Article

Medical Augmented-Reality Visualizer for Surgical Training and Education in Medicine

by
Radosław Gierwiało
1,*,
Marcin Witkowski
1,
Maciej Kosieradzki
2,
Wojciech Lisik
2,
Łukasz Groszkowski
1 and
Robert Sitnik
1
1
Faculty of Mechatronics Warsaw University of Technology, ul. Św, Andrzeja Boboli 8, 02-525 Warsaw, Poland
2
Medical University of Warsaw, Żwirki i Wigury 61, 02-091 Warsaw, Poland
*
Author to whom correspondence should be addressed.
Appl. Sci. 2019, 9(13), 2732; https://doi.org/10.3390/app9132732
Submission received: 10 May 2019 / Revised: 28 June 2019 / Accepted: 30 June 2019 / Published: 5 July 2019
(This article belongs to the Special Issue Augmented Reality: Current Trends, Challenges and Prospects)

Abstract

:
This paper presents a projection-based augmented-reality system (MARVIS) that supports the visualization of internal structures on the surface of a liver phantom. MARVIS is endowed with three key features: tracking of spatial relationship between the phantom and the operator’s head in real time, monoscopic projection of internal liver structures onto the phantom surface for 3D perception without additional head-mounted devices, and phantom internal electronic circuit to assess the accuracy of a syringe guidance system. An initial validation was carried out by 25 medical students (12 males and 13 females; mean age, 23.12 years; SD, 1.27 years) and 3 male surgeons (mean age, 43.66 years; SD, 7.57 years). The validation results show that the ratio of failed syringe insertions was reduced from 50% to 30% by adopting the MARVIS projection. The proposed system suitably enhances a surgeon’s spatial perception of a phantom internal structure.

1. Introduction

Medical applications of virtual and augmented reality (AR) have been extensively developed during the last decade [1,2]. In the current era of data fusion, AR provides an ideal approach for educational purposes [3], especially those related to medicine [4,5,6], as it supports the training of surgeons without risk to patients. Virtual reality and AR techniques may also be employed to shorten the learning curves [7] related to surgical procedures and increase the overall educational efficiency, thereby providing increased patient safety.
Shortening the learning curves for surgical personnel is a societally important and widely researched issue. It aims to improve the accuracy and performance of surgical procedures in the most effective manner. Key factors related to learning of surgical procedures include proper real-time feedback and trial evaluation [8]. Studies have shown that the preferred feedback type is haptic (e.g., tool vibration) [9], suggesting that the success of surgical training is notably influenced by the degree of realism of the implemented haptic feedback [10]. In addition, surgeons may prefer additional haptic feedback, as it can provide valuable tactile information during surgery [9]. More generally, haptic feedback is believed to enhance perception by providing another mode of sensorial information. A review of simulation platforms available within endourology [11] presents a set of outcome measures for the validation of simulation and assessment tools. They include such parameters as:
  • face validity (i.e., extent to which the examination resembles the situation in the real world),
  • content validity (i.e., extent to which the intended content domain is being measured by the assessment exercise),
  • construct validity (i.e., extent to which a test is able to differentiate between a good and bad performer),
  • concurrent validity (i.e., extent to which the results of the test correlate with gold-standard tests known to measure the same domain),
  • predictive validity (i.e., extent to which this assessment will predict future performance),
  • acceptability (i.e., extent to which assessment procedure is accepted by subjects in assessment),
  • educational impact (i.e., extent to which test results and feedback contribute to improve the learning strategy on behalf of the trainer and the trainee),
  • cost effectiveness (i.e., technical and nontechnical requirements for implementation of test into clinical practice)
An initial validation of the system described in this paper with regard to the aforementioned parameters will be presented in further sections.
Currently available systems that support surgical procedures by means of augmented visualization utilize virtual reality headsets, goggles with translucent displays [12], or external computer displays [13]. For instance, head-mounted displays like Google Glass or Microsoft Hololens are being used in research on medical procedure training [14,15]. Although the headsets are often reported to be useful, they create a physical barrier between the surgeons and their environment, imposing an undesirable situation during medical procedures. Moreover, most translucent devices require additional markers for external tracking to achieve precise positioning of the virtual structures [16], especially in changing environments. Most of these devices are uncomfortable to wear and use for prolonged periods and often cause eye strain, headaches, and substantial discomfort [17,18,19]. Likewise, external screens can cause discomfort by the frequent switching of the surgeon’s focus between the patient and screen, thus prolonging operation time.
Another known disadvantage is that stereoscopic AR projection systems can exhibit the vergence–accommodation conflict. Conventional 3D displays present images on a surface, requiring both eyes to focus at a certain distance regardless of the intended distance to the virtual object. Hence, it is essential to properly set the depth of the display considering the depth of the depicted scene. Otherwise, eye strain, discomfort, and fatigue can result by excessive use of the lens muscles in the eyes to focus on the correct plane [20].
In this paper, we introduce an AR system called MARVIS (Medical AR VISualizer) that provides support for surgical procedures training by overlaying images of internal structures onto the surface of a phantom organ. The human liver was chosen as the test organ, for which biopsy and thermoablation were considered as exemplary procedures. This study aimed to develop a system that closely resembles the real conditions of a surgeon’s workspace. The key aspects of the MARVIS system are the following:
  • Optical tracking of the user’s head while practicing on the organ phantom. Information related to the spatial relationship between the phantom and operator’s head is calculated in real time.
  • Projection of internal structures onto the surface of the liver phantom in conjunction with naked-eye observation. This type of observation along with monoscopic motion parallax provides 3D perception through simple motions of either the operator’s head or the phantom. No additional goggles or headsets are required.
  • A dedicated phantom composed of segments with different electric conductivities and an electronic module. This subsystem provides objective information about the procedure results in terms of the correct targeting rate of the internal structures.
Various AR systems for medical applications have been proposed. In Ref. [21], a system that displays anatomical objects in three dimensions combined with a 2D slicing plane on an external stereoscopic display is introduced. This system allows trainees to feel a virtual patient using their hands through palpation. In addition, projection-based AR systems for medicine have also been proposed. In Ref. [22], an interactive computer-generated intelligent virtual agent is introduced, where visual information is projected onto the physical shell of a head. Another system trains ultrasound-guided needle placement augmented with computer-generated ultrasound imagery, which emulates the physical process of ultrasound scanning on patients [23]. A system presented in Ref. [24] simulates the fermoal palpation procedure in a virtual environment and allows to train needle insertion into the vessel.
However, the systems in Refs. [21,24] show the generated auxiliary data on external monitors, and the operator must constantly switch the viewpoint, possibly leading to problems in long-term perception. The technique described in Ref. [21] needs a wired stylus to manipulate the virtual object. Furthermore, the system in Ref. [24] requires dedicated hardware to deliver tactile feedback. The systems in Refs. [22,23] do not consider the operator’s viewpoint, possibly causing manipulation problems during the virtual medical procedure due to different coordinate systems. Moreover, the approach presented in Ref. [23] renders all information on screen as monochromatic visualization only.
The approach we propose in this paper has the abovementioned key aspects and comprises a novel projection-based AR system. The approach is implemented on the MARVIS dedicated system, which allows to visualize previously segmented computer tomography (CT) medical data of internal structures on the liver phantom.

2. Materials and Methods

2.1. Overview

The MARVIS system consists of four modules, as illustrated in Figure 1. The phantom-tracking module (PhTM) detects the phantom in the real-time video stream and determines its 3D position and orientation using data stored in the model database (MDB). The position of the surgeon’s head is estimated using a marker-based optical head-tracking module (HdTM). Images of internal structures projected by the projection module (PrM) are transformed (in terms of perspective and deformation) considering the relative positions of the phantom and operator’s head. The rendered images are visible on the surface of the phantom, which is connected using an electronic structure interaction module (SIM) to detect the physical (electrical) contact of the surgeon’s tool with the internal structures of the phantom. In the next subsection, we detail each module and its role in data processing.
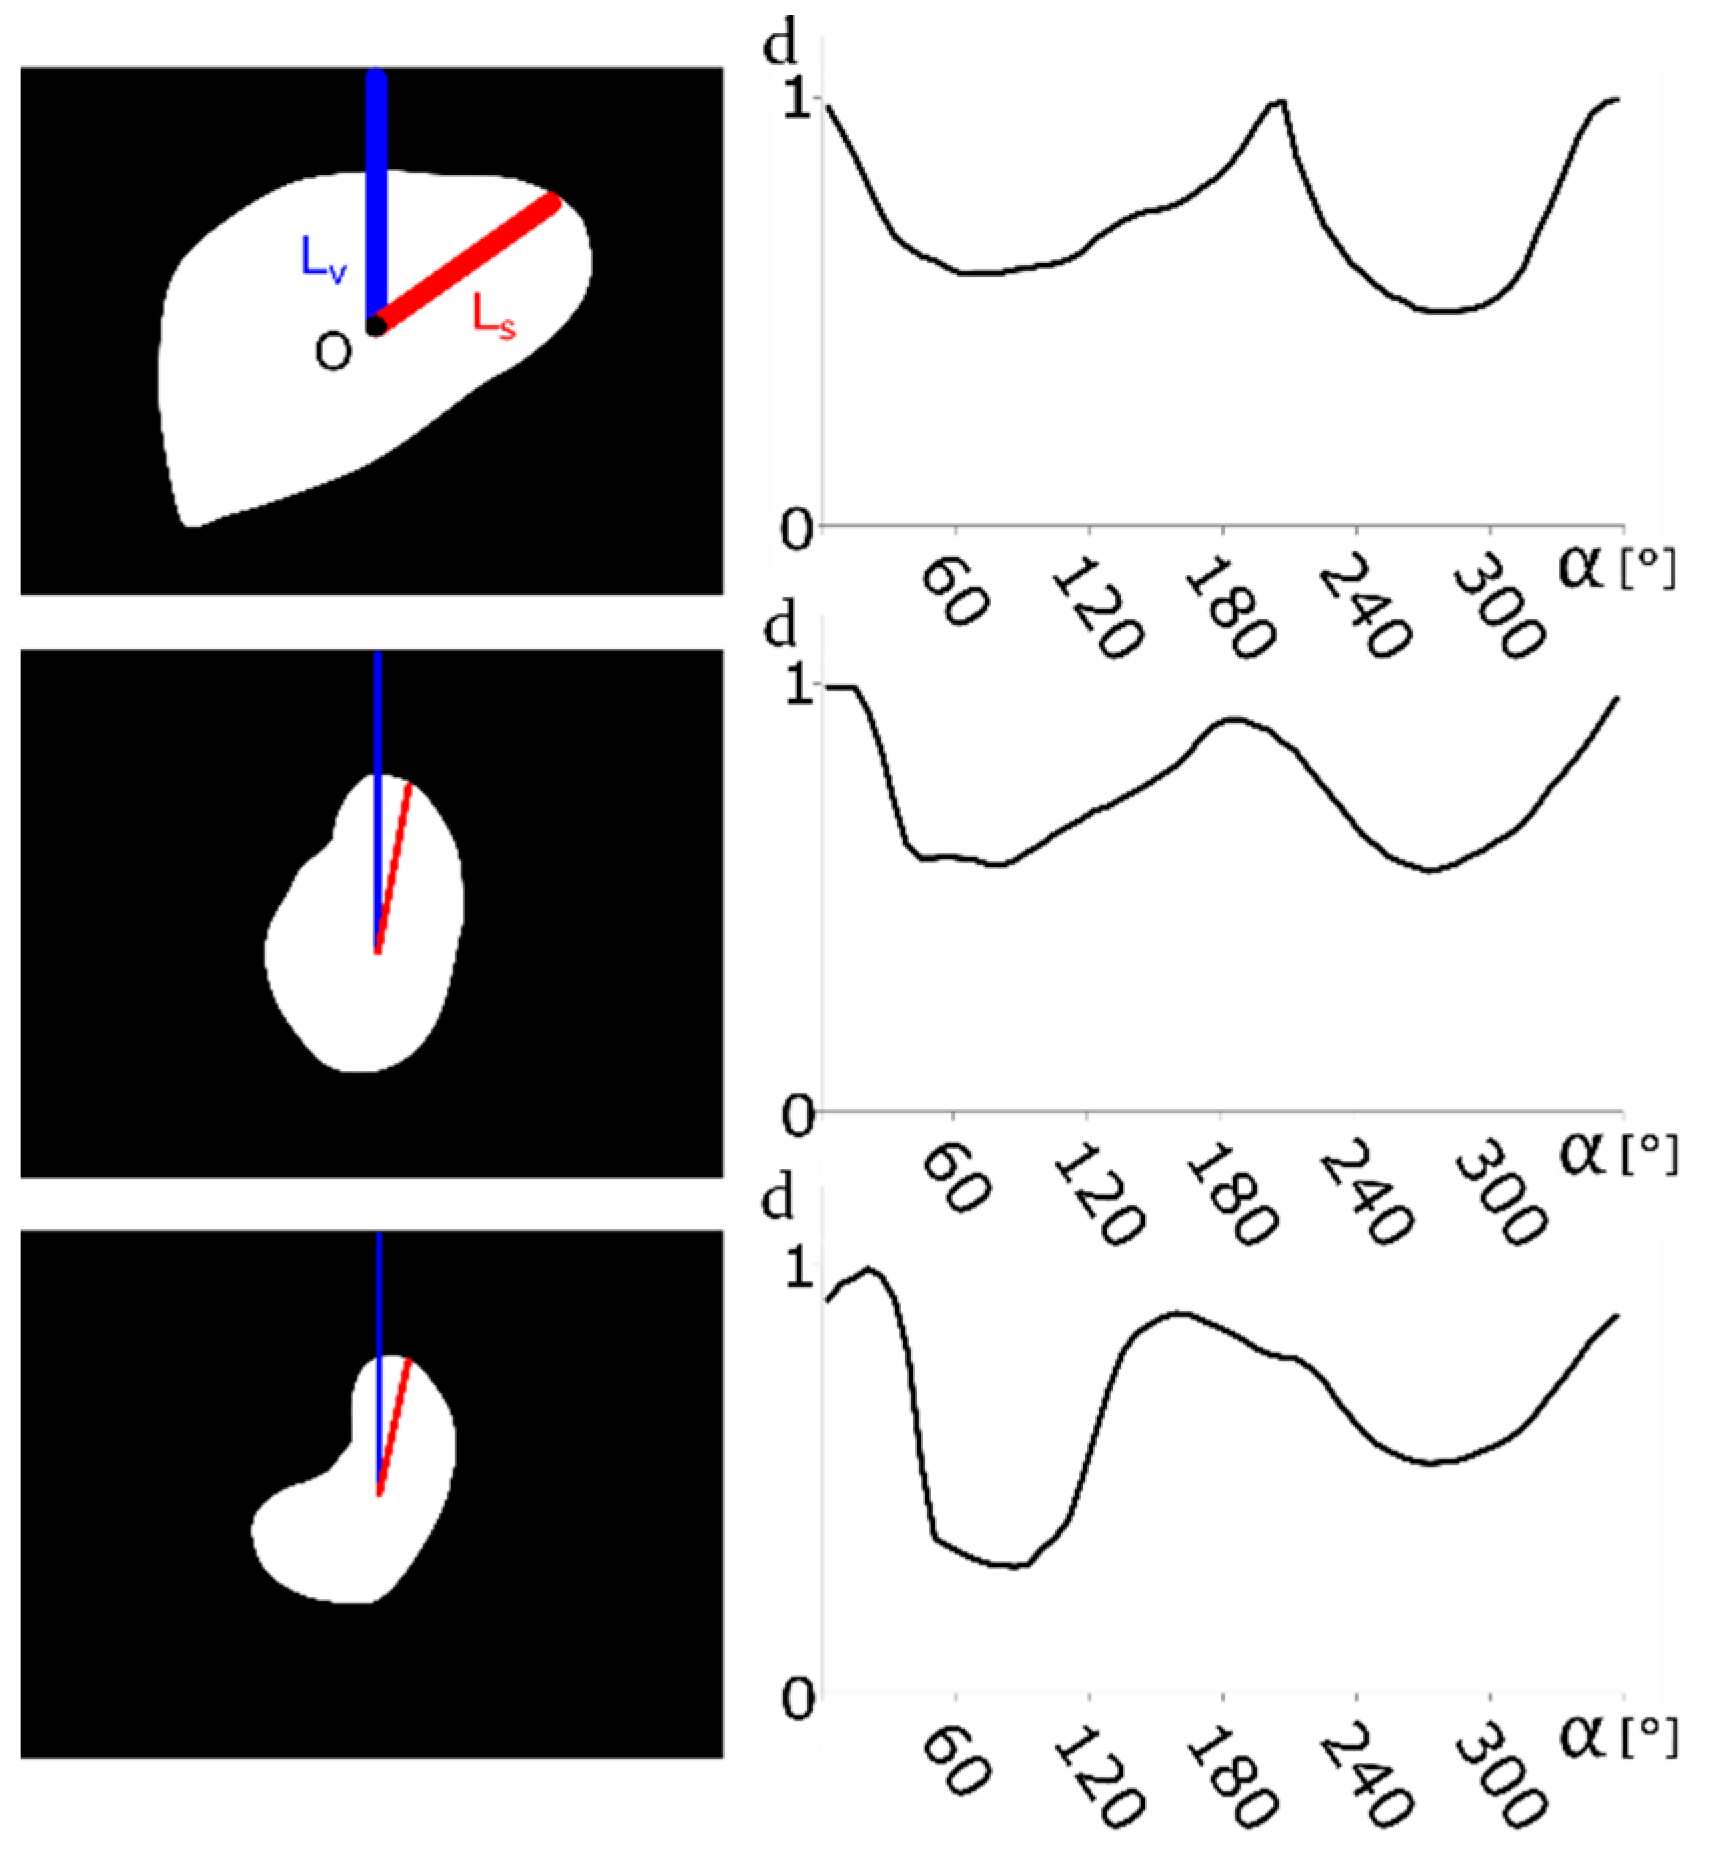
Tracking the phantom relies on its contours acquired through a tracking camera. Contour tracking has lower computational complexity than comparison based on 3D models, which usually requires components such as smart-pixel cameras [25], time-of-flight cameras [26], or at least two standard cameras to get the spatial coordinates of each point [27]. A set of contours is created for the digital liver model (using edge detection on a binary silhouette of a digital model, as shown in the left column of Figure 2) for a range of rotations (±60° with respect to the X axis, ±45° with respect to the Y axis). A resolution of 2° per axis is related to the degrees of freedom of a real liver. For each angle (a combination of rotations around two axes on the horizontal plane, perpendicular to the tracking-camera axis), a contour-based shape descriptor (CSD) is calculated and stored in the MDB. A CSD analysis for the physical phantom is performed by the user during training and allows estimation of its orientation in real time.

2.2. Contour-Based Shape Descriptor

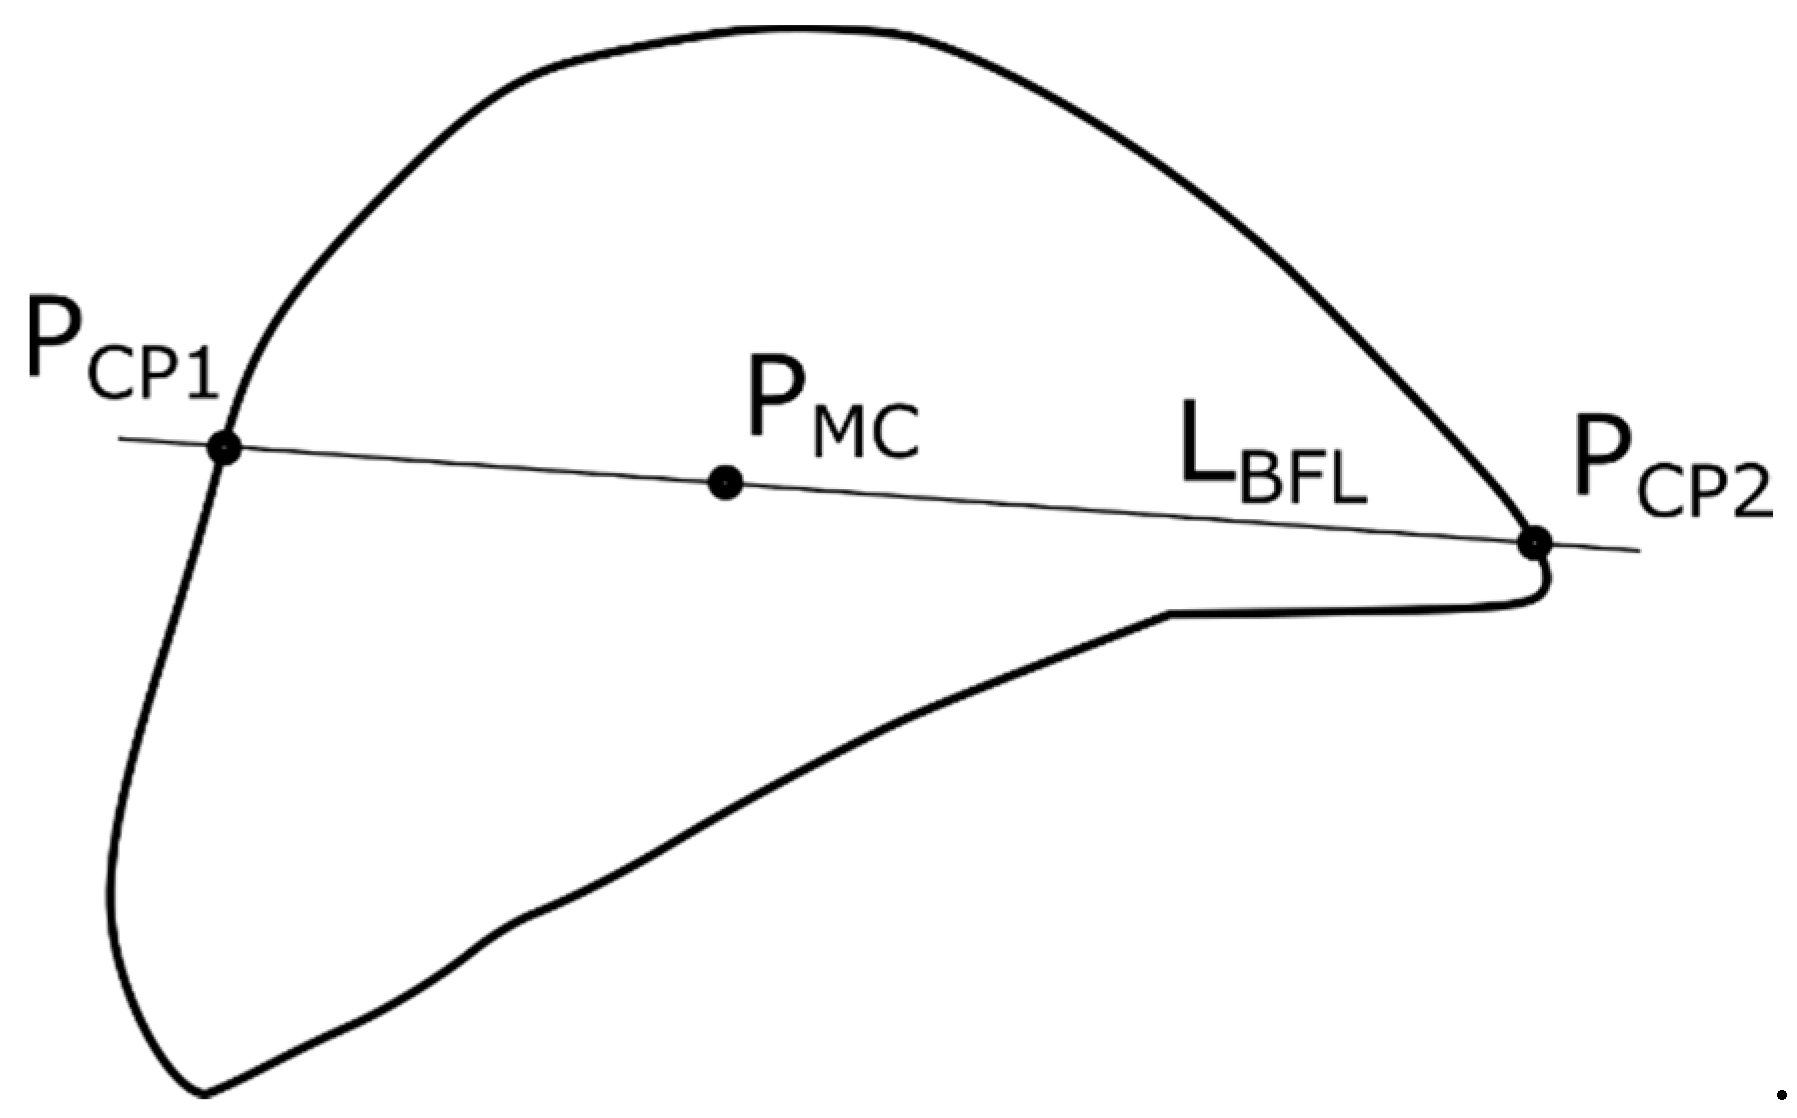
The position and orientation of the liver phantom are calculated from its contour. The initial contour is a vector comprising 2D points represented in a Cartesian coordinate system (XY plane). The contour may be obtained by either using the computer-generated image of a projection of the 3D model onto a 2D plane of the virtual camera or analyzing video footage. The proposed CSD is invariant to object scale and rotation about the camera axis and is represented using polar coordinates with the pole located at the geometric center of mass of the 2D object silhouette (Figure 2). The polar axis is defined by the contour start point, which is selected using two points (PCP1, PCP2) at the intersection between the contour and the best-fitting line (LBFL) of all the contour points. Then, the contour start point is selected as the farthest point from the pole (Figure 3). The scale-invariant feature is achieved by normalizing the distances in terms of the distance from the pole to the contour start point. The rotation-invariant feature is achieved by using line LBFL and the contour start point. The CSD is obtained by uniform angular sampling (every 6°) of the contour and storing the parameter pair (α, d) per point, where α is the polar angle and d is the normalized radius of the contour point.

2.3. Model Database

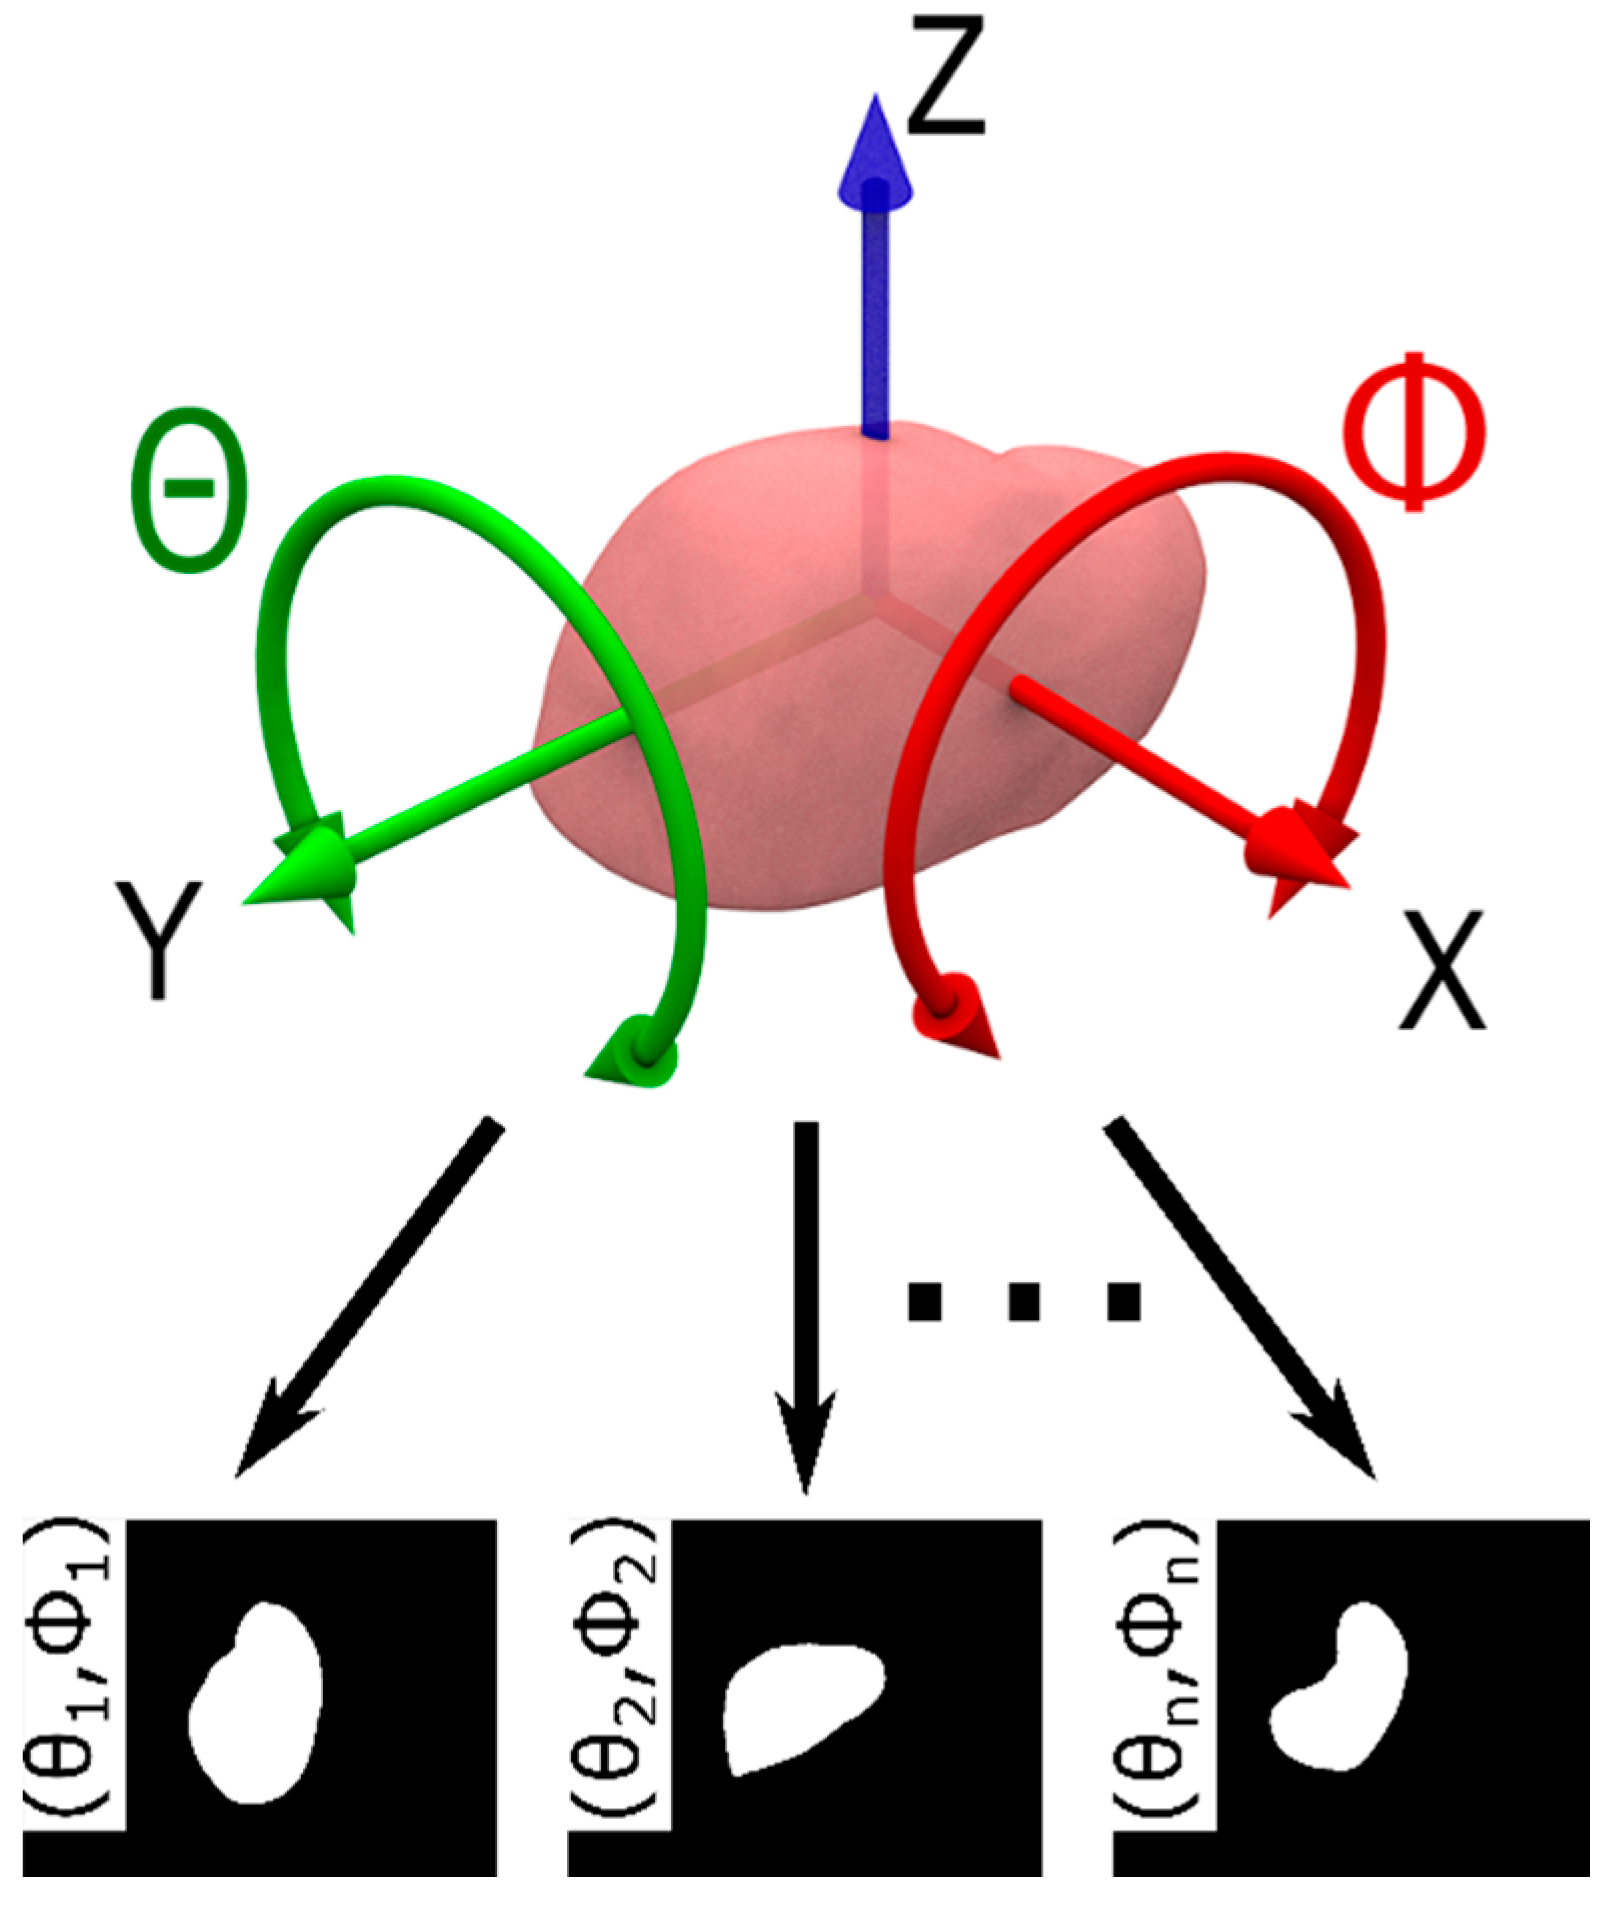
The MDB in this study stored a 3D surface model of the liver along with a set of possible rotations and corresponding CSDs. Each surface model is built once in the form of a triangle mesh per physical phantom, using real imaging data. For each orientation (θ,Φ) defined by rotations about the (X,Y) axes of the model (Figure 4), the contour is determined and a corresponding CSD is calculated. Input silhouette images used for CSD calculation are created by projecting the 3D triangle mesh onto a 2D plane, followed by contour extraction. The sampling of angles (θ,Φ) affects the final angular resolution of phantom tracking, and a balance should be maintained between the image analysis requirements regarding accuracy and statistical errors.

2.4. Phantom-Tracking Module

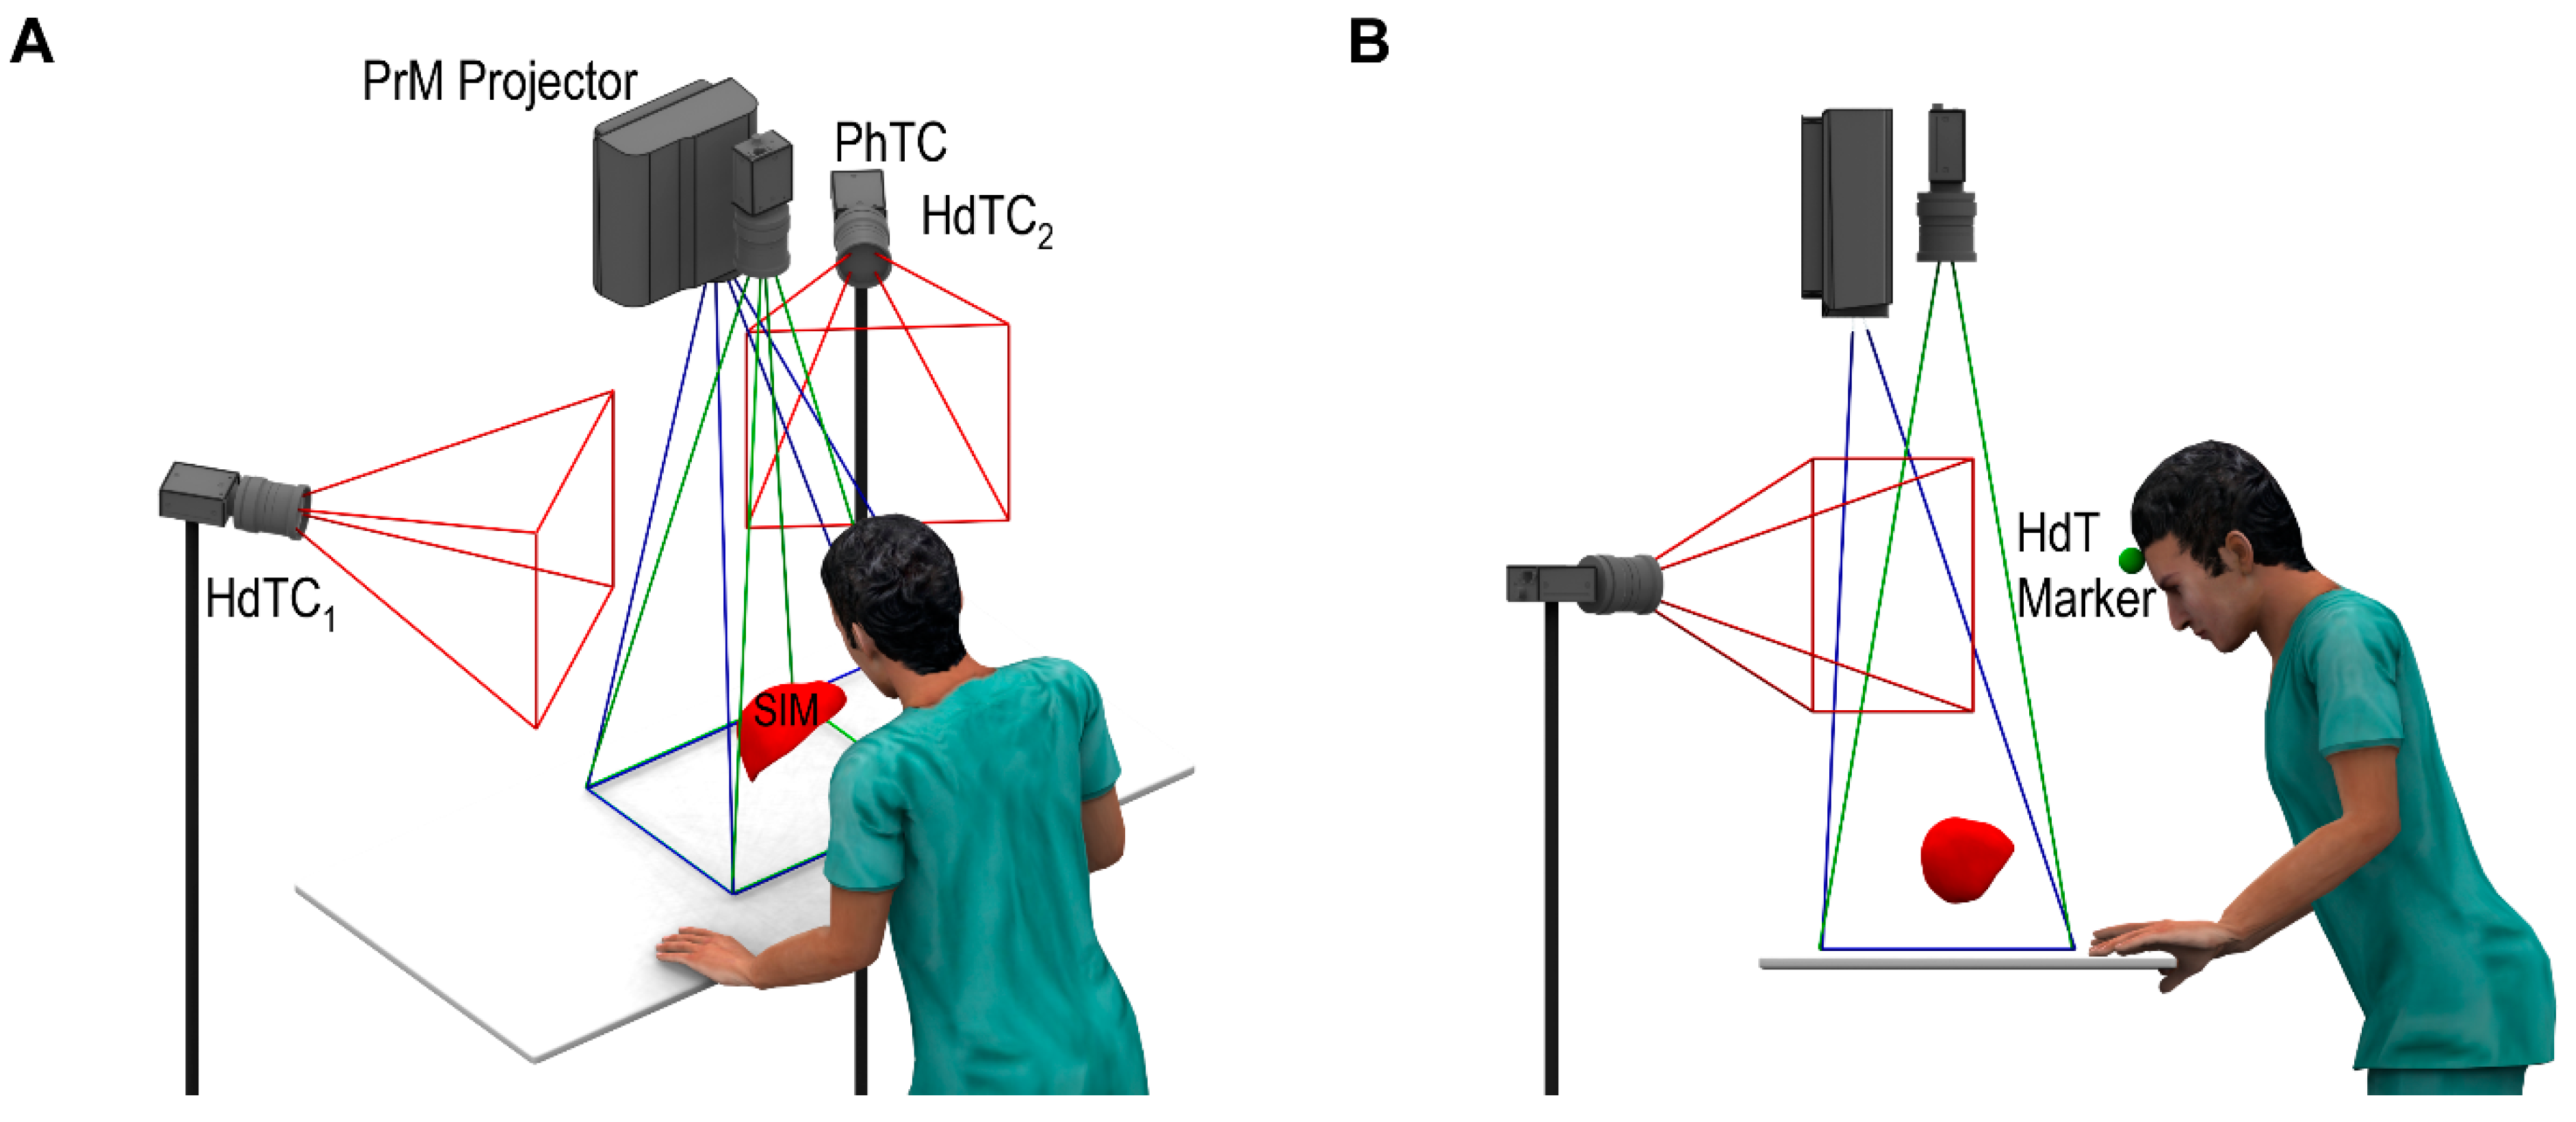
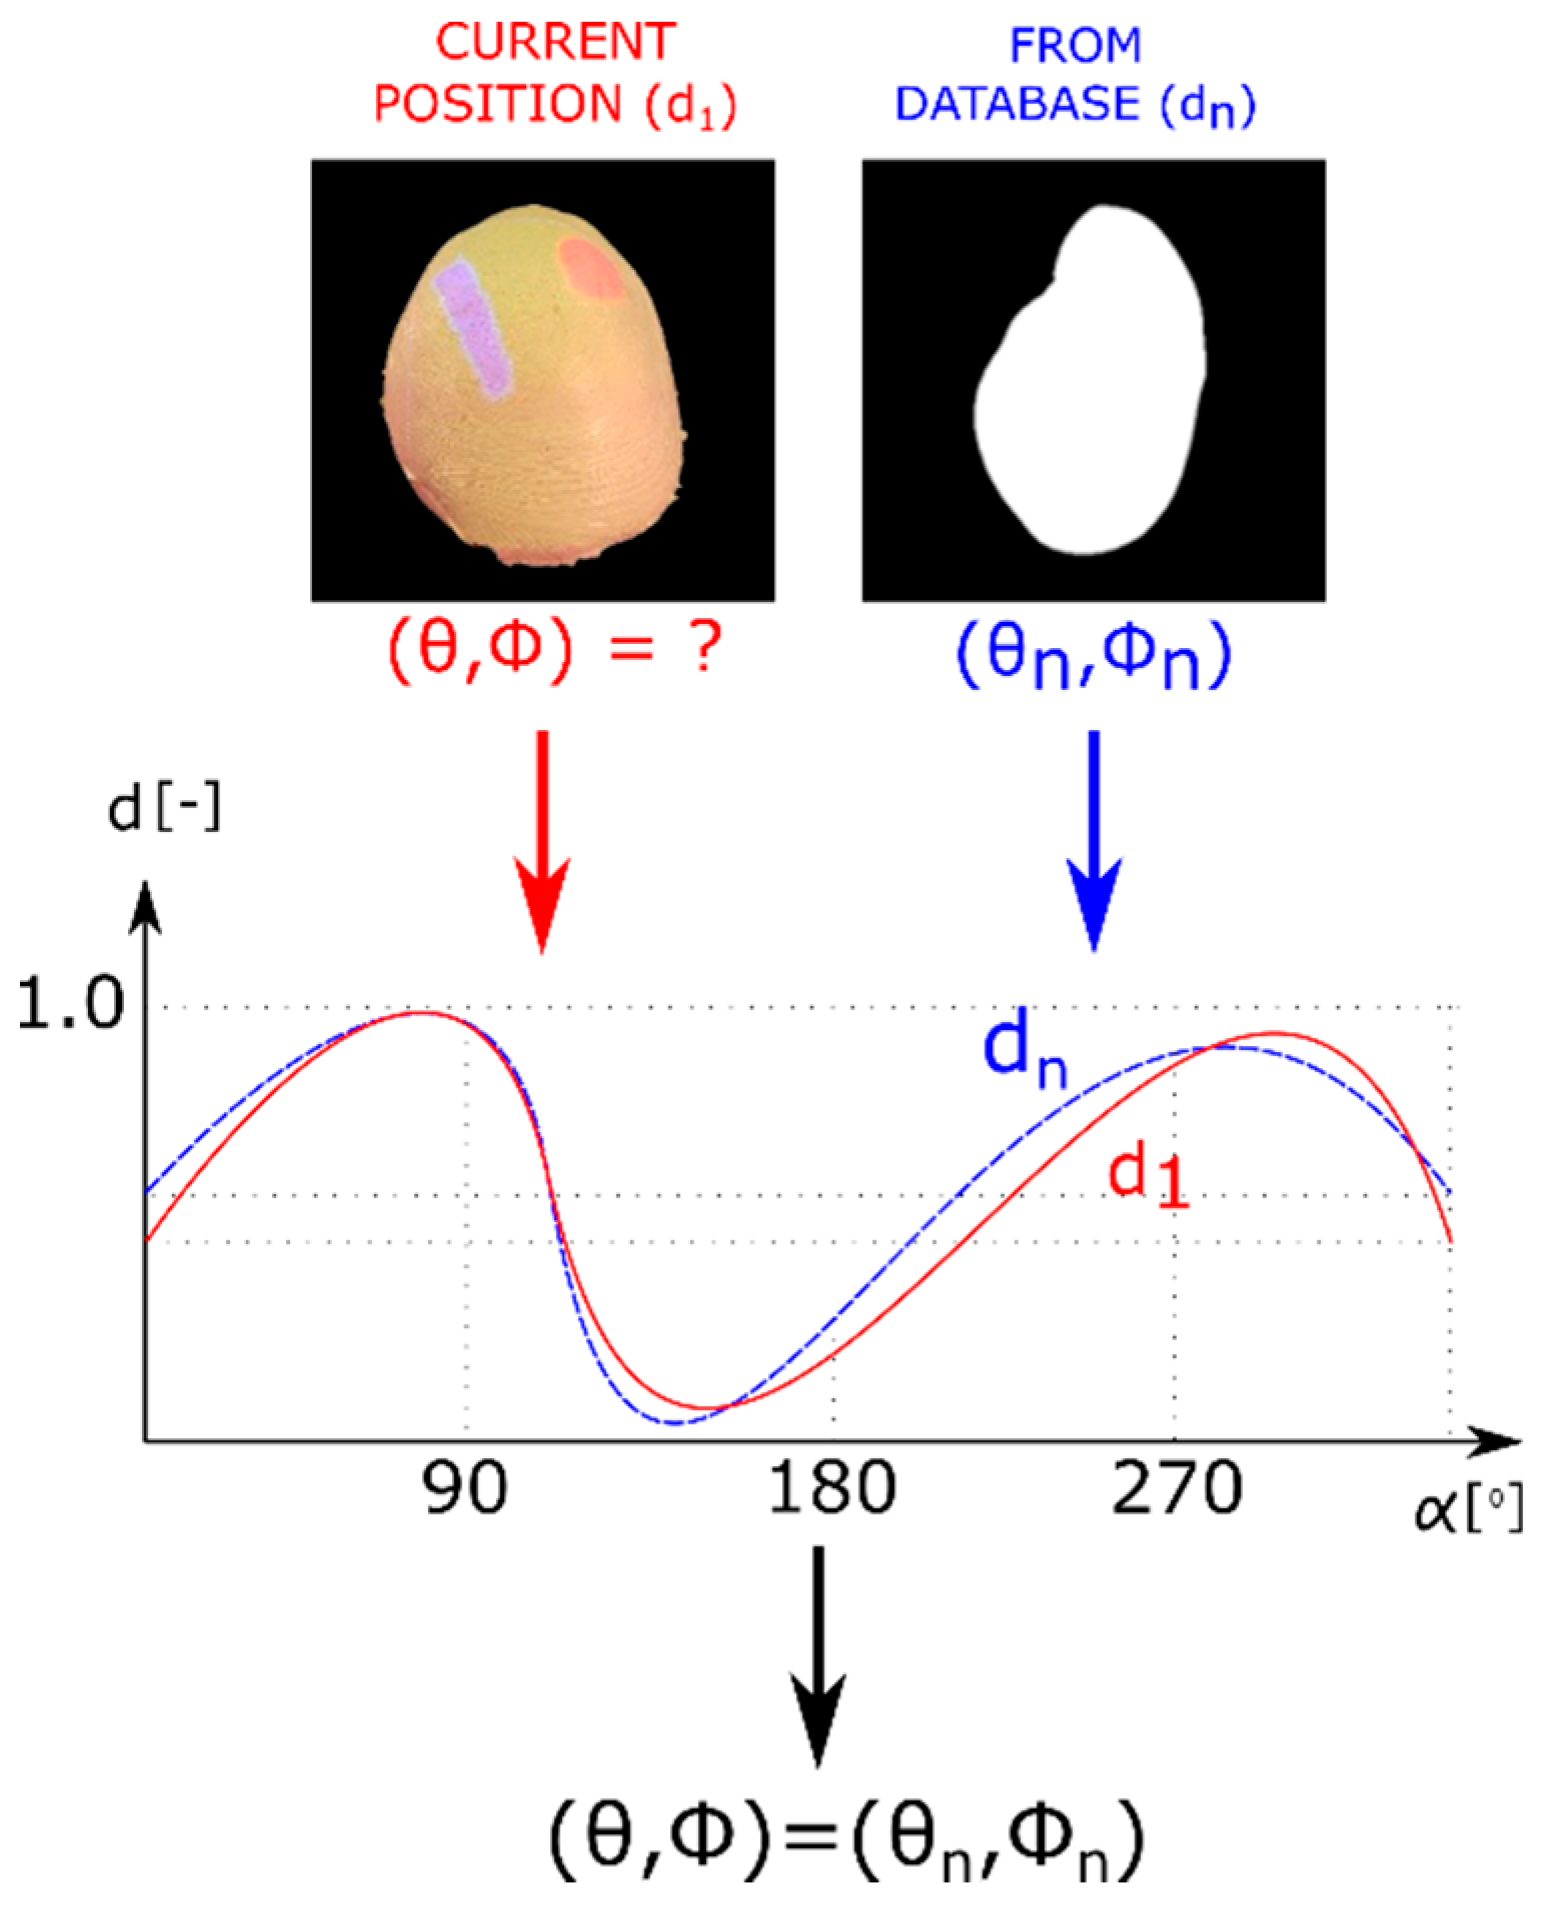
The PhTM locates the liver phantom in the field of view of the tracking camera (Figure 5), which is a pinhole-calibrated [28] color camera, and calculates its position and orientation. During system operation, the current phantom position is calculated by determining the geometric center of mass of the contour and its transformation into a global coordinate system. Phantom rotation (θ,Φ) is calculated by correlating the CSD for the current frame with precomputed CSDs from the MDB (Figure 6). Similarity is determined using the minimum of contour difference SAB, calculated for contours A and B as follows:
S A B =   ( d A i d B i ) 2 N
where dAi and dBi are the distances to point i of contours A and B from the pole, respectively, and N is the number of points per contour, which is sampled according to the required angular accuracy. Hence, similarity SAB measures the difference between two CSDs and is calculated between the current CSD of the phantom image and CSDs for every orientation, as stored in the MDB, providing an estimate for the current angles (θ,Φ) of the phantom.
Note that the third rotation angle (about the axis perpendicular to the work table) is calculated directly from the image captured by the phantom-tracking camera, because the current CSD is invariant to Z-axis rotation. This reduces the MDB size and improves the speed of the database search. The PhTM implements the abovementioned key aspect 1.

2.5. Head-Tracking Module

The viewing perspective of the user is determined from the calculated position of a single marker located on the forehead between the user’s eyebrows, referred to as the mid-eyes point. We use the marker for head position tracking to avoid problems when the system is simultaneously used by some individuals. The marker clearly identifies the viewpoint to be rendered by MARVIS. The proposed solution utilizes monoscopic motion parallax, allowing the viewer to determine spatial relationships between the internal structures of the phantom. This approach is used assuming that the head pitch with respect to the phantom remains stable and that the mid-eyes point is located 45 mm below the marker. These assumptions increase the accuracy of the viewing angle. The HdTM locates the user’s mid-eyes point, determining the marker position within the 3D coordinate system. If the HdTM loses the marker, the system uses the last known position. This approach is supported by a pinhole stereo-calibrated setup [28] consisting of two color cameras (HdTC1 and HdTC2 in Figure 5). The HdTM is also related to key aspect 1.

2.6. Projection Module

Key aspect 2 is implemented using the PrM. All the visual information rendered by a graphics card using the segmented medical data and recalculated using MARVIS is projected onto the destination phantom surface by the PrM projector, which is calibrated as the inverse pinhole camera [29]. More details on the projection system are provided in Section 2.9.

2.7. Structure Interaction Module

The phantom in the proposed system consists of molding silicone, which imitates the tactile texture of an organ’s surface. In fact, similar types of materials have been used as sensor covering to imitate human fingers [30]. The internal structures within the phantom are made of an electrically conductive material. During phantom design, we used CT scan data from a real liver. Then, we obtained a custom mold of the liver external shape and hepatic portal vein structure by image segmentation. In addition, a mold of tumorous tissue with an arbitrary shape was fabricated. The custom molds of internal structures were made of a material that absorbs X-rays and is electrically conductive. The internal structures were wired with cables and then immersed in silicone, which resembled the liver tissue. Finally, the manufactured liver phantom was CT scanned to obtain its detailed 3D model including the fabricated internal structures.
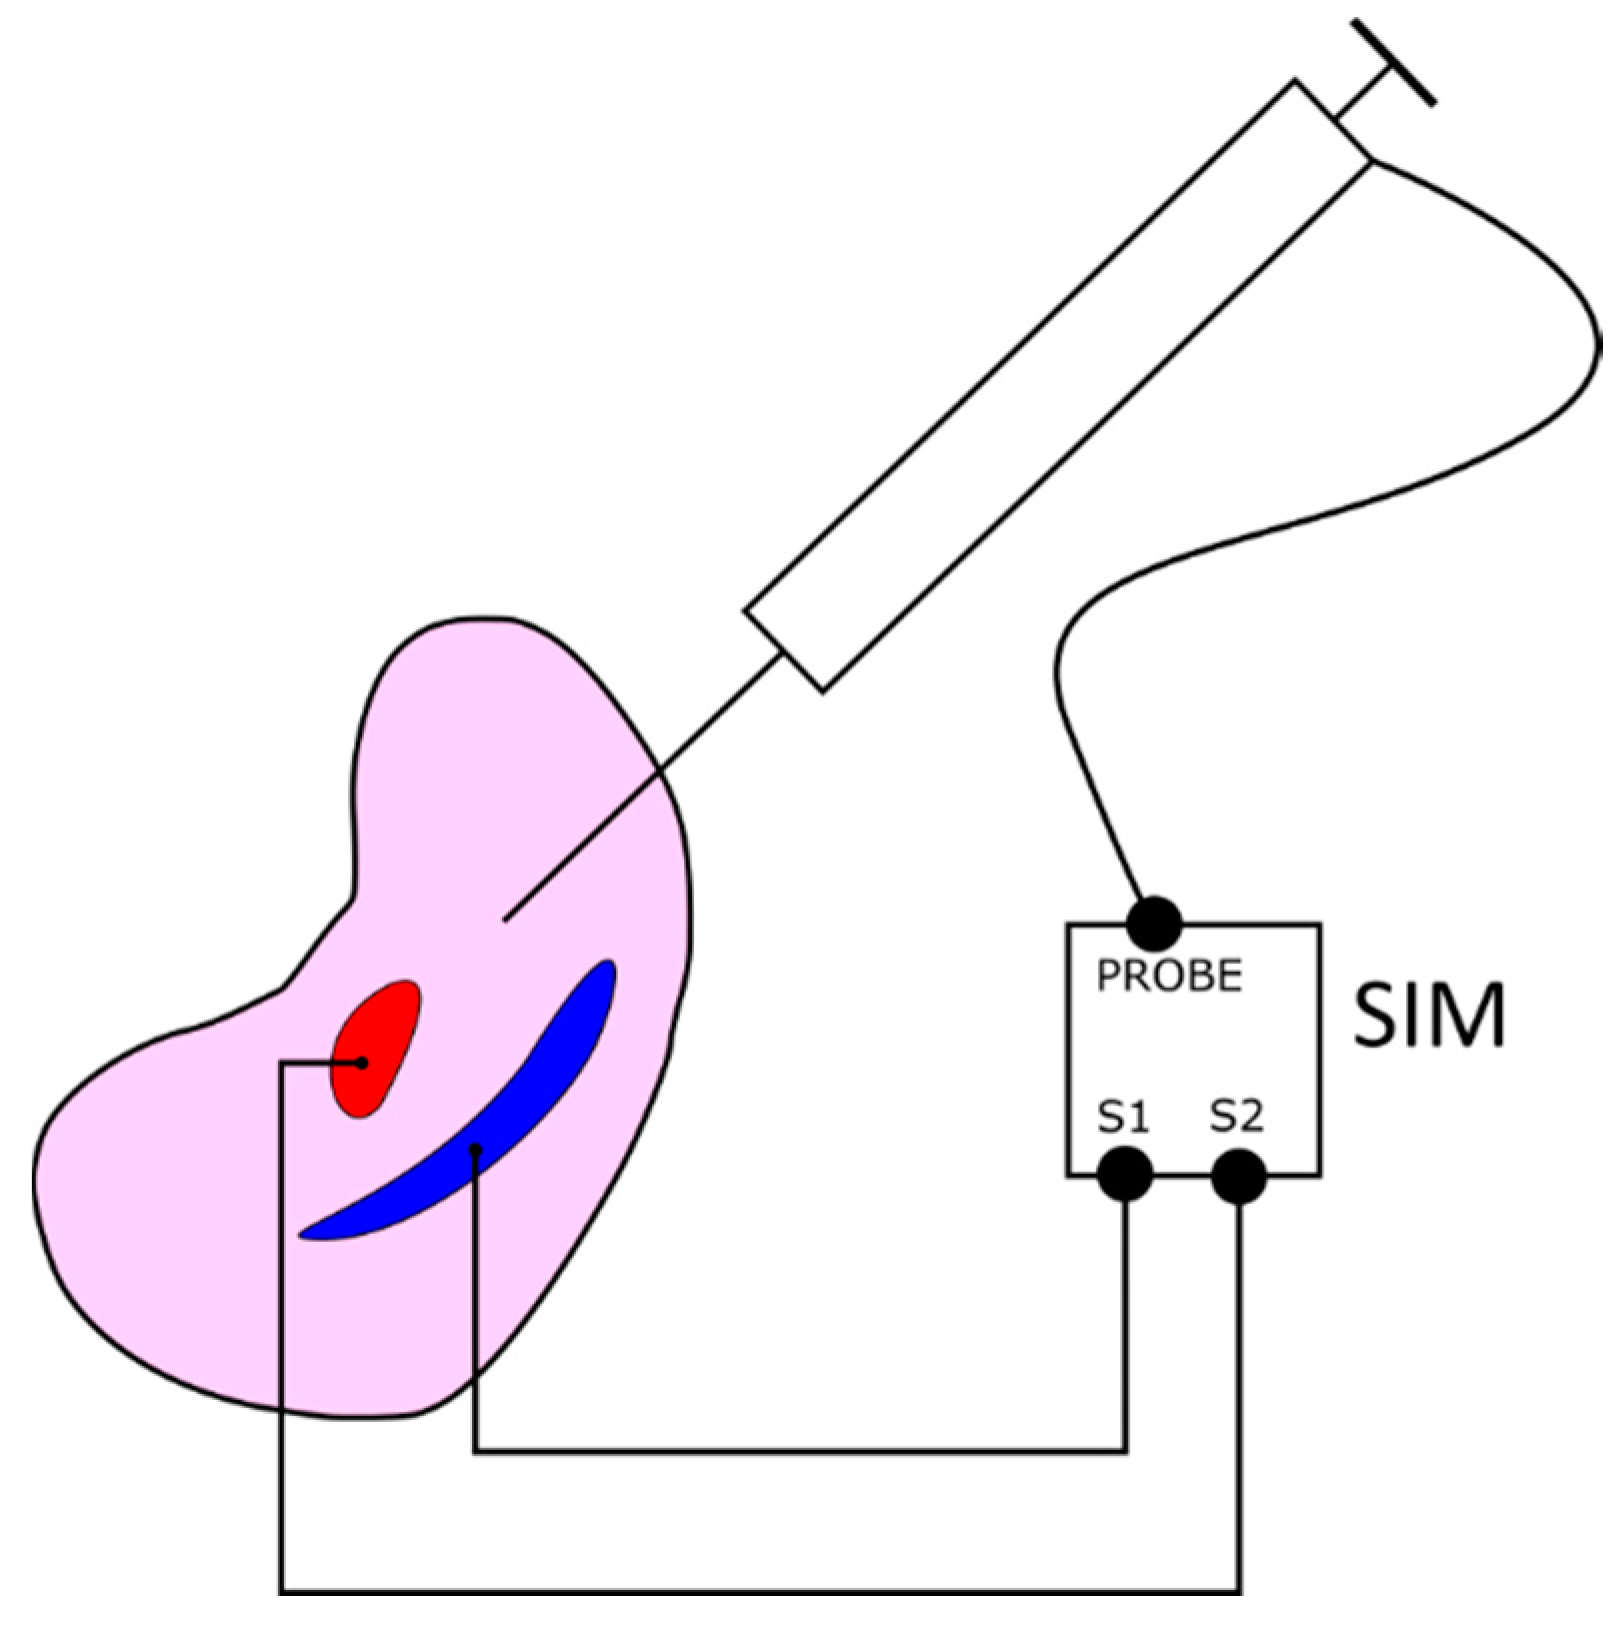
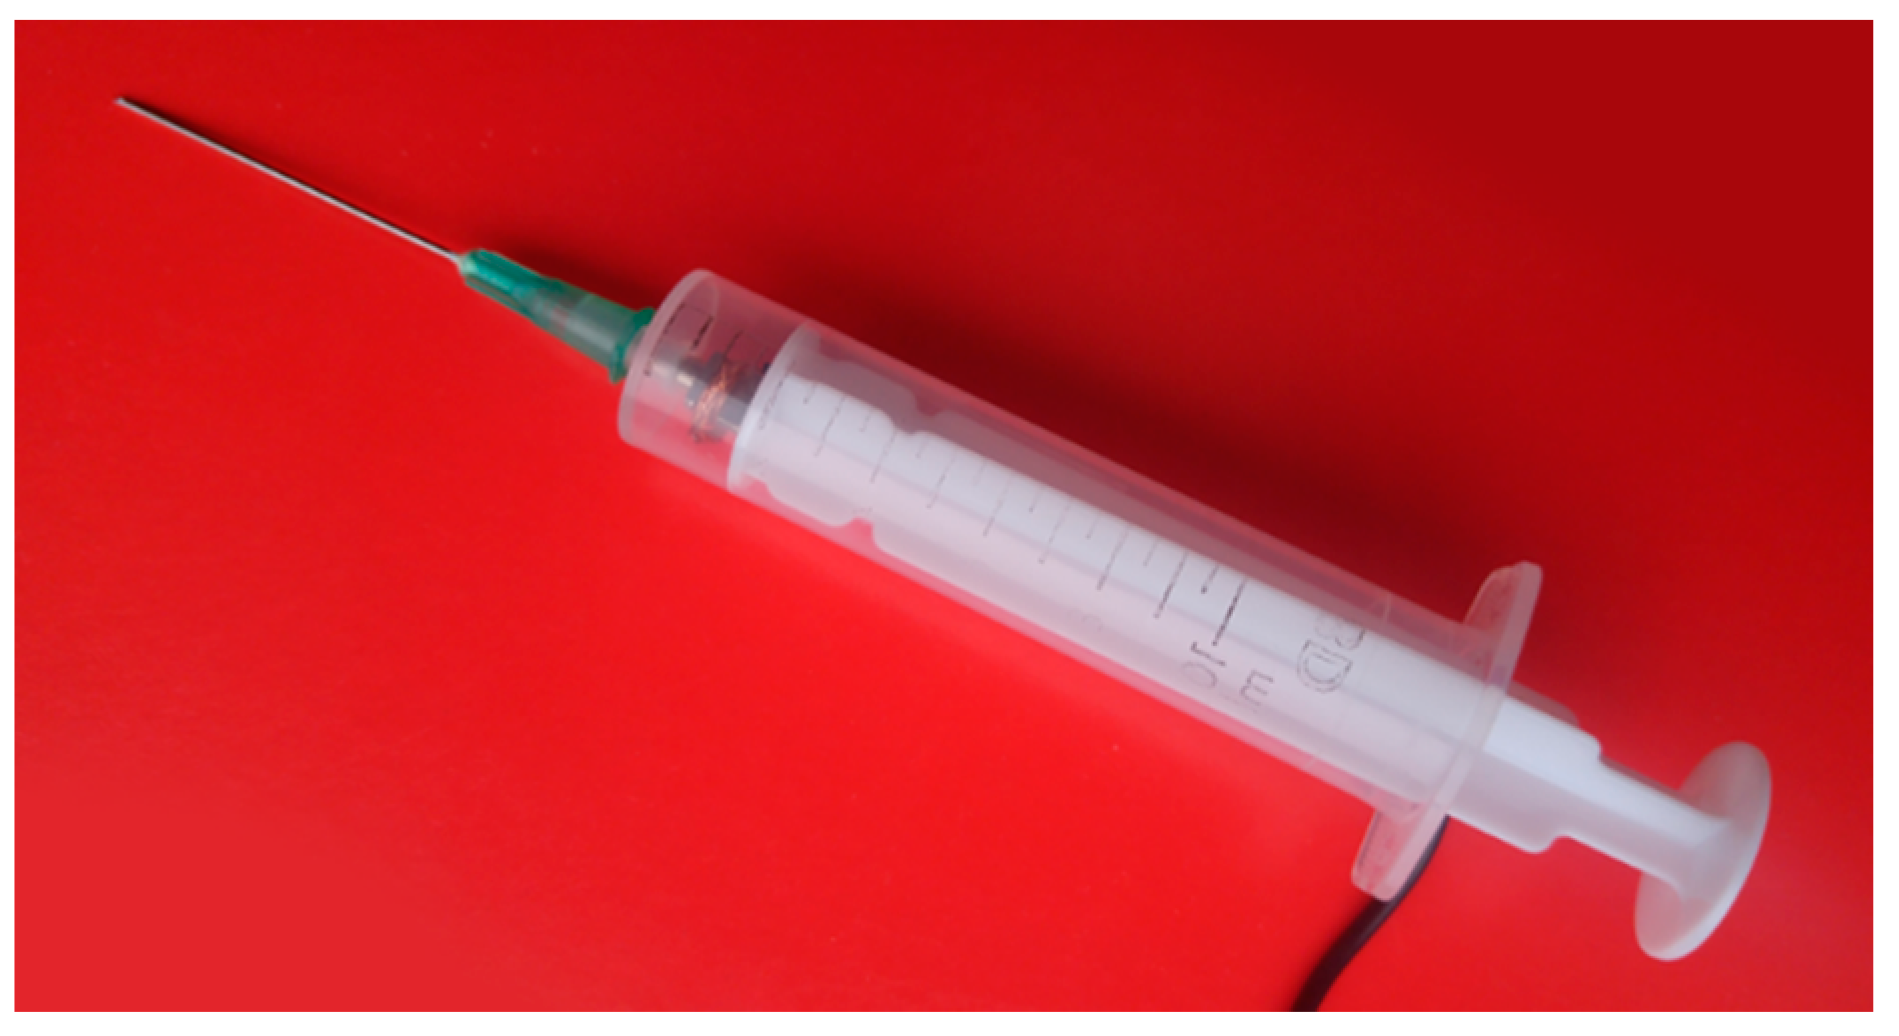
As the internal structures of the phantom are detectable by CT imaging, its digital 3D model accurately corresponds to the physical phantom. The electrical connectors of the internal structures located at the bottom of the phantom connect each structure to the SIM (Figure 7). The SIM algorithms are implemented in a hardware module based on a Microchip PIC12F675 microcontroller. The hardware module is connected to both the internal structures and a syringe probe needle. The SIM network interface allows to start/reset a stopwatch, whereas the needle that closes the circuit with either of the internal structures stops the stopwatch and adds a new entry to the database (the structure is impinged and the time is measured). The SIM implements part of key aspect 3.

2.8. Global Calibration

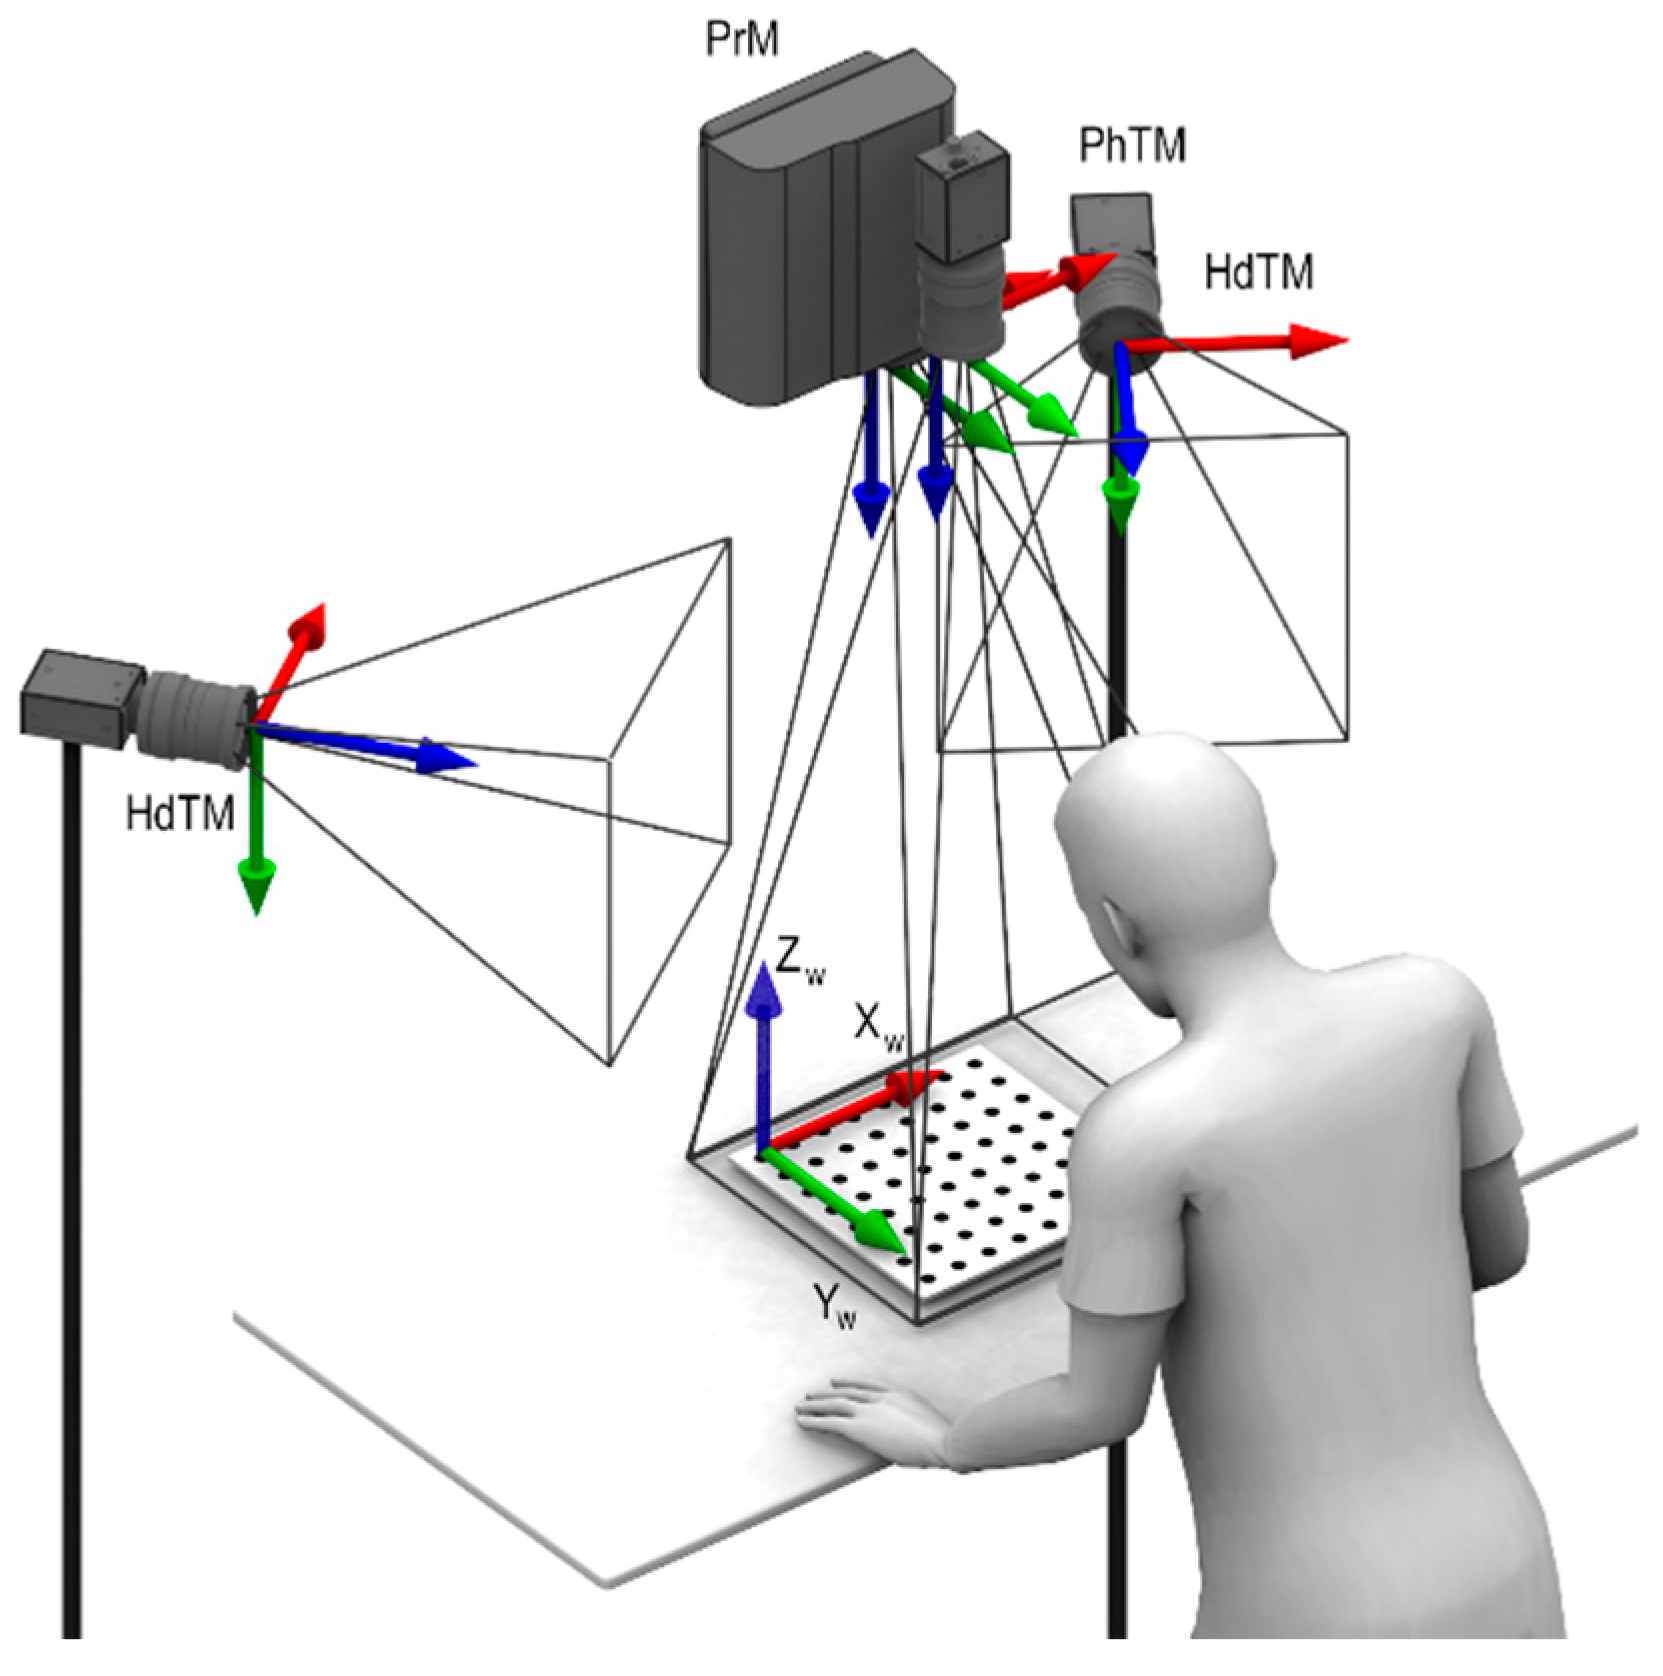
Initially, each device in the modules uses its local coordinate system (Figure 8), and hence the output data is expressed into a common global coordinate system with the origin on the working table (Xw, Yw, and Zw axes in Figure 8). These modules must be set up and calibrated before operation. First, the PhTM must be calibrated to estimate the internal and external parameters of the projector in the PrM and the camera in the PhTM, using the pinhole method proposed in Ref. [29]. The same algorithm and calibration pattern are used to calibrate the pair of stereo cameras (HdTC1 and HdTC2) in the HdTM. All calculations are then realized in the same global coordinate system.

2.9. Prototype Fabrication

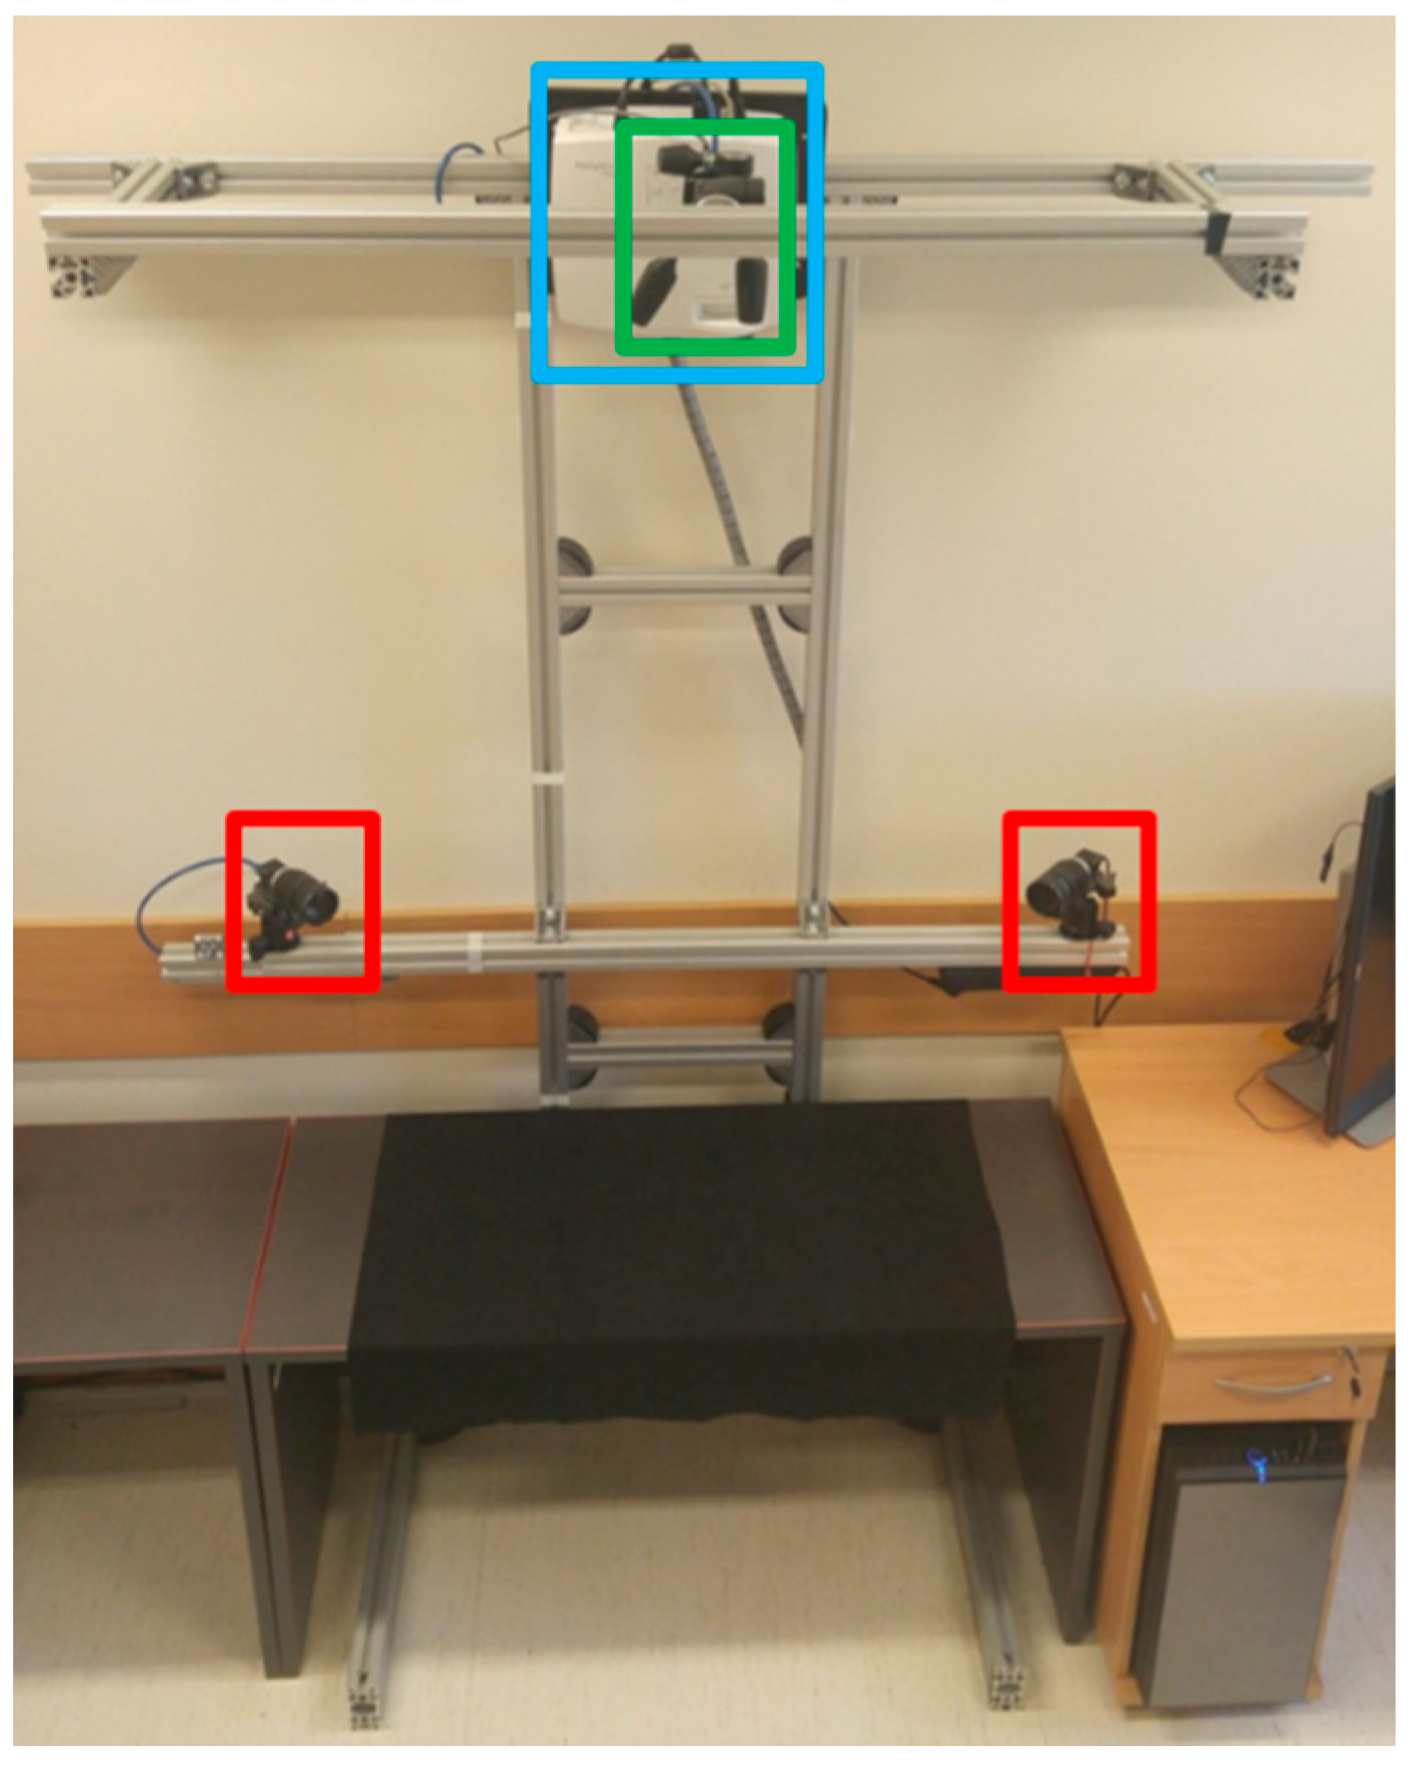
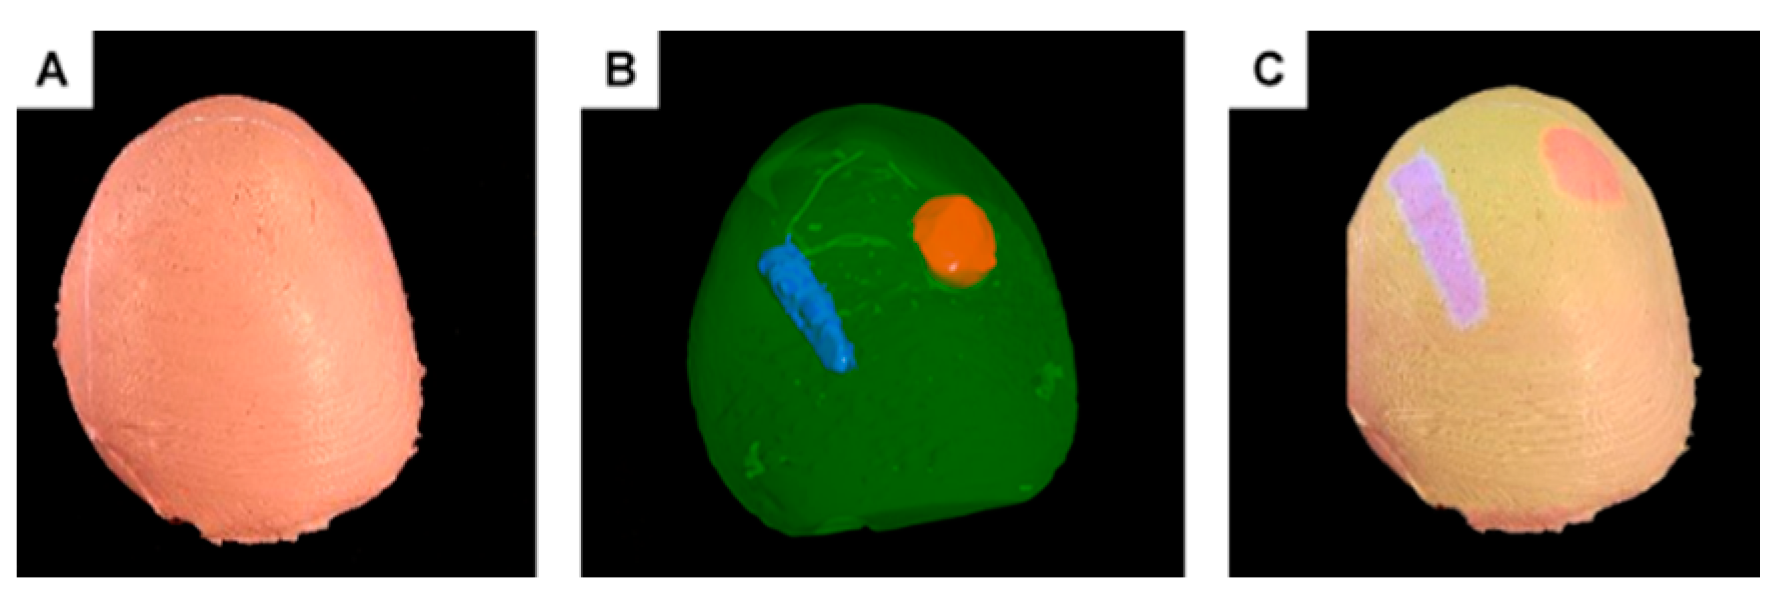
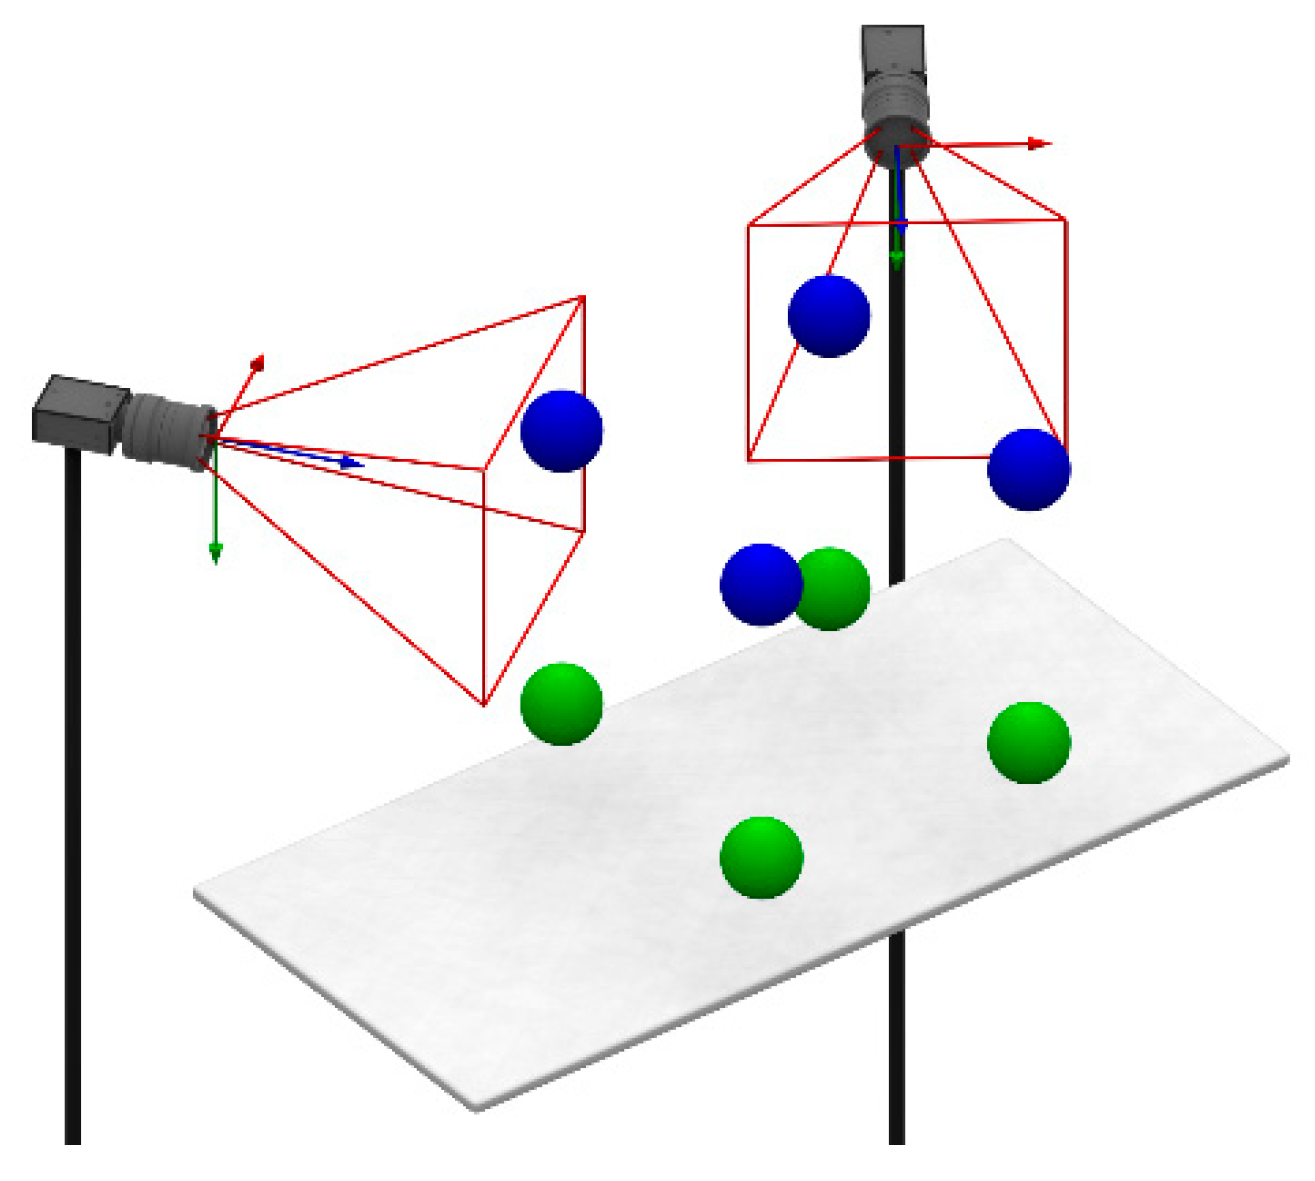
We implemented a prototype of the MARVIS system to assess and validate its concept. The system frame was made from aluminum profiles of 45 × 45 mm. The PhTM consists of a 2 MP color camera (Flea3 FL3-U3-20E4C; Point Grey Research Inc, Wilsonville, OR, USA) equipped with a narrow-angle lens (f = 25 mm; Pentax Corp., Tokyo, Japan; green area in Figure 9). The camera optical axis is nearly parallel to the projector optical axis, with a working distance of 1450 mm. The HdTM consists of two 2 MP color cameras (Flea3 FL3-U3-20E4C; Point Grey Research Inc, Wilsonville, OR, USA; red areas in Figure 9) with wide-angle lenses (f = 8 mm; Pentax Corp., Tokyo, Japan;), pointing at the user’s head. The distance between the HdTM cameras is approximately 1200 mm. The liver phantom illumination and AR displaying are obtained from a full HD projector (EH415; Optoma Corp., New Taipei, Taiwan; PrM, blue area in Figure 9). The projection distance is approximately 1300 mm, and the optical axis is perpendicular to the working table. The SIM consists of a PIC microcontroller with an additional hardware module based on the Banana PI board (Sinovoip Co., Ltd, Shenzhen, China) and IBM Node-RED software for capturing data from the user’s syringe probe (Figure 10). The phantom was cast from silicone molding rubber [31], and the internal structures from agar [32]. The molding casts were designed using 3ds Max 2017 and printed from ABS using a µPrint 3D printer (Stratasys Ltd., Valencia, CA, USA). The print quality was set to the highest value, layer height 0.254 mm. The liver phantom view is augmented with the internal structures as shown in Figure 11. The area in red represents a tumor, and that in blue represents blood vessels.
The developed software was implemented in C++ using Visual Studio 2015 (Microsoft Corp., Redmond, WA, USA) and the OpenGL API. It runs on a 64-bit Windows 10 Pro computer with an Core i7 6700K (4.0 GHz; Intel Corp., Santa Clara, CA, USA) processor and GeForce 980 graphics card (NVIDIA Corp., Santa Clara, CA, USA). The CSDs of the liver model were sampled with resolution of 5° about the Z-axis (60 points for the contour). Prerendered views were generated with resolution of 2° about both the X and Y axes. These resolutions consider the tradeoff between computational complexity and phantom simulation accuracy. The ranges of rotation per axis were chosen after consultation with medical experts, within ranges −60° < Φ < 60° and 45°< θ < 45° relative to a default anatomic phantom position on the working table. These values consider the surgical experience from two of the coauthors and the limitations of liver anatomical movements in the human body. These ranges, which were implemented in MARVIS, are broader than the usual angles found in surgeon’s practice.
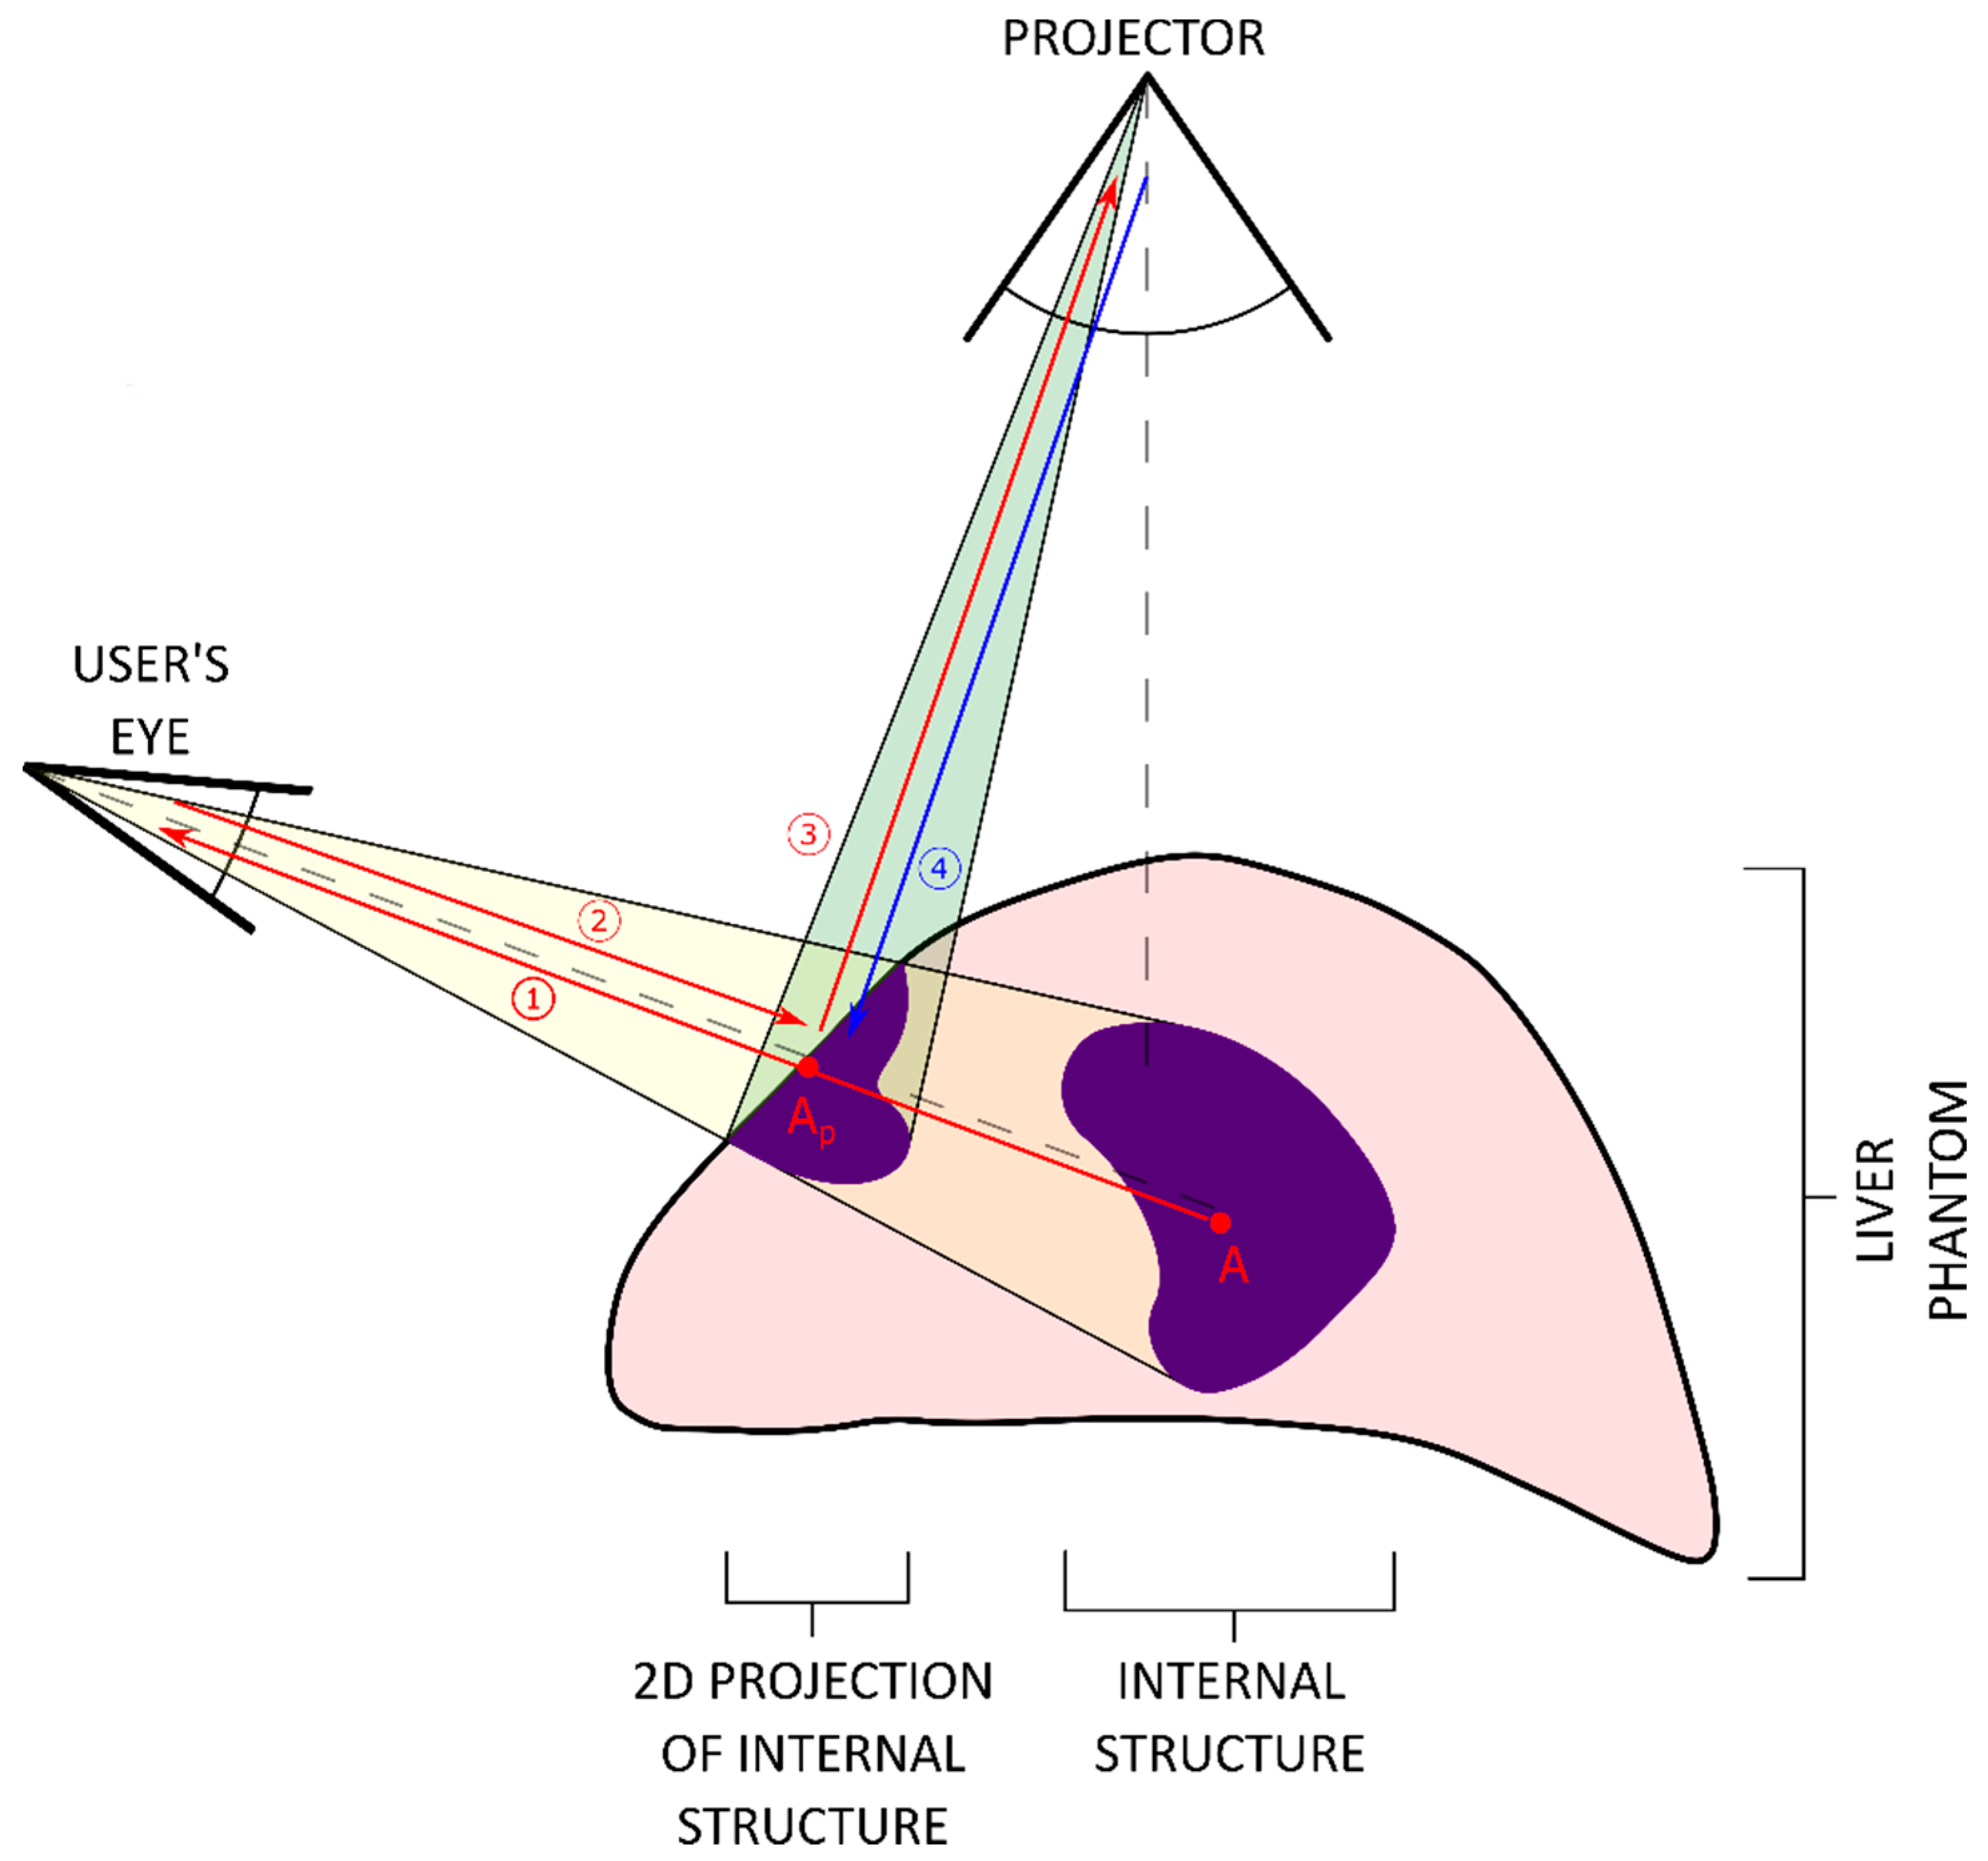
MARVIS generates an OpenGL scene of a liver model, including its internal structures, at each timeframe and projects its transformed image onto the physical phantom. First, a scene is rendered with respect to the user’s viewpoint (Figure 12, step 1), beginning with the phantom shell without internal structures. Next, the system renders the internal structures in a separate framebuffer for superimposition onto the framebuffer with the shell image, disregarding depth information from the Z-axis buffer (Figure 12, projection of A onto Ap). The system then virtually re-projects the pixels (Figure 12, step 2) from the user’s viewpoint onto the liver phantom surface based on the global coordinate system and projects these pixels onto the projector image plane (Figure 12, step 3). Therefore, the PrM accesses the information required to display an image with suitable perception characteristics for the operator (Figure 12, step 4).
The elements of the required transformation matrices are partially calculated during calibration, such as matrices containing the intrinsic and extrinsic parameters for all the cameras and projector. Other elements, such as matrices containing information of liver phantom orientation and user’s head position, are updated frame-by-frame in real time.

3. Results

We performed various evaluations to validate the performance of the MARVIS system. The analyzed functionalities include angular accuracy of phantom tracking, quality of mutual calibrations at particular modules, and accuracy of head tracking. Finally, a test of the whole system was conducted.

3.1. Angular Accuracy of Phantom Tracking

To assess the accuracy of angular position estimation for the phantom, we employed a dedicated hardware configuration. Specifically, the phantom was placed on a stack comprising a tilting table and a rotary table. The phantom was positioned flat and attached to the table surface. The starting orientation of the phantom was estimated based on the flat arrangement of its bottom part, such that it was tangent at two points to a vertical line projected by the PrM.
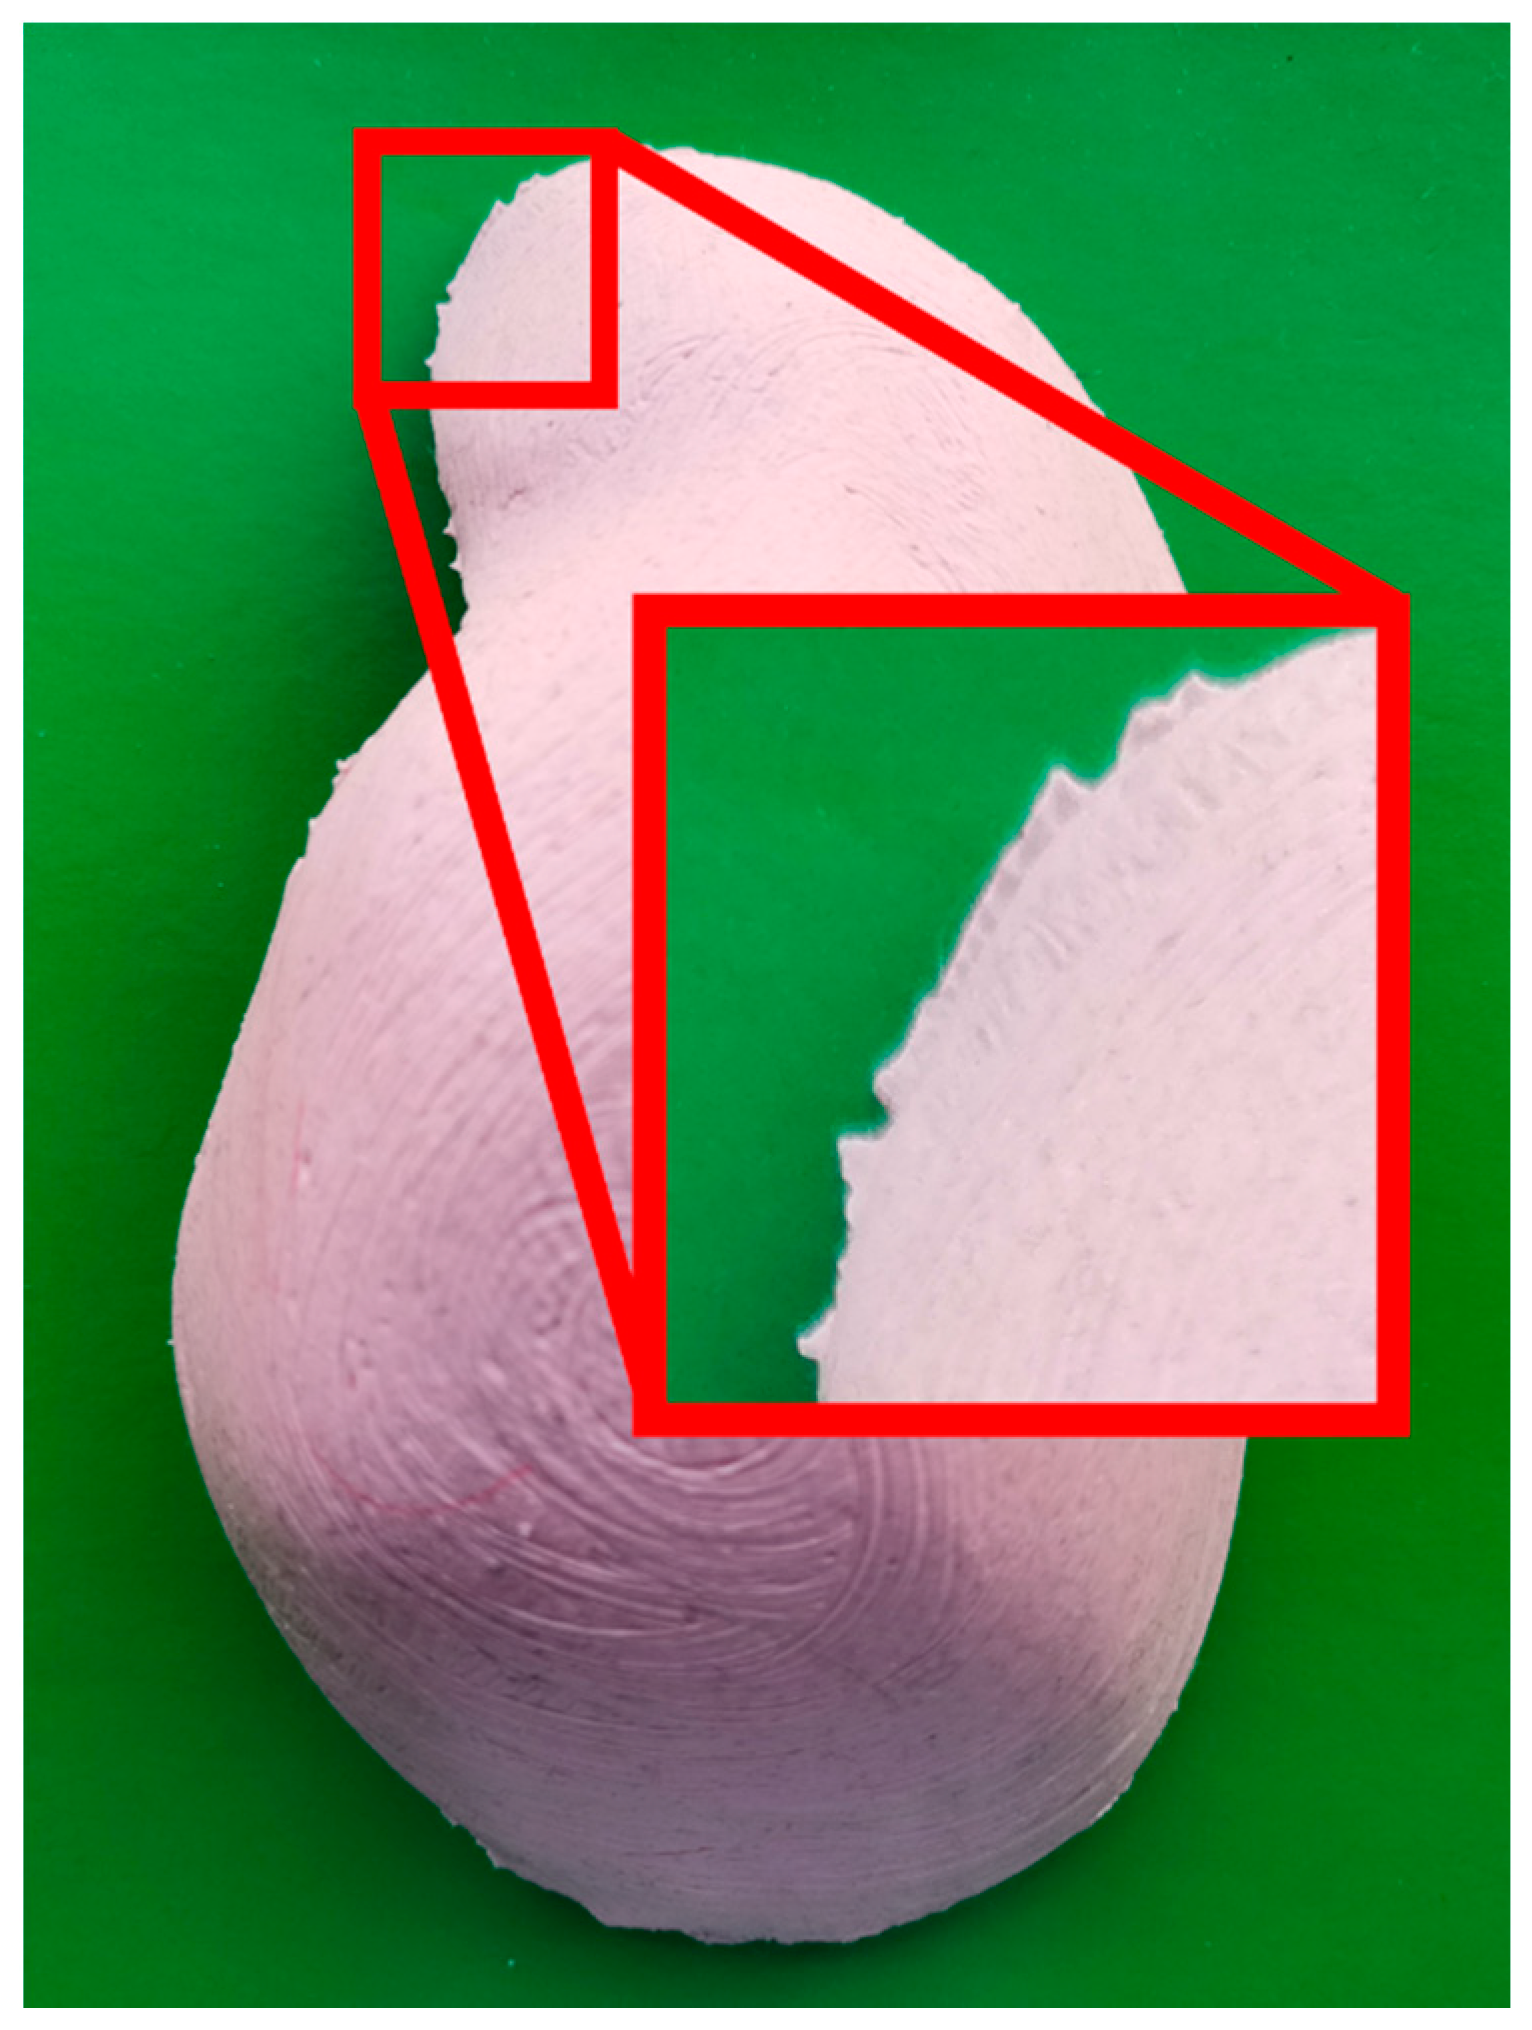
Each axis of rotation was independently validated in Table 1a–c. Angular tracking about the X and Y axes was conducted with a 2° resolution, corresponding to the angular spatial resolution of the prerendered positions in the MDB. The average error was 1.38° (maximum 3.0°) about the X axis, and 1.92° (maximum 4.0°) about the Y axis. We believe that the accuracy of the silicon mold is the most important factor that influences the matching procedure, because the crucial contour detection operation is applied to local changes in shape (Figure 13). The detection of rotation resolution about the Z-axis is limited by the resolution of the PhTM camera.

3.2. Mutual Calibration of Phantom-Tracking and Projection Modules

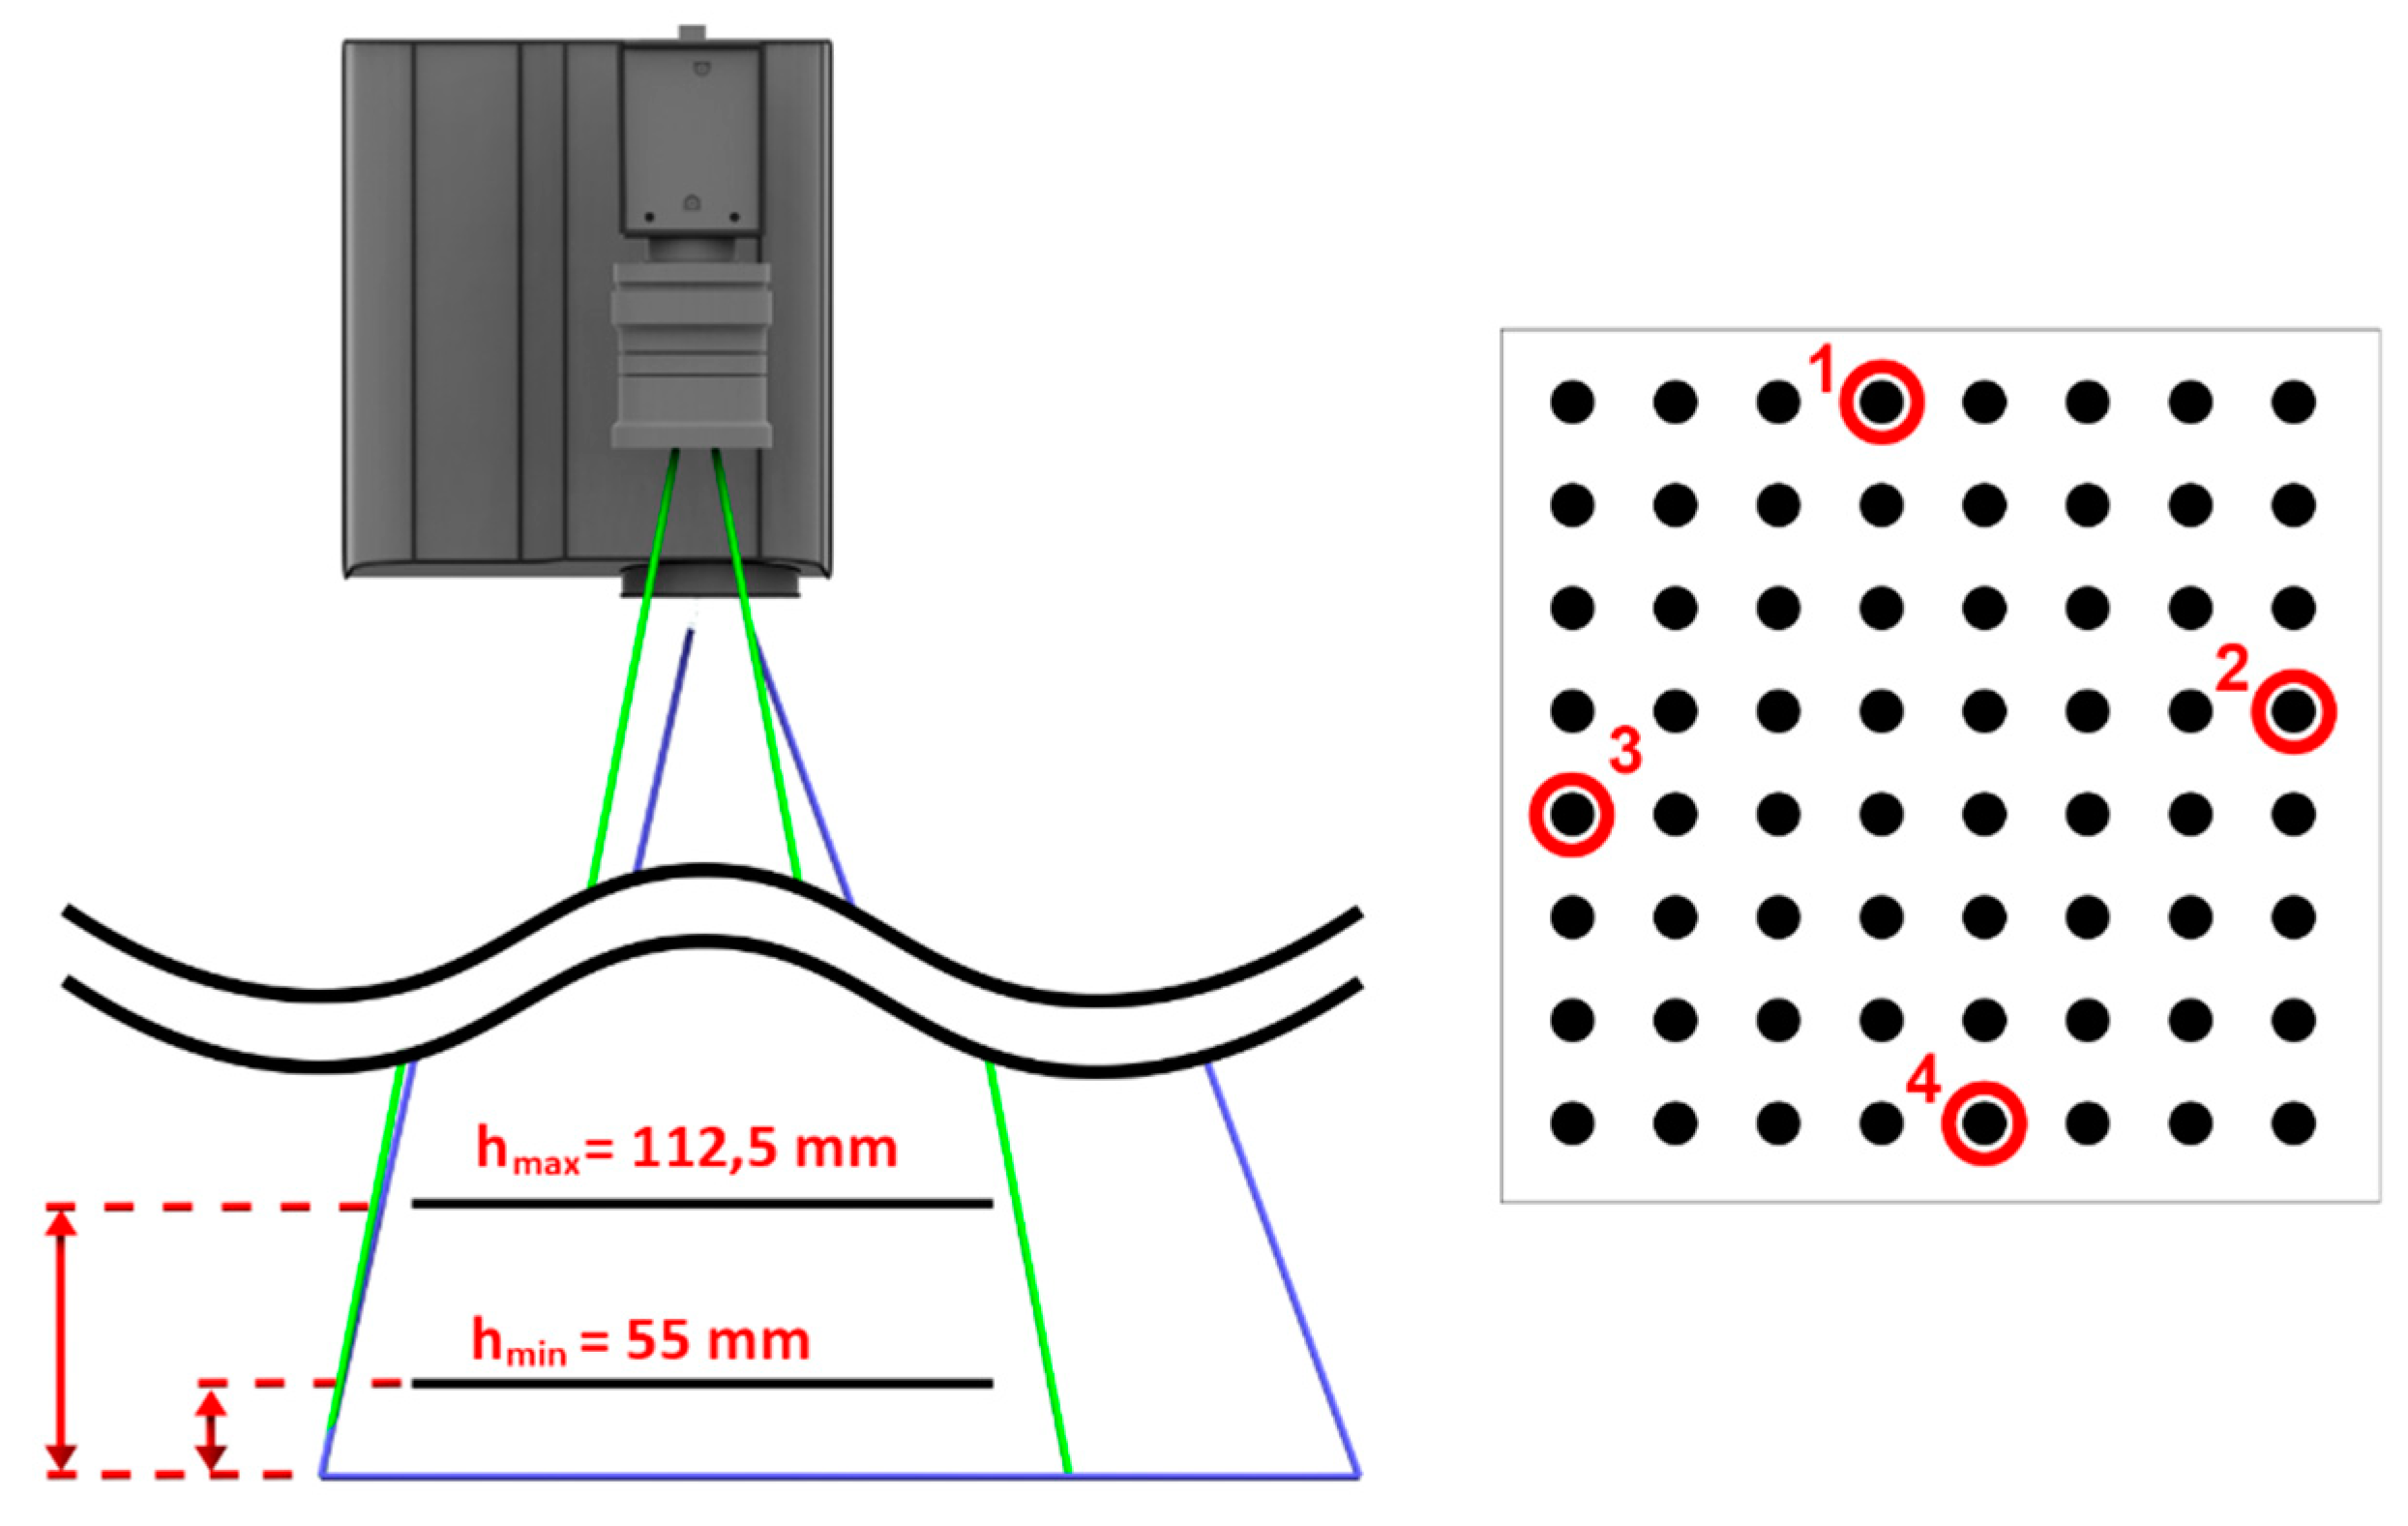
The mutual calibration of the PhTM and PrM was assessed by estimating the marker reprojection error which is a common method for systems consisting of image detectors and projectors. Four markers from a calibration board were selected and measured at seven distances from the working table at a range of 55.5–112.5 mm (Figure 14, Table 2), which corresponds to the phantom surface position. The average reprojection error within the calibrated measurement volume was 0.01 mm (maximum 0.17 mm). The average size of a projected pixel was 0.20 mm, and the average size of the pixels captured by the PhTM camera was 0.25 mm. The results are satisfactory when compared to commercially-available tracking systems which achieve accuracy of 0.61 ± 0.55 cm (Oculus Rift) and 0.58 ± 0.45 cm (HTC Vive) [33]. However, it must be noted that MARVIS uses a much smaller measurement volume.

3.3. Head-Tracking Accuracy

To validate the head-tracking accuracy of MARVIS, several points (Figure 15) near the edges of the calibration volume were selected for calculating the reprojection error. For the image plane in the middle of the calibrated volume, one pixel of the HdTM camera image corresponds to 2.5 mm. The obtained results listed in Table 3 confirm an angular accuracy below 0.1 degree [34], which is sufficient to track the user’s head viewing direction. This is used for determining the orientation of the user’s viewpoint in the global coordinate system and then to enable parallax motion. The accuracy of this measurement is crucial to prevent the vergence–accommodation conflict.

3.4. System Validation

An initial validation of MARVIS was conducted as a trial involving pricking internal structures of the liver phantom (Figure 16) using either phantom image data displayed in a traditional way on an external LCD monitor (control experiment) or structures being projected (Figure 12) directly onto the phantom’s surface (test experiment).
The total of 25 students (12 males and 13 females, mean age, 23.12 years; SD, 1.27 years) from the faculties of medicine at the Medical University of Warsaw took part in the validation. Additionally, three experienced male surgeons performed the same test (mean age, 43.66 years; SD, 7.57 years). Given the small number of participating surgeons, we analyzed the data from all the participants together. For each participant, the experiment was carried out as follows:
  • Control experiment: Author R.G. selected an internal structure from the 3D model displayed on the external monitor. The 3D model was generated using CT data of the first phantom (two phantoms with different internal structure shapes were used for each participant of the experiment in order to avoid the influence of the user remembering the particular case). The participant was asked to prick the structure in the first liver phantom with a syringe probe by looking at the 3D model. The 3D model could be rotated accordingly using a computer keyboard. The time to complete the task was measured manually by the test supervisor until the participant informed task accomplishment.
  • Test experiment: Author R.G. selected an internal structure projected by the MARVIS system onto the second phantom. The participant was asked to prick the structure with the syringe probe. Holding the phantom in his hand in a way that would not interfere with phantom contour detection, the participant inspected the internal structures as they were projected onto the phantom’s surface. Phantom position and participant’s head were tracked with PhTM and HdTM, respectively.
  • When the participant decided to prick the structure, he had to put the phantom on the desk (for stability) and pause PhTM tracking by depressing a foot pedal. Otherwise, his hands or the syringe occluding the phantom contour would cause PhTM to provide false data about phantom position. Only then pricking could be performed. HdTM and PrM were working continuously so the projection parameters of the internal structures depended on the current position of the participant’s head. The duration time of the pricking procedure was measured as in the control experiment.
  • The test experiment was performed with the first phantom.
  • The control experiment was performed with the second phantom.
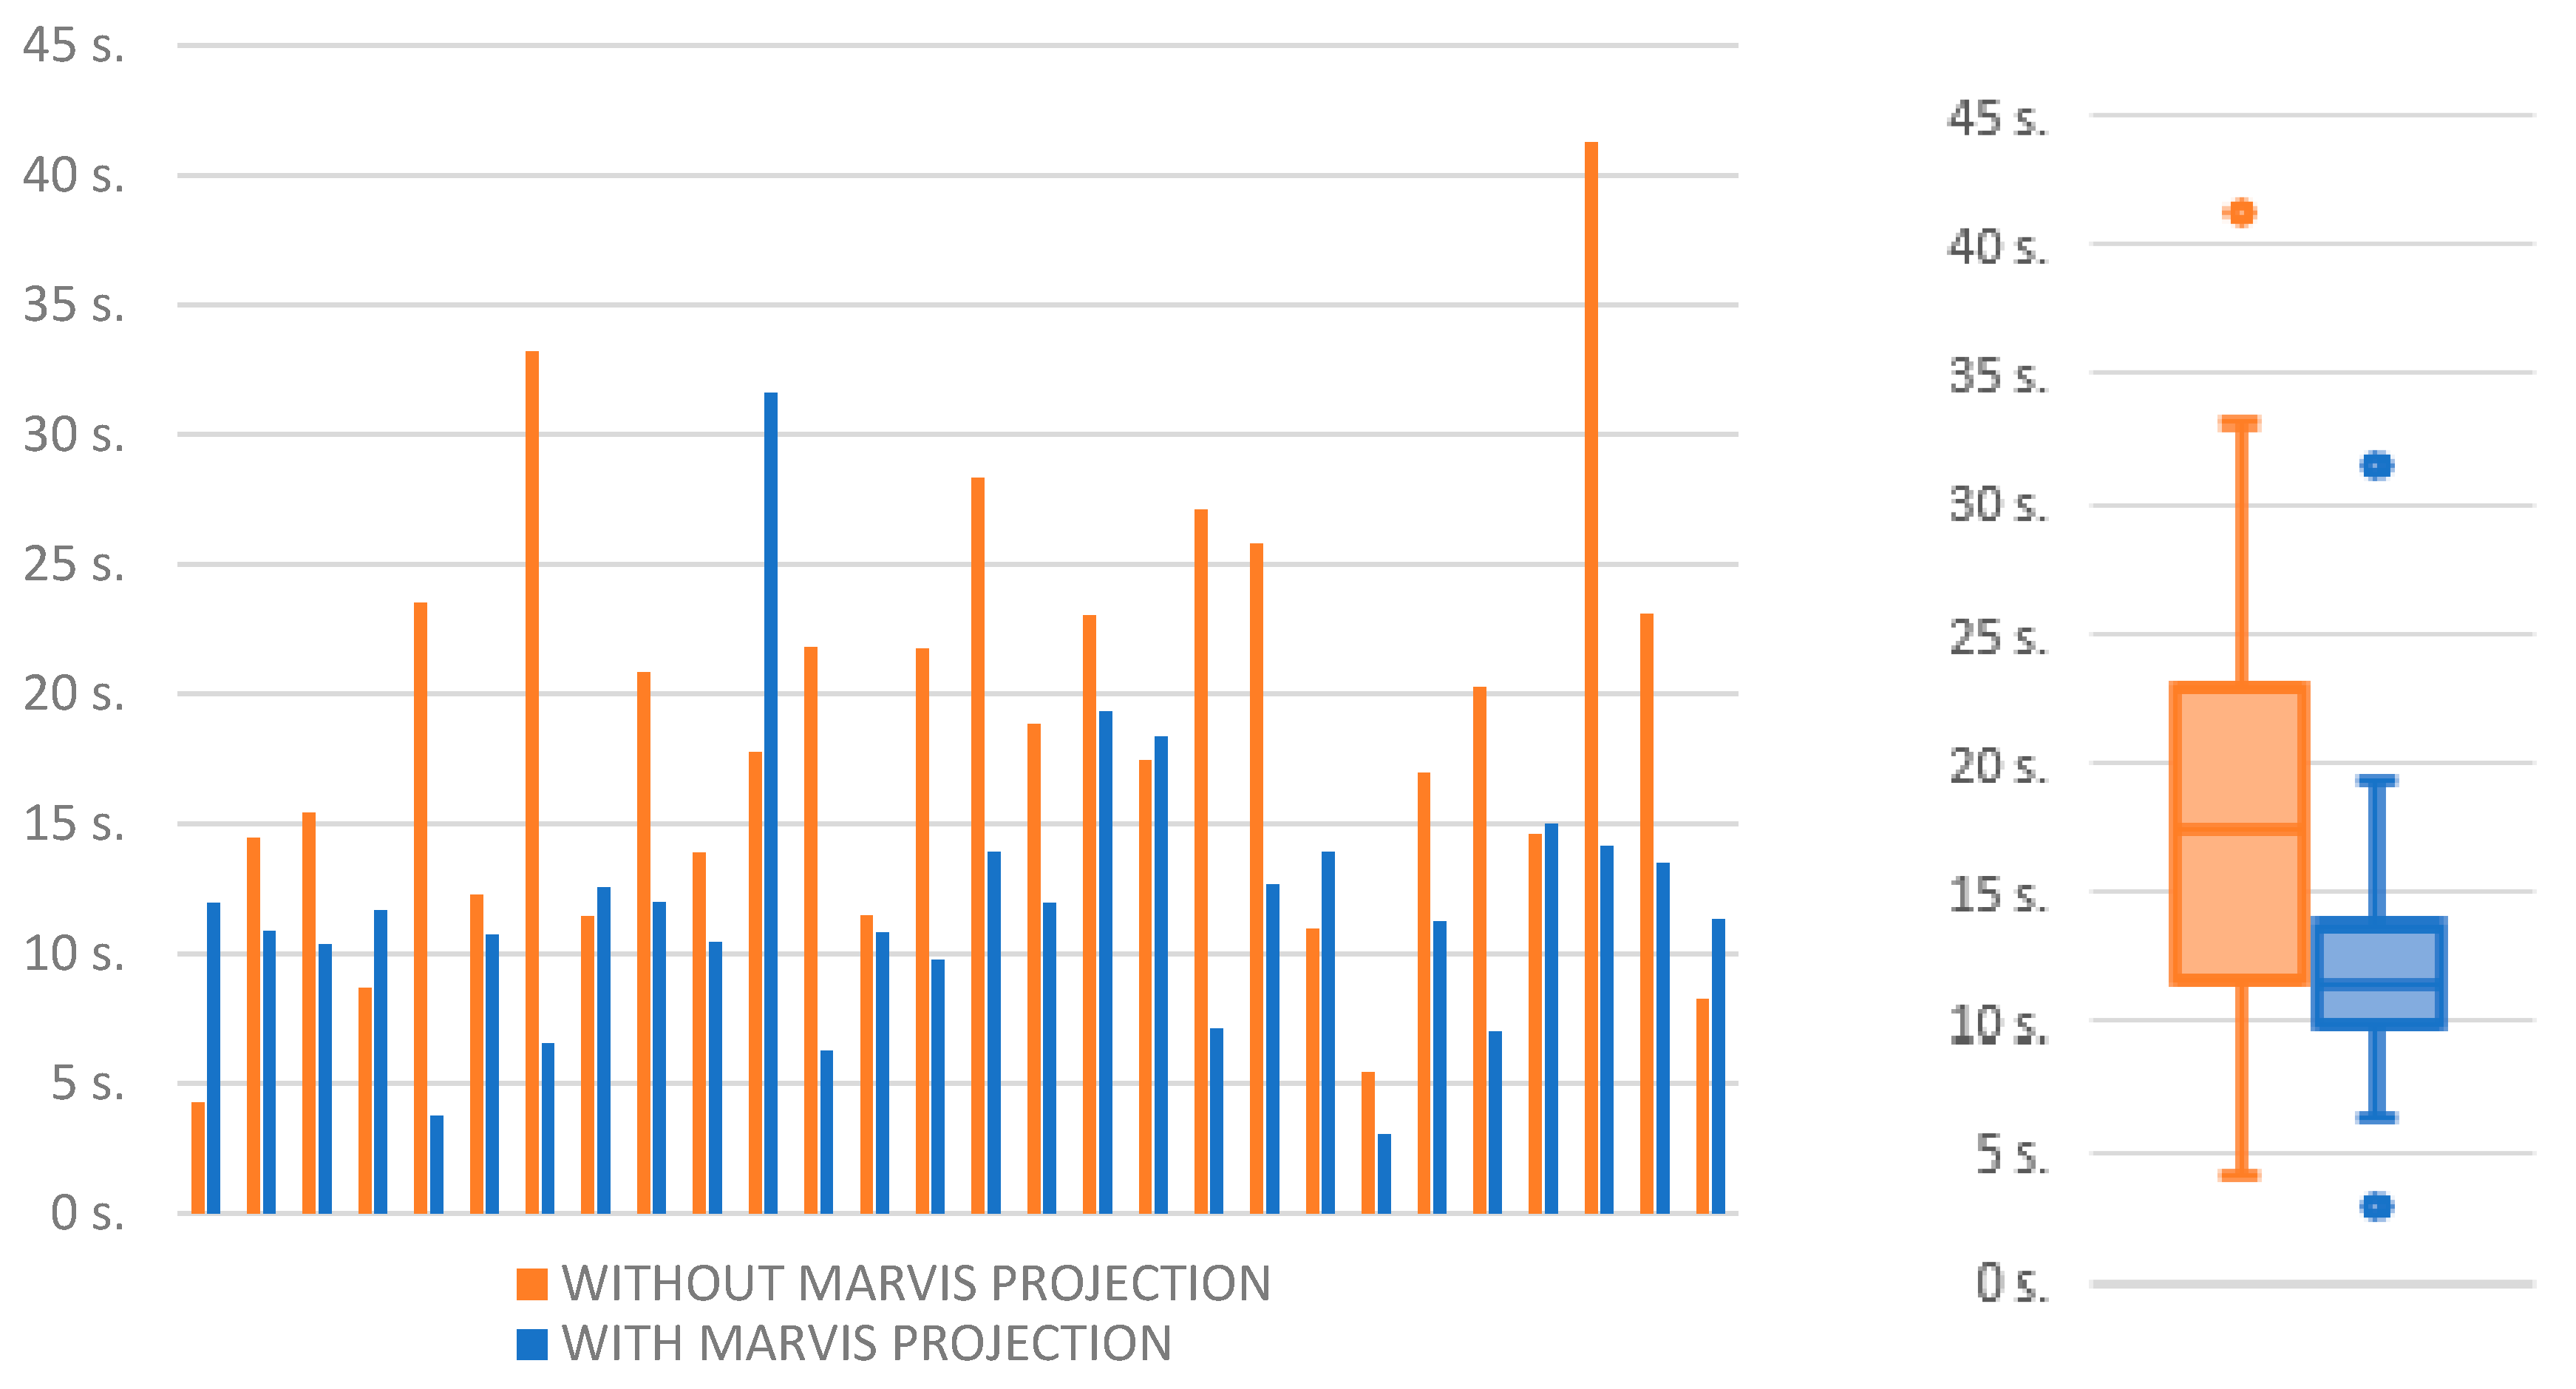
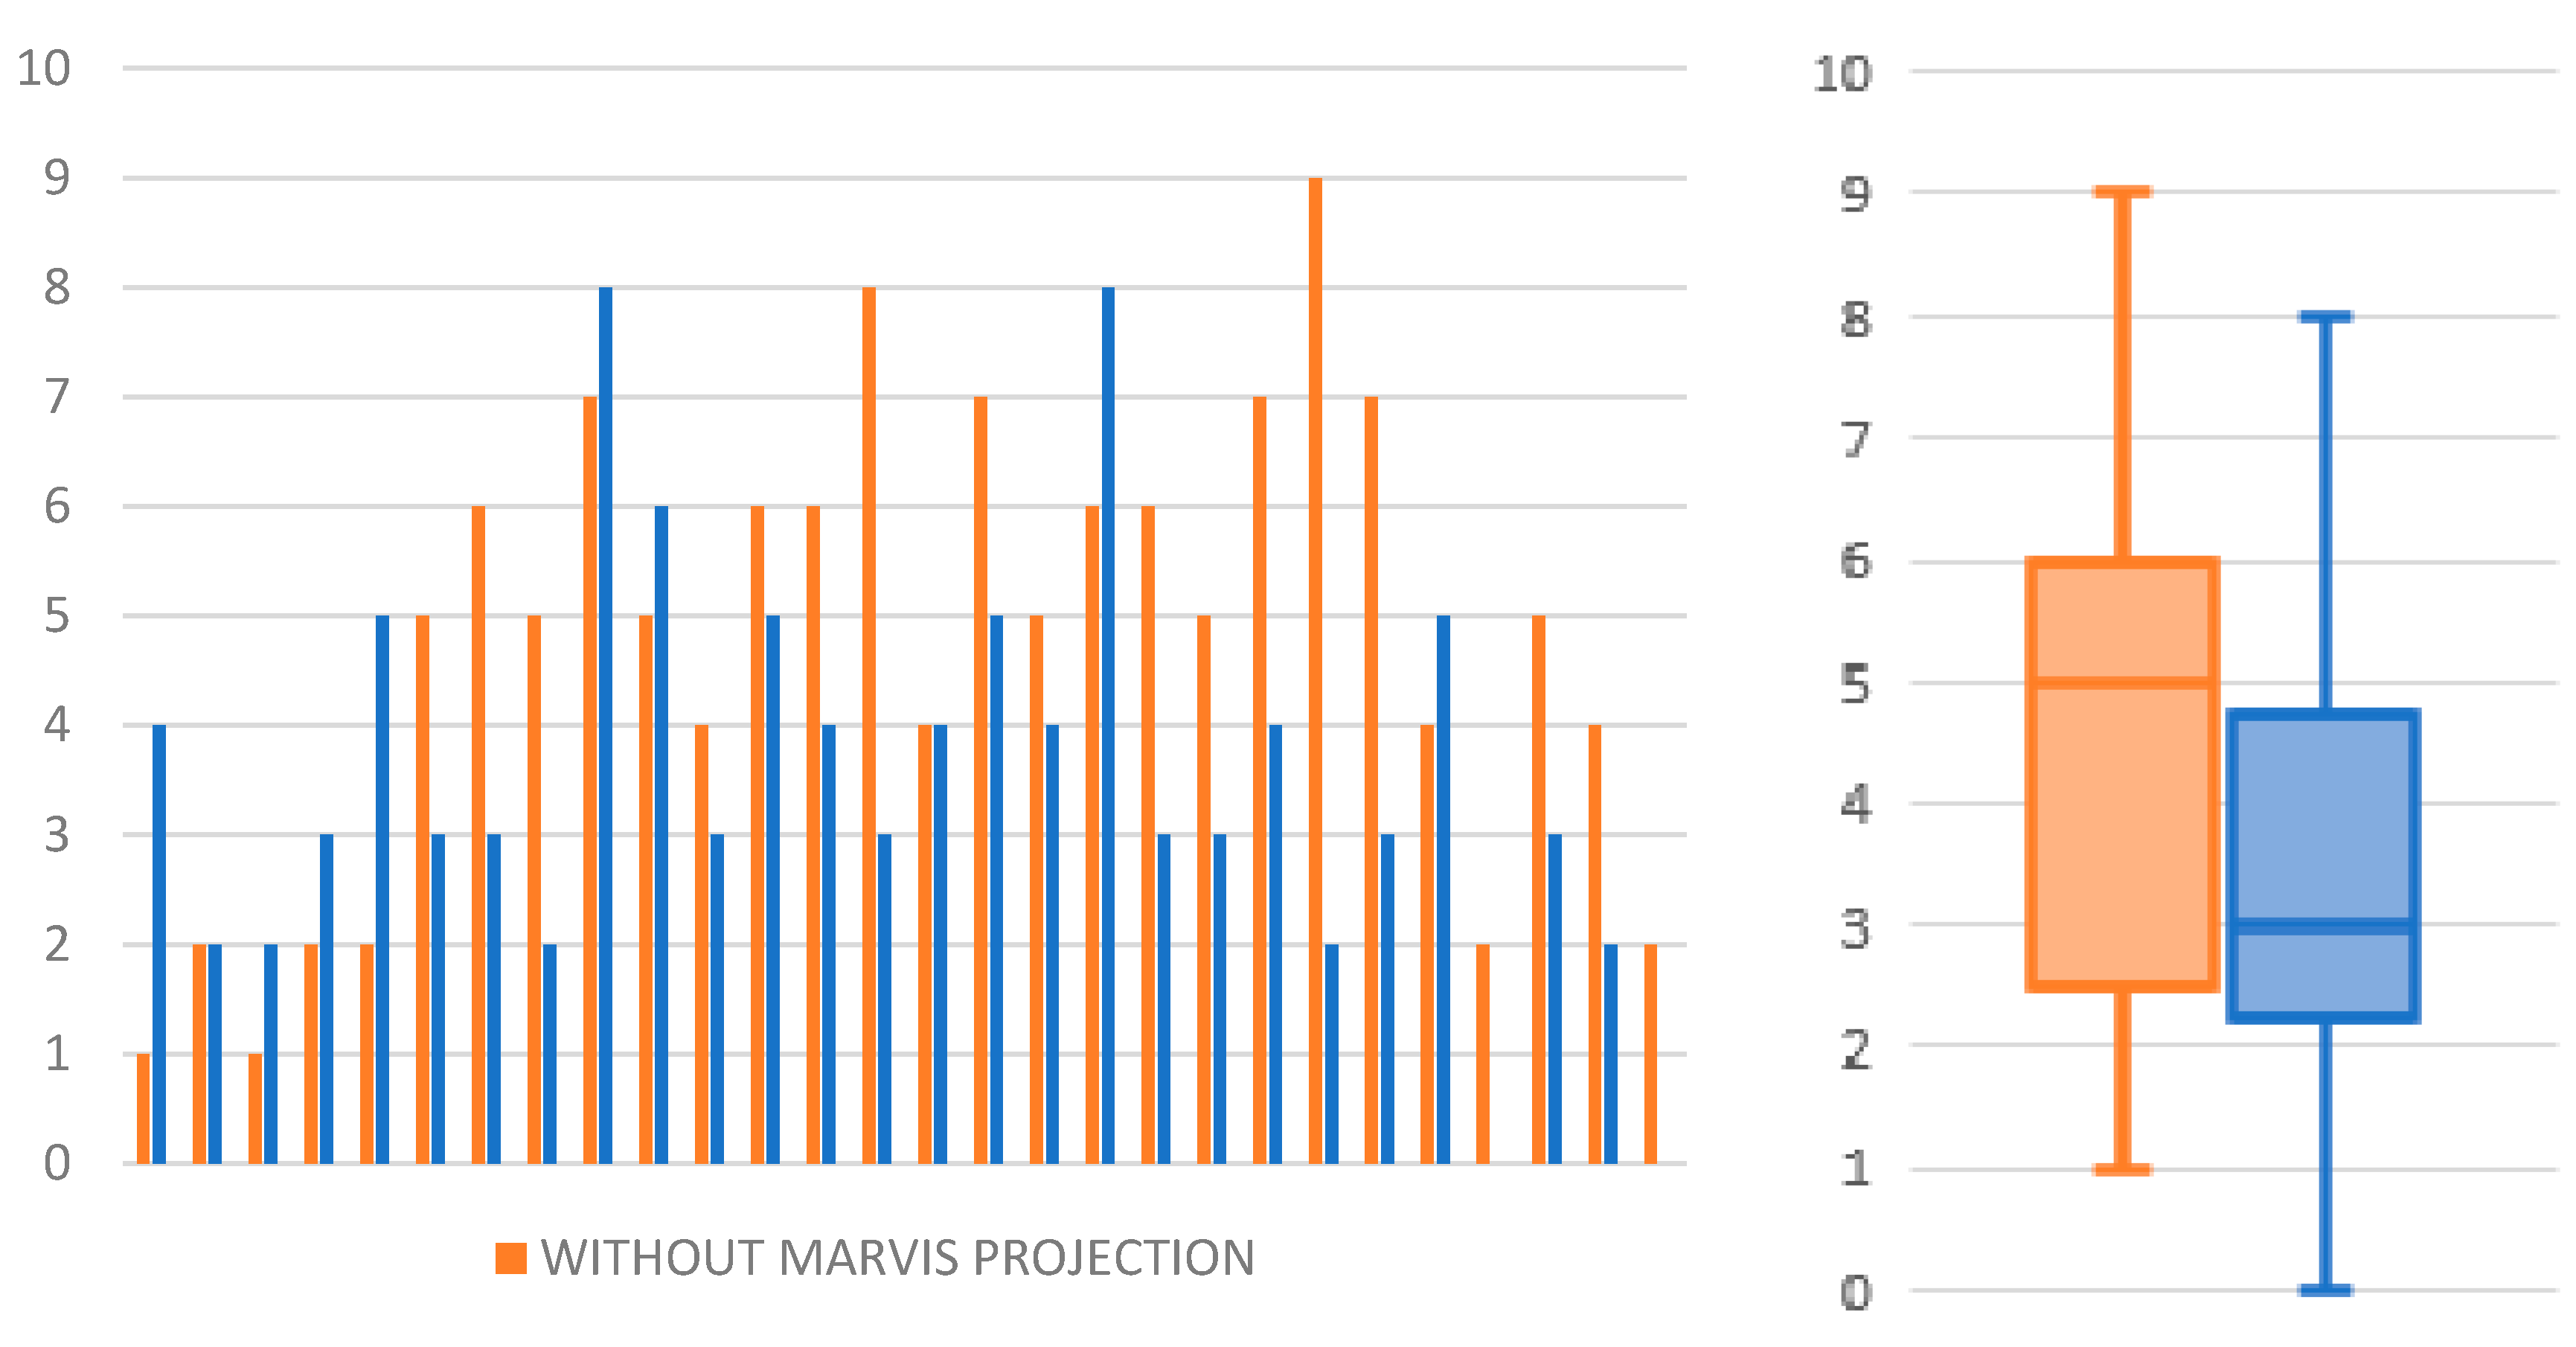
The tests showed that the failure rate (i.e., participants not being able to hit the desired structure) dropped from 50% without projection to 30% with projection (Table 4, failure rate columns, and Figure 17 and Figure 18). Moreover, the median time to perform one correct prick dropped from 17.6 s to 11.5 s (Table 4, median time columns). Most of the participants consistently claimed that projection simplified and reduced the time to complete the test procedure.

3.5. System Performance

The framerates of the PhTM camera and HdTM cameras were 60 fps. The average image projection framerate of the PrM was 25 fps regardless of the position/orientation of the phantom. The lag between moving the phantom and the change in the projected image was approximately 0.5 s (as measured using an external 120 fps camera). Each prick took 21.5 ± 9.3 s in the worst case, and a needle probe remained sufficiently sharp for efficient pricking over approximately 150 trials. Every custom-made liver phantom was pricked approximately 50 times by students and it still keeps its mechanical material properties. However, conductivity drops after approximately 1 month, when agar dries.

4. Discussion

The proposed system fulfills our design requirements and provides 3D perception of internal structures when either the operator’s head or the phantom moves. The simulator provides content validity by clearly determining whether the training participant was able to prick the proper internal structure during the test. The duration of the pricking procedure is measured, and faulty hits are recorded to differentiate between a good and bad performer (construct validity). Although no dedicated surveys were conducted, the user acceptability during the tests was very high. The educational impact was positive as shown by the failure rate distribution and median procedure time histograms. The cost of a single pricking procedure is mainly connected with the wear of the phantom and is approximately USD 0.50 (the cost of the system hardware is not considered here).
Although the design requirements have been met, certain aspects of the presented solution can be further improved. In the current setup, the user must pay attention not to occlude the phantom edge from the PhTM camera. Moreover, the silicone mold may be deformed if mishandled and provide a faulty CSD. Furthermore, head tracking with a single marker makes the system sensitive to yaw/pitch/roll rotations of the head, and considerable rotations can lead to inaccuracy and distortion in the projected image.
For a focused image to be formed on the retina, the eyes accommodate at a proper distance and adjust the required vergence. The allowable tolerance of the focusing distance for the observer to perceive of a clear image is ±0.3D (diopter) [35], and the acceptable vergence error is at the level of 15–30′ (arc minutes) [36]. Larger values impede the generation of stereoscopic vision [37]. Although small discrepancies do not cause the complete disappearance of binocular fusion, they notably undermine depth perception [38]. Therefore, the long-term use of conventional 3D displays causes fatigue and discomfort to the viewer [39,40,41]. Those symptoms may be caused by the lack of synchronization between vergence and accommodation [20]. In contrast, monoscopic visualization supported by motion parallax avoids these problems.
After a few days of tests, we noticed declining performance of the participants, and one of them complained about a blunt needle. Then, we verified that this was the reason for the observed performance decay. In fact, after replacing the needle, the effectiveness returned to the expected levels. Furthermore, some students had difficulties interpreting the CT data displayed on the external LCD during the control experiment, possibly because of their inexperience. In addition, frozen pose detection was problematic, as some of students found it difficult to coordinate the pedal usage. On the other hand, some participants pointed out the low resolution of the projected data as the main drawback of the MARVIS system. Nevertheless, most participants claimed that using MARVIS led to easier and faster task completion by the projection-supported 3D perception and understanding of the spatial relationships between internal structures. They also agreed on their interest to train with the MARVIS system on more complex cases.
The initial validation demonstrates the applicability of the MARVIS system for surgical training and education in medicine. The corresponding results show that methods employing natural phantom manipulation (i.e., using the operator’s hands) along with visualization unobstructed by external devices and enhanced by AR are promising for the development of surgical research and applications.

5. Conclusions

We propose a low-cost glasses-free medical AR visualizer called MARVIS for use in surgical training and education in medicine. The proposed approach allows the projection of internal structures on the surface of a silicone liver phantom considering the user’s viewpoint. The system setup prevents problems such as eye strain, discomfort, and fatigue, which are generally present when using AR headsets or glasses. Moreover, marker-less shape matching simplifies the phantom preparation. The overall accuracy of the MARVIS system from the viewpoint of natural human perception is highly satisfactory. Regarding the employed hardware, MARVIS accuracy is in the range of a single pixel of the projected image.
MARVIS may be used to support the education in medicine and improve the training of surgeons without risk to patients. Using MARVIS, we demonstrated that an AR system can influence the performance to accomplish surgical procedures. Using a real phantom provides a natural tactile experience for future surgeons and can simplify the process of surgical operation planning.
In future work, we will focus on improving visual data representation and decreasing the system response time to improve the user experience. We also intend to render more complex texture information related to internal structures using computer-generated 3D lighting. Further development of 3D mapping algorithms is also planned.

Author Contributions

Conceptualization, R.G., M.W. and R.S.; methodology, R.G. and R.S.; software, R.G.; validation, R.G., M.W., W.L., and M.K.; investigation, R.G.; resources, L.G.; writing—original draft preparation, R.G. and R.S.; writing—review and editing, M.W.; supervision W.L., M.K., and R.S.; project administration, R.S.; funding acquisition, R.S.

Funding

The work described in this article was part of project 2014/13/B/ST7/01704, funded by the National Science Centre with public money for science and statutory work at Warsaw University of Technology, Poland.

Conflicts of Interest

The authors declare no conflicts of interest.

References

  1. Ma, M.; Jain, L.C.; Anderson, P. Virtual, Augmented Reality and Serious Games for Healthcare 1; Springer: Berlin/Heidelberg, Germany, 2014; Volume 68. [Google Scholar]
  2. Martín-Gutiérrez, J.; Fabiani, P.; Benesova, W.; Meneses, M.D.; Mora, C.E. Augmented reality to promote collaborative and autonomous learning in higher education. Comput. Human Behav. 2015, 51, 752–761. [Google Scholar] [CrossRef]
  3. Fonseca, D.; Martí, N.; Redondo, E.; Navarro, I.; Sánchez, A. Relationship between student profile, tool use, participation, and academic performance with the use of Augmented Reality technology for visualized architecture models. Comput. Human Behav. 2014, 31, 434–445. [Google Scholar] [CrossRef]
  4. Lee, K. Augmented Reality in Education and Training. TechTrends 2012, 56, 13–21. [Google Scholar] [CrossRef]
  5. Bacca, J.; Baldiris, S.; Fabregat, R.; Graf, S. Augmented Reality Trends in Education: A Systematic Review of Research and Applications. Educ. Technol. Soc. 2014, 17, 133–149. [Google Scholar]
  6. Pantelidis, P.; Chorti, A.; Papagiouvanni, I.; Paparoidamis, G.; Drosos, C.; Panagiotakopoulos, T.; Lales, G.; Sideris, M. Virtual and Augmented Reality in Medical Education. In Medical and Surgical Education—Past, Present and Future; InTechOpen: Rijeka, Croatia, 2018. [Google Scholar] [Green Version]
  7. Kluger, M.D.; Vigano, L.; Barroso, R.; Cherqui, D. The learning curve in laparoscopic major liver resection. J. Hepatobiliary Pancreat. Sci. 2013, 20, 131–136. [Google Scholar] [CrossRef] [PubMed]
  8. Hopper, A.N.; Jamison, M.H.; Lewis, W.G. Learning curves in surgical practice. Postgrad. Med. J. 2007, 83, 777–779. [Google Scholar] [CrossRef] [PubMed] [Green Version]
  9. Koehn, J.K.; Kuchenbecker, K.J. Surgeons and non-surgeons prefer haptic feedback of instrument vibrations during robotic surgery. Surg. Endosc. 2015, 29, 2970–2983. [Google Scholar] [CrossRef]
  10. Van der Meijden, O.A.J.; Schijven, M.P. The value of haptic feedback in conventional and robot-assisted minimal invasive surgery and virtual reality training: A current review. Surg. Endosc. 2009, 23, 1180–1190. [Google Scholar] [CrossRef]
  11. Lovegrove, C.E.; Abe, T.; Aydin, A.; Veneziano, D.; Sarica, K.; Khan, M.S.; Dasgupta, P.; Ahmed, K. Simulation training in upper tract endourology: Myth or reality? Minerva Urol. Nefrol. 2017, 69, 579–588. [Google Scholar] [CrossRef]
  12. Chen, H.; Lee, A.S.; Swift, M.; Tang, J.C. 3D Collaboration Method over HoloLensTM and SkypeTM End Points. In Proceedings of the 23rd ACM International Conference on Multimedia, Brisbane, Australia, 26–30 October 2015; pp. 27–30. [Google Scholar] [CrossRef]
  13. Hua, H.; Gao, C.; Brown, L.D.; Ahuja, N.; Rolland, J.P. Using a head-mounted projective display in interactive augmented environments. In Proceedings of the IEEE and ACM International Symposium on Augmented Reality, Washington, DC, USA, 29–30 October 2001; pp. 217–223. [Google Scholar] [CrossRef]
  14. Hanna, M.G.; Ahmed, I.; Nine, J.; Prajapati, S.; Pantanowitz, L. Augmented Reality Technology Using Microsoft HoloLens in Anatomic Pathology. Arch. Pathol. Lab. Med. 2018, 142, 638–644. [Google Scholar] [CrossRef] [Green Version]
  15. Jeroudi, O.M.; Christakopoulos, G.; Christopoulos, G.; Kotsia, A.; Kypreos, M.A.; Rangan, B.V.; Banerjee, S.; Brilakis, E.S. Accuracy of Remote Electrocardiogram Interpretation with the Use of Google Glass Technology. Am. J. Cardiol. 2015, 115, 374–377. [Google Scholar] [CrossRef] [PubMed]
  16. Mischkowski, R.A.; Zinser, M.J.; Kübler, A.C.; Krug, B.; Seifert, U.; Zöller, J.E. Application of an augmented reality tool for maxillary positioning in orthognathic surgery—A feasibility study. J. Cranio-Maxillofac. Surg. 2006, 34, 478–483. [Google Scholar] [CrossRef] [PubMed]
  17. Riecke, B.E.; Schulte-Pelkum, J.; Buelthoff, H.H. Perceiving Simulated Ego-Motions in Virtual Reality: Comparing Large Screen Displays with HMDs; Rogowitz, B.E., Pappas, T.N., Daly, S.J., Eds.; International Society for Optics and Photonics: Bellingham, WA, USA, 2005; p. 344. [Google Scholar]
  18. Lacoche, J.; Le Chenechal, M.; Chalme, S.; Royan, J.; Duval, T.; Gouranton, V.; Maisel, E.; Arnaldi, B. Dealing with frame cancellation for stereoscopic displays in 3D user interfaces. In Proceedings of the 2015 IEEE Symposium on 3D User Interfaces (3DUI), Arles, France, 23–24 March 2015; pp. 73–80. [Google Scholar]
  19. Kramida, G. Resolving the vergence-accommodation conflict in head-mounted displays. IEEE Trans. Vis. Comput. Graph. 2016, 22, 1912–1931. [Google Scholar] [CrossRef] [PubMed]
  20. Hoffman, D.M.; Girshick, A.R.; Banks, M.S. Vergence—Accommodation conflicts hinder visual performance and cause visual fatigue. J. Vis. 2015, 8, 1–30. [Google Scholar] [CrossRef] [PubMed]
  21. Mandalika, V.B.H.; Chernoglazov, A.I.; Billinghurst, M.; Bartneck, C.; Hurrell, M.A.; Ruiter, N.; Butler, A.P.H.; Butler, P.H. A Hybrid 2D/3D User Interface for Radiological Diagnosis. J. Digit. Imaging 2018, 31, 56–73. [Google Scholar] [CrossRef] [PubMed]
  22. Daher, S.; Hochreiter, J.; Norouzi, N.; Gonzalez, L.; Bruder, G.; Welch, G. Physical-Virtual Agents for Healthcare Simulation. In Proceedings of the 18th International Conference on Intelligent Virtual Agents—IVA ’18, Sydney, Australia, 5–8 November 2018; pp. 99–106. [Google Scholar]
  23. Magee, D.; Zhu, Y.; Ratnalingam, R.; Gardner, P.; Kessel, D. An augmented reality simulator for ultrasound guided needle placement training. Med. Biol. Eng. Comput. 2007, 45, 957–967. [Google Scholar] [CrossRef] [Green Version]
  24. Coles, T.R.; John, N.W.; Gould, D.; Caldwell, D.G. Integrating haptics with augmented reality in a femoral palpation and needle insertion training simulation. IEEE Trans. Haptics 2011. [Google Scholar] [CrossRef]
  25. Fleck, S.; Busch, F.; Biber, P.; Straber, W. 3D Surveillance A Distributed Network of Smart Cameras for Real-Time Tracking and its Visualization in 3D. In Proceedings of the 2006 Conference on Computer Vision and Pattern Recognition Workshop (CVPRW’06), Washington, DC, USA, 17–22 June 2006; p. 118. [Google Scholar]
  26. Cui, Y.; Schuon, S.; Chan, D.; Thrun, S.; Theobalt, C. 3D shape scanning with a time-of-flight camera. In Proceedings of the 2010 IEEE Computer Society Conference on Computer Vision and Pattern Recognition, San Francisco, CA, USA, 13–18 June 2010; pp. 1173–1180. [Google Scholar]
  27. Seitz, S.M.; Curless, B.; Diebel, J.; Scharstein, D.; Szeliski, R. A Comparison and Evaluation of Multi-View Stereo Reconstruction Algorithms. In Proceedings of the 2006 IEEE Computer Society Conference on Computer Vision and Pattern Recognition—Volume 1 (CVPR’06), Washington, DC, USA, 17–22 June 2006; Volume 1, pp. 519–528. [Google Scholar]
  28. Zhang, Z. A flexible new technique for camera calibration. IEEE Trans. Pattern Anal. Mach. Intell. 2000, 22, 1330–1334. [Google Scholar] [CrossRef]
  29. Szelag, K.; Maczkowski, G.; Gierwialo, R.; Gebarska, A.; Sitnik, R. Robust geometric, phase and colour structured light projection system calibration. Opto-Electron. Rev. 2017, 25, 326–336. [Google Scholar] [CrossRef]
  30. Mayol-Cuevas, W.W.; Juarez-Guerrero, J.; Munoz-Gutierrez, S. A first approach to tactile texture recognition. In Proceedings of the SMC’98 Conference IEEE International Conference on Systems, Man, and Cybernetics (Cat. No.98CH36218), San Diego, CA, USA, 14 October 1998; Volume 5, pp. 4246–4250. [Google Scholar]
  31. MM922 Silicone Moulding Rubbers. Available online: https://acc-silicones.com/products/moulding_rubbers/MM922 (accessed on 15 February 2019).
  32. Matsuhashi, T. ‘Agar’. In Food Gels; Springer: Dordrecht, The Netherlands, 1990; pp. 1–51. [Google Scholar]
  33. Borrego, A.; Latorre, J.; Alcañiz, M.; Llorens, R. Comparison of Oculus Rift and HTC Vive: Feasibility for Virtual Reality-Based Exploration, Navigation, Exergaming, and Rehabilitation. Games Health J. 2018, 7, 151–156. [Google Scholar] [CrossRef]
  34. Ribo, M.; Pinz, A.; Fuhrmann, A.L. A new optical tracking system for virtual and augmented reality applications. In Proceedings of the 18th IMTC 2001 IEEE Instrumentation and Measurement Technology Conference. Rediscovering Measurement in the Age of Informatics (Cat. No.01CH 37188), Budapest, Hungary, 21–23 May 2001; IEEE: Piscataway, NJ, USA; Volume 3, pp. 1932–1936. [Google Scholar]
  35. Charman, W.N.; Whitefoot, H. Pupil Diameter and the Depth-of-field of the Human Eye as Measured by Laser Speckle. Opt. Acta Int. J. Opt. 1977, 24, 1211–1216. [Google Scholar] [CrossRef]
  36. Schor, C.; Wood, I.; Ogawa, J. Binocular sensory fusion is limited by spatial resolution. Vision Res. 1984, 24, 661–665. [Google Scholar] [CrossRef]
  37. Julesz, B. Foundations of Cyclopean Perception; Chicago University Press: Chicago, IL, USA, 1971. [Google Scholar]
  38. Blakemore, C. The range and scope of binocular depth discrimination in man. J. Physiol. 1970, 211, 599–622. [Google Scholar] [CrossRef] [PubMed] [Green Version]
  39. Emoto, M.; Niida, T.; Okano, F. Repeated Vergence Adaptation Causes the Decline of Visual Functions in Watching Stereoscopic Television. J. Disp. Technol. 2005, 1, 328–340. [Google Scholar] [CrossRef]
  40. Takada, H. The progress of high presence and 3D display technology the depth-fused 3-D display for the eye sweetly. Opt. Electro. Opt. Eng. Contact 2006, 44, 316–323. [Google Scholar]
  41. Takaki, Y. Novel 3D Display Using an Array of LCD Panels; Chien, L.-C., Ed.; International Society for Optics and Photonics: Bellingham, WA, USA, 2003; p. 1. [Google Scholar]
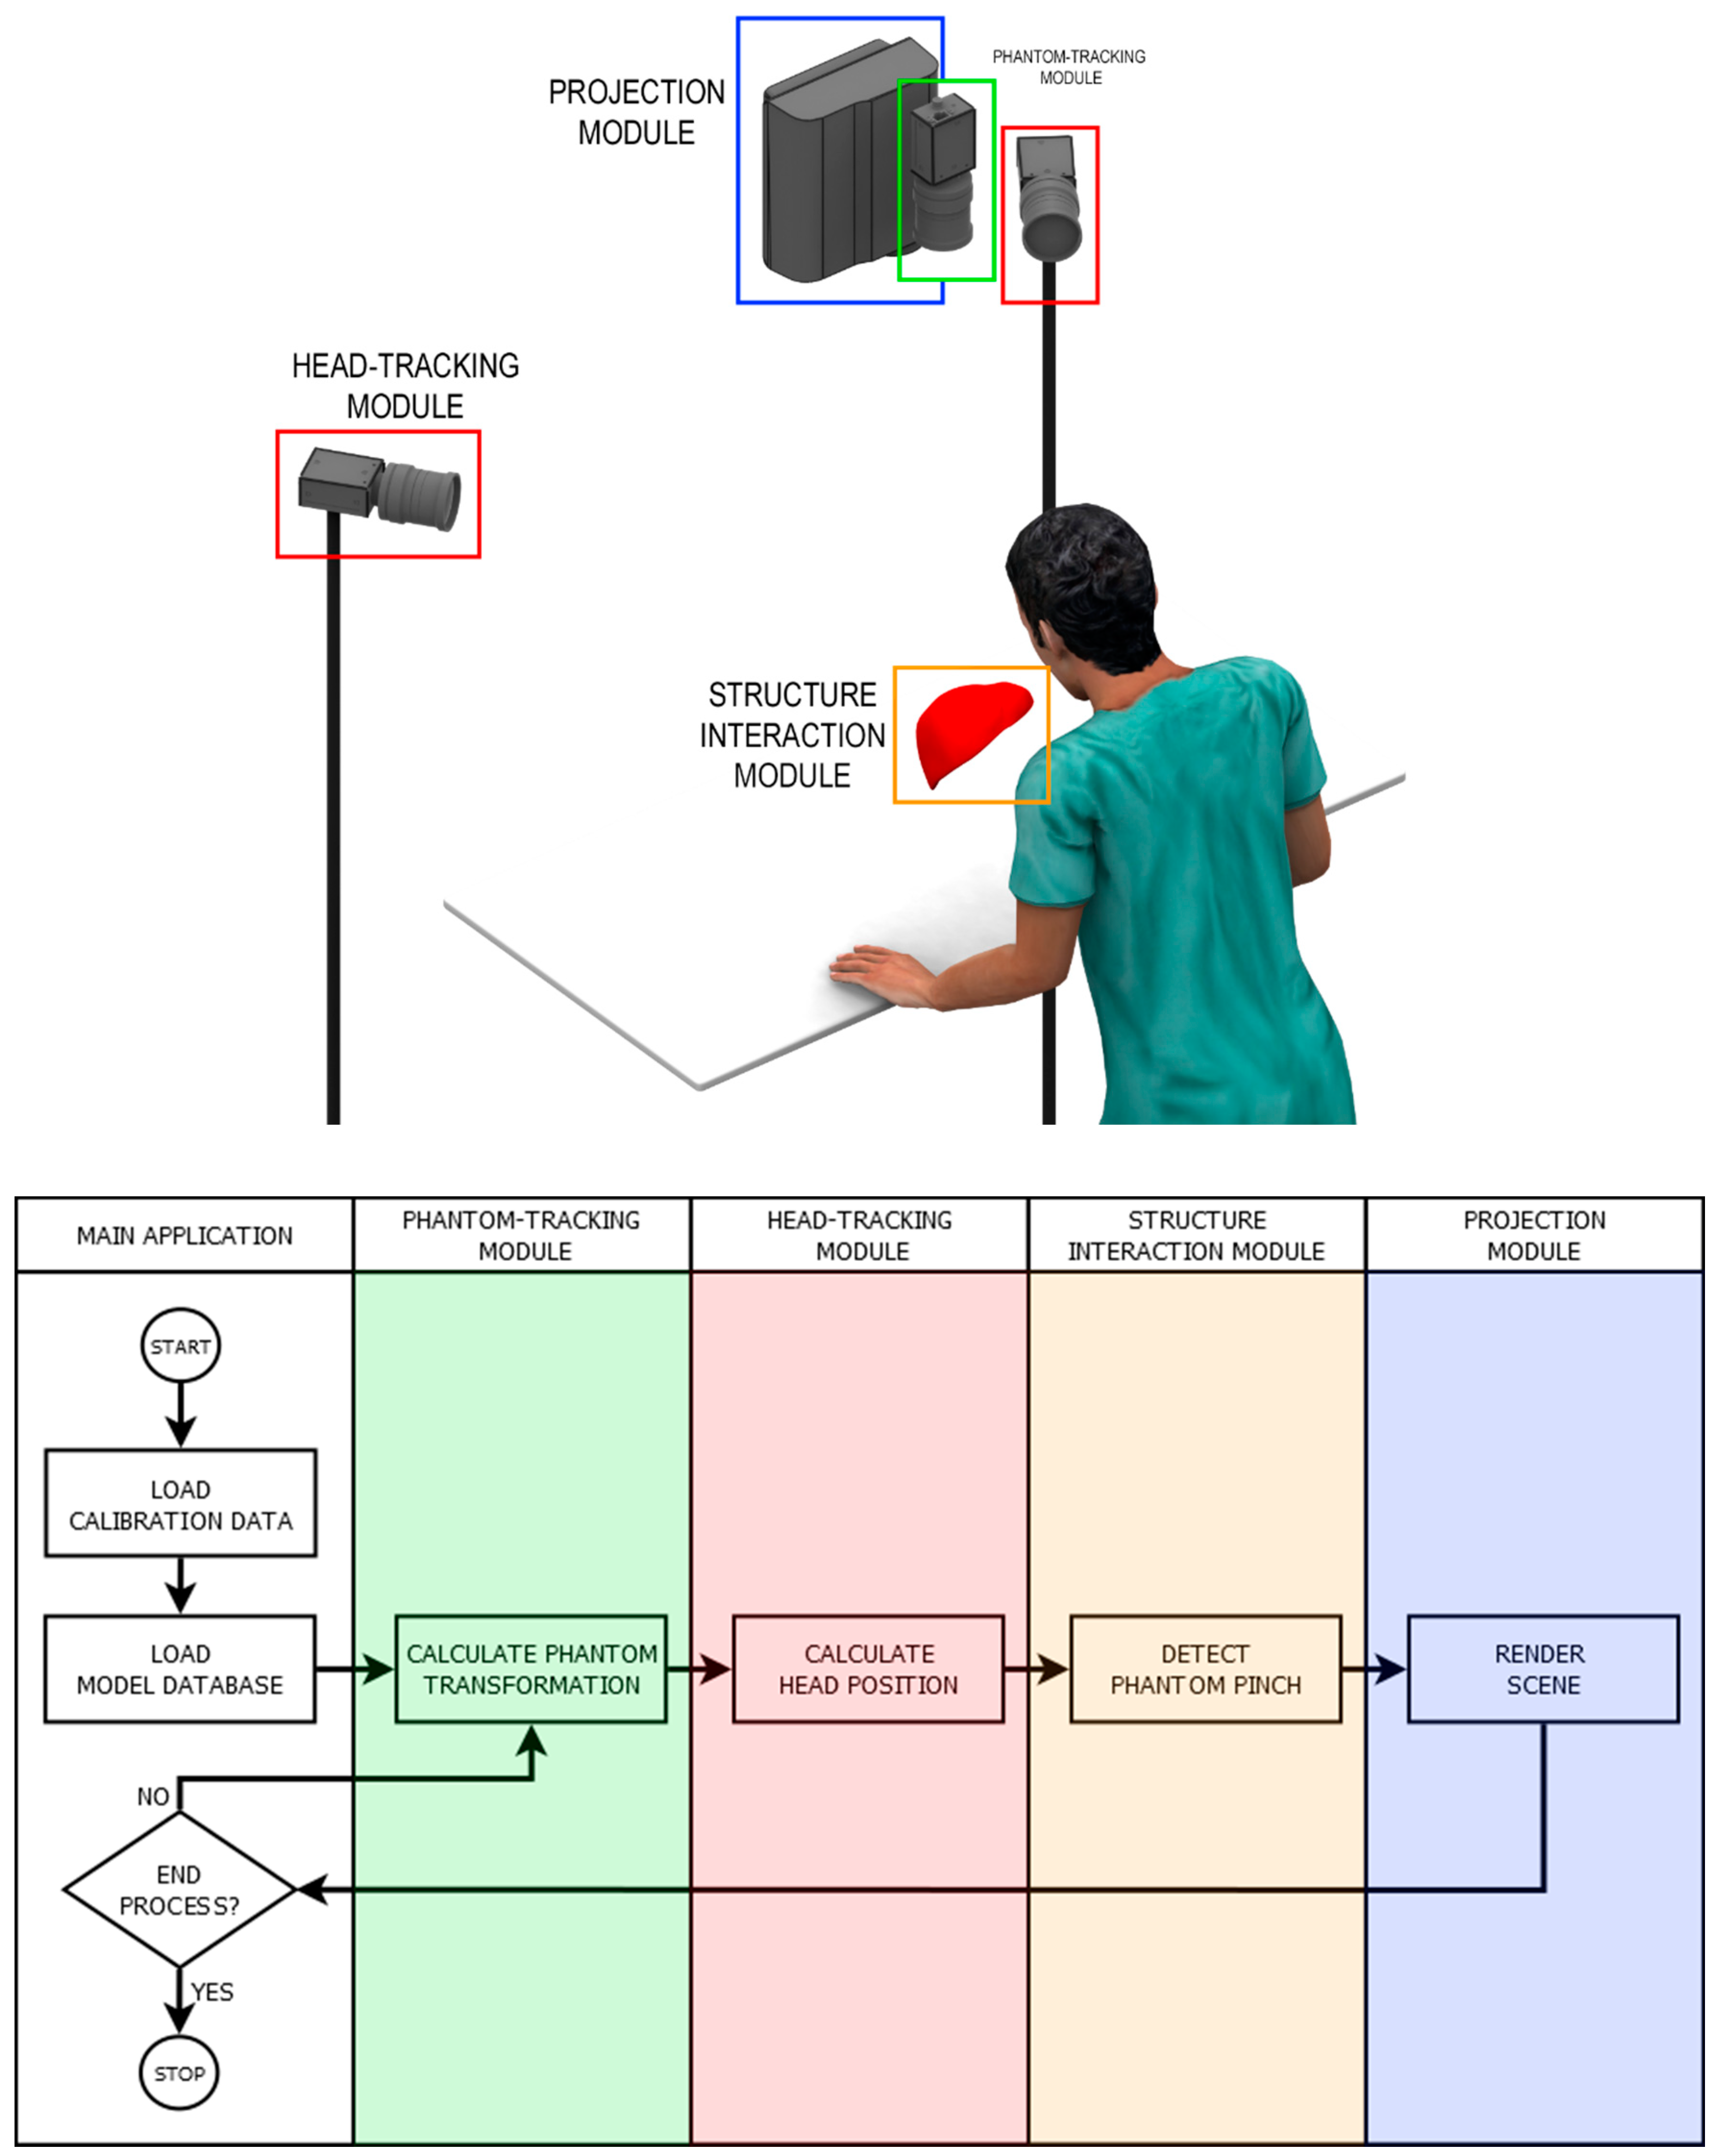
Figure 1. MARVIS system (top) and subsystem flowchart (bottom).
Applsci 09 02732 g001
Figure 2. Examples of contours from the MDB. Left column: prerendered images of model position. Right column: Image descriptor d(α). The plots show the distance from geometric center of mass (Y axis) with respect to the angular position of the point (X axis). Ls is the starting position for descriptor calculations, Lv is the reference line used to determine the angle about the Zw axis, and O is the contour center of mass.
Applsci 09 02732 g002
Figure 3. Analyzed points to determine the starting point for the contour descriptor. PMC is the pole, i.e., geometric center of mass of the contour, LBFL is the best-fitting line of all contour points, and PCP1 and PCP2 are points at the intersection between the contour and line LBFL.
Applsci 09 02732 g003
Figure 4. Rotation angles of liver phantom used in the MARVIS system, where Φ and θ are the rotations about the X and Y axes, respectively.
Applsci 09 02732 g004
Figure 5. MARVIS system setup from a perspective view (A) and from its left side (B). HdTC1 and HdTC2 are the head-tracking cameras, and PhTC is the phantom-tracking camera.
Applsci 09 02732 g005
Figure 6. One iteration of CSD comparison. The algorithm searches for the most similar contour in the MDB (blue line) to the contour from the real scene (red line).
Applsci 09 02732 g006
Figure 7. SIM connections. The module has three channels: for tumors (S1), vessels (S2), and syringe probe (PROBE).
Applsci 09 02732 g007
Figure 8. Local coordinate systems from the MARVIS devices. Red, green, and blue arrows correspond to the X, Y, and Z axes in the coordinate systems, respectively. Xw, Yw, and Zw represent the axes of the global coordinate system.
Applsci 09 02732 g008
Figure 9. Prototype of MARVIS comprising the HdTM cameras (red), PrM projector (cyan), and PhTM camera (green).
Applsci 09 02732 g009
Figure 10. User’s syringe probe used to detect needle pricking into the liver phantom.
Applsci 09 02732 g010
Figure 11. (A)—Liver phantom without projection, (B)—rendered 3D scene for current position, and (C)—liver phantom illuminated by projector.
Applsci 09 02732 g011
Figure 12. User’s viewpoint and projector remapping of internal structures in the liver phantom.
Applsci 09 02732 g012
Figure 13. Liver phantom mold edge accuracy.
Applsci 09 02732 g013
Figure 14. Object tracking accuracy calculated for four calibration markers (1–4) at heights above the working table in the range of 55–112.5 mm imposed by mechanical limits of the lift table.
Applsci 09 02732 g014
Figure 15. Part of test points to calculate the head-tracking accuracy. Presented eight points are near the edges of the calibrated volume.
Applsci 09 02732 g015
Figure 16. Setup and validation of MARVIS system. (A)—Experimental setup showing author R.G. preparing the system for tests with the HdTM marker on his forehead. (B)—Performance of validation tests. (C)—Detailed projection view. The green border indicates that pose detection was paused.
Applsci 09 02732 g016
Figure 17. Median time of a correct prick for each participant (on the left); a box-and-whisker diagram presenting the distribution of the values (on the right). The band in the box presents the median value for all participants. The boxes present the first and third quartiles while the ends of the whiskers show the minimal and maximal values without outliers in the group. Data points for which the distance to the box exceeds 1.5 of the interquartile range are marked as outliers.
Applsci 09 02732 g017
Figure 18. The number of correct attempts for each participant (on the left); a box-and-whisker diagram presenting the distribution of correct attempts (out of ten in total) for each participant (on the right). The boxes present the first and third quartiles while the ends of the whiskers show the minimal and maximal values in the group.
Applsci 09 02732 g018
Table 1. Detection accuracy of phantom rotation angles. (a) Difference ∆|φ| between reference rotation φref and angle φmeas about the X axis detected by the system for the phantom placed on the table (Unit: degrees, °). (b) Difference ∆|θ| between reference rotation θref and angle θmeas about the Y axis detected by the system for the phantom placed on the table (Unit: degrees, °). (c) Difference ∆|ψ| between reference rotation ψref and angle ψmeas about the Z-axis detected by the system for the phantom placed on the table. (Unit: degrees, °).
(a)(b)(c)
φrefφmeas∆|φ|θrefθmeas∆|θ|ψrefψmeas∆|ψ|
30.028.02.030.031.0100.00.010.01
25.024.01.025.023.02.022.522.890.39
20.018.02.020.017.03.045.045.700.70
15.016.01.015.011.04.067.568.601.10
10.010.00.010.09.01.090.089.470.53
5.06.01.05.05.00.0112.5111.350.15
0.00.00.00.0–1.01.0135.0135.420.42
−5.0–4.01.0–5.0–7.02.0157.5156.870.62
–10.0–10.00.0–10.0–13.03.0180.0179.270.73
–15.0–12.03.0–15.0–17.02.0
–20.0–18.02.0–20.0–21.01.0
–25.0–22.03.0–25.0–25.00.0
–30.0–28.02.0–30.0–33.03.0
Table 2. Object-tracking reprojection error at specific height (along Z-axis) above the table.
Marker 1Marker 2Marker 3Marker 4
On CameraOn ProjectorOn CameraOn ProjectorOn CameraOn ProjectorOn CameraOn Projector
ZXYXYXYXYXYXYXYXY
[mm][mm][mm][mm][mm][mm][mm][mm][mm][mm][mm][mm][mm][mm][mm][mm][mm]
55.50.000.000.000.000.000.000.000.000.000.000.000.000.000.000.000.00
65.5−0.020.01−0.040.020.0110.000.030.02−0.020.010.070.000.014−0.000.020.00
75.5−0.010.020.000.03−0.01−0.02−0.020.020.010.020.170.000.00−0.010.000.00
85.5−0.010.040.00−0.080.010.010.110.03−0.01−0.010.05−0.03−0.02−0.02−0.020.00
95.5−0.020.05−0.010.03−0.020.010.030.040.010.010.12−0.01−0.01−0.02−0.01−0.05
105.5−0.020.06−0.01−0.01−0.040.01−0.040.050.02−0.000.17−0.020.02−0.040.02−0.18
112.80.010.050.00−0.05−0.010.00−0.020.030.000.000.11−0.010.00−0.02−0.02−0.16
Table 3. Head-tracking reprojection error in calibration volume.
X0Y0Z0X1Y1Z1XYZ
[mm][mm][mm][mm][mm][mm][mm][mm][mm]
−504.35338.531367.02−505.87338.901370.981.520.373.96
−517.29−348.871350.01−517.96−348.571351.600.670.311.59
329.76112.35964.45330.37111.57966.910.610.782.46
339.01−135.37968.48339.60−135.44970.280.590.081.80
46.13174.12588.1046.24174.62592.710.110.504.61
28.39−128.10578.1128.41−128.06582.330.010.044.22
204.44137.02632.78205.57137.01637.431.140.014.65
206.63−148.44629.07207.64−148.42633.281.010.024.21
236.3719.10682.92237.9218.94687.451.550.154.53
45.7421.10877.7045.9120.99881.100.170.113.39
−118.2763.501069.90−118.6363.381072.950.350.123.05
−270.3269.221234.31−270.9669.111237.190.640.102.88
−186.02−257.161080.75−186.49−257.021082.930.460.142.18
−195.27228.511040.83−196.05228.671044.490.780.173.66
Average error0.690.213.37
Median error0.630.133.53
Each row corresponds to a 3D point in the global coordinate system. (X0,Y0,Z0) describes the position of the first calculation of the 3D reprojection of 2D pixels onto the global coordinate system. (X1,Y1,Z1) describes the result of projecting (X0,Y0,Z0) onto the camera pixels and their reprojection to the 3D coordinate system.
Table 4. MARVIS validation results.
Without ProjectionWith ProjectionComparison
Participant Number of Correct AttemptsNumber of Incorrect AttemptsAverage Time to Correctly Prick NeedleSDMedian Time to Correctly Prick NeedleFailure RateNumber of Correct AttemptsNumber of Incorrect AttemptsAverage Time to Correctly Prick Needle SDMedian time to Correctly Prick NeedleFailure RateMedian Time DifferenceFailure Rate Difference
---[s][s][s][%]--[s][s][s][%][s][%]
19126.2549.054.2610.06411.971.5911.9740.07.730.0
28214.198.1514.4720.08216.5813.3810.8820.0−3.60.0
39114.049.1815.4210.08211.2910.9910.3520.0−5.110.0
4828.112.638.6720.07310.423.7111.6730.03.010.0
58227.7516.2423.5120.0554.051.993.7450.0−19.830.0
65518.2111.7112.2650.07315.9713.810.7330.0−1.5−20.0
74626.9510.9233.2160.07310.8910.46.5530.0−26.7−30.0
85512.483.111.4550.08212.042.6112.5520.01.1−30.0
93718.773.3920.8470.02813.162.6711.9880.0−8.910.0
105519.6716.5613.8950.0469.393.9710.4460.0−3.510.0
116417.566.3717.7540.07331.8815.8531.630.013.9−10.0
124622.149.4121.860.05511.5810.336.2750.0−15.5−10.0
134620.6614.7111.4660.06412.925.3710.8340.0−0.6−20.0
142821.745.3221.7480.07311.174.199.7530.0−12.0−50.0
156435.1924.9328.3440.06414.99.2613.9140.0−14.40.0
163738.2241.9518.8570.05511.018.3811.9550.0−6.9−20.0
175528.2216.5923.0250.06421.338.1719.3240.0−3.7−10.0
184616.318.7517.4560.02821.611.4518.3580.00.920.0
194628.18.0227.1260.0738.596.727.1230.0−20.0−30.0
205527.4210.1225.850.07312.78.5812.6830.0−13.1−20.0
213715.068.9910.9670.06414.374.0113.9340.03.0−30.0
22195.270.05.4390.0826.215.33.0420.0−2.4−70.0
233723.729.6616.9670.07313.6213.3411.2430.0−5.7−40.0
246421.257.9420.2740.0558.326.577.0150.0−13.310.0
258225.9225.7714.6120.010015.186.21150.00.4−20.0
265562.3535.9641.2850.07321.913.514.1630.0−27.1−20.0
276424.137.1423.140.08212.466.2613.4920.0−9.6−20.0
288211.938.058.2620.010024.7734.4511.320.03.1−20.0
Avarage22.5613.5918.2947.50 13.948.6811.3235.36
Median21.509.3017.6050.0 12.587.4511.3230.0