Article

Determination and Implementation of Reasonable Completion State for the Self-Anchored Suspension Bridge with Extra-Wide Concrete Girder

1
School of Science, Nanjing University of Science and Technology, Nanjing 210094, China
2
School of Civil Engineering, Southeast University, Nanjing 210096, China
3
Beijing Advanced Innovation Center for Future Urban Design, Beijing University of Civil Engineering and Architecture, Beijing 100044, China
4
School of Civil Engineering, Nanjing Forestry University, Nanjing 210037, China
5
School of Civil Engineering, Suzhou University of Science and Technology, Suzhou 215009, China
6
School of Civil Engineering, Beijing Jiaotong University, Beijing 100044, China
*
Author to whom correspondence should be addressed.
Appl. Sci. 2019, 9(12), 2576; https://doi.org/10.3390/app9122576
Submission received: 9 May 2019 / Revised: 18 June 2019 / Accepted: 21 June 2019 / Published: 25 June 2019

Abstract

:
The present work is aimed at studying the determination method and implementation process of reasonable completion state for the Hunan Road Bridge, which is currently the widest concrete self-anchored suspension bridge in China. The global finite element model and the cable analytic program BNLAS were integrated. The synthesis algorithm of completion state determination was proposed. The contact relationships between the cable and saddles were captured using the refined FE discretization method. The concrete shrinkage and creep effects during the construction and operation periods were predicted using the CEB-FIP 90 model and the age-adjusted effective modulus method. The cable alignments under the free cable state, system transformation condition, and completion state were obtained. Moreover, the multiple-control method for the whole process of system transformation was proposed. The multiple parameters included the hanger tensioning force, exposed amount of hanger anchor cup, and tag line position. A detailed system transformation procedure was formulated and well preformed in the construction site. In addition, the further optimization analysis of final hanger force was conducted based on the actual completion state. The influence on the stress and geometry evolution of girder brought by the final girder alignment was investigated. The measured results of structural alignment and stress show that the target completion state was well implemented. The accuracy and efficiency of the proposed multiple-control method were verified by checking the tag line position of each step. In addition, the optimized final hanger force and girder lifting amount were obtained, which can provide feedback and reference for the construction control and service safety of the similar concrete self-anchored suspension bridges.

1. Introduction

Currently, the girder material forms of self-anchored suspension bridges in China are diverse, including the concrete girder, steel girder, and steel-concrete composite girder. The concrete self-anchored suspension bridge is becoming more competitive among the city bridges of medium-span because of the economics of concrete and elegance appearance [1,2]. More than 30 concrete self-anchored suspension bridges have been built in China. In addition, the girder width usually increases to 50 m or more to meet the increasing lane requirements. The concrete shrinkage and creep effects in the extra-wide girder and towers should be fully considered. Moreover, the reliability of the bridge is related to important social impacts [3,4,5]. The determination of a reasonable completion state and the corresponding control of implementation process are necessary for the structural safety and service durability.
The accurate cable system analysis is the premise of completion state determination for the self-anchored suspension bridge. Some analytic programs of cable system have been proposed, including the BNLAS (SGKZ2000) program developed by Tang [6] and the SSBAP2009 proposed by Li [7], which are characterized by small computing cost compared with the general finite element (FE) software [6,7,8,9,10,11,12,13,14,15,16]. However, the influences brought by the concrete shrinkage and creep during construction and operation periods should be precisely considered by determining the appropriate pre-displacements of components. Moreover, the convenient and refined method is required to simulate the changes in the contact relationships between cable and saddles during system transformation. As for the construction of self-anchored suspension bridge, the tower and girder are first erected. The cables are anchored on the girder ends. Then, the completion state is achieved by conducting the system transformation. The schemes of system transformation have been widely investigated by relying on actual bridge structures [17,18,19,20,21]. Kim [2] proposed the system transformation scheme of Yong Jong Bridge in Korea based on the reverse nonlinear FE analysis. However, there are few studies on the refined control methods of hanger tensioning, including the tensioning state control and judgment criteria, which are also the main factors affecting the accuracy and efficiency of system transformation. In short, the refined control of system transformation has become a serious issue to be solved along with the growing construction number of a self-anchored suspension bridge.
In this paper, the ANSYS beam-type FE simulation, cable analytic program BNLAS (SGKZ2000), and filed monitoring data were integrated. The determination and implementation methods of a reasonable completion state for the Hunan Road Bridge were studied, which is currently the widest concrete self-anchored suspension bridge in China. The synthesis algorithm of reasonable completion state determination was proposed based on the prediction of concrete shrinkage and creep. The calculation principles of the CEB-FIP 90 model and age-adjusted effective modulus method were compiled into the FE simulations. Moreover, the multiple-control method for the whole process of system transformation was proposed. A detailed system transformation procedure was formulated and performed well in the construction site. In addition, the further optimization analysis of the completion state was conducted. The optimized target values of hanger forces and girder-lifting amount were obtained.

2. Hunan Road Bridge

The Hunan Road Bridge [22,23,24,25] is located in Liaocheng City, Shandong Province in China, which was opened to traffic on May 1, 2015. The layouts of the bridge are shown in Figure 1 and Figure 2. The span arrangement is 53 m + 112 m + 53 m = 218 m. The 37 pairs of hangers are numbered as DS1-N~DS37-N and DS1-S~DS37-S on the north and south sides, respectively. In addition, the hangers DS1 and DS37 are rigid. The hangers DS8, DS9, DS29, and DS30 belong to the flexible hangers of type B. The remaining hangers belong to the flexible hangers of type A. The longitudinal and transvers distances between hangers are 5 m and 31.7 m, respectively. The numbers beginning with CS in Figure 1 represent the girder cross section located at the towers, girder endpoints, sidespan midpoints, and the quarter points of mid-span, respectively. The main girder with a width of 52 m is currently the widest among the concrete self-anchored suspension bridges in China. The longitudinal and transverse slopes of girder are 2.5% and 1.5%, respectively. The rise-span ratios of mid-span and side-span are 1/5.276 and 1/12.965, respectively. The towers are transversely connected by the crossbeams. The girder bearings on the crossbeams at the west and east towers are transverse unidirectional sliding bearing and bi-directional sliding bearing, respectively.
The detailed cross sections of key components are shown in Figure 3, including the girder, tower, hanger, and cable. The cast-in-place prestressed concrete girder is composed of two box beams with three cells. The girder height at the road centerline is 2.8 m. The crossbeams are densely arranged in a girder with an interval of 5 m corresponding to hangers. The standard cube compressive strengths of the concrete materials used in girder and tower are 50 MPa and 40 MPa, respectively. The tensile strengths of the steel wires used in prestressed tendon and cable are 1860 MPa and 1670 MPa, respectively.

3. Determination Method of a Reasonable Completion State

3.1. Calculation Method of Cable Alignment

The segmented catenary theory of cable is shown in Figure 4. The loads include the concentrated load Fi transmitted by hanger and the distributed load q. The basic assumptions include that the main cable is an ideal flexible cable. The local bending at turning points and the sectional bending stiffness are ignored. The changes in cable cross-sectional area and self-weight are ignored. Hooke’s law is suitable for the cable stress-strain relationship [26]. The variation relationship between the cable alignment and internal force is approximately considered as geometric nonlinear, which meet the force balance condition and deformation compatibility condition [16,27].
The calculation method of cable alignment is shown in Figure 5. The deformations of tower and girder caused by the cable force and the concreter shrinkage and creep during construction and operation periods were considered. In addition, the BNLAS program (SGKZ2000) developed by Southwest Jiaotong University in China [6] was adopted to assist the calculation of cable alignment. The BNLAS program is developed based on the analytical expressions and numerical iterations. The calculation functions include the theoretical cable alignment, vertical and horizontal components of cable force, reaction force of the tower, and cable erection alignment.

3.2. Prediction Method of Concrete Shrinkage and Creep

The concrete shrinkage and creep effects during construction and operation periods were predicted using the CEB-FIP 90 model [28] and age-adjusted effective modulus method [29]. The relationship between the initial instantaneous elastic deformation and final concrete creep deformation is approximately linear when the stress of concrete does not exceed 40% of the ultimate strength. The superposition principle can be used to calculate the strain caused by the stress applied step-by-step [30]. The relationship between the strain increment and stress increment during the time interval of (ti, ti−1) caused by concrete shrinkage and creep is shown in Equation (1).
Δ ε C S ( t i , t i 1 ) = Δ σ C ( t i , t i 1 ) E ( t i 1 ) [ ( 1 + χ ( t i , t i 1 ) ϕ ( t i , t i 1 ) ] + j = 1 i 1 Δ σ ( t j ) E ( t j ) [ ϕ ( t i , t j ) ϕ ( t i 1 , t j ) ] + Δ ε S ( t i , t i 1 )
where C and S represent the creep and shrinkage effects, respectively. ΔσC(ti, ti−1) is the stress increment caused by creep. ΔεS(ti, ti−1) is the strain increment caused by shrinkage. E is the elastic modulus of concrete. χ(ti, ti−1), ϕ(ti, ti−1), and R(ti, ti−1) are the aging coefficient, the creep coefficient, and the relaxation coefficient, respectively, which are detailed as follows.
χ ( t i , t i 1 ) = E ( t i 1 ) E ( t i 1 ) R ( t i , t i 1 ) 1 ϕ ( t i , t i 1 )
R ( t i , t i 1 ) = 1 J ( t i , t i 1 ) [ 1 + c 1 α ( t i , t i 1 ) J ( t i , t i 1 ) 10 J ( t i , t i 1 ) ] 10
c 1 = 0.0119 ln t i 1 + 0.08 ,   α ( t i , t i 1 ) = J ( t i 1 + ζ , t i 1 ) J ( t i , t i ζ ) 1 ,   ζ = t i t i 1 2
The age-adjusted effective modulus EC(ti, ti−1) can be defined as Equation (5).
E C ( t i , t i 1 ) = E ( t i 1 ) 1 + χ ( t i , t i 1 ) ϕ ( t i , t i 1 )
The step-wise analysis method of concrete shrinkage and creep effect is shown in Figure 6. First, the elastic modulus of concrete during each time interval of (ti, ti−1) was replaced by the age-adjusted effective modulus EC(ti, ti−1). The structural responses caused by concrete creep were obtained by the sequential calculation and gradual accumulation. Moreover, the initial strains applied on the prestressed tendons during each time interval (ti+1, ti) were updated to consider the pre-stress relaxation, which was based on the pre-stresses calculation results of the former time interval (ti, ti−1). The changes in structural stress and geometry during the construction period caused by concrete shrinkage and creep were considered in the bridge completion state, which was based on the drafted construction time from the cast of concrete to the completion state for each girder segment. In addition, the concrete shrinkage effects were calculated using the analogous means adopted in the temperature effect calculation based on the shrinkage strain of each step.

3.3. Finite Element Model

The spatial FE mode of Hunan Road Bridge established using ANSYS software is shown in Figure 7. The Timoshenko beam element (BEAM188) in ANSYS was adopted to simulate the tower, crossbeam, and girder. The tension-only link element (LINK10) was used to simulate the cable, hanger, and prestressed tendons. The internal forces of the cable, hanger, and prestressed tendons were applied by defining the initial strains. The additional quality element (MASS21) was adopted to simulate the weights of deck pavement, saddle, clip, and approach bridge. The nodes of tower bottoms were consolidated completely. The DOFs between the girder, tower, and approach bridge were constrained, according to the actual bearing types [31]. As shown in Figure 8, the arrows represent the sliding directions of bearing. The bearings between the girder and the crossbeams at west and east towers are transverse unidirectional sliding bearing and bi-directional sliding bearing, respectively. The static equilibrium analyses under self-weight were conducted in the follow sections. Moreover, the massless rigid arms (BEAM188) were introduced to connect the cables with the girder ends and tower tops. The compressions of girder and towers caused by cable force and the concrete shrinkage and creep during the construction period were simulated by changing the temperatures of rigid arms. The structural sectional properties and material parameters are shown in Table 1.
In addition, the refined simulation method of cable saddles was proposed as shown in Figure 9. The deformation of the saddle was ignored. The middle part of the saddle top was assumed to be in constant contact with cable, and there was no relative displacement between the splay saddle base and girder [32]. The changes in contact relationships between cable and saddles during system transformation were simulated precisely and conveniently.
As can be seen in Figure 9a, the main saddle body was simulated by the rigid beam elements distributed radially along the top surface of the saddle. The main saddle base was simulated by the rigid beam element co-locating with the tower. The rigid connections relaxing the longitudinal constraints were used to connect the saddle base and the bottom surface of the main saddle. Thus, the displacement of the main saddle during system transformation can be simulated. Moreover, the rigid connections were used to simulate the contact between the cable and the middle part of the saddle top. The encryption areas of compression-only connections were set in both sides of the saddle. Thus, the separation of cable from the main saddle and the changes in cutting point positions can be simulated. In addition, the splay saddle is also an important steering member for the cable. As can be seen in Figure 9b, the rigid connections were used to simulate the connections between the splay saddle base and the main girder.

3.4. Synthesis Algorithm for Determining a Reasonable Completion State

The synthesis algorithm for the reasonable completion state determination of a concrete self-anchored suspension bridge was proposed, as shown in Figure 10. The compressions of tower and girder caused by the cable force and the concrete shrinkage and creep effects during the drafted construction period were offset by introducing the rigid arms. The structural deformations caused by the concrete shrinkage and creep effects during the long-term operation period were considered by optimizing the hanger force and girder alignment at the completion state based on the prediction results.

3.5. Reasonable Completion State of the Hunan Road Bridge

The proposed algorithm was used to determine the reasonable completion state of the Hunan Road Bridge. The results of cable alignments at the erection and completion states are shown in Figure 11. The boundary conditions of the global FE model were consistent with the analytic analysis after introducing the rigid arms. The FE analysis results of cable alignment and internal force were in good agreement with the BNLAS analysis results after a comparison. The unstressed lengths of cable segments at side span and middle span are 55.322 m and 120.881 m, respectively. The pre-displacements of the cable anchoring points at girder ends are 0.021 m. The pre-displacements of main saddles on the west and east towers are -0.0271 m and 0.286 m, respectively. The positive displacement values in this paper are eastward.
The target hanger forces at the completion state are shown in Figure 12. Then, the completion state was verified by checking the forced state under the combined condition of dead and live loads of the whole bridge. The envelope diagram of the girder bending moment is shown in Figure 13. For the sake of brevity, the bending moment of half structure was plotted considering the symmetry of the Hunan Road Bridge.

4. Implementation Analysis of a Reasonable Completion State

4.1. Cable Erection

The cable erection control is the foundation for the realization of a reasonable completion state [33]. The pre-displacements of components were calculated using the method described in Figure 5 and Figure 10, considering the deformations of tower and girder caused by the cable force and concrete shrinkage and creep effects [34,35]. The pre-displacements of cable anchoring points at the west and east girder ends were −1.5 cm and 3 cm, respectively. The same pre-displacements were adopted for the splay saddle bases and bearings at girder ends. The corresponding pre-displacements of hanger anchoring points were calculated. The pre-displacements of the main saddle and the splay saddle were 25.6 cm and 2 cm, respectively, which were pre-biased toward the girder ends along the support planes. The bearings on the crossbeam of east tower were pre-biased toward the east side-span with the value of 2.5 cm. The pre-lifting amounts of main saddles were 1.5 cm. The pre-camber of girder at the middle mid-span was 0.18 m.
The unstressed lengths of cables were calculated based on the cable cross-section type shown in Figure 14 and the results of cable alignments are shown in Figure 11. The calculation method of the unstressed hanger length was proposed as shown in Figure 15, which was based on the measured geometry of the hanger tube and cable erection alignment.
The comparison between the measured free cable alignment and target alignment is shown in Figure 16, which takes the north cable as an example. The error percentage of cable alignment at each hanger was compared. For the sake of brevity, only part of the hanger serial number was plotted along the horizontal coordinate axis. In addition, the discrete statistics results of error percentage were described. The results show that the error percentages of cable alignment at girder ends and middle mid-span are relatively higher, because of the catenary characteristics of the cable. Moreover, the errors of cable alignment are smaller than the allowable value of ± 2 cm in China specification.

4.2. Multiple-Control Method for the Whole Process of System Transformation

The girder jacking-up method [36] and hanger tensioning method [1,2] are usually adopted for the system transformation of a self-anchored suspension bridge. The application of the later method is wider [21,37]. The hangers are tensioned in several stages and the girder is transformed from the bracket support state to the cable suspension state [38,39]. In addition, the hanger force, hanger elastic elongation, and the vertical displacements of girder and cable can be chosen as the control parameters of the system transformation process [40]. However, only one of them is usually chosen as the single control parameter currently, or the target hanger force and tag line position were chosen as the dual control parameters for part of the hanger tensioning process [41]. Moreover, the control accuracy of the hanger tensioning process is affected by the ambient temperature changes, operation errors, and measuring errors [42]. Especially for the later tensioning stages, the influences on hanger force brought by the measuring error of cable displacement are more significant because of the large cable stiffness. The final adjustment of hanger force might be more complex.
In this paper, the multiple-control method for the whole process of the system transformation was proposed. The hanger tensioning force, exposed the amount of hanger anchor cup, and the tag line position were chosen as the multi-control parameters. The hanger tensioning and the mutual check between the multiple parameters were synchronized. The tensioning error accumulations were basically avoided. The calculation schematic is shown in Figure 17. The tag line was prefabricated on the surface of hanger, and Lta was the initial distance between the tag line and the bottom surface of the hanger anchor cup. The hanger tensioning force Pij of tensioning step i for hanger j was used to calculate the elevation value Haij at the bottom surface of the hanger anchor cup.
H a i j = H c i j Δ H c i j L c L s j P i j L s j E j A j
where Hcij is the measured cable alignment at hanger j and ΔHcij is the vertical displacement of the cable caused by hanger tensioning. Lc is the distance from the cable center to the hanger fork ear center and Lsj is the unstressed hanger length. Ej and Aj are the elastic modulus and cross-sectional areas of the hanger, respectively.
The target distance Ltdij from the tag line to the top of the hanger tube was calculated based on the vertical displacement ΔHgij of the girder caused by hanger tensioning, as well as the target value of the exposed amount Lsaij of the hanger anchor cup.
{ L t d i j = H a i j + L t a ( 1 + P i j E i A j ) H d i j Δ H g i j L s a i j = H d i j L d j T p T s + Δ H g i j H a i j
where Hdij is the measured elevation of the hanger tube top, Ldj is the measured length of the hanger tube, and Tp and Ts are the thicknesses of the anchor plate and nut, respectively. The principles of the multiple-control method are detailed as follows.
(1)
The prefabricated tag line should be convenient for observation. The value of Lta for the Hunan Road Bridge was 3.5 m. The elastic elongation of the hanger segment from the tag line to the bottom surface of the hanger anchor cup cannot be ignored.
(2)
The target position of the tag line in each tensioning step should be calculated based on the hanger tensioning force, instead of the target hanger force. Thus, the synchronization of hanger tensioning and multiple-check can be realized. The tensioning errors can then be eliminated basically before dismantling the tensioning equipment. The phenomenon of repeated installation of tensioning equipment, if checking the tag line positons after the whole hanger tensioning round according to the traditional control method [41], can be avoided.
(3)
The observation line was prefabricated before hanger tensioning, according to the target distance from the tag line to the hanger tube top in each tensioning step. The sign of the completion of the tensioning step is that the observation line goes down to be parallel with the top surface of the hanger tube. In addition, the hanger tensioning can be continued only if the error ratio between the measured tensioning force and target value is within ±3%. Otherwise, correct the hanger tensioning force until the error ratio is within ±3%, under the premise of ensuring the tag line position error is within ±2 cm in China specification.

4.3. Hanger Tensioning Procedure

The system transformation method based on the passive tensioning of the side span was adopted. The active tensioning process was divided into four stages, including five tensioning rounds. The four stages were the initial tensioning stage (tensioning round 1), side-span passive tensioning stage I and II (tensioning round 2, 3, and 4), and partial adjustment stage (tensioning round 5). The target hanger forces at the end of the first three stages were 0.35F, 0.72F, and 0.96F, respectively, and F is the hanger force at the completion state, as shown in Figure 12. In addition, all of the hangers were tensioned in the initial tensioning stage. The hangers of side span were tensioned so that the target exposed amounts of hanger anchor cups at a completion state were achieved. The control parameters included the tag line position Ltd and exposed amount Lsa of the hanger anchor cup. Then, only the hangers of mid-span were tensioned in place progressively during the subsequent stages, which adopted the hanger tensioning force Pij, the tag line position Ltd, and the anchor cup exposed amount Lsa as the multiple control parameters. At the same time, the main saddles were pushed toward the mid-span. Thus, the side-span passive tensioning was realized through the passive loading of side-span hangers. Lastly, the target completion state was realized through the global passive tensioning by applying the secondary dead loads. Thereby, the system transformation process was significantly simplified with good economic rationality.
The implementation plan and the target values of control parameters in each hanger tensioning stage were formulated based on the proposed control method. In addition, the deformations of cable and girder during system transformation were measured using the total station instrument. The hanger forces were measured using the hanger tensioning equipment based on the meter reading when the hangers were pulled up.

4.3.1. Initial Tensioning Stage

The self-anchored suspension bridge was transformed from the free cable state to the hanger anchoring state by conducting the initial tensioning for all hangers. A total of 8 sets of tensioning equipment were adopted considering the structural symmetry of the Hunan Road Bridge. The specific steps are shown in Table 2. The pushing amounts of main saddles and the serial numbers of tensioned hangers are described. The hangers were tensioned beginning from the towers toward both sides symmetrically. The south and north hangers were tensioned synchronously. The target values of control parameters are shown in Table 3, including the tag line position Ltd and the exposed amount Lsa of the hanger anchor cup.

4.3.2. Side-Span Passive Tensioning Stage I

The side-span passive tensioning process was divided into two stages to avoid the excessive hanger tensioning force Pij. The control parameters included the hanger tensioning force Pij, the tag line position Ltd, and the exposed amount Lsa of hanger anchor cup. The specific steps of side-span passive tensioning stage I are shown in Table 4. The hangers were tensioned beginning from the towers toward mid-span symmetrically. At the same time, the main saddles were pushed toward mid-span using the principle of “small step and fast running.” For the sake of brevity, only the target values of the tensioning force Pij and tag line position Ltd are shown in Table 5. The corresponding exposed amounts Lsa of the hanger anchor cup can be easily calculated, according to Equation (7).

4.3.3. Side-Span Passive Tensioning Stage II

The target hanger force at the end of the side-span passive tensioning stage II was 0.96F, which is relatively big with respect to the bearing capacity and anti-sliding ability of the cable clamp. As the cable displacement during the hanger tensioning process is characterized by the weak coherence when the bridge has been provided with certain stiffness. The hangers closest to the tensioned hanger will be unloaded during hanger tensioning, while the internal forces of the farther hangers will increase. The peaks of the hanger tensioning force and the internal forces of the farther hangers need to be decreased. Thereby, the side-span passive tensioning stage II was divided into two rounds, including round 3 and round 4. The specific steps are shown in Table 6. The target values of control parameters are shown in Table 7 and Table 8, respectively.

4.3.4. Partial Adjustment Stage

The internal forces of partial hangers were adjusted based on the measured hanger forces and the actual remaining secondary dead loads. The specific step and hanger tensioning force Pij are shown in Table 9. Then, the west and east main saddles were pushed toward the mid-span with the distances of 0.7 cm and 1.7 cm, respectively. The remaining secondary dead loads were applied.

4.4. Verification of the Proposed Multiple-Control Method

When the errors of Ltd, Lsa, and P in each tensioning step were within their respective allowable ranges. The measured tag line positons Ltd were compared with the target values. As shown in Figure 18, taking the north hangers as examples. The errors of Ltd are within ±1.5 cm, which reflects the accuracy of the proposed multiple-control method. In addition, the mutual check between the multiple control parameters was realized during each tensioning step. The phenomenon of repeated installation of tensioning equipment, if checking the tag line positons at the end of a hanger tensioning round according to the traditional control method, was avoided.

5. Discussions on the Completion State

5.1. Measured Results of the Completion State

The measured errors of final hanger forces of the Hunan Road Bridge are shown in Figure 19. Taking the north hangers as examples, the error ratios are within ±4%. The alignment comparisons of north cable and main girder are shown in Figure 20 and Figure 21, and the errors are within ±2 cm and ±1 cm, respectively. The measured cable forces at anchor ends are shown in Table 10. The error ratios are within ±3%. The measured data reflect that the actual completion state of the Hunan Road Bridge is in good agreement with the target state by adopting the proposed multiple-control method.

5.2. Further Optimization Analysis of the Completion State

The targets of completion state control for concrete self-anchored suspension bridge include the uniform cable force, smooth girder alignment, suitable pre-lifting amount of the girder, and pre-biased amount of tower toward the side span, which considers the long-term concrete shrinkage and creep effects. The maximum measured girder lifting amount of the Hunan Road Bridge at the completion state was located in the middle of mid-span with the value of 0.013 m, with respect to the initial installation state. The measured biased amount of towers toward the side span were 0.4 cm. For the purpose of offsetting the adverse influences brought by the concrete shrinkage and creep effects during long-term service life, the further optimization analysis of the completion state was conducted based on the actual completion state. The optimized values of hanger force and girder lifting amount were determined to provide appropriate feedback to the construction control process.
First, the predicted results of cable and girder displacements affected by long-term concrete shrinkage and creep are investigated, as shown in Figure 22 and Figure 23, respectively. The prediction reliability was verified by comparing the predicted cable displacement of −0.020 m at DS19 after the first operation year with the measured data of −0.018 m. The significant downward deformation of cables at the middle mid-span will be caused by the movements of cable anchoring points at tower tops toward the mid-span. The girder deflection at the mid-span will increase continually, and the maximum is located in section CS5. The side-span girder will rise slightly. The structural alignment evolutions present a change trend of increasing quickly first and then slowing down.
Then, the parametric analysis about the influence on the stress and geometry evolution of girder brought by the final girder alignment was conducted. The global hanger forces were changed by 1% to 5% to provide different final girder geometries. The bridge completion state after equilibrium analysis and the state evolution at mid-span girder section CS5 after 50 years are shown in Table 11. The longitudinal stresses of the plate close to the first outer web were compared. The results show that the compressive stresses of the top plate after 50 years will decrease in a safe range, and the ones of the bottom plate will increase. The girder compressive stress can be effectively allocated by increasing the pre-lifting amount of the girder at the mid-span. The adverse influences on the structural safety brought by concrete shrinkage and creep can then be reduced. In addition, the adjustment of girder curvature should be conducted in a reasonable range to avoid the excessive bending moment in the girder.

6. Conclusions

In this study, we focused on the determination and implementation methods of reasonable completion state for the concrete self-anchored suspension bridge. The construction-control process of the Hunan Road Bridge, which is the widest one among the similar bridges in China currently, was analyzed by integrating the numerical simulation and field monitoring. Moreover, the long-term structural changes affected by concrete shrinkage and creep were investigated. The further optimization analyses of hanger forces were conducted based on the actual completion state. The significant contributions of this study are summarized as follows.
The calculation principles of the cable system was proposed based on the segmented catenary theory, invariance principle of unstressed length, and prediction of concrete shrinkage and creep. The cable analytic program (BNLAS SGKZ2000) and ANSYS spatial beam-type FE model were integrated. The synthesis algorithm for determining a reasonable completion state was proposed. The contact relationships between the cable and saddles during system transformation were well simulated using the refined FE meshing method. The rigid arms were introduced to consider the compressions of tower and girder caused by the cable force and concrete shrinkage and creep during construction. Thus, the calculation accuracy of the FE model was in good agreement with the BNLAS program. The cable alignments at a free cable state, system transformation condition, and completion state were determined. In addition, the control parameters of cable erection were obtained, including the pre-displacements of anchoring points and pre-lifting amounts of the main saddles. The whole-process control of the cable system from the construction to the completion state was realized using the proposed algorithm.
The multiple-control method for the whole process of system transformation and corresponding control principles were proposed. The hanger tensioning force, exposed amount of hanger anchor cup, and tag line position were chosen as the multi-control parameters, which were mutually checked during each hanger tensioning step. The tag line position was calculated based on the hanger tensioning forces of each step considering the elastic elongation of hanger. In addition, the system transformation method based on the passive tensioning of the side span was adopted. The active tension process was divided into four stages, including five tension rounds. The accuracies of the proposed multiple-control method was verified by comparing the measured tag line positon in each tensioning step with the target values, as well as the measured completion state. The tensioning error accumulations were avoided basically. In addition, the phenomenon of repeated installation of equipment, if checking the tag line positon after a hanger tensioning round, according to the traditional control method, was avoided. Moreover, the total time used for the system transformation of Hunan Road Bridge was 21 days, which reflects the efficiency of the proposed control method. This part of the research work provides important references for the system transformation control of the similar self-anchored suspension bridges.
The concrete shrinkage and creep effects during construction and operation periods were considered to determine a reasonable completion state. According to the prediction results, the positions of cable anchor points at tower tops and girder ends will move toward the mid-span. Significant deflections of girder at the middle mid-span will be caused. The maximum measured girder-lifting amount at the middle section under the actual completion state was 0.013 m. The target hanger forces were further optimized based on the numerical simulations. A parametric study about the influence on the stress and geometry evolution of the girder brought by the final girder alignment after adjusting hanger forces was conducted. The results show that the long-term compressive stress evolution of the girder was optimized through the appropriate adjustment of hanger force. The optimized girder pre-lifting amount and hanger force were obtained to effectively offset the adverse influences brought by the long-term concrete shrinkage and creep, which are the lessons learned from this paper.

Author Contributions

Conceptualization, G.Z. and A.L.; Data curation, G.Z. and Z.X.; Formal analysis, G.Z.; Funding acquisition, G.Z., A.L. and J.L.; Investigation, G.Z. and M.D.; Methodology, G.Z. and M.D.; Project administration, G.Z. and Z.X.; Software, G.Z.; Supervision, A.L.; Validation, G.Z. and M.D.; Writing—original draft, G.Z.; Writing—review & editing, L.Z.
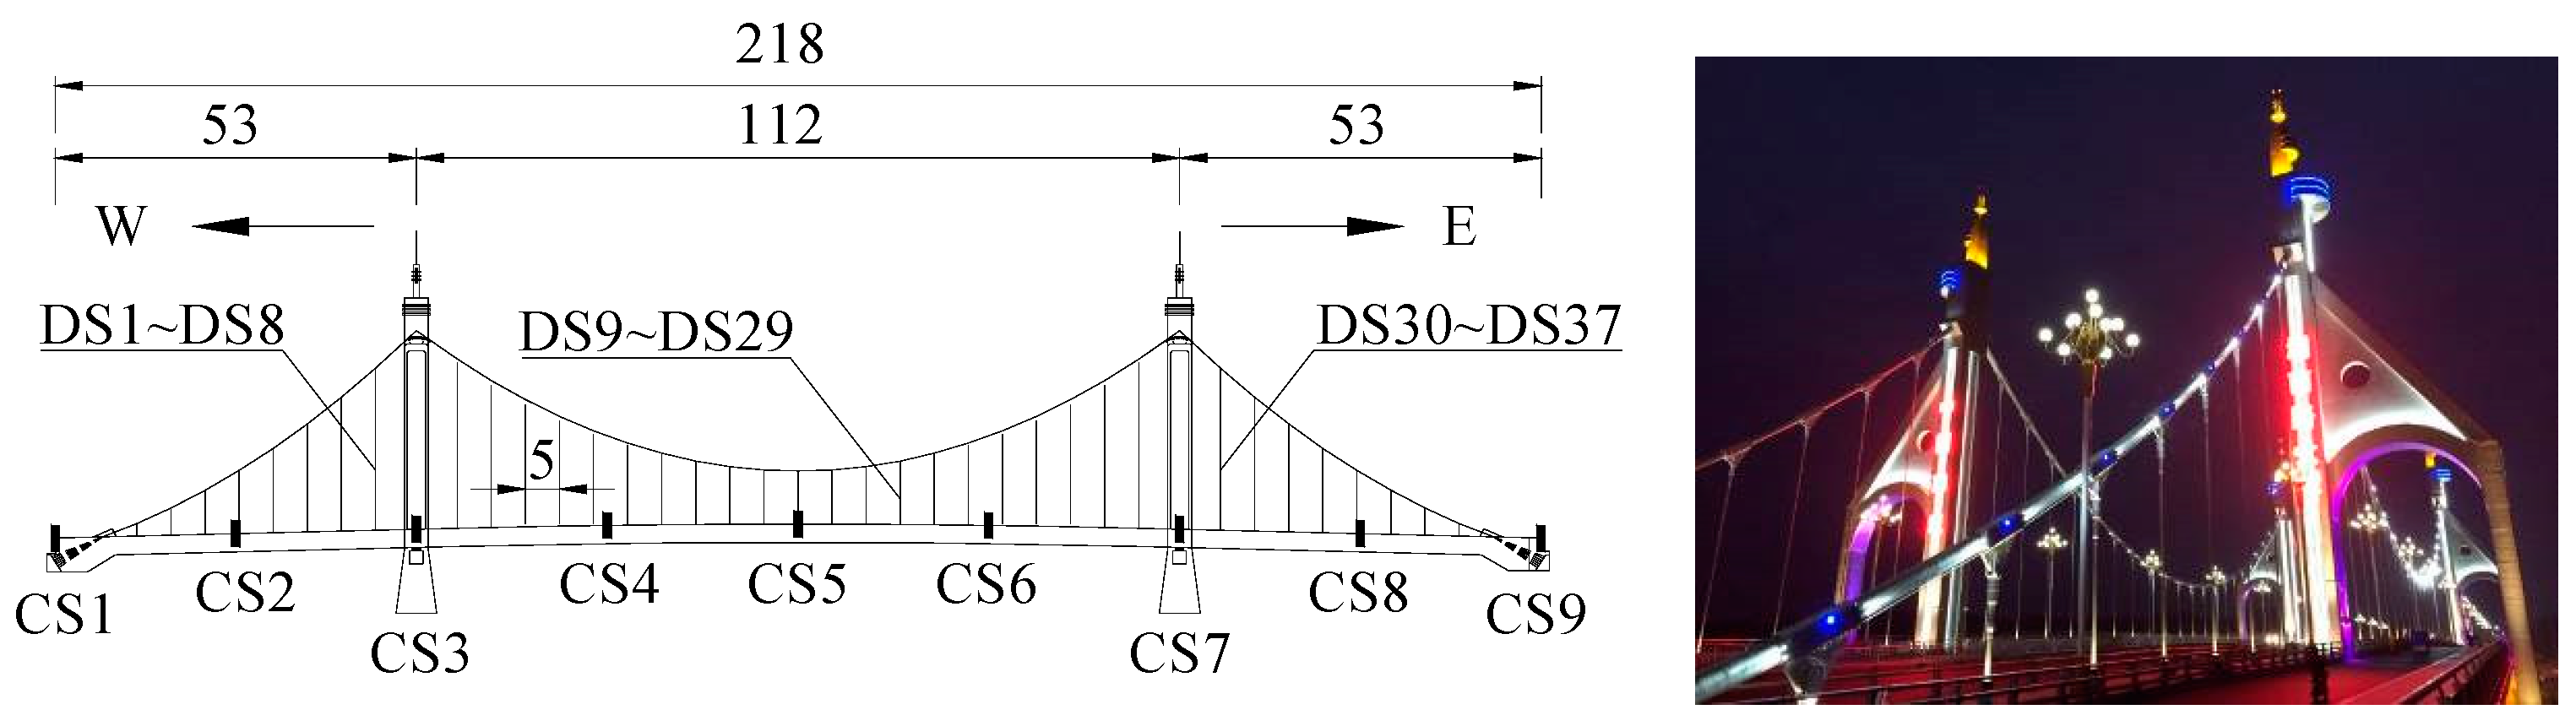
Funding

This research was funded by [National Natural Science Foundation of China] grant number [51278104], [Fundamental Research Funds for the Central Universities] grant number [30919011246], [Transportation Scientific Research Program of Jiangsu Province, China] grant number [2011Y03], [Research Fund for the Doctoral Program of Higher Education of China] grant number [20133204120015], [Universities Natural Science Foundation of Jiangsu Province, China] grant number [12KJB560003]. And The APC was funded by [Fundamental Research Funds for the Central Universities grant number [30919011246] of Nanjing University of Science and Technology].

Conflicts of Interest

The authors declare no conflict of interest.

References

  1. Sun, J.; Manzanarez, R.; Nander, M. Suspension cable design of the new San Francisco-Oakland Bay Bridge. J. Bridge Eng. 2004, 9, 101–106. [Google Scholar] [CrossRef]
  2. Kim, H.K.; Lee, M.J.; Chang, S.P. Determination of hanger installation procedure for a self-anchored suspension bridge. Eng. Struct. 2006, 28, 959–976. [Google Scholar] [CrossRef]
  3. Kumberg, T.; Schneid, S.; Reindl, L. A wireless sensor network using GNSS receivers for a short-term assessment of the modal properties of the Neckartal Bridge. Appl. Sci. 2017, 7, 626. [Google Scholar] [CrossRef]
  4. Kong, Q.Z.; Robert, R.; Silva, P.; Mo, Y. Cyclic crack monitoring of a reinforced concrete column under simulated pseudo-dynamic loading using piezoceramic-based smart aggregates. Appl. Sci. 2016, 6, 341. [Google Scholar] [CrossRef]
  5. Hu, D.T.; Guo, Y.X.; Chen, X.F.; Zhang, C.R. Cable force health monitoring of Tongwamen Bridge based on fiber bragg grating. Appl. Sci. 2017, 7, 384. [Google Scholar] [CrossRef]
  6. Tang, M.L. 3D Geometric Nonlinear Analysis of Long-span Suspension Bridge and its Software Development. Ph.D. Dissertation, Southwest Jiaotong University, Chengdu, China, 2003. (In Chinese). [Google Scholar]
  7. Li, J.H. Study of Key Technical Issues and Reliability Assessment of Spatial Cable Self-anchored Suspension bridge. Ph.D. Dissertation, Southeast University, Chongqing, China, 2011. (In Chinese). [Google Scholar]
  8. Xiao, R.C.; Xiang, H.F. Study of the determination method and program of ideal state for the extra large suspension bridge. East China Highw. 1997, 6, 15–20. (In Chinese) [Google Scholar]
  9. Pevrot, A.H.; Goulois, A.M. Analysis of cable structures. Comput. Struct. 1979, 10, 805–813. [Google Scholar] [CrossRef]
  10. Ozdemir, H. A finite element approach for cable problems. Int. J. Solids Struct. 1979, 15, 427–437. [Google Scholar] [CrossRef]
  11. Jayaraman, H.B.; Knudson, W.C. A curved element for the analysis of cable structures. Comput. Struct. 1981, 14, 325–333. [Google Scholar] [CrossRef]
  12. Tan, Y.G.; Zhang, Z.; Huang, C.L. An analytical method for main cable configuration of self-anchored suspension bridges. J. Highw. Transp. Res. Dev. 2007, 24, 88–90. (In Chinese) [Google Scholar] [CrossRef]
  13. Hu, J.H. The Research on Structural System and Static-dynamic Mechanics Performance of Long-span Self-anchored Suspension Bridges. Ph.D. Dissertation, Hunan University, Changsha, China, 2006. (In Chinese). [Google Scholar]
  14. Shen, R.L. Calculation methods for design and erection of cable curve of suspension bridge. China Civ. Eng. J. 1996, 29, 3–9. (In Chinese) [Google Scholar]
  15. Luo, X.H. Cable finish stage of datum strand for suspension bridge. Struct. Eng. 2004, 20, 21–26. (In Chinese) [Google Scholar]
  16. Kim, H.K.; Lee, M.J.; Chang, S.P. Non-linear shape-finding analysis of a self-anchored suspension bridge. Eng. Struct. 2002, 24, 1547–1559. [Google Scholar] [CrossRef]
  17. Shi, L. Research of Design Theory on Concrete Self-anchored Suspension Bridge. Ph.D. Dissertation, Dalian University of Technology, Dalian, China, 2003. (In Chinese). [Google Scholar]
  18. Zhang, Z. Concrete Self-anchored Suspension Bridge; China Communication Press: Beijing, China, 2005. (In Chinese) [Google Scholar]
  19. Song, X.M.; Dai, G.L.; Fang, S.J. Total bridge model test of Sanchaji Xiangjiang Bridge. China J. Highw. Transp. 2009, 22, 53–59. (In Chinese) [Google Scholar]
  20. Qiu, W.L. Nonlinear Analysis and Experimental Study of Self-anchored Suspension Bridge. Ph.D. Dissertation, Dalian University of Technology, Dalian, China, 2004. (In Chinese). [Google Scholar]
  21. Li, C.X.; Ke, H.J.; Liu, J.; Dong, C.W. Key technologies of construction control in system transformation for Pingsheng Bridge. China Civ. Eng. J. 2008, 41, 49–54. (In Chinese) [Google Scholar]
  22. Zhou, G.P.; Li, A.Q.; Li, J.H.; Duan, M.J. Test and numerical investigations on static and dynamic characteristics of extra-wide concrete self-anchored suspension bridge under vehicle loads. J. Cent. South Univ. 2017, 24, 2382–2395. [Google Scholar] [CrossRef]
  23. Zhou, G.P.; Li, A.Q.; Li, J.H.; Duan, M.J. Structural health monitoring and time-dependent effects analysis of self-anchored suspension bridge with extra-wide concrete girder. Appl. Sci. 2018, 8, 115. [Google Scholar] [CrossRef]
  24. Zhou, G.P.; Li, A.Q.; Li, J.H.; Duan, M.J. Health monitoring and comparative analysis of time-dependent effect using different prediction models for self-anchored suspension bridge with extra-wide concrete girder. J. Cent. South Univ. 2018, 25, 2025–2039. [Google Scholar] [CrossRef]
  25. Zhou, G.P.; Li, A.Q.; Li, J.H.; Duan, M.J.; Spencer, B.F.; Zhu, L. Beam finite element including shear lag effect of extra-wide concrete box girders. J. Bridge Eng. 2018, 23, 04018083. [Google Scholar] [CrossRef]
  26. Irvine, H.M. Cable Structures; MIT Press: London, UK, 1992. [Google Scholar]
  27. Luo, X.H. Numerical analysis method for cable system of suspension bridges. J. Tongji Univ. 2004, 32, 441–446. (In Chinese) [Google Scholar]
  28. Model Code for Concrete Structures 1990; CEB-FIP 90; Comité Euro-International du Béton-Fédération International de la Précontrainte: Thomas Telford, UK, 1990.
  29. Bažant, Z.P. Prediction of concrete creep effects using age-adjusted effective modulus method. J. Am. Concr. Inst. 1972, 69, 212–217. [Google Scholar]
  30. Iskakbayev, A.; Teltayev, B.; Oliviero Rossi, C. Steady-state creep of asphalt concrete. Appl. Sci. 2017, 7, 142. [Google Scholar] [CrossRef]
  31. Bedon, C.; Dilena, M.; Morassi, A. Ambient vibration testing and structural identification of a cable-stayed bridge. Meccanica 2016, 51, 2777–2796. [Google Scholar] [CrossRef] [Green Version]
  32. Duan, M.J.; Li, J.H.; Suo, X.C.; Zhou, G.P. Refined analysis method of saddle for self-anchored concrete suspension bridge. J. Nanjing Tech. Univ. 2016, 38, 112–115. (In Chinese) [Google Scholar]
  33. Li, J.H.; Li, A.Q. Calculation, Monitoring and Assessment of Spatial Cable Self-Anchored Suspension Bridges; China Communication Press: Beijing, China, 2011. (In Chinese) [Google Scholar]
  34. Tang, M.L.; Shen, R.L.; Qiang, S.Z. An accurate calculation method for erecting curves of wire strands of long suspension bridges. J. Southwest Jiaotong Univ. 2001, 36, 303–307. (In Chinese) [Google Scholar]
  35. Tang, M.L.; Wang, C.J.; Shen, R.L. Monitoring and analysis of datum strand of the Xi Houmen suspension bridge. J. Chongqing Jiaotong Univ. 2008, 27, 532–536. (In Chinese) [Google Scholar]
  36. Feng, G.; Deng, W. Self-anchored suspension system installation and transformation in the main hole of Xiangjiang River Sanchaji Bridge. Highw. Eng. 2008, 33, 110–113. (In Chinese) [Google Scholar]
  37. Li, C.X.; Ke, H.J.; Yang, W.; He, J.; Li, H.L. Comparative study on the optimal system transformation schemes for Taohuayu self-anchored suspension bridge. China Civ. Eng. J. 2014, 9, 120–127. (In Chinese) [Google Scholar]
  38. Hu, J.H.; Shen, R.L.; Zhang, G.M.; Tang, M.L.; Wang, Z.B. A total bridge model study of the Pingsheng Bridge in Foshan. China Civ. Eng. J. 2007, 40, 17–25. (In Chinese) [Google Scholar]
  39. Zhou, X.H.; Wu, J.; Di, J. Mechanical analysis for long-span self-anchored suspension bridges. China Civ. Eng. J. 2006, 39, 42–45. (In Chinese) [Google Scholar]
  40. Ke, H.J.; Li, C.X.; Zhang, Y.P.; Dong, C.W. System transformation program and control principles of suspender tension for a self-anchored suspension bridge with two towers and large transverse inclination spatial cables. China Civ. Eng. J. 2010, 11, 94–101. (In Chinese) [Google Scholar]
  41. Li, A.Q.; Li, J.H. Tag line control method for system transformation of self-anchored suspension bridge. Bridge Constr. 2013, 43, 37–41. (In Chinese) [Google Scholar]
  42. Kim, S.H.; Won, J.H. Structural behavior of a long-span partially earth-anchored cable-stayed bridge during installation of a key segment by thermal prestressing. Appl. Sci. 2016, 6, 231. [Google Scholar] [CrossRef]
Figure 1. Global layout of the Hunan Road Bridge (Unit: m).
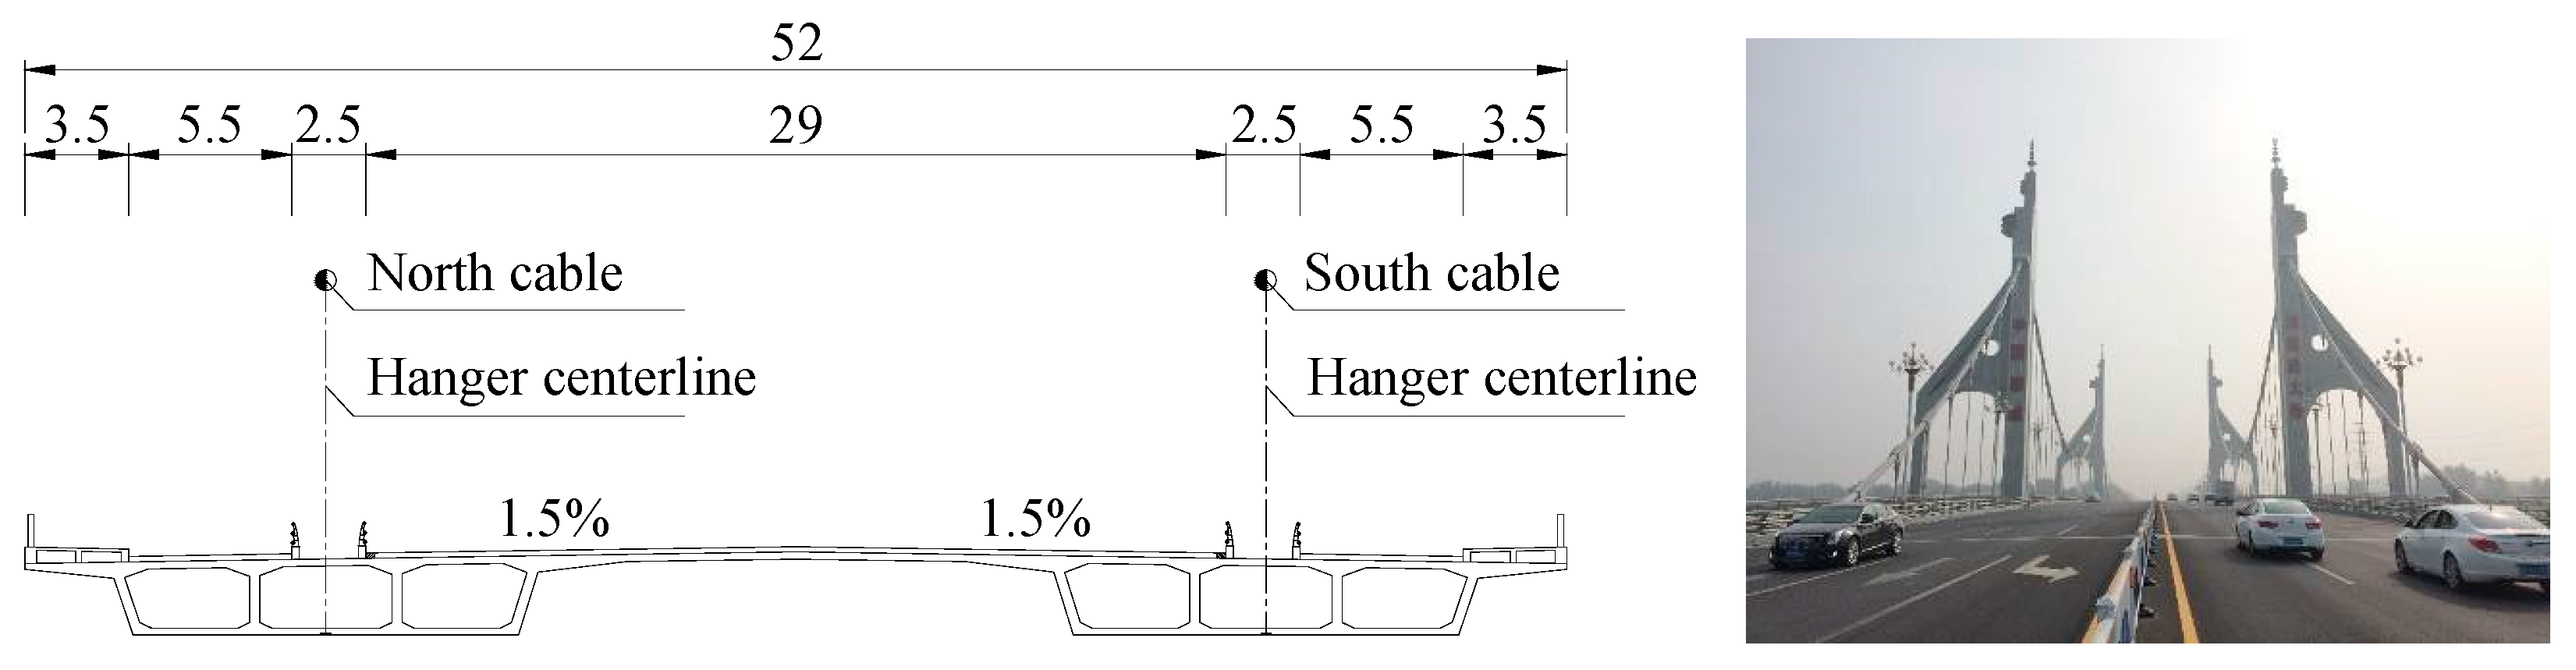
Applsci 09 02576 g001
Figure 2. Cable system and extra-wide girder (Unit: m).
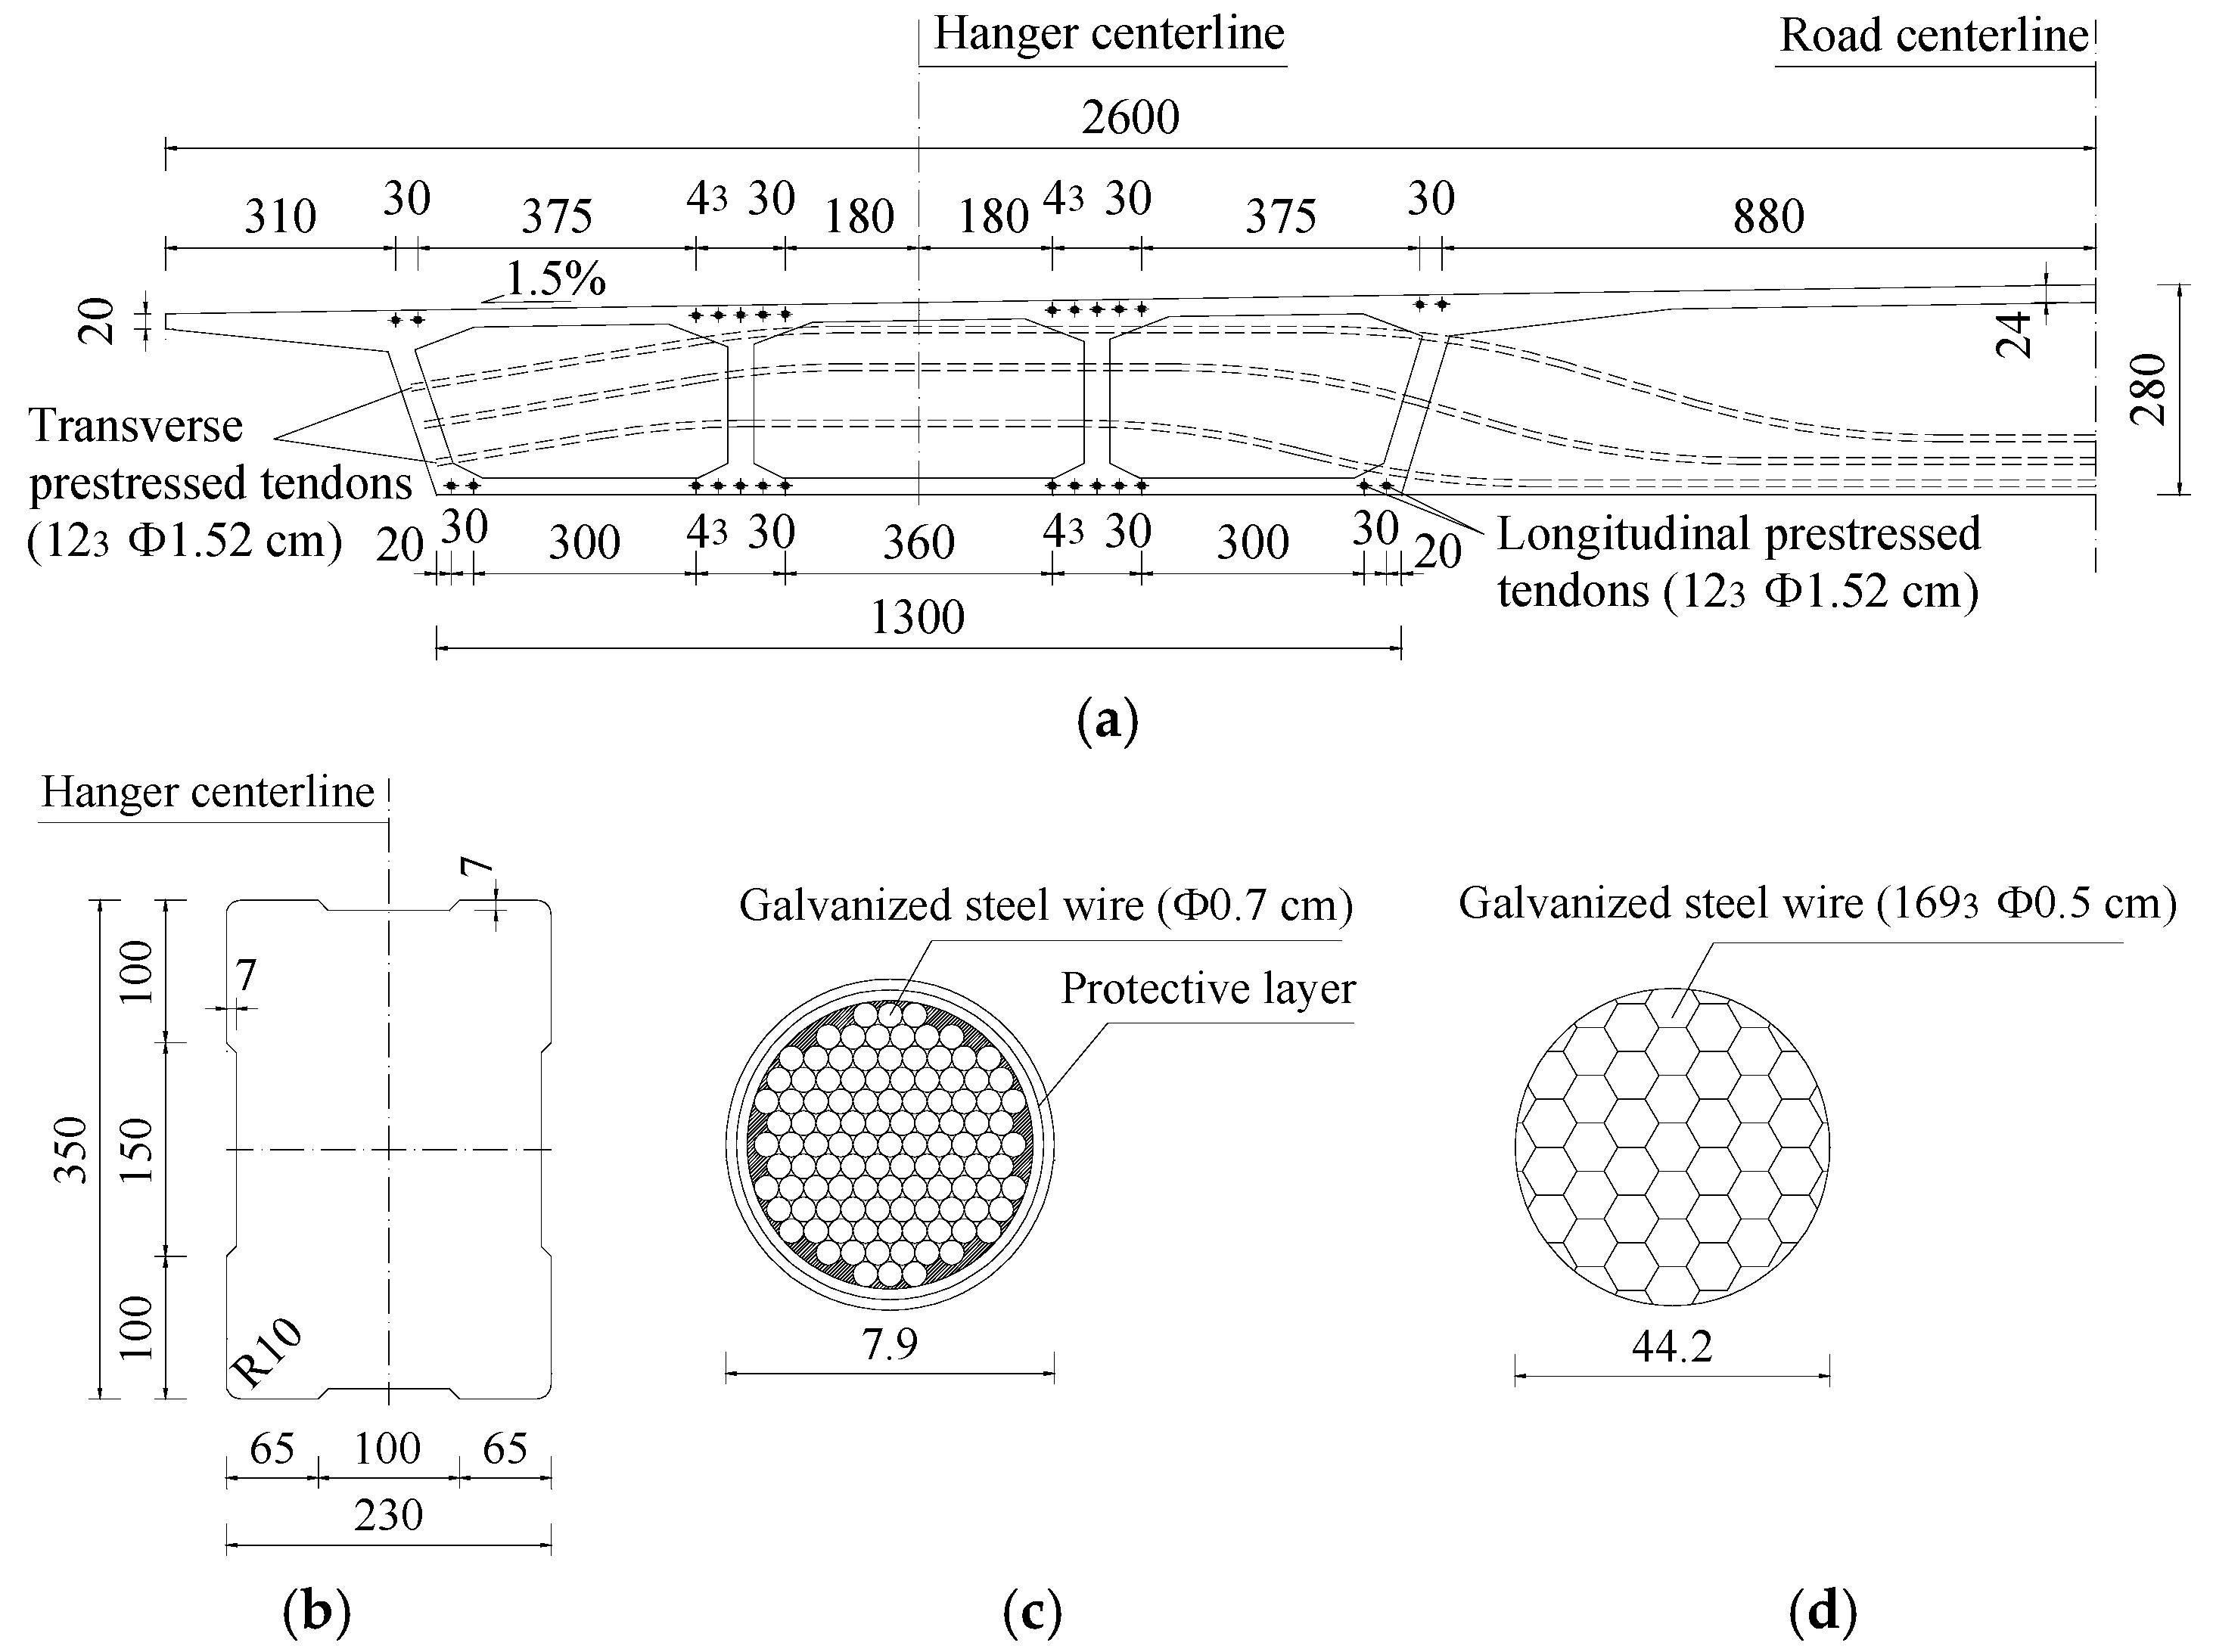
Applsci 09 02576 g002
Figure 3. Cross section of key component: (a) half part of girder, (b) tower, (c) hanger, and (d) cable (Unit: cm).
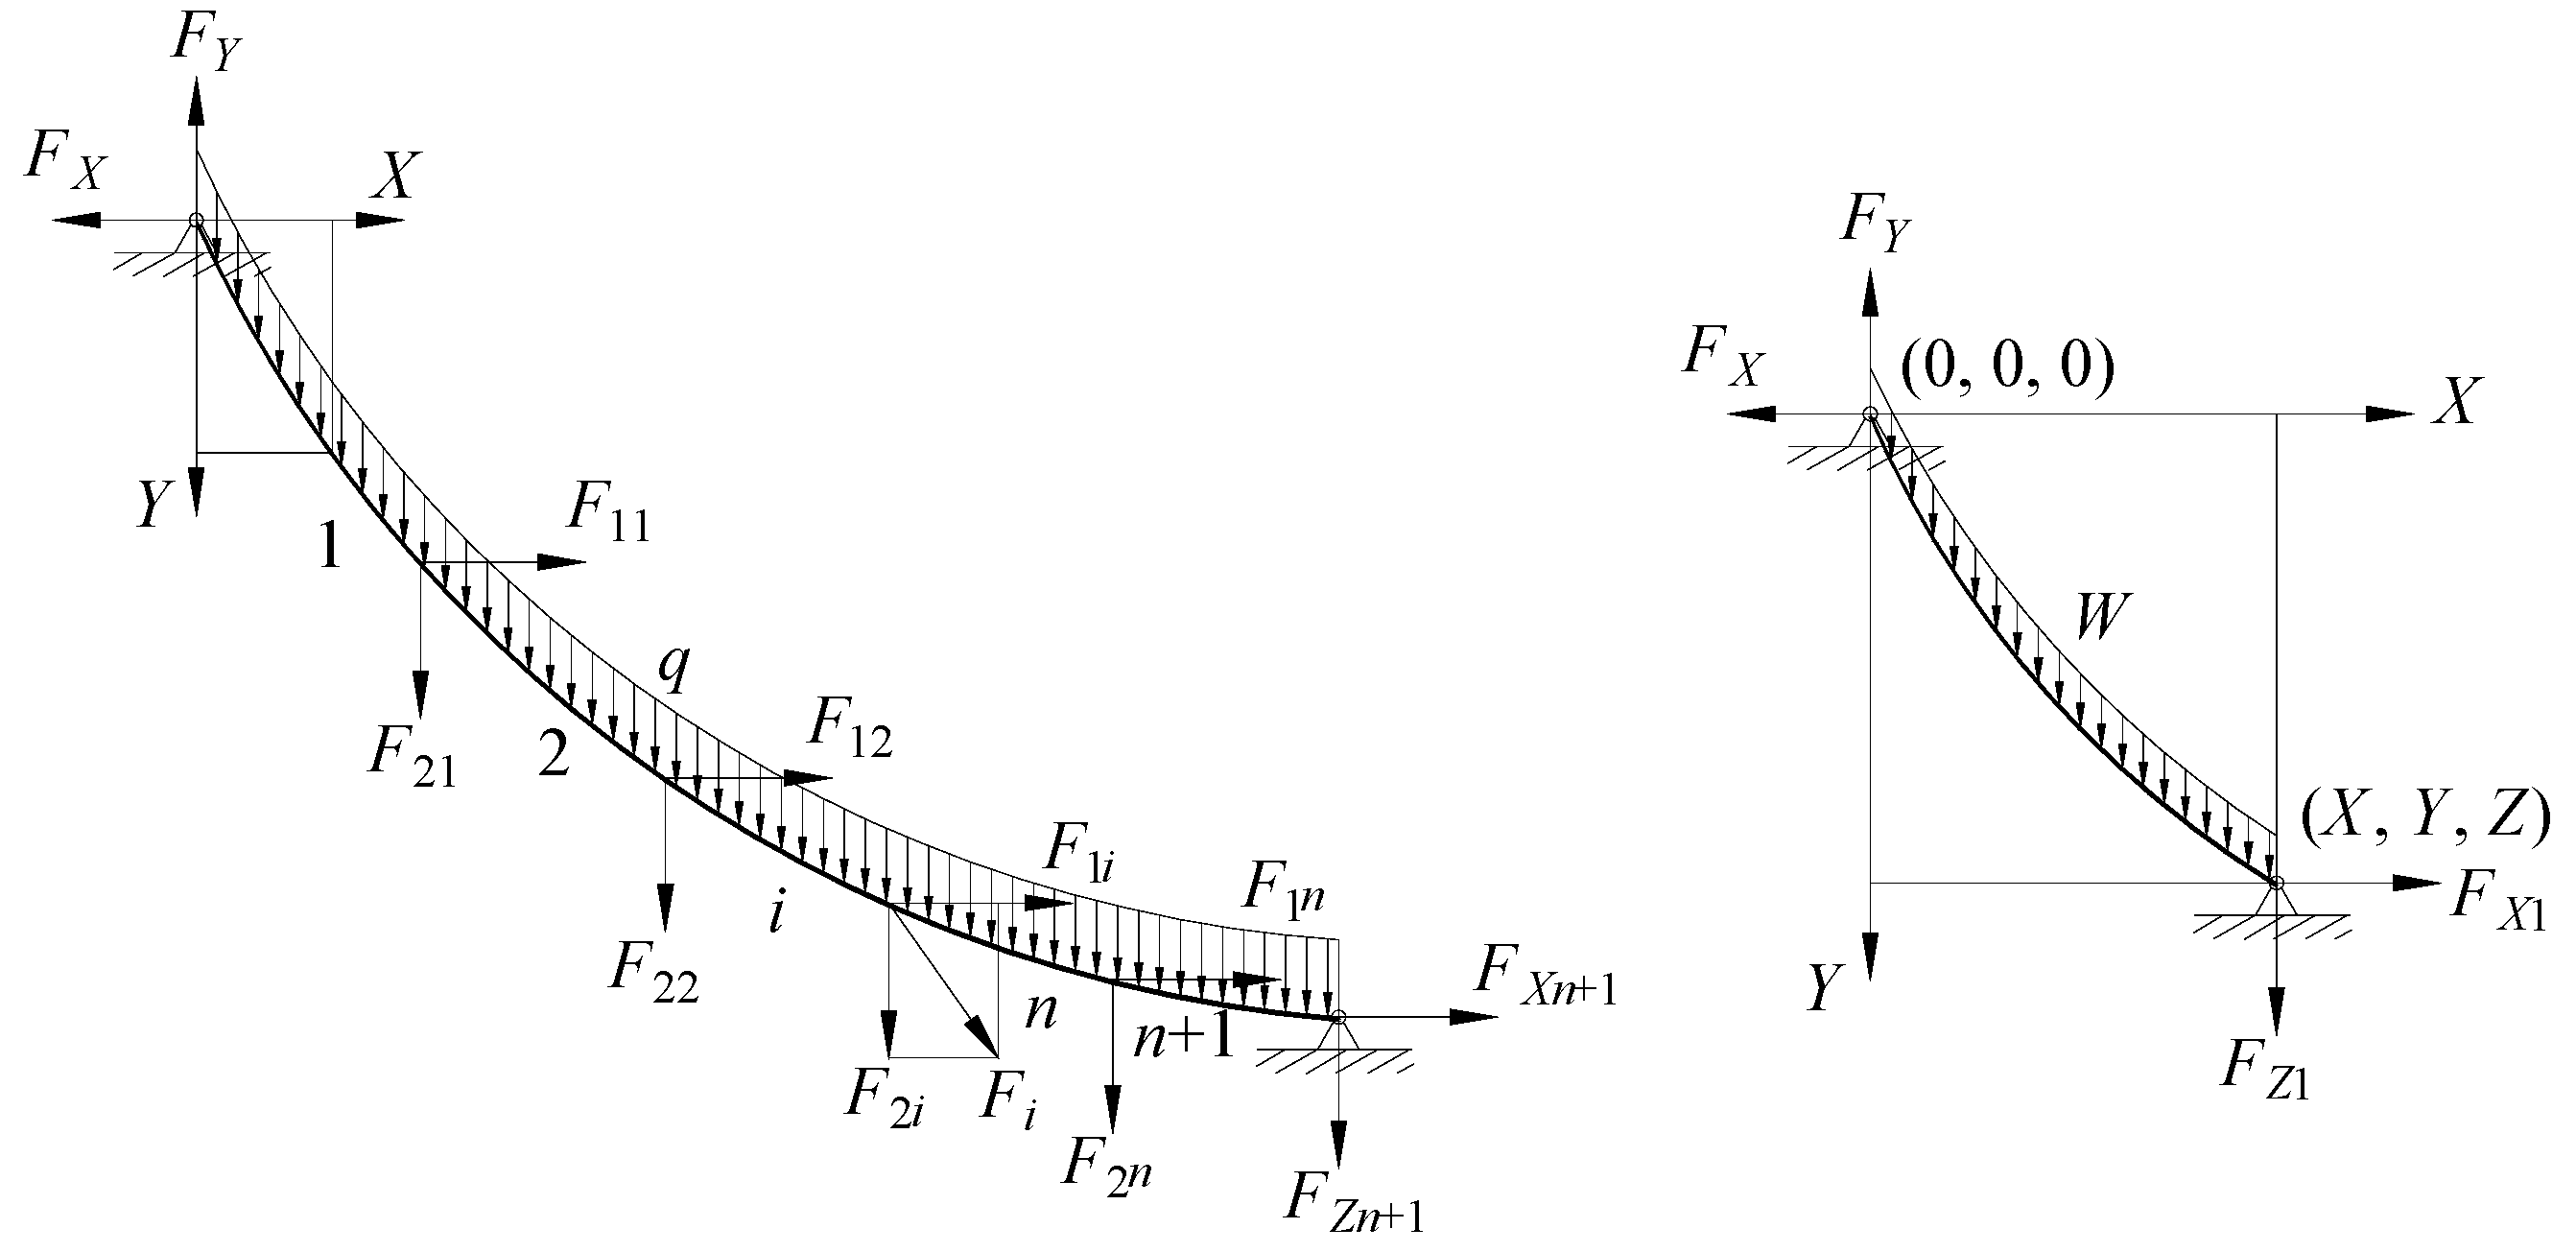
Applsci 09 02576 g003
Figure 4. Forced state of cable at the completion state.
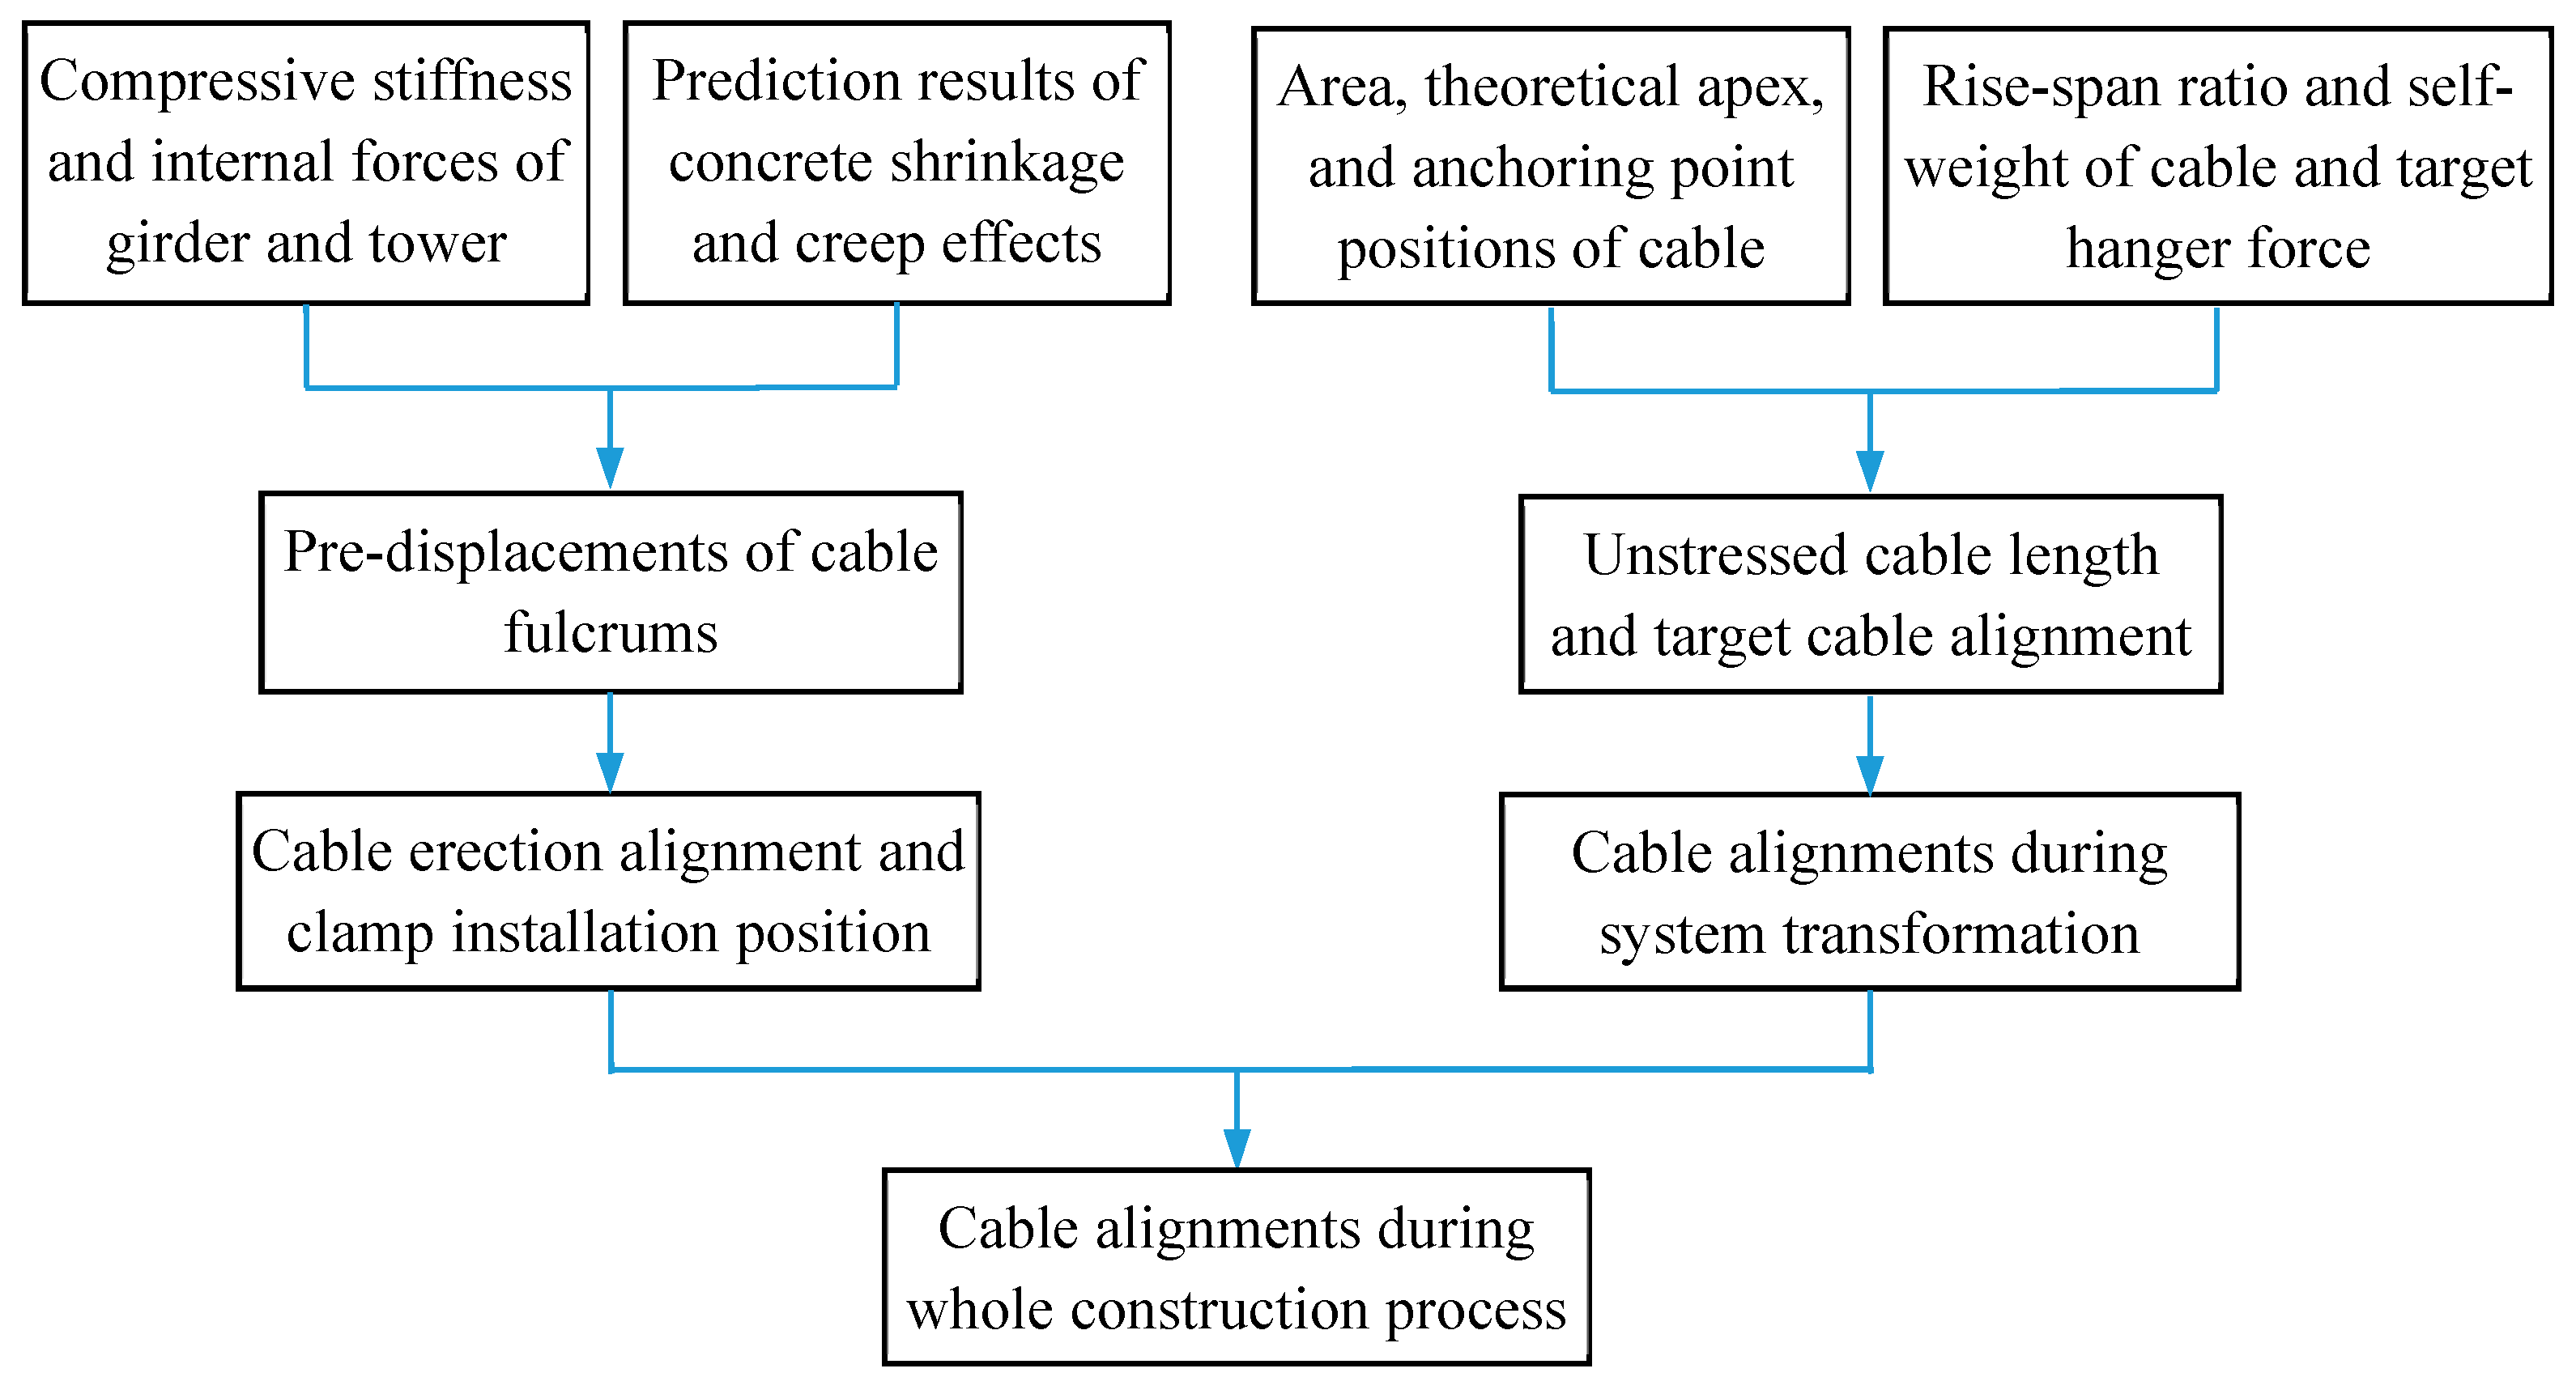
Applsci 09 02576 g004
Figure 5. Numerical algorithm of the cable system for a concrete self-anchored suspension bridge.
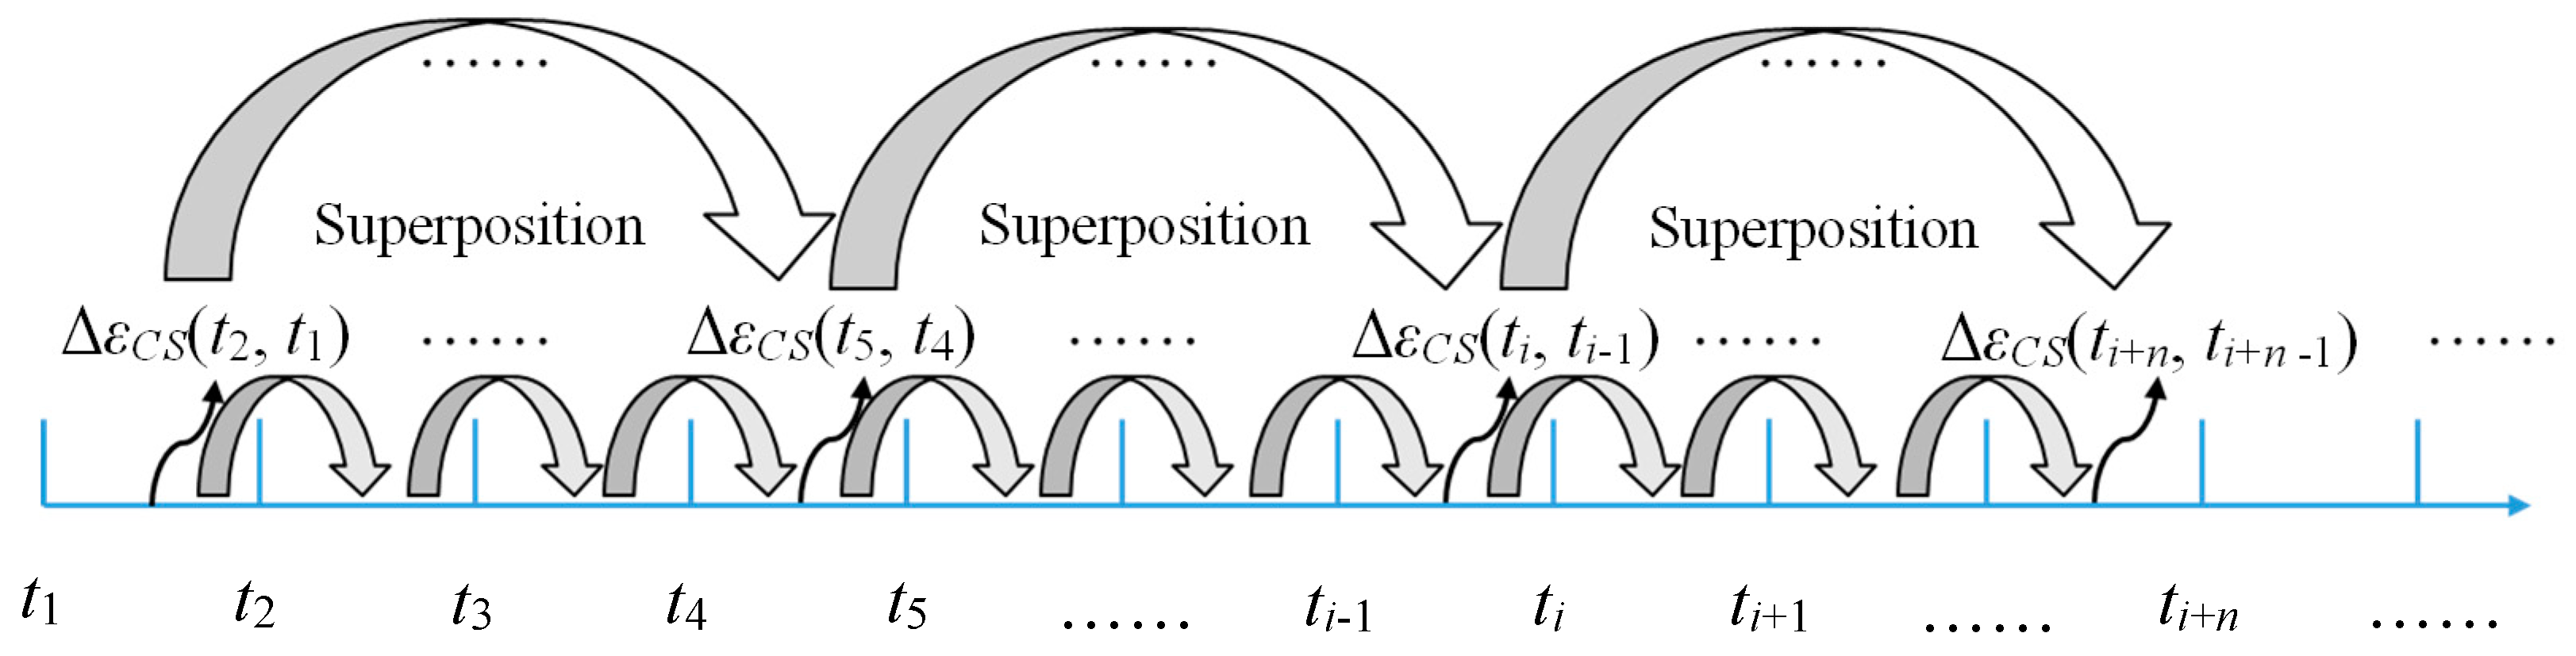
Applsci 09 02576 g005
Figure 6. Schematic diagram of the stepwise analysis of concrete shrinkage and creep effect.
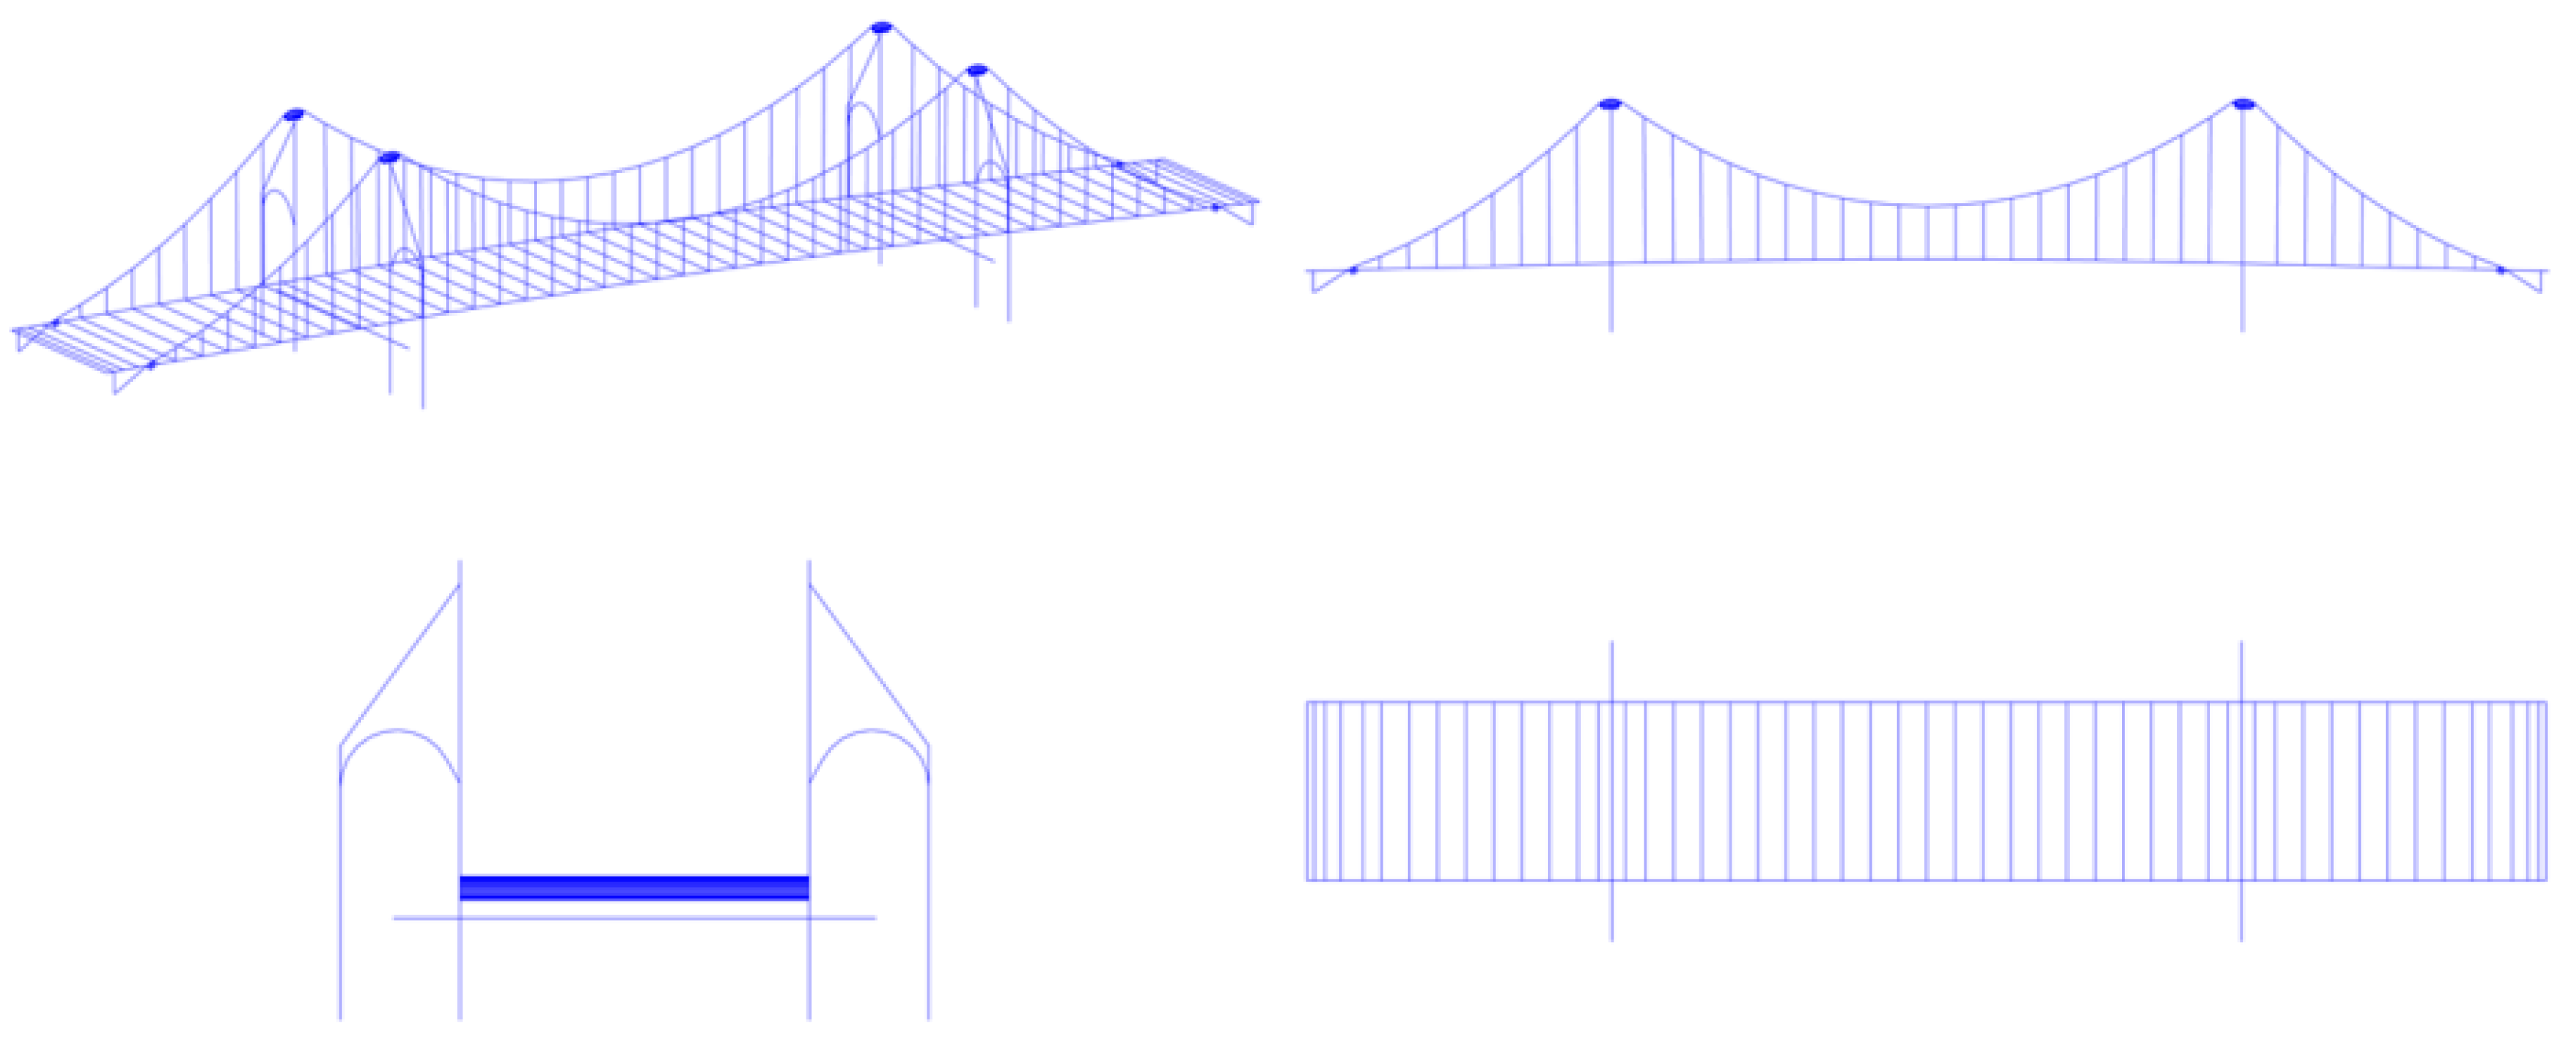
Applsci 09 02576 g006
Figure 7. Spatial FE mode of the Hunan Road Bridge.
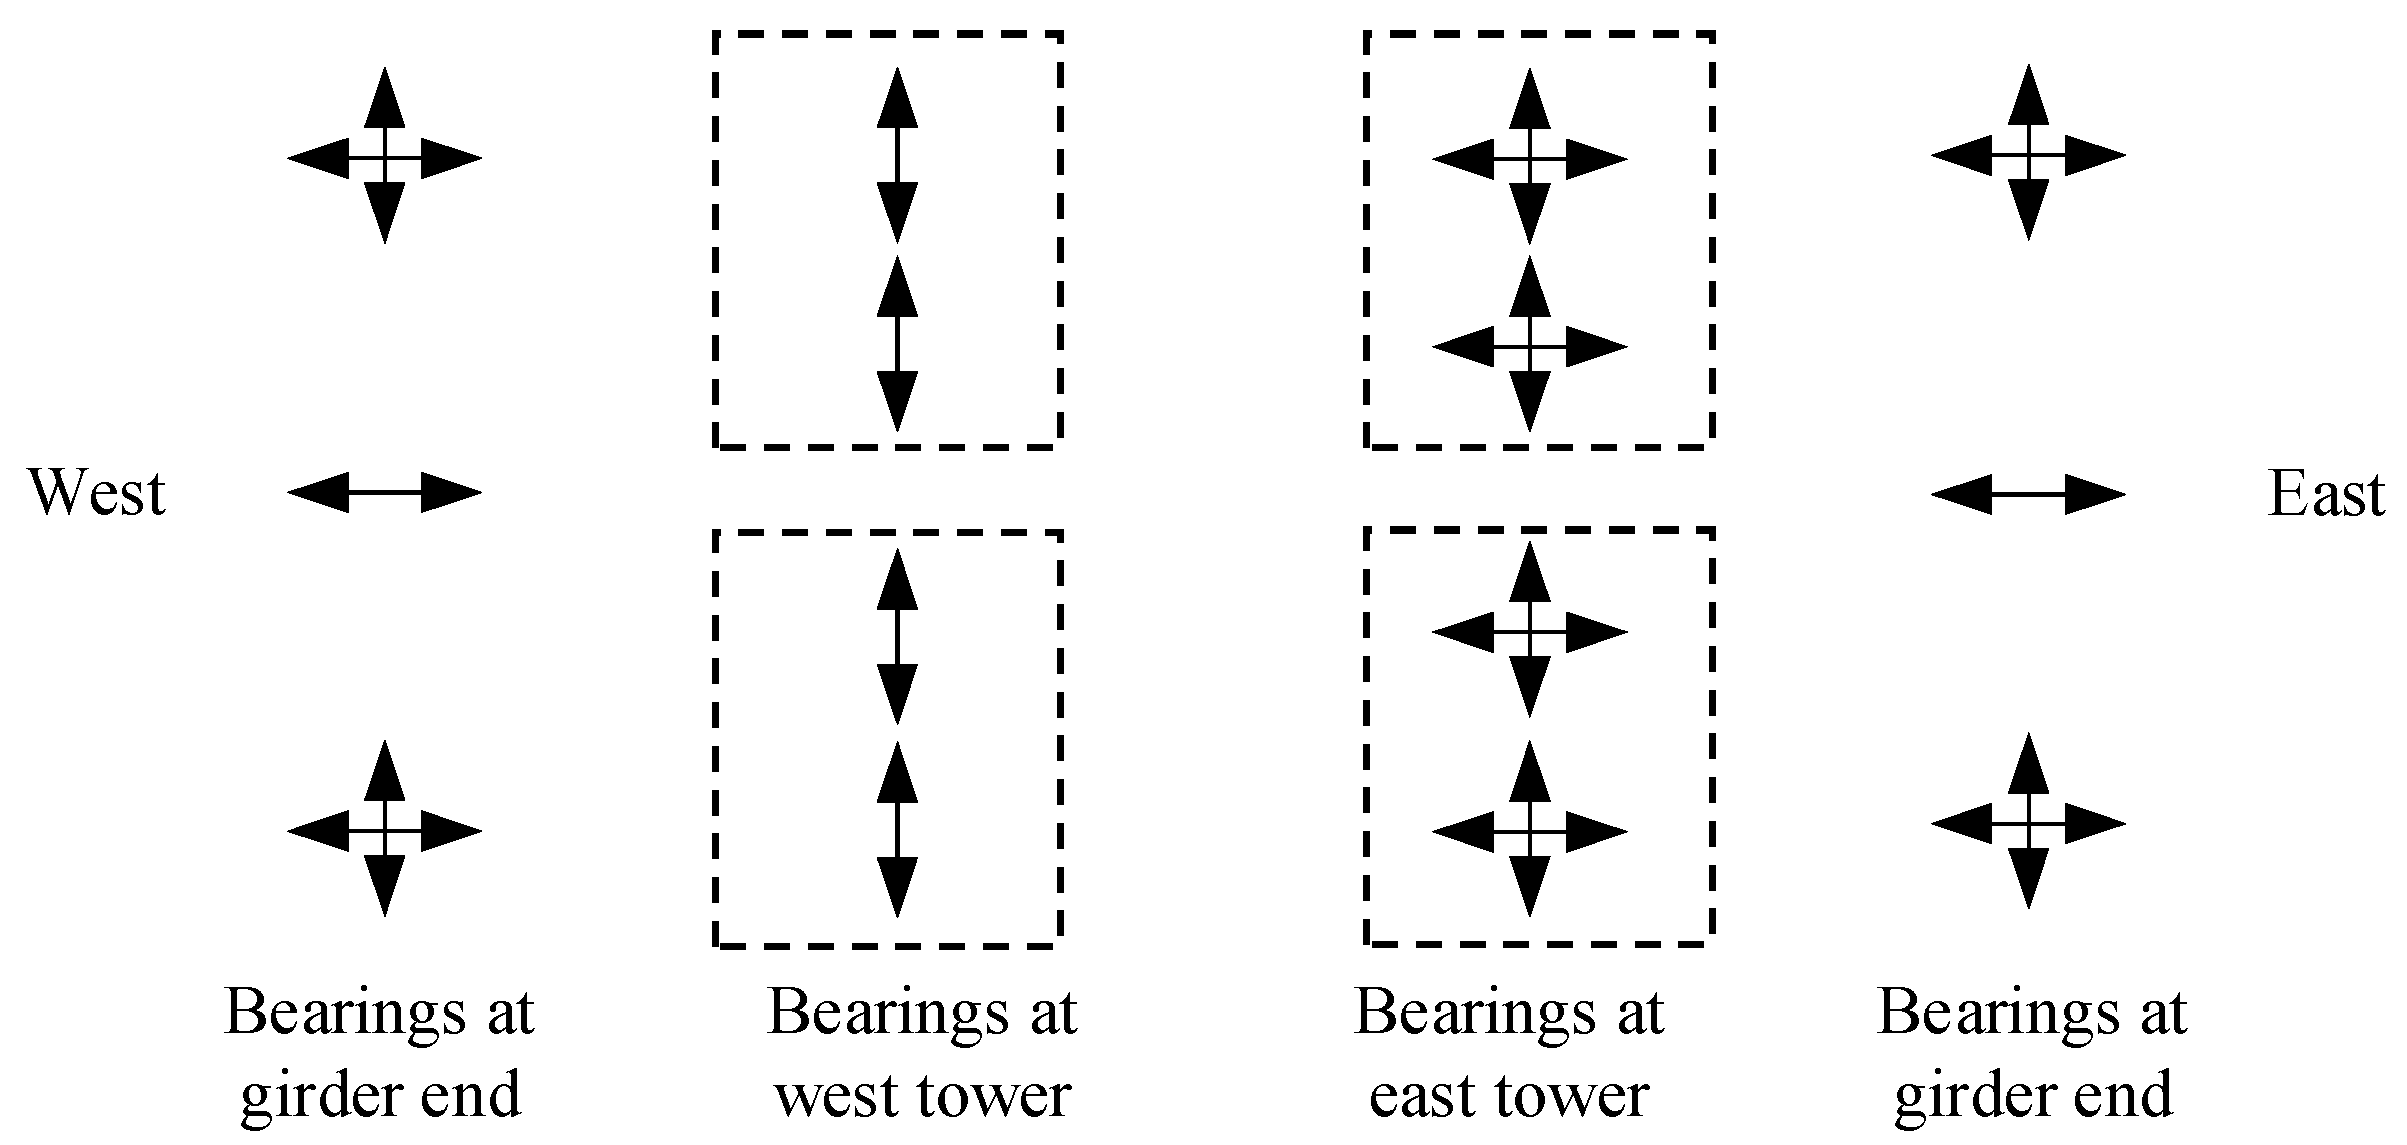
Applsci 09 02576 g007
Figure 8. Bearing types of the Hunan Road Bridge (The dashed boxes represent the locations of towers).
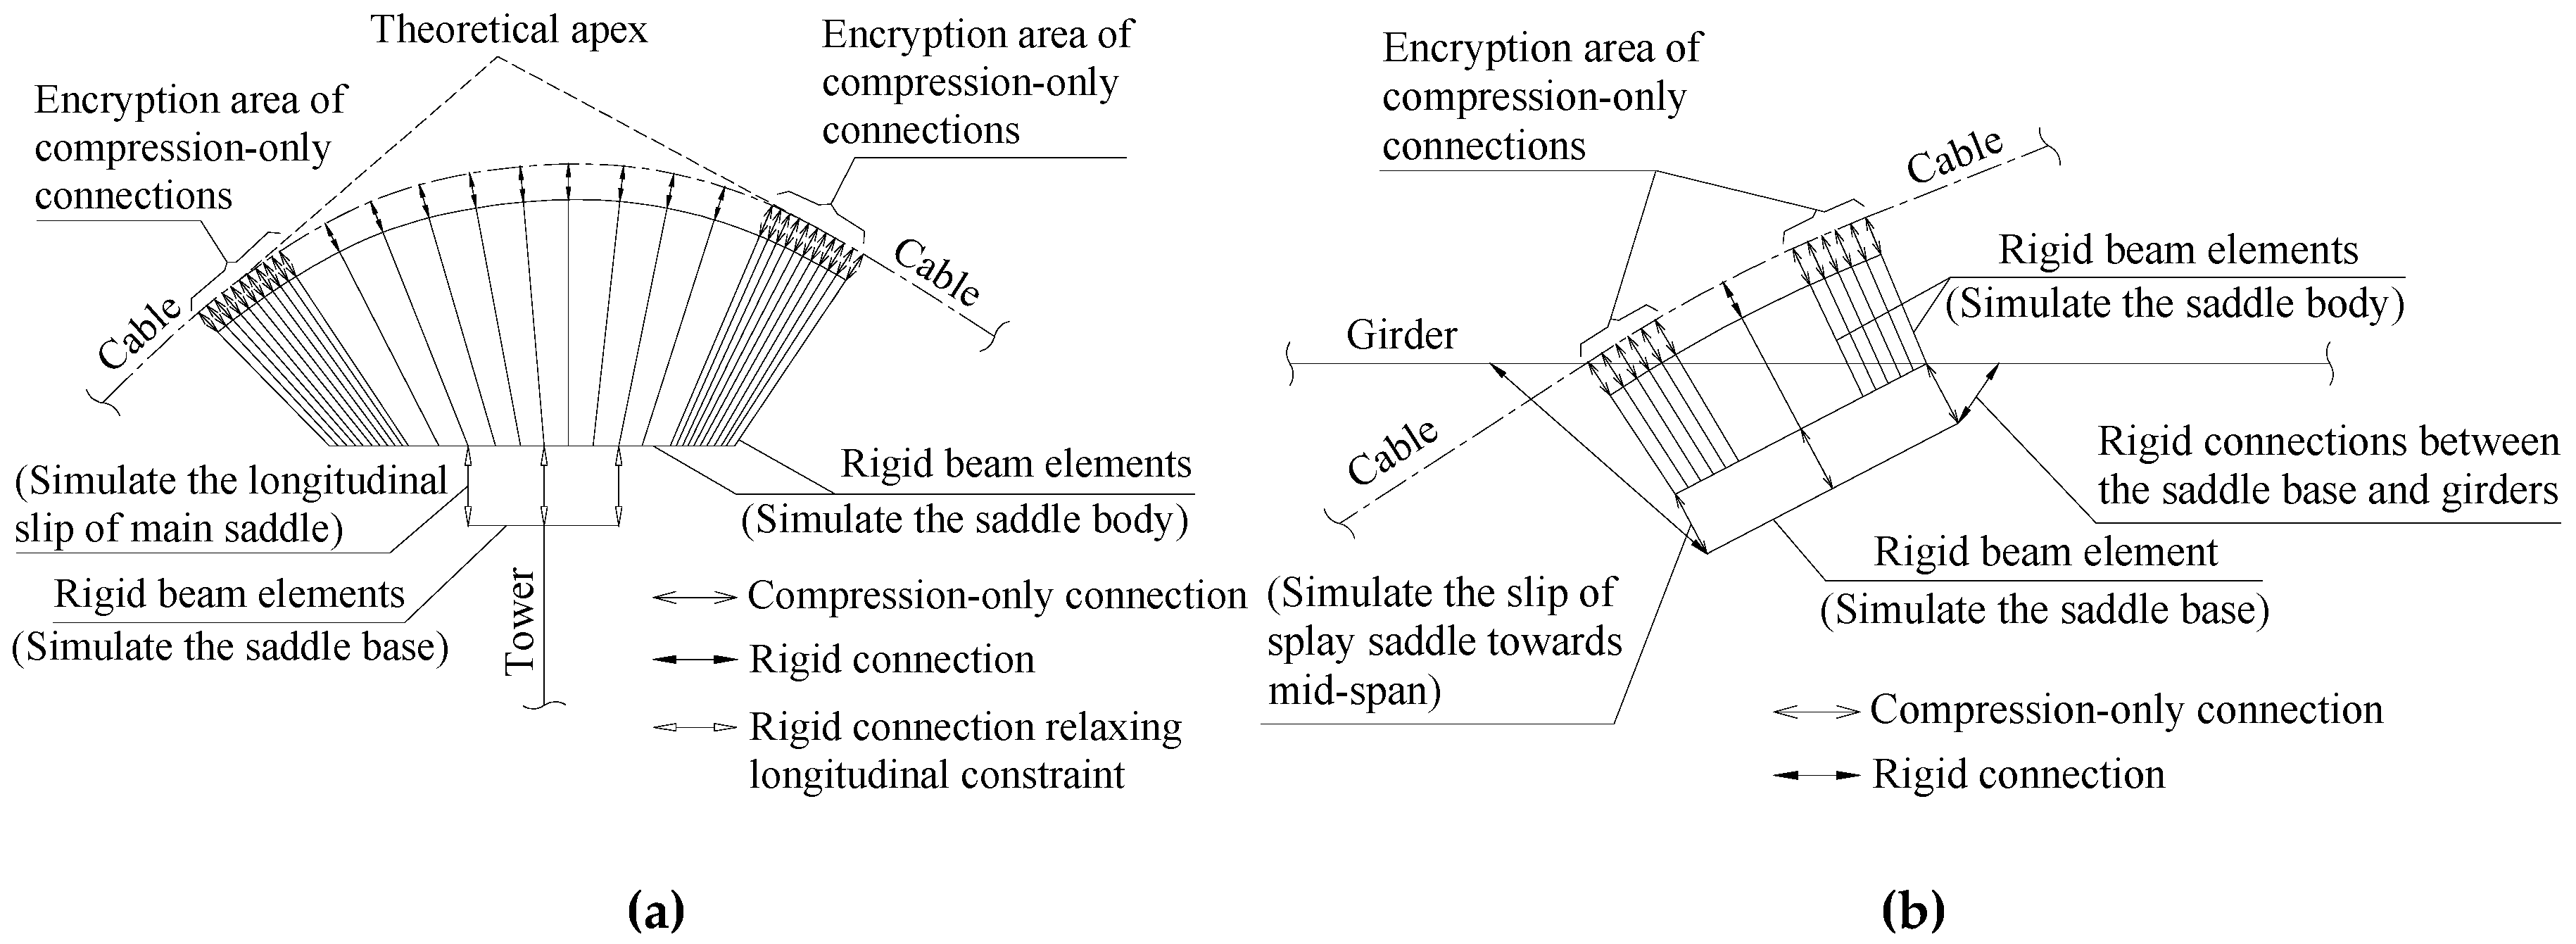
Applsci 09 02576 g008
Figure 9. Refined FE models of cable saddles: (a) Main saddle. (b) Splay saddle.
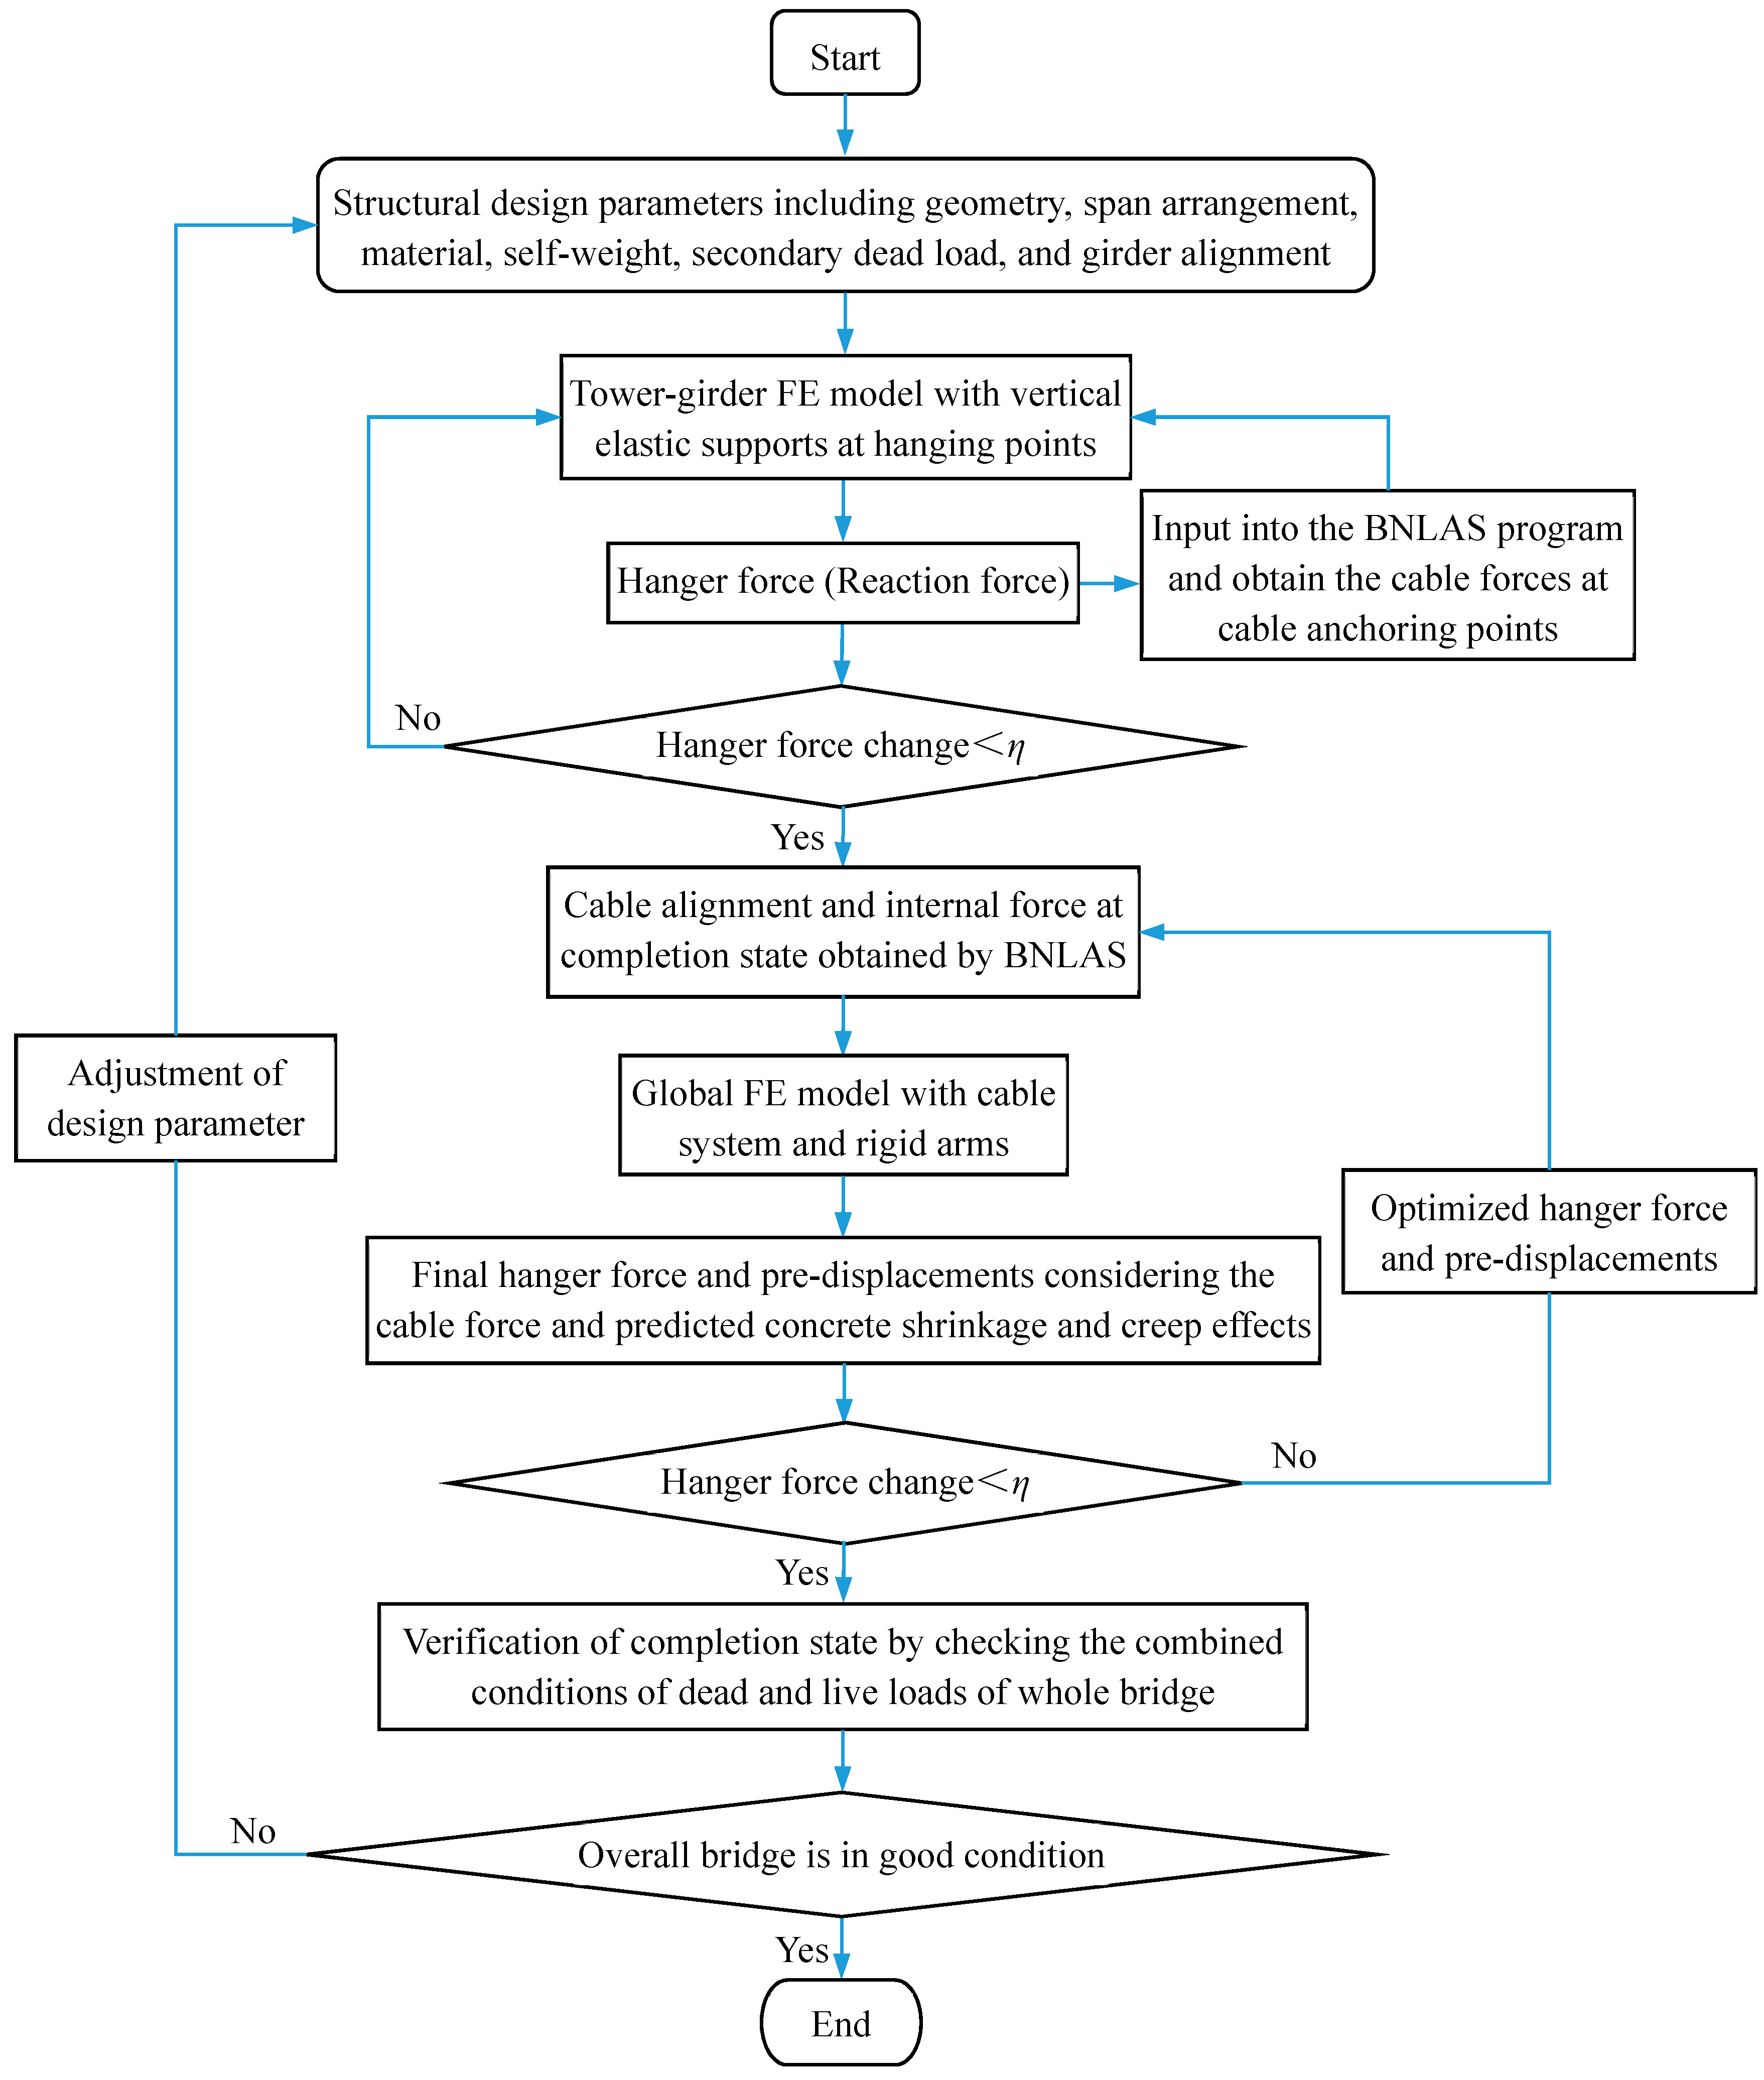
Applsci 09 02576 g009
Figure 10. Algorithm flowchart of reasonable completion state determination for concrete self-anchored suspension bridge.
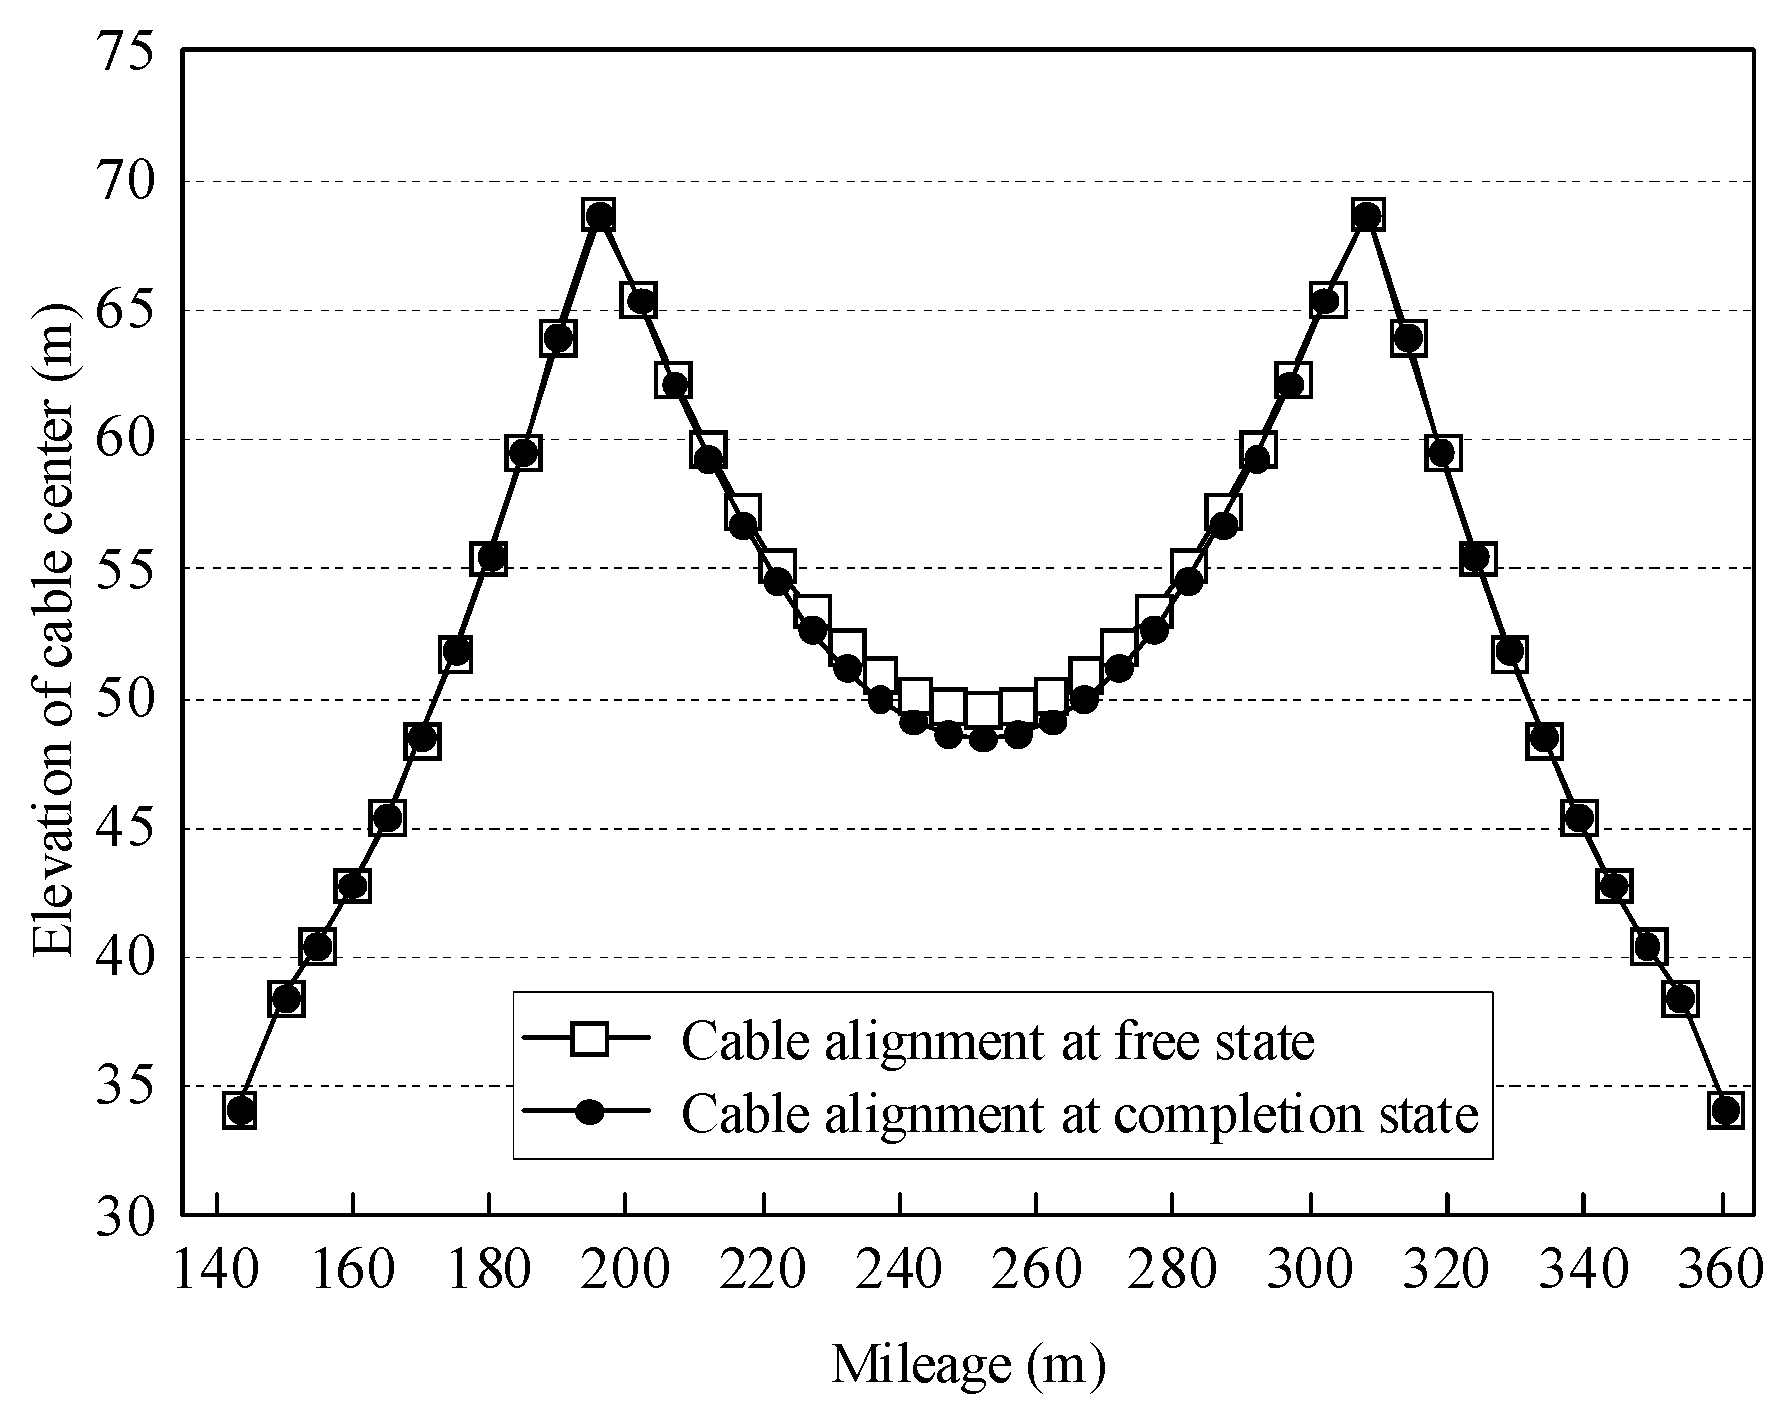
Applsci 09 02576 g010
Figure 11. Results of cable alignments at erection and completion states of the Hunan Road Bridge.
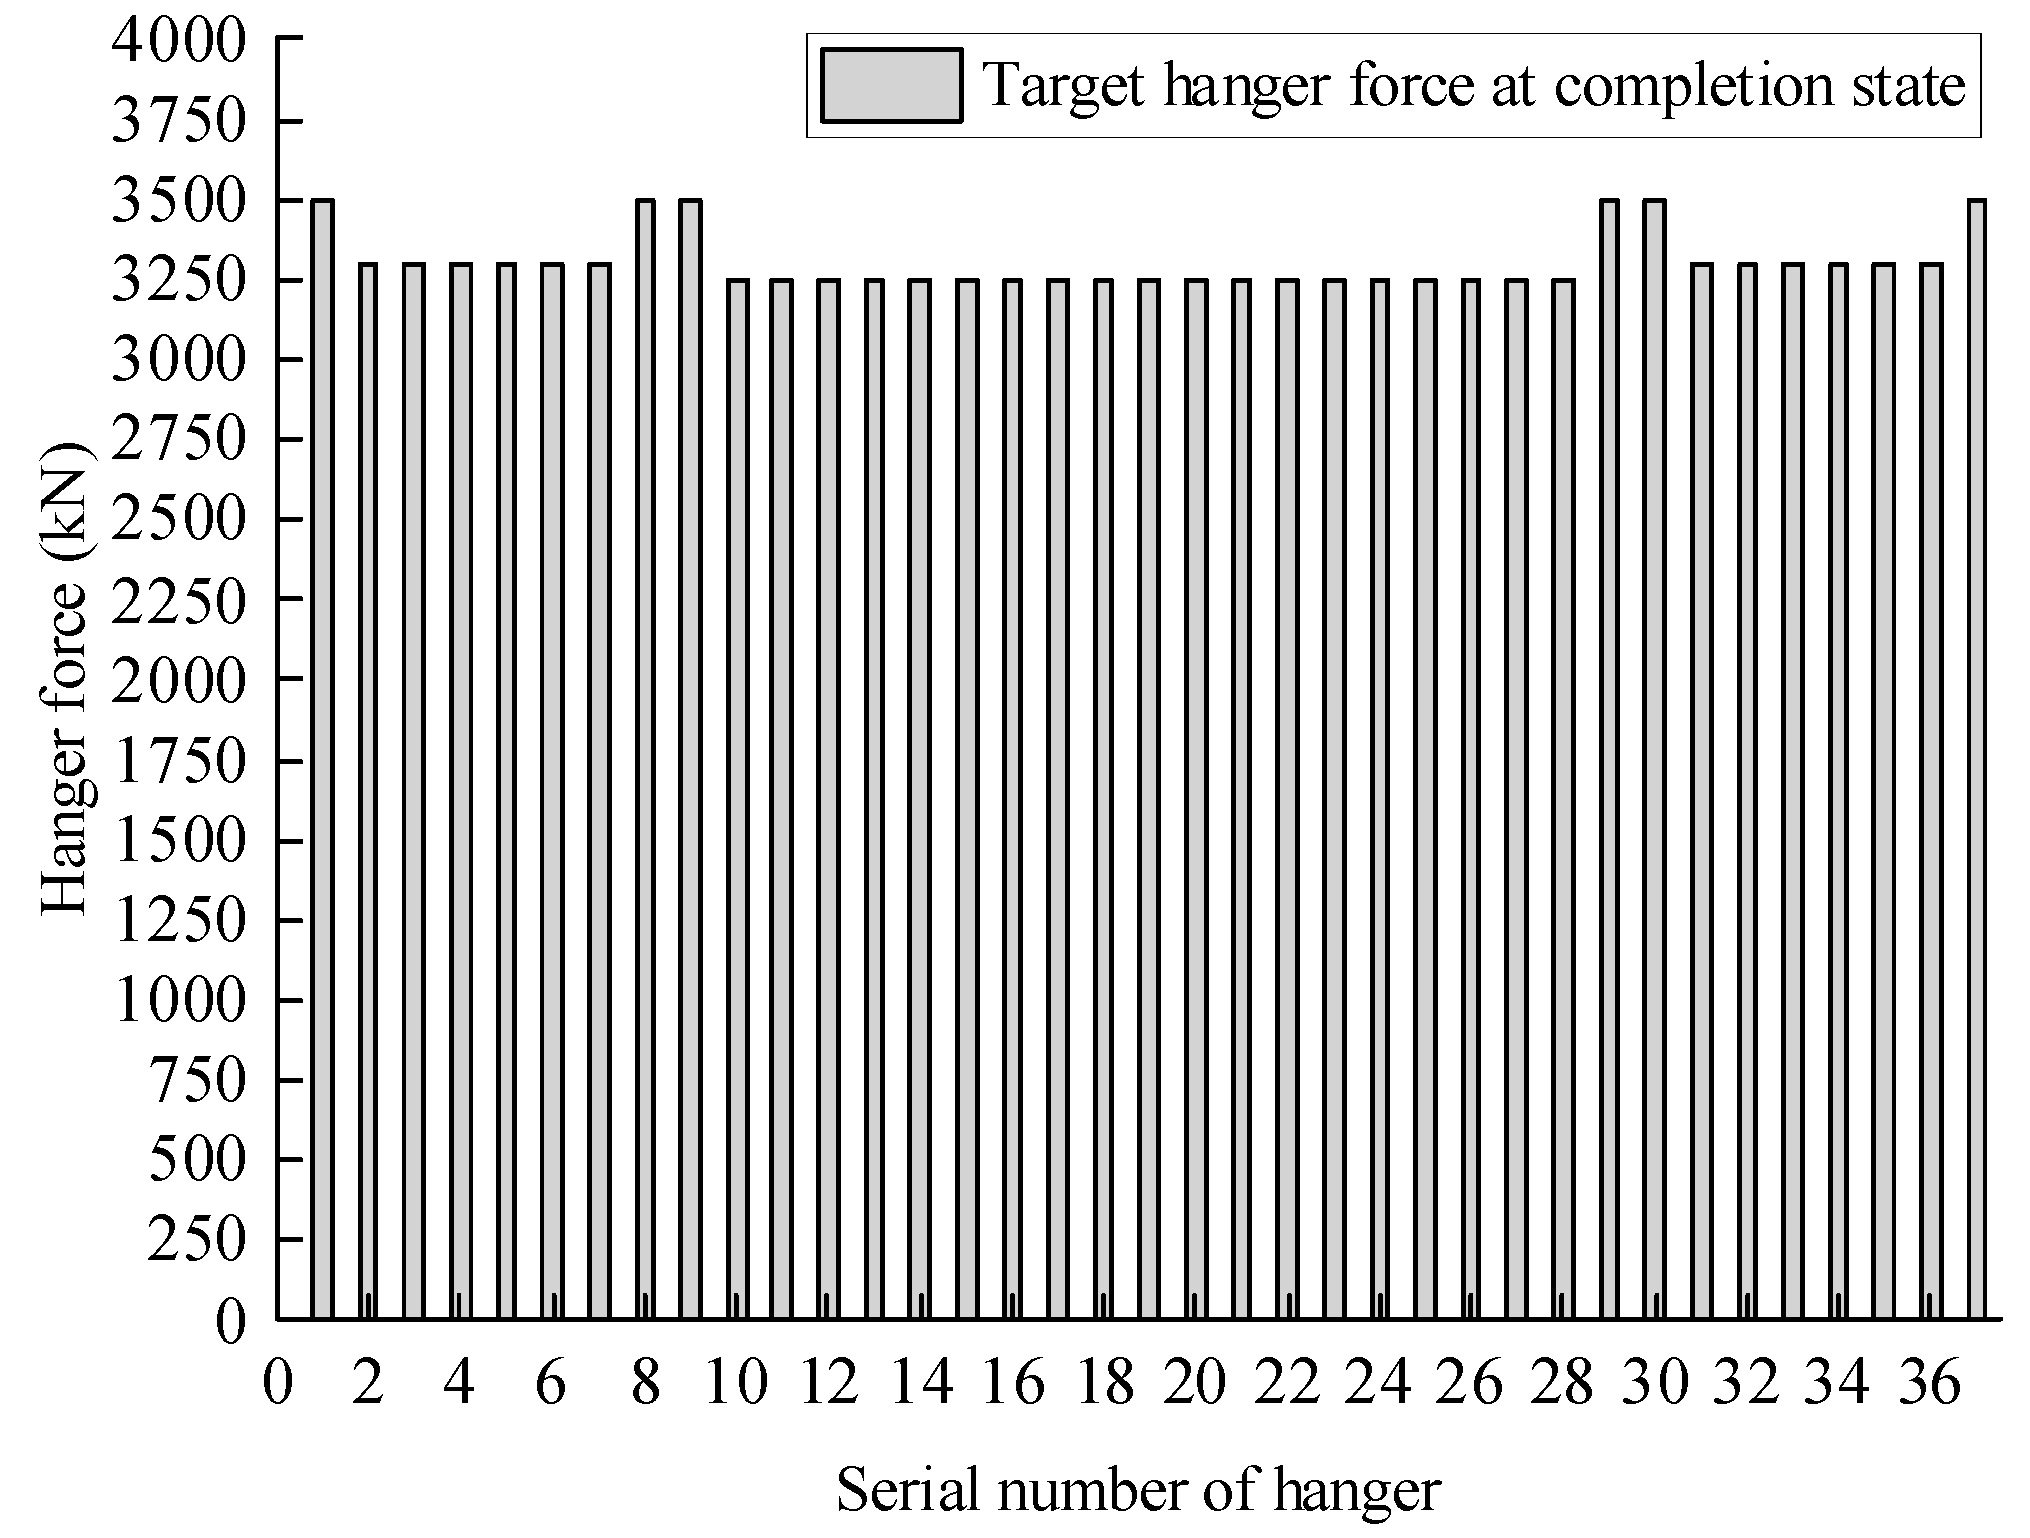
Applsci 09 02576 g011
Figure 12. Target hanger force at the completion state (Unit: kN).
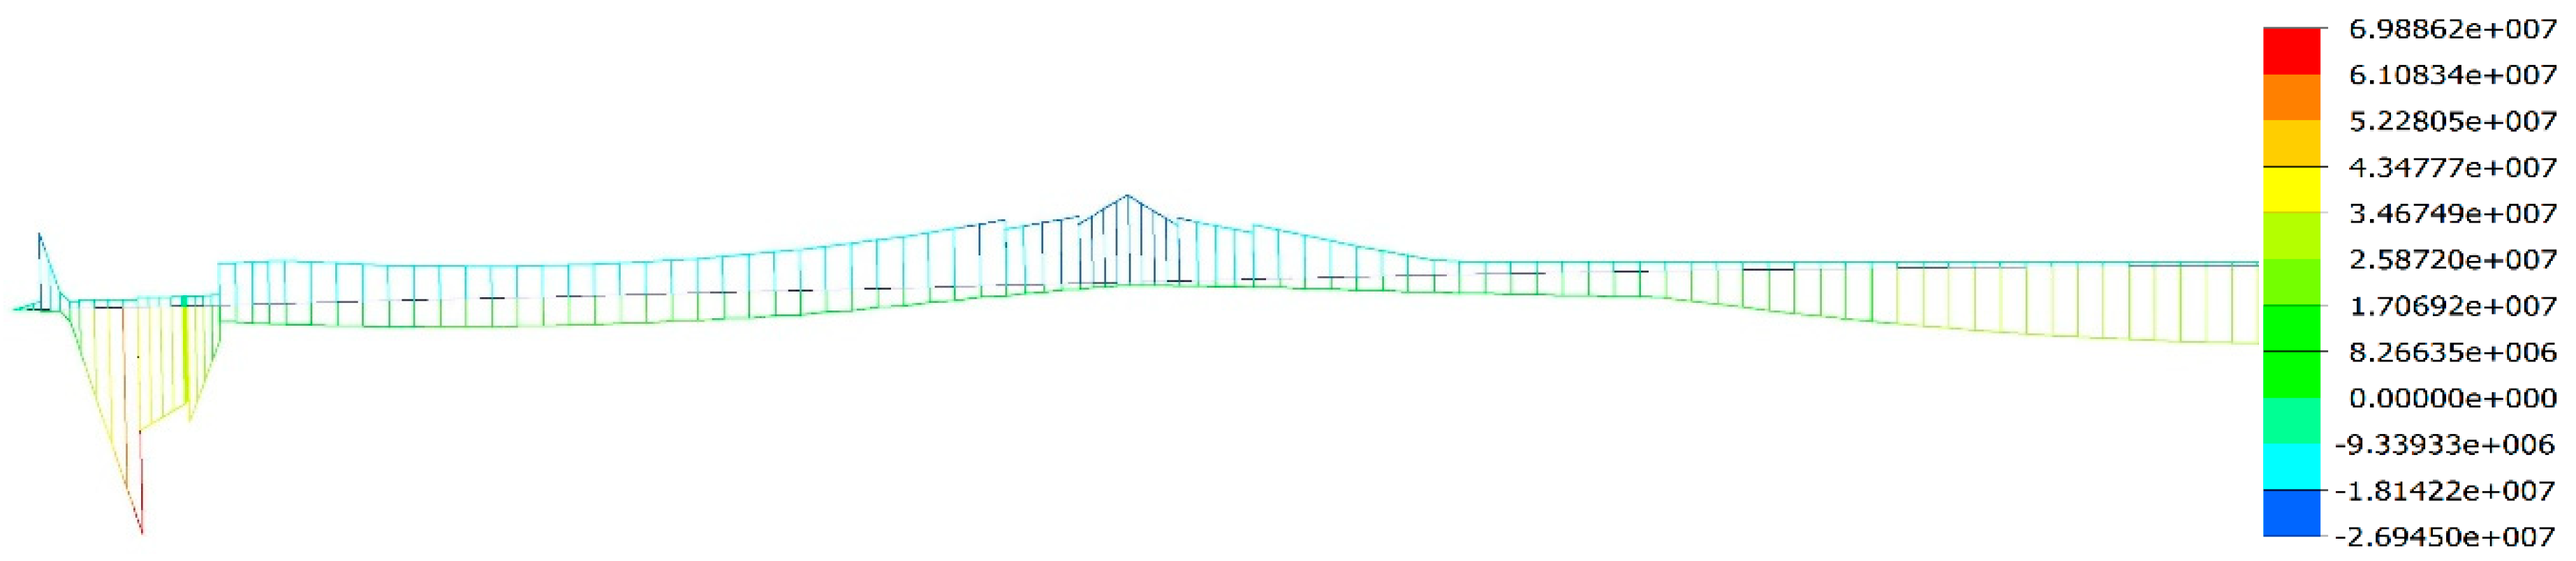
Applsci 09 02576 g012
Figure 13. Moment envelope diagram of girder under the combined condition of dead and live loads (Unit: N·m).
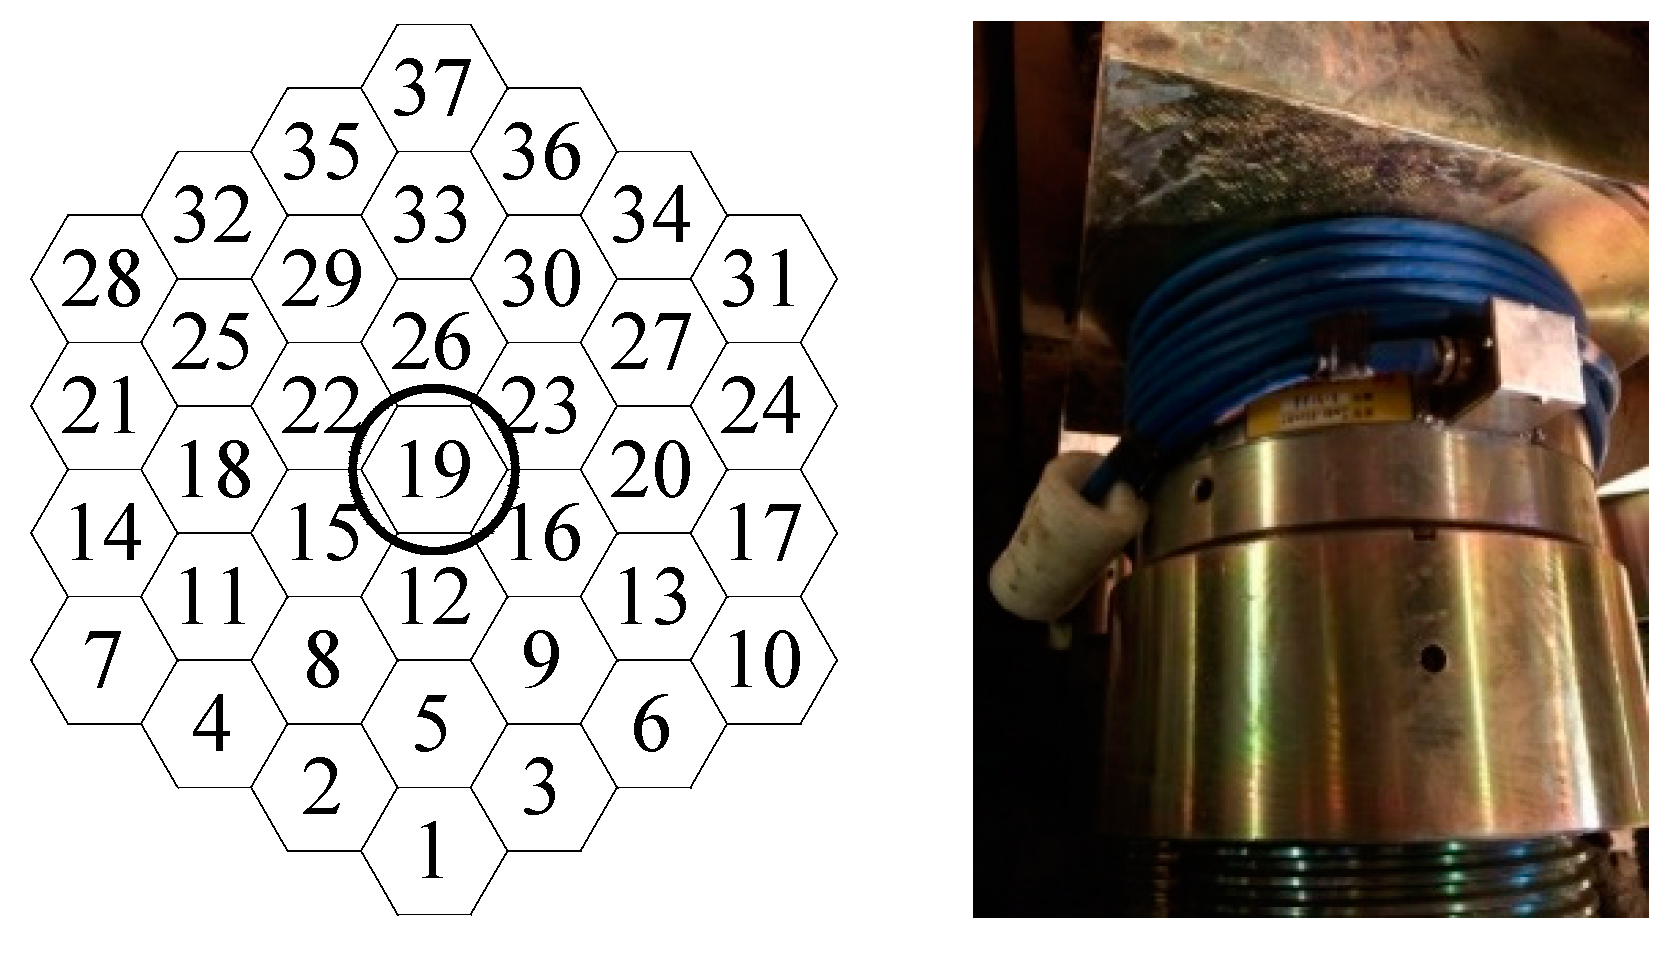
Applsci 09 02576 g013
Figure 14. Schematic diagram of cable strand and the photo of the pressure sensor installment.
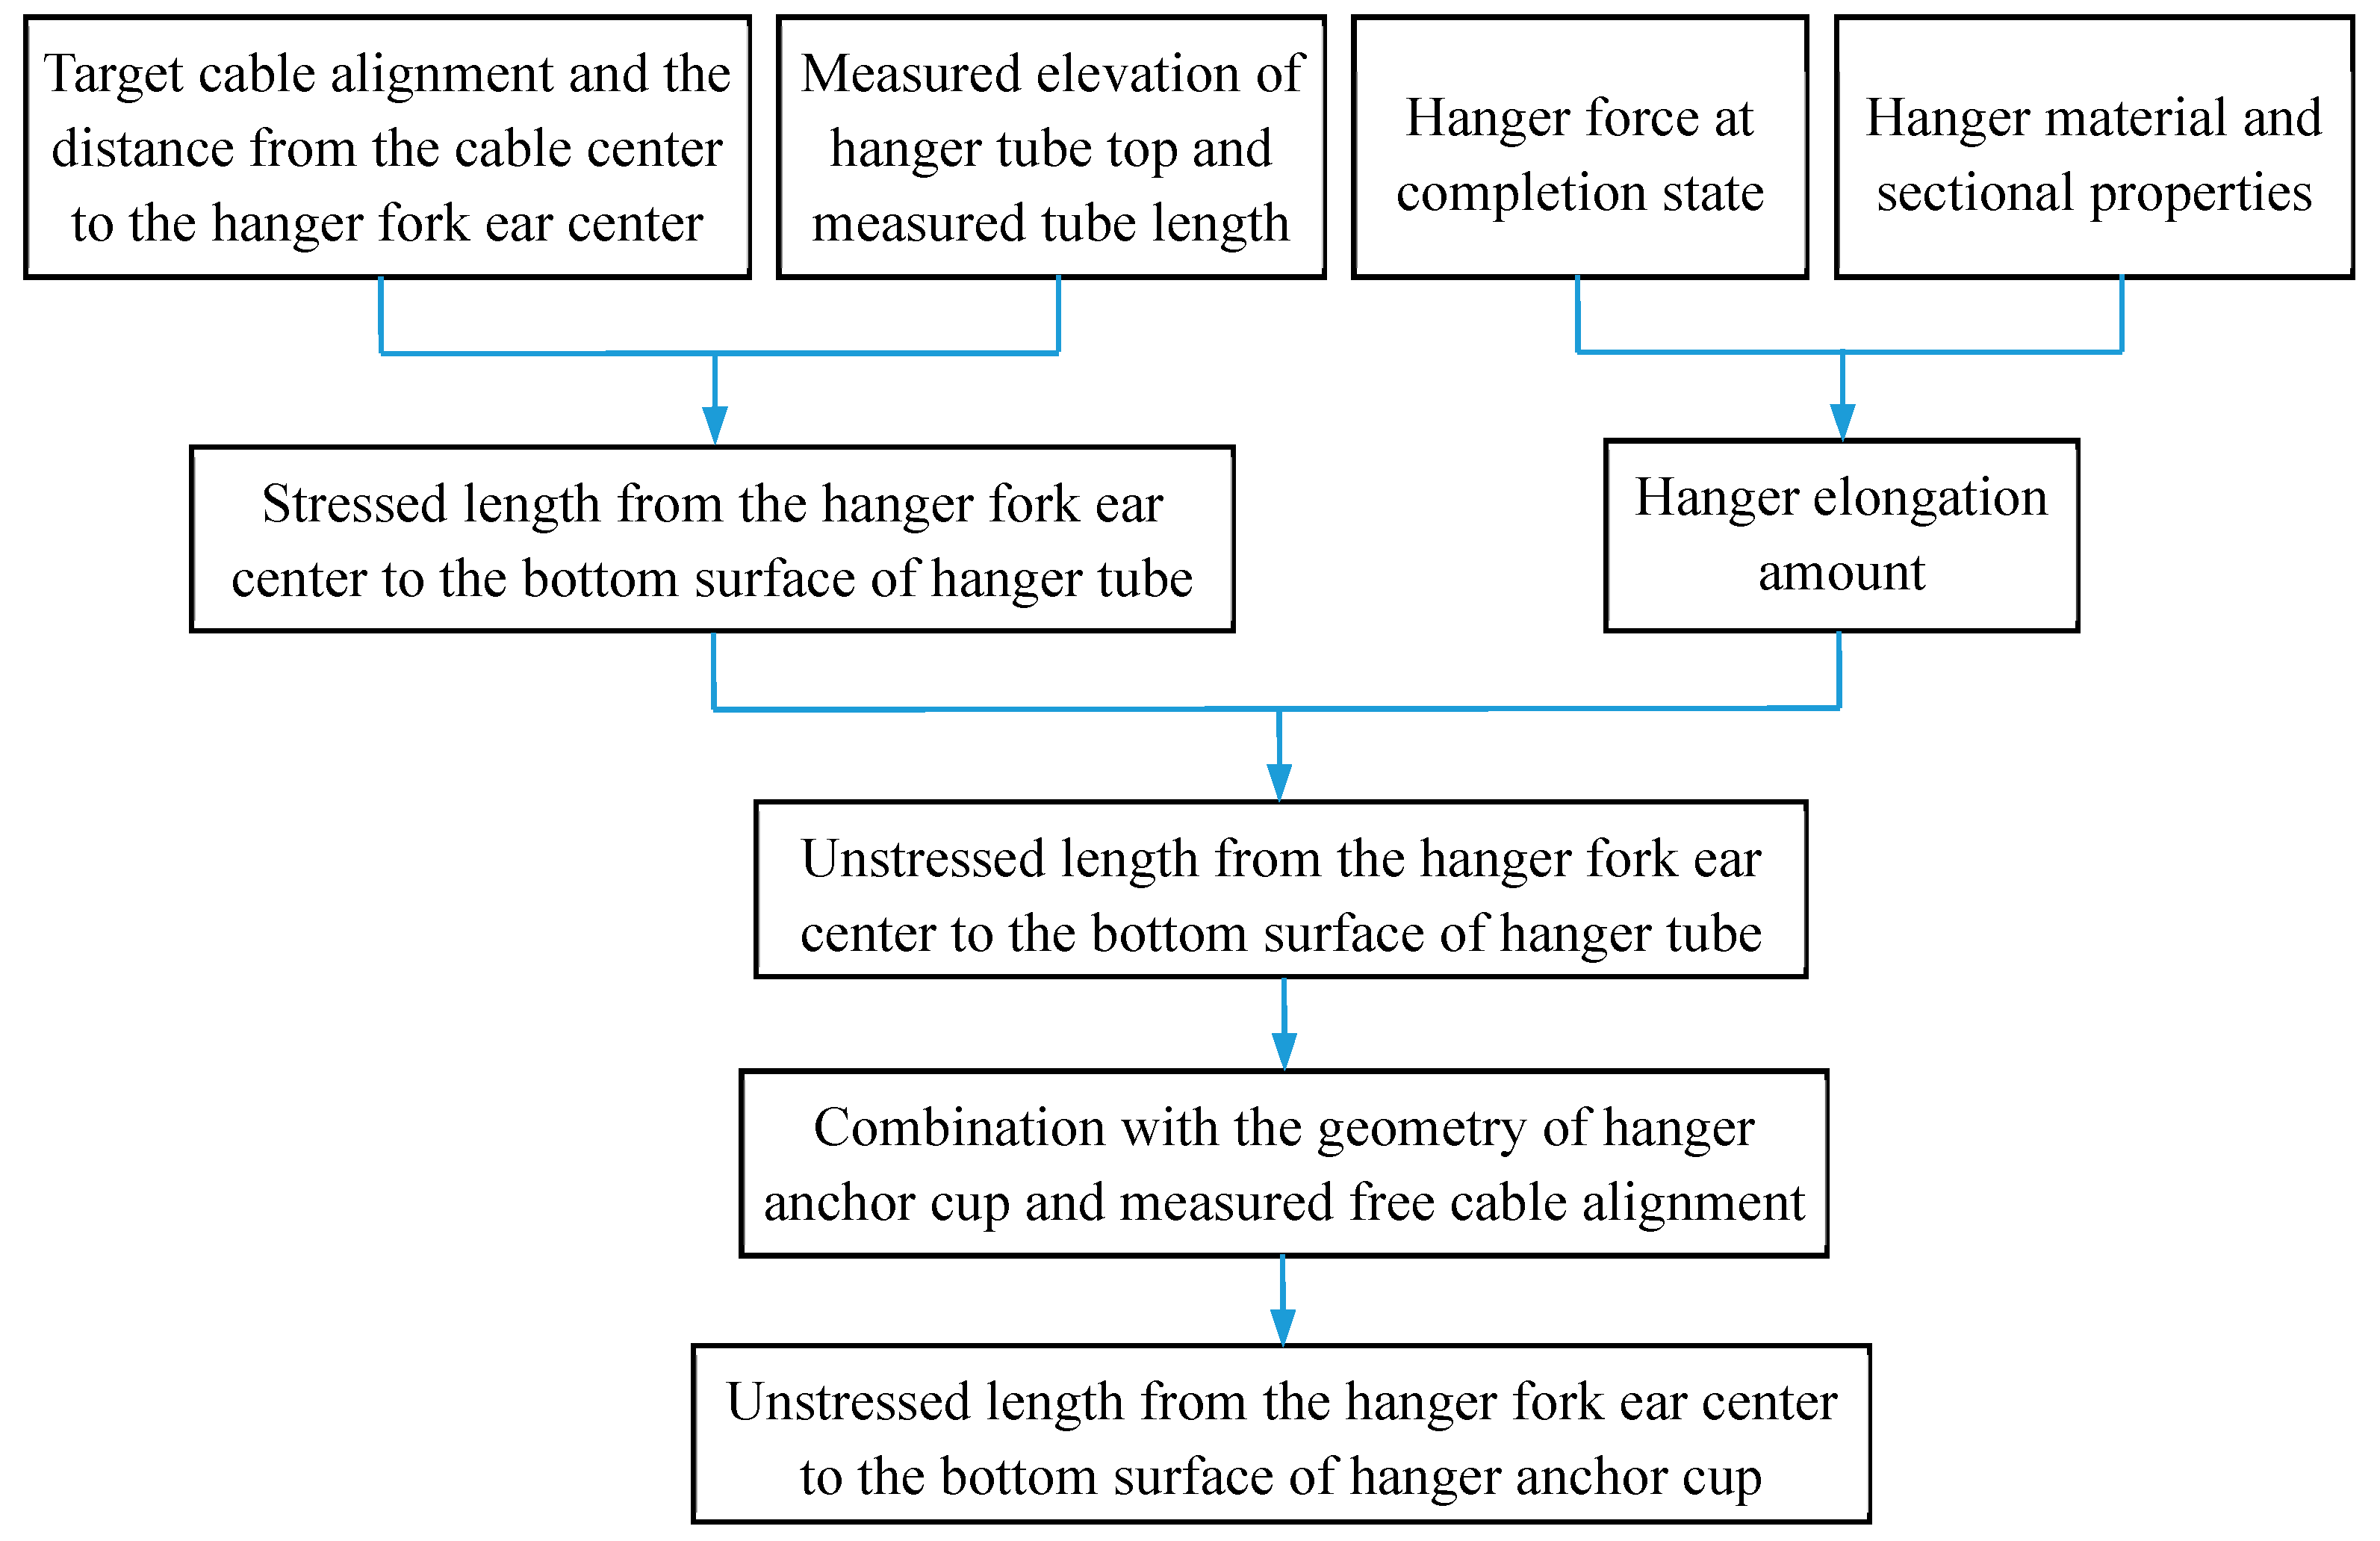
Applsci 09 02576 g014
Figure 15. Algorithm flowchart of the determination method of unstressed hanger length.
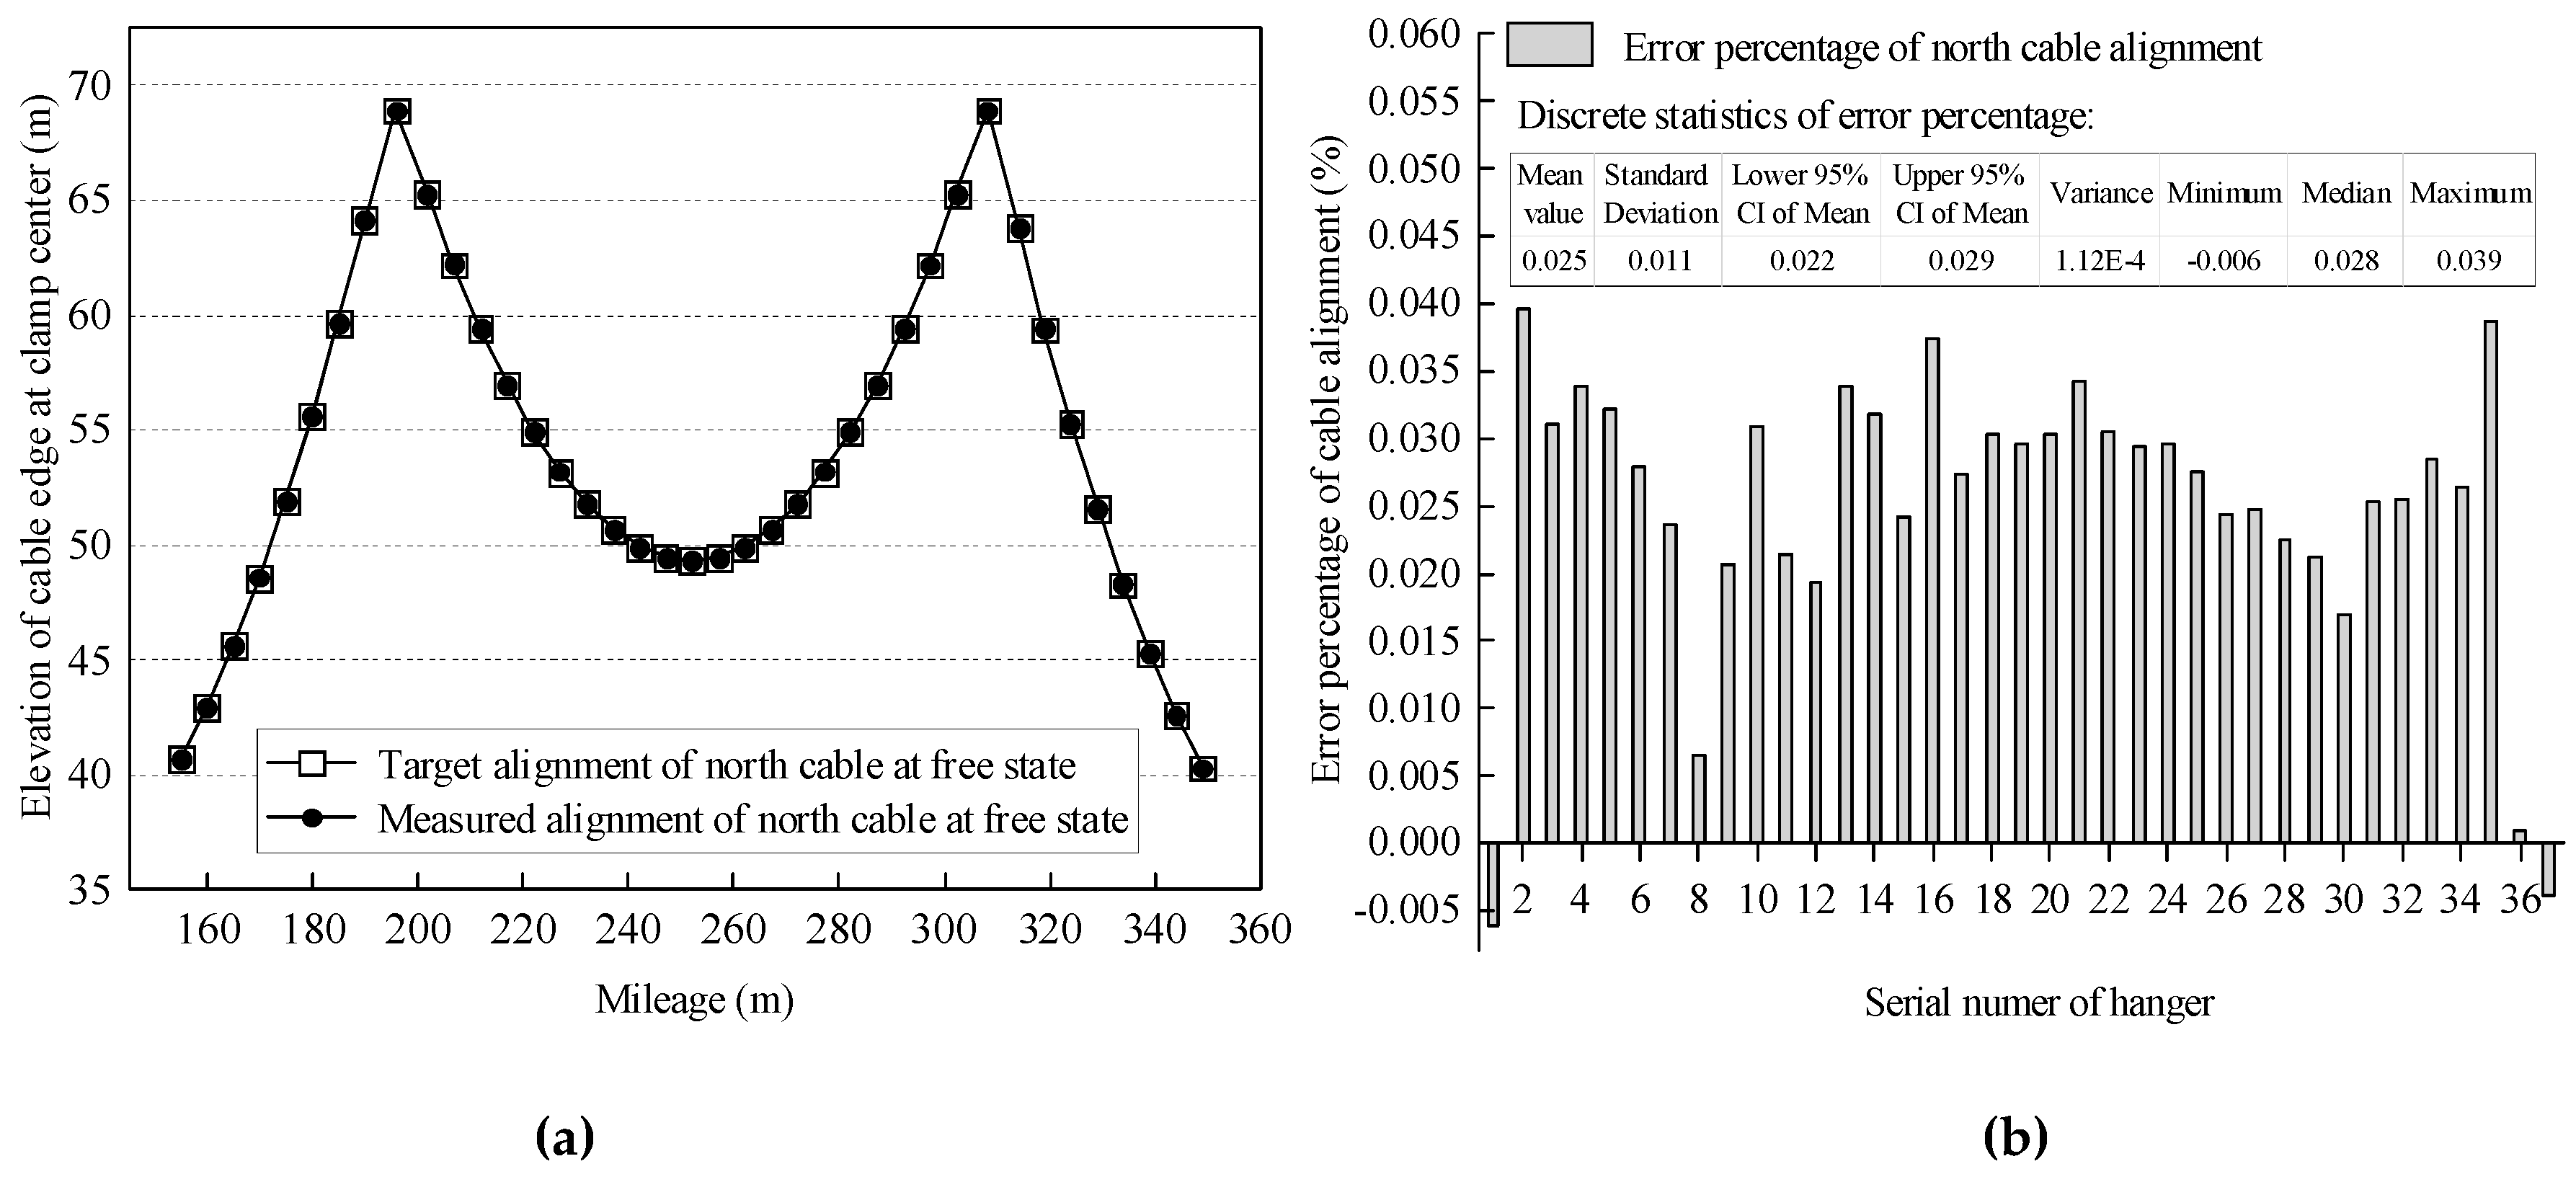
Applsci 09 02576 g015
Figure 16. Erection alignment of north cable. (a) Cable alignment. (b) Error percentage.
Applsci 09 02576 g016
Figure 17. Calculation schematic and photo of the multiple-control method for system transformation.
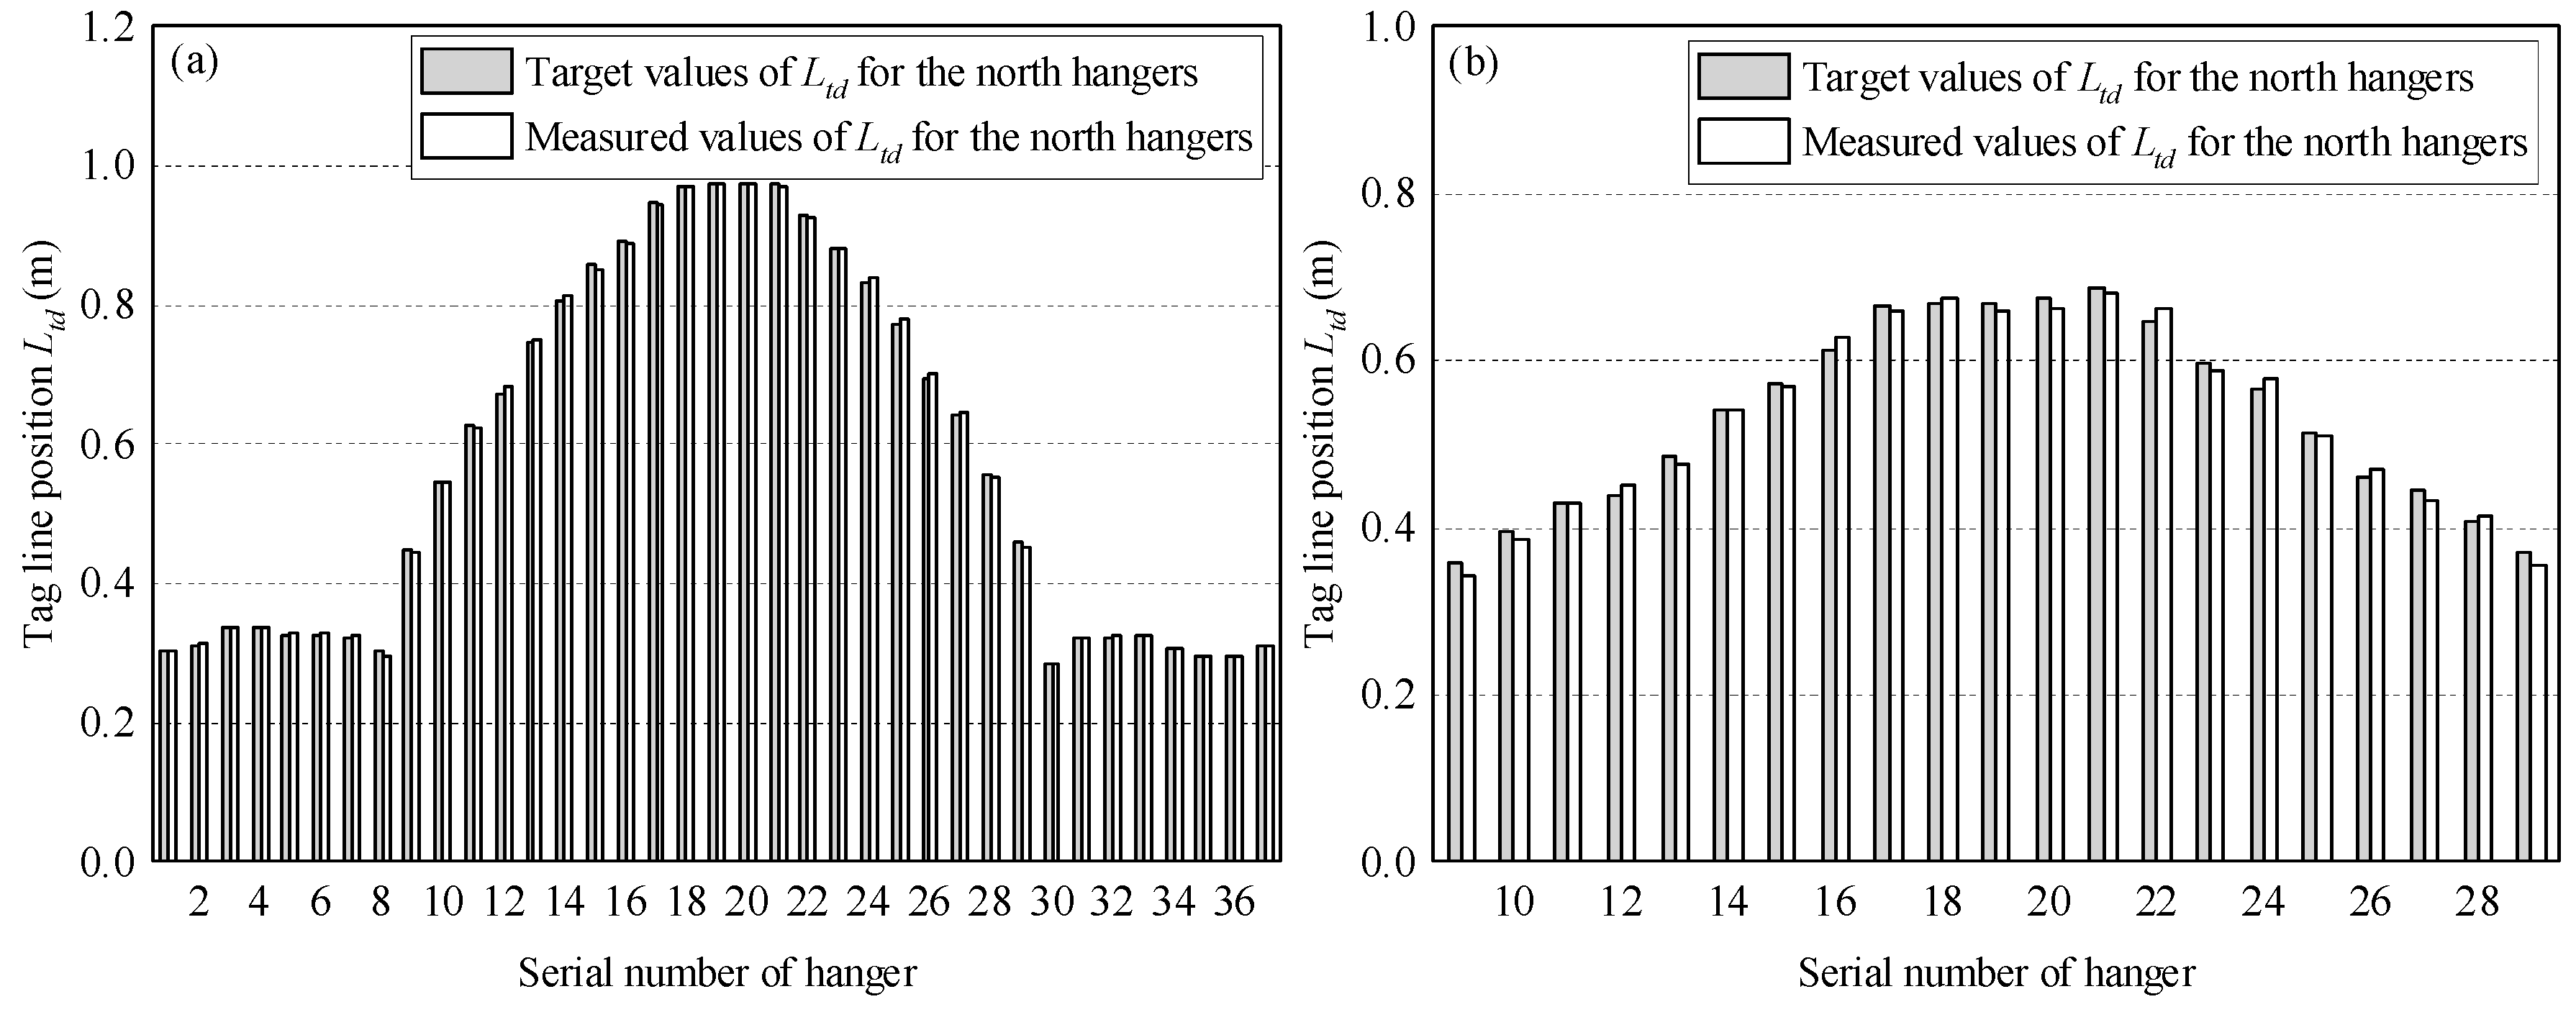
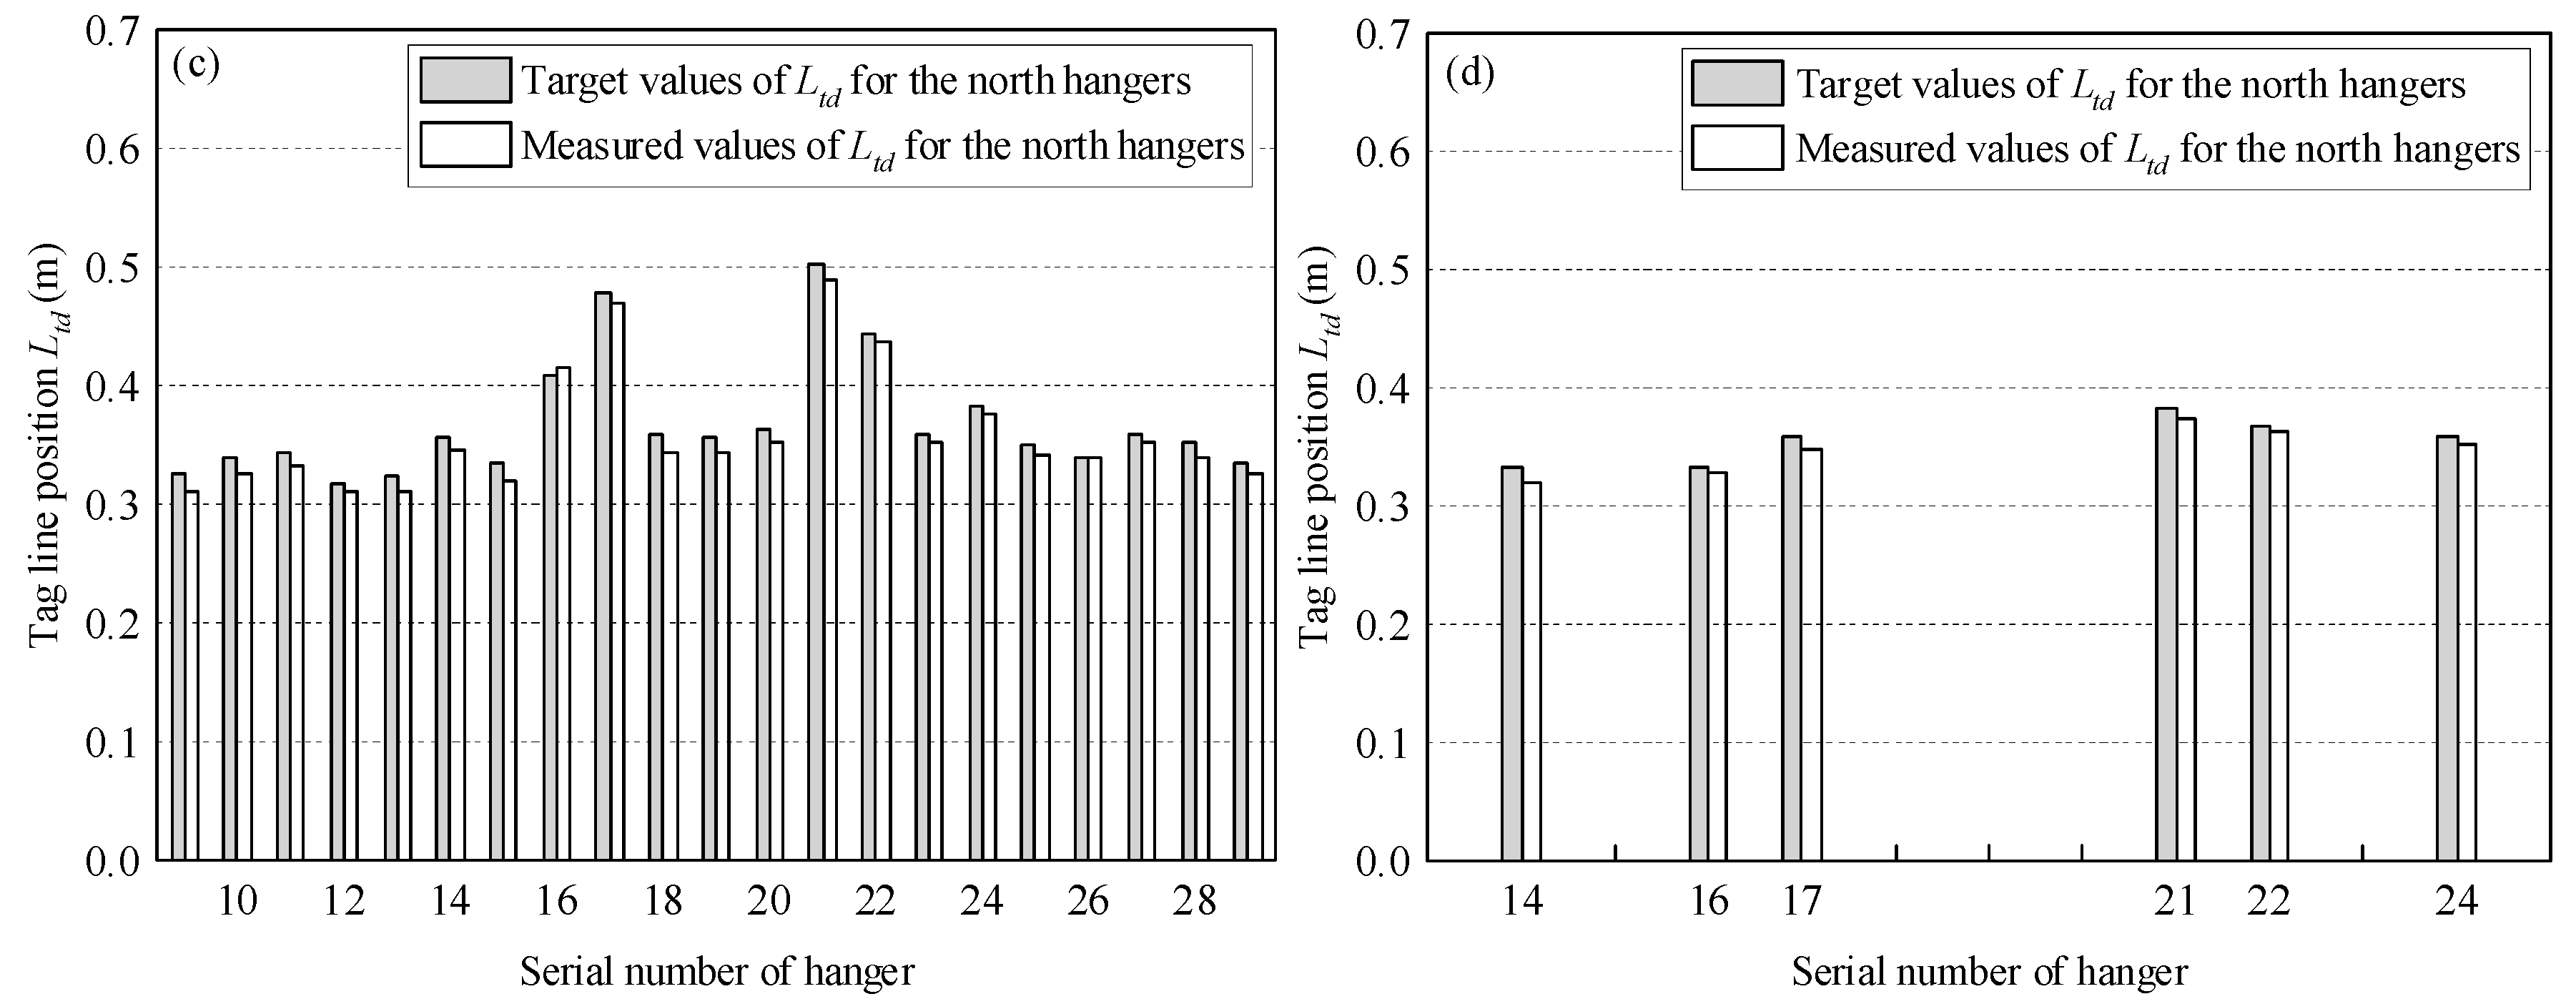
Applsci 09 02576 g017
Figure 18. Comparisons of the tag line positions of north hangers. (a) Tensioning round 1. (b) Tensioning round 2. (c) Tensioning round 3. (d) Tensioning round 4.
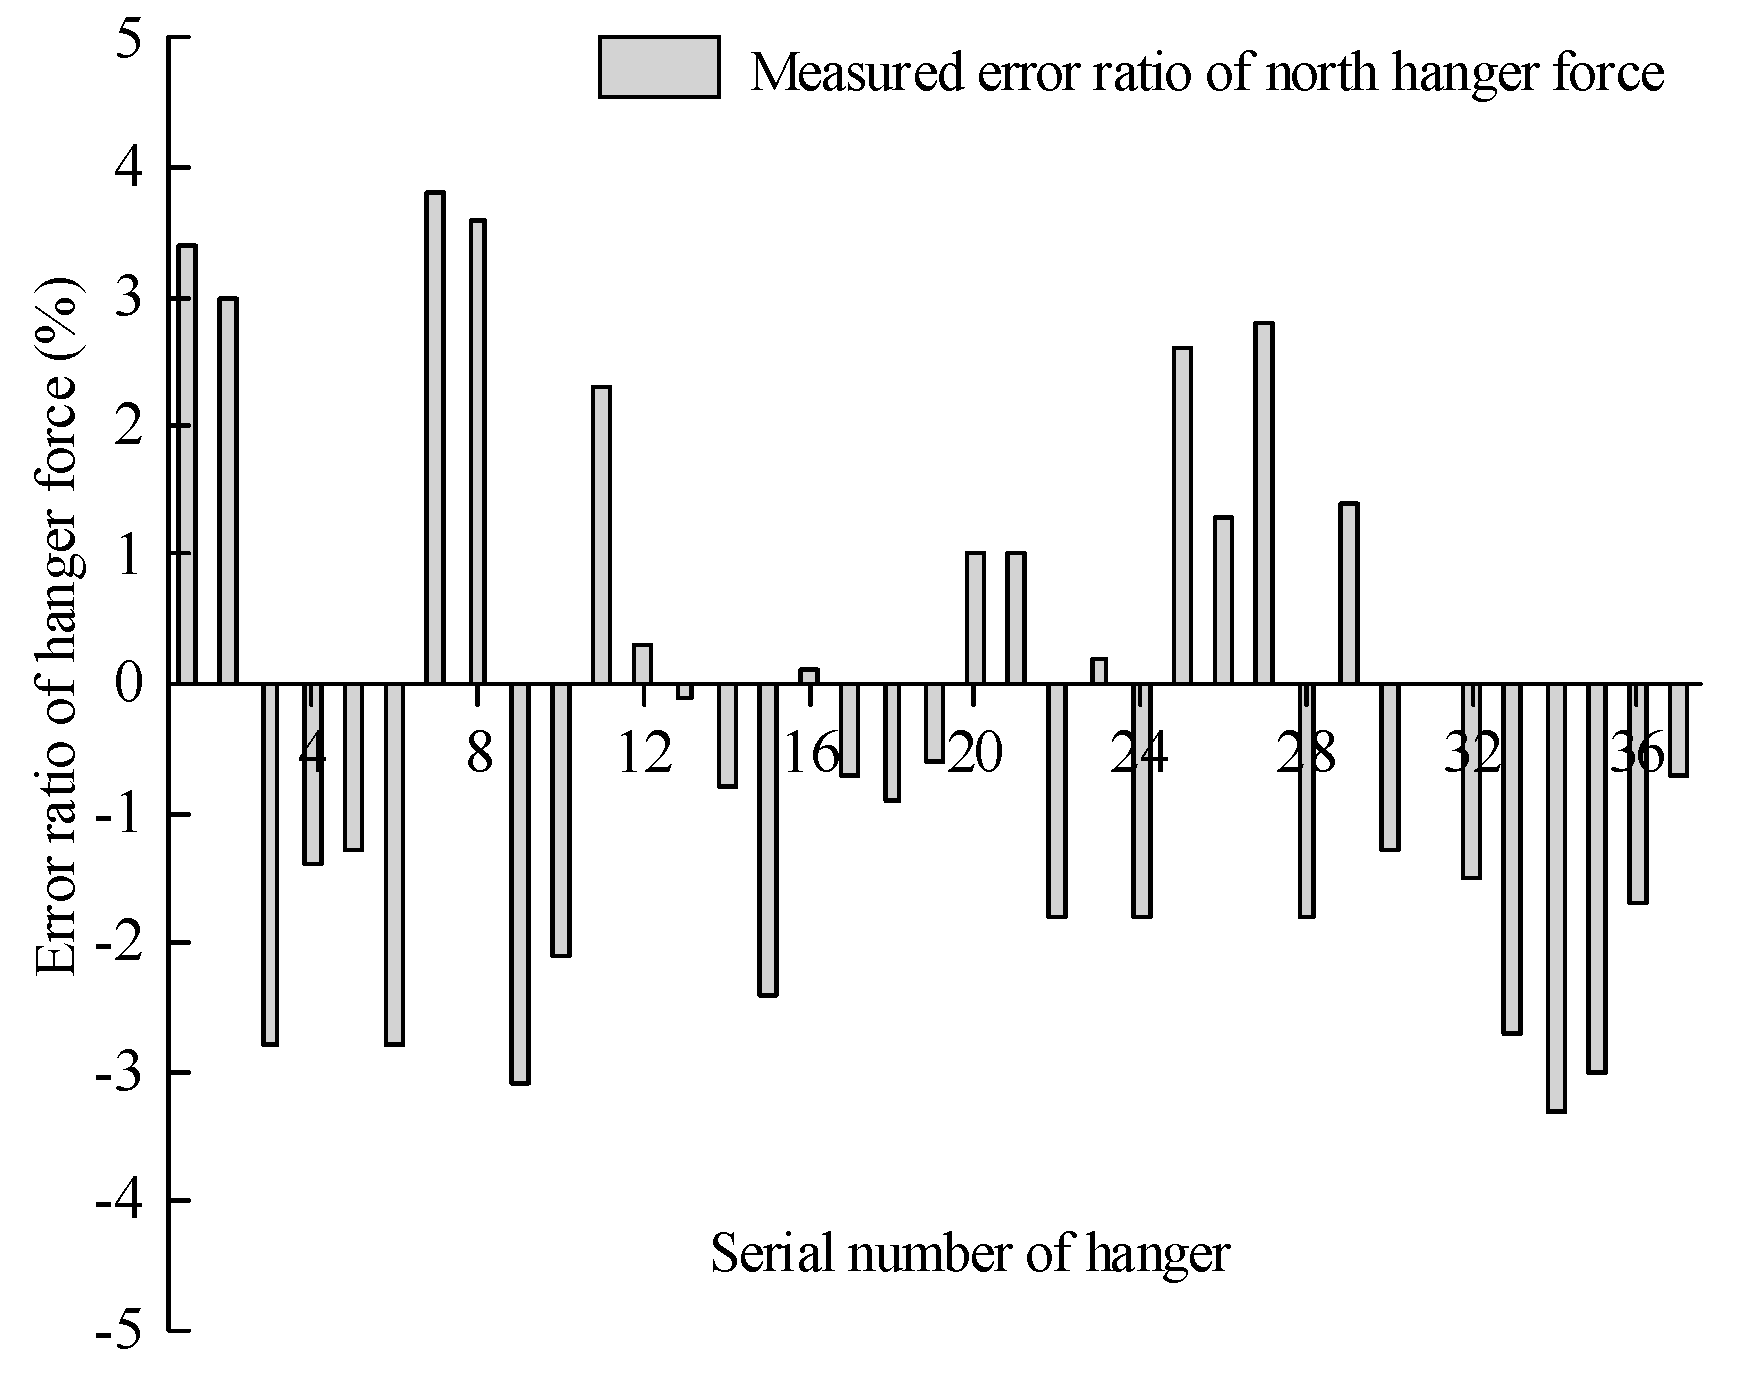
Applsci 09 02576 g018aApplsci 09 02576 g018b
Figure 19. Measured error of the final hanger force.
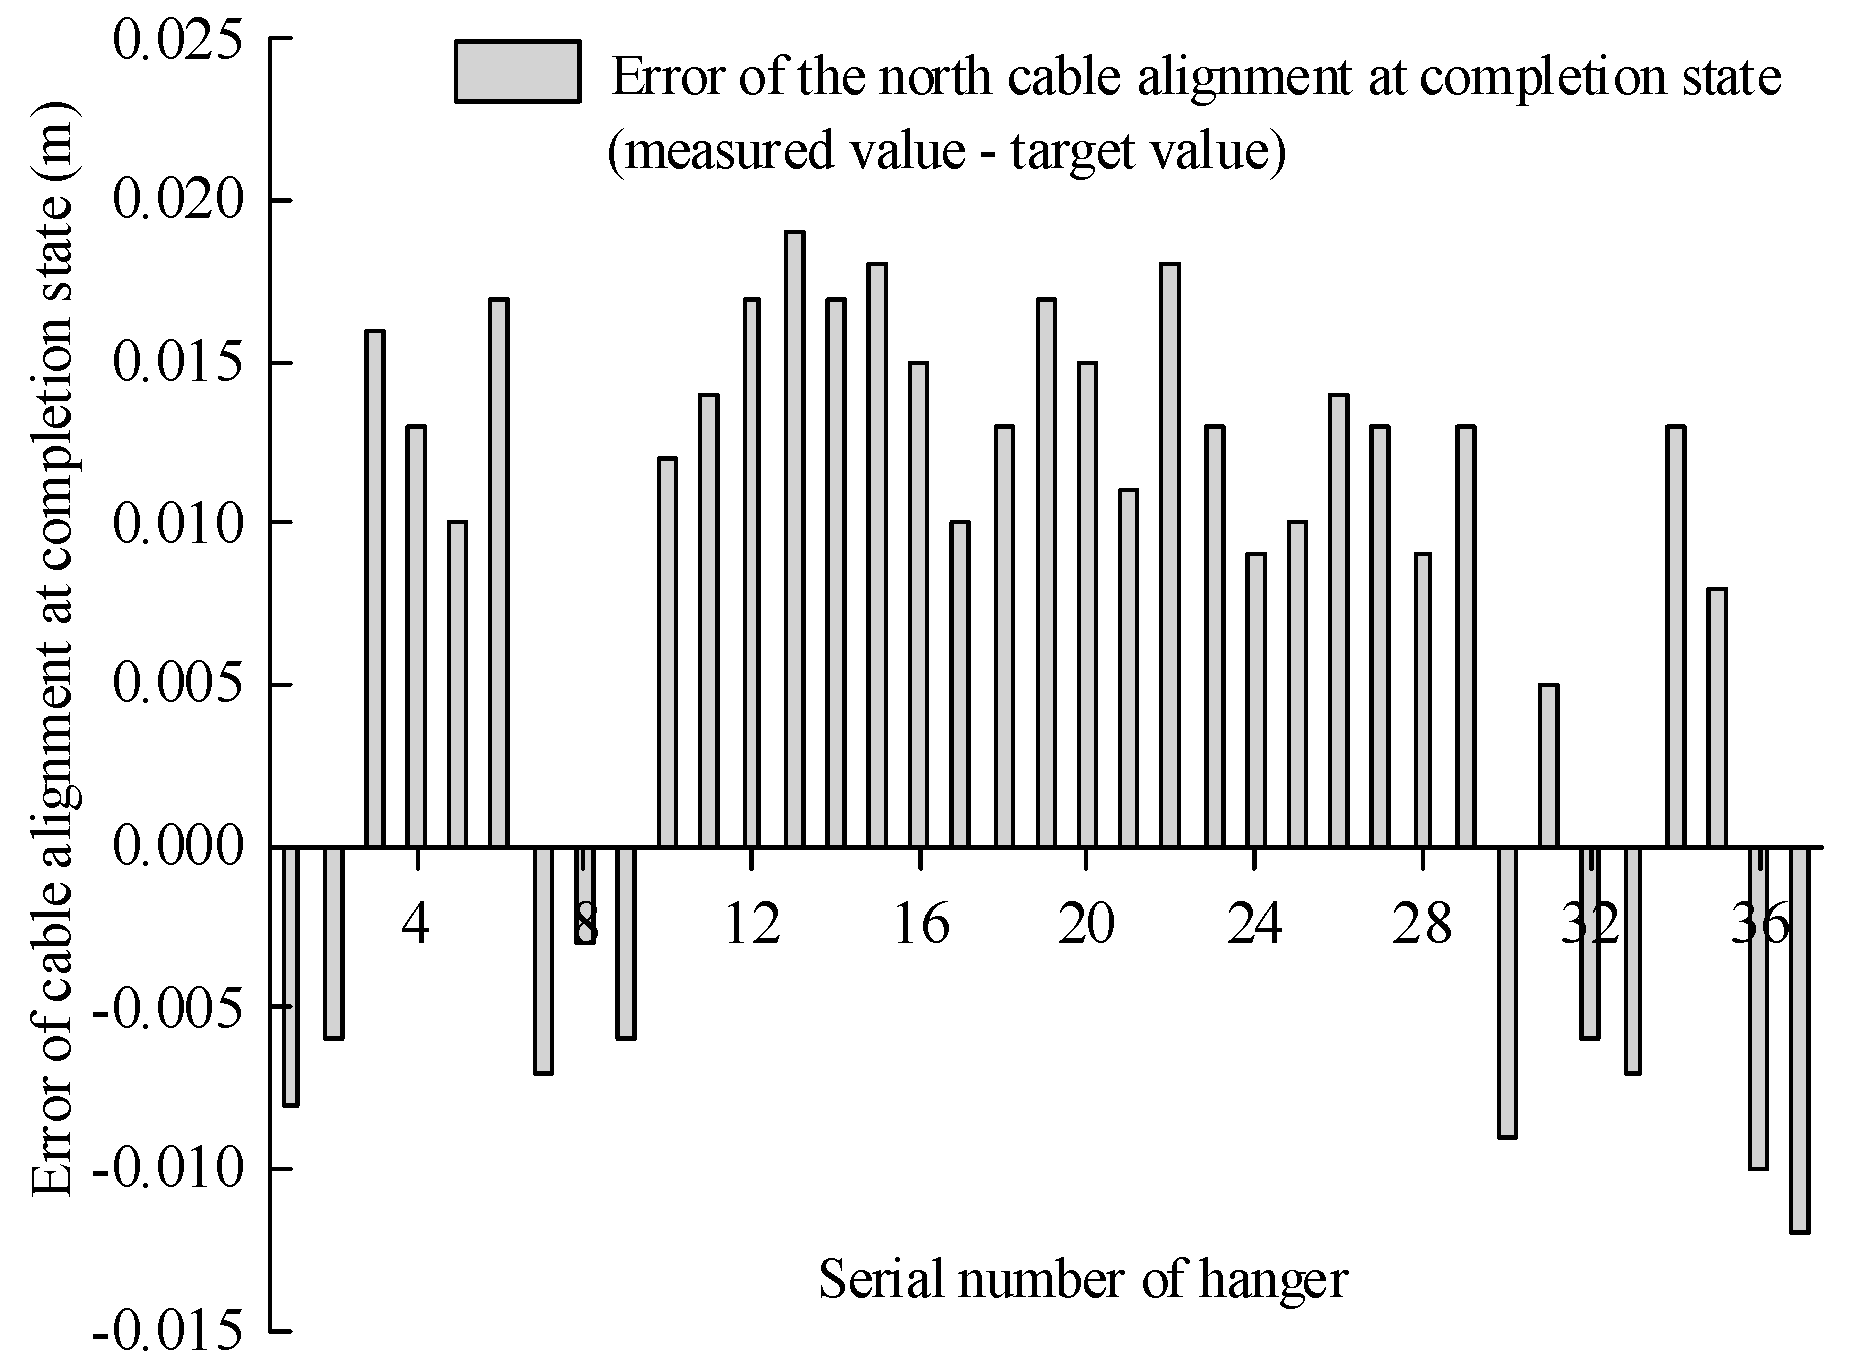
Applsci 09 02576 g019
Figure 20. Comparison of the final cable alignment.
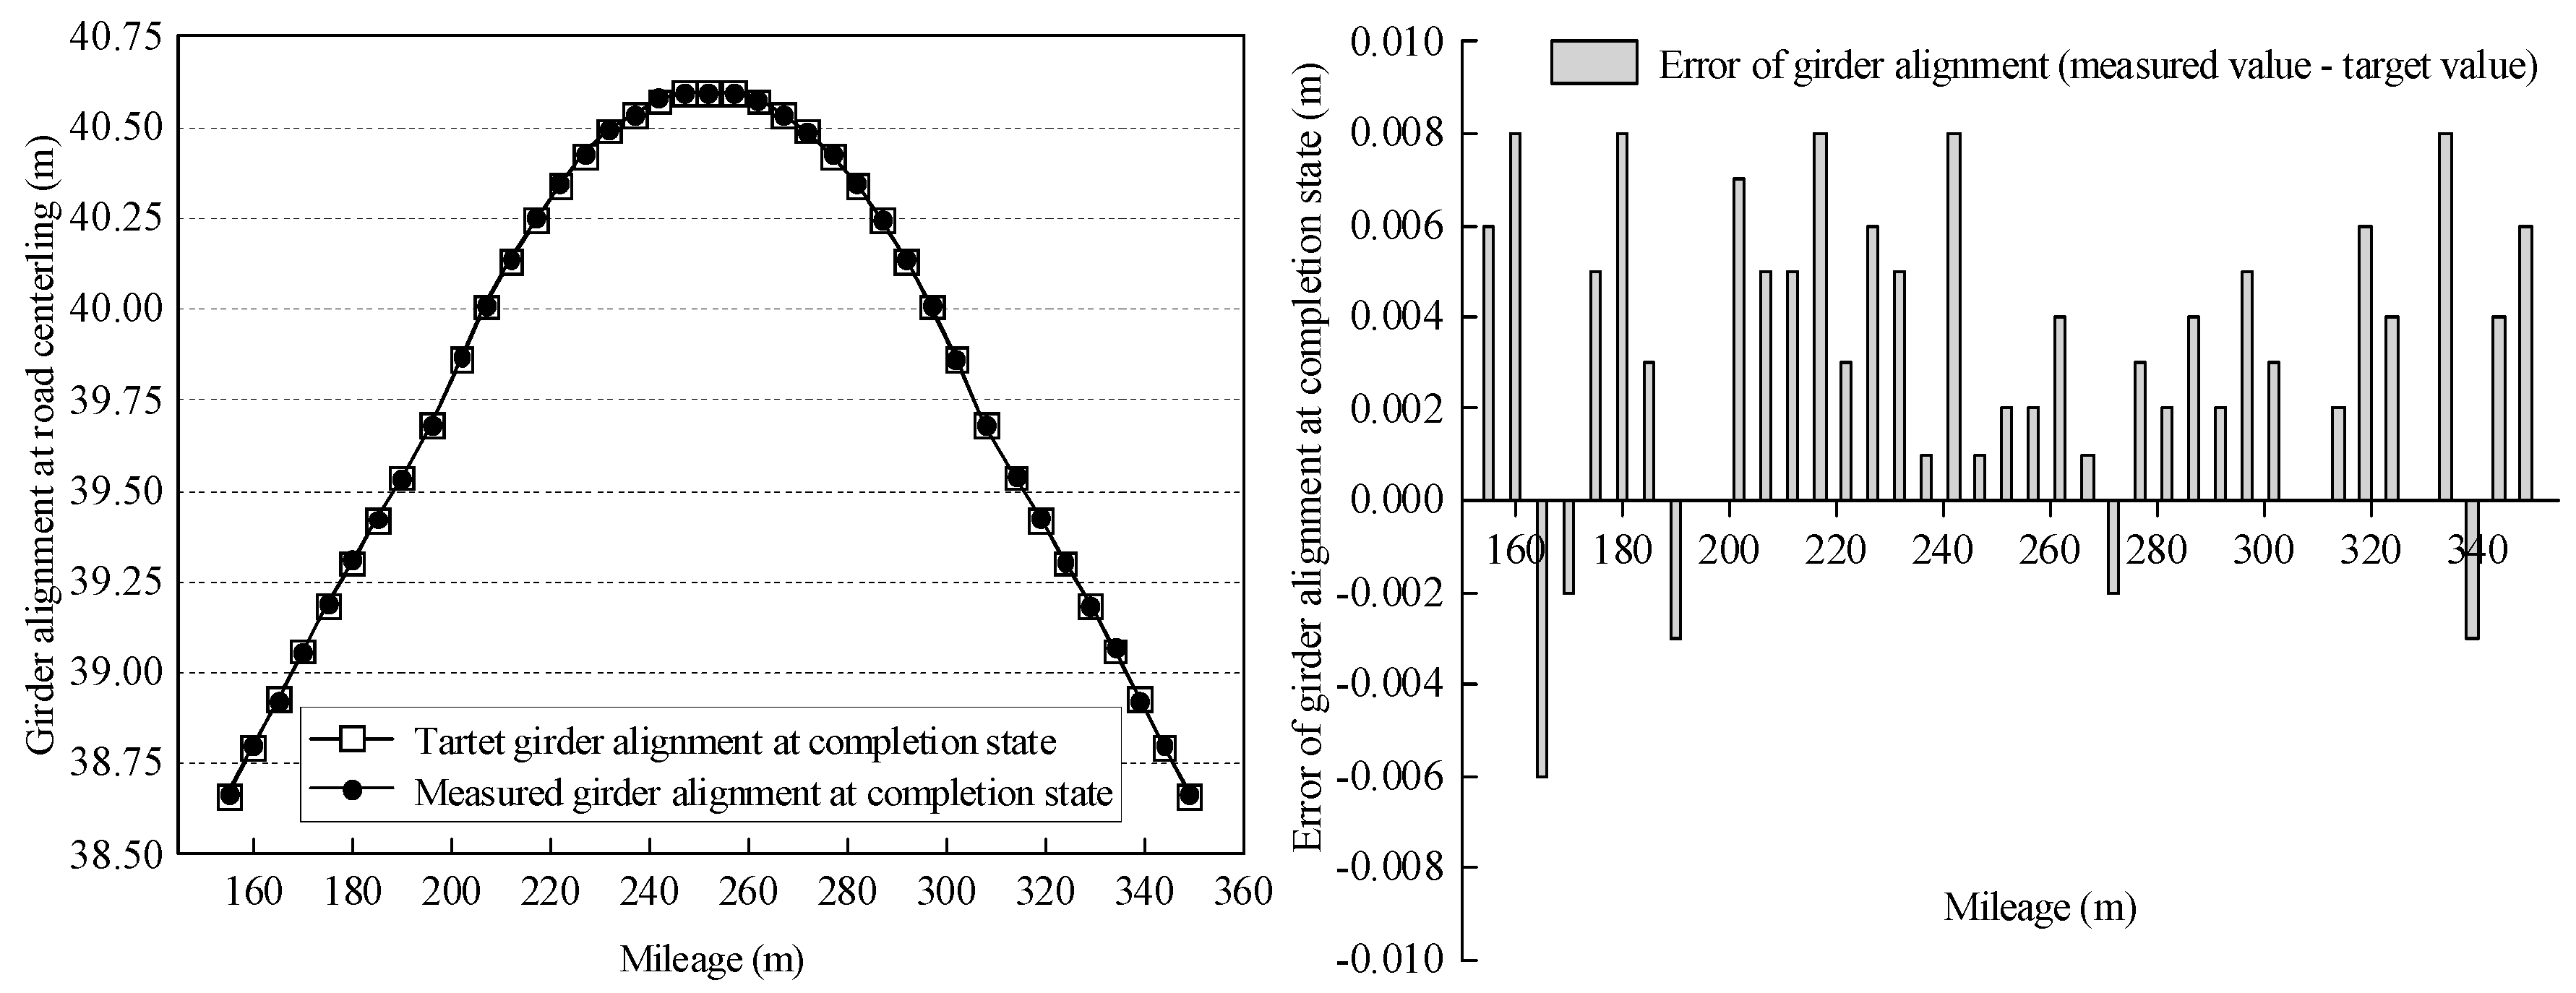
Applsci 09 02576 g020
Figure 21. Measured girder alignment at completion state and error.
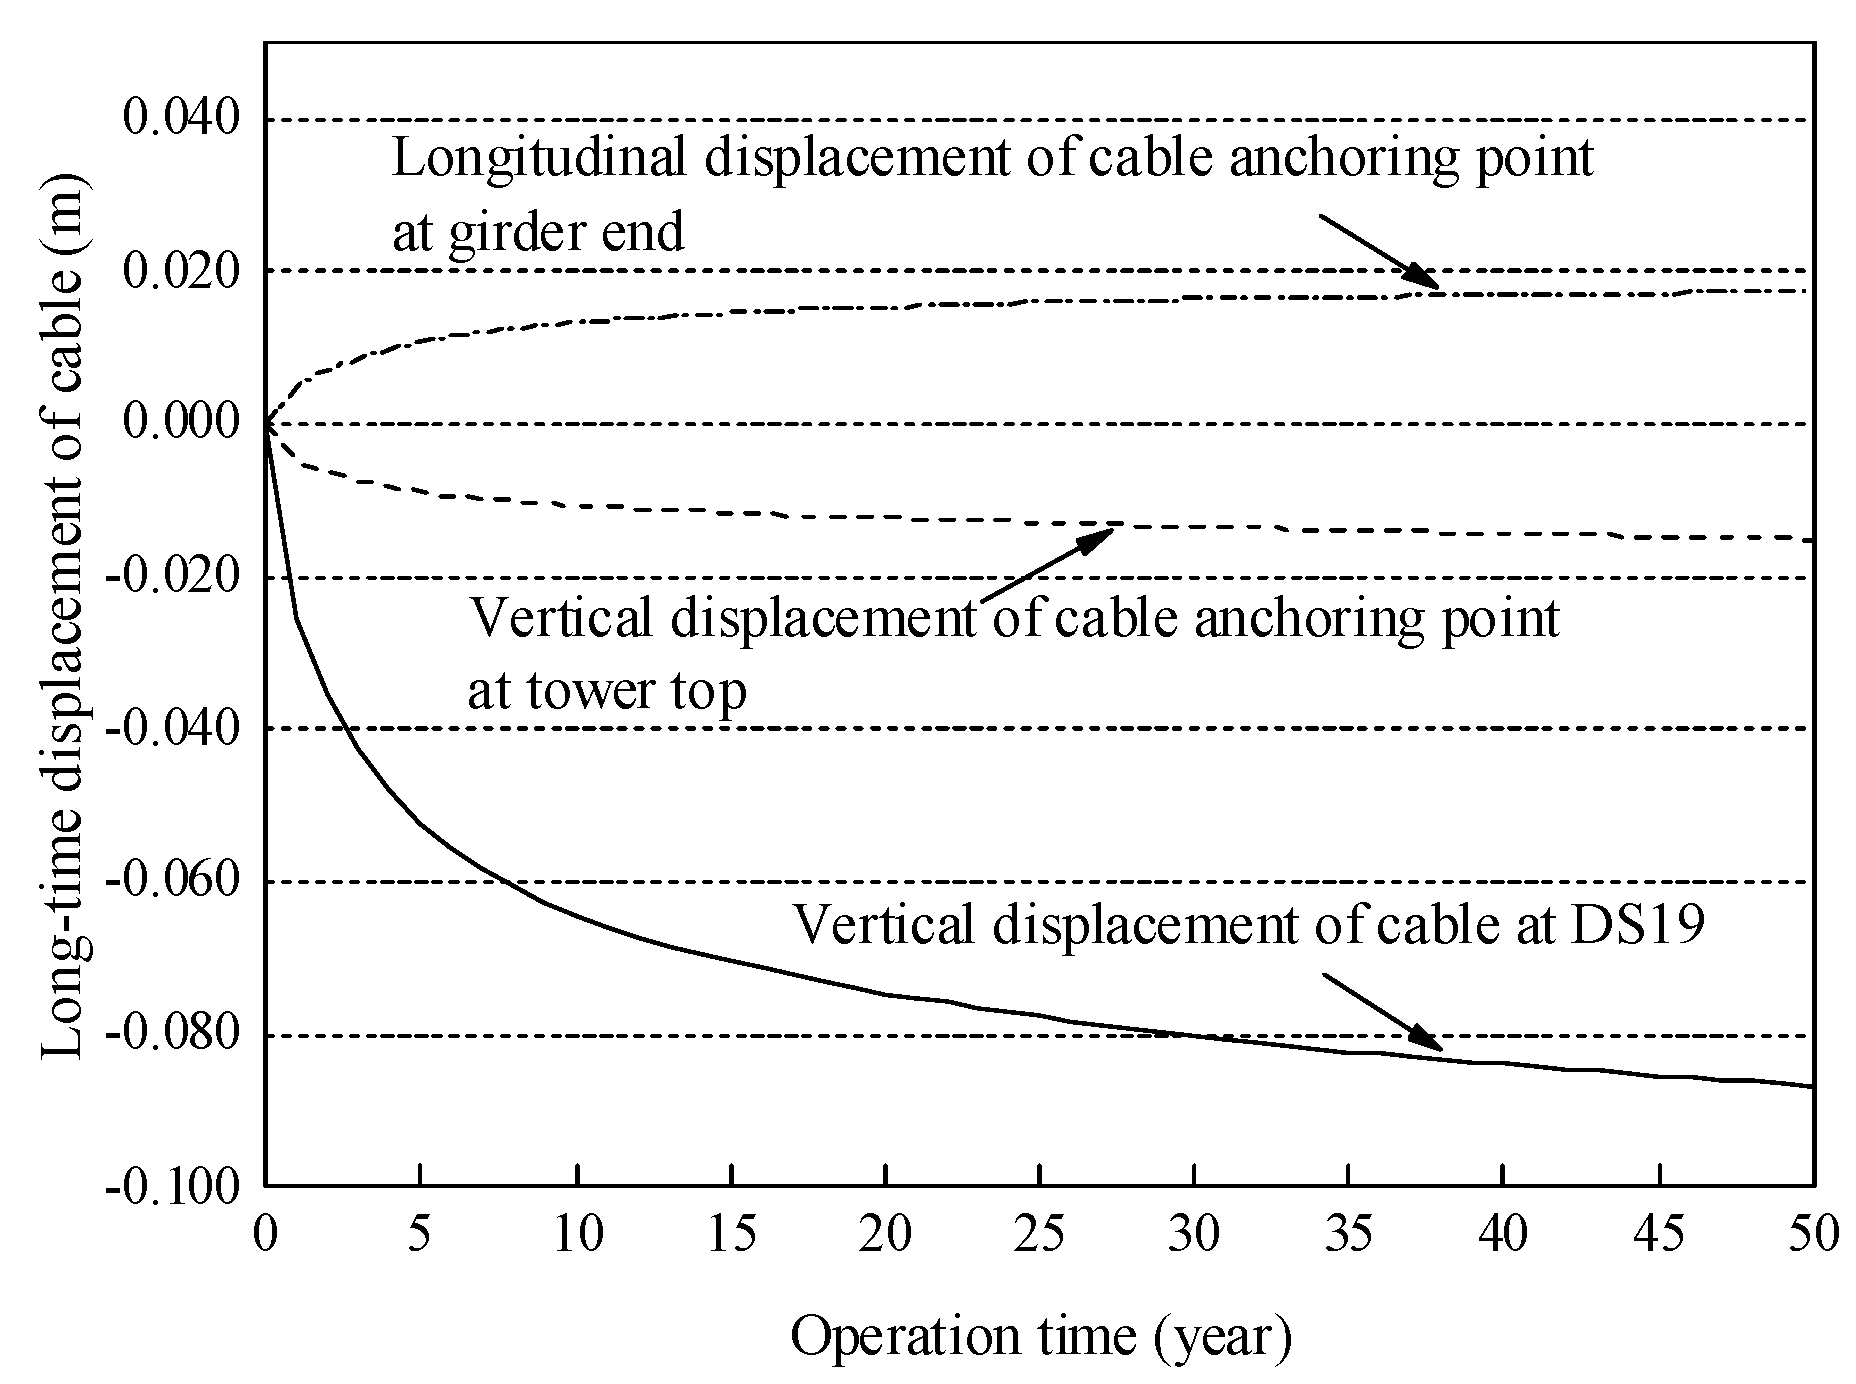
Applsci 09 02576 g021
Figure 22. Predicted cable displacement.
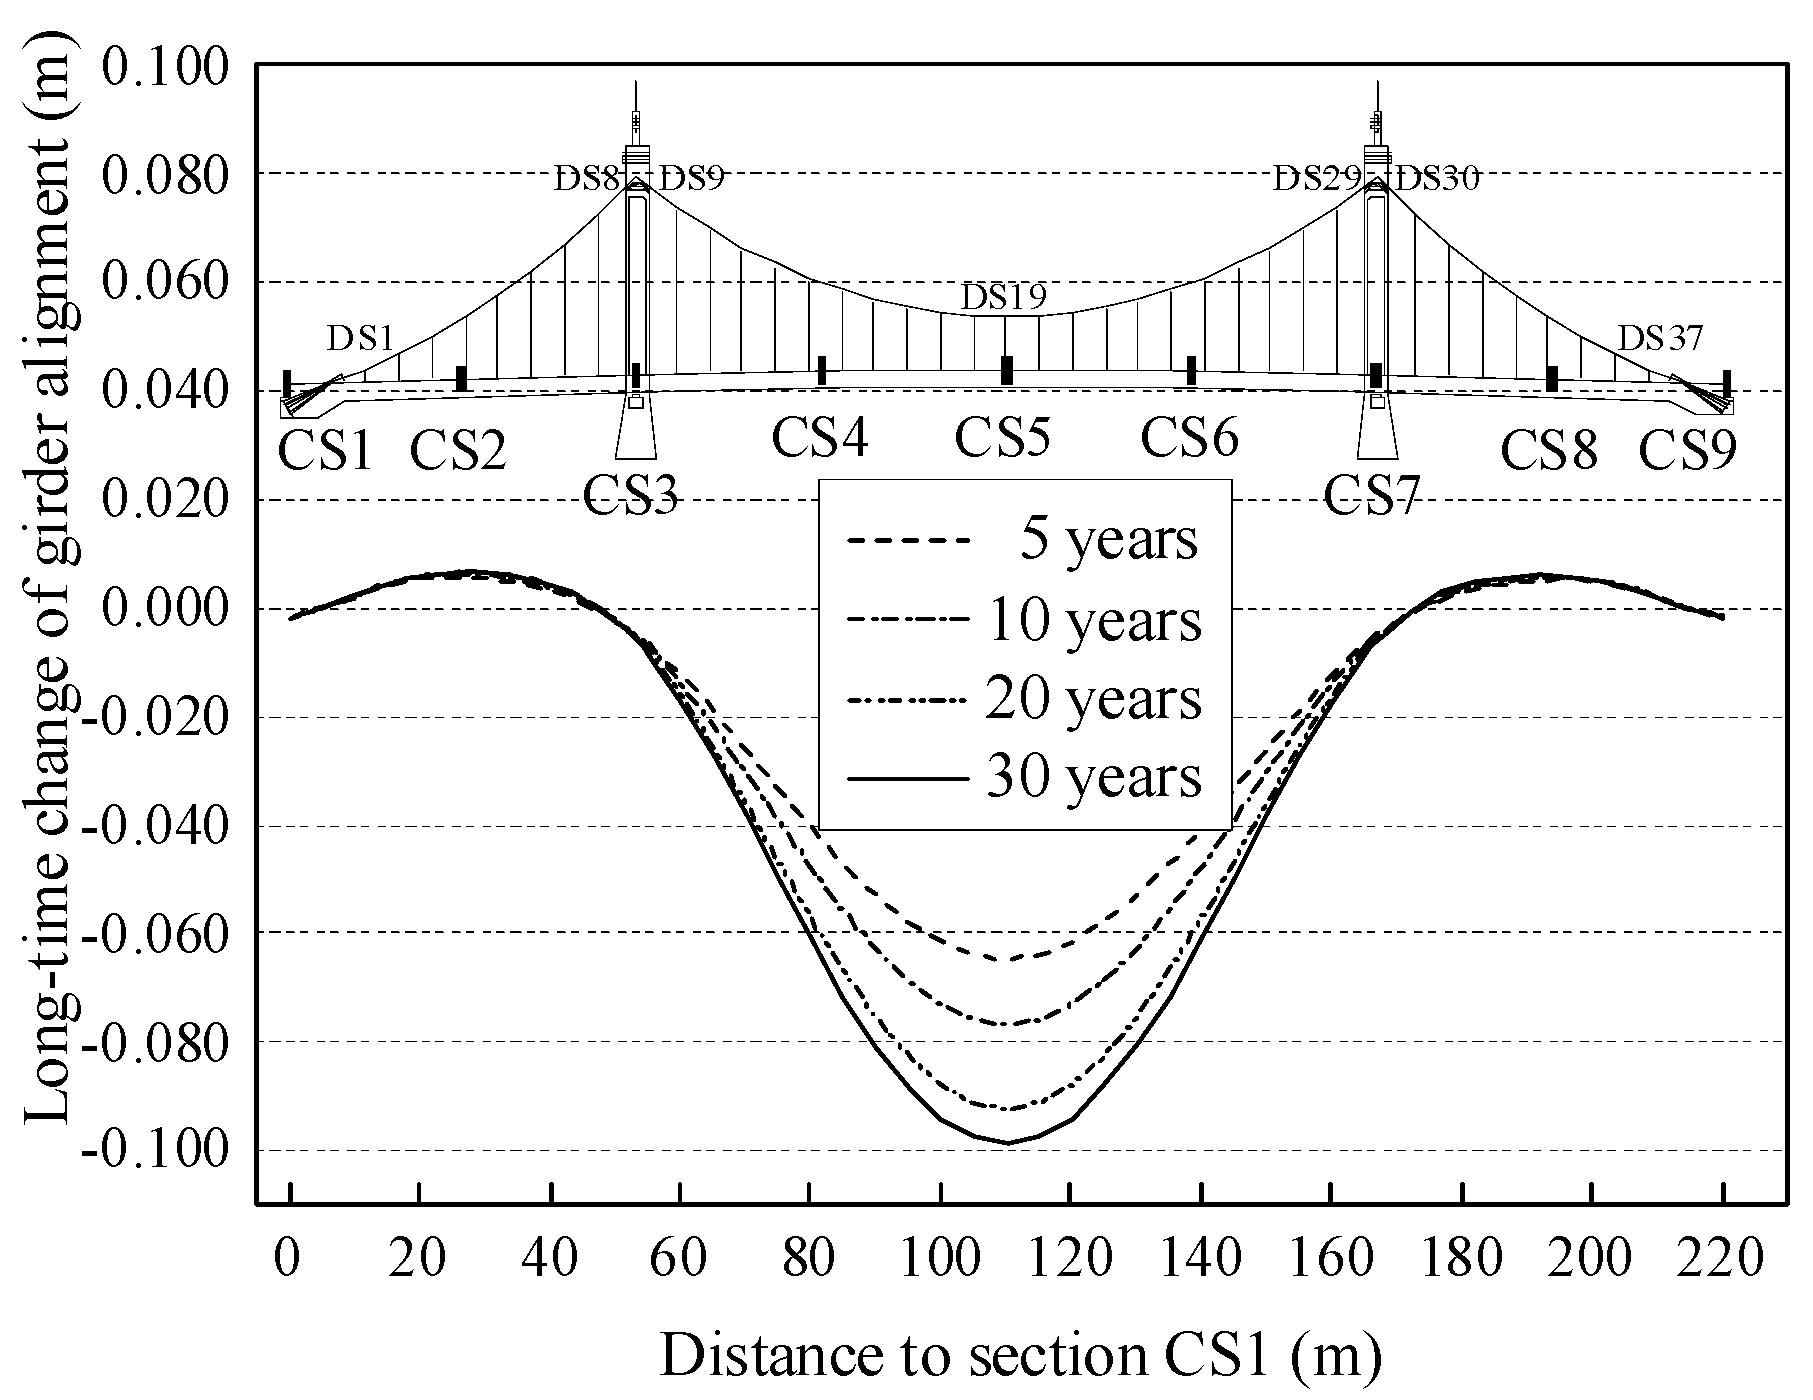
Applsci 09 02576 g022
Figure 23. Predicted girder displacement.
Applsci 09 02576 g023
Table 1. Typical cross-sectional properties and material parameters of the Hunan Road Bridge.
Component TypeSection Area A (m2)Elastic Modulus E (MPa)Density ρ (kg/m3)Ix (m4)Iy (m4)Iz (m4)
CableCable0.1482.00 × 1058005——————
Flexible hanger of type A4.89 × 10−32.05 × 1058005——————
Flexible hanger of type B5.35 × 10−32.05 × 1058005——————
Rigid hanger 0.0112.00 × 1058005——————
GirderMain girder13.9473.45 × 104254921.63113.809569.453
Crossbeam1.2503.45 × 10425490.499 × 10−170.6510.026
TowerMain tower8.0503.25 × 10425490.833 × 10−163.5498.218
Crossbeam3.1053.25 × 10425490.419 × 10−92.0371.510
Table 2. Specific step of tensioning round 1.
StepDescriptionStepDescription
1-1The main saddles on the west and east towers were pushed 8.6 cm and 7.1 cm respectively towards the middle.1-7DS4, DS14, DS24, DS34
1-2DS8 DS9, DS29, DS301-8DS3, DS15, DS23, DS35
1-3DS7, DS10, DS28, DS311-9DS16, DS22
1-4DS6, DS11, DS27, DS321-10DS2, DS17, DS21, DS36
1-5DS5, DS12, DS26, DS331-11DS18, DS20
1-6DS13, DS251-12DS1, DS37, DS19
Table 3. Target values of the control parameters of tensioning round 1 (Unit: m).
North SideSouth Side
HangerLsaLtdHangerLsaLtdHangerLsaLtdHangerLsaLtd
DS1-N0.2280.303DS20-N−0.4320.974DS1-S0.2340.294DS20-S−0.4430.982
DS2-N0.2290.312DS21-N−0.4340.973DS2-S0.2440.298DS21-S−0.4290.969
DS3-N0.2230.337DS22-N−0.3860.929DS3-S0.2370.305DS22-S−0.4030.942
DS4-N0.2040.335DS23-N−0.3390.882DS4-S0.2180.319DS23-S−0.3580.904
DS5-N0.2130.327DS24-N−0.2920.832DS5-S0.2230.319DS24-S−0.2990.840
DS6-N0.2170.326DS25-N−0.2290.772DS6-S0.2100.334DS25-S−0.2400.783
DS7-N0.2180.322DS26-N−0.1550.695DS7-S0.2200.318DS26-S−0.1690.709
DS8-N0.2390.303DS27-N−0.0980.641DS8-S0.2250.314DS27-S−0.1100.653
DS9-N0.0900.448DS28-N−0.0130.556DS9-S0.0750.465DS28-S−0.0330.577
DS10-N−0.0050.545DS29-N0.0830.459DS10-S−0.0170.558DS29-S0.0530.492
DS11-N−0.0830.626DS30-N0.2620.284DS11-S−0.0910.631DS30-S0.2660.313
DS12-N−0.1330.673DS31-N0.2180.322DS12-S−0.1670.704DS31-S0.2430.297
DS13-N−0.2070.746DS32-N0.2210.322DS13-S−0.2330.771DS32-S0.2380.302
DS14-N−0.2630.806DS33-N0.2170.325DS14-S−0.2870.826DS33-S0.2510.290
DS15-N−0.3160.858DS34-N0.2360.307DS15-S−0.3440.882DS34-S0.2580.282
DS16-N−0.3510.894DS35-N0.2480.294DS16-S−0.3900.933DS35-S0.2690.268
DS17-N−0.4050.949DS36-N0.2460.296DS17-S−0.4250.966DS36-S0.2700.273
DS18-N−0.4310.970DS37-N0.2190.312DS18-S−0.4410.979DS37-S0.2170.280
DS19-N−0.4320.974——————DS19-S−0.4500.989——————
Notes: The meanings of the control parameters shown in Table 3 can refer to Figure 17. The negative values of the exposed amount Lsa of the hanger anchor cup represent that the extension rods were required to realize the anchoring state. The exposed amounts of extension rods can be calculated based on the geometry size of the extension rod adopted.
Table 4. Specific step of tensioning round 2.
StepDescriptionStepDescription
2-1Saddles were pushed 1.0 cm toward the mid-span.2-7Saddles were pushed 2.1 cm toward the mid-span.
2-2DS9, DS10, DS28, DS292-8DS15, DS16, DS22, DS23
2-3Saddles were pushed 1.8 cm toward the mid-span.2-9Saddles were pushed 1.1 cm toward the mid-span.
2-4DS11, DS12, DS26, DS272-10DS17, DS21
2-5Saddles were pushed 2.0 cm toward the mid-span.2-11Saddles were pushed 1.3 cm toward the mid-span.
2-6DS13, DS14, DS24, DS252-12DS18, DS19, DS20
Table 5. Target values of the control parameters of tensioning round 2.
North SideSouth Side
HangerP (kN)Ltd (m)HangerP (kN)Ltd (m)HangerP (kN)Ltd (m)HangerP (kN)Ltd (m)
DS9-N17000.359DS20-N23400.674DS9-S17000.376DS20-S23400.682
DS10-N21500.397DS21-N38000.689DS10-S21500.410DS21-S38000.686
DS11-N16500.431DS22-N35500.648DS11-S16500.436DS22-S35500.661
DS12-N27000.440 DS23-N22000.598DS12-S27000.471DS23-S22000.620
DS13-N19500.487DS24-N31000.566DS13-S19500.512DS24-S31000.574
DS14-N31000.540DS25-N19500.513DS14-S31000.560DS25-S19500.524
DS15-N22000.574DS26-N27000.462DS15-S22000.598DS26-S27000.476
DS16-N35500.613DS27-N16500.446DS16-S35500.652DS27-S16500.458
DS17-N38000.666DS28-N21500.408DS17-S38000.683DS28-S21500.429
DS18-N23400.670DS29-N17000.370DS18-S23400.679DS29-S17000.403
DS19-N23400.669 ——————DS19-S23400.685 ——————
Table 6. Specific steps of tensioning rounds 3 and 4.
StepDescriptionStepDescription
3-1Saddles were pushed 0.3 cm toward the mid-span.3-9Saddles were pushed 0.5 cm toward the mid-span.
3-2DS9, DS10, DS28, DS293-10DS17, DS21
3-3Saddles were pushed 0.8 cm toward the mid-span.3-11Saddles were pushed 1.0 cm toward the mid-span.
3-4DS11, DS12, DS26, DS273-12DS18, DS19, DS20
3-5Saddles were pushed 1.4 cm toward the mid-span.4-1Saddles were pushed 0.1 cm toward the mid-span.
3-6DS13, DS14, DS24, DS254-2DS14, DS24
3-7Saddles were pushed 1.6 cm toward the mid-span.4-3Saddles were pushed 1.4 cm toward the mid-span.
3-8DS15, DS16, DS22, DS234-4DS16, DS17, DS21, DS22
Table 7. Target values of the control parameters of tensioning round 3.
North SideSouth Side
HangerP (kN)Ltd (m)HangerP (kN)Ltd (m)HangerP (kN)Ltd (m)HangerP (kN)Ltd (m)
DS9-N28500.327DS20-N40300.363DS9-S28500.343DS20-S40300.371
DS10-N30100.341DS21-N40000.503DS10-S30100.354DS21-S40000.500
DS11-N26500.345DS22-N40000.445DS11-S26500.350DS22-S40000.458
DS12-N36200.318DS23-N37500.360DS12-S36200.349DS23-S37500.381
DS13-N30500.325DS24-N40000.383DS13-S30500.350DS24-S40000.391
DS14-N40000.357DS25-N30500.351DS14-S40000.377DS25-S30500.362
DS15-N37500.335DS26-N36200.340DS15-S37500.359DS26-S36200.354
DS16-N40000.410DS27-N26500.360DS16-S40000.449DS27-S26500.372
DS17-N40000.479DS28-N30100.353DS17-S40000.496DS28-S30100.374
DS18-N40300.359DS29-N28500.336DS18-S40300.368DS29-S28500.370
DS19-N31800.358——————DS19-S31800.374——————
Table 8. Target values of the control parameters of tensioning round 4.
North SideSouth Side
HangerP (kN)Ltd (m)HangerP (kN)Ltd (m)HangerP (kN)Ltd (m)HangerP (kN)Ltd (m)
DS14-N31200.333DS21-N31200.383DS14-S31200.353DS21-S31200.380
DS16-N31200.334DS22-N31200.369DS16-S31200.373DS22-S31200.382
DS17-N31200.359DS24-N31200.359DS17-S31200.376DS24-S31200.367
Table 9. Specific step and control parameter of tensioning round 5.
StepNorth SideSouth Side
HangerP (kN)HangerP (kN)HangerP (kN)HangerP (kN)
5-1B23380B303400N43080N323080
B73500B313500N73380N333080
5-2B43140B323140N23370————
B53140B333140N103030————
B153060————N153060————
5-3B343080B363100N13620N373560
Table 10. Comparison of cable force at completion state.
LocationCableMeasured Value (kN)Target Value (kN)Error Ratio (%)
West anchor endNorth cable51763.15652945.4ࢤ2.22
South cable54320.91052951.52.59
East anchor endNorth cable51587.65252966.3ࢤ2.60
South cable51585.72552967.5ࢤ2.61
Table 11. Parametric analysis result of the influence on girder state evolution brought by final girder geometry.
Increasing Percentage of Hanger ForceCompletion State after Equilibrium AnalysisGirder State after 50 Years
Girder Lifting Amount (m)Girder Longitudinal Stress (MPa)Girder Deflection (m)Girder Longitudinal Stress (MPa)
Top PlateBottom PlateTop PlateBottom Plate
0%0.013−5.410−5.780−0.087−6.618−2.171
1%0.015−5.322−6.183−0.087−6.532−2.569
2%0.017−5.233−6.586−0.088−6.446−2.966
3%0.019−5.145−6.989−0.088−6.359−3.364
4%0.021−5.056−7.391−0.089−6.273−3.762
5%0.023−4.968−7.794−0.089−6.187−4.160

