Article

Assessing the Effect of Nano Hydrophobic Silane Silica on Aggregate-Bitumen Interface Bond Strength in the Spring-Thaw Season

1
School of Transportation, Jilin University, Changchun 130022, China
2
Research Institute of Highway, Ministry of Transport of China, Beijing 100088, China
*
Author to whom correspondence should be addressed.
Appl. Sci. 2019, 9(12), 2393; https://doi.org/10.3390/app9122393
Submission received: 14 May 2019 / Revised: 6 June 2019 / Accepted: 8 June 2019 / Published: 12 June 2019

Abstract

:

Featured Application

This paper proposed an aggregate-bitumen interface bond strength test to evaluate the effect of nano hydrophobic silane silica (NHSS) on aggregate-bitumen interface bond strength in the spring-thaw season. The results proved that the addition of NHSS could increase the aggregate-bitumen interface shear strength under any working conditions. Furthermore, the moisture damage model of aggregate-bitumen interface shear strength of NHSS modified asphalt was established based on a research method combining numerical calculations and laboratory tests, which provides suggestions for pavement construction in seasonally frozen regions.

Abstract

In the asphalt–aggregate system, the aggregate-bitumen interface cohesive and adhesive bond determine the mechanical properties of asphalt pavement. The presence of moisture leading to adhesive failure at the binder-aggregate interface and/or cohesive failure within the binder or binder-filler mastic is the main mechanisms of moisture damage in the spring-thaw season. In order to evaluate the effect of nano hydrophobic silane silica (NHSS) on aggregate-bitumen interface bond strength in the spring-thaw season, an aggregate-bitumen interface bond strength test was proposed to quantify the interface bond strength of base asphalt and NHSS modified asphalt. Then, the effect of temperature, freeze-thawing cycles and moisture on aggregate-bitumen interface shear strength of base asphalt and NHSS modified asphalt was also discussed. The results illustrated that the shear failure dominated the aggregate-bitumen interface bonding failure in the spring-thaw season, and temperature and moisture had a significant effect on interface shear strength of modified and unmodified asphalt. Moreover, the addition of NHSS could increase the aggregate-bitumen interface shear strength under any working conditions. Furthermore, the moisture damage model of aggregate-bitumen interface shear strength of base asphalt (BA) and NHSS modified asphalt was established based on a research method combining numerical calculations and laboratory tests.

1. Introduction

Asphalt mixture has been widely used in the world as the main construction material for pavement because of the advantages including good mechanical strength, smooth ride, low noise, convenient construction and maintenance [1,2,3,4,5,6,7]. However, the increase of traffic and the damage from external environmental factors leads to all kinds of pavement diseases, which shorten the service life and increase the maintenance costs [8,9,10,11,12].
Among various pavement diseases, moisture damage is one of the main diseases of early failure of asphalt pavement as it accelerates or causes some typical pavement diseases such as rutting raveling and road surface settlement cracking [13,14,15,16,17,18]. Especially in seasonally frozen regions, moisture damage is a very serious disease of asphalt pavement caused by the freeze-thaw cycle and dynamic pore water pressure. In the asphalt–aggregate system, the aggregate-bitumen interface cohesive and adhesive bond determine the mechanical properties of asphalt pavement. The loss of cohesion (strength) and stiffness of the asphalt film, and the failure of the adhesive bond between aggregate and asphalt in conjunction with the degradation or fracture of the aggregate were identified as the main mechanisms of moisture damage in the spring-thawing season [19,20,21].
In recent years, many researchers around the world made great efforts into exploring the moisture damage mechanism at the aggregate-bitumen interface through numerical calculations or laboratory tests [22,23,24]. Zhang et al. evaluated the moisture sensitivity of aggregate-bitumen bonds with moisture absorption, tensile strength, and failure surface examination. The results showed that the linear relationship between retained tensile strength and the square root of moisture uptake suggests that the water absorption process controls the degradation of the aggregate-bitumen bond [25]. Cho et al. focused on suggesting general mechanisms to explain asphalt-aggregate bond behavior in the Dynamic Shear Rheometer (DSR) moisture damage test. The results indicated that shear-thickening and thixotropy can explain the reversible behavior, the increasing dropping trend in wet conditions in the mechanism of the colloidal system [26]. Caro et al. evaluated the influence of material properties and loading conditions on the response of asphalt mixtures subjected to a moisture environment. The results suggested that the diffusion coefficient of the asphalt matrix and aggregates, and the aggregate-matrix interface bond strength, have the most influence on the moisture susceptibility of the materials [27]. Moraes et al. investigated the feasibility of the newly developed bitumen bond strength (BBS) test for moisture damage characterization. The results indicated that modification and moisture exposure time highly affect the bond strength of asphalt-aggregate systems [28].
In order to solve these problems and extend the service life of asphalt pavements, a lot of research has been conducted on new pavement materials. The prevention approaches of moisture damage mainly focus on increasing aggregate roughness and modified asphalt [29,30,31]. Among various prevention approaches, it is generally believed that modification of asphalt binders has achieved positive significance over the last few decades [32]. Gorkem et al. determined the effect of additives, such as hydrated lime as well as elastomeric (SBS) and plastomeric (EVA) polymer modified bitumen (PMB) on the stripping potential and moisture susceptibility characteristics of hot mix asphalt. The results indicated that samples prepared with SBS PMB exhibited more resistance to water damage compared to samples prepared with EVA PMB [33]. Palit et al. showed that crumb-rubber modified mixes exhibited lower temperature susceptibility and greater resistance to moisture damage compared to normal mixes [34]. Goh et al. showed that the addition of nanoclay and carbon microfiber would improve a mixture’s moisture susceptibility performance or decrease the moisture damage potential in most cases [35].
At present, the modification of asphalt with nanomaterials has gained attention. Nano-material refers to a material with the size of less than 100 nm in at least one dimension. Due to the very small size and huge surface area, the properties of nanomaterials are much different from the normal-sized materials. The addition of these nano-sized particles to another material may overcome the monolithic limitations, and asphalt binder is no exception [36]. In our previous study, the influence of nano hydrophobic silane silica (NHSS) on the property of the asphalt binder and asphalt mixture in the spring-thaw season was discussed systematically. The results showed that the incorporation of NHSS is the most cost-effective technique for mitigating freeze-thaw cycle damage and extending the service life of asphalt pavement in the spring-thaw season [37]. In order to further understand the enhancement mechanism of NHSS in the spring-thaw season, the effect of NHSS on aggregate-bitumen interface bond strength in the spring-thaw season was systematically assessed in this study. Within this framework, an aggregate-bitumen interface bond strength test was proposed to quantify the interface bond strength of base asphalt and NHSS modified asphalt. Then, the effect of temperature, freeze-thawing cycles and moisture on aggregate-bitumen interface shear strength of base asphalt and NHSS modified asphalt was discussed. Moreover, the moisture damage model of aggregate-bitumen interface shear strength of base asphalt and NHSS modified asphalt was established, based on a research method combining numerical calculations and laboratory tests.

2. Materials and Sample Preparation

2.1. Asphalt

The base asphalt used in this paper is AH-90 asphalt named ‘Pan Jin’ base asphalt. The test parameters of the based asphalt used in this study are summarized in Table 1.

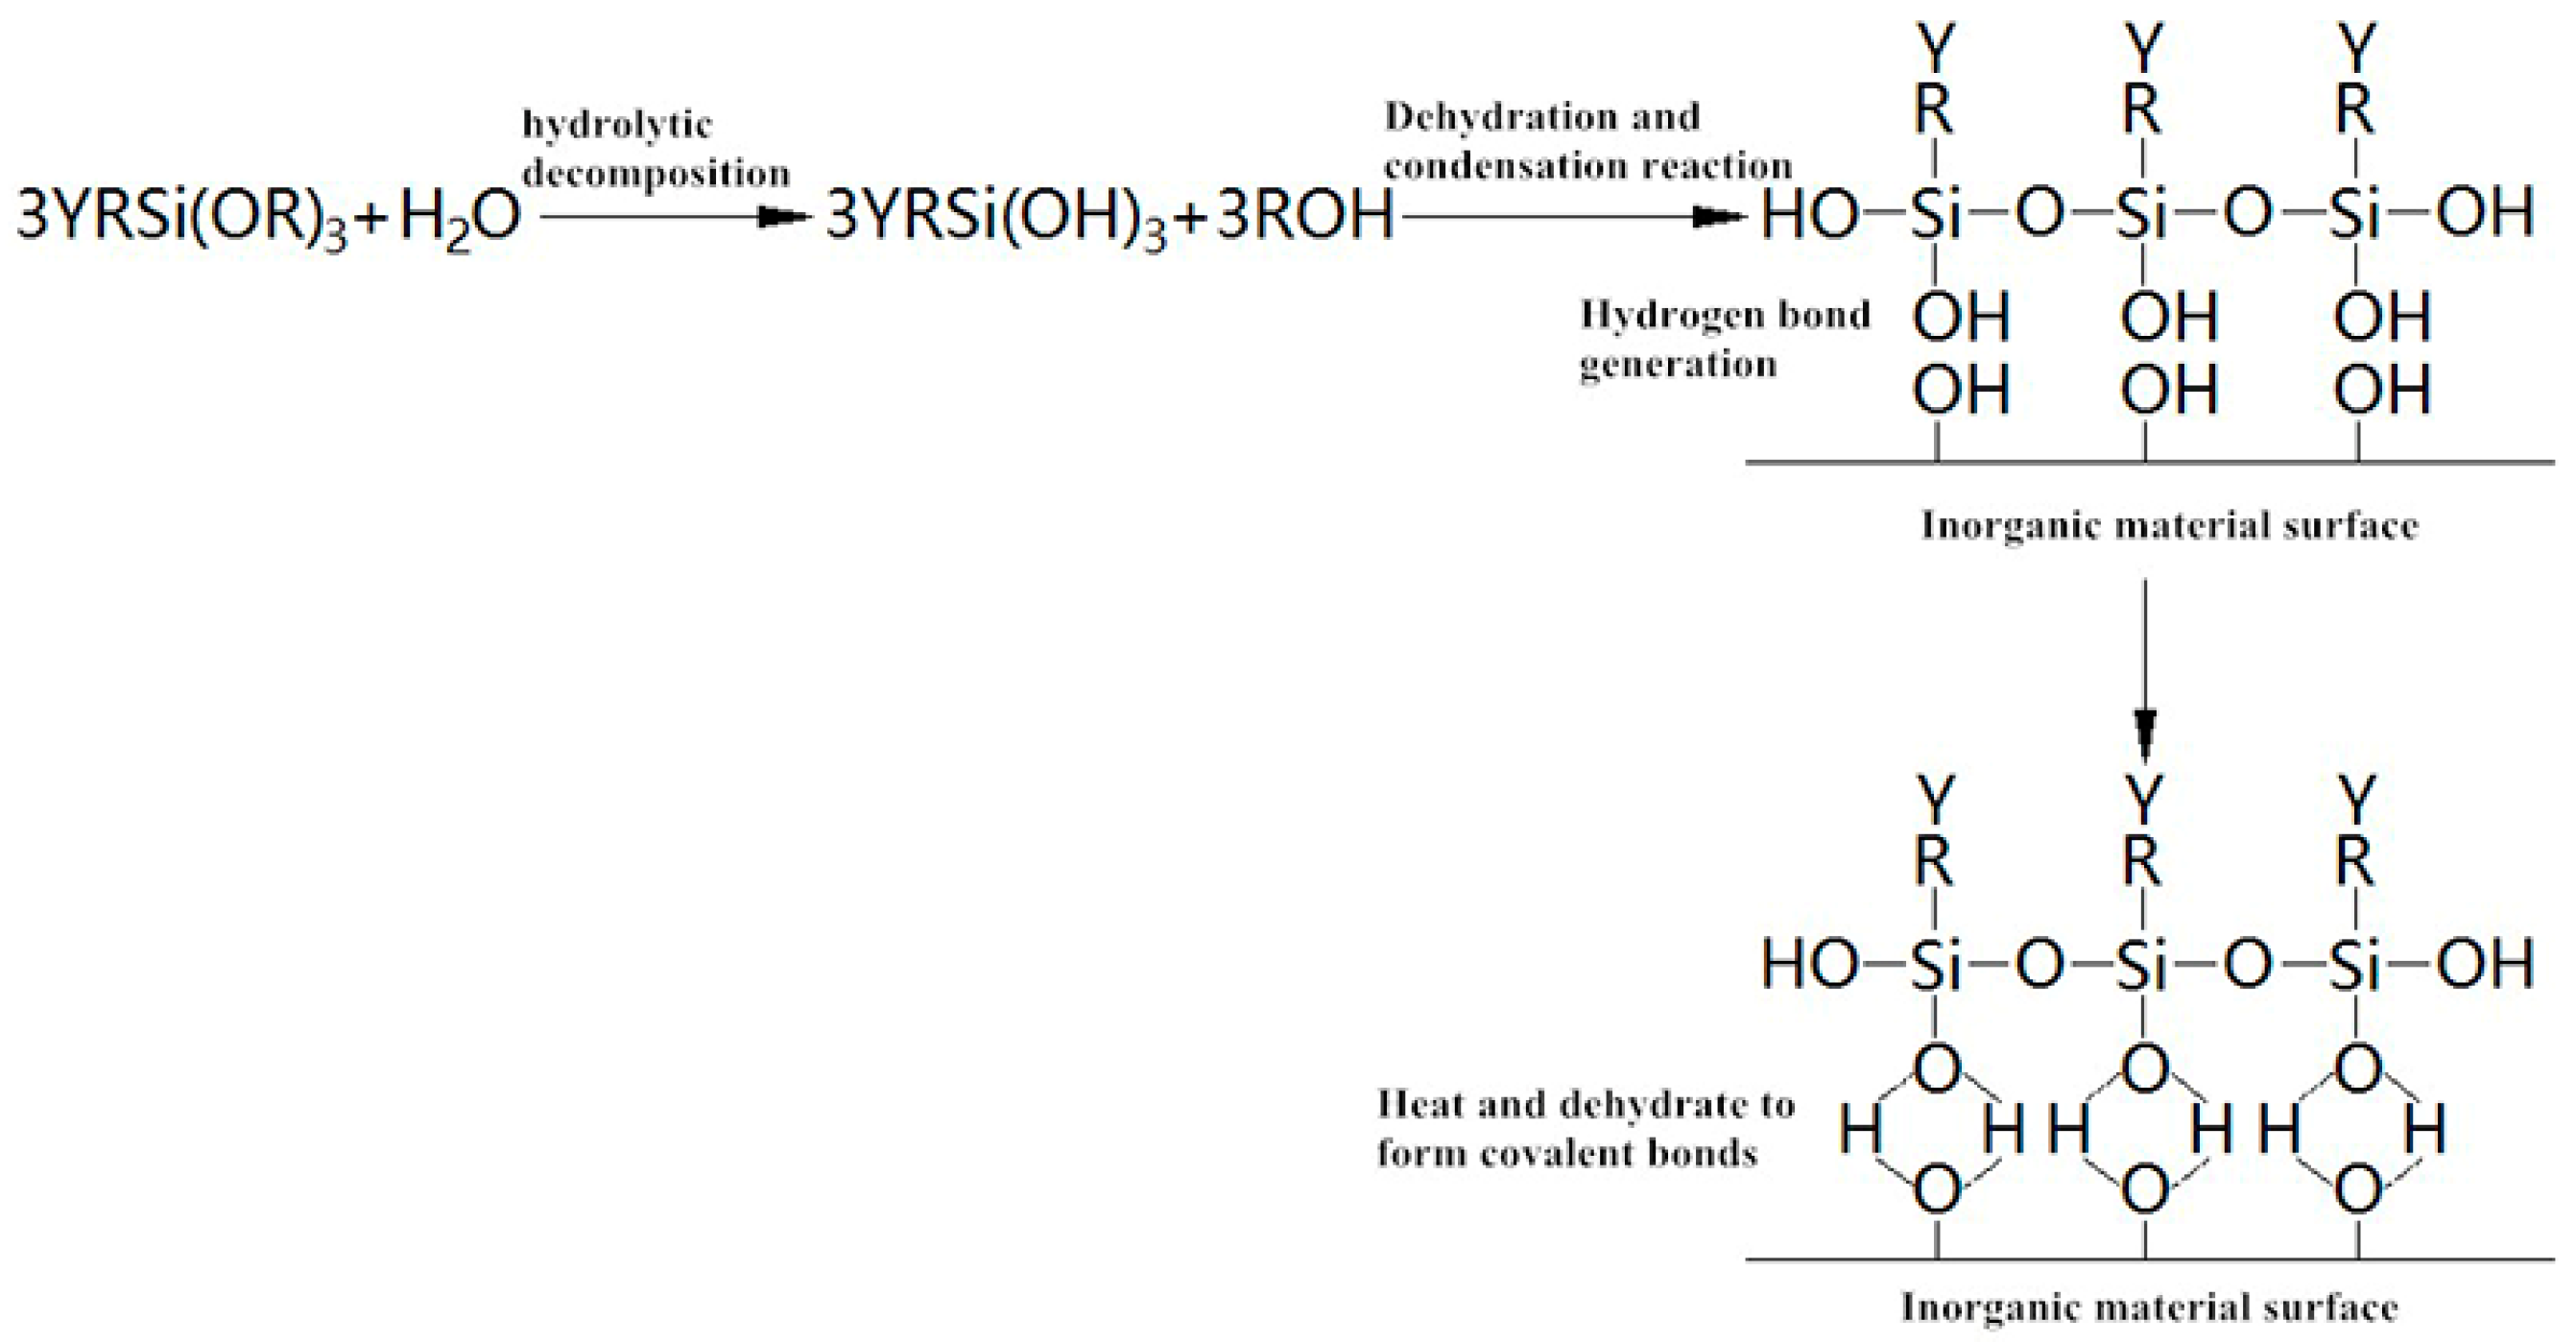
2.2. Nano Hydrophobic Silane Silica

Nano-silica is an important asphalt modifier with superior adhesion, tear resistance and heat aging resistance. However, the nano-silica exhibits hydrophilicity due to the polysilane inside the nano-silica and the reactive silanol groups present on the outer surface. The hydroxyl groups on the surface can be classified into three types: isolated hydroxyl group, continuous hydroxyl group, and twin hydroxyl group. Isolated hydroxyl group is a free hydroxyl group that does not participate in the reaction; the continuous hydroxyl group is formed by two hydrogen groups that generate hydrogen bonds and associate with each other; two hydroxyl groups attached to the same Si are called twin hydroxyl groups. The isolated hydroxyl group and continuous hydroxyl group have no hydrogen bond. The reinforcing effect of nanosilica as a modifier mainly comes from the active structure (-Si-OH) on the surface of the particles, and it is easy to bond the surrounding ions. The surface of nanosilica is uniformly distributed with a layer of silanol and siloxane group with strong water absorption. The water molecules can be physically covered on the surface of the particles or chemically bonded to the hydroxyl groups on the Si atoms. Therefore, nanosilica shows a strong affinity for water. In order to reduce the number of surface silanol structures and change the surface functional groups of the primary nanosilica particles, the surface modifier is used to modify the nanosilica to realize the transition from hydrophilic to hydrophobic. There are many surface treatment agents for nanosilica, and silane coupling agent surface treatment is the most common application method. The nano hydrophobic silane silica is obtained by grafting silane coupling agent onto the surface of nanosilica to carry out surface modification. The surface modification method of nano hydrophobic silane silica is detailed as follows: the X group in the silane coupling agent first undergoes hydrolysis by contacting with moisture, and then forms a temporary oligomer by dehydration condensation. The hydroxyl groups on the surface of nanosilica can react with the oligomeric structure to generate hydrogen bonds, then the nanosilica and the oligomer continue to undergo condensation and dehydration reaction by heating, drying, etc., and finally the silane coupling agent is successfully grafted onto the surface of the nanosilica by a covalent bond, as is shown in Figure 1. After surface modification, the number of silanol structures on the surface of the nanosilica is reduced, the structure of the surface functional groups and the atomic layer of the nanosilica particles is changed. Thereby, the surface properties such as physicochemical adsorption of nanosilica are changed, the surface free energy of the nanoparticle and the phenomenon of agglomeration between particles is reduced. The initial decomposition temperature of nano hydrophobic silane silica obtained by grafting the silane coupling agent on the surface of the silica is about 250 °C, and the loss on ignition (1000 °C, 2 h) is 1.5~2.0, which ensure the workability and effectiveness of nano hydrophobic silane silica in the asphalt pavement construction.
The nano material was obtained from Changtai Micronano Chemical Co., Ltd. (Shouguang, Shandong province, China). The technical properties of nano hydrophobic silane silica material provided by Changtai Weina Chemical Co., Ltd (Shouguang City, China). are presented in Table 2.

2.3. Asphalt Sample Preparation

In the previous study, the incorporation method of nano hydrophobic silane silica was discussed in detail [38]. A high shear mixer with the speed of 2000 rpm was used for incorporating the nano hydrophobic silane silica into the base asphalt. Mixing percentages of nano hydrophobic silane silica was 3 wt% of the base asphalt and mixing temperature was kept at 140 °C. The mixing time was about 60 min to ensure homogeneous blending. Base asphalt and nano hydrophobic silane silica modified asphalt were denoted by BA and NHSSMA. The technical parameters of the NHSSMA used in this study are summarized in Table 3.

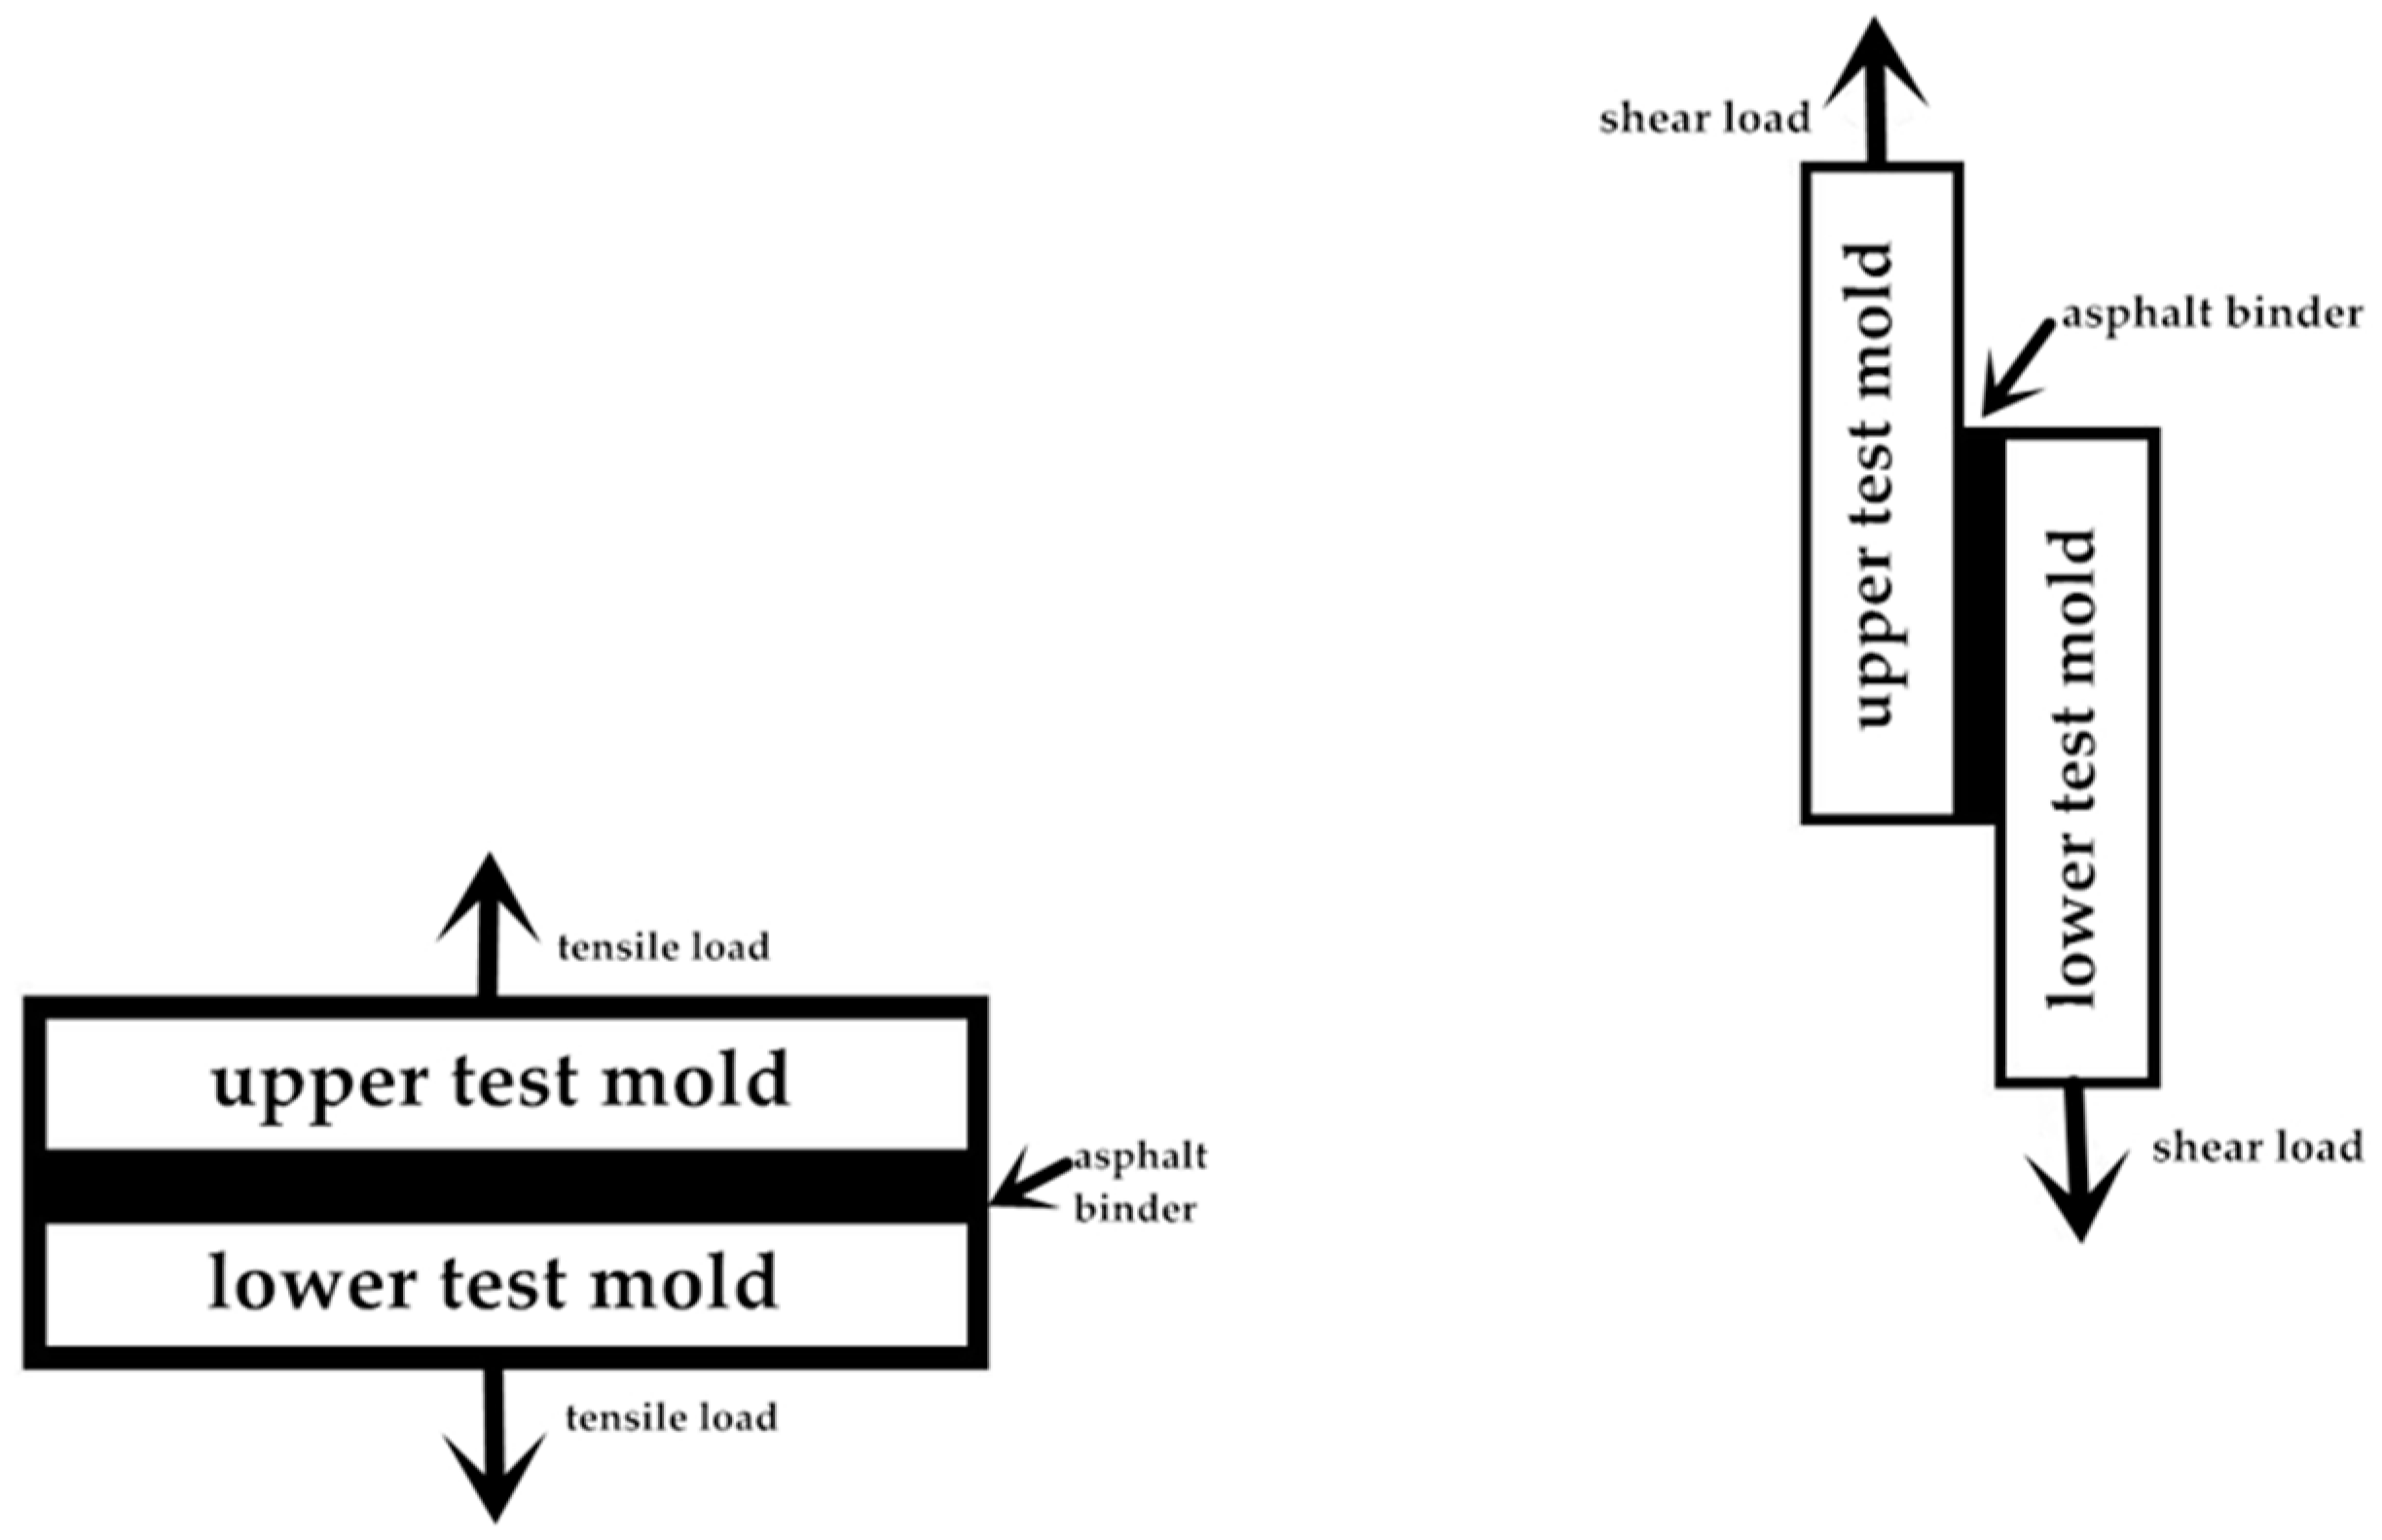
3. Aggregate-Bitumen Interface Bond Strength Test
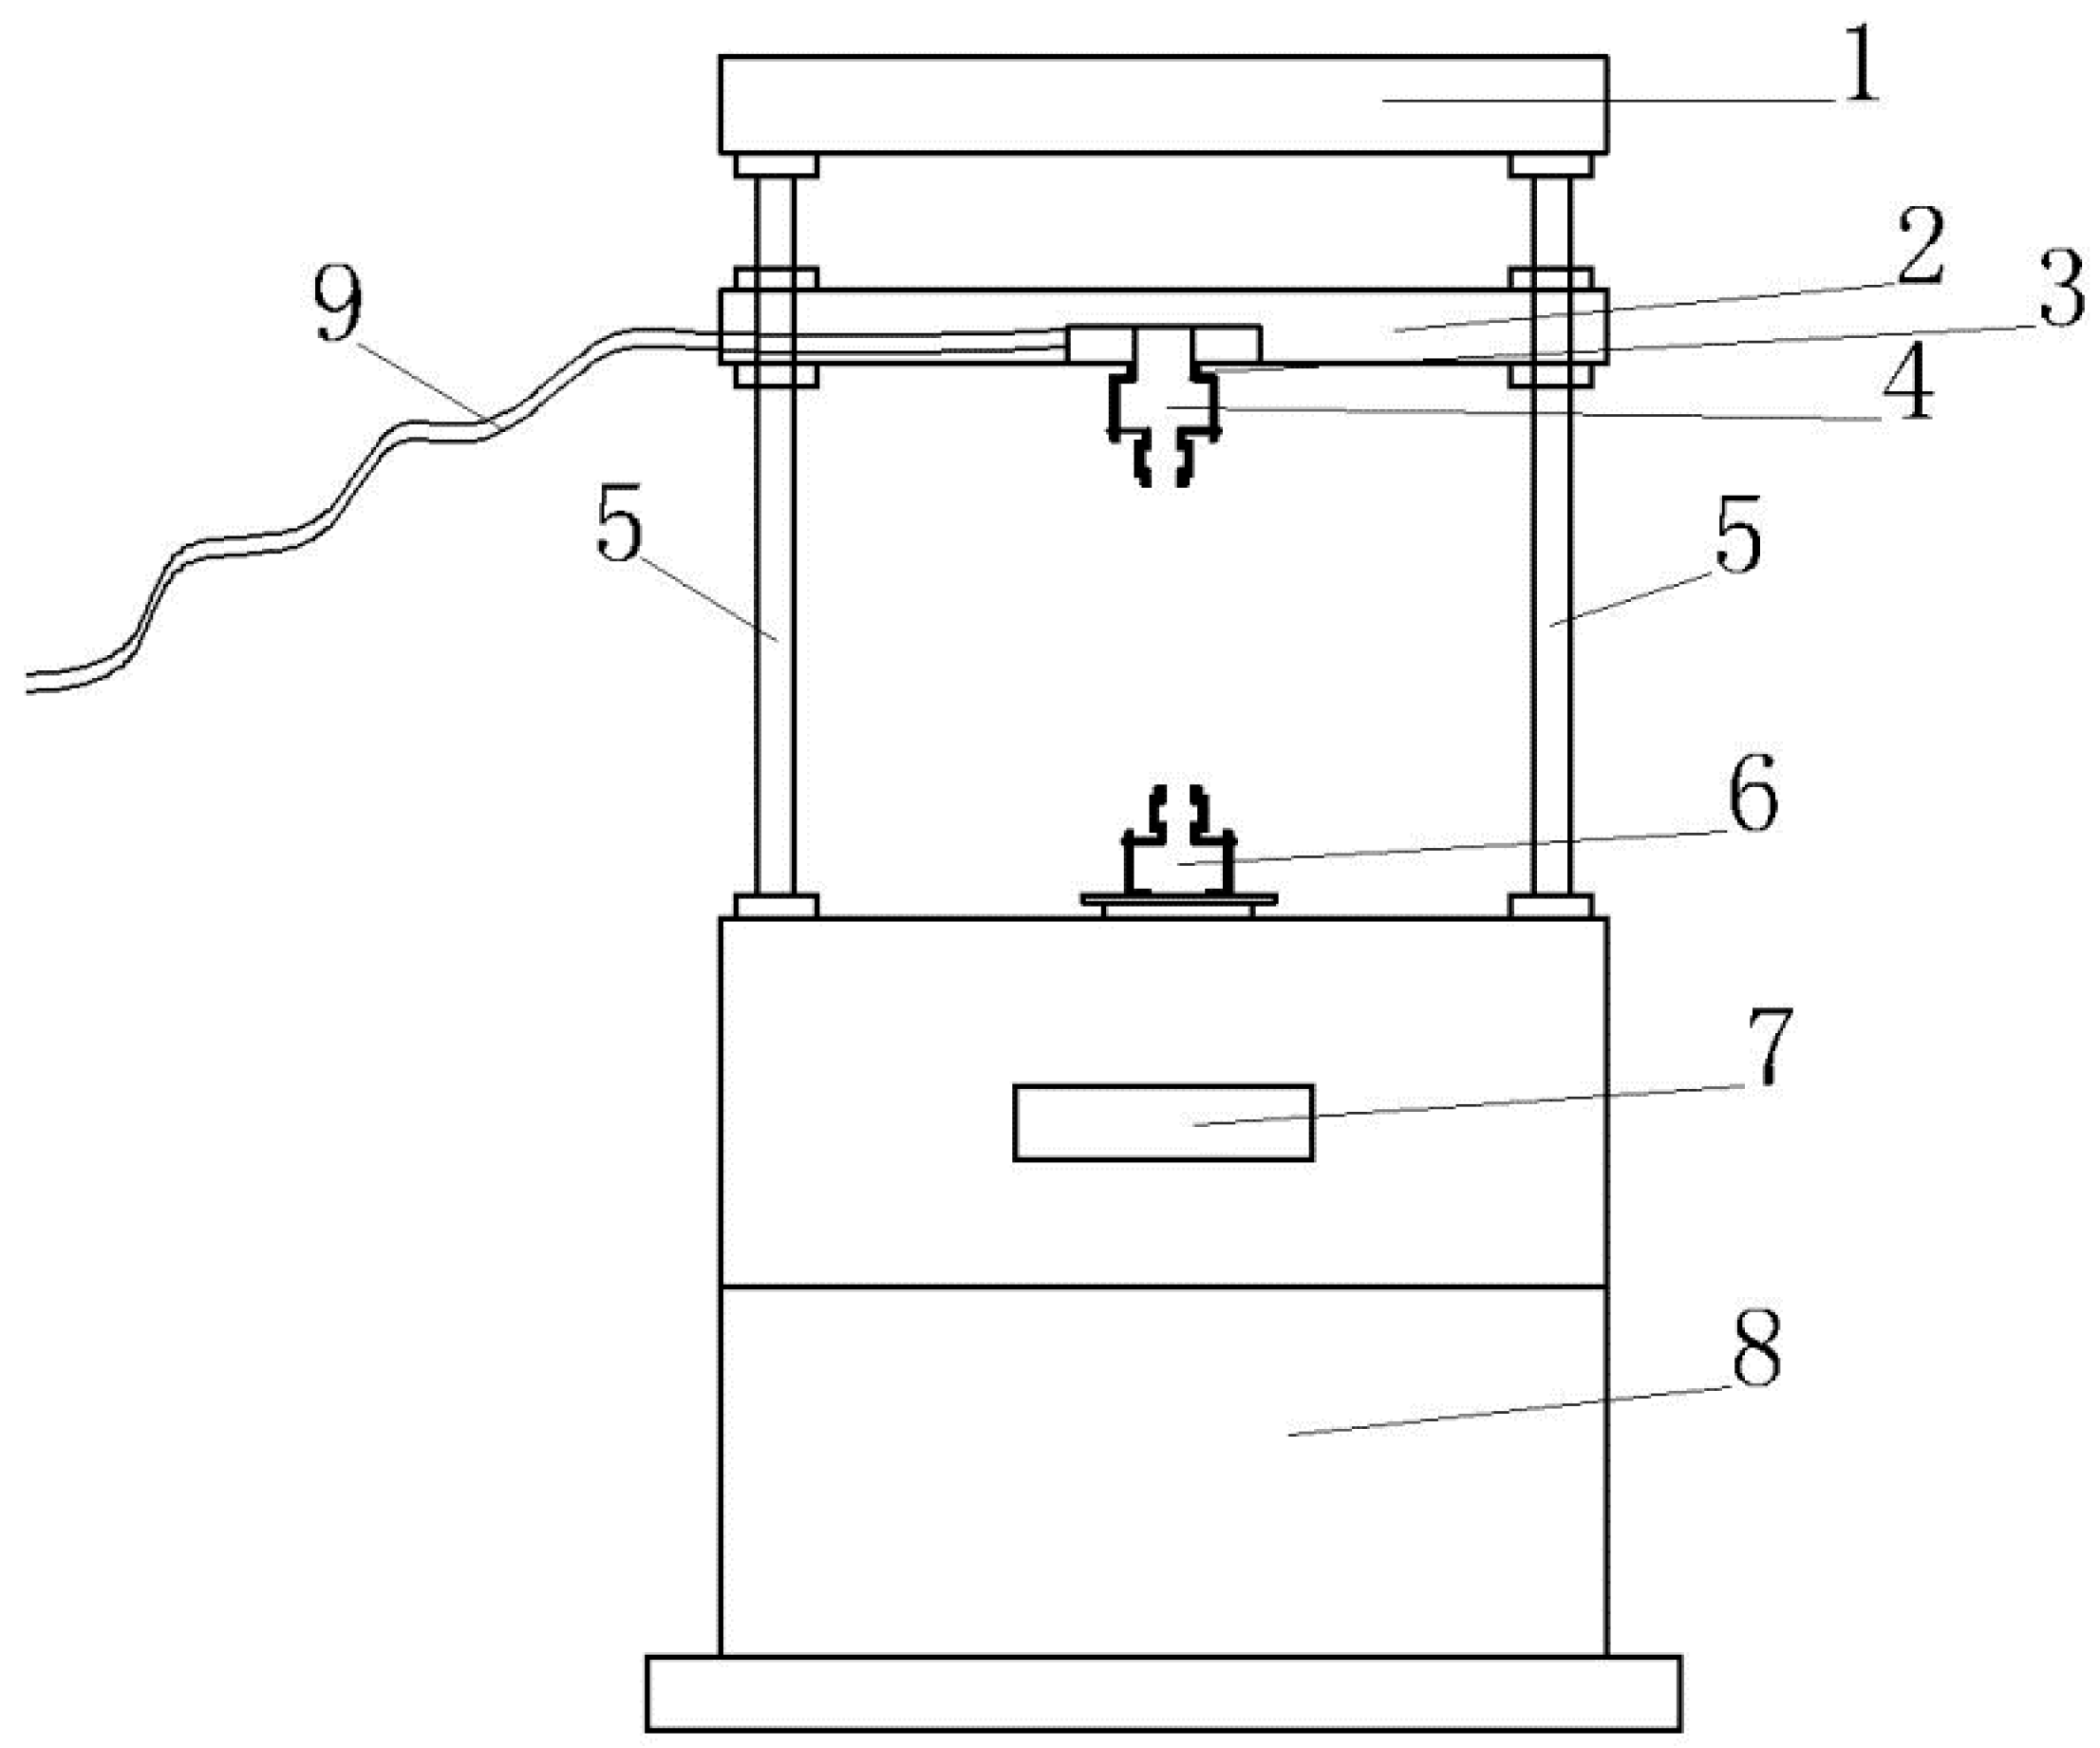
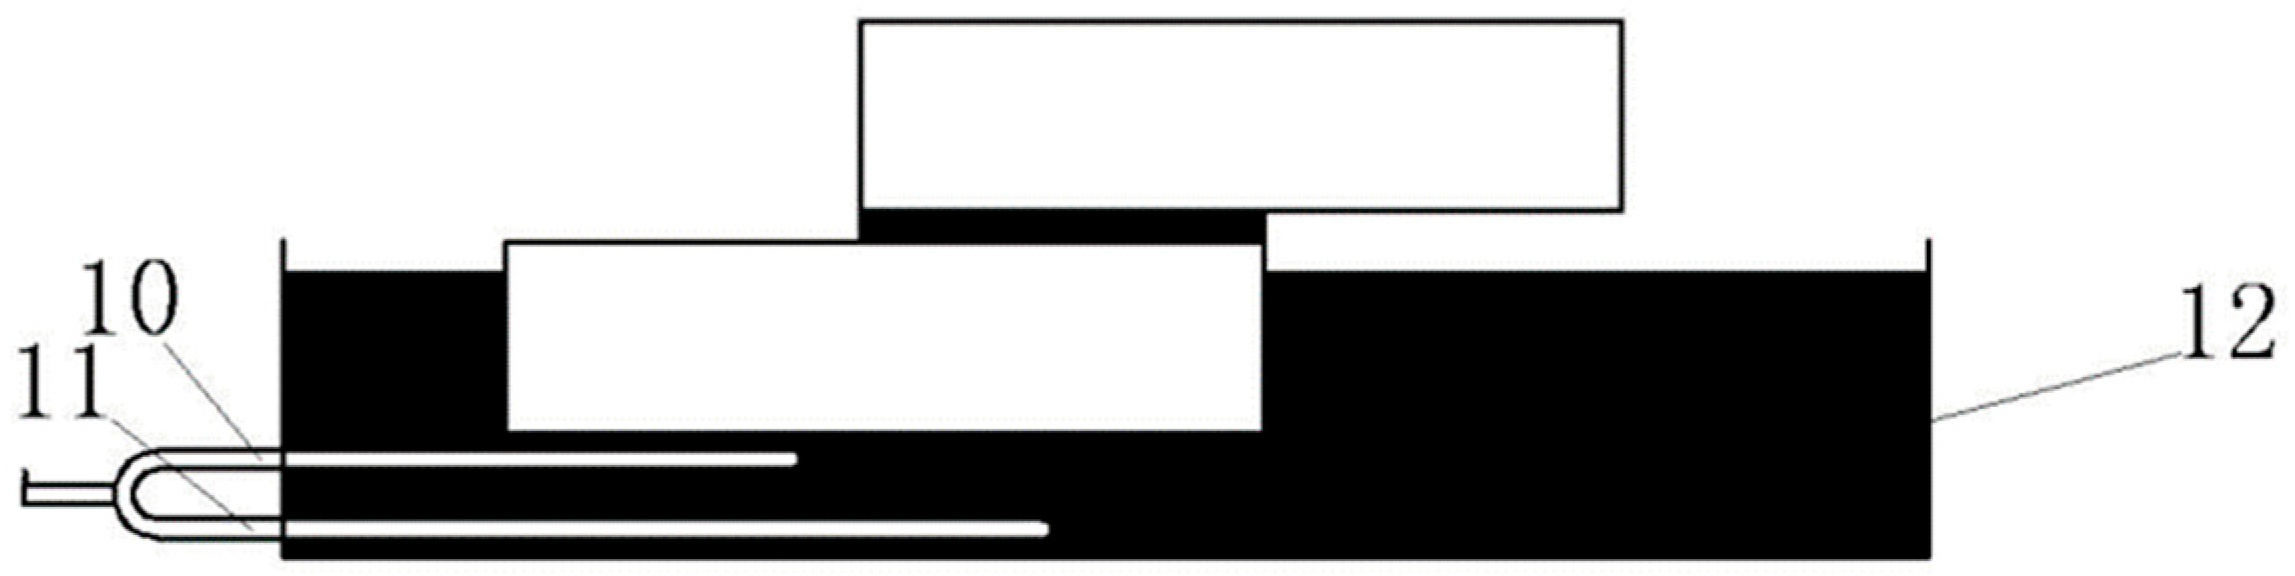
3.1. Test Equipment

The role of asphalt binder in asphalt mixtures is to coat the stones and polymerize the stones together. Therefore, the adhesion theory has long been applied to evaluate the bond strength of hot mix asphalt mixture (HMA). In the adhesion theory, the bond between aggregate and asphalt binder can be ideally considered as an adhesive joint. If more specific, it can be considered as a butt joint. In asphalt mixture system, the asphalt binder is an adherent and the aggregate is considered to be the bonded portion. The destruction of the system occurred within the binder or binder-filler mastic called cohesive failure, which occurred at the binder-aggregate interface considered as adhesive failure, and two failure modes are shown in Figure 2.
In this paper, cohesive failure and adhesive failure are collectively referred to as bond failure. In order to measure the aggregate-bitumen interface bond strength of BA and NHSSMA, an aggregate-bitumen interface bond strength tester was designed independently, as show in Figure 3.
The aggregate-bitumen interface bond strength tester is mainly composed of nine main components, which are (1) upper separator, (2) lower separator, (3) hinged bar chain, (4) upper grip finger, (5) screw rod, (6) lower grip finger, (7) asynchronous motor, (8) pedestal and (9) data transmission line. The screw rod (5) of the tester can be driven by the asynchronous motor (7) to shear or stretch the test sample fixed between the upper grip finger (4) and lower grip finger (6). The test sample is champed into the upper grip finger (4) and lower grip finger (6), computer can set the shear (tensile) rate, and the shear or tensile failure load is collected through the data line (9). The shear (tensile) rate was selected to be 1 mm/min. The aggregate-bitumen interface shear (tensile) strength can be calculated as following.
S S = F s S s c , T S = F T S T c ,
where F s and F T is the maximum shear and tensile failure load, S s c and S T c is the shear and tensile failure area, and SS and TS is the aggregate-bitumen interface shear and tensile strength. The upper grip finger (4) is fixed on the lower separator (2) through the hinged bar chain (3), so that there is only a vertical upward tensile (shear) force during the tensile (shear) process, and no bending moment occurs. The self-developed aggregate-bitumen interface bond strength tester overcomes the disadvantage that the bending moment is easy to generate during the shear or tensile process in the conventional test equipment.

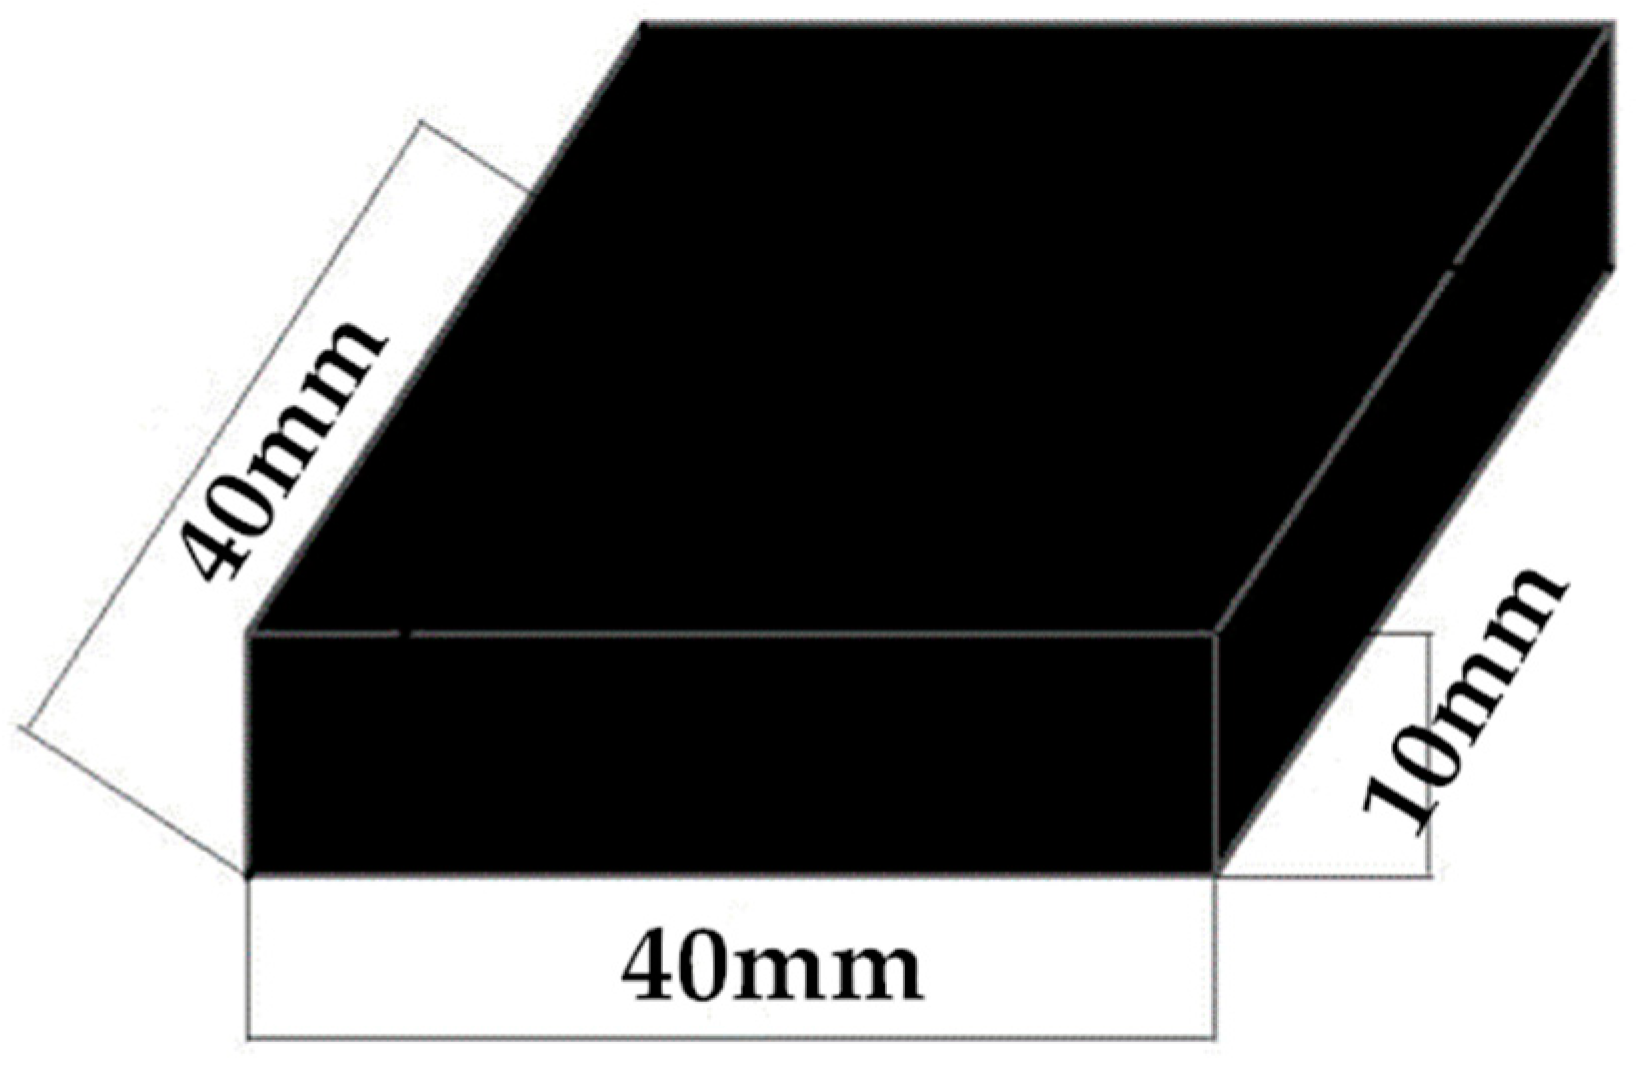
3.2. Test Sample Preparation

In the aggregate-bitumen interface bond strength test, the test mold is a vital part that needs to be designed independently. In order to accurately measure the bond strength and the bond area, the aggregate-bitumen interface must keep flat. In the paper, the appropriate size of granite stones was selected from stone pit, and several square test molds with a size of 40 × 40 × 10 mm was manufactured through large water-cooled stone cutting machine. The size of each test mold after cutting was accurately measured, the unqualified test mold was screened out, and the test mold is shown in Figure 4.
The test sample was prepared by applying the quantitative asphalt binder to the surface of one test mold, flattening with a preheated blade, and then adhering it to the surface of another test mold. The shear sample and tensile sample are shown in Figure 5.
In order to simulate the process of moisture diffusion into the aggregate-bitumen interface, the test sample was placed in a water bath. The test sample placed in the water bath is shown in Figure 6.
As shown in Figure 6, the asphalt binder is not submerged below the water surface. This prevents moisture from entering the aggregate-bitumen interface from the edge of the aggregate-bitumen interface or directly through the asphalt binder, ensuring that moisture can only diffuse from the stone to the aggregate-bitumen interface. The test sample immersed in the water is to evaluate the influence of moisture on the aggregate-bitumen interface bond strength in the spring-thaw season. In addition to the test sample in Figure 6, the water bath (12), the U-shaped heating tube (11) and temperature sensor (10) were also included.

3.3. Test Sample Cleaning

After each aggregate-bitumen interface bond strength test, a layer of asphalt binder remained on the surface of the test mold. Due to the large number of tests, the test mold needed to be cleaned and reused. According to experience, there are two ways to remove surface residual asphalt: (1) high temperature heating cleaning method; (2) chemical reagent cleaning method. Since the high temperature heating cleaning method has high requirements on equipment, the cleaning process is complicated, and the cleaning effect is the same as that of the chemical reagent cleaning method, and repeated high-temperature heat treatment (approximately 500 °C) may adversely affect the physical structure of the test mold. Therefore, the chemical reagent cleaning method was adopted to clean the test mold after test. The specific cleaning process is as follows.
(1)
The test mold with residual asphalt was frozen for about 0.5 h.
(2)
The test mold was removed from the cryostat and the residual asphalt on the surface of the test mold gently scraped with a plastic sheet.
(3)
The surface of the test mold was rinsed with trichloroethylene until no residual bitumen.
(4)
The surface of the test mold was rinsed with a small amount of acetone solution to accelerate the drying process of the test mold.
(5)
The rinsed test mold was placed in an oven at 100 °C for 12 h.

3.4. Test Procedure

The test equipment, test sample preparation, and test sample cleaning of the aggregate-bitumen interface bond strength test were introduced in the previous section. The details of aggregate-bitumen interface bond strength test are described below.
(1)
The test mold was placed in 100 °C oven for 15 min.
(2)
BA and NHSSMA were placed in an oven at 135 °C and heated to a flowing state.
(3)
The quantitative asphalt binder was applied to the surface of one test mold, flat with a preheated blade, and then adhered to the surface of another test mold.
(4)
The prepared test sample was placed in a water bath to simulate the process of moisture diffusion into the aggregate-bitumen interface. The immersion height of each test sample was consistent, and the immersion height was one-half the thickness of the test mold.
(5)
The test sample was tested, and the data was obtained by setting the loading rate and the test temperature through a computer. The collected data was the maximum failure load and failure area. In order to ensure the validity and repeatability of the data, the number of parallel tests in each group of experiments was 4–6. The numerical values appearing in the article are the average of the data that meet the error requirements, and the coefficient of variation of all test data was within 10%.
(6)
Finally, the test mold was cleaned and we the next set of tests were carried out.

4. Results and Discussion

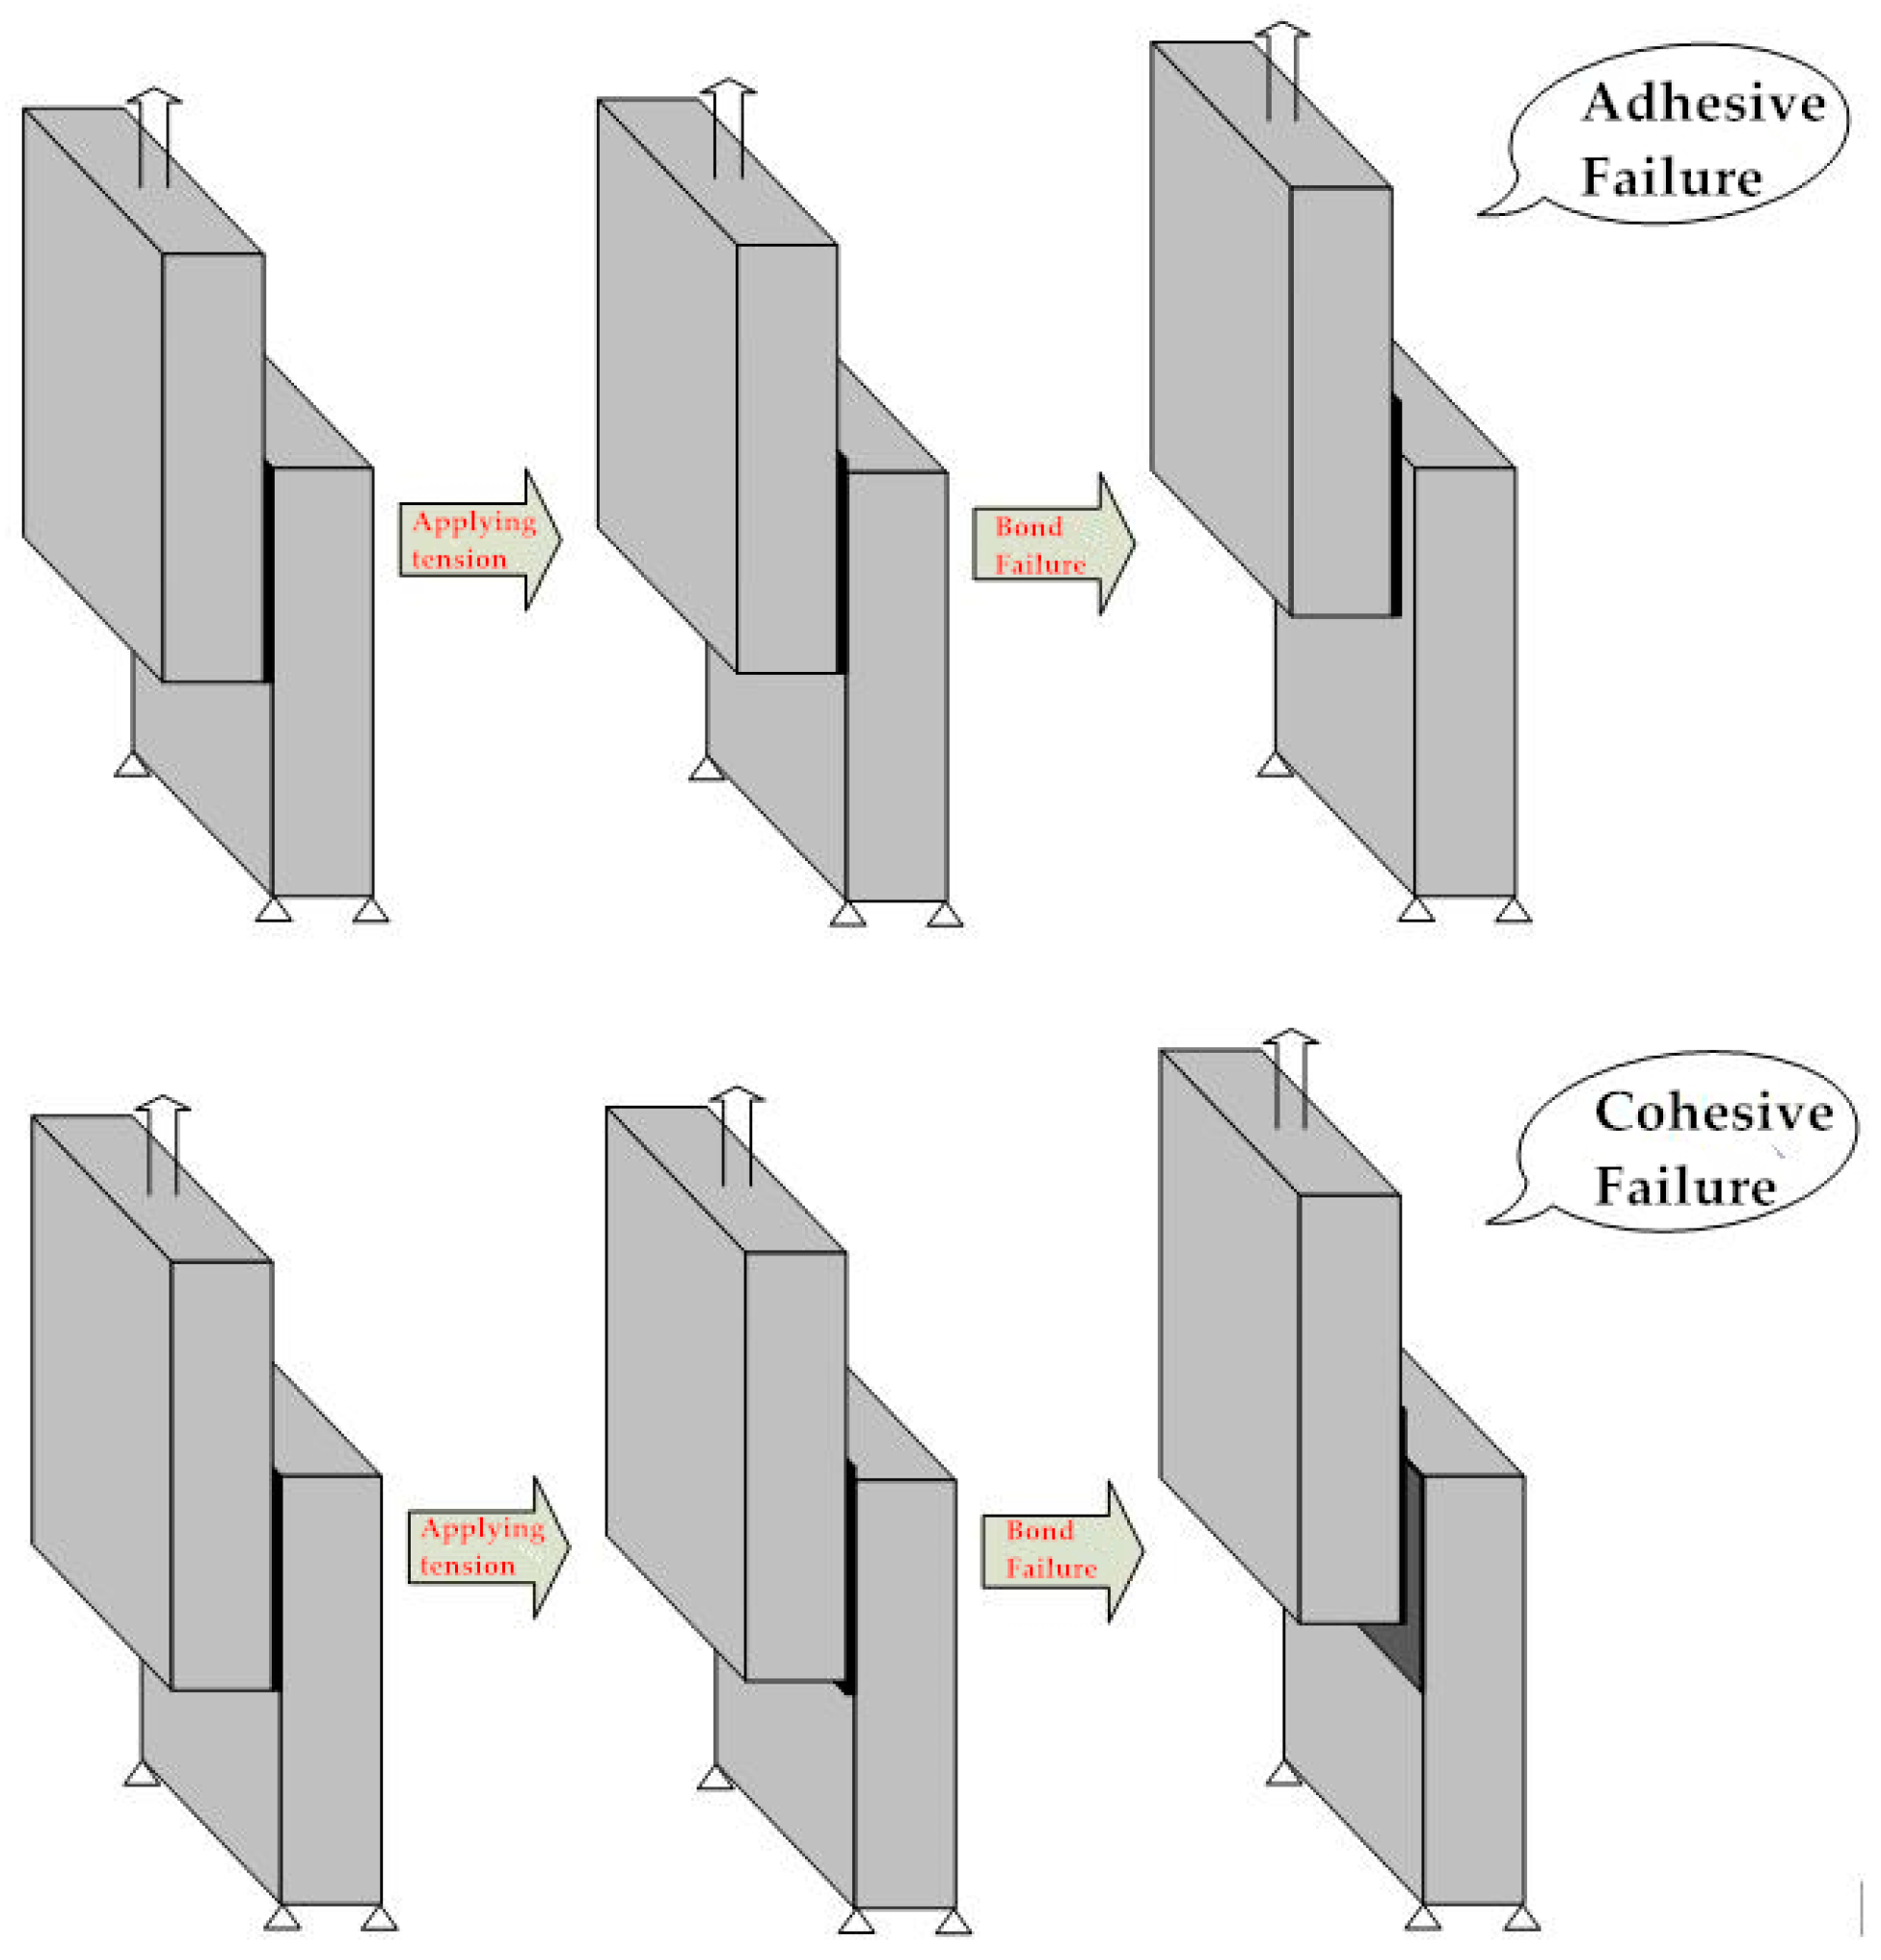
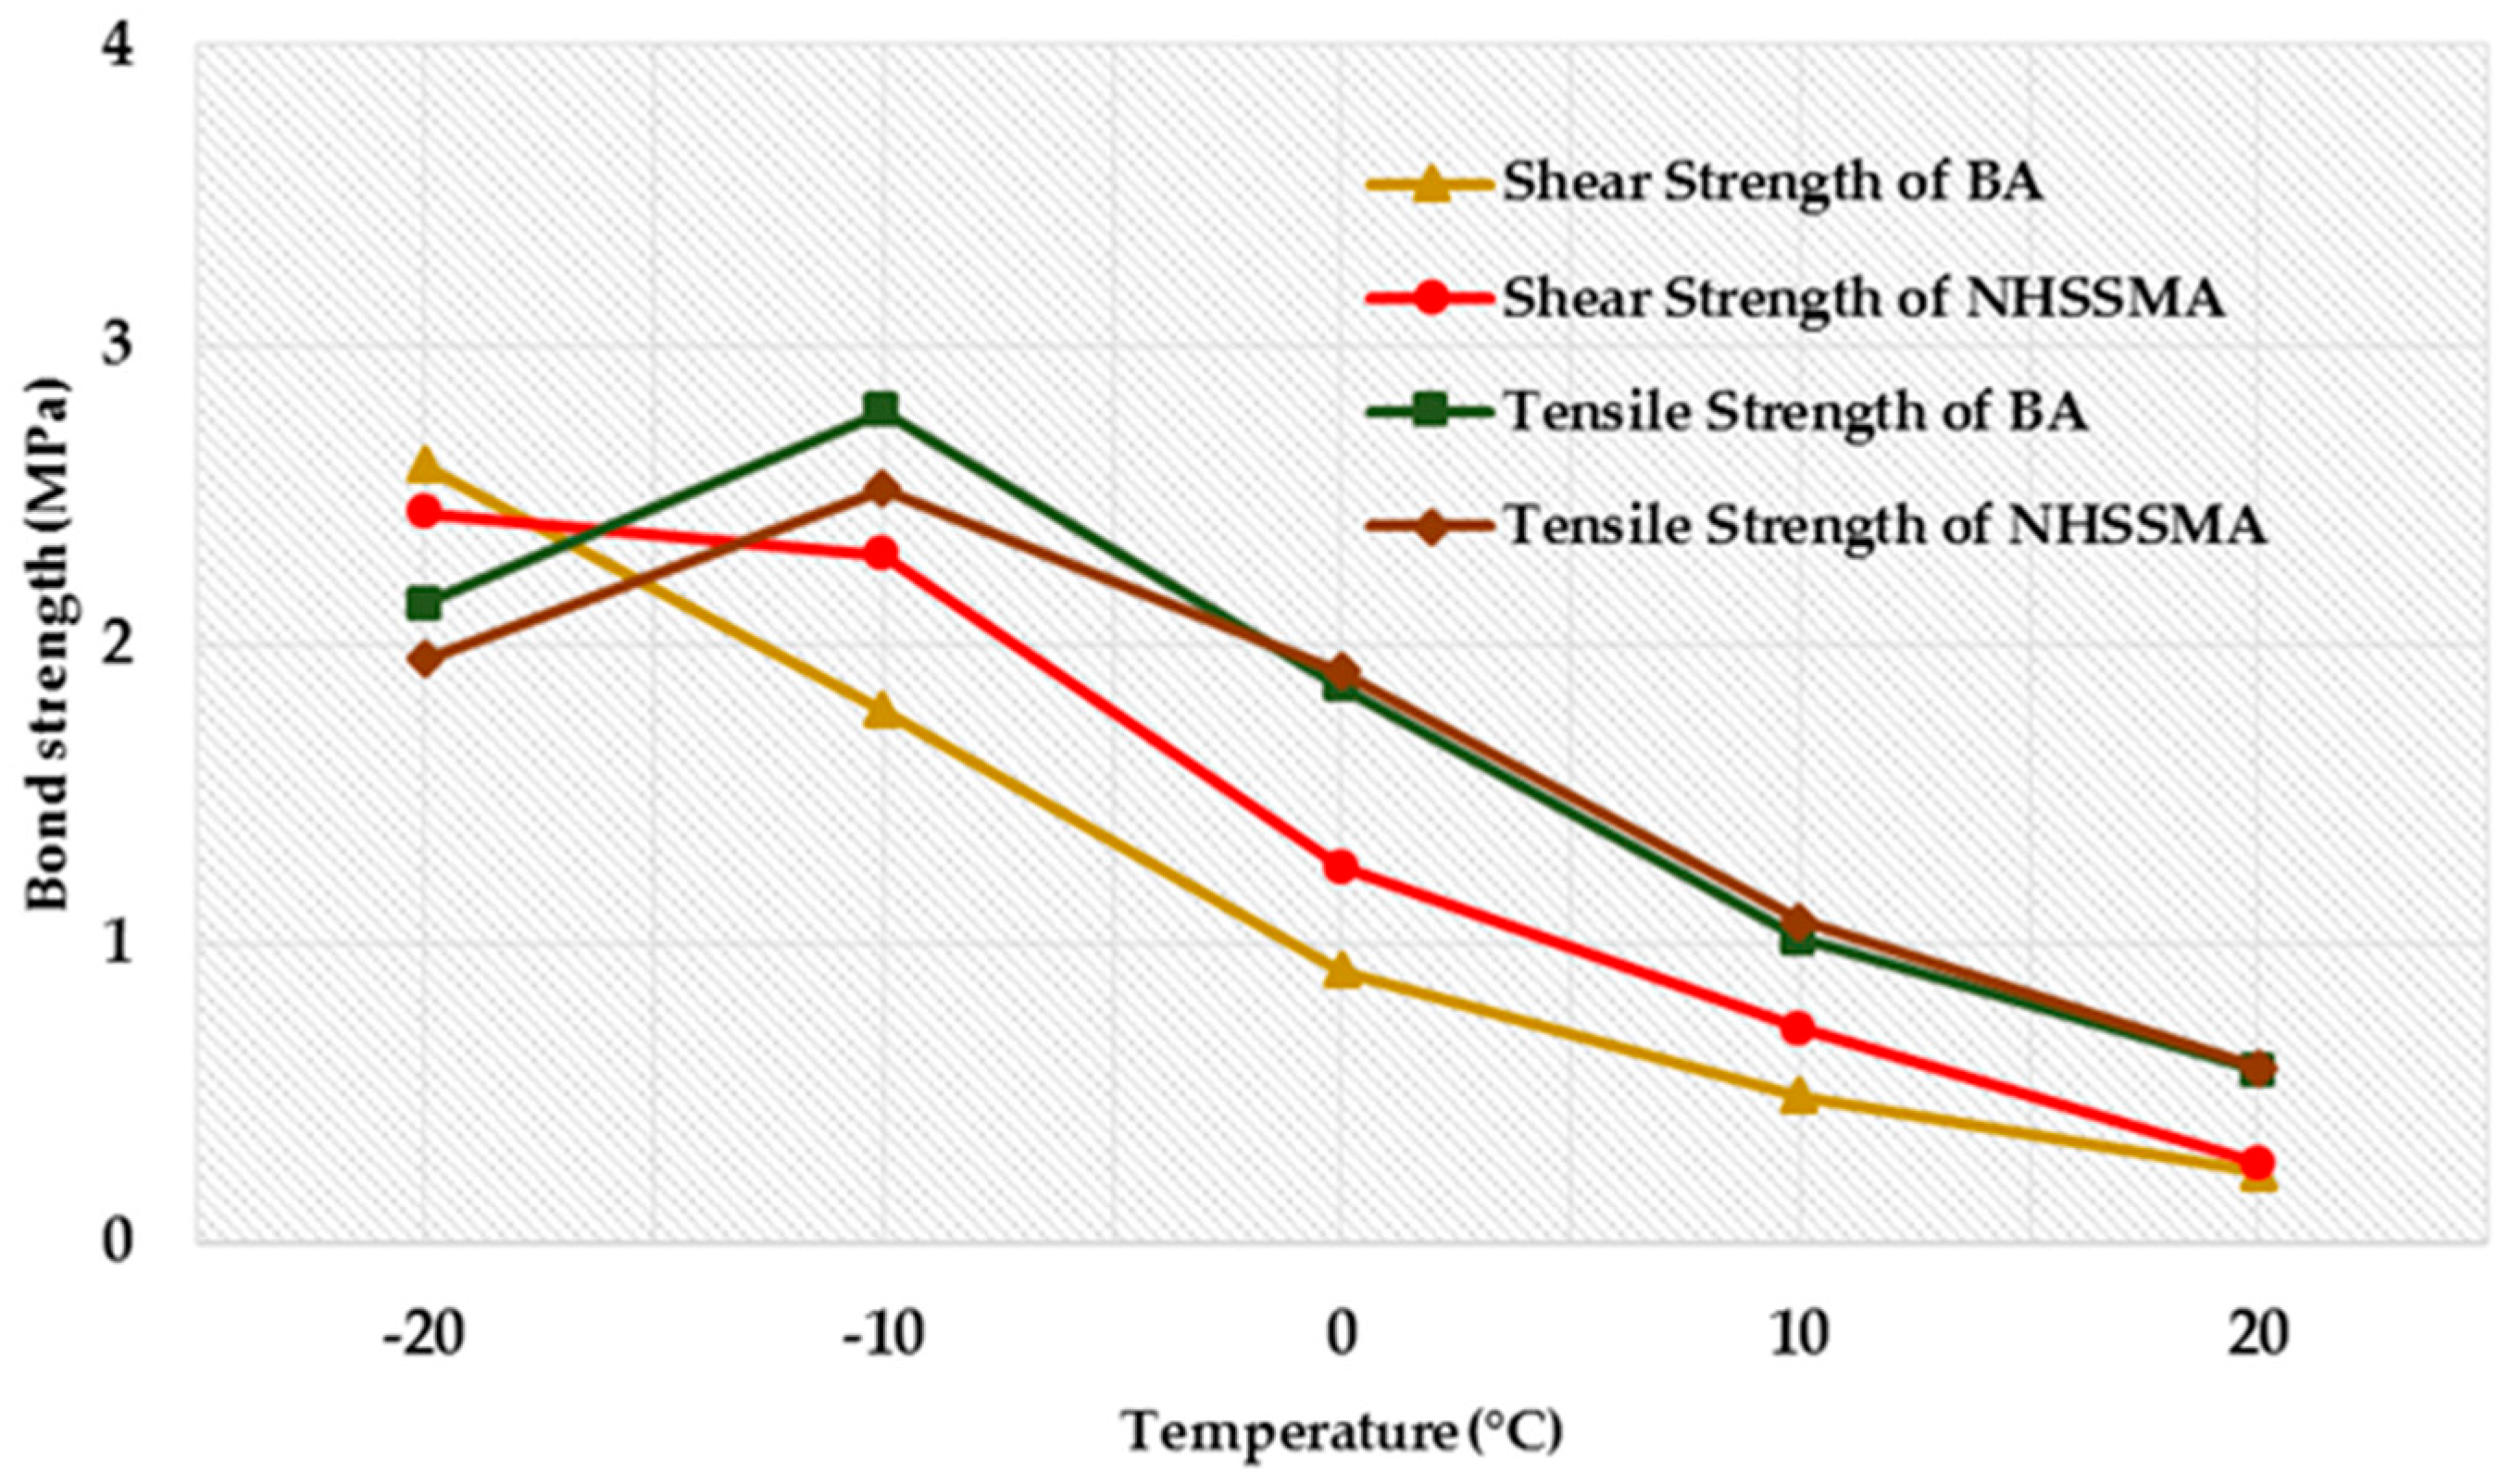
4.1. Contribution of Shear Strength and Tensile Strength to Aggregate-Bitumen Interface Bond Strength

The load applied to the asphalt binder can be decomposed into tensile and shear loads. In order to study the bond strength of aggregate-bitumen interface under different load effects in the spring-thaw season, the aggregate-bitumen interface shear and tensile strength test for BA and NHSSMA were carried out in −20~20 °C based on the spring temperature. The tensile strength and shear strength of aggregate-bitumen interface for BA and NHSSMA at different temperature are given in Figure 7. It is can be seen from this figure that the aggregate-bitumen interface bond strength was greatly affected following the addition of modifier. From Figure 7, it was observed that addition of nano hydrophobic silane silica improved the shear strength of aggregate-bitumen interface at the temperature above −10 °C, and the increase range is 16.8%~47.1%. The reason for the improvement in shear strength values of nano hydrophobic silane silica modified binder sample is that nano hydrophobic silane silica contribute to the viscosity of asphalt. When the temperature is high, NHSSMA can exert the advantage of high-viscosity property. Therefore, the aggregate-bitumen interface shear strength of NHSSMA is higher than that of BA. However, the asphalt exhibits more elastic characteristics at low temperature. NHSSMA becomes more brittle, so the aggregate-bitumen interface shear strength of BA is slightly larger than that of NHSSMA at −20 °C. It also can be seen from Figure 7 that the aggregate-bitumen interface tensile strength of NHSSMA is slightly larger than that of BA when the temperature is above 0 °C.
From Figure 7, it was also observed that the aggregate-bitumen interface tensile strength was significantly higher than shear strength when the temperature is above −10 °C, but the aggregate-bitumen interface tensile strength was lower than shear strength at −20 °C. Thus, it can be concluded that the aggregate-bitumen interface shear failure is more likely to occur in the pavement when the temperature is above −10 °C, and the aggregate-bitumen interface is prone to tensile failure when the temperature is below −15 °C. This conclusion is also consistent with the fact that the pavement is prone to rutting at high temperatures and cracking is likely to occur at low temperatures. Since the shear failure dominates the aggregate-bitumen interface bonding failure in the spring temperature range, the following study focused on the aggregate-bitumen interface shear failure. In addition, it is interesting to note that the tensile strength of BA and NHSSMA has a peak at −10 °C, which may be related to the glass transition temperature of the asphalt. The glass temperature of asphalt is between −10 and −20 °C. Asphalt will change from glassy state to a viscoelastic state with increasing temperature. When the test temperature is higher than the glass temperature of the asphalt, the asphalt exhibits stronger viscoelasticity, and the adhesion between the asphalt and aggregate increases, resulting in an increase in tensile strength. As the temperature continues to increase, the viscosity of the asphalt gradually decreases, and the tensile strength gradually decreases.

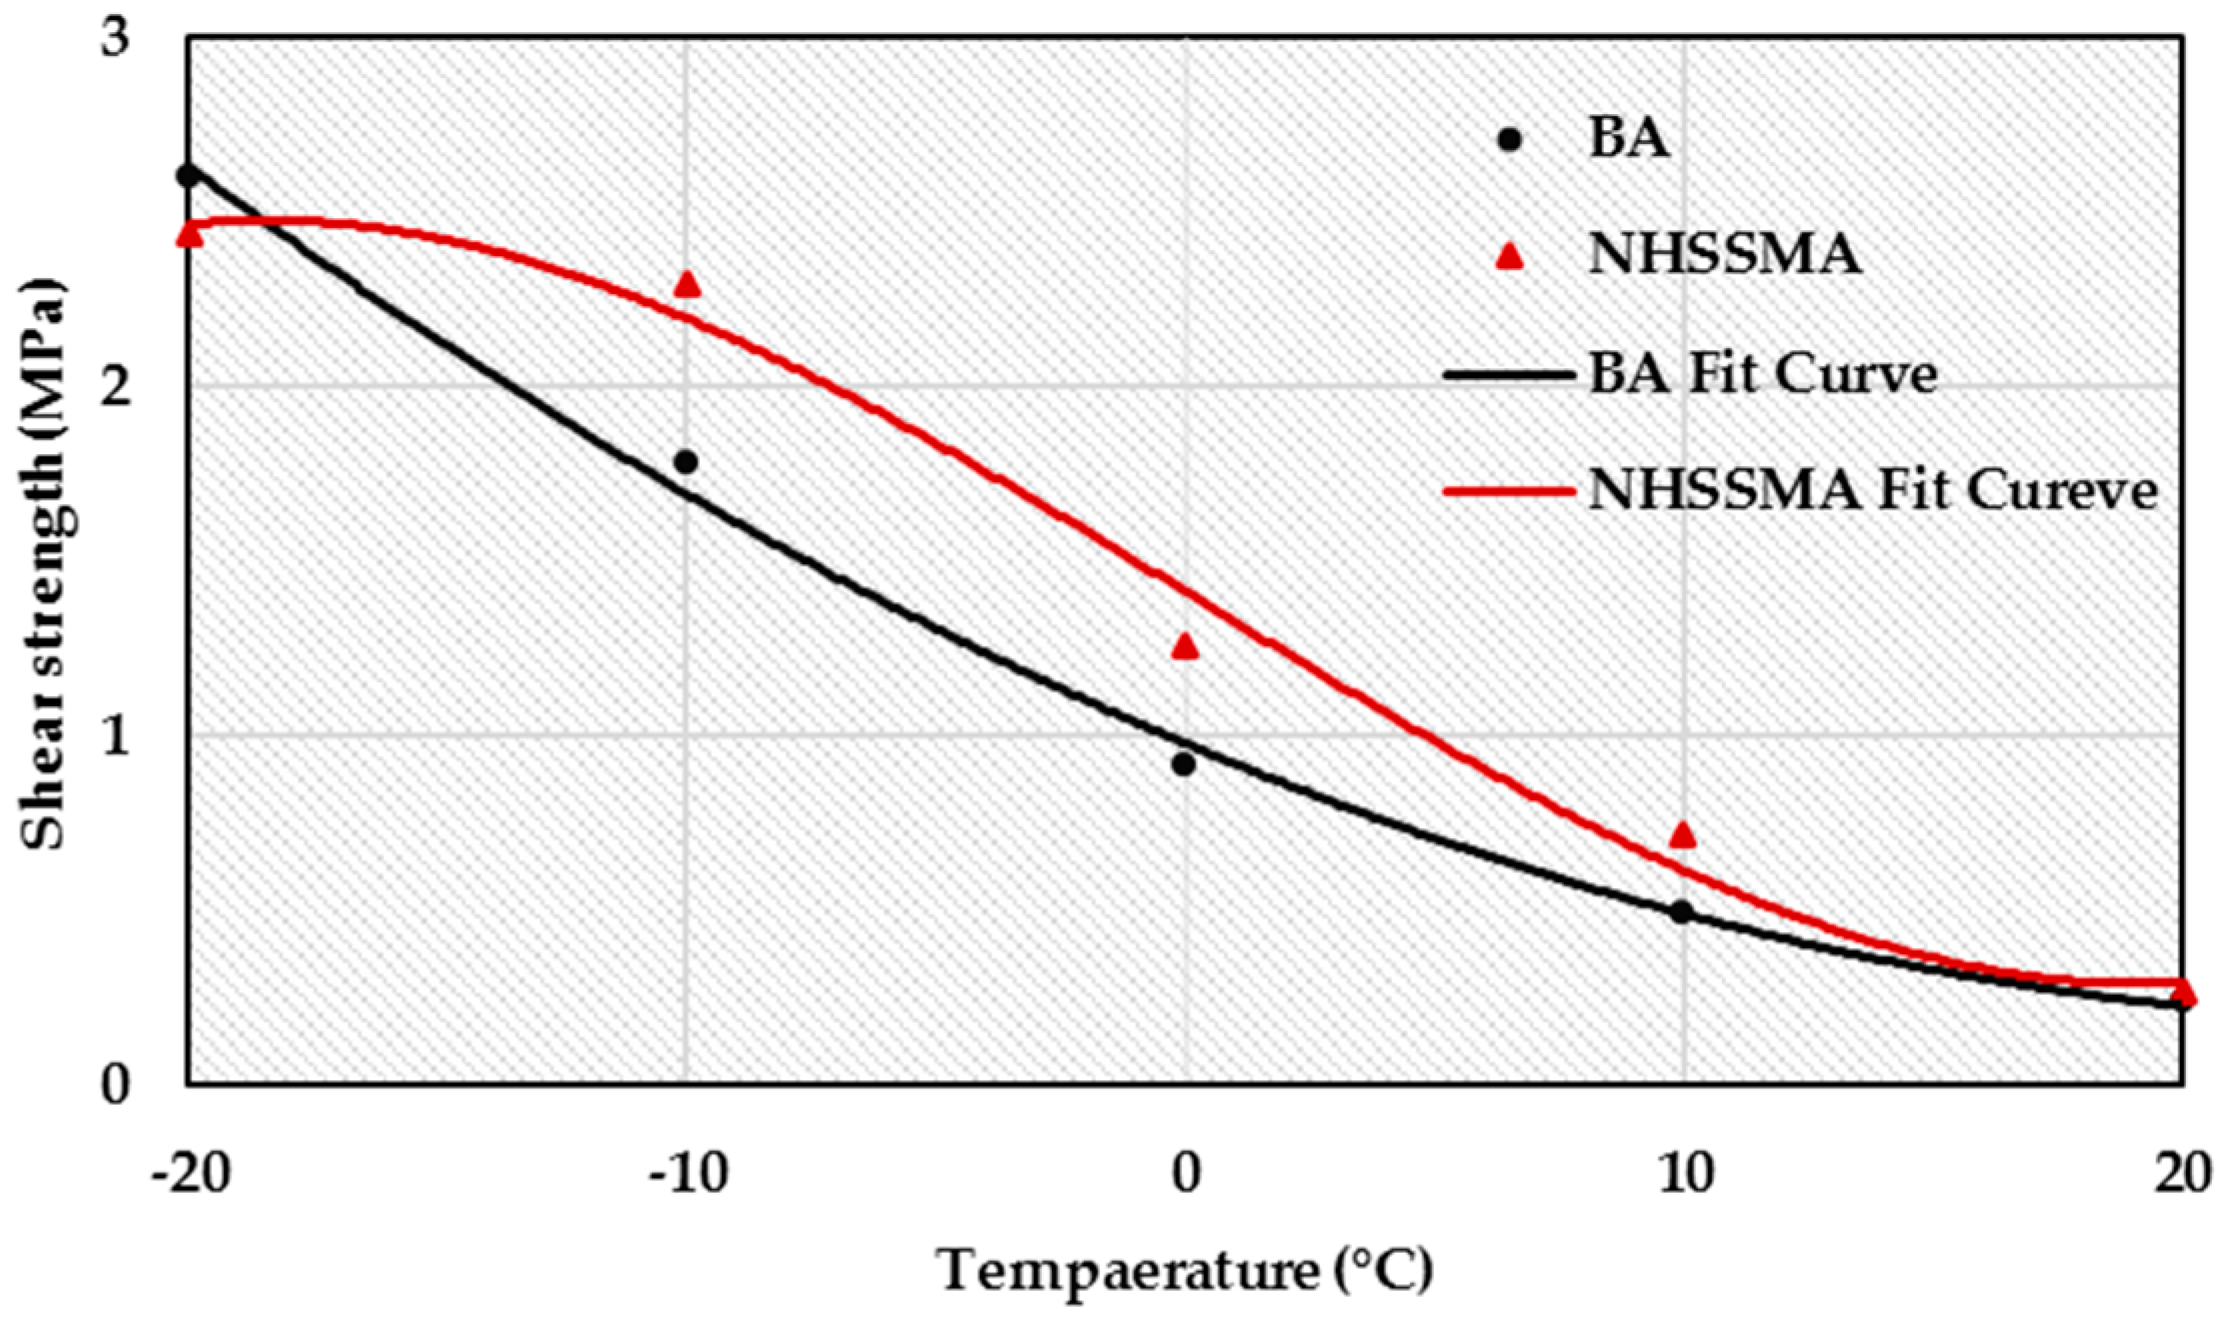
4.2. Effect of Temperature on Aggregate-Bitumen Interface Shear Strength

Asphalt is a typical temperature sensitive material, and temperature is the most important factor affecting the aggregate-bitumen shear strength. The aggregate-bitumen interface shear strengths of modified and unmodified asphalt are given in Figure 8. As seen in Figure 8, for modified and unmodified asphalt, the aggregate-bitumen interface shear strength decreased with the increase of temperature, this indicated that, with the increase of temperature, the asphalt became soft and its resistance to interface shear failure declined. Moreover, a higher slope of the fit curve means that a higher temperature sensitivity of the asphalt is observed. As can be witnessed, the temperature sensitivity of nano hydrophobic silane silica modified asphalt was lower than that of base asphalt, which is consistent with the conclusions of the conventional physical properties test in the published article.
In the test temperature range of −20~20 °C, the change trend of aggregate-bitumen interface shear strength of NHSSMA with temperature is generally consistent with that of BA. Moreover, the aggregate-bitumen interface shear strength of nano hydrophobic silane silica modified asphalt was always greater than base asphalt when the temperature was above −10 °C, which is because incorporation of nano hydrophobic silane silica can improve the viscosity and resistance to interface shear failure of asphalt. Asphalt tends to be in a glassy state at −20 °C and exhibits more brittleness than viscosity. At the test temperature of −20 °C, the incorporation of nano hydrophobic silane silica not only fails to improve the viscosity of the asphalt but also destroys the integrity and uniformity of asphalt, thereby causing the aggregate-bitumen interface shear strength of NHSSMA to be lower than that of BA at −20 °C.

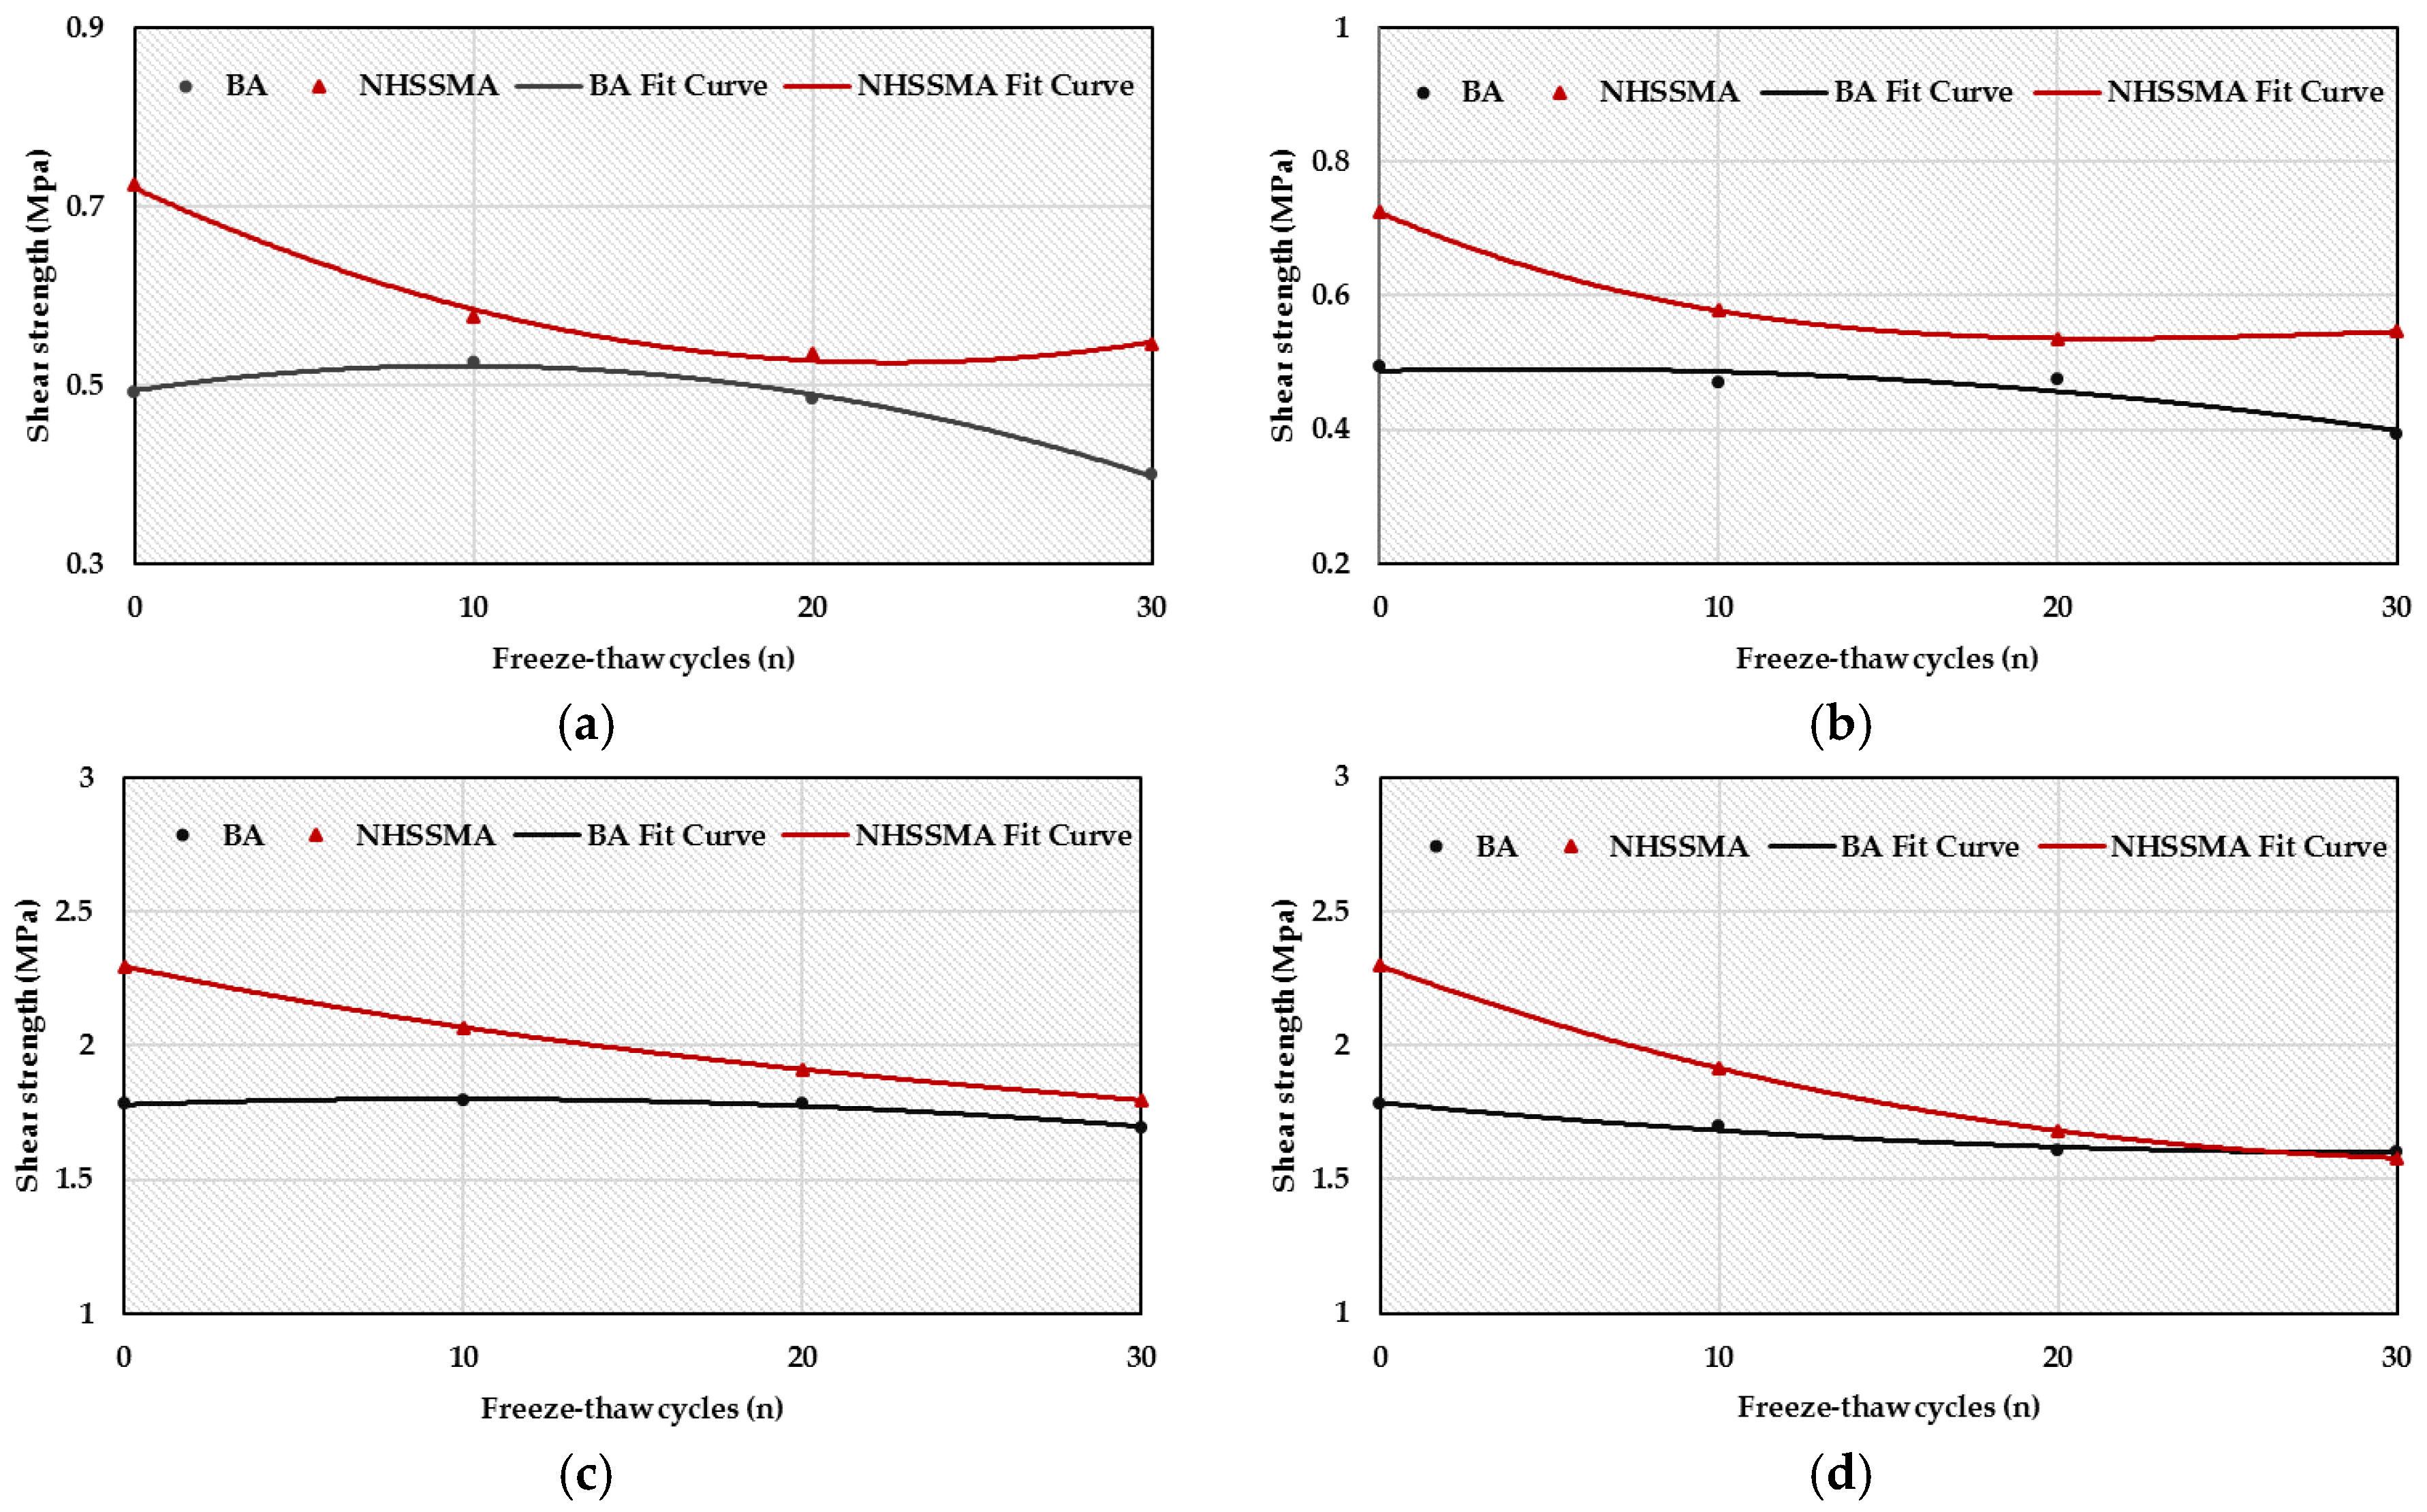
4.3. Effect of Freeze-Thaw Cycles on Aggregate-Bitumen Interface Shear Strength

In the seasonally frozen regions, freeze-thaw (F-T) damage is the main pavement disease, causing a variety of poor conditions in bitumen pavement, such as cracks, pits, potholes, and slush. In order to evaluate the effect of freeze-thaw cycles on aggregate-bitumen interface shear strength of NHSSMA, damaged BA and NHSSMA after 10, 20, and 30 F-T cycles were collected for an aggregate-bitumen interface shear strength test. The details of a freeze-thaw cycle test is described below.
First, neat and modified asphalt binders were heated to a fluid state and poured into a fixed-size plate to ensure the dimensions of asphalt binder samples was approximately 6 × 250 × 250 mm. The purpose of this was to make the thickness of the prepared asphalt binder samples as close as possible to the thickness of the asphalt film in the actual pavement.
Then, the samples were submerged in a container containing water, then the container with specimens were placed in the precision temp-enclosure at −15 °C and frozen for 10 h.
Finally, the base asphalt and modified asphalt samples were soaked in water at 15 °C for 16 h through adjusting the temperature controller.
As described above, a complete freeze-thaw aging cycle was completed. Then, after 10, 20, and 30 freeze-thaw aging cycles, damaged samples were collected for aggregate-bitumen interface shear strength test to evaluate the effect of freeze-thaw cycles on aggregate-bitumen interface shear strength of NHSSMA. Moreover, another set of experiments was designed to consider the effect of snow-melting agent on asphalt in the spring-thaw season. A 20% concentration of CaCl2 solution was selected for the F-T cycle. The aggregate-bitumen interface shear strength of modified and unmodified asphalt with freeze-thaw cycles under different conditions are given in Figure 9.
As shown in Figure 9a, 10 °C aggregate-bitumen interface shear strength of BA increases with the increase of F-T cycles, and then decreases slightly. After 30 F-T cycles, 10 °C aggregate-bitumen interface shear strength of BA decreased by 18.9% to 0.4 MPa. The 10 °C aggregate-bitumen interface shear strength of NHSSMA decreased with the increase of F-T cycles. After 30 F-T cycles, 10 °C aggregate-bitumen interface shear strength of NHSSMA decreased by 24.6% to 0.546 MPa. It can be seen that 10 °C aggregate-bitumen interface shear strength decay rate of NHSSMA is greater than BA under the F-T cycles, but 10 °C aggregate-bitumen interface shear strength of NHSSMA is still higher than that of BA at different F-T cycles. This indicates that the incorporation of NHSS increases the 10 °C aggregate-bitumen interface shear strength of asphalt under the F-T cycles.
It can be concluded from Figure 9b that the snow-melting agent has a greater influence on 10 °C aggregate-bitumen interface shear strength, and the decay rate under a snow-melting agent is higher than that under clear water. After 30 F-T cycles, 10 °C aggregate-bitumen interface shear strength of BA and NHSSMA decreased by 20.3% and 43.4%, respectively. However, whether it is a clear water or CaCl2 solution, 10 °C aggregate-bitumen interface shear strength of NHSSMA is greater than that of BA. This shows that NHSS can improve the aggregate-bitumen interface shear strength of asphalt in the spring-thaw season.
As shown in Figure 9c,d, after 30 F-T cycles, −10 °C aggregate-bitumen interface shear strength of BA and NHSSMA decreased by 4.8% and 21.8%, respectively. After 30 F-T cycles, −10 °C aggregate-bitumen interface shear strength of BA and NHSSMA with snow-melting agent decreased by 10% and 31.3%, respectively. The variation of aggregate-bitumen interface shear strength with F-T cycles at −10 °C is basically the same as that of 10 °C.
In summary, the aggregate-bitumen interface shear strength of modified and unmodified asphalt decreases with the increase of F-T cycle, which is due to the aging of asphalt caused by the F-T cycle. The snow-melting agent has a greater influence on aggregate-bitumen interface shear strength, and the decay rate under the snow-melting agent is higher than that under clear water. This may be due to the chemical reaction of chloride ions in the snow-melting agent with the asphalt, further aggravating the aging of the asphalt. Whether it is a clear water or CaCl2 solution, the aggregate-bitumen interface shear strength of NHSSMA is greater than that of BA. This indicates that NHSS can improve the aggregate-bitumen interface shear strength of asphalt in the spring-thaw season. Moreover, the data also show that the aggregate-bitumen interface shear strength of modified and unmodified asphalt is less affected by F-T cycles at low temperatures relative to high temperatures. This also explains that pavement moisture damage mainly occurs in warm springs rather than cold winters.

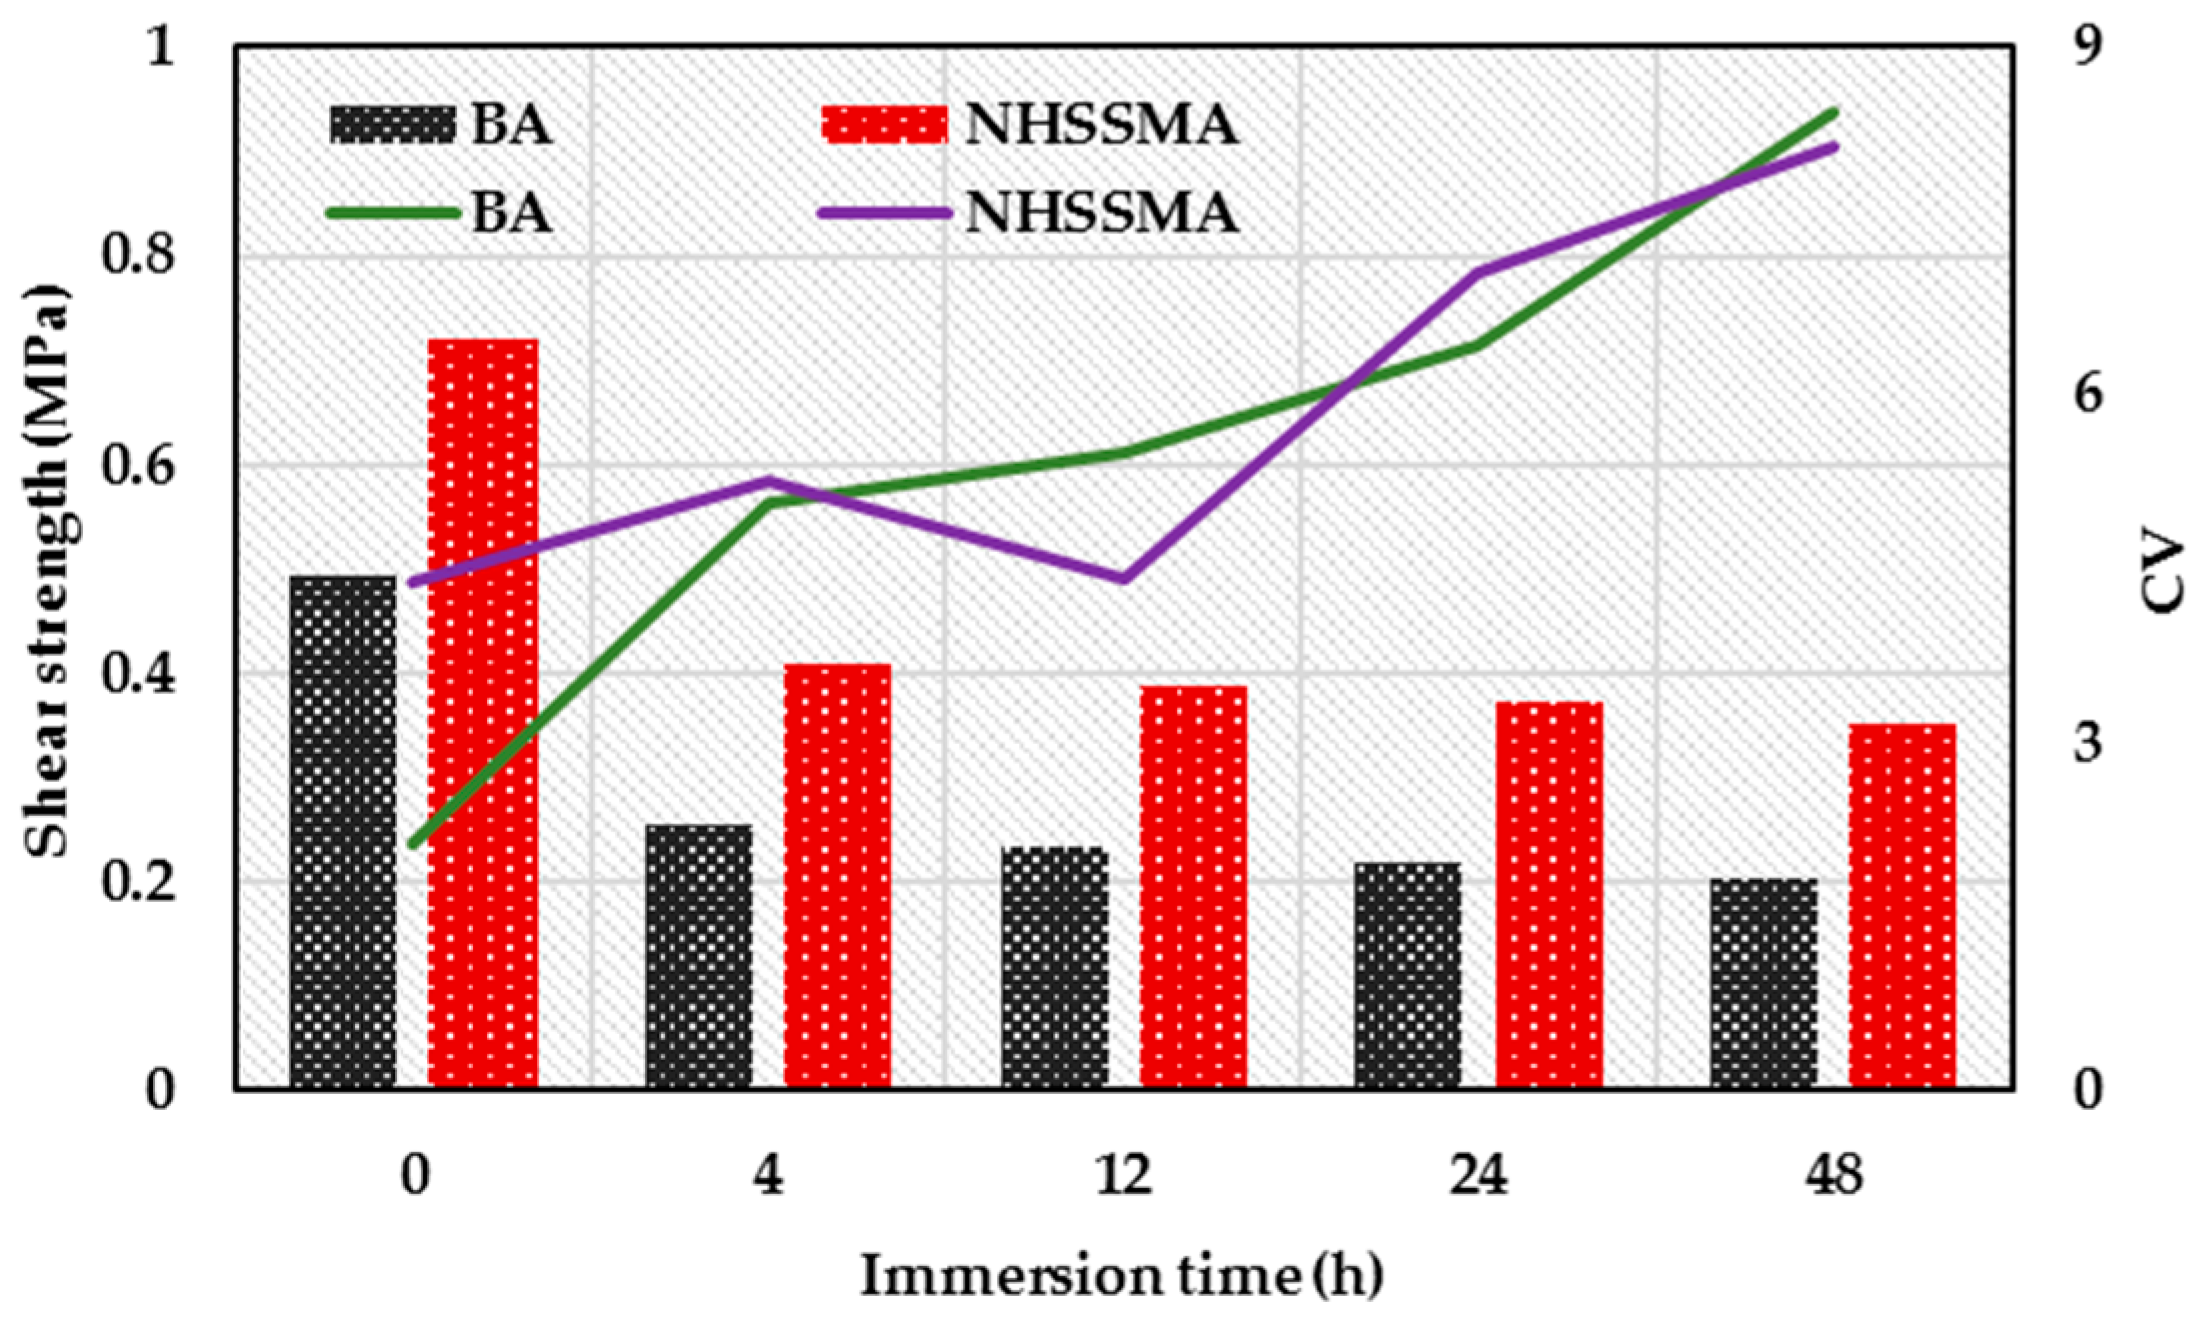
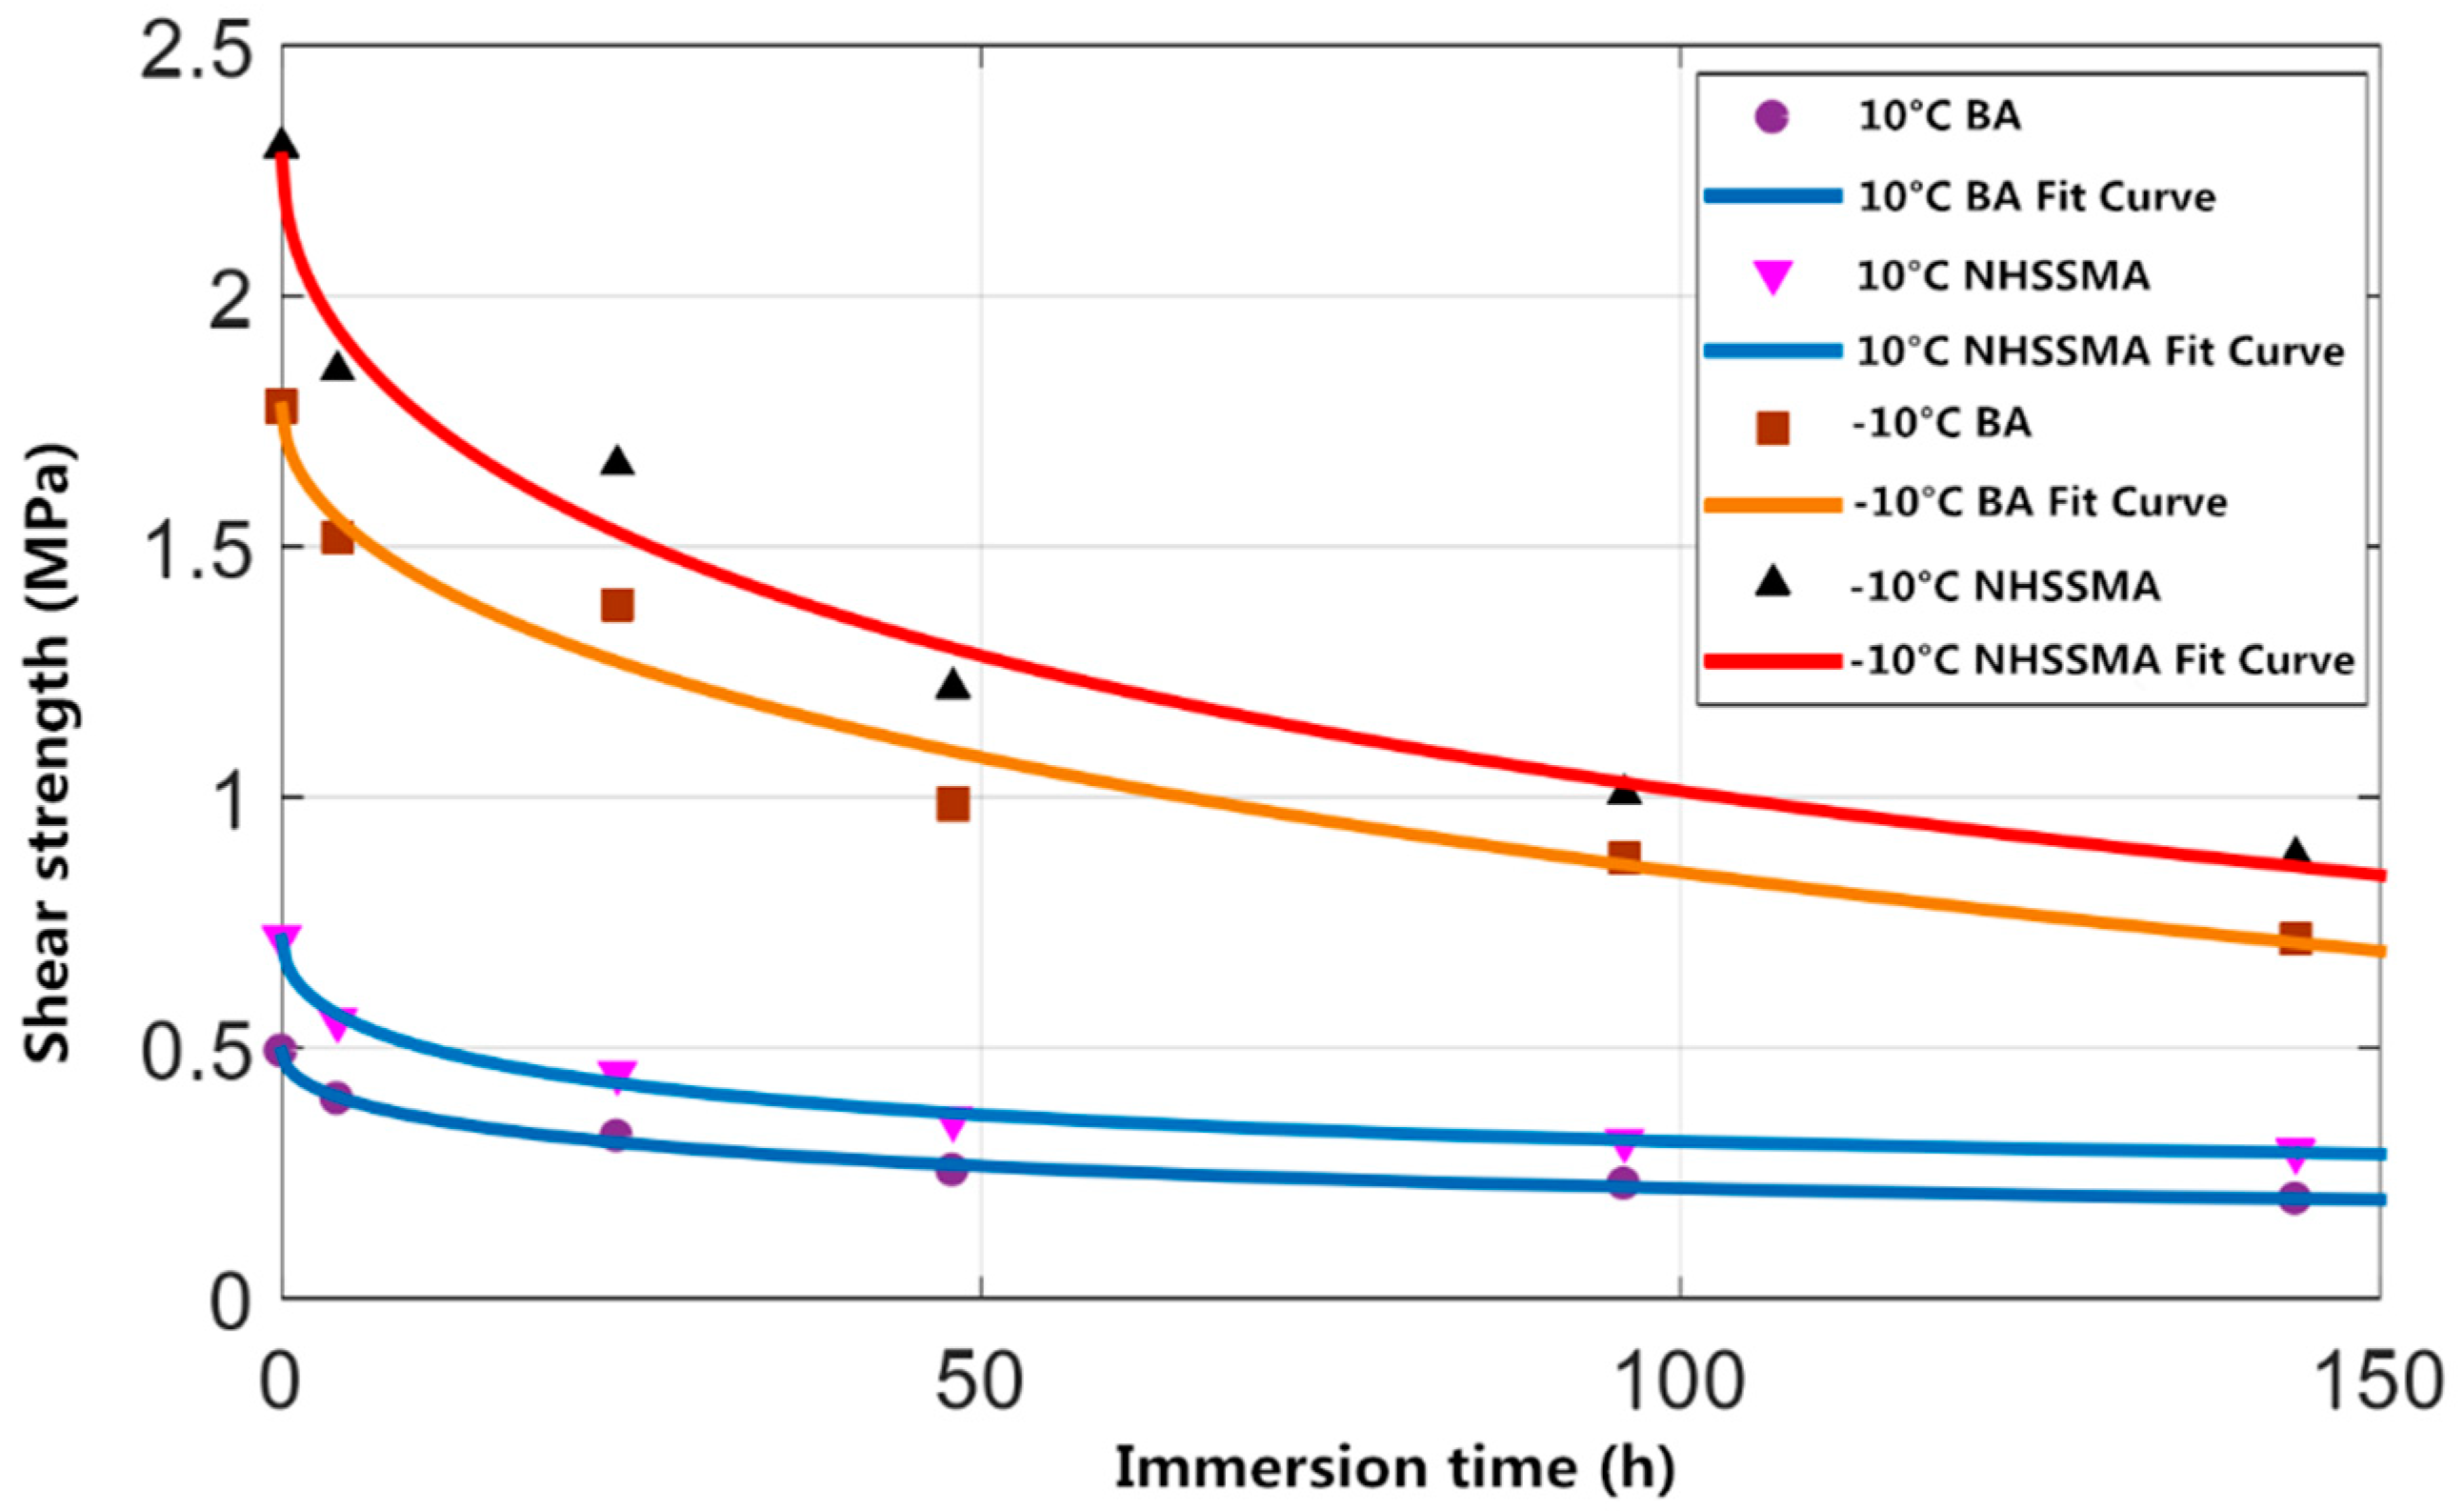
4.4. Effect of Moisture on Aggregate-Bitumen Interface Shear Strength

In the spring-thaw season, after the asphalt film breaks, the aggregate-bitumen interface will be exposed to the moisture environment and the penetration speed of the moisture to the aggregate-bitumen interface will increase exponentially compared with the diffusion speed through the asphalt film. In order to evaluate the variation of the shear strength of the aggregate-bitumen interface that is directly exposed to the moisture environment, the dry test shear sample was completely immersed in a water bath at 10 °C for 4, 8, 24, and 48 h and then taken out for testing. The test results include the average aggregate-bitumen interface shear strength and coefficient of variation (CV). The formula for CV is as follows.
CV = σ μ ,
where σ is data standard deviation and μ is data average. The test results are given in Figure 10. It can be seen from Figure 10 that 10 °C aggregate-bitumen interface shear strength of BA and NHSSMA gradually decrease with increasing immersion time, and the shear strength decreased significantly in the early stage of water immersion. After 4 h of immersion, 10 °C aggregate-bitumen interface shear strength of NHSSMA and BA are greatly reduced, with a decrease of 43.1% and 48.3%, respectively. After that, 10 °C aggregate-bitumen interface shear strength of modified and unmodified asphalt decreases slowly as the immersion time increases. After 48 h of immersion, 10 °C aggregate-bitumen interface shear strength of NHSSMA and BA are reduced by 51% and 55.4%, respectively. This indicates that when the asphalt film has a large range of rupture, the moisture can quickly penetrate into the aggregate-bitumen interface, which has a significant effect on the aggregate-bitumen interface shear strength. Moreover, whether it is strength value or the descend range, NHSSMA is better than BA at different immersion times, which indicates that the addition of nano hydrophobic silane silica improves the ability of asphalt binder to resist moisture damage.
As seen in Figure 10, CV of test results for modified and unmodified asphalt gradually increase with the immersion time, and CV of test results for the two types of asphalt binders is smallest when the immersion time is zero. This indicates that the aggregate-bitumen interface shear strength test can obtain more accurate data in the dry environment, and the longer the immersion time, the greater the discreteness of the test data. CV of all test results measured in this paper is within 8.4%, which proves that the aggregate-bitumen interface shear strength test has good repeatability.

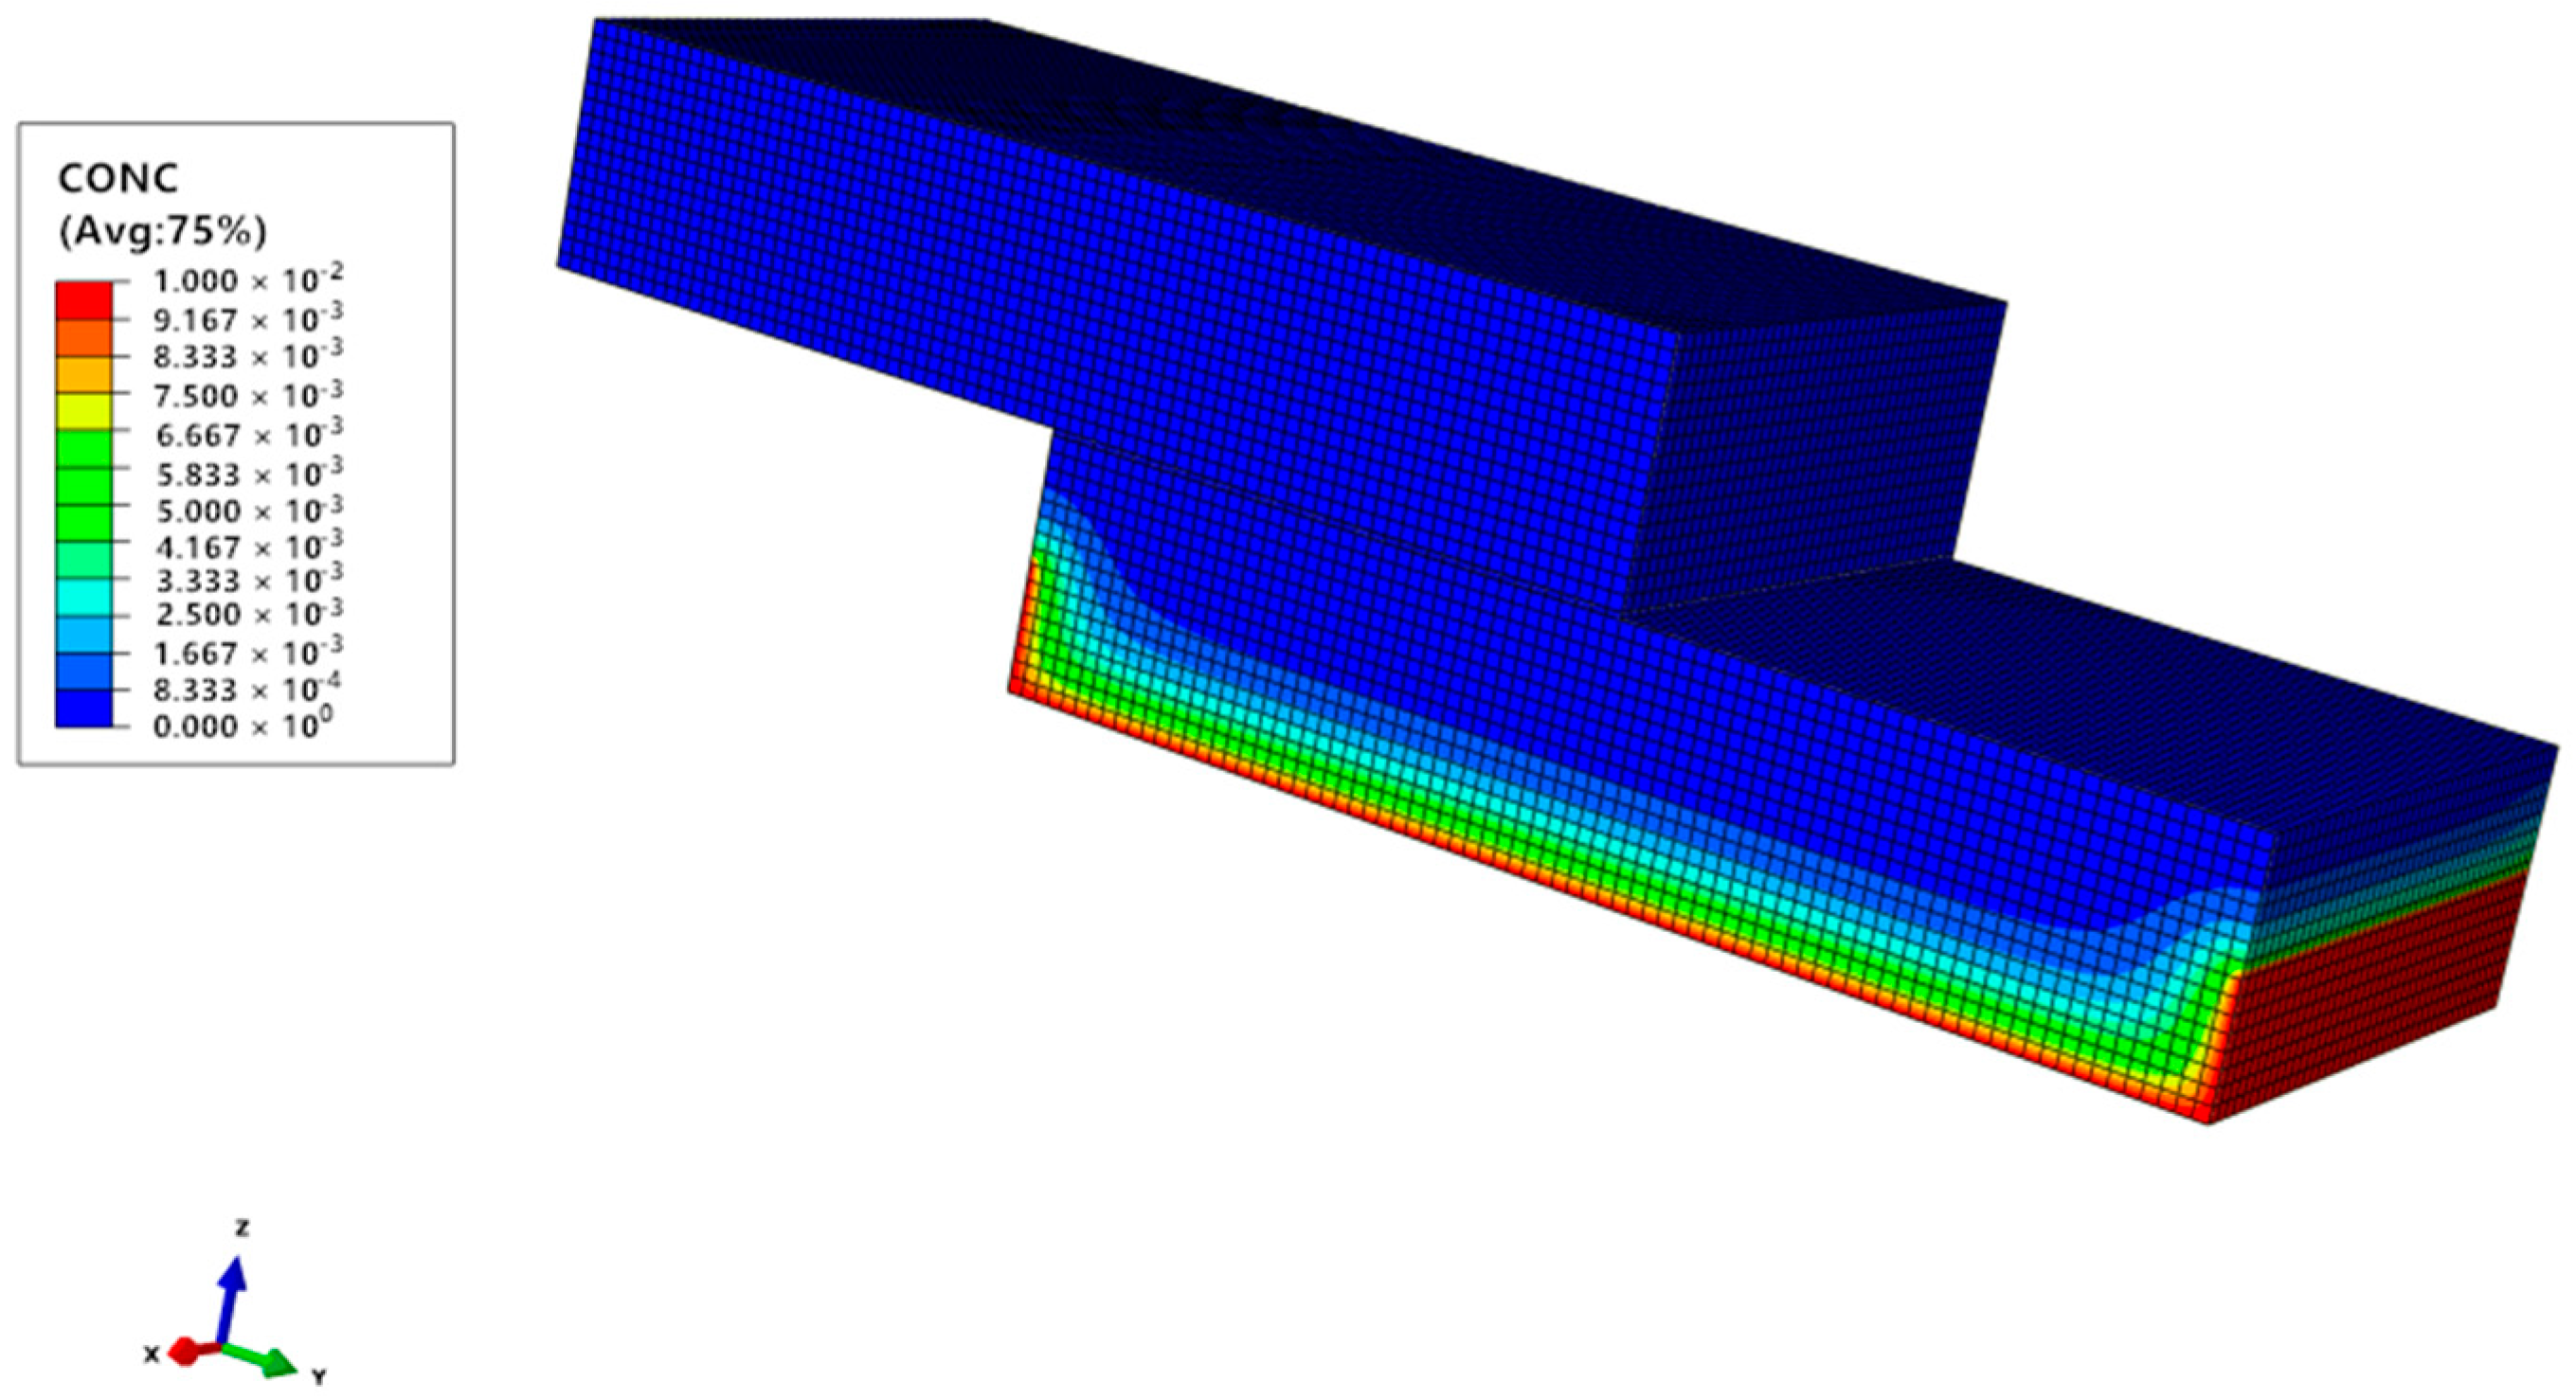
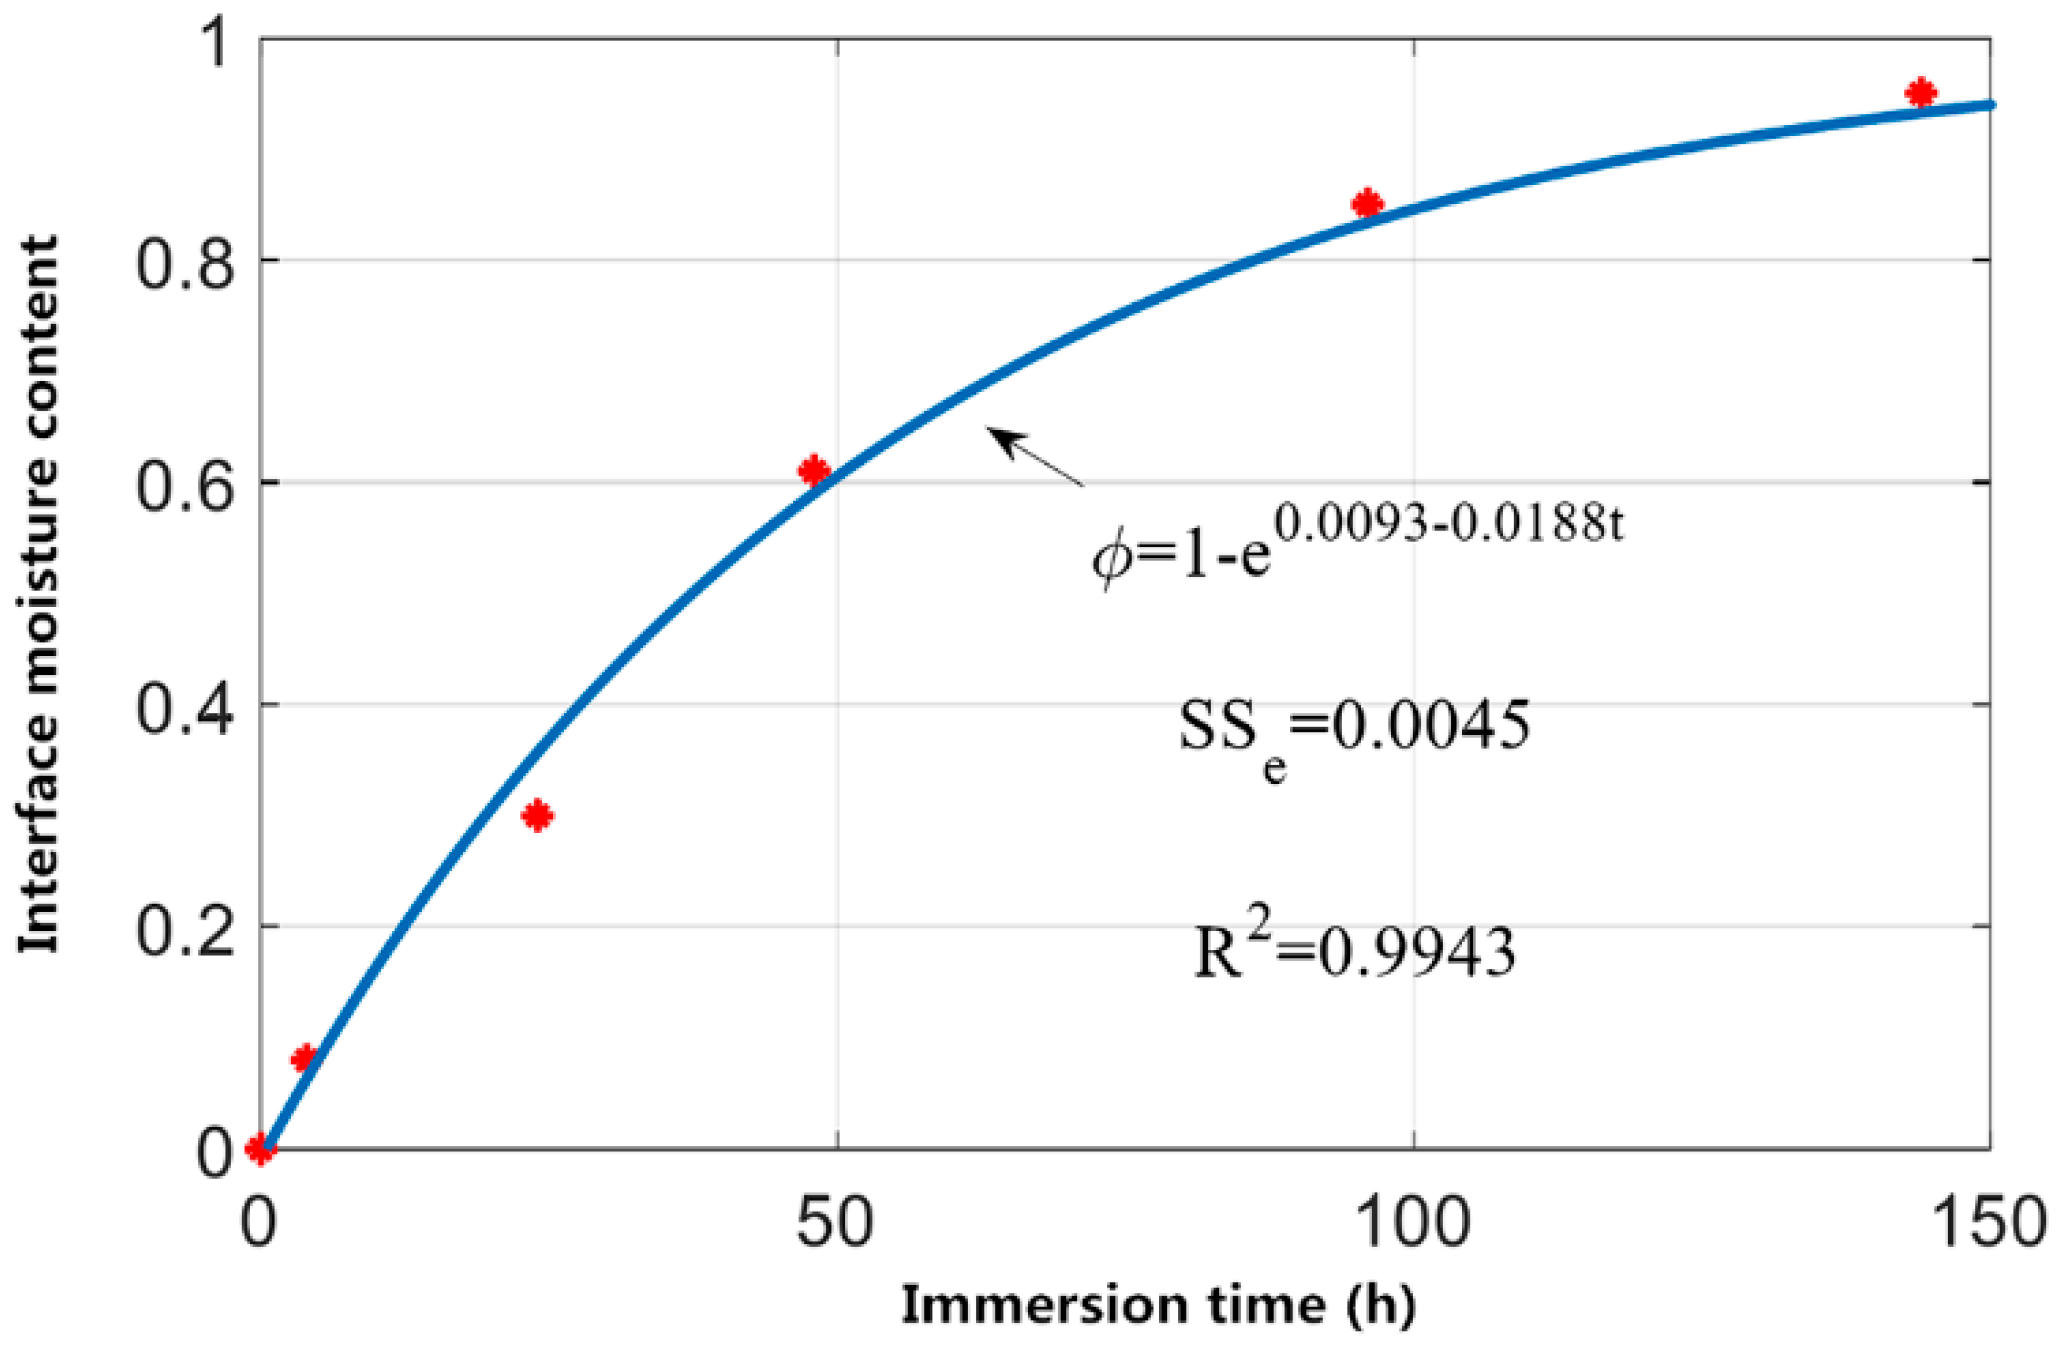
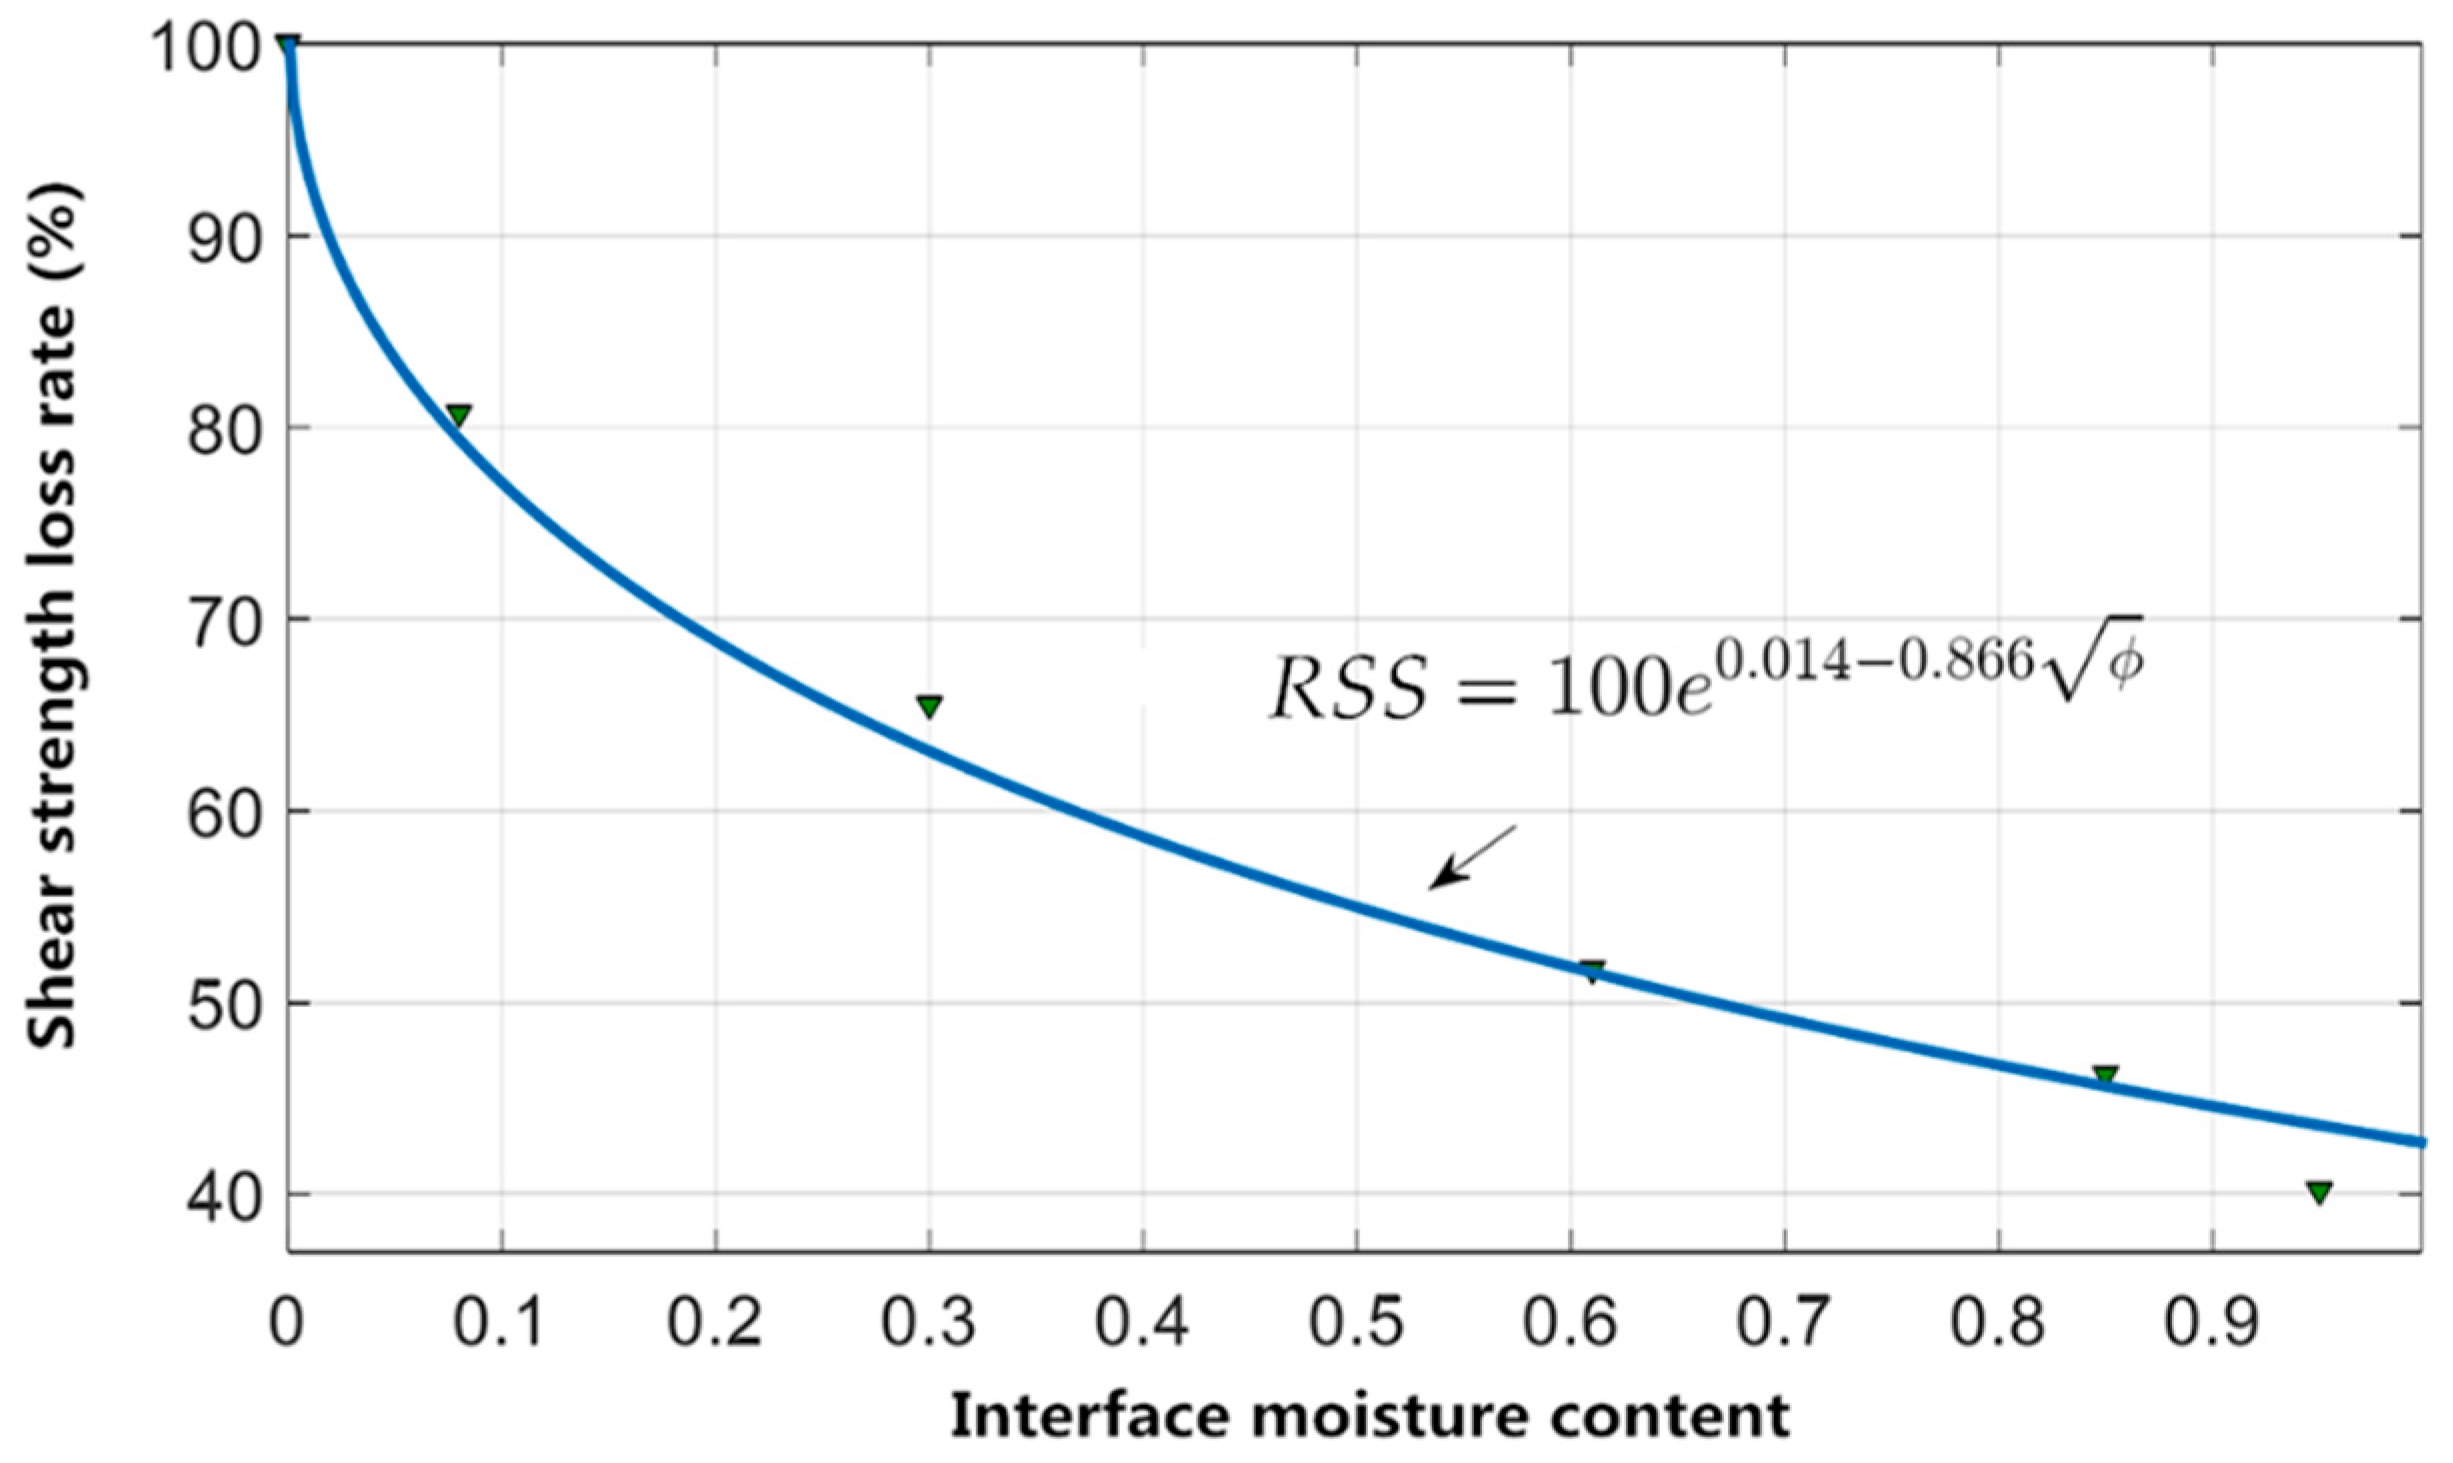
4.5. Establishment of Moisture Damage Model of Aggregate-Bitumen Interface Shear Strength

The aggregate-bitumen interface bond strength plays an important role in the pavement performance of bituminous pavement. Generally speaking, the stone is more hydrophilic compared with asphalt. In the spring-thaw season, after the moisture penetrates into the aggregate-bitumen interface, the moisture tends to wet more stone surface, which causes the bond failure between stone and asphalt, forcing the asphalt film to peel off from the stone surface. In order to evaluate the influence of interfacial moisture content on aggregate-bitumen interface shear strength of NHSSMA, a research method combining numerical calculations and laboratory tests was proposed. First, the relation between aggregate-bitumen interface shear strength and immersion time was established through laboratory tests. Secondly, the relationship between immersion time and interfacial moisture content was determined by Abaqus finite element software. Finally, the relationship between the interfacial moisture content and aggregate-bitumen interface shear strength was established by the intermediate indicator of the immersion time.
The laboratory test refers to the aggregate-bitumen interface bond strength test of Section 3, the test shear sample was immersed in water at 10 °C and the immersion height was half the thickness of the lower test mold, approximately 5 mm. After 4, 24, 48, 96, and 144 h of water immersion, the damaged test shear sample was collected for shear test immediately. When the test temperature of shear test was −10 °C, the damaged test shear sample needed to be packaged with plastic wrap and placed in a temperature control box at −10 °C for 2 h. The shear test was carried out after the temperature of the test shear sample was stabilized at −10 °C. The test results are shown in Figure 11.
It can be seen from Figure 11 that the short-dated immersion can greatly reduce the aggregate-bitumen interface shear strength. After 48 h of water immersion, the interfacial moisture content tends to be stable, the 10 °C aggregate-bitumen interface shear strength of modified and unmodified asphalt are reduced by 48.3% and 50.3%, and the −10 °C aggregate-bitumen interface shear strength of modified and unmodified asphalt are reduced by 44.5% and 47%, respectively. Thereafter, as the immersion time increases, the aggregate-bitumen interface shear strength of modified and unmodified asphalt enters a stage of steady decline. When the immersion time reached 144 h, 10 °C aggregate-bitumen interface shear strength of BA and NHSA asphalt are reduced by 59.9% and 59.3%, and −10 °C aggregate-bitumen interface shear strength of modified and unmodified asphalt is reduced by 59.7% and 61.6%, respectively. The 10 or −10 °C aggregate-bitumen interface shear strength of nano hydrophobic silane silica modified asphalt is higher than that of base asphalt by nearly 80% at any immersion time, and the modification effect is remarkable.
Through the above tests, the relationship between aggregate-bitumen interface shear strength of modified and unmodified asphalt and immersion time was obtained. In order to further explore the effect of interfacial moisture content on aggregate-bitumen interface shear strength, it is necessary to quantify interfacial moisture content.
In this paper, the Mass Diffusion module of Abaqus finite element software was applied for interfacial moisture content calculation. Abaqus/Standard provides transient and steady-state models for calculating the diffusion of one material to another. The control equation used in the calculation was an extended form of Fick diffusion law, which can be used to calculate the diffusion of a non-uniform solubility material in the base material. The control equations and constitutive relations used in the calculation are as follows.
(1) Control equation
The calculation of the percolation diffusion issue obeys the mass conservation law of the diffusion phase.
V d c d t d V + S n · J d S = 0 ,
where c is mass concentration of diffusion material, V is any volume, S is surface of V , n is the out-of-plane normal direction of S , J is the diffusion flux of the diffusion phase, and t is the time. Apply the divergence theorem to get the following formula.
V ( d c d t + x · J ) d V = 0.
Due to the arbitrariness of the volume, the following formula can be obtained.
V δ ϕ ( d c d t + x · J ) d V = 0 ,
where δ ϕ is an arbitrary continuous scalar field. The above formula can be extended to the following formula.
V [ δ ϕ ( d c d t ) + x · ( δ ϕ J ) J · δ ϕ x ] d V = 0 ,
where ϕ is the standard concentration, φ = c / s , s is the solubility of the diffusion material in the base material. The following formula is obtained by applying the divergence theorem again.
V [ δ ϕ ( d c d t ) δ ϕ x · J ] d V + S δ ϕ n · J d S = 0.
(2) Constitutive relationship
Diffusion is assumed to chemical potential gradient drive, and the basic constitutive relationship is as shown in the following equation.
J = sD · [ ϕ x + k s x ( l n ( θ θ z ) ) + k p p x ] ,
where, D ( c , θ , f ) is the diffusion coefficient; s ( θ , f ) is solubility; k s ( c , θ , f ) is the Sorel effect factor, related to the temperature gradient and affects the diffusion; θ is the temperature; θ z is all zero degrees; k p ( c , θ , f ) is the compressive stress factor and is related to the equivalent compressive stress gradient p , which affects the diffusion; f is any predefined field variable.
The size of simulated model is consistent with the size of the actual shear specimen, which is composed of two 40 × 40 × 10 mm cubic granite stones. The main parameter is the moisture diffusion coefficient of the rock material (Drock), and Drock is 0.6 mm2/h according to the granite stone. The boundary condition is that the water immersion is half of the height of the lower block, so the water concentration of all surfaces below the 1/2 height of the block is 1. The collected data is the interfacial moisture content at different immersion times in the calculation, and the total immersion time is 144 h. All conditions of the calculation are consistent with the actual situation. The interfacial moisture content is calculated as follows.
ϕ = C m C m m a x ,
where ϕ is the interfacial moisture content, C m is the interfacial moisture concentration, C m m a x is the extreme limit of interfacial moisture concentration. If ϕ = 1 , it means that the moisture at the interface has reached a state of saturation. Figure 12 shows the moisture content of shear specimen at 4 h of immersion.
Figure 13 shows fitting curve of interfacial moisture content with immersion time. It can be seen from Figure 13 that interfacial moisture content increases rapidly at the early stage of immersion, and can reach 60% of the extreme limit of interfacial moisture concentration after 50 h of immersion. After 100 h of immersion, the interfacial moisture content tends to be saturated, and the growth rate is obviously slowed down.
According to the test results and numerical calculation results, the relationship between aggregate-bitumen interface shear strength and interfacial moisture content can be obtained, as shown in Table 4.
According to Table 4, it can be clearly found that the fitting result is better at higher temperatures, indicating that acquired data is relatively stable at higher temperatures and has better regularity, and the dispersion of data is slightly larger at lower temperatures. In order to establish aggregate-bitumen interface shear strength damage model of modified and unmodified asphalt binder, a residual shear strength index (RSS) is proposed. The residual shear strength is calculated as follows.
RSS = S S n S S 0 × 100 ,
where RSS is residual aggregate-bitumen interface shear strength, S S 0 is the aggregate-bitumen interface shear strength when interfacial moisture content is 0, S S n is the aggregate-bitumen interface shear strength at different interfacial moisture content. Figure 14 shows fitting curve of 10 °C residual aggregate-bitumen interface shear strength of BA with interfacial moisture content.
The regression equation of damage model and the corresponding value of each model is shown in Table 5. The moisture damage model of aggregate-bitumen interface shear strength is effective, because all R2 of the regression equation are above 0.9. In order to compare the model parameters and analyze physical meaning, the model parameter a is defined as shear strength damage degree, and the value of b represents the aggregate-bitumen interface shear strength damage rate. It can be clearly seen from Table 5 that the damage degree of NHSSMA is larger than BA in the test temperature range, which indicates that the modified asphalt is more sensitive to interfacial moisture, especially at lower temperature. Interestingly, NHSSMA is more sensitive to interfacial moisture, but it can still provide greater aggregate-bitumen interface shear strength than BA at any interfacial moisture content. This may be due to the fact that the incorporation of the nano hydrophobic silane silica does not change the moisture-sensitive properties of aggregate-bitumen interface, but it can improve the viscosity of asphalt, thus the incorporation of nano hydrophobic silane silica improves the bond strength between asphalt and aggregate in a moisture environment.
It can be seen from Table 5 that the damage factor b of modified and unmodified asphalt at low temperature is greater than that at high temperature, which indicates that the damage rate of aggregate-bitumen interface shear strength is faster at higher temperature. Aggregate-bitumen interface shear strength of BA at −10 °C is about 3.6~4.3 times that at of BA at 10 °C, and aggregate-bitumen interface shear strength of NHSSMA at −10 °C is about 3~3.7 times that at of NHSSMA at 10 °C. Thus, the aggregate-bitumen interface bond failure is most likely to occur in the spring-thaw season.

5. Conclusions

The effect of hydrophobic nano-silica on aggregate-bitumen interface bond strength in spring-thaw season was assed.
In this paper, the effect of nano hydrophobic silane silica on the interface bond strength in spring-thaw season was systematically investigated according to self-designed aggregate-bitumen interface bond strength test. The results indicated that the addition of nano hydrophobic silane silica improves the ability of aggregate-bitumen interface to resist moisture damage in the spring-thaw season. The main conclusions are as follows:
  • The aggregate-bitumen interface bond strength test results illustrated that the shear failure dominated the aggregate-bitumen interface bonding failure in the spring-thaw season.
  • The aggregate-bitumen interface shear strength test showed that temperature and moisture had a significant effect on interface shear strength of modified and unmodified asphalt. Moreover, the addition of NHSS could increase the aggregate-bitumen interface shear strength under any working conditions.
  • Based on a research method combining numerical calculations and laboratory tests, the moisture damage model of aggregate-bitumen interface shear strength of BA and NHSSMA was established. Model parameter a and parameter b could be used to evaluate the moisture damage degree and moisture damage rate of aggregate-bitumen interface shear strength, respectively.

Author Contributions

Data curation, W.G., Y.L. and M.S.; Formal analysis, W.G.; Funding acquisition, X.G.; Investigation, Y.L. and M.S.; Methodology, W.G.; Project administration, X.G. and W.D.; Software, W.G.; Writing—original draft, W.G., J.L. and M.S.; Writing—review and editing, X.G. and W.D.

Funding

This research was funded by the National Nature Science Foundation of China (NSFC) (Grant No. 51178204).

Conflicts of Interest

The authors declare no conflict of interest.

References

  1. Zhang, D.; Chen, M.Z.; Wu, S.P.; Riara, M.; Wan, J.M.; Li, Y.Y. Thermal and rheological performance of asphalt binders modified with expanded graphite/polyethylene glycol composite phase change material (EP-CPCM). Constr. Build. Mater. 2019, 194, 83–91. [Google Scholar] [CrossRef]
  2. El-Hakim, M.; Tighe, S.L. Impact of freeze-thaw cycles on mechanical properties of asphalt mixes. Transp. Res. Rec. 2014, 2444, 20–27. [Google Scholar] [CrossRef]
  3. Porto, M.; Caputo, P.; Loise, V.; Eskandarsefat, S.; Teltayev, B.; Rossi, C.O. Bitumen and bitumen modification: A review on latest advances. Appl. Sci. 2019, 9, 742. [Google Scholar] [CrossRef]
  4. Rossi, C.O.; Teltayev, B.; Angelico, R. Adhesion promoters in bituminous road materials: A review. Appl. Sci. 2017, 7, 524. [Google Scholar] [CrossRef]
  5. Ji, J.; Yao, H.; Liu, L.H.; Suo, Z.; Zhai, P.; Yang, X.; You, Z.P. Adhesion evaluation of asphalt-aggregate interface using surface free energy method. Appl. Sci. 2017, 7, 156. [Google Scholar] [CrossRef]
  6. Wang, W.T.; Wang, L.B.; Xiong, H.C.; Luo, R. A review and perspective for research on moisture damage in asphalt pavement induced by dynamic pore water pressure. Constr. Build. Mater. 2019, 204, 631–642. [Google Scholar] [CrossRef]
  7. Mozaffari, S.; Tchoukov, P.; Atias, J.; Czarnecki, J.; Nazemifard, N. Effect of Asphaltene Aggregation on Rheological Properties of Diluted Athabasca Bitumen. Energy Fuels 2015, 29, 5595–5599. [Google Scholar] [CrossRef]
  8. Luo, R.; Huang, T.T.; Zhang, D.R.; Lytton, R.L. Water vapor diffusion in asphalt mixtures under different relative humidity differentials. Constr. Build. Mater. 2017, 136, 126–138. [Google Scholar] [CrossRef]
  9. Molenaar, A.A.A.; Hagos, E.T.; van de Ven, M.F.C. Effects of aging on the mechanical characteristics of bituminous binders in PAC. J. Mater. Civ. Eng. 2010, 22, 779–787. [Google Scholar] [CrossRef]
  10. Mozaffari, S.; Tchoukova, P.; Mozaffari, A.; Atias, J.; Czarnecki, J.; Nazemifard, N. Capillary driven flow in nanochannels—Application to heavy oil rheology studies. Colloids Surf. A. 2017, 513, 178–187. [Google Scholar] [CrossRef]
  11. Nian, T.F.; Li, P.; Wei, X.Y.; Wang, P.H.; Li, H.S.; Guo, R. The effect of freeze-thaw cycles on durability properties of SBS-modified bitumen. Constr. Build. Mater. 2018, 187, 77–88. [Google Scholar] [CrossRef]
  12. Darjani, S.; Koplik, J.; Pauchard, V. Extracting the equation of state of lattice gases from random sequential adsorption simulations by means of the Gibbs adsorption isotherm. Phys. Rev. E 2017, 96, 052803. [Google Scholar] [CrossRef] [PubMed] [Green Version]
  13. Airey, G.D.; Collop, A.C.; Zoorob, S.E.; Elliott, R.C. The influence of aggregate, filler and bitumen on asphalt mixture moisture damage. Constr. Build. Mater. 2008, 22, 2015–2024. [Google Scholar] [CrossRef]
  14. Wang, H.; Li, E.Q.; Xu, G.J. Molecular dynamics simulation of asphalt-aggregate interface adhesion strength with moisture effect. Int. J. Pavement Eng. 2017, 18, 414–423. [Google Scholar] [CrossRef]
  15. Cucalon, L.G.; Bhasin, A.; Kassem, E.; Little, D.; Herbert, B.E.; Masad, E. Physicochemical characterization of binder-aggregate adhesion varying with temperature and moisture. J. Transp. Eng. Part B Pavement. 2017, 143, 04017007. [Google Scholar] [CrossRef]
  16. Berdahl, P.; Akbari, H.; Levinson, R. Weathering of roofing materials—An overview. Constr. Build. Mater. 2008, 22, 423–433. [Google Scholar] [CrossRef]
  17. Liu, F.; Darjani, S.; Akhmetkhanova, N.; Maldarelli, C.; Banerjee, S.; Pauchard, V. Mixture Effect on the Dilatation Rheology of Asphaltenes-Laden Interfaces. Langmuir 2017, 33, 1927–1942. [Google Scholar] [CrossRef]
  18. Lin, Y.M.; Hu, C.C.; Adhikari, S.; Wu, C.H.; Yu, M. Evaluation of Waste Express Bag as a Novel Bitumen Modifier. Appl. Sci. 2019, 9, 1242. [Google Scholar] [CrossRef]
  19. Kok, B.V.; Yilmaz, M. The effects of using lime and styrene-butadiene-styrene on moisture sensitivity resistance of hot mix asphalt. Constr. Build. Mater. 2009, 23, 1999–2006. [Google Scholar] [CrossRef]
  20. Sengoz, B.; Agar, E. Effect of asphalt film thickness on the moisture sensitivity characteristics of hot-mix asphalt. Build. Sci. 2007, 42, 3621–3628. [Google Scholar] [CrossRef]
  21. Yang, X.L.; Shen, A.Q.; Guo, Y.C.; Zhou, S.B.; He, T.Q. Deterioration mechanism of interface transition zone of concrete pavement under fatigue load and freeze-thaw coupling in cold climatic areas. Constr. Build. Mater. 2018, 160, 588–597. [Google Scholar] [CrossRef]
  22. Caro, S.; Masad, E.; Bhasin, A.; Little, D. Moisture susceptibility of asphalt mixtures, Part 1: Mechanisms. Int. J. Pavement Eng. 2008, 9, 81–98. [Google Scholar] [CrossRef]
  23. Preeda, C.; Hussain, U.B. Effect of moisture on the cohesion of asphalt mastics and bonding with surface of aggregates. Road Mater. Pavement Des. 2018, 19, 741–753. [Google Scholar] [CrossRef]
  24. Apeagyei, A.K.; Grenfell, J.R.A.; Airey, G.D. Observation of reversible moisture damage in asphalt mixtures. Constr. Build. Mater. 2014, 60, 73–80. [Google Scholar] [CrossRef] [Green Version]
  25. Zhang, J.Z.; Airey, G.D.; Grenfell, J.; Apeagyei, A.K. Moisture damage evaluation of aggregate-bitumen bonds with the respect of moisture absorption, tensile strength and failure surface. Road Mater. Pavement Des. 2017, 18, 833–848. [Google Scholar] [CrossRef]
  26. Cho, D.W.; Kim, K. The mechanisms of moisture damage in asphalt pavement by applying chemistry aspects. KSCE J. Civil Eng. 2010, 14, 333–341. [Google Scholar] [CrossRef]
  27. Caro, S.; Masad, E.; Bhasin, A.; Little, D. Micromechanical modeling of the influence of material properties on moisture-induced damage in asphalt mixtures. Constr. Build. Mater. 2010, 24, 1184–1192. [Google Scholar] [CrossRef]
  28. Moraes, R.; Velasquez, R.; Bahia, H.U. Measuring the effect of moisture on asphalt-aggregate bond with the bitumen bond strength test. Transp. Res. Rec. 2011, 2209, 70–81. [Google Scholar] [CrossRef]
  29. Yao, H.; Dai, Q.L.; You, Z.P. Chemo-physical analysis and molecular dynamics (MD) simulation of moisture susceptibility of nano hydrated lime modified asphalt mixtures. Constr. Build. Mater. 2015, 101, 536–547. [Google Scholar] [CrossRef] [Green Version]
  30. Tarefder, R.A.; Zaman, A.M. Nanoscale evaluation of moisture damage in polymer modified asphalts. J. Mater. Civ. Eng. 2010, 22, 714–725. [Google Scholar] [CrossRef]
  31. Rossi, C.O.; Ashimova, S.; Calandra, P.; De Santo, M.P.; Angelico, R. Mechanical resilience of modified bitumen at different cooling rates: A rheological and atomic force microscopy investigation. Appl. Sci. 2017, 7, 779. [Google Scholar] [CrossRef]
  32. Yusoff, N.I.M.; Breem, A.A.S.; Alattug, H.N.M.; Hamim, A.; Ahmad, J. The effects of moisture susceptibility and ageing conditions on nano-silica/polymer-modified asphalt mixtures. Constr. Build. Mater. 2014, 72, 139–147. [Google Scholar] [CrossRef]
  33. Gorkem, C.; Sengoz, B. Predicting stripping and moisture induced damage of asphalt concrete prepared with polymer modified bitumen and hydrated lime. Constr. Build. Mater. 2009, 23, 2227–2236. [Google Scholar] [CrossRef]
  34. Palit, S.K.; Reddy, K.S.; Pandey, B.B. Laboratory evaluation of crumb rubber modified asphalt mixes. J. Mater. Civ. Eng. 2004, 16, 45–53. [Google Scholar] [CrossRef]
  35. Goh, S.W.; Akin, M.; You, Z.P.; Shi, X.M. Effect of deicing solutions on the tensile strength of micro- or nano-modified asphalt mixture. Constr. Build. Mater. 2011, 25, 195–200. [Google Scholar] [CrossRef]
  36. Mozaffari, S.; Li, W.H.; Thompson, C.; Ivanov, S.; Seifert, S.; Lee, B.; Kovarik, L.; Karim, A.M. Colloidal nanoparticle size control: Experimental and kinetic modeling investigation of the ligand metal binding role in controlling the nucleation and growth kinetics. Nanoscale 2017, 9, 13772–13785. [Google Scholar] [CrossRef]
  37. Guo, W.; Guo, X.D.; Sun, M.Z.; Dai, W.T. Evaluation of the durability and the property of an asphalt concrete with nano hydrophobic silane silica in spring-thawing season. Appl. Sci. 2018, 8, 1475. [Google Scholar] [CrossRef]
  38. Guo, W.; Guo, X.D.; Chang, M.Y.; Dai, W.T. Evaluating the effect of hydrophobic nanosilica on the viscoelasticity property of asphalt and asphalt mixture. Materials 2018, 11, 2328. [Google Scholar] [CrossRef] [PubMed]
Figure 1. Grafting process of silane coupling agent on nanosilica.
Applsci 09 02393 g001
Figure 2. Adhesive failure and cohesive failure at the aggregate-bitumen interface.
Applsci 09 02393 g002
Figure 3. Aggregate-bitumen interface bond strength tester.
Applsci 09 02393 g003
Figure 4. Aggregate-bitumen interface bond strength test mold.
Applsci 09 02393 g004
Figure 5. Aggregate-bitumen interface bond strength test tensile sample and shear sample.
Applsci 09 02393 g005
Figure 6. Test shear sample placed in the water bath.
Applsci 09 02393 g006
Figure 7. Tensile strength and shear strength of aggregate-bitumen interface for base asphalt (BA) and NHSS modified asphalt (NHSSMA) at different temperature.
Applsci 09 02393 g007
Figure 8. Aggregate-bitumen interface shear strength of BA and NHSSMA at different temperatures.
Applsci 09 02393 g008
Figure 9. The changes of aggregate-bitumen interface shear strength of BA and NHSSMA with freeze-thaw cycles under different conditions. (a) The 10 °C aggregate-bitumen interface shear strength of BA and NHSSMA under different freeze-thaw cycles. (b) The 10 °C aggregate-bitumen interface shear strength of BA and NHSSMA with snow-melting agent under different freeze-thaw cycles. (c) The −10 °C aggregate-bitumen interface shear strength of BA and NHSSMA under different freeze-thaw cycles. (d) The −10 °C aggregate-bitumen interface shear strength of BA and NHSSMA with snow-melting agent under different freeze-thaw cycles.
Applsci 09 02393 g009
Figure 10. The 10 °C aggregate-bitumen interface shear strength of BA and NHSSMA at different immersion times.
Applsci 09 02393 g010
Figure 11. Aggregate-bitumen interface shear strength of BA and NHSSMA at different immersion times.
Applsci 09 02393 g011
Figure 12. Moisture content of shear specimen at 4 h immersion time.
Applsci 09 02393 g012
Figure 13. Fitting curve of interfacial moisture content with immersion time.
Applsci 09 02393 g013
Figure 14. Fitting curve of 10 °C residual aggregate-bitumen interface shear strength of BA with interfacial moisture content.
Applsci 09 02393 g014
Table 1. Technical parameters of base asphalt.
Technical ParametersPenetration (0.1 mm)25 °C Ductility (cm)Softening Point (°C)Flash Point (°C)Solubility (%)Density (g·cm−3)
15 °C25 °C30 °C
Test results25.386.9142.4>13044.634099.91.003
Test procedureGB/T0606-2011GB/T0605-2011GB/T0606-2011GB/T0611-2011GB/T0607-2011GB/T0603-2011
Table 2. Technical parameters of nano hydrophobic silane silica.
Technical ParametersWater CharacteristicsBET (m2/g)Average Particle Size (nm)PH ValueSiO2 Content (%)
Test resultsHydrophobia125 ± 20125.0–8.0≥99.8
Standard values------130 ± 30≤203.7–6.5≥99.8
Test procedureGB/T20020GB/T20020GB/T20020GB/T20020GB/T20020
Table 3. Technical parameters of nano hydrophobic silane silica modified asphalt (NHSSMA).
Technical ParametersPenetration10 °C DuctilitySoftening PointPI Value135 °C Rotational Viscosity
15 °C25 °C30 °C
Units0.1 mmmm°C-mpa
Test results20.864.111523348.1−1.357912.1
Table 4. Fitting results of the relationship between aggregate-bitumen interface shear strength and interfacial moisture content.
Asphalt CategoryTest TemperatureRegression EquationEquation ParametersSSeR2
abc
BA10 °C SS = e a b ϕ c 0.1930.2760.7210.00010.99
BA−10 °C2.8060.06614.710.030.96
NHSSMA10 °C−0.2210.7640.0840.00010.99
NHSSMA−10 °C3.8970.02946.940.0230.98
SSe is residual sum of squares, R2 is determination coefficient.
Table 5. Fitting results of moisture damage model of aggregate-bitumen interface shear strength.
Asphalt CategoryTest TemperatureRegression EquationEquation ParametersSSeR2
ab
BA10 °CR SS = e a b ϕ 0.0140.86621.850.99
BA−10 °C0.0390.791189.20.93
NHSSMA10 °C0.00080.8993.0350.99
NHSSMA−10 °C0.0250.866118.80.95

