A Novel Extraction Method for Wildlife Monitoring Images with Wireless Multimedia Sensor Networks (WMSNs)

Abstract
Featured Application
Abstract
1. Introduction
2. Related Work
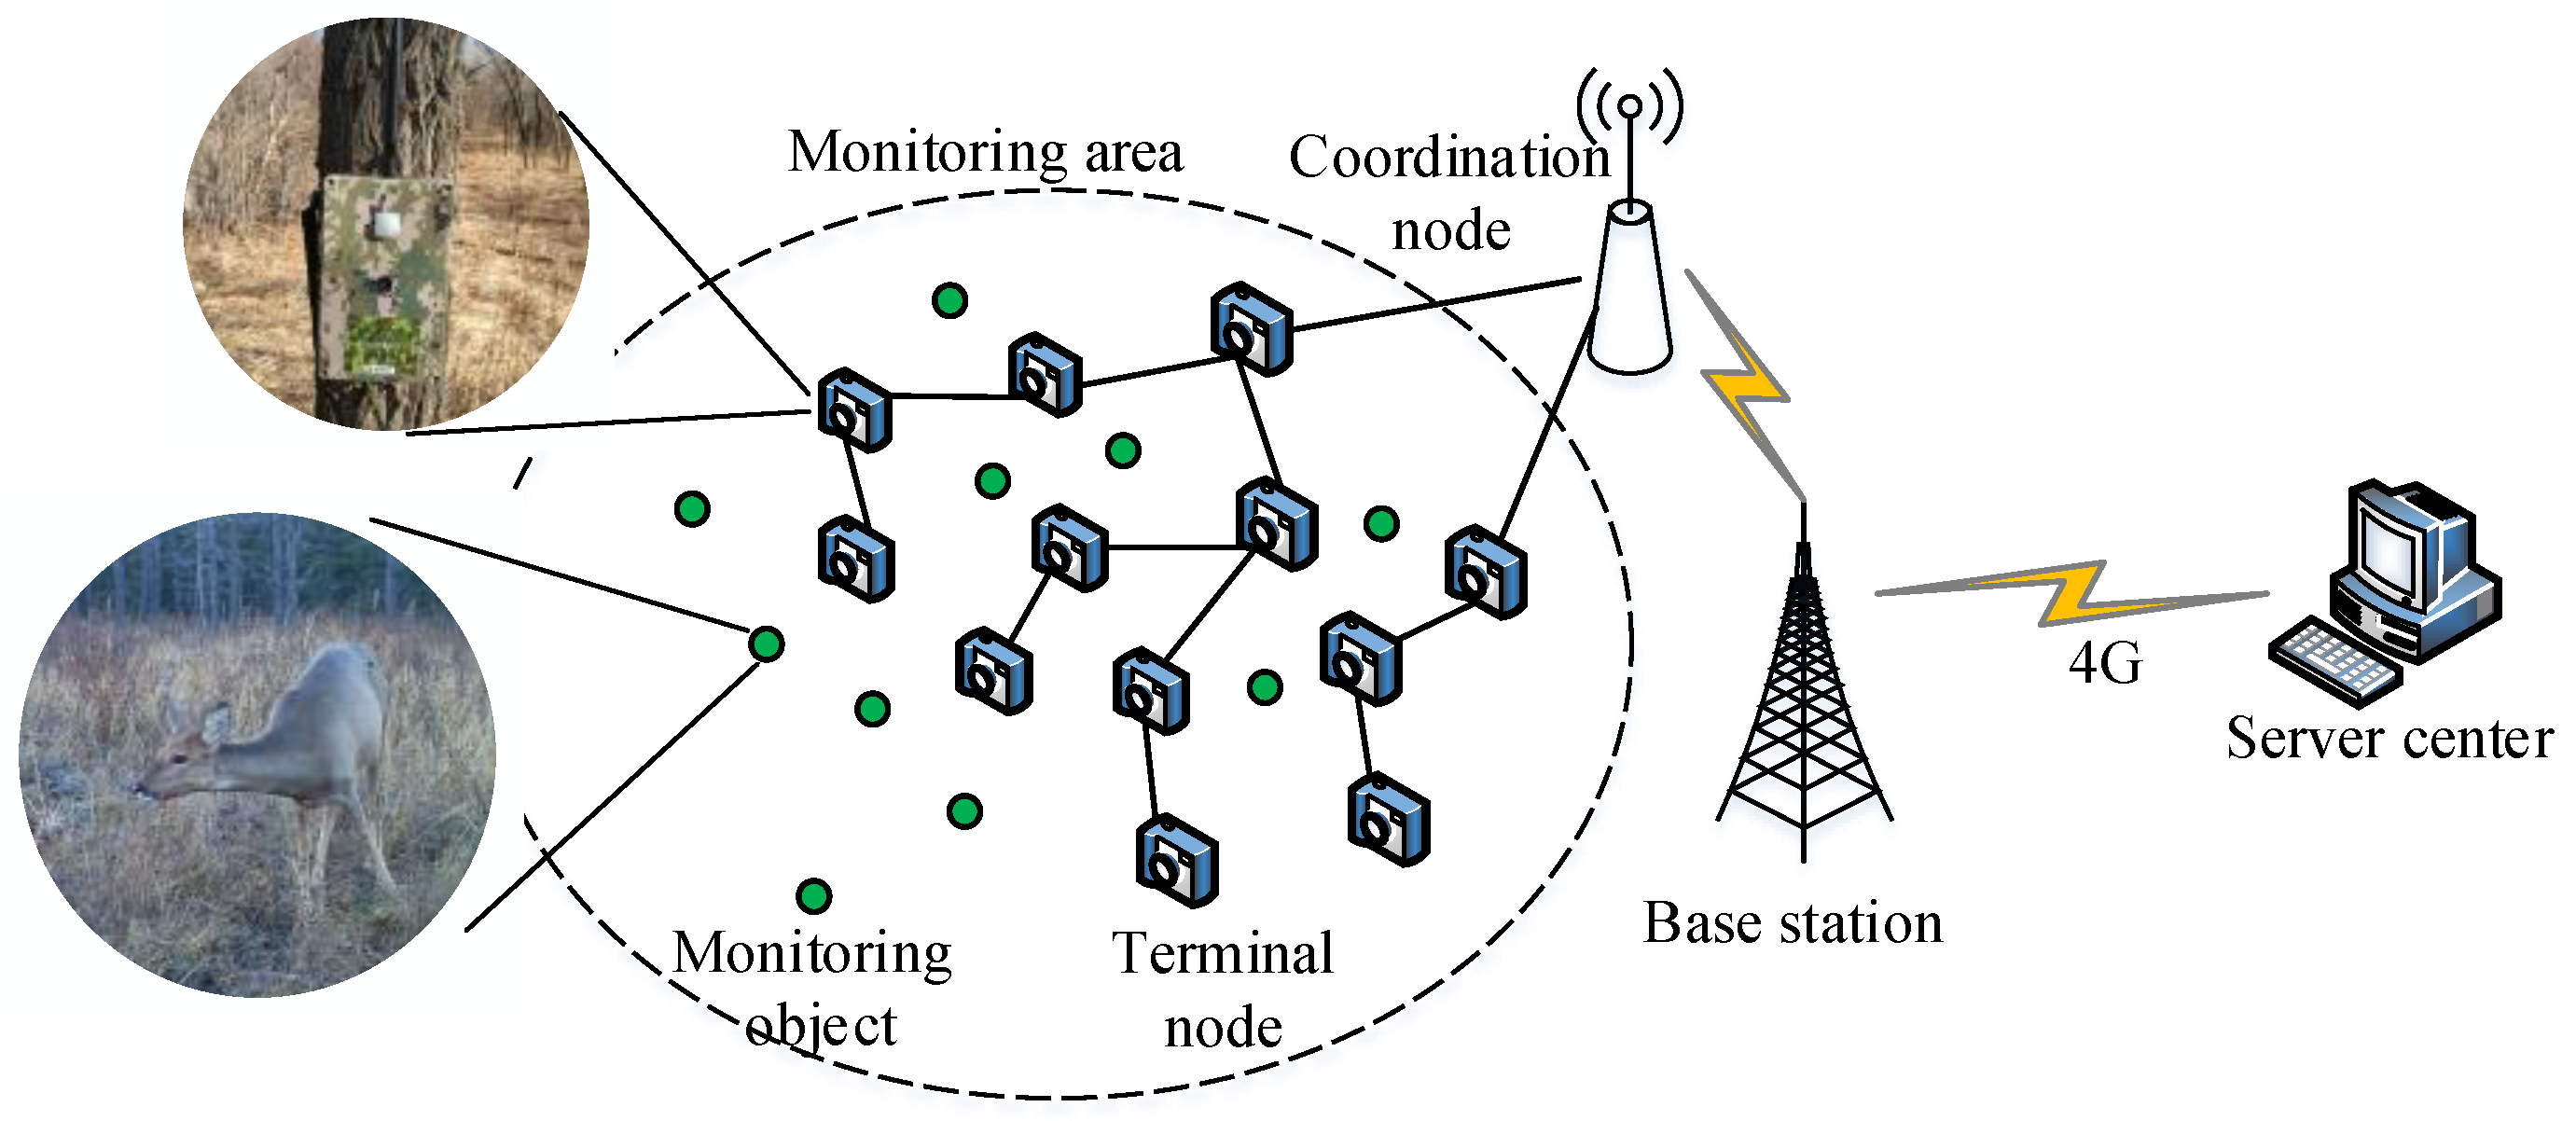
3. Materials
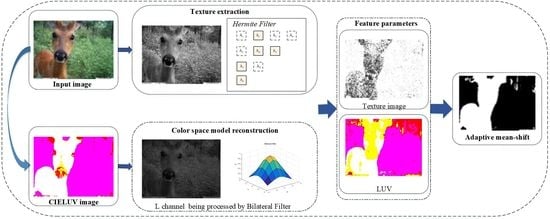
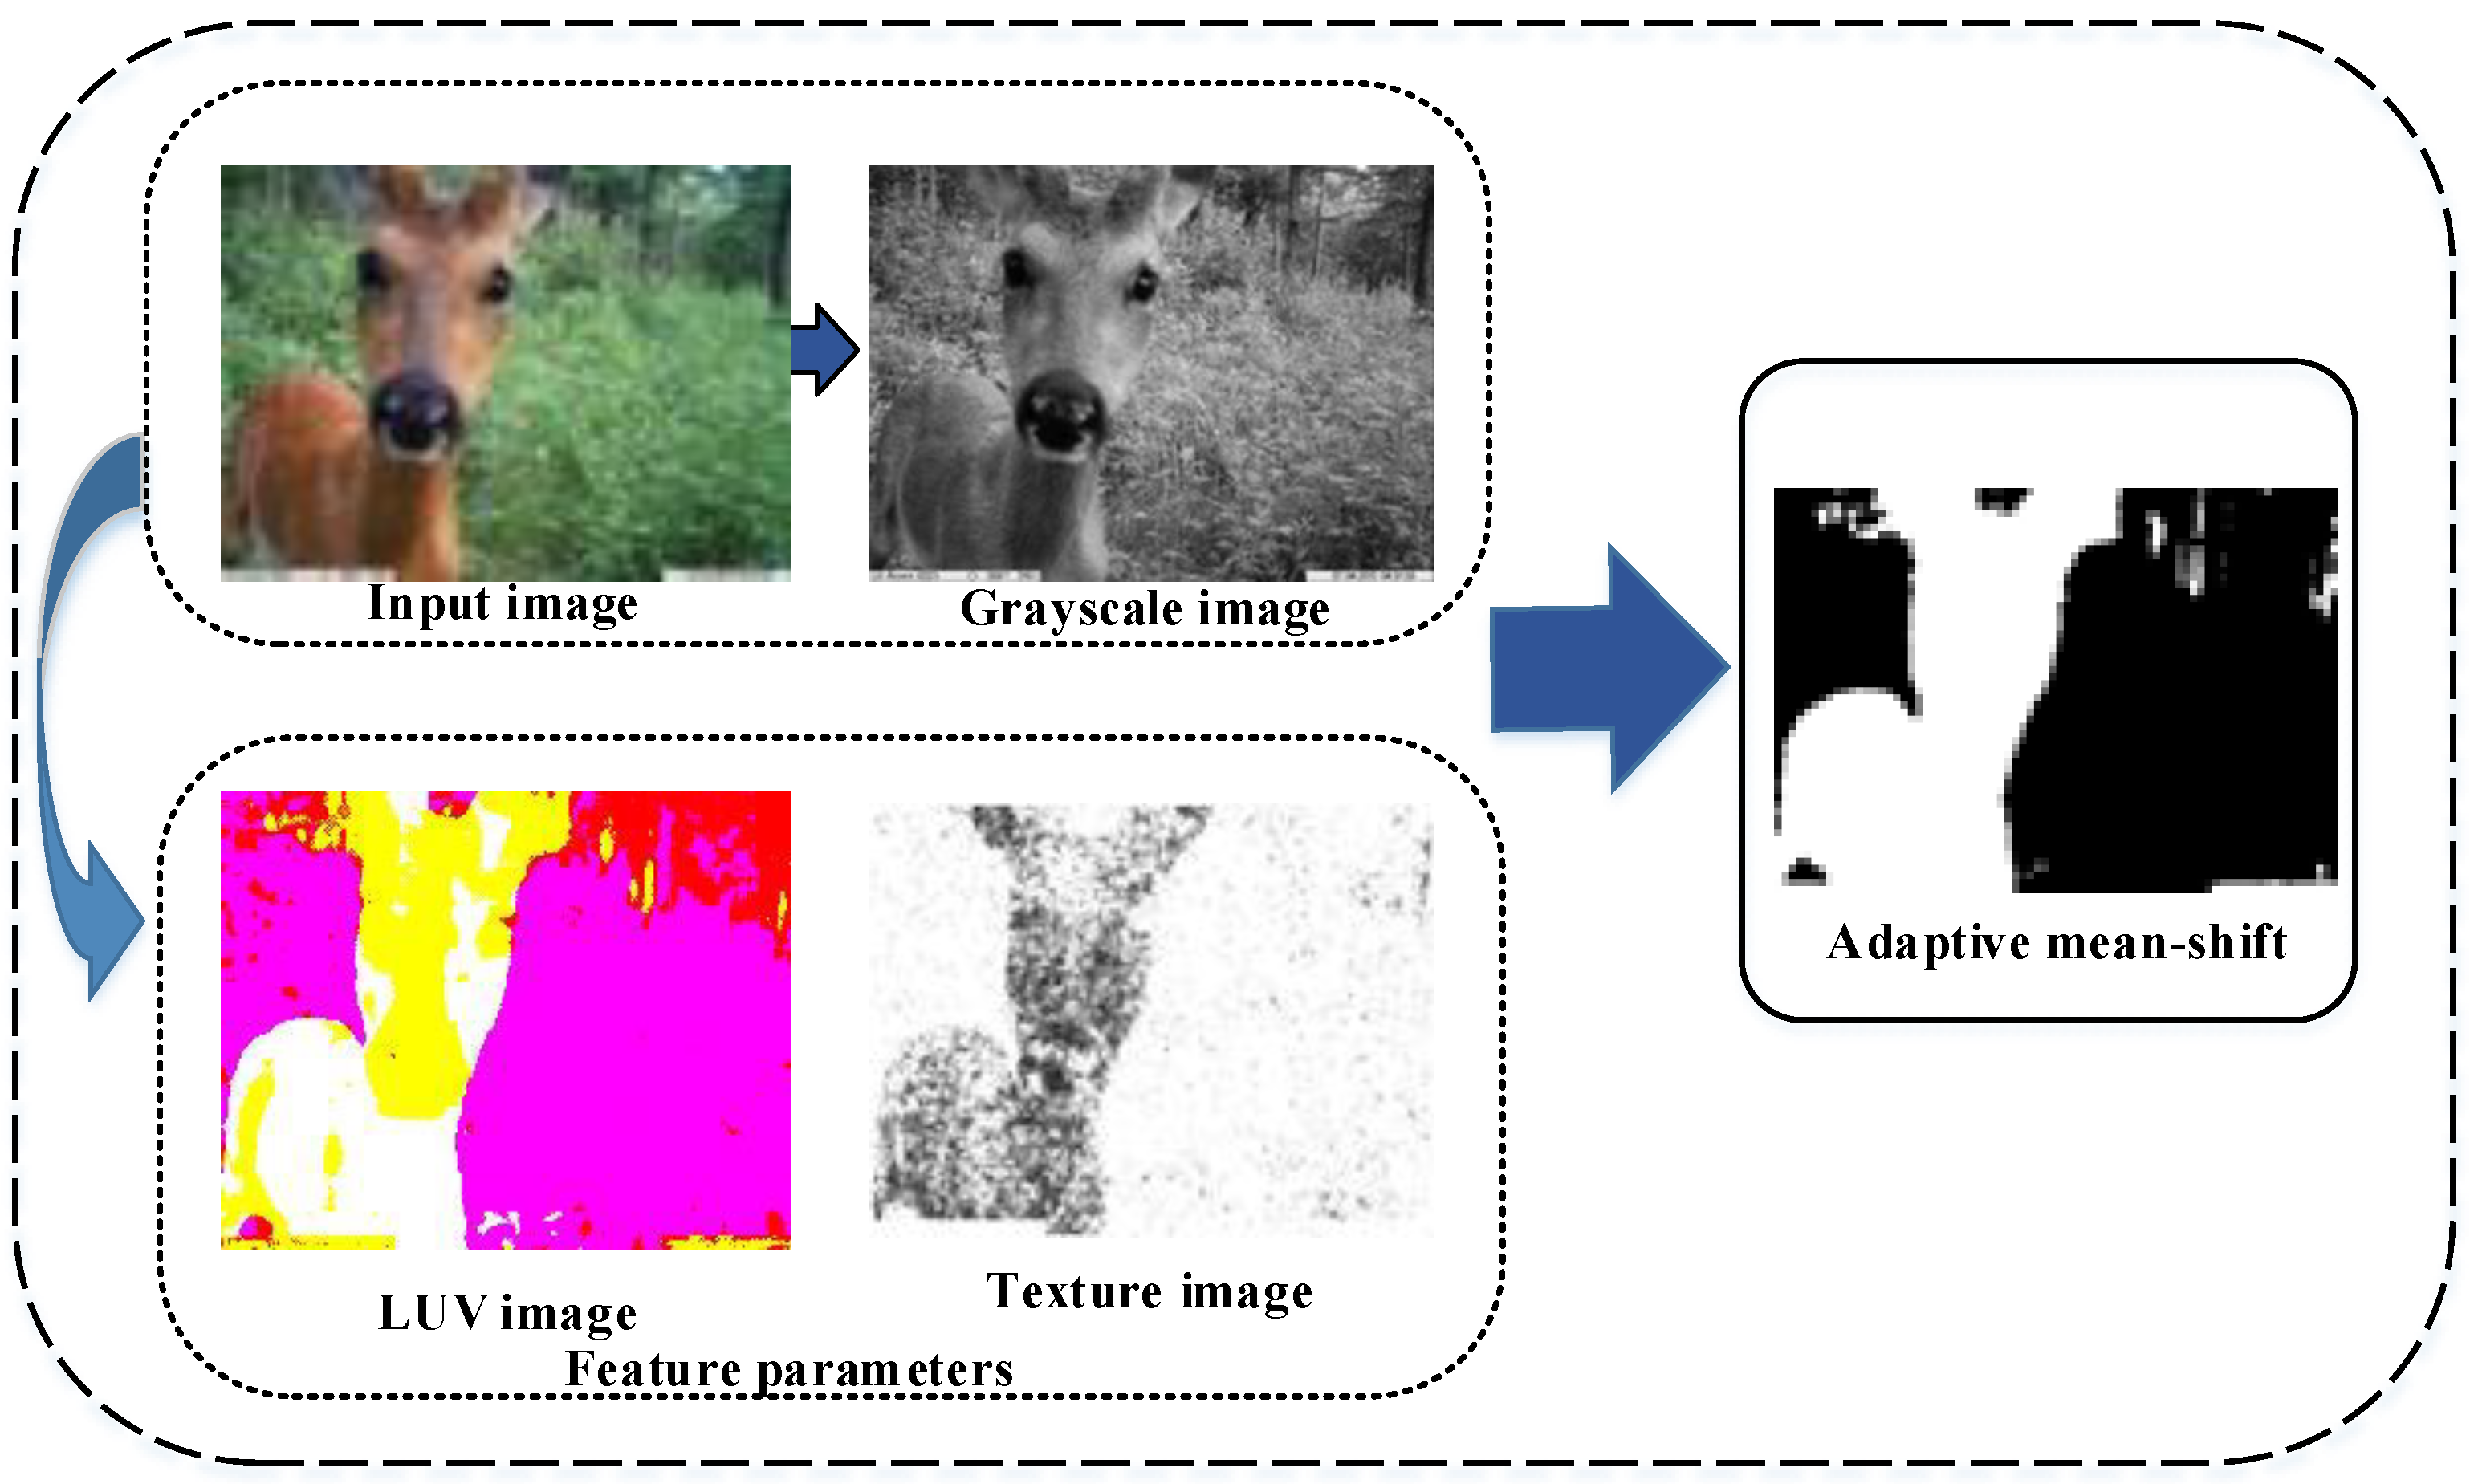
4. Experimental Methods
- Color information is extracted by constructing a color space, which is utilized to solve the problem of uneven illumination in the monitoring images;
- Texture information is extracted based on Hermite transform to ensure the target region; in other words, the extracted texture information is not affected by illumination or the shooting angle, even under conditions including a complex background and uneven illumination;
- To guarantee the extraction efficiency, the adaptive mean-shift algorithm is utilized to extract the foreground region when the color and texture information is received.
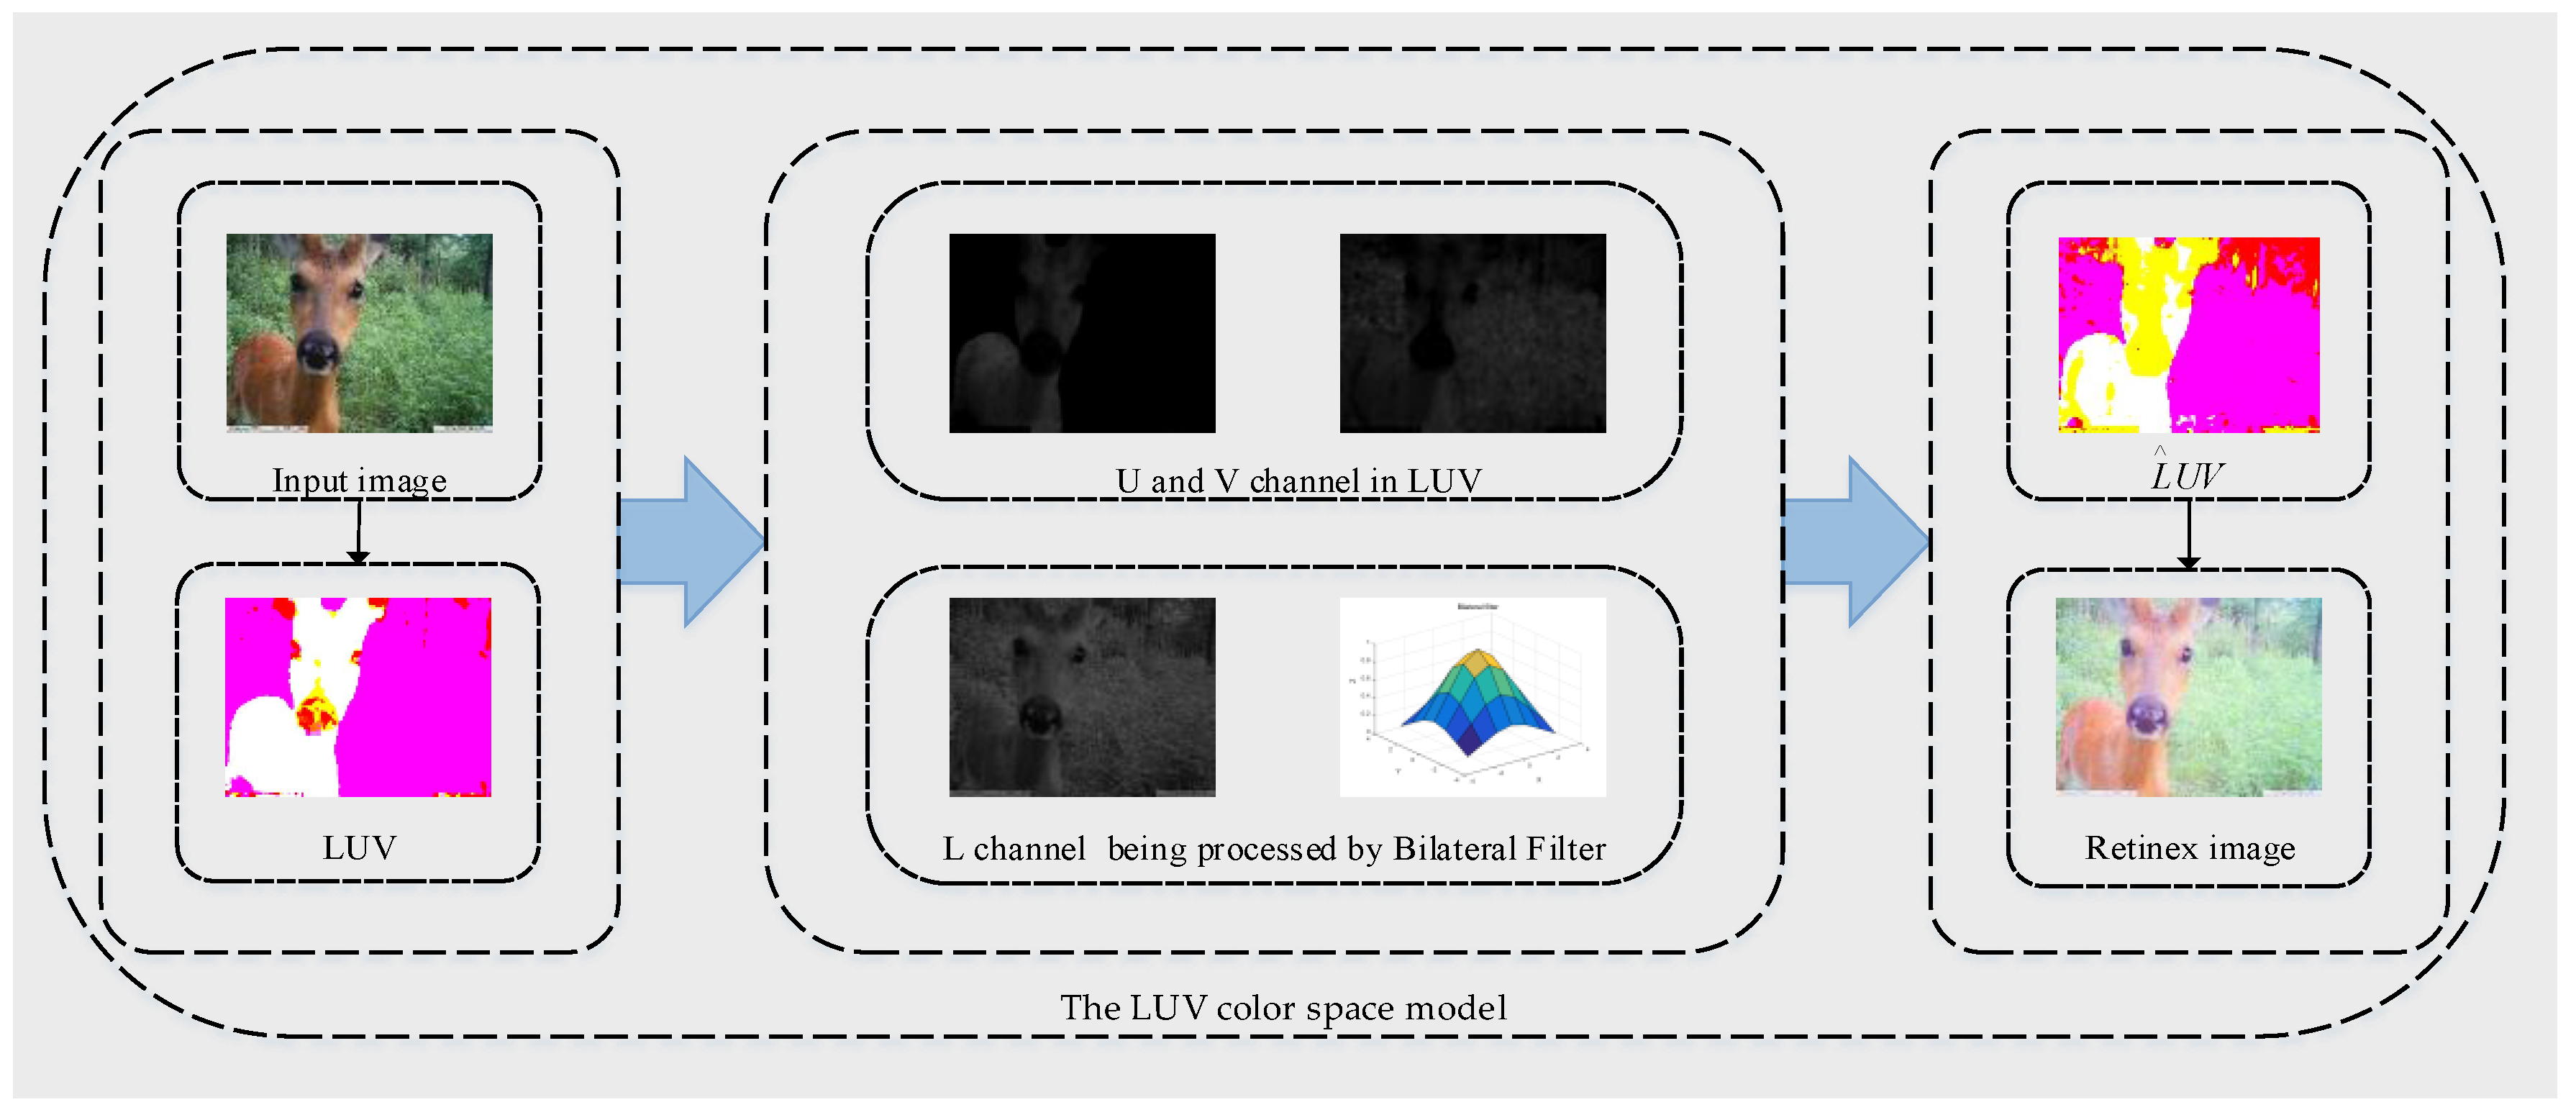
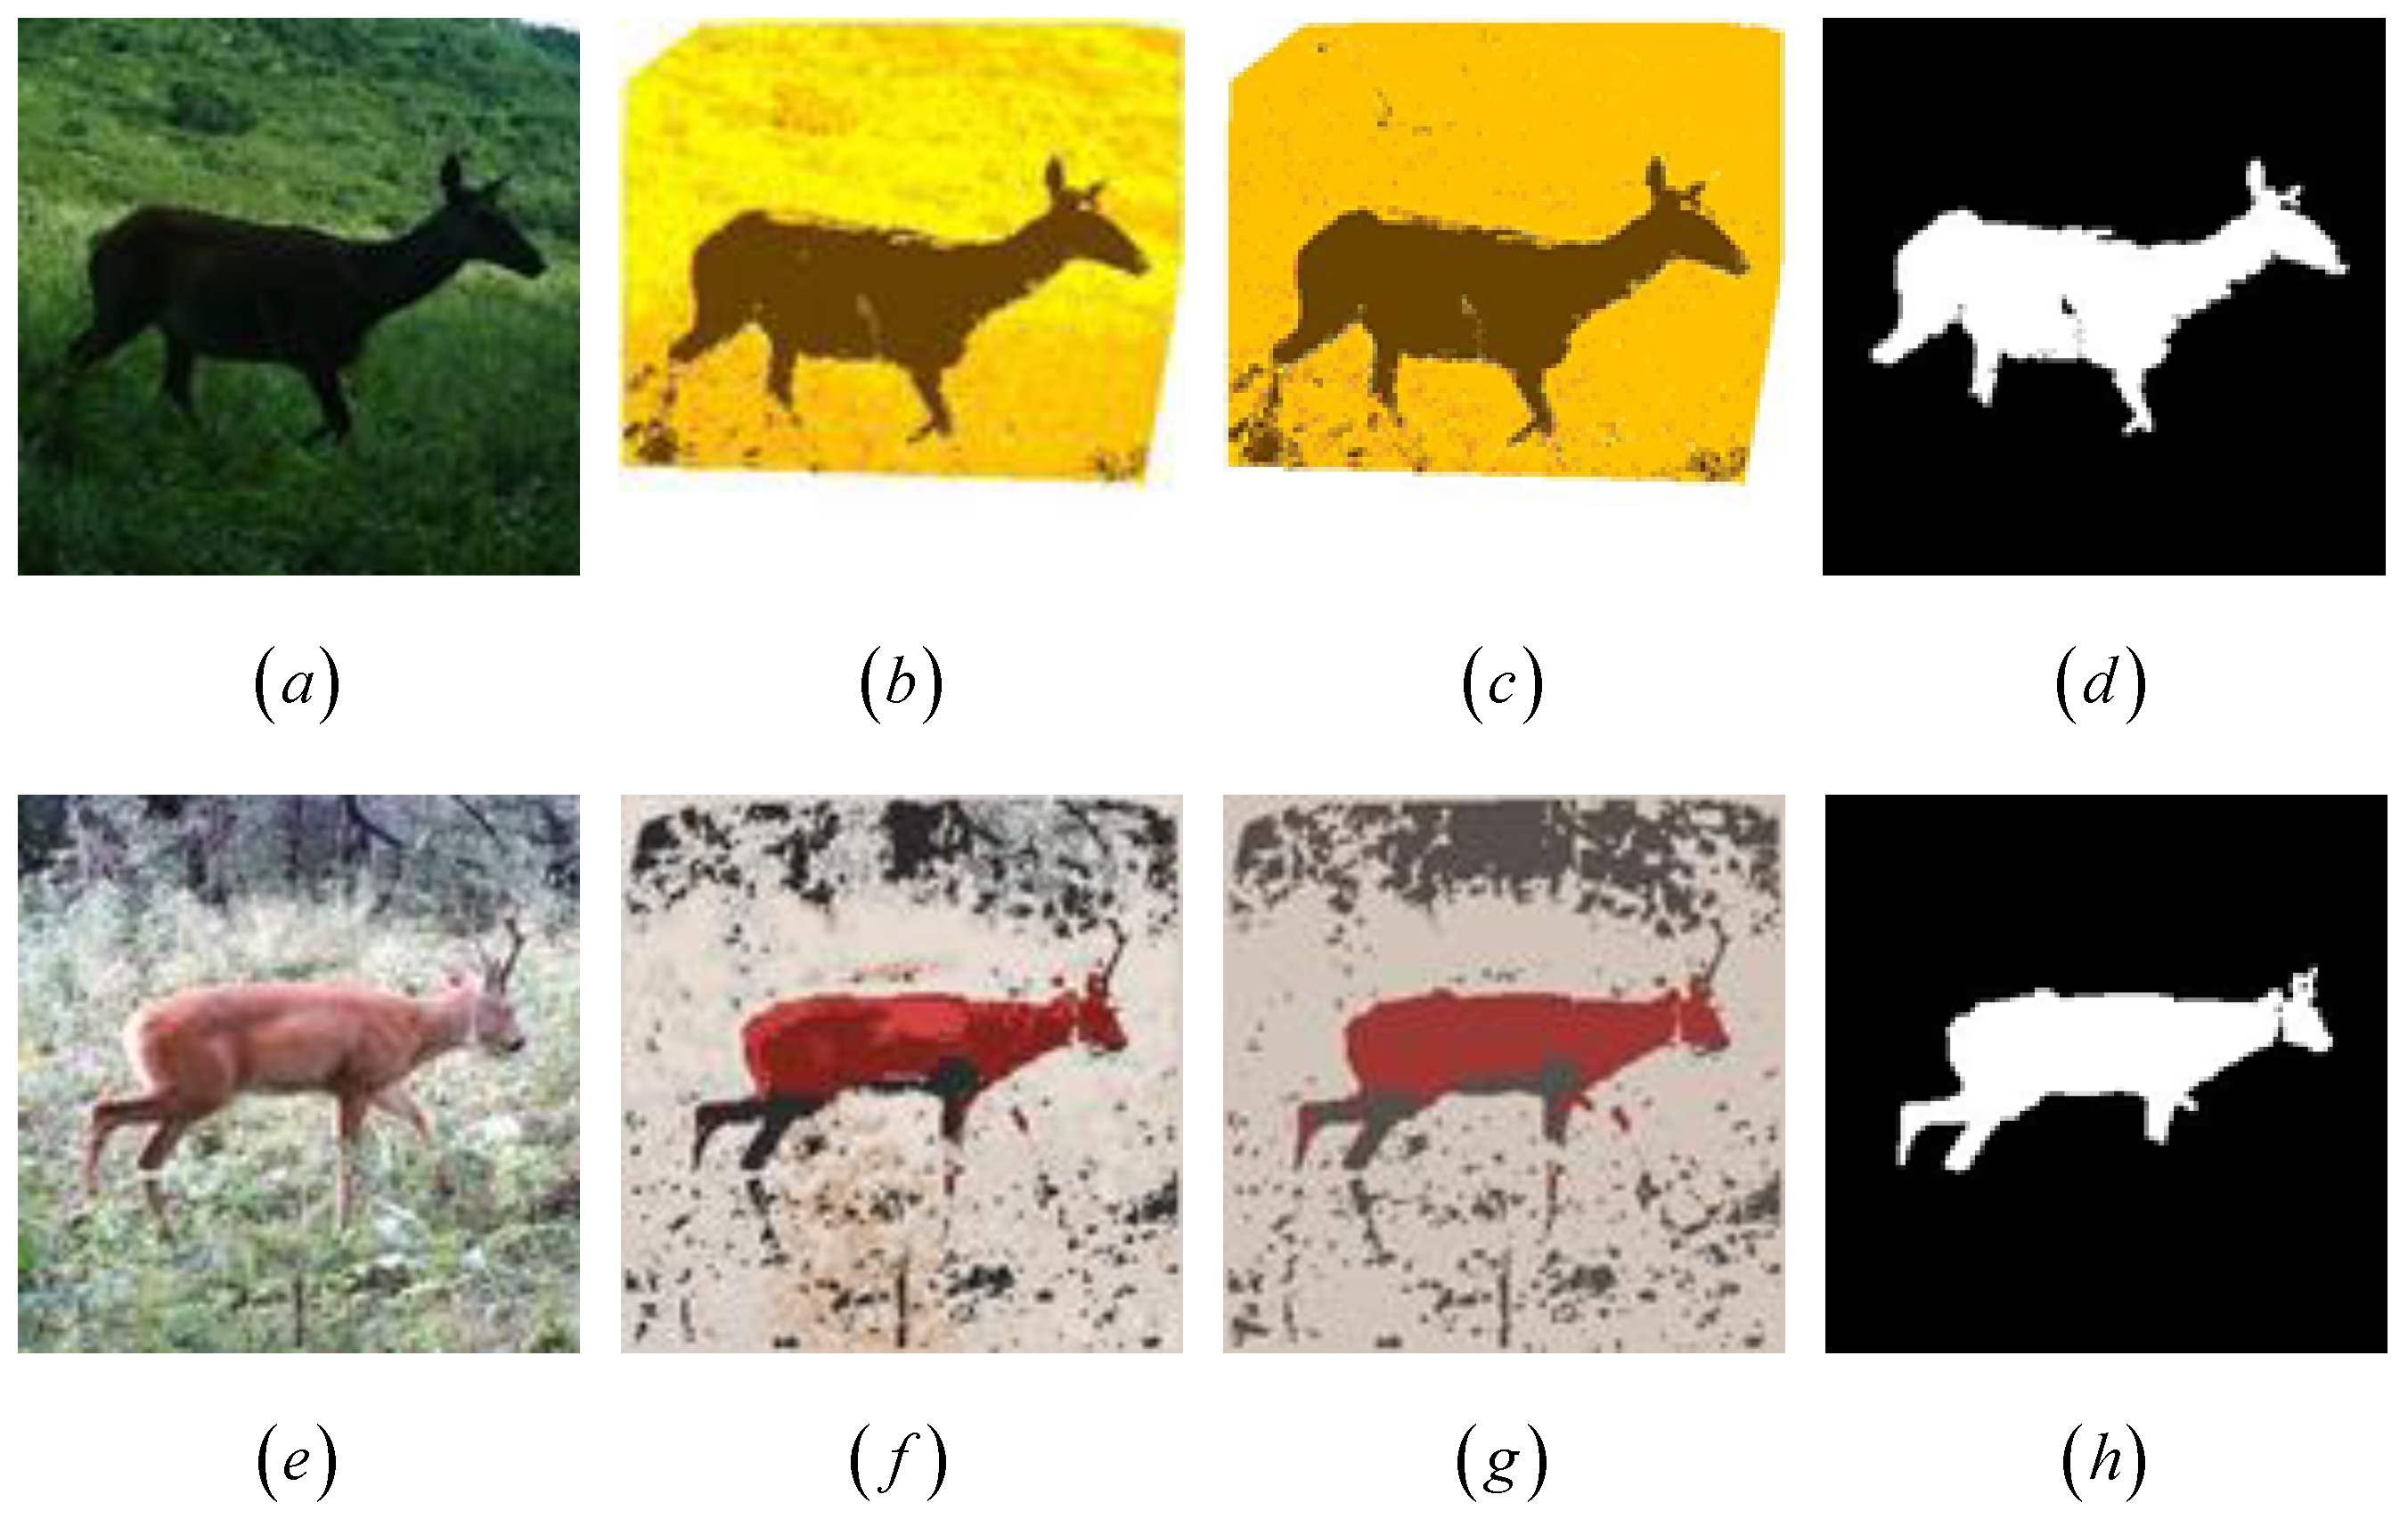
4.1. Color Space Information Extraction
- Convert the wildlife monitoring images from the RGB color space to the LUV color space;
- Apply convolutions with a bilateral filter to the L channel of the motoring image to obtain the luminance component . The values of the bilateral filter represent different scales, which are 10, 50, and 100 for three scales;
- Preserve the original chrominance parameters with the and channel;
- Reconstruct the color space model with .
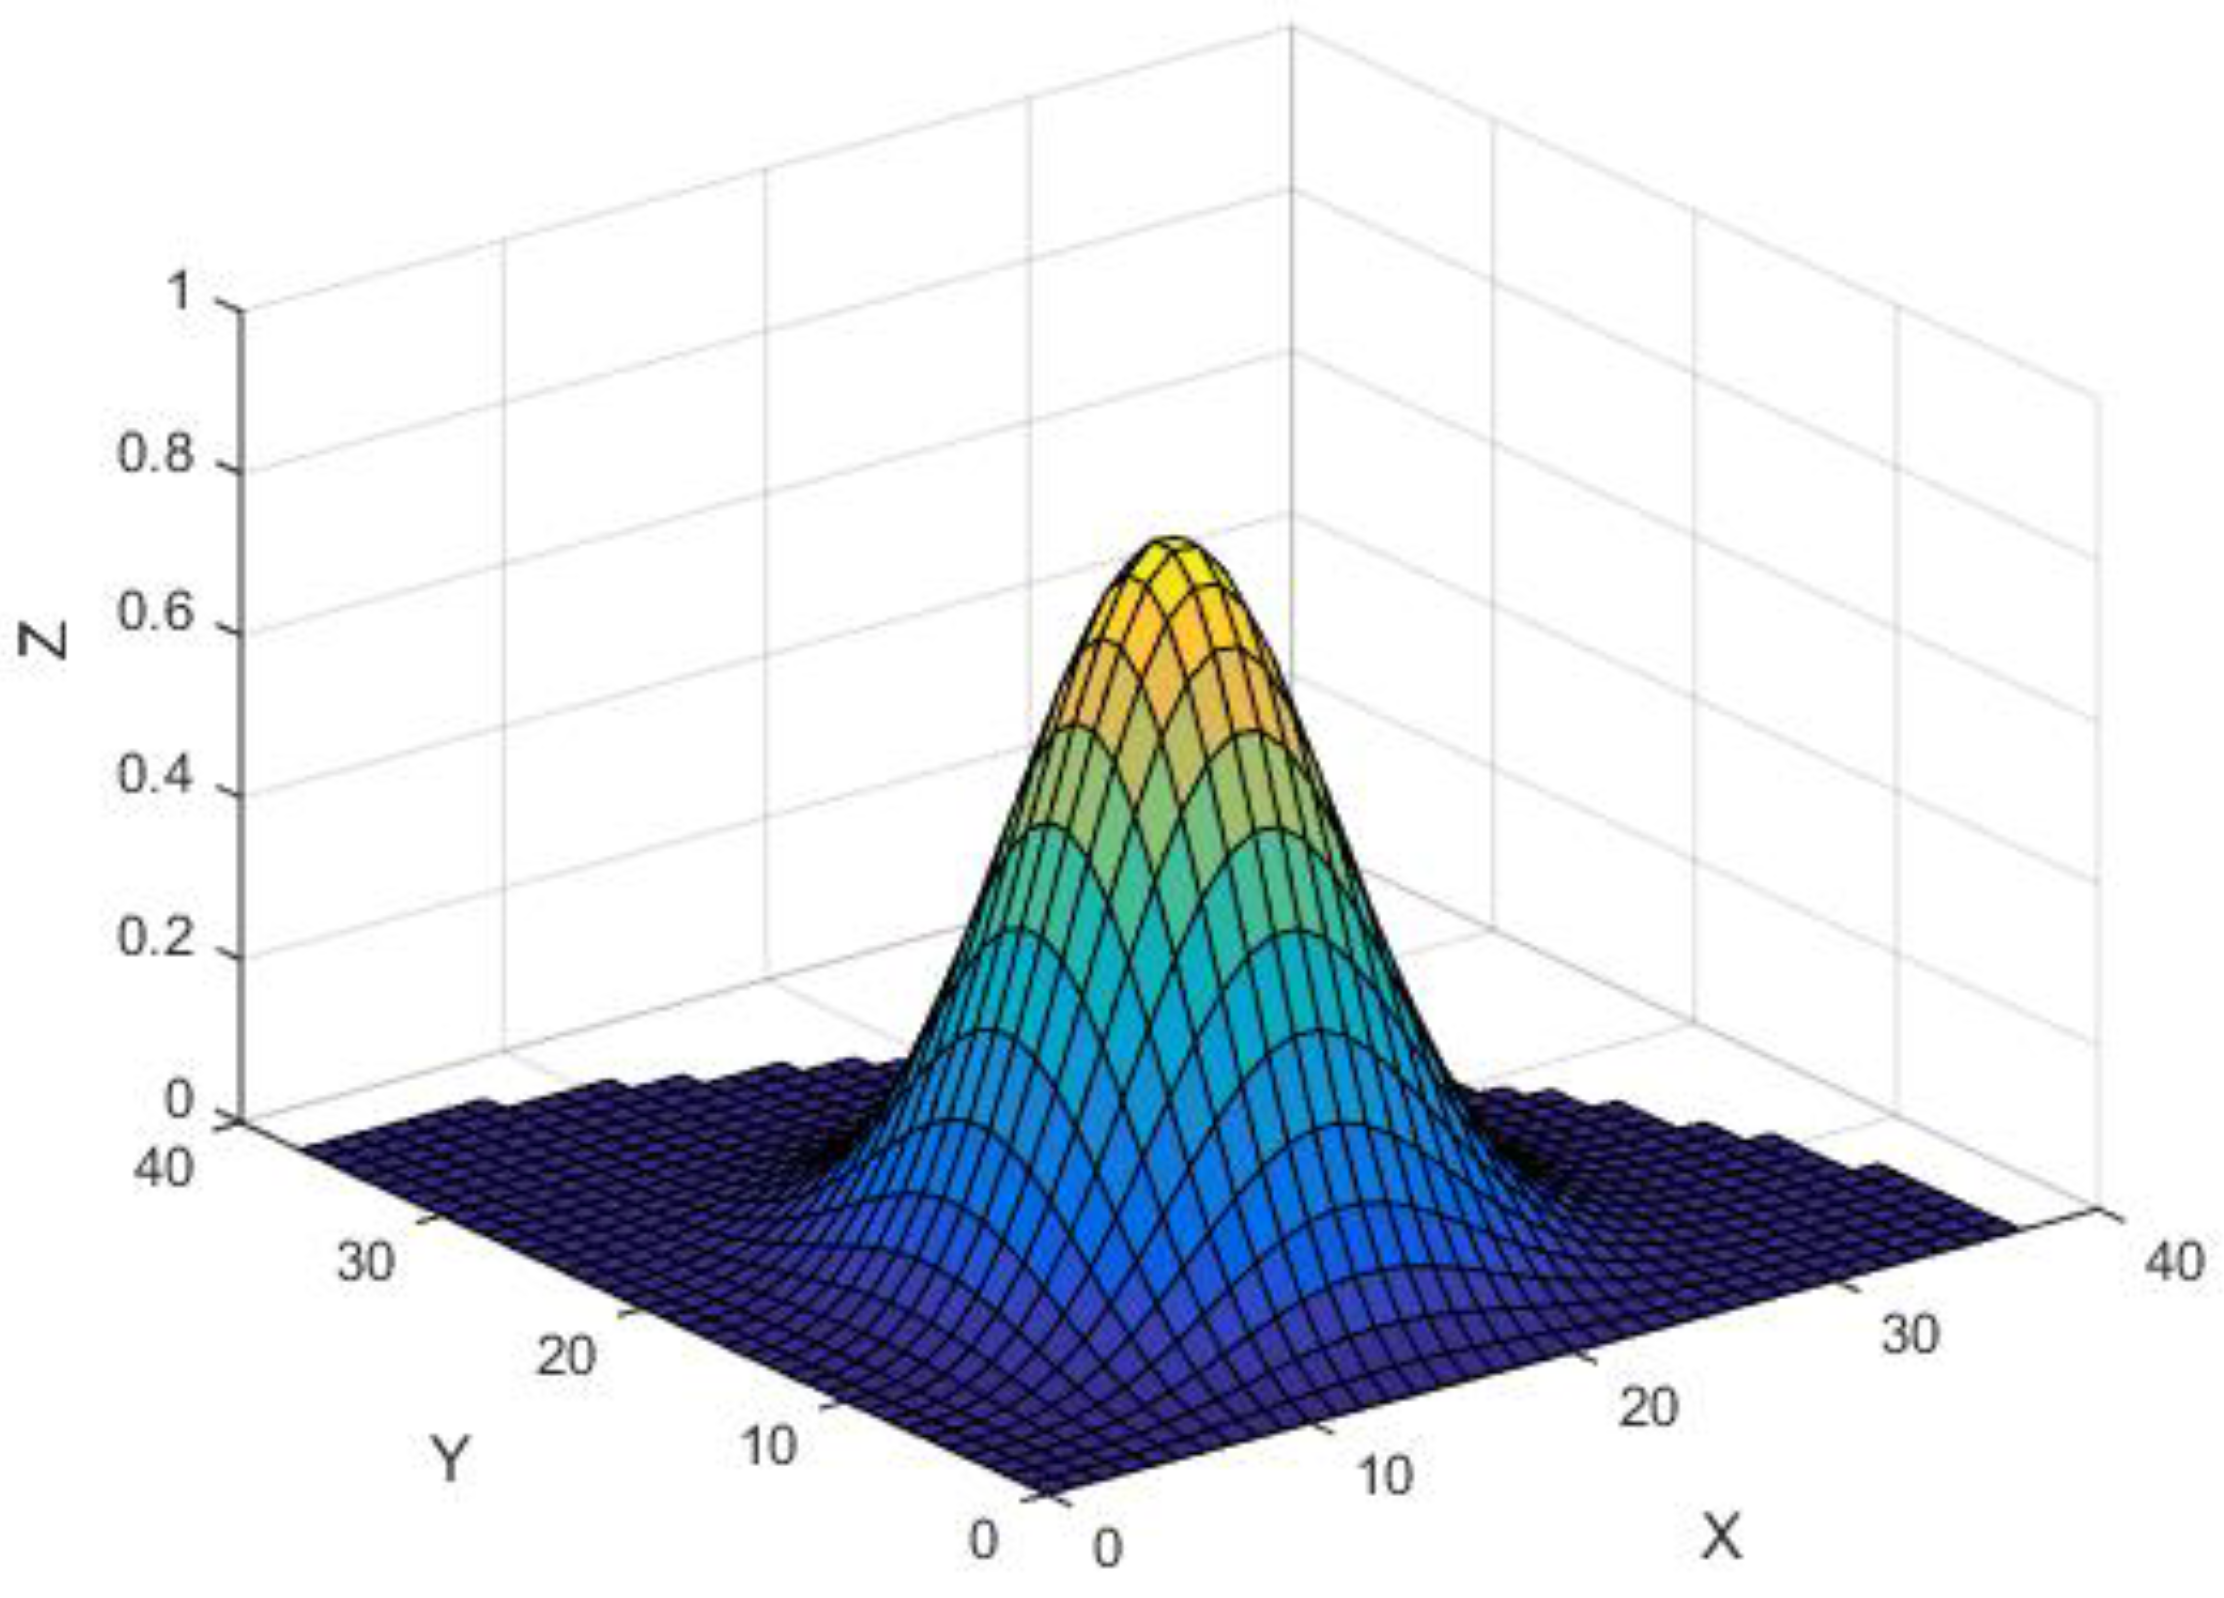
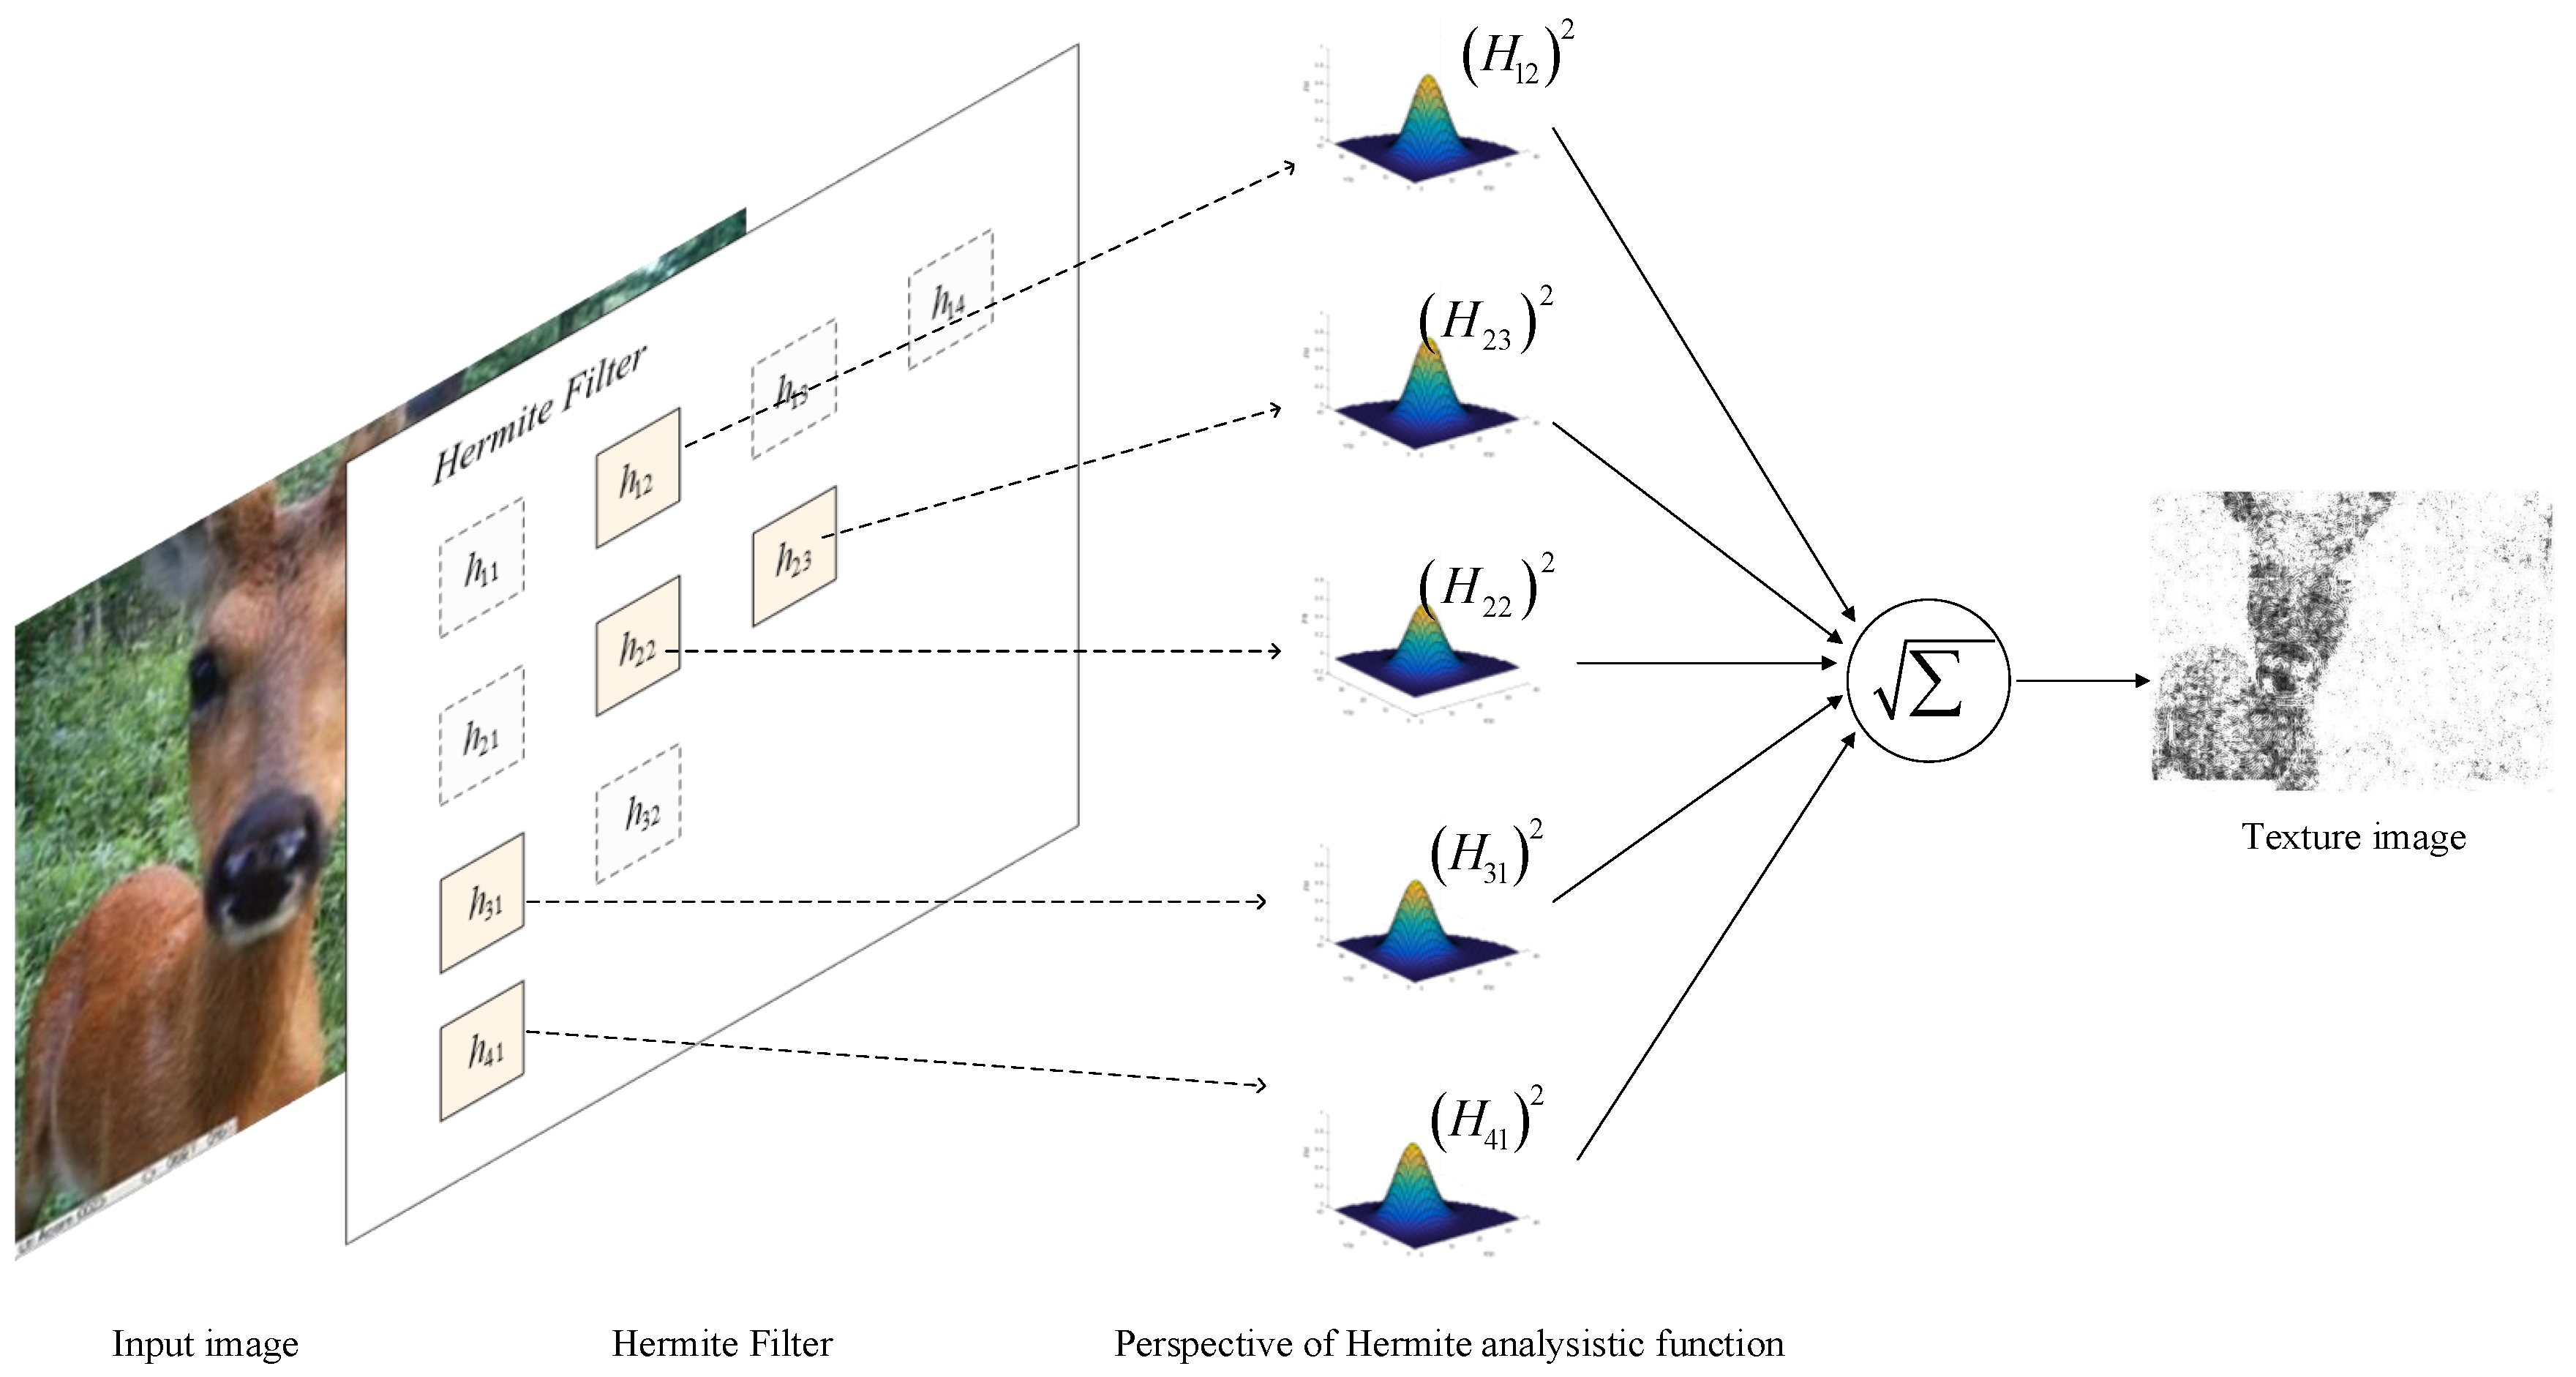
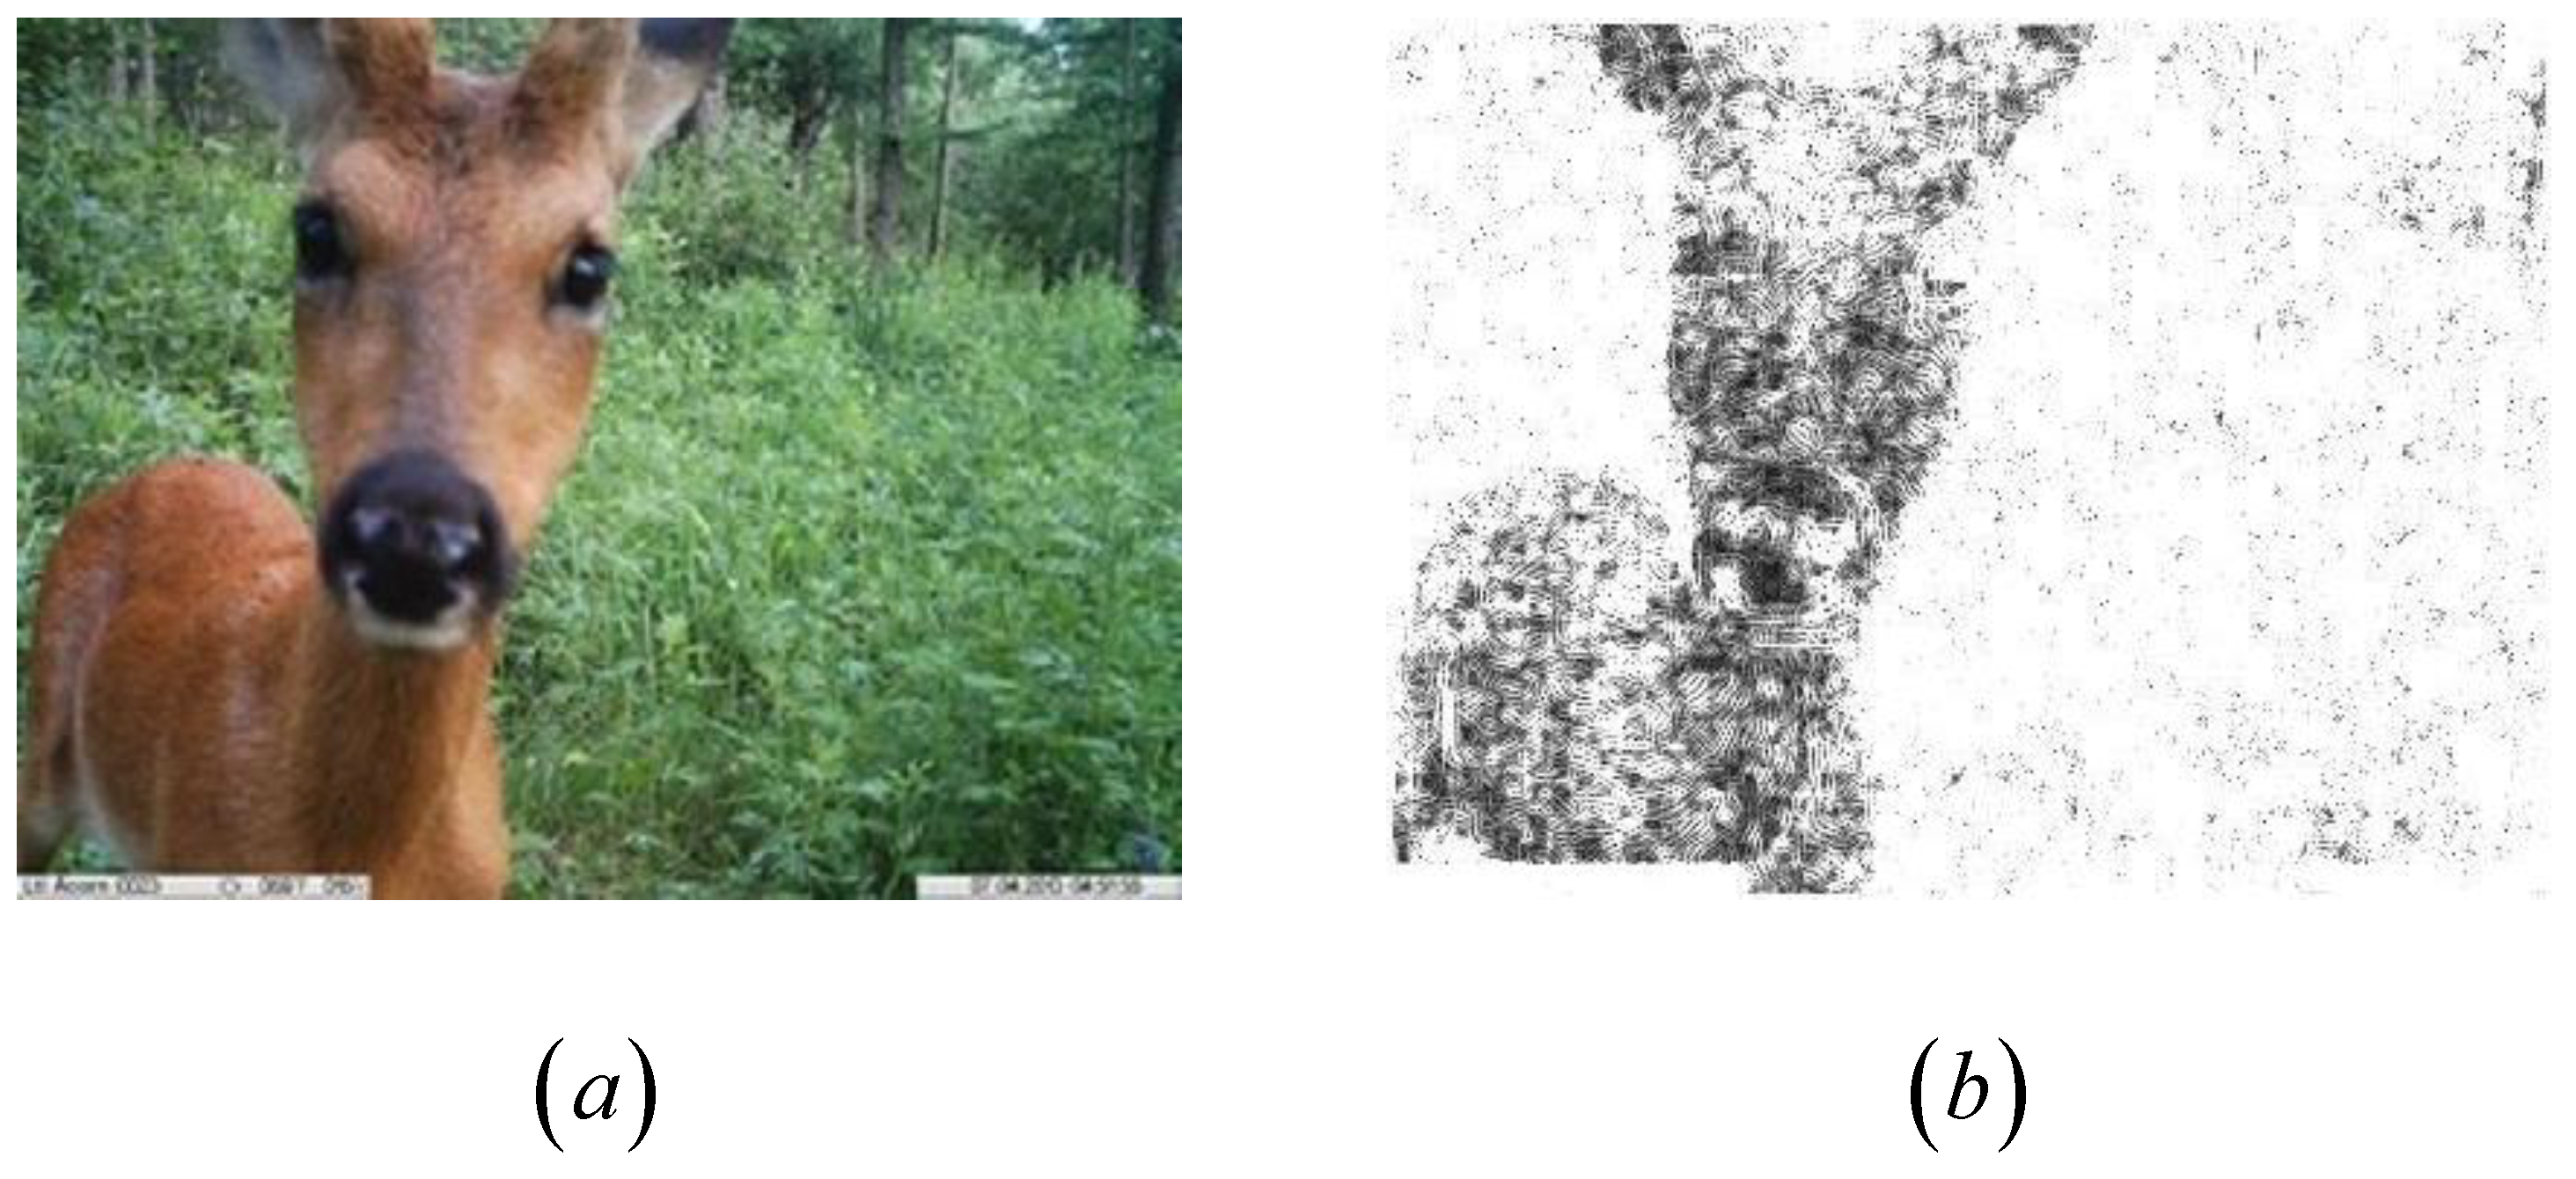
4.2. Texture Information Extraction
- In order to reduce the amount of data calculated, we set the value relationship between and as ;
- Since and are mutually converted matrices, one is arbitrarily selected as the convolution kernel;
- The polynomial was not chosen due to the fact it did not extract any texture information.
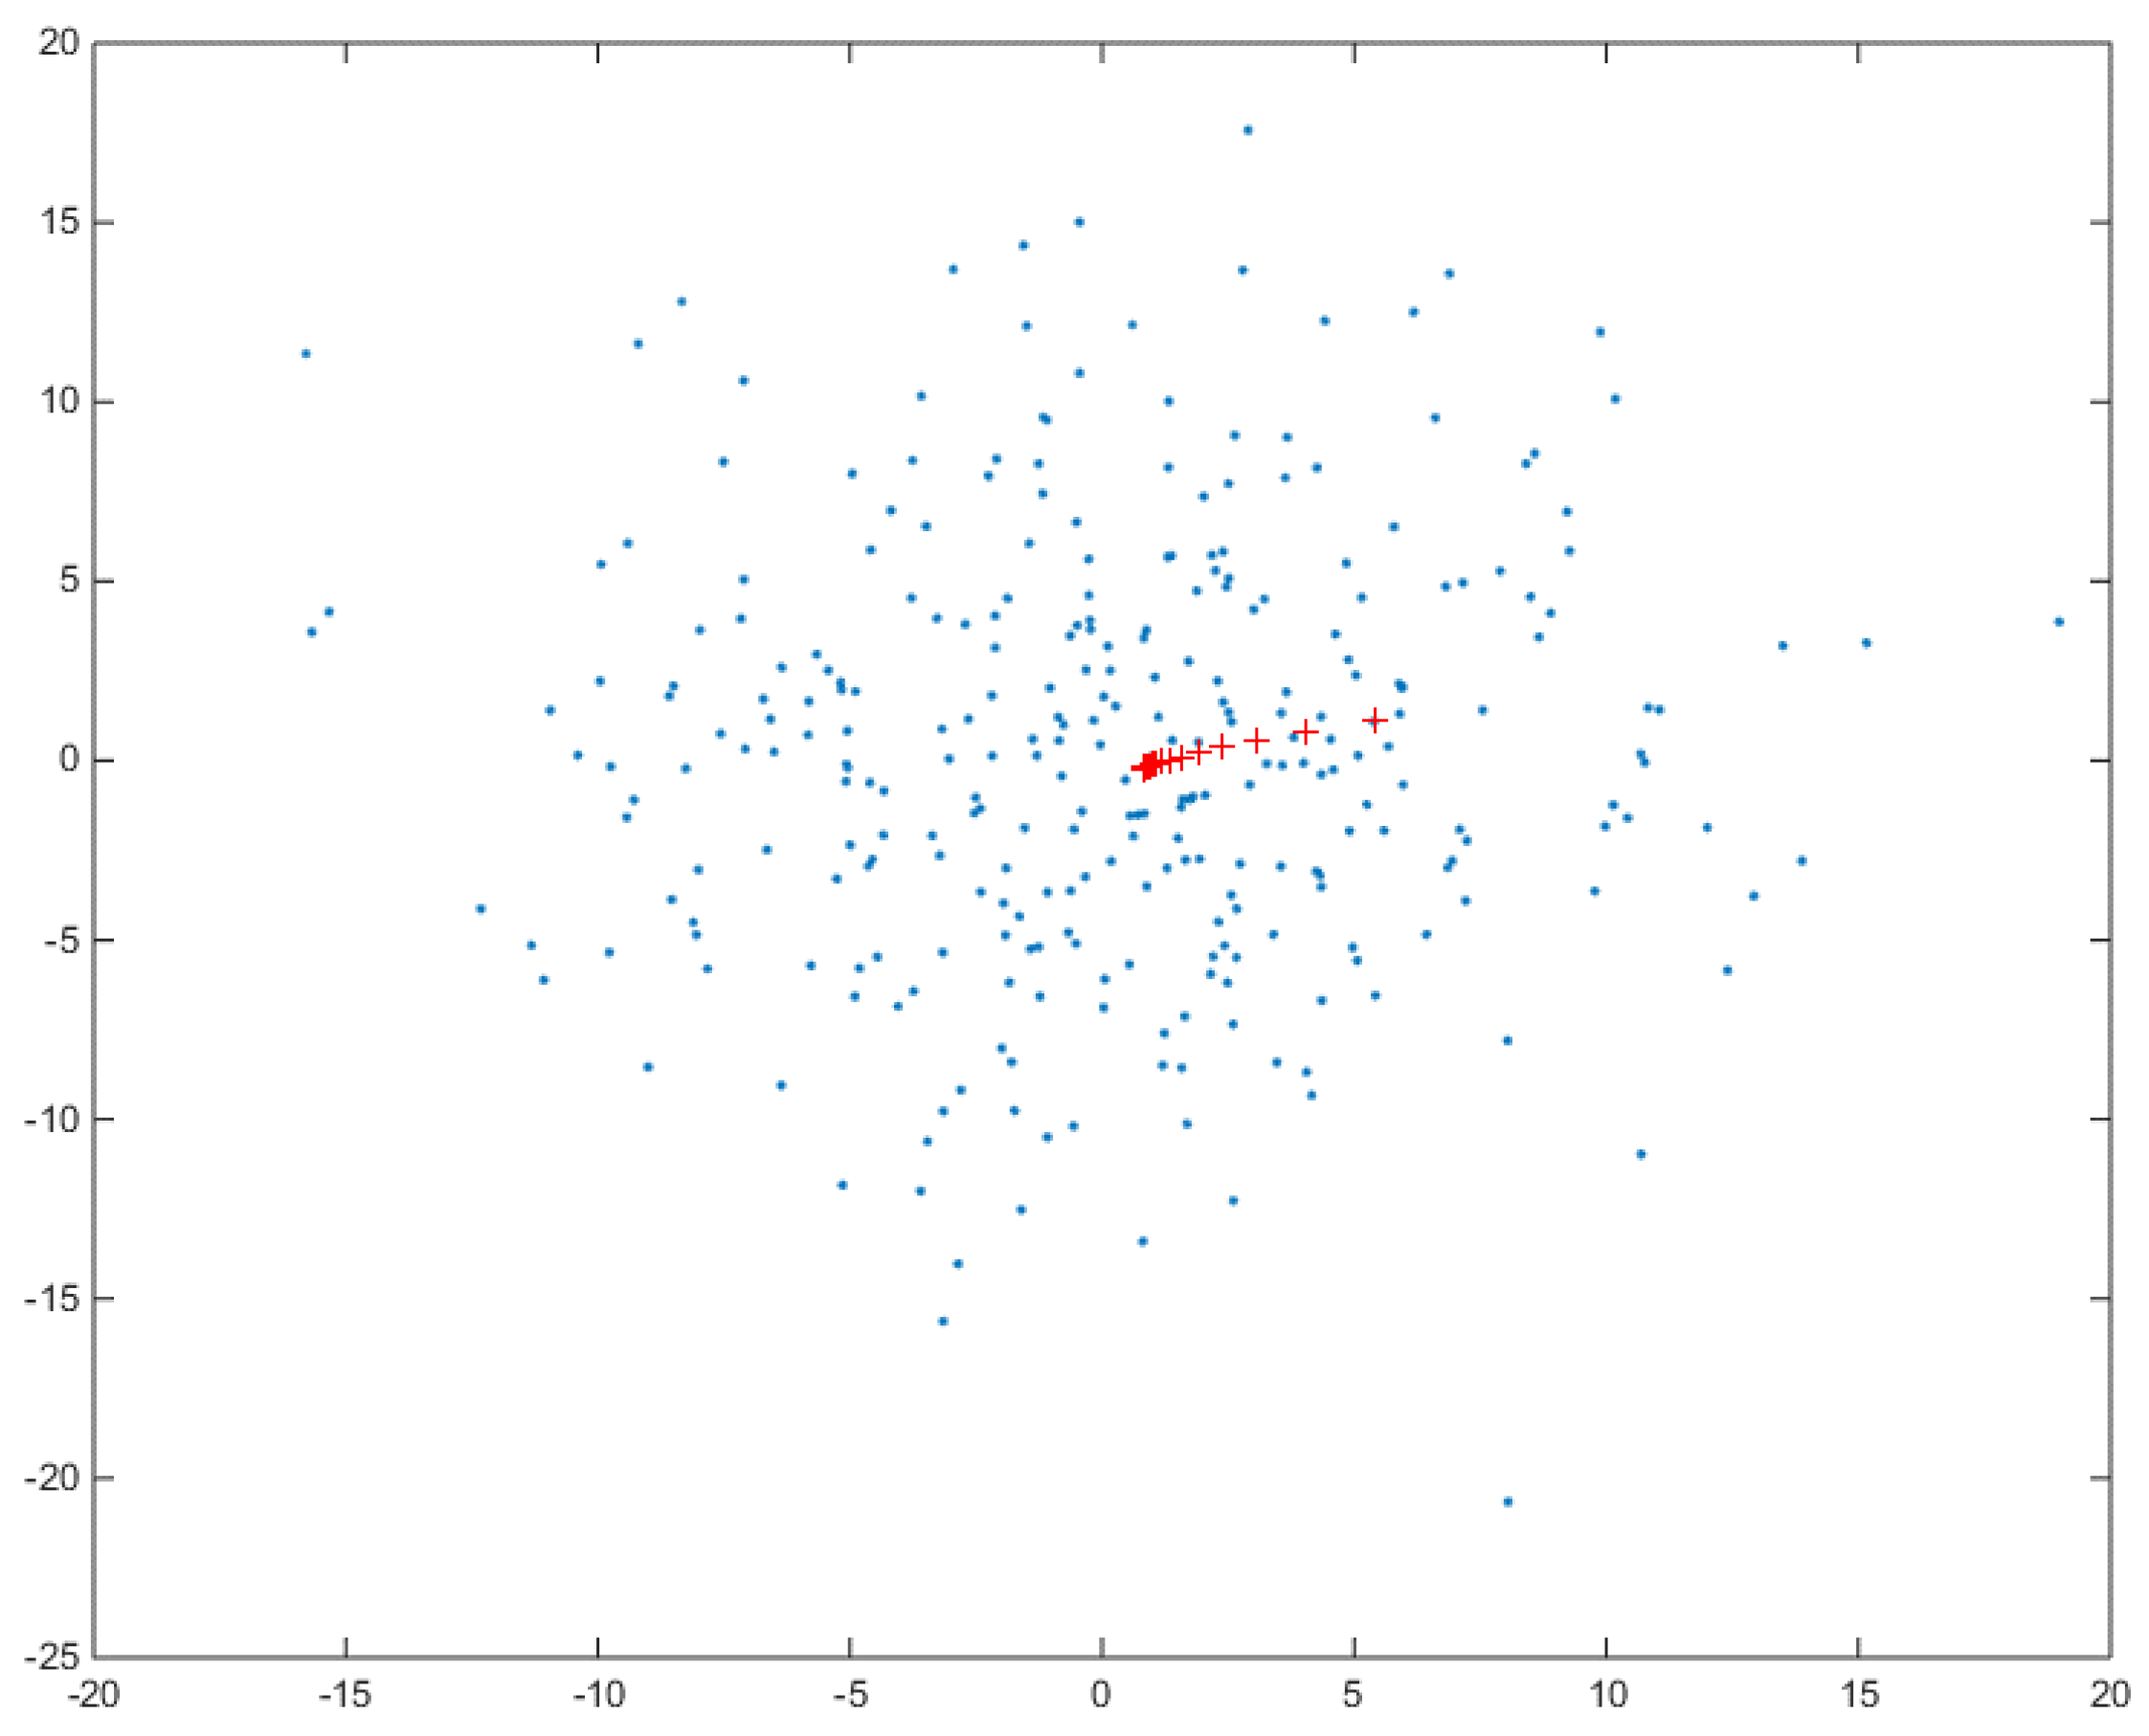
4.3. Adaptive Mean-Shift Algorithm
5. Experimental Results and Discussion
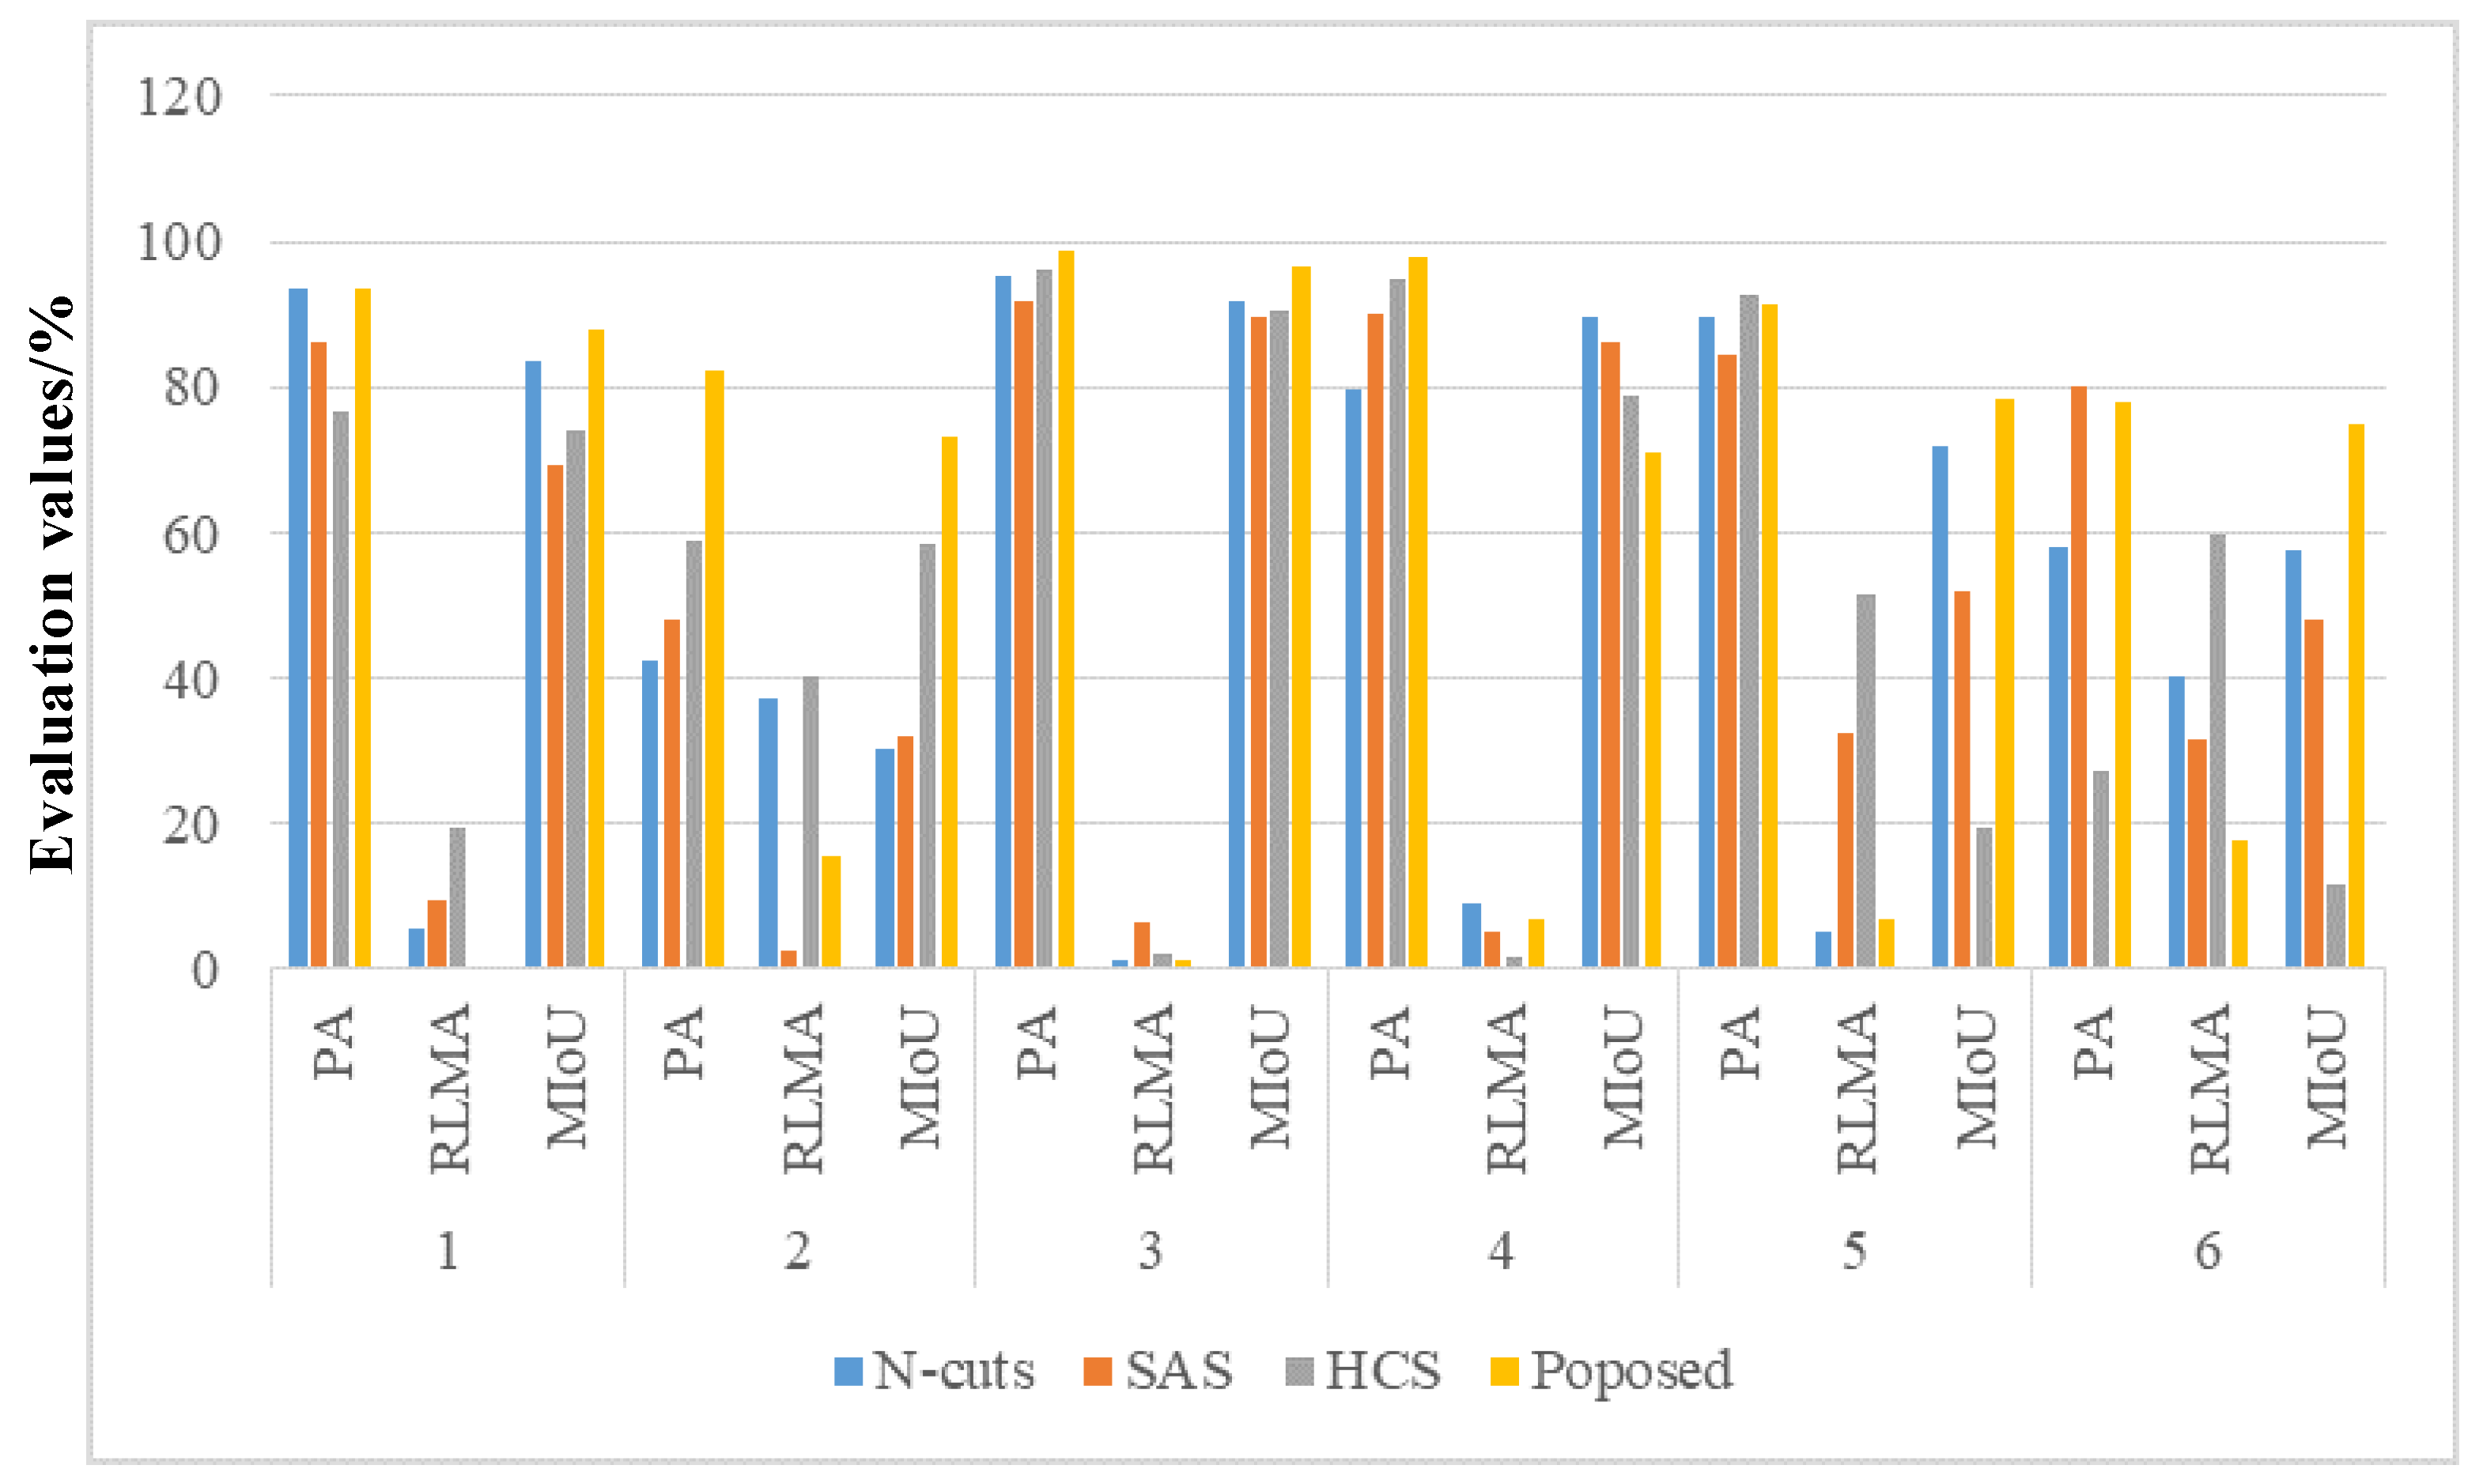
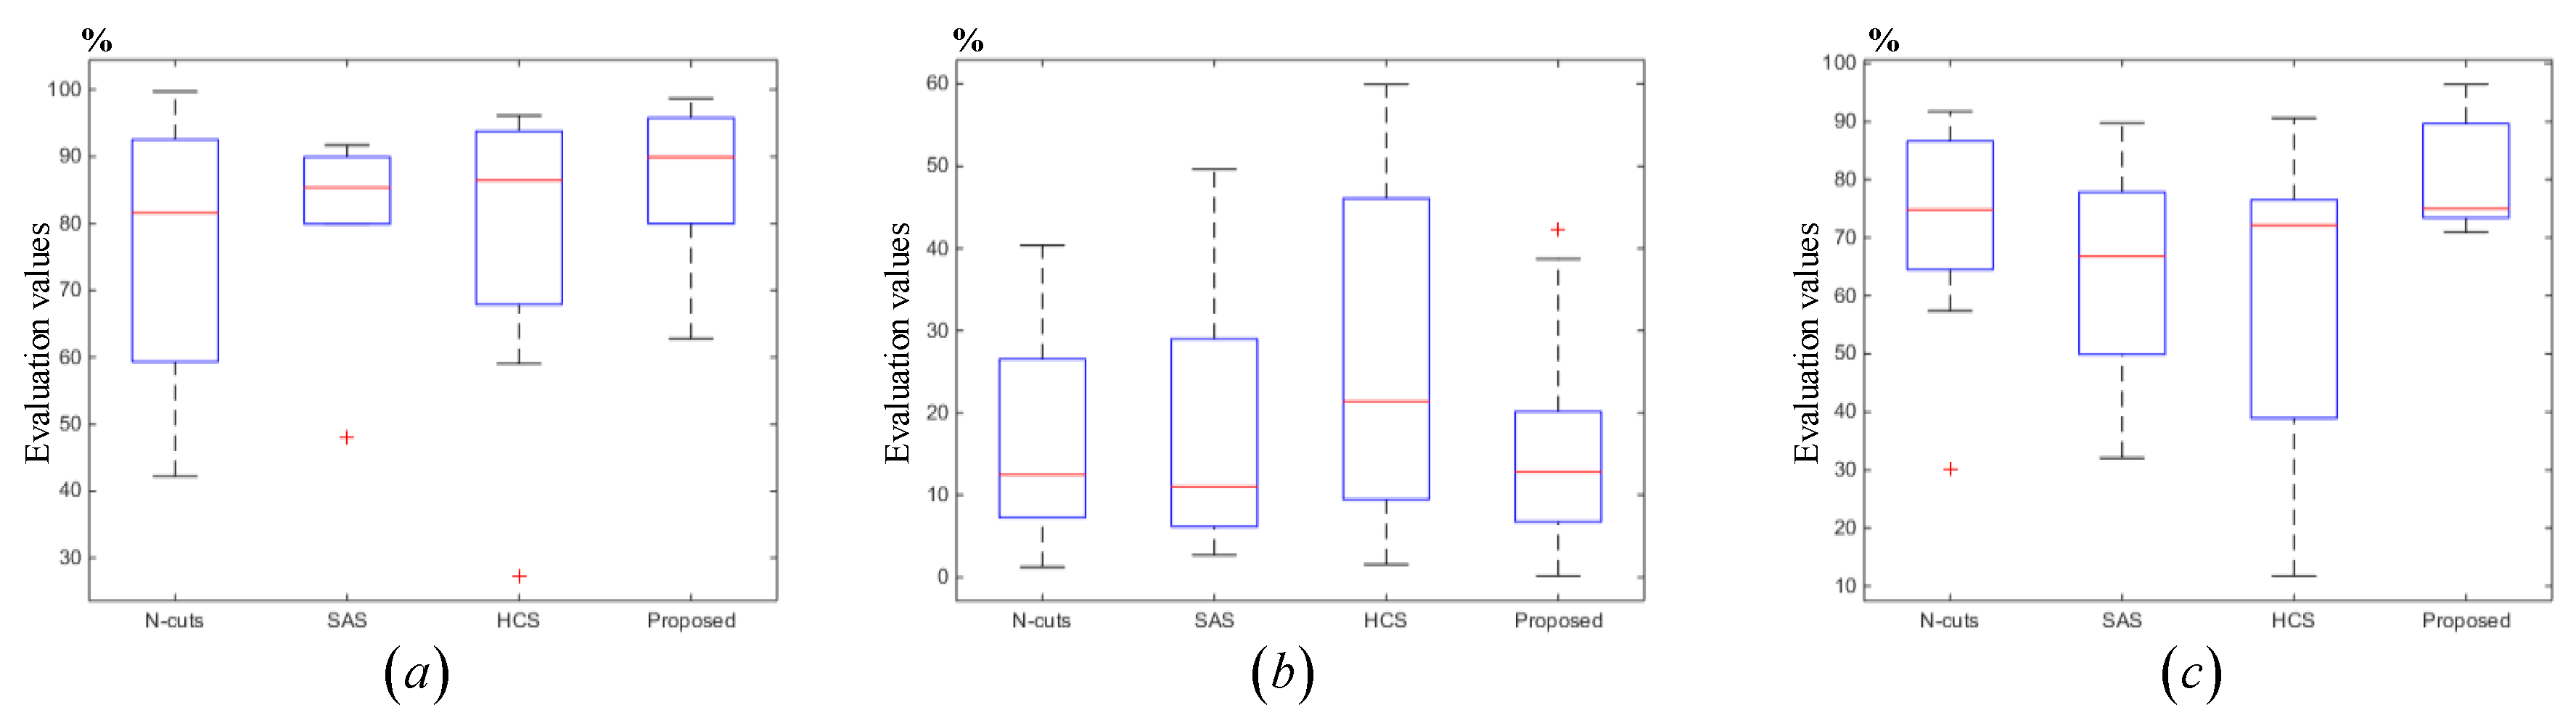
5.1. Evaluation Criteria
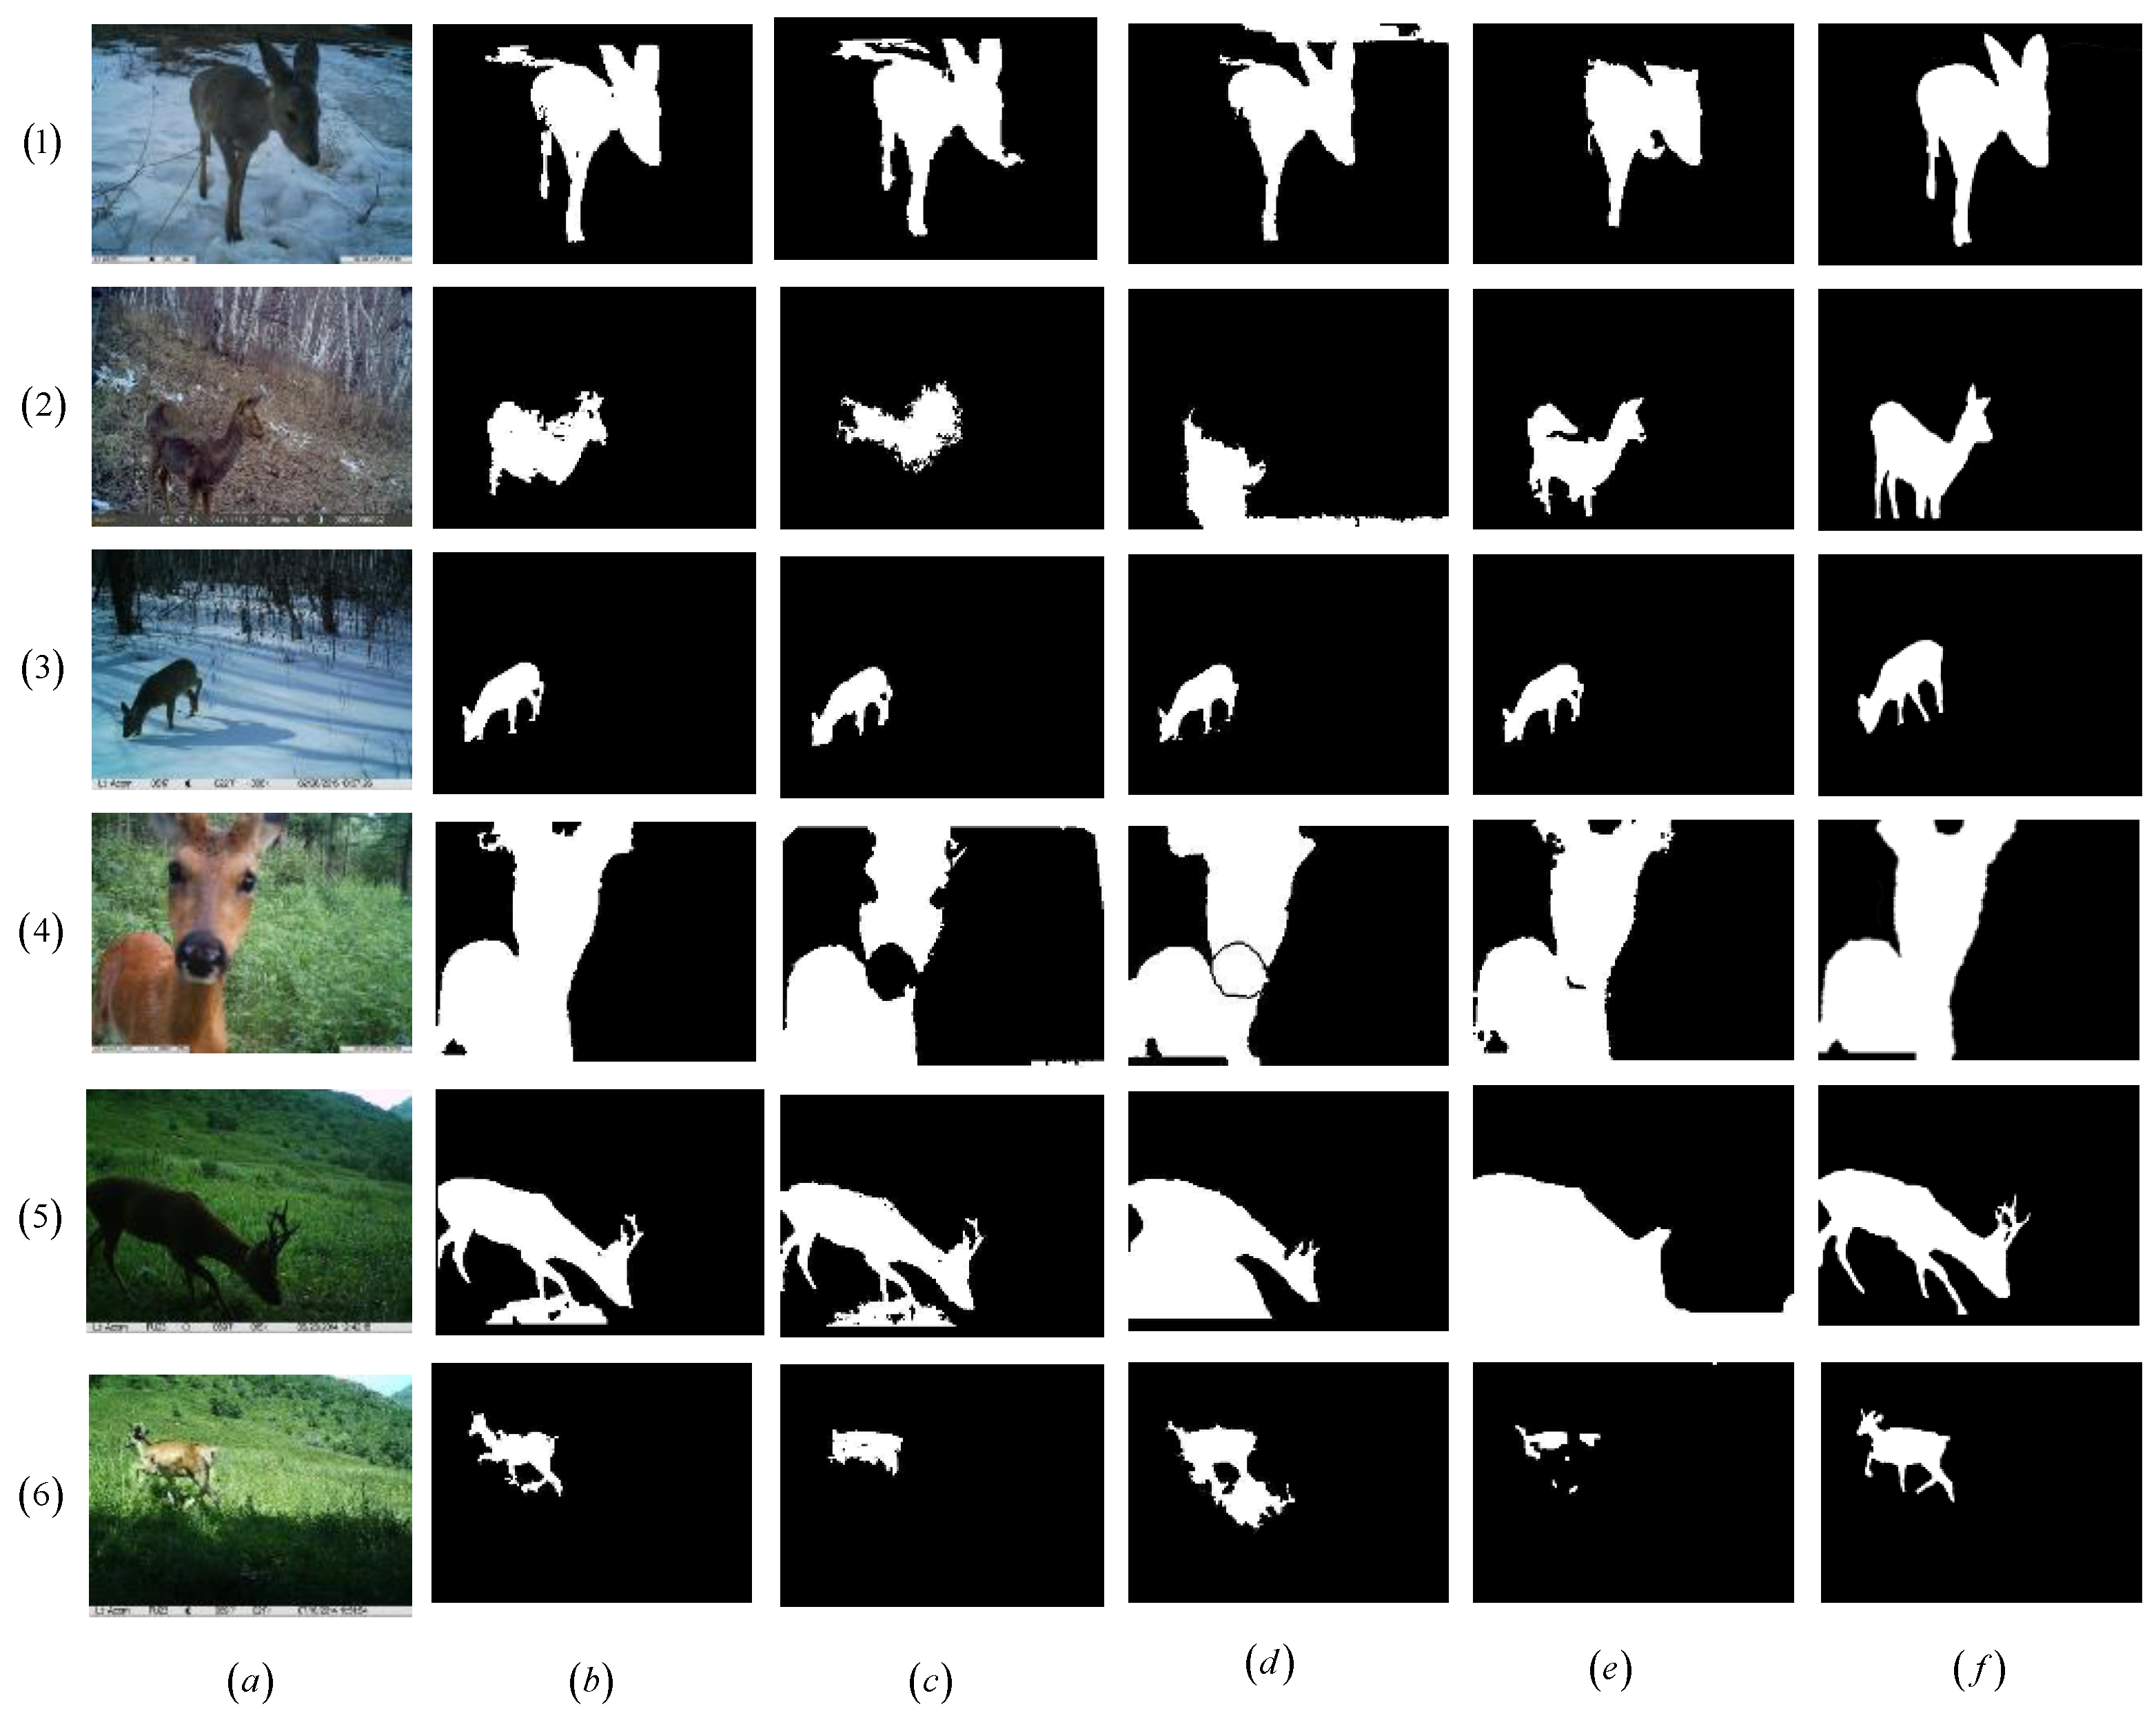
5.2. Experiment and Analysis
6. Conclusions
Author Contributions
Funding
Conflicts of Interest
References
- Hori, B.; Petrell, R.J.; Fernlund, G.; Trites, A. Mechanical reliability of devices subdermally implanted into the young of long-lived and endangered wildlife. J. Mater. Eng. Perform. 2012, 21, 1924–1931. [Google Scholar] [CrossRef]
- Handcock, R.N.; Swain, D.L.; Bishophurley, G.J. Monitoring animal behaviour and environmental interactions using wireless sensor networks, GPS collars and satellite remote sensing. Sensors 2009, 9, 3586–3603. [Google Scholar] [CrossRef] [PubMed]
- Evans, M.N.; Guerrero-Sanchez, S.; Bakar, M.S.A. First known satellite collaring of a viverrid species: Preliminary performance and implications of GPS tracking Malay civets (Viverra tangalunga). Ecol. Res. 2016, 31, 475–481. [Google Scholar] [CrossRef]
- Gomez, A.; Salazar, A.; Vargas, F. Towards Automatic Wild Animal Monitoring: Identification of Animal Species in Camera-trap Images using Very Deep Convolutional Neural Networks. Ecol. Inform. 2017, 41, 24–32. [Google Scholar] [CrossRef]
- Rovero, F.; Zimmermann, F. Camera Trapping for Wildlife Research. J. Wildl. Manag. 2017, 81, 1125. [Google Scholar]
- Pettorelli, N.; Laurance, W.F.; O’Brien, T.G. Satellite remote sensing for applied ecologists: Opportunities and challenges. J. Appl. Ecol. 2014, 51, 839–848. [Google Scholar] [CrossRef]
- Feng, G.; Mi, X.; Yan, H. CFor Bio: A network monitoring Chinese forest biodiversity. Sci. Bull. 2016, 61, 1163–1170. [Google Scholar] [CrossRef]
- Luis, G.; Glen, M.; Eduard, P. Unmanned Aerial Vehicles (UAVs) and Artificial Intelligence Revolutionizing Wildlife Monitoring and Conservation. Sensors 2016, 16, 97. [Google Scholar]
- Wang, H.; Fapojuwo, A.O.; Davies, R.J. A Wireless Sensor Network for Feedlot Animal Health Monitoring. IEEE Sens. J. 2016, 16, 6433–6446. [Google Scholar] [CrossRef]
- Al-Turjman, F.; Radwan, A. Data Delivery in Wireless Multimedia Sensor Networks: Challenging and Defying in the IoT Era. IEEE Wirel. Commun. 2017, 24, 126–131. [Google Scholar] [CrossRef]
- Zhang, J.; Xiang, Q.; Yin, Y.; Chen, C.; Luo, X. Adaptive compressed sensing for wireless image sensor networks. Multimed. Tools Appl. 2017, 76, 4227–4242. [Google Scholar] [CrossRef]
- Banerjee, R.; Bit, S.D. An energy efficient image compression scheme for wireless multimedia sensor network using curve fitting technique. Wirel. Netw. 2017, 3, 1–17. [Google Scholar] [CrossRef]
- Shen, X.; Xiang, L.; Chen, H. Fast Computation of Threshold Based on Multi-threshold Otsu Criterion. J. Electron. Inf. Technol. 2017, 39, 144–149. [Google Scholar]
- Han, J.; Yang, C.; Zhou, X. A new multi-threshold image segmentation approach using state transition algorithm. Appl. Math. Model. 2017, 44, 588–601. [Google Scholar] [CrossRef]
- Yeom, S. Infrared image segmentation based on region of interest extraction with Gaussian mixture modeling. In Proceedings of the Automatic Target Recognition XXVII, SPIE Defense + Security, Anaheim, CA, USA, 1 May 2017; p. 102020. [Google Scholar]
- Fang, Z.; Yu, X.; Wu, C.; Chen, D.; Jia, T. Superpixel Segmentation Using Weighted Coplanar Feature Clustering on RGBD Images. Appl. Sci. 2018, 8, 902. [Google Scholar] [CrossRef]
- Goferman, S.; Zelnikmanor, L.; Tal, A. Context-aware saliency detection. IEEE Trans. Pattern Anal. Mach. Intell. 2012, 34, 1915–1926. [Google Scholar] [CrossRef] [PubMed]
- Long, J.; Shelhamer, E.; Darrell, T. Fully Convolutional Networks for Semantic Segmentation. In Proceedings of the IEEE Conference on Computer Vision and Pattern Recognition (CVPR), Boston, MA, USA, 8–10 June 2015; pp. 3431–3440. [Google Scholar]
- Zhu, J.; Du, X.; Fan, H. Image multi-scale edge detection and image multi-scale segmentation. Geogr. Geo-Inf. Sci. 2013, 29, 45–48. [Google Scholar]
- Jiang, Y.; Hao, Z.; Yang, Z. A cooperative honey bee mating algorithm and its application in multi-threshold image segmentation. Inf. Sci. 2016, 369, 171–183. [Google Scholar] [CrossRef]
- Souza, É.L.; Pazzi, R.W.; Nakamura, E.F. A prediction-based clustering algorithm for tracking targets in quantized areas for wireless sensor networks. Wirel. Netw. 2015, 21, 2263–2278. [Google Scholar] [CrossRef]
- Zou, B.; Liu, Q.; Chen, Z. Saliency detection using boundary information. Multimed. Syst. 2016, 2, 245–253. [Google Scholar] [CrossRef]
- Wei, Z.; Yi, F.; Xiaosong, W. An Improved Image Semantic Segmentation Method Based on Superpixels and Conditional Random Fields. Appl. Sci. 2018, 8, 837. [Google Scholar]
- Shehu, A.; Hulaj, A.; Bajrami, X. An Algorithm for Edge Detection of the Image for Application in WSN. In Proceedings of the 2nd International Conference on Applied Physics, System Science and Computers, Dubrovnik, Croatia, 27–29 September 2017; pp. 207–213. [Google Scholar]
- Feng, W.; Zhang, J.; Hu, C. A Novel Saliency Detection Method for Wild Animal Monitoring Images with WMSN. J. Sens. 2018, 2018. [Google Scholar] [CrossRef]
- Tian, X.; Yu, W. Color image segmentation based on watershed transform and feature clustering. In Proceedings of the IEEE Advanced Information Management, Communicates, Electronic and Automation Control Conference, Xi’an, China, 3–5 October 2016; pp. 1830–1833. [Google Scholar]
- Akbulut, Y.; Guo, Y.; Şengür, A. An effective color texture image segmentation algorithm based on hermite transform. Appl. Soft Comput. 2018, 67, 494–504. [Google Scholar] [CrossRef]
- Shinde, S.R.; Sabale, S.; Kulkarni, S. Experiments on content based image classification using Color feature extraction. In Proceedings of the 2015 International Conference on Communication, Information & Computing Technology, Mumbai, India, 15–17 January 2015; pp. 1–6. [Google Scholar]
- Rahman, Z.; Jobson, D.D.; Woodell, G.A. Retinex processing for automatic image enhancement. J. Electron. Imaging 2004, 13, 100–110. [Google Scholar]
- Zhang, S.; Wang, T.; Dong, J. Underwater image enhancement via extended multi-scale Retinex. Neurocomputing 2017, 245, 1–9. [Google Scholar] [CrossRef]
- Neto, J.R.D.O.; Lima, J.B. Discrete Fractional Fourier Transforms Based on Closed-Form Hermite–Gaussian-Like DFT Eigenvectors. IEEE Trans. Signal Process. 2017, 65, 6171–6184. [Google Scholar] [CrossRef]
- Yun, L.; Shu, S.; Gang, H. A Weighted Measurement Fusion Particle Filter for Nonlinear Multisensory Systems Based on Gauss–Hermite Approximatio. Sensors 2017, 17, 2222–2235. [Google Scholar]
- Leibon, G.; Rockmore, D.N.; Park, W. A Fast Hermite Transform. Theor. Comput. Sci. 2008, 409, 211–228. [Google Scholar] [CrossRef]
- Luo, Z.Z. Hermite Interpolation-Based Wavelet Transform Modulus Maxima Reconstruction Algorithm’s Application to EMG De-noising. J. Electron. Inf. Technol. 2009, 31, 857–860. [Google Scholar]
- Craciun, S.; Kirchgessner, R.; George, A.D.; Lam, H.; Principe, J.C. A real-time, power-efficient architecture for mean-shift image segmentation. J. Real-Time Image Process. 2018, 14, 379–394. [Google Scholar] [CrossRef]
- Lang, F.; Yang, J.; Yan, S.; Qin, F. Superpixel Segmentation of Polarimetric Synthetic Aperture Radar (SAR) Images Based on Generalized Mean Shift. Remote Sens. 2018, 10, 1592. [Google Scholar] [CrossRef]
- Liu, C.; Zhou, A.; Zhang, Q. Adaptive image segmentation by using mean-shift and evolutionary optimization. IET Image Process. 2014, 8, 327–333. [Google Scholar] [CrossRef]
- Wang, G.; Wang, G.; Yang, H. Mean shift segmentation algorithm based on fused color-texture model. Sci. Surv. Mapp. 2015, 40, 108–112. [Google Scholar]
- Daniel, F.; Pavel, K. Fast mean shift by compact density representation. In Proceedings of the IEEE Conference on Computer Vision and Pattern Recognition, Miami, FL, USA, 20–25 June 2009; pp. 1818–1825. [Google Scholar]
- Mesas-Carrascosa, F.J.; Rumbao, I.C.; Berrocal, J.A.B.; Porras, A.G.-F. Positional Quality Assessment of Orthophotos Obtained from Sensors Onboard Multi-Rotor UAV Platforms. Sensors 2014, 14, 22394–22407. [Google Scholar] [CrossRef] [PubMed]
- Shi, J.; Malik, J. Normalized cuts and image segmentation. IEEE Trans. Pattern Anal. Mach. Intell. 2000, 22, 888–905. [Google Scholar]
- Ban, Z.; Liu, J.; Cao, L. Superpixel Segmentation Using Gaussian Mixture Model. IEEE Trans. Image Process. 2018, 27, 4105–4117. [Google Scholar] [CrossRef] [PubMed]
| 1 | Trigger mode Trigger mode Infrared trigger |


| Monitoring Node | Parameter |
|---|---|
| Camera | OV7725 QVGA 30 fps |
| Pixel | 640 × 480 |
| Memory card | SD 16G |
| Controller | STM32 |
| Monitoring range | 120°/Radius 10 m |
| Maximum transmission distance | 1200 m |
© 2019 by the authors. Licensee MDPI, Basel, Switzerland. This article is an open access article distributed under the terms and conditions of the Creative Commons Attribution (CC BY) license (http://creativecommons.org/licenses/by/4.0/).
Share and Cite
Liu, W.; Liu, H.; Wang, Y.; Zheng, X.; Zhang, J. A Novel Extraction Method for Wildlife Monitoring Images with Wireless Multimedia Sensor Networks (WMSNs). Appl. Sci. 2019, 9, 2276. https://doi.org/10.3390/app9112276
Liu W, Liu H, Wang Y, Zheng X, Zhang J. A Novel Extraction Method for Wildlife Monitoring Images with Wireless Multimedia Sensor Networks (WMSNs). Applied Sciences. 2019; 9(11):2276. https://doi.org/10.3390/app9112276
Chicago/Turabian StyleLiu, Wending, Hanxing Liu, Yuan Wang, Xiaorui Zheng, and Junguo Zhang. 2019. "A Novel Extraction Method for Wildlife Monitoring Images with Wireless Multimedia Sensor Networks (WMSNs)" Applied Sciences 9, no. 11: 2276. https://doi.org/10.3390/app9112276
APA StyleLiu, W., Liu, H., Wang, Y., Zheng, X., & Zhang, J. (2019). A Novel Extraction Method for Wildlife Monitoring Images with Wireless Multimedia Sensor Networks (WMSNs). Applied Sciences, 9(11), 2276. https://doi.org/10.3390/app9112276