Article

Exhaust Gas Condensation during Engine Cold Start and Application of the Dry-Wet Correction Factor

by
Barouch Giechaskiel
*,
Alessandro A. Zardini
and
Michael Clairotte
European Commission—Joint Research Centre, Directorate for Energy, Transport and Climate, Sustainable Transport Unit, 21027 Ispra, Italy
*
Author to whom correspondence should be addressed.
Appl. Sci. 2019, 9(11), 2263; https://doi.org/10.3390/app9112263
Submission received: 10 May 2019 / Revised: 29 May 2019 / Accepted: 29 May 2019 / Published: 31 May 2019
(This article belongs to the Special Issue Air Pollution)

Abstract

:

Featured Application

Dry-wet correction factors for diesel, gasoline, and CNG vehicles.

Abstract

Gas components, like carbon monoxide (CO) and dioxide (CO2), can be measured on a wet- or dry-basis depending on whether the water is left or removed from the sample before analysis. The dry concentrations of gaseous components in the exhaust from internal combustion engines are converted to wet concentrations with conversion factors based on the combustion products and the fuel properties. Recent CO2 measurements with portable emissions measurement systems (PEMS) compared to laboratory grade equipment showed differences during the first minutes after engine start. In this study we compared instruments measuring on a dry- and wet-basis using different measuring principles (non-dispersive infrared detection (NDIR) and Fourier-transform infrared spectroscopy (FTIR)) at the exhaust of gasoline, compressed natural gas (CNG), and diesel light-duty and L-category vehicles. The results showed an underestimation of the CO2 and CO mass emissions up to 13% at cold start when the conversion factor is applied and not direct “wet” measurements are taken, raising concerns about reported CO2 and CO cold start emissions in some cases. The underestimation was negligible (<1%) for CO2 when the whole test (20–30 min) was considered, but not for CO (1%–10% underestimation) because the majority of emissions takes place at cold start. Exhaust gas temperature, H2O measurements and different expressions of the dry-wet corrections confirmed that the differences are due to condensation at the exhaust pipes and aftertreatment devices when the surface temperatures are lower than the dew point of the exhaust gases. The results of this study help to interpret differences when comparing instruments with different principles of operation at the same location, instruments sampling at different locations, or the same instrument measuring different driving test cycles or at different ambient temperatures (e.g., −7 °C).

1. Introduction

Road transport is a significant source of air pollution in the European Union (EU) and vehicle emissions regulations try to limit the emission levels [1]. For instance, carbon dioxide (CO2) is a greenhouse gas regulated by the EU with emission limits for vehicles [2]. Exceedance of these limits by the vehicle manufacturers are subject to fines.
The current regulations are traditionally based on measurements of diluted samples from bags filled from a dilution tunnel where the whole exhaust gas is diluted during roller bench tests. However, direct measurements of the raw exhaust from the tailpipe are permitted in the EU and worldwide in the case of engine emission tests (e.g., heavy duty diesel engines and small utility gasoline engines) [3]. Moreover, direct tailpipe measurements are often conducted for research purposes [4].
Recently, on-road measurements with Portable Emissions Measurement Systems (PEMS) were introduced both in the heavy-duty [5,6] and light-duty regulations [7]. The majority of the commercial systems use the same principle as the laboratory grade equipment in order to measure carbon monoxide (CO) and CO2: Non-Dispersive Infrared detection (NDIR) after drying the exhaust gas to reduce water (H2O) spectral interference. However, the PEMS specifications in EU permit other principles as well, as long as the equivalency is proven [7]. Recently the wet-basis measurement with heated NDIR was introduced. Such measurements need to take into account the water interference effects (spectral overlap and molecular interaction) on CO and CO2. Roller-bench and on-road tests for research purposes are also conducted with Fourier-Transform Infrared Spectroscopy (FTIR) [8] because several chemical components can be simultaneously detected [9,10,11]. The measurement in this case is wet-based.
The dry-wet conversion of the gas concentrations is done with a multiplicative correction factor (Kd-w) given in several national and international regulations [6,7,12]. They are based on established combustion equations to derive air-to-fuel ratios (derived in the past for the performance of carburetors and fuel injection systems) [13,14]. The different expressions of this correction factor in the various regulations are very similar to each other, but not identical. The correction factors are based on the gaseous dry-based concentrations of combustion products (mainly CO2 and CO) and the fuel properties assuming that neither condensation nor evaporation of water in the pipes take place.
Condensation of water vapor and several other condensable semi-volatile components in the exhaust gas can take place when the temperatures of the pipes or after-treatment devices are below the dew point temperature of the exhaust gas. The dew point of water in the gasoline exhaust is about 53 °C, lower for diesel, higher for CNG (about 60 °C) [15]. These values are for stoichiometric combustion and change for instance at lean conditions and or different winter/summer fuel formulations, especially for high ethanol content. The dew point can further increase and even exceed 100 °C in the presence of SO3 [16]. Thus, condensation during low ambient temperatures and engine cold start is inevitable.
The exhaust gas condensation has been studied to protect Exhaust Gas Recirculation (EGR) valves [16], to model condensation at aftertreatment devices [17], to recover water from military vehicles [18], to avoid condensation in the dilution tunnels for the measurement of emissions [19], or to avoid failures of NOx, oxygen, ammonia, and soot sensors utilizing ceramic sensing elements containing electrodes or electrochemical cells [20]. It has also been shown that it can result in loss of hydrophilic compounds (such as NH3) [21]. However, as far as the authors are aware, there is no scientific literature on the sensitivity of measured gas concentrations with respect to different dry-wet correction factors, even though cold start emissions are a topic widely discussed [4,22,23,24,25,26,27,28,29,30,31]. The comparison of instruments at the tailpipe with different measurement techniques is not common and only recently it was mentioned that some differences could exist [32]. In most cases the exhaust flow rate was considered the major contributor of the differences and not the CO2 concentration measurements [33].
The objective of this paper is to explain these differences by comparing wet- and dry-based analyzers, quantifying the differences, and discussing the implications on the measurement results and cold start emissions. For this reason, different principles of measurement (NDIR, FTIR) from different manufacturers will be compared for various engine technologies (spark ignition, compression ignition).

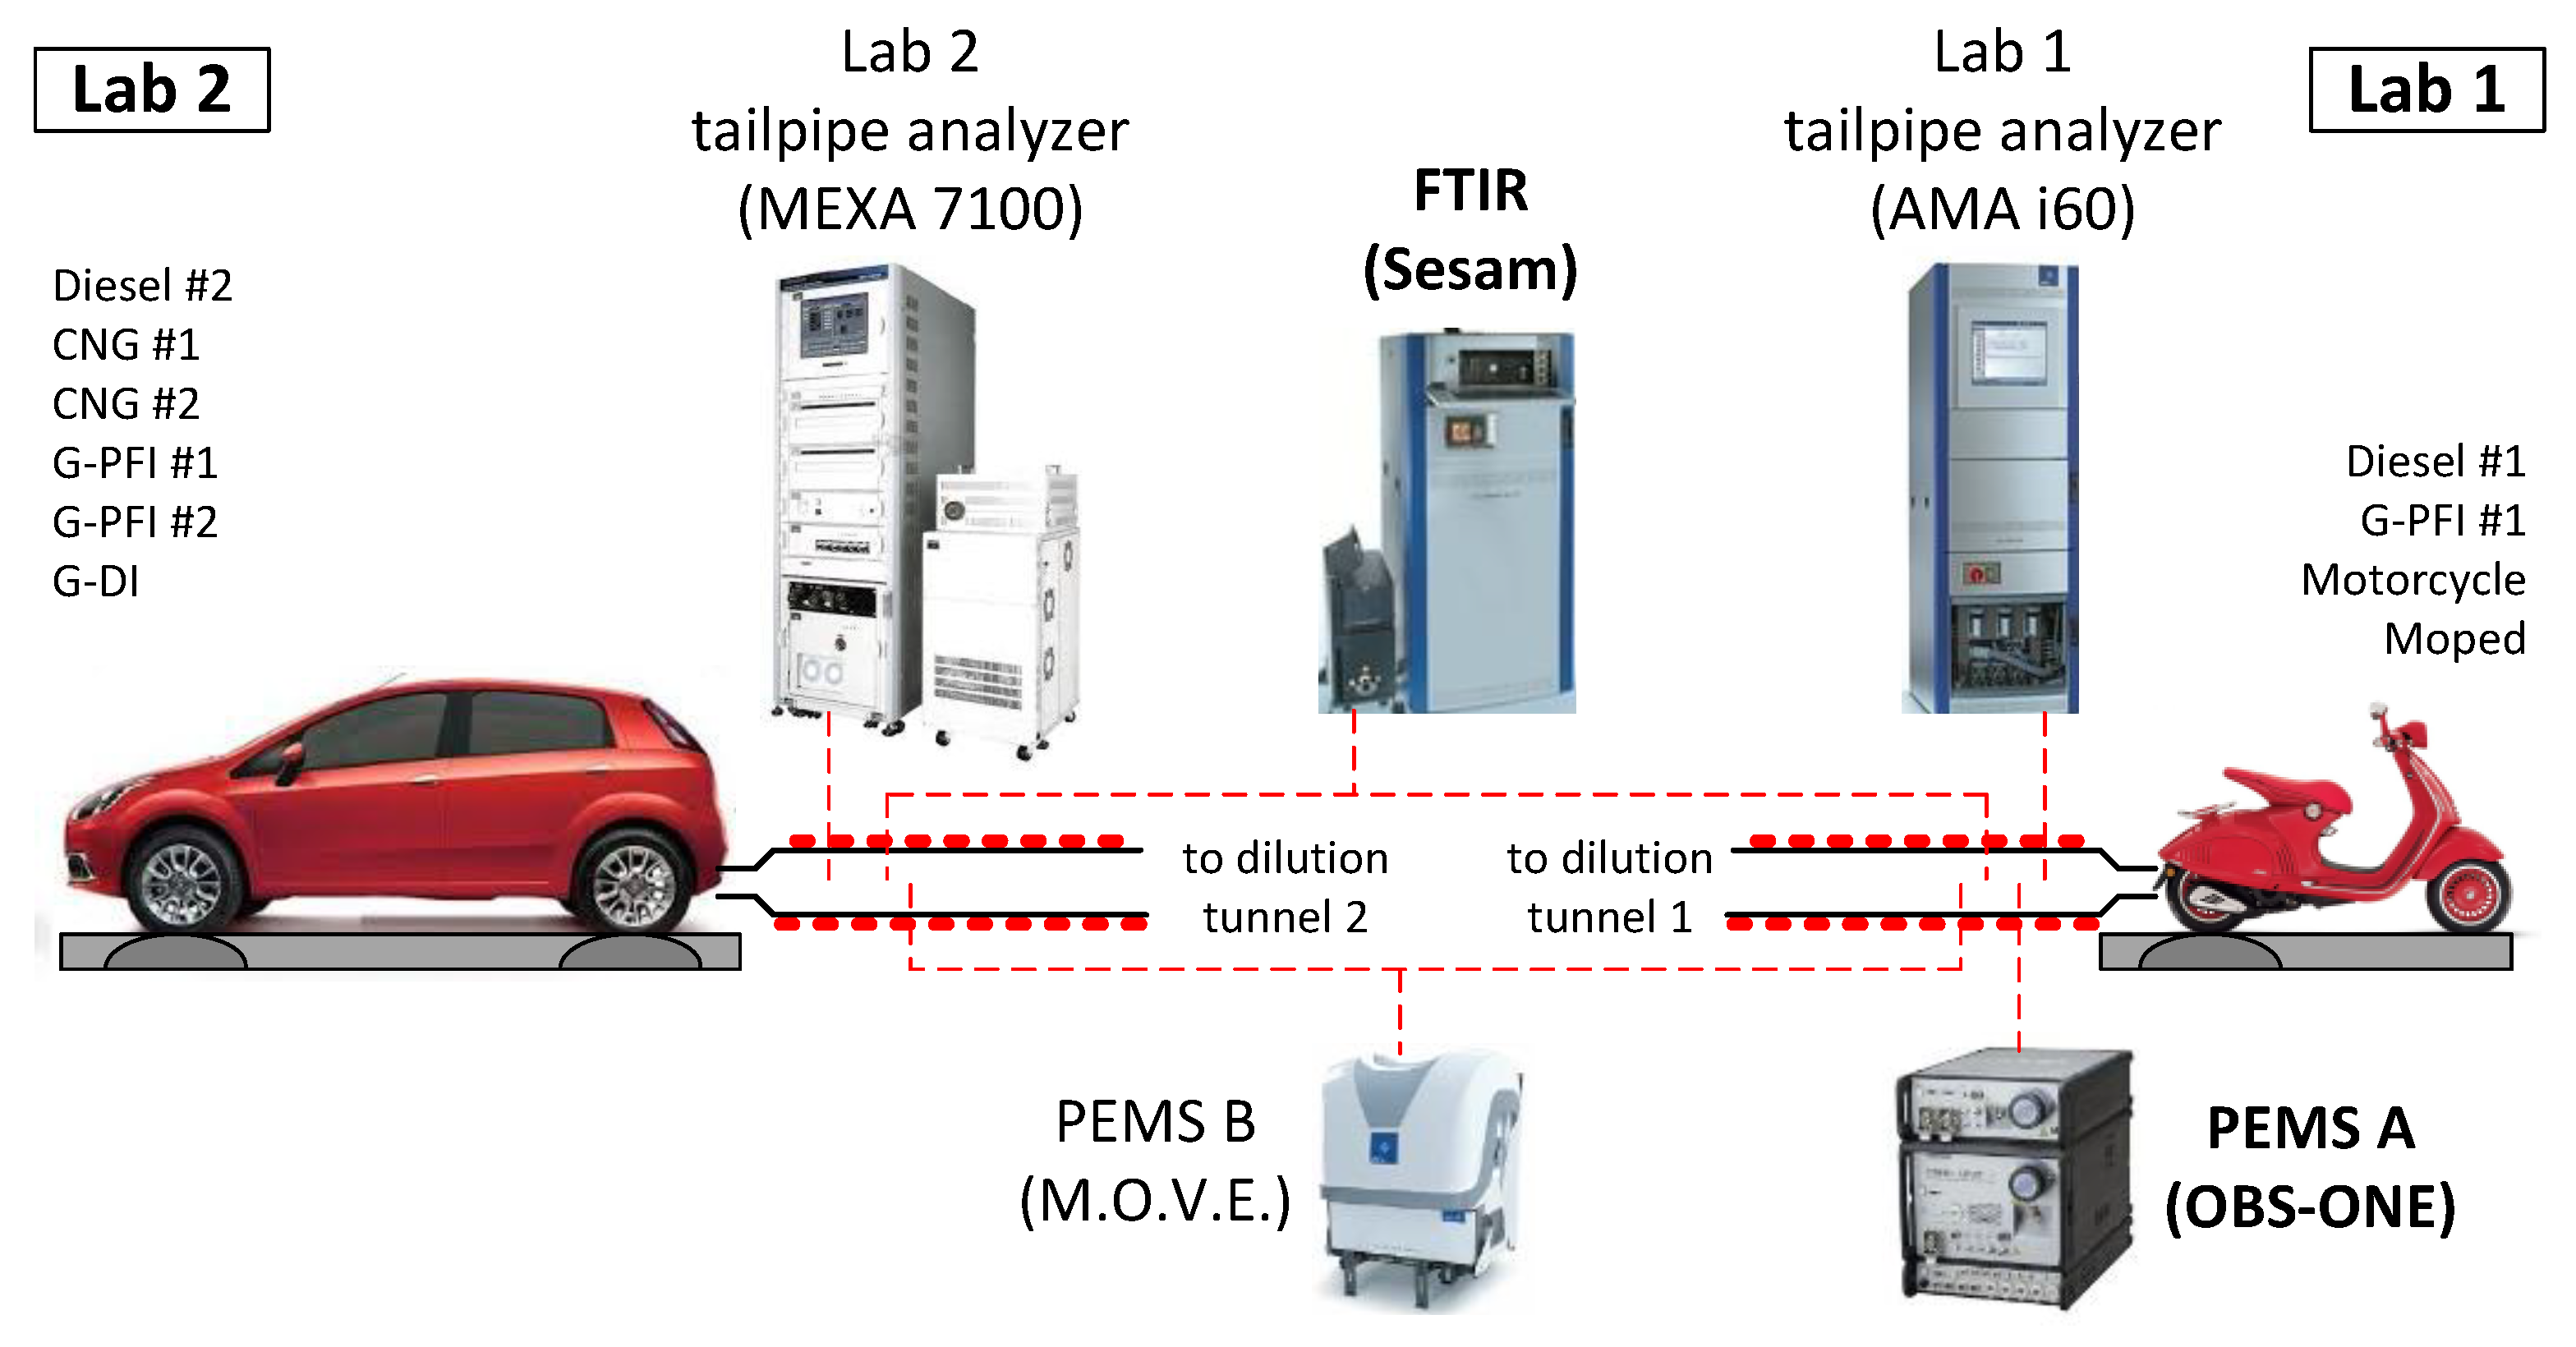
2. Materials and Methods

The experimental setup is given in Figure 1. The light-duty vehicles tested were respecting the Euro 6 emission standard [34] and the two-wheelers (L-category) the recently introduced Euro 4 [35]. They were all registered in 2017–2018 with one exception (2014). The fleet consisted of vehicles with diesel, gasoline, and CNG fueled engines; see Table 1. Market fuels were used during the campaign: diesel B7, gasoline E10, and CNG (>87% methane).
The vehicles were tested with the recently introduced Worldwide harmonized Light-duty vehicle Test Cycle (WLTC) for type approval in EU. For two-wheelers, the recently introduced Worldwide harmonized Motorcycle Test Cycle (WMTC) was used. Extra cold and hot NEDC (New European Driving Cycle) and WLTC tests were done with the Gasoline Direct Injection (G-DI) and constant speed tests with the Gasoline Port Fuel Injection (G-PFI) #2 vehicles.
The motorcycles were tested at the one axle roller dynamometer Vehicle Emissions Laboratory (VELA 1) of the European Commission–Joint Research Centre in Italy. The light-duty tests were conducted at the two axis roller dynamometer Vehicle Emissions Laboratory (VELA 2). G-PFI #1 was additionally tested at the one-axis roller dynamometer (VELA 1). In all cases laboratory grade analyzers were sampling from the tailpipe in parallel with PEMS or FTIR. The characteristics of the equipment are summarized in Table 2. All systems used heated lines >90 °C in order to avoid any condensation in their sampling lines.
PEMS A [36] and FTIR measure chemical concentrations on a wet basis, thus they do not apply any dry-wet correction on the original signal. PEMS B and the laboratory grade analyzers of laboratory 1 and 2 measure on a dry basis: PEMS B compensates for the water interference and for Lab1 and Lab2 the dry-wet correction is applied in post-processing.
NDIR analyzers are composed of an infrared source lamp, a sample chamber, and a reference parallel chamber through which the split IR beam is focused, an optical filter to select the wavelength that the molecules absorbs, and a detector. FTIR is composed of an infrared source lamp, a Michelson interferometer as dispersive element, a sample chamber, and a detector. The advantage of the FTIR technique is that the full mid-infrared spectra is acquired, which allows building dedicated multilinear models based on specific wavelength area in which interferences of other compounds (i.e., H2O) do not occur.

3. Theoretical Analysis

The concentrations measured on a dry basis Cdry are converted to a wet basis Cwet with the dry-wet conversion factor (Kd-w) as:
Cwet = Kd-w × Cdry,
We found the following formulas to calculate Kd-w: according to the RDE test procedure, the ISO (International Organization for Standardization) 8178 standard or based on the H2O measurement:

3.1. RDE

The formula used in EU light-duty [7] and heavy-duty [6] regulations is:
Kd-w,RDE = {1/[1 + a × 0.005 × (CCO2 + CCO)] − kw1} × 1.008,
where
kw1 = 1.608 × Ha/(1000 + 1.608 × Ha),
where Ha (g water per kg dry air) is the vehicle intake air absolute humidity, CCO2 (%) is the (measured) dry CO2 concentration, CCO (%) is the (measured) dry CO concentration, a is the molar hydrogen to carbon ratio of the fuel.
The Ha was provided by the climatic chamber where the vehicles were tested: for the typical testing conditions (23–25 °C and 50%–55% relative humidity), it was in the range 8.7–10.9 g/kg. The a was 1.86 in most gasoline and diesel cases, while 3.85 for CNG.

3.2. ISO 8178

ISO 8178-1:2017 [12] is applicable to reciprocating internal combustion engines for mobile, transportable, and stationary use, excluding engines for motor vehicles primarily designed for road use.
Kd-w,ISO = 1/A,
A = 1 + a × 0.005 × (CCO2 + CCO) − 0.1 × CH2 +kw1pr/pb,
CH2 = 0.5 × a × CCO × (CCO2 + CCO)/(CCO + 3 × CCO2),
where CH2 (%) is the dry H2 concentration, pr (kPa) is the water pressure after the instrument cooler, pb (kPa) is the total barometric pressure. Their ratio is typically around 0.008.

3.3. From H2O Measurements

In the case where measurements are on a wet basis and H2O concentrations are available (typical in case of FTIR deployment), CH2O (%), Kd-w can be estimated from:
Kd-w, H2O = 1 − CH2O/100.

3.4. CO2 Mass Emissions

The mass CO2 emissions mCO2 (g/s) were calculated from the (wet) concentration of the CO2 CCO2 (%) and the exhaust gas flow rate qexh (kg/s) according to the EU RDE legislation:
mCO2 = u × CCO2 × qexh,
where u is the ratio of the density of the CO2 and the overall density of the exhaust (0.001517 for diesel B7, 0.001551 for CNG, 0.001518 for gasoline E10) [7]. The exhaust gas flow rate was measured in the laboratory from the difference of the total flow of the dilution tunnel minus the dilution air flow.

4. Results

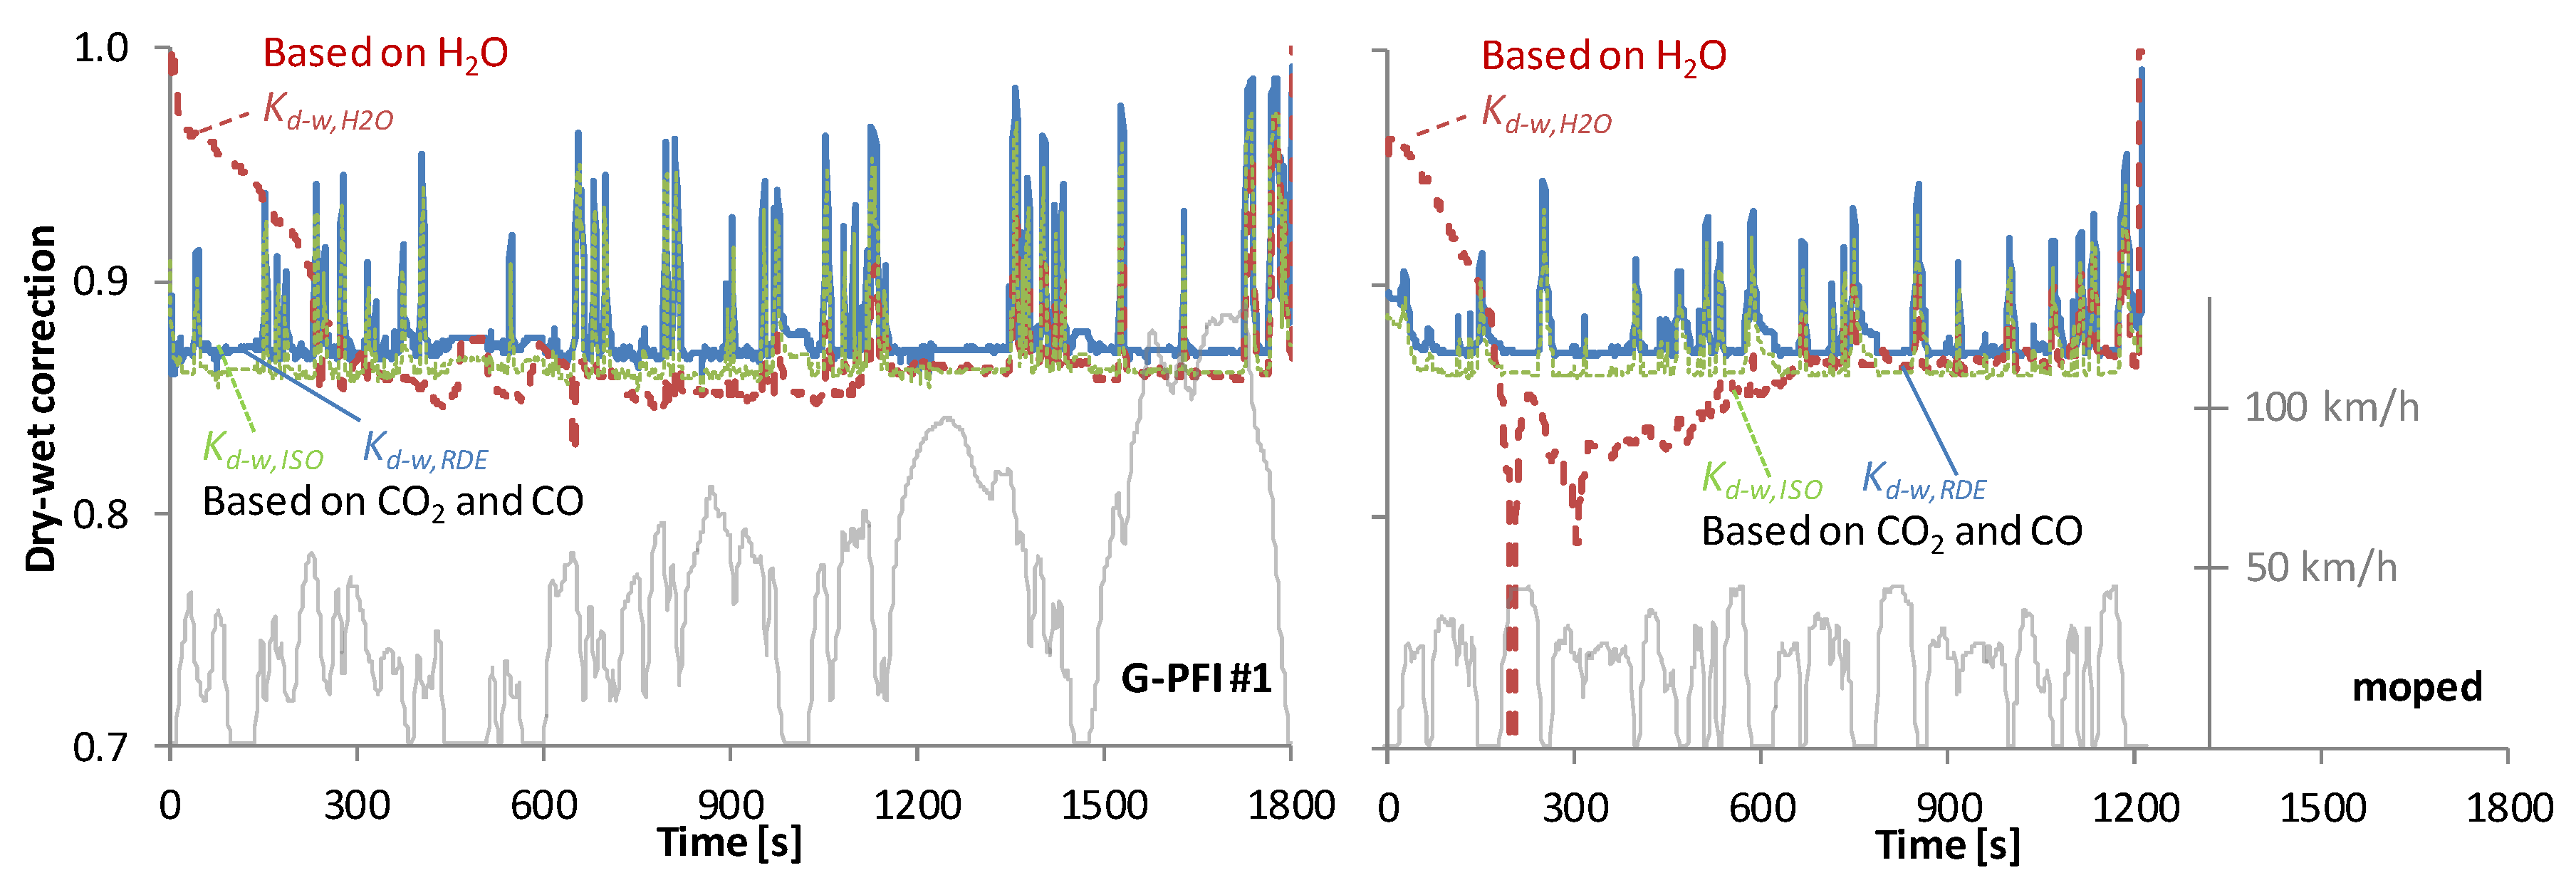
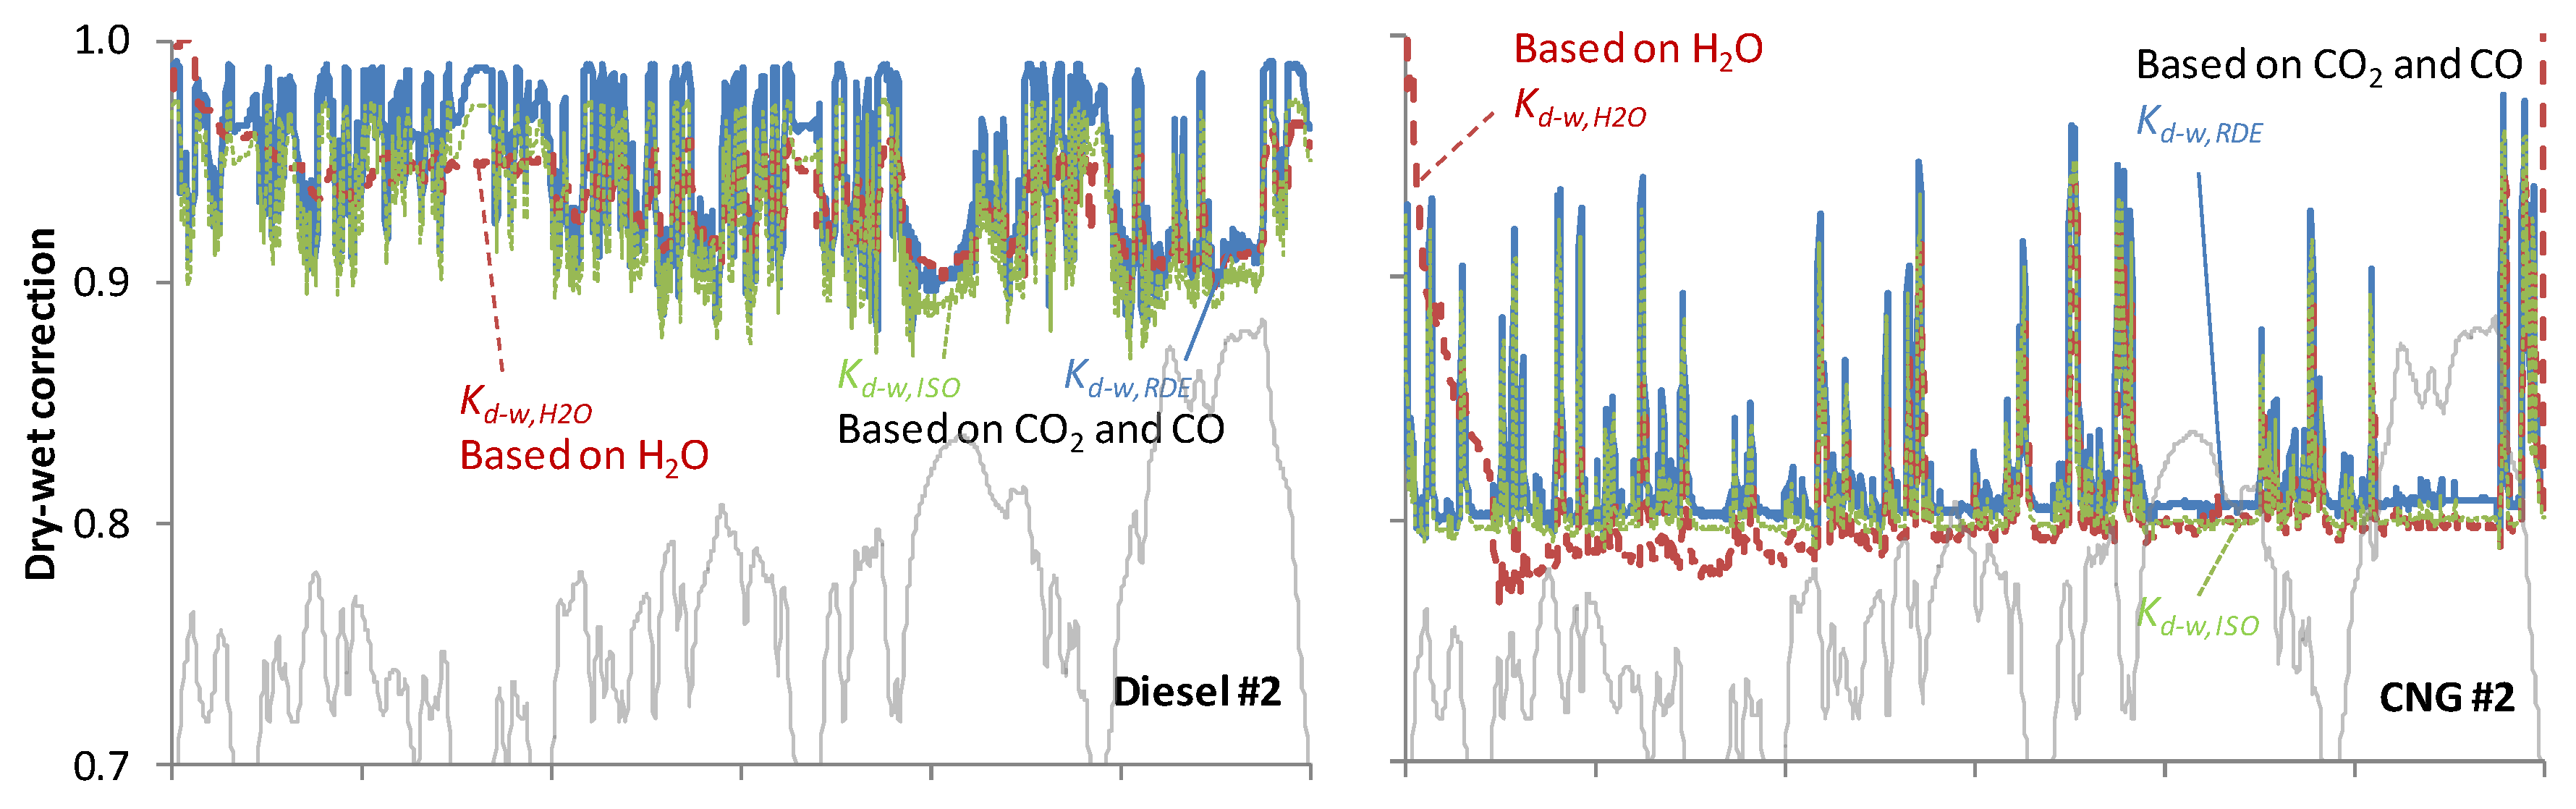
4.1. Dry-Wet Correction

The Kd-w factors with the two basic approaches (H2O or CO2 and CO tailpipe measurements) are plotted for some vehicles in Figure 2 during WLTC and WMTC emission tests (see Section 2). It can be seen that (i) the factor based on H2O measurements is in general smoother than the second-by-second calculation based on CO2 and CO; (ii) the two expressions based on CO2 and CO measurements (ISO, RDE) are very close to each other (within 1.5%); (iii) the CO and CO2 based factor is lower than the H2O based factor during the first 30–600 s but then very similar.
There are some cases where the Kd-w,H2O factor drops below 0.8 for a few seconds due to H2O spikes. These spikes appear at spark ignition vehicles when the exhaust gas temperature is close to the dew point and there is a fuel cut-off. We believe that they are true evaporation of water due to changes of flow (pressure) and temperature when there is an almost equilibrium of evaporation and condensation: the pressure drop lowers the dew point and results in water evaporation.
Table 3 summarizes the values of the conversion factors for the start condensation time, i.e., from engine start until the Kd-w,H2O curve in Figure 2 crosses the Kd-w,RDE curve, and for the rest of the cycle. The ISO factor is not considered because it was not derived for the road vehicles; nevertheless, the results would be similar (within 1.5%). For diesel vehicles the two conversion factor curves meet after 35–45 s and have difference around 5%. The conversion factors of the CNG vehicles at the first 2–3 min have the largest differences of 7%–12%. The conversion factors of the gasoline vehicles differ 5%–7.5%; the difference lasts around 2 min for the two-wheelers and 4–10 min for the passenger cars. The differences become smaller at the rest of the cycle (<3%) but with the opposite trend (results with Kd-w,RDE correction higher).

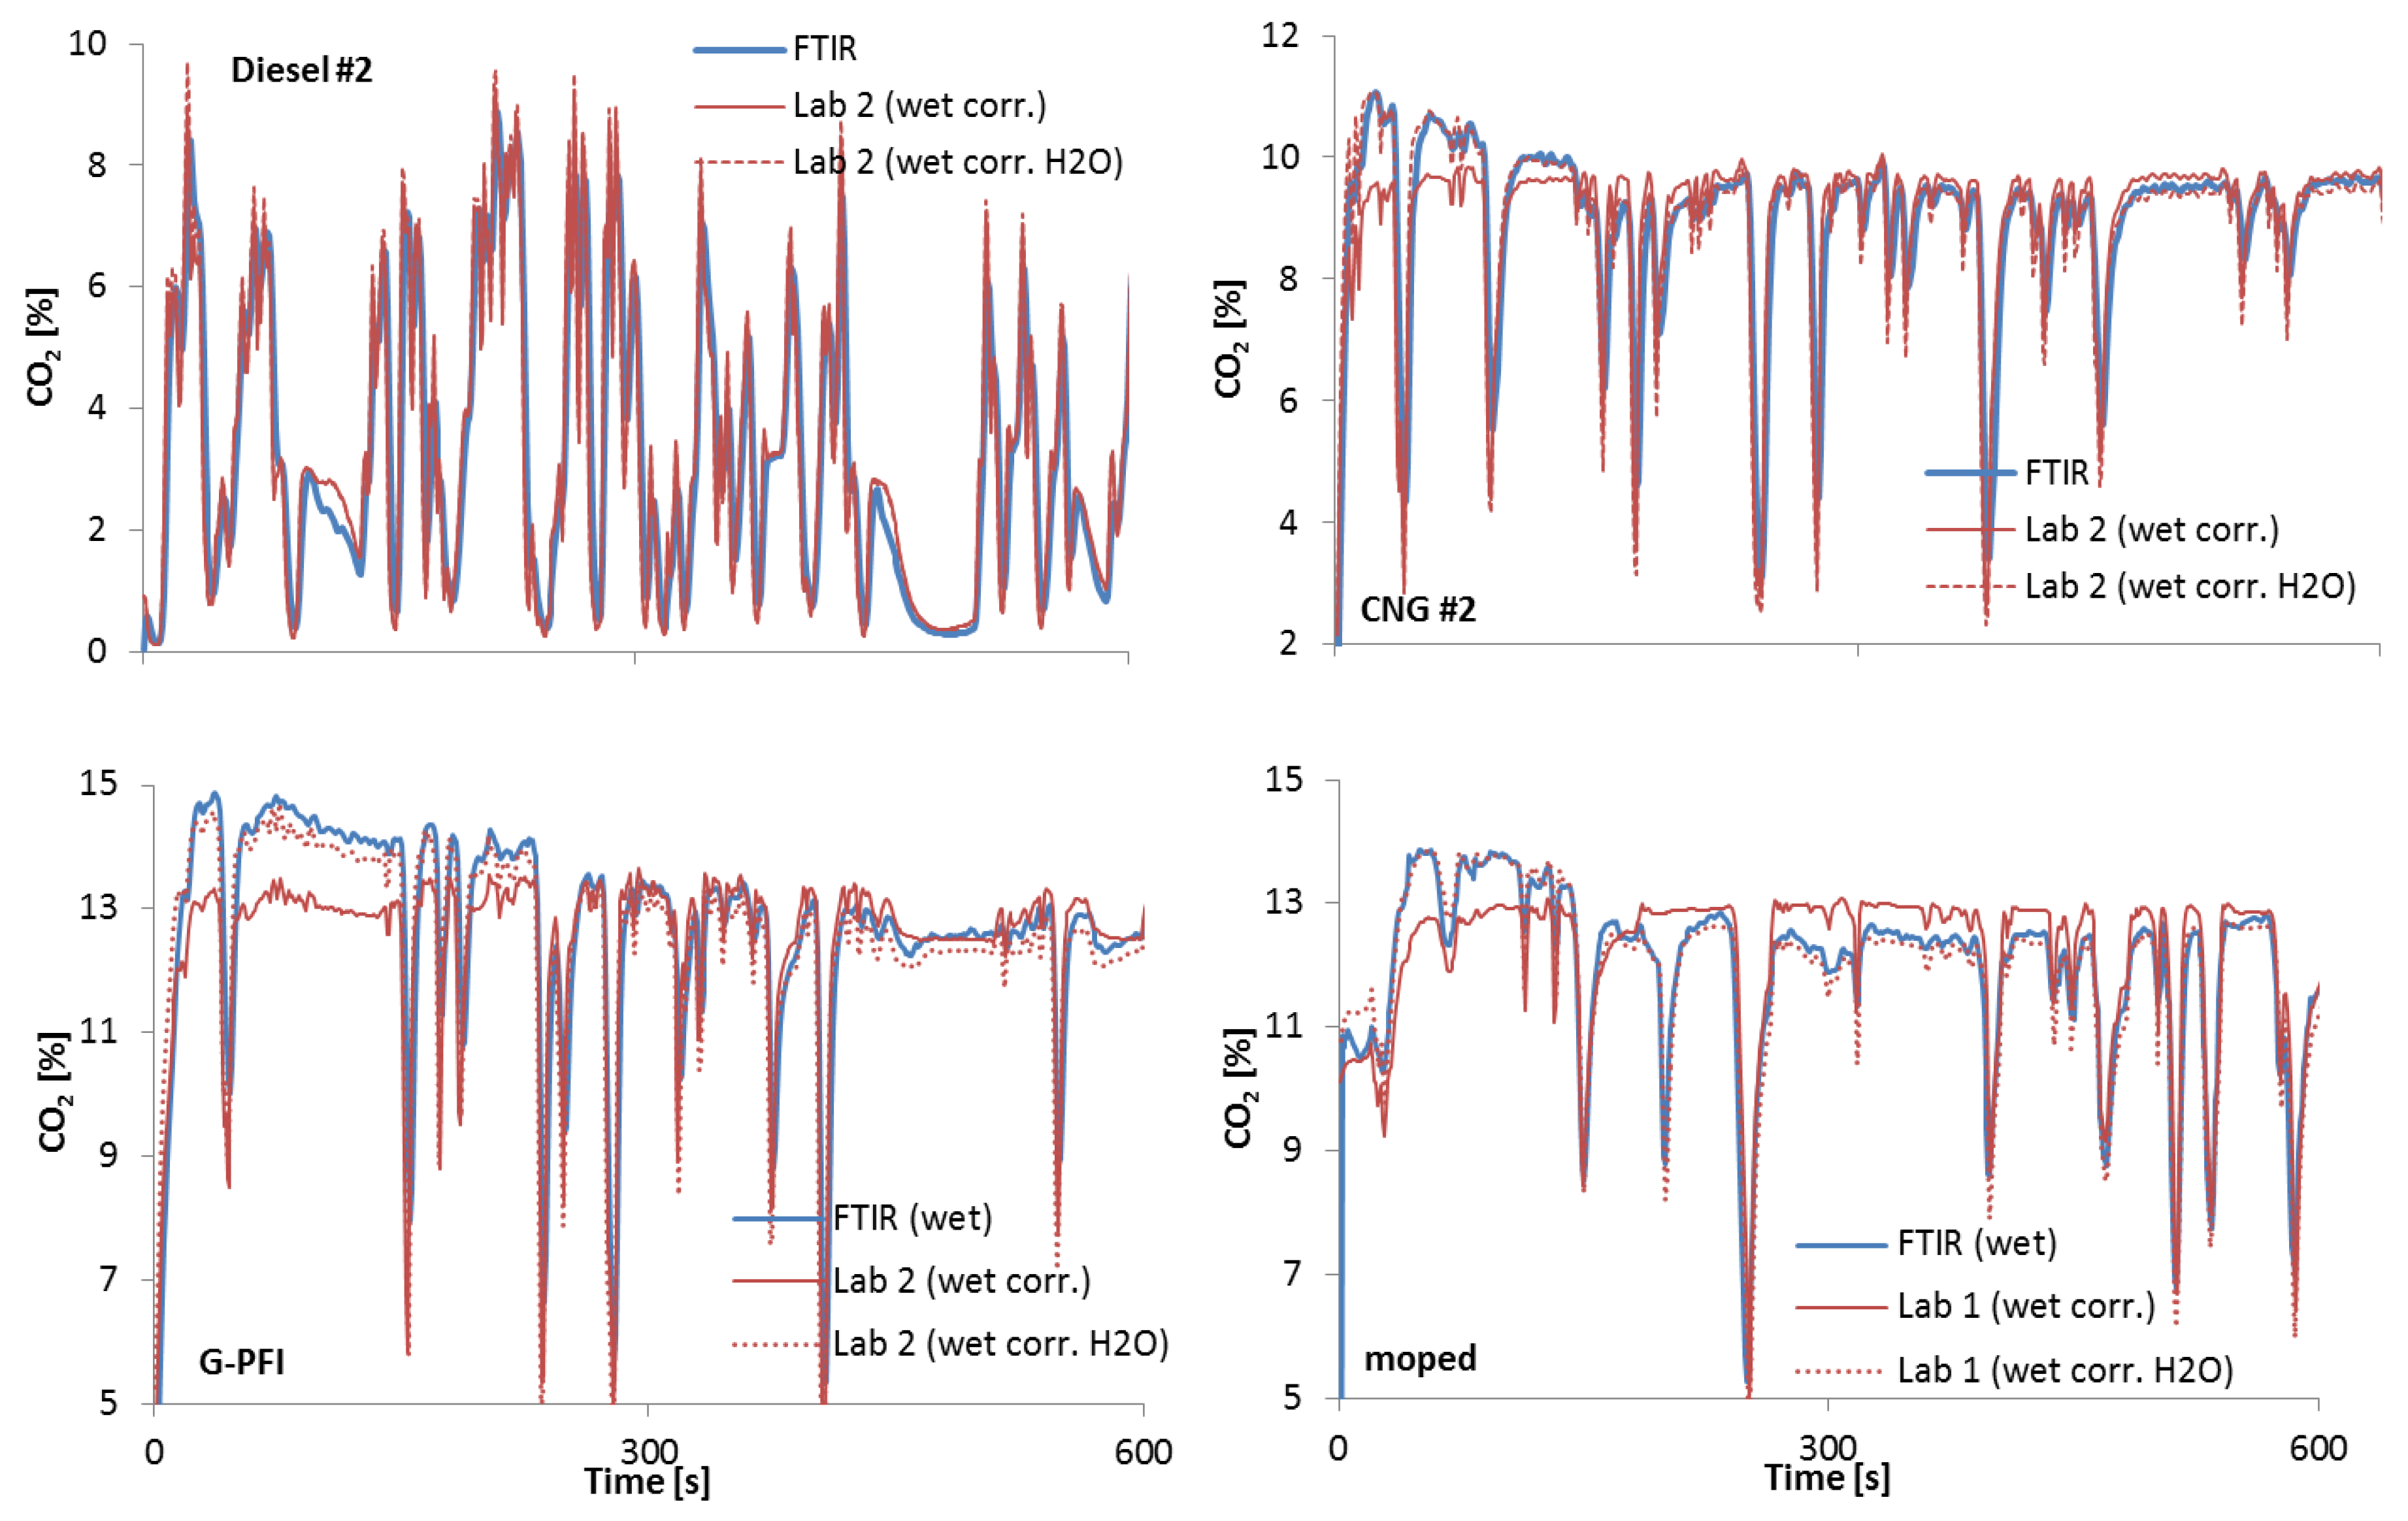
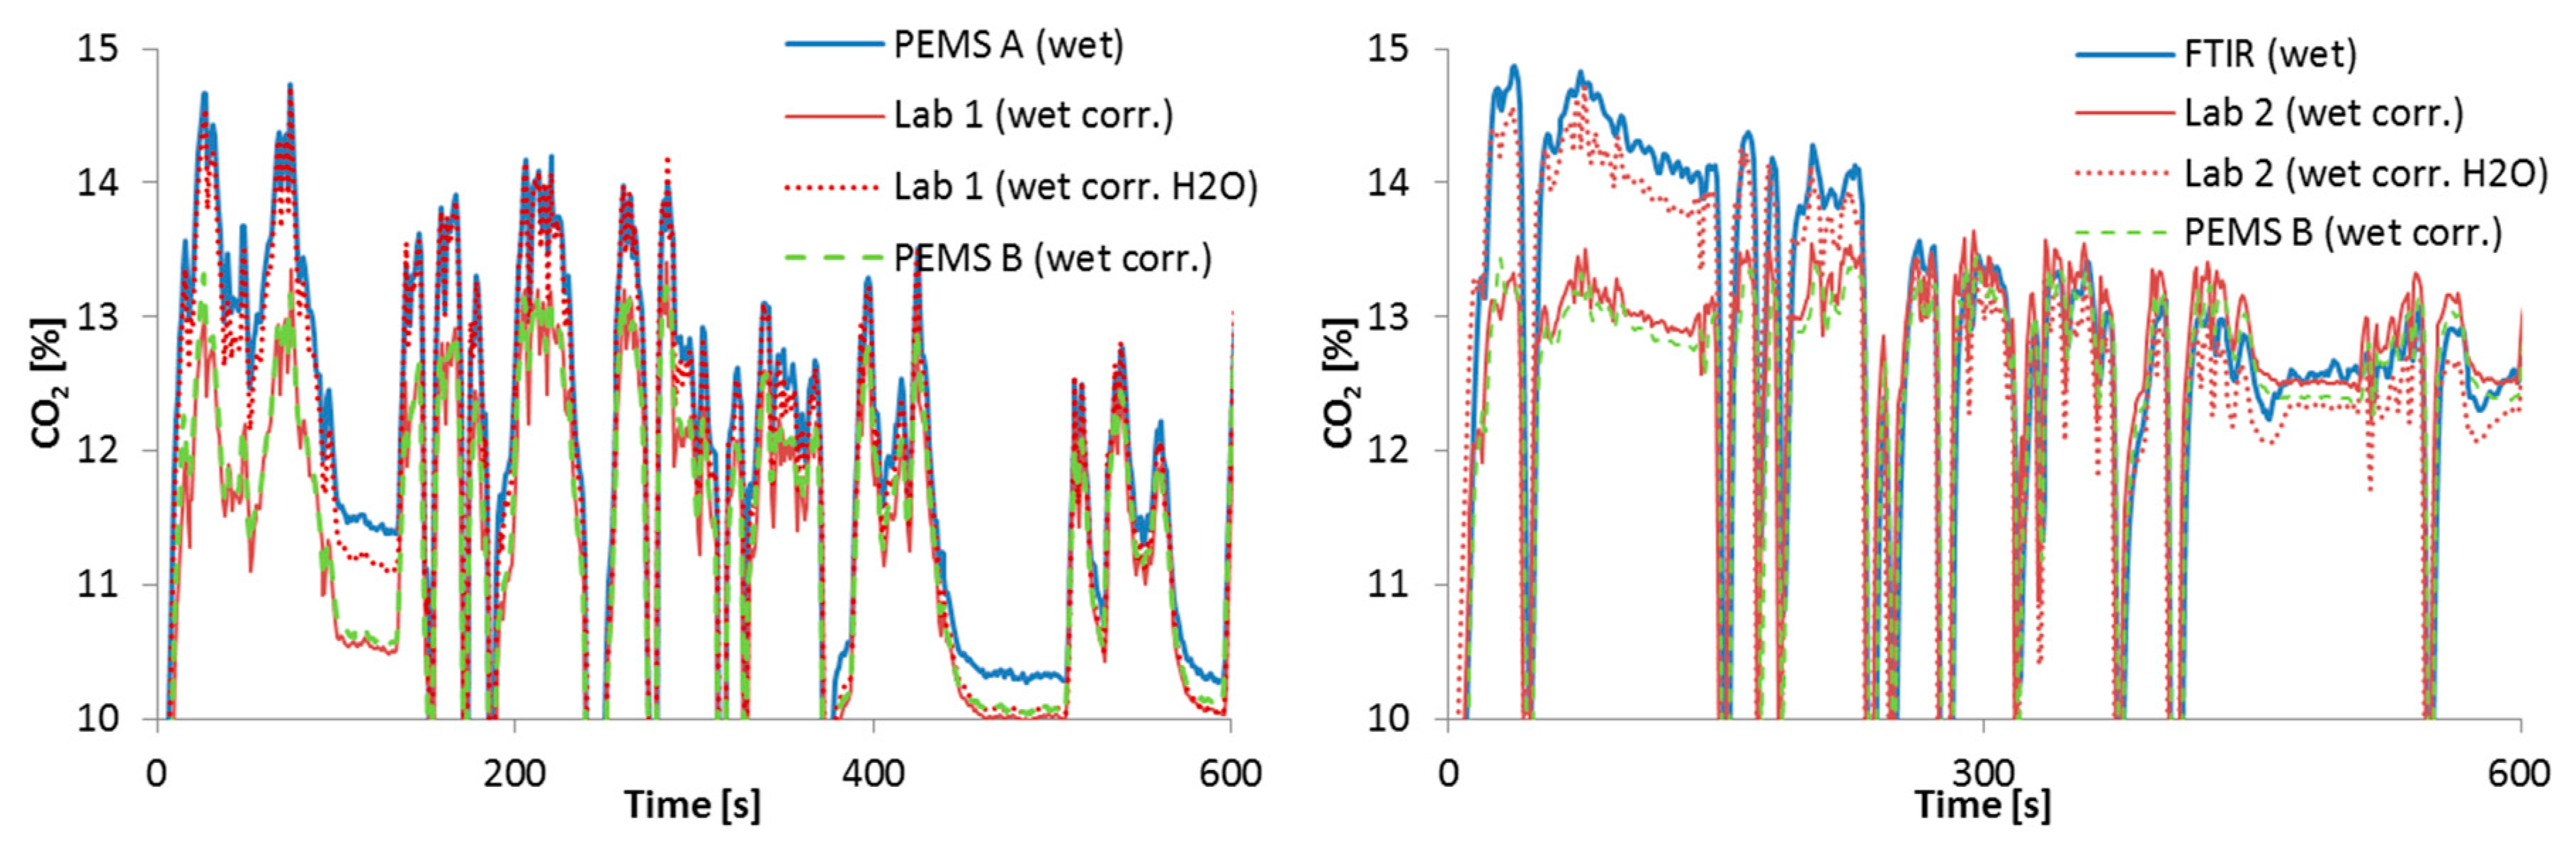
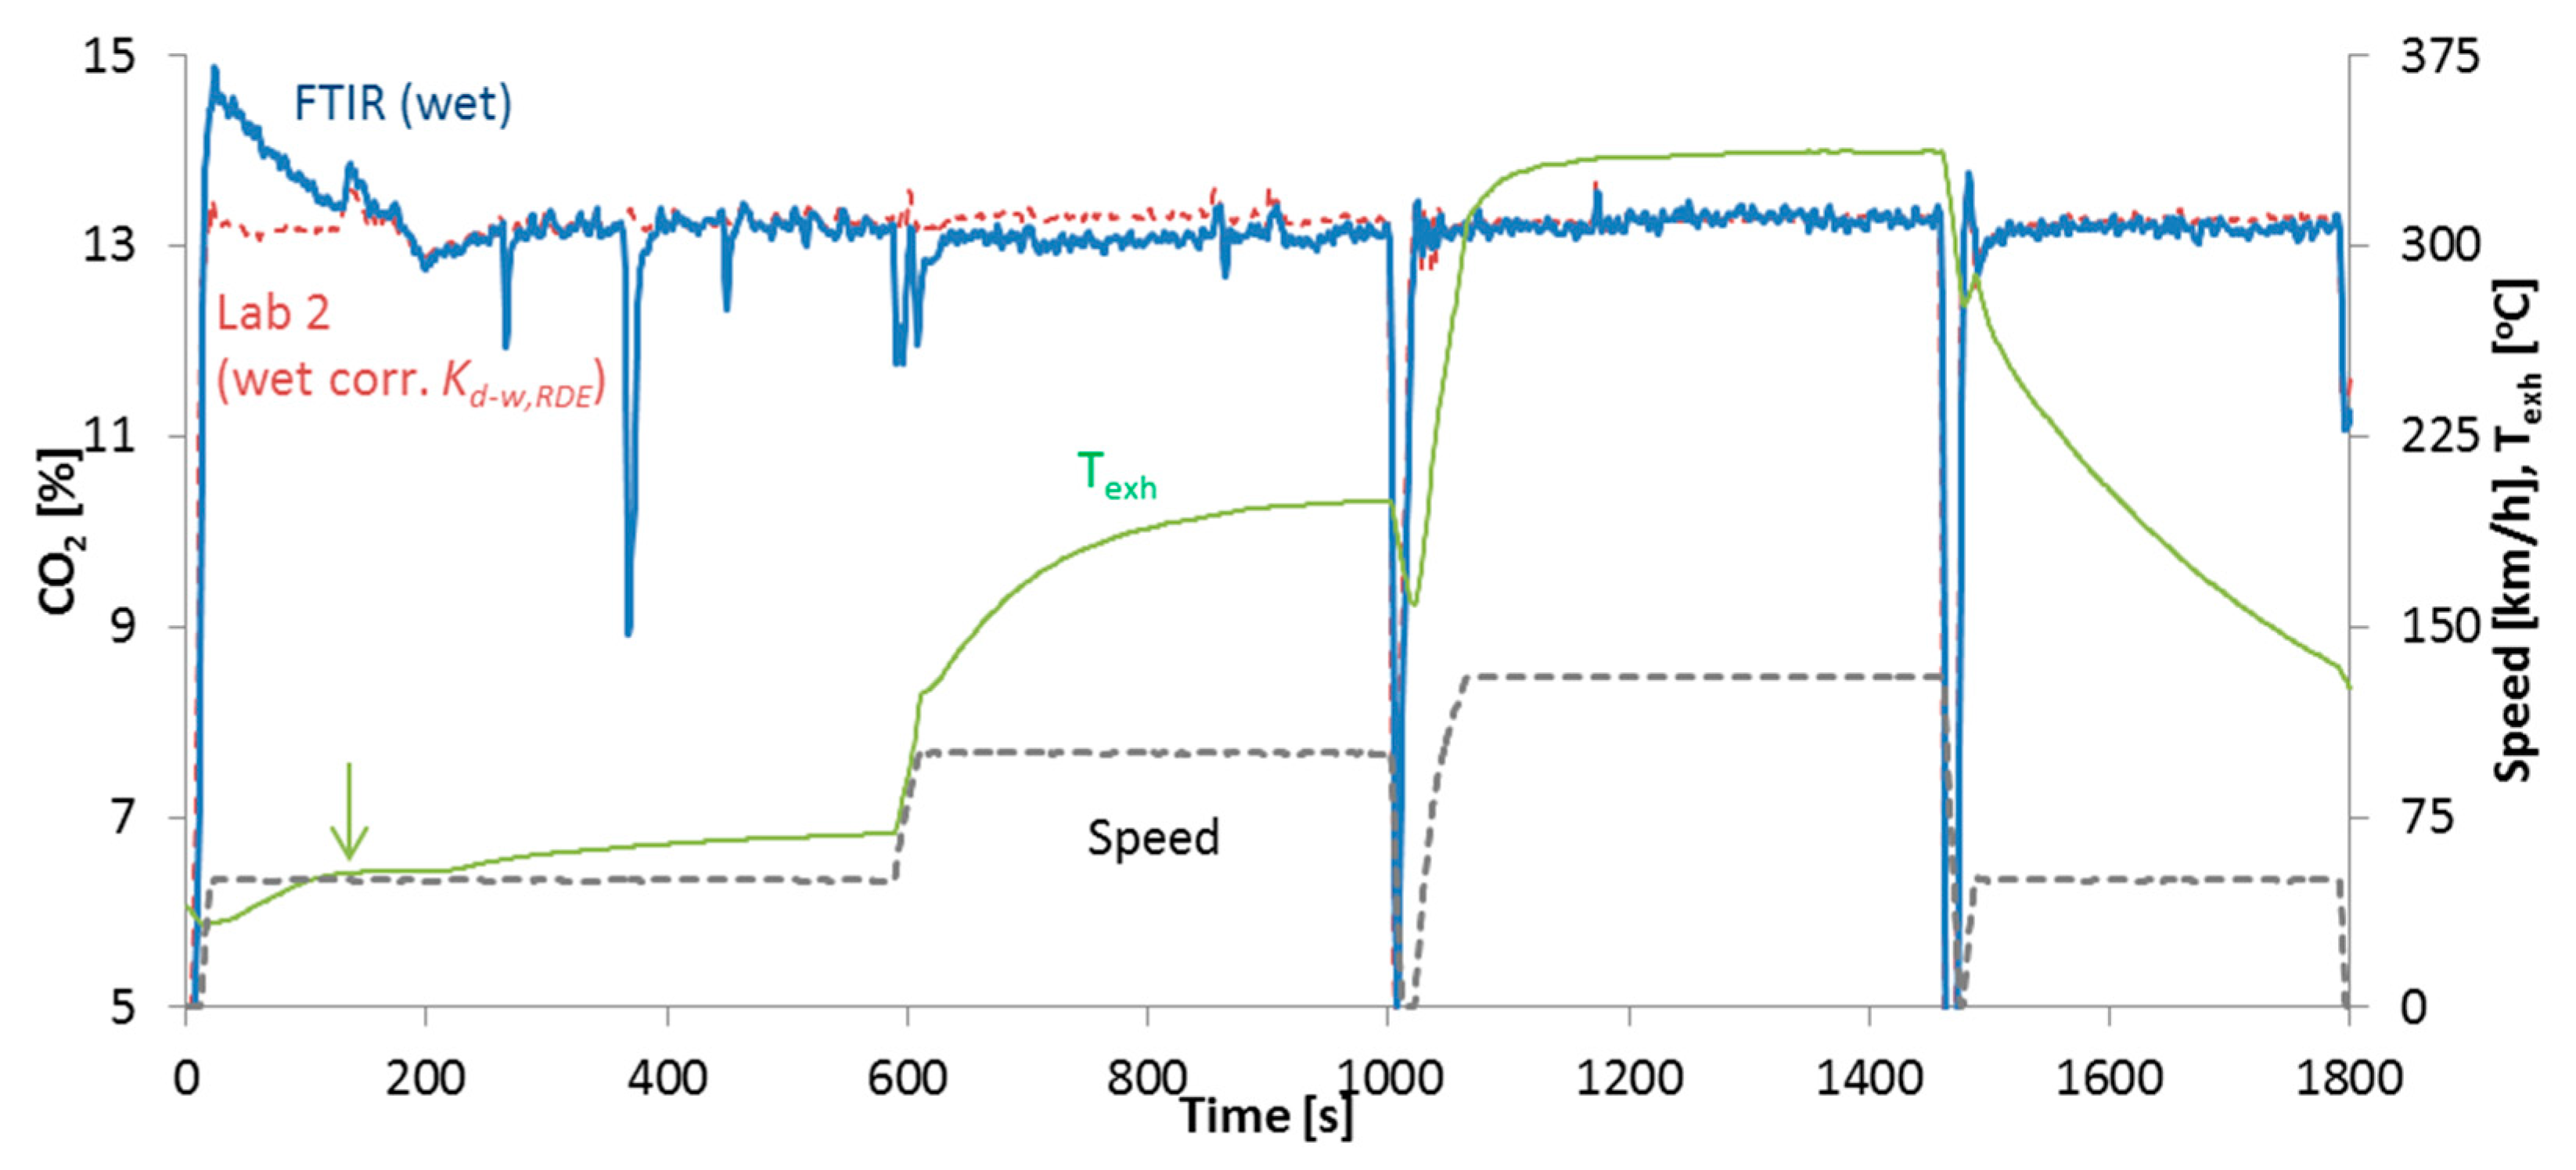
4.2. CO2 Exhaust Measurements

The wet CO2 concentrations (%) (directly measured or converted with different Kd-w factors) are presented in Figure 3. Only the first 600 s are shown because approximately after the first 600 s the Kd-w corrections tend to be similar (within 3%) and thus any CO2 differences have to do with the accuracy of the CO2 analyzers (typically better than 2% for the two techniques: NDIR and FTIR, Table 2) and less with the Kd-w factor. In agreement with the dry-wet correction factor results, there is a big difference at the beginning of the test (5%–10%) (FTIR vs. Lab 2 wet corr.) (Table 4). The difference becomes smaller when the Kd-w factor based on H2O is used (<2%) (FTIR vs. Lab 2 wet corr. H2O). At the rest of the test the differences are ±2% regardless of the conversion factor that is used.

4.3. Principle of Measurement

Figure 4 plots the results for the G-PFI #1 vehicle at two different laboratories. The tests were conducted with a time difference of 1 year and different settings at the chassis dynamometer, so the absolute levels are not directly comparable. Nevertheless, in both cases the wet measurements (PEMS A, left panel or FTIR right panel) are higher than the wet corrected results according to the RDE equation (Lab 1 and PEMS B left panel, Lab 2 and PEMS B, right panel). The differences become smaller when the correction based on H2O is used (Lab 1 or 2 wet corr. H2O). Together with results in Figure 3, this confirms that the cold start differences discussed so far are neither company, nor instrument, nor laboratory dependent, but have to do with the principle of the measurement (direct wet measurement or corrected). The differences between FTIR and heated NDIR are out of the scope of this study.

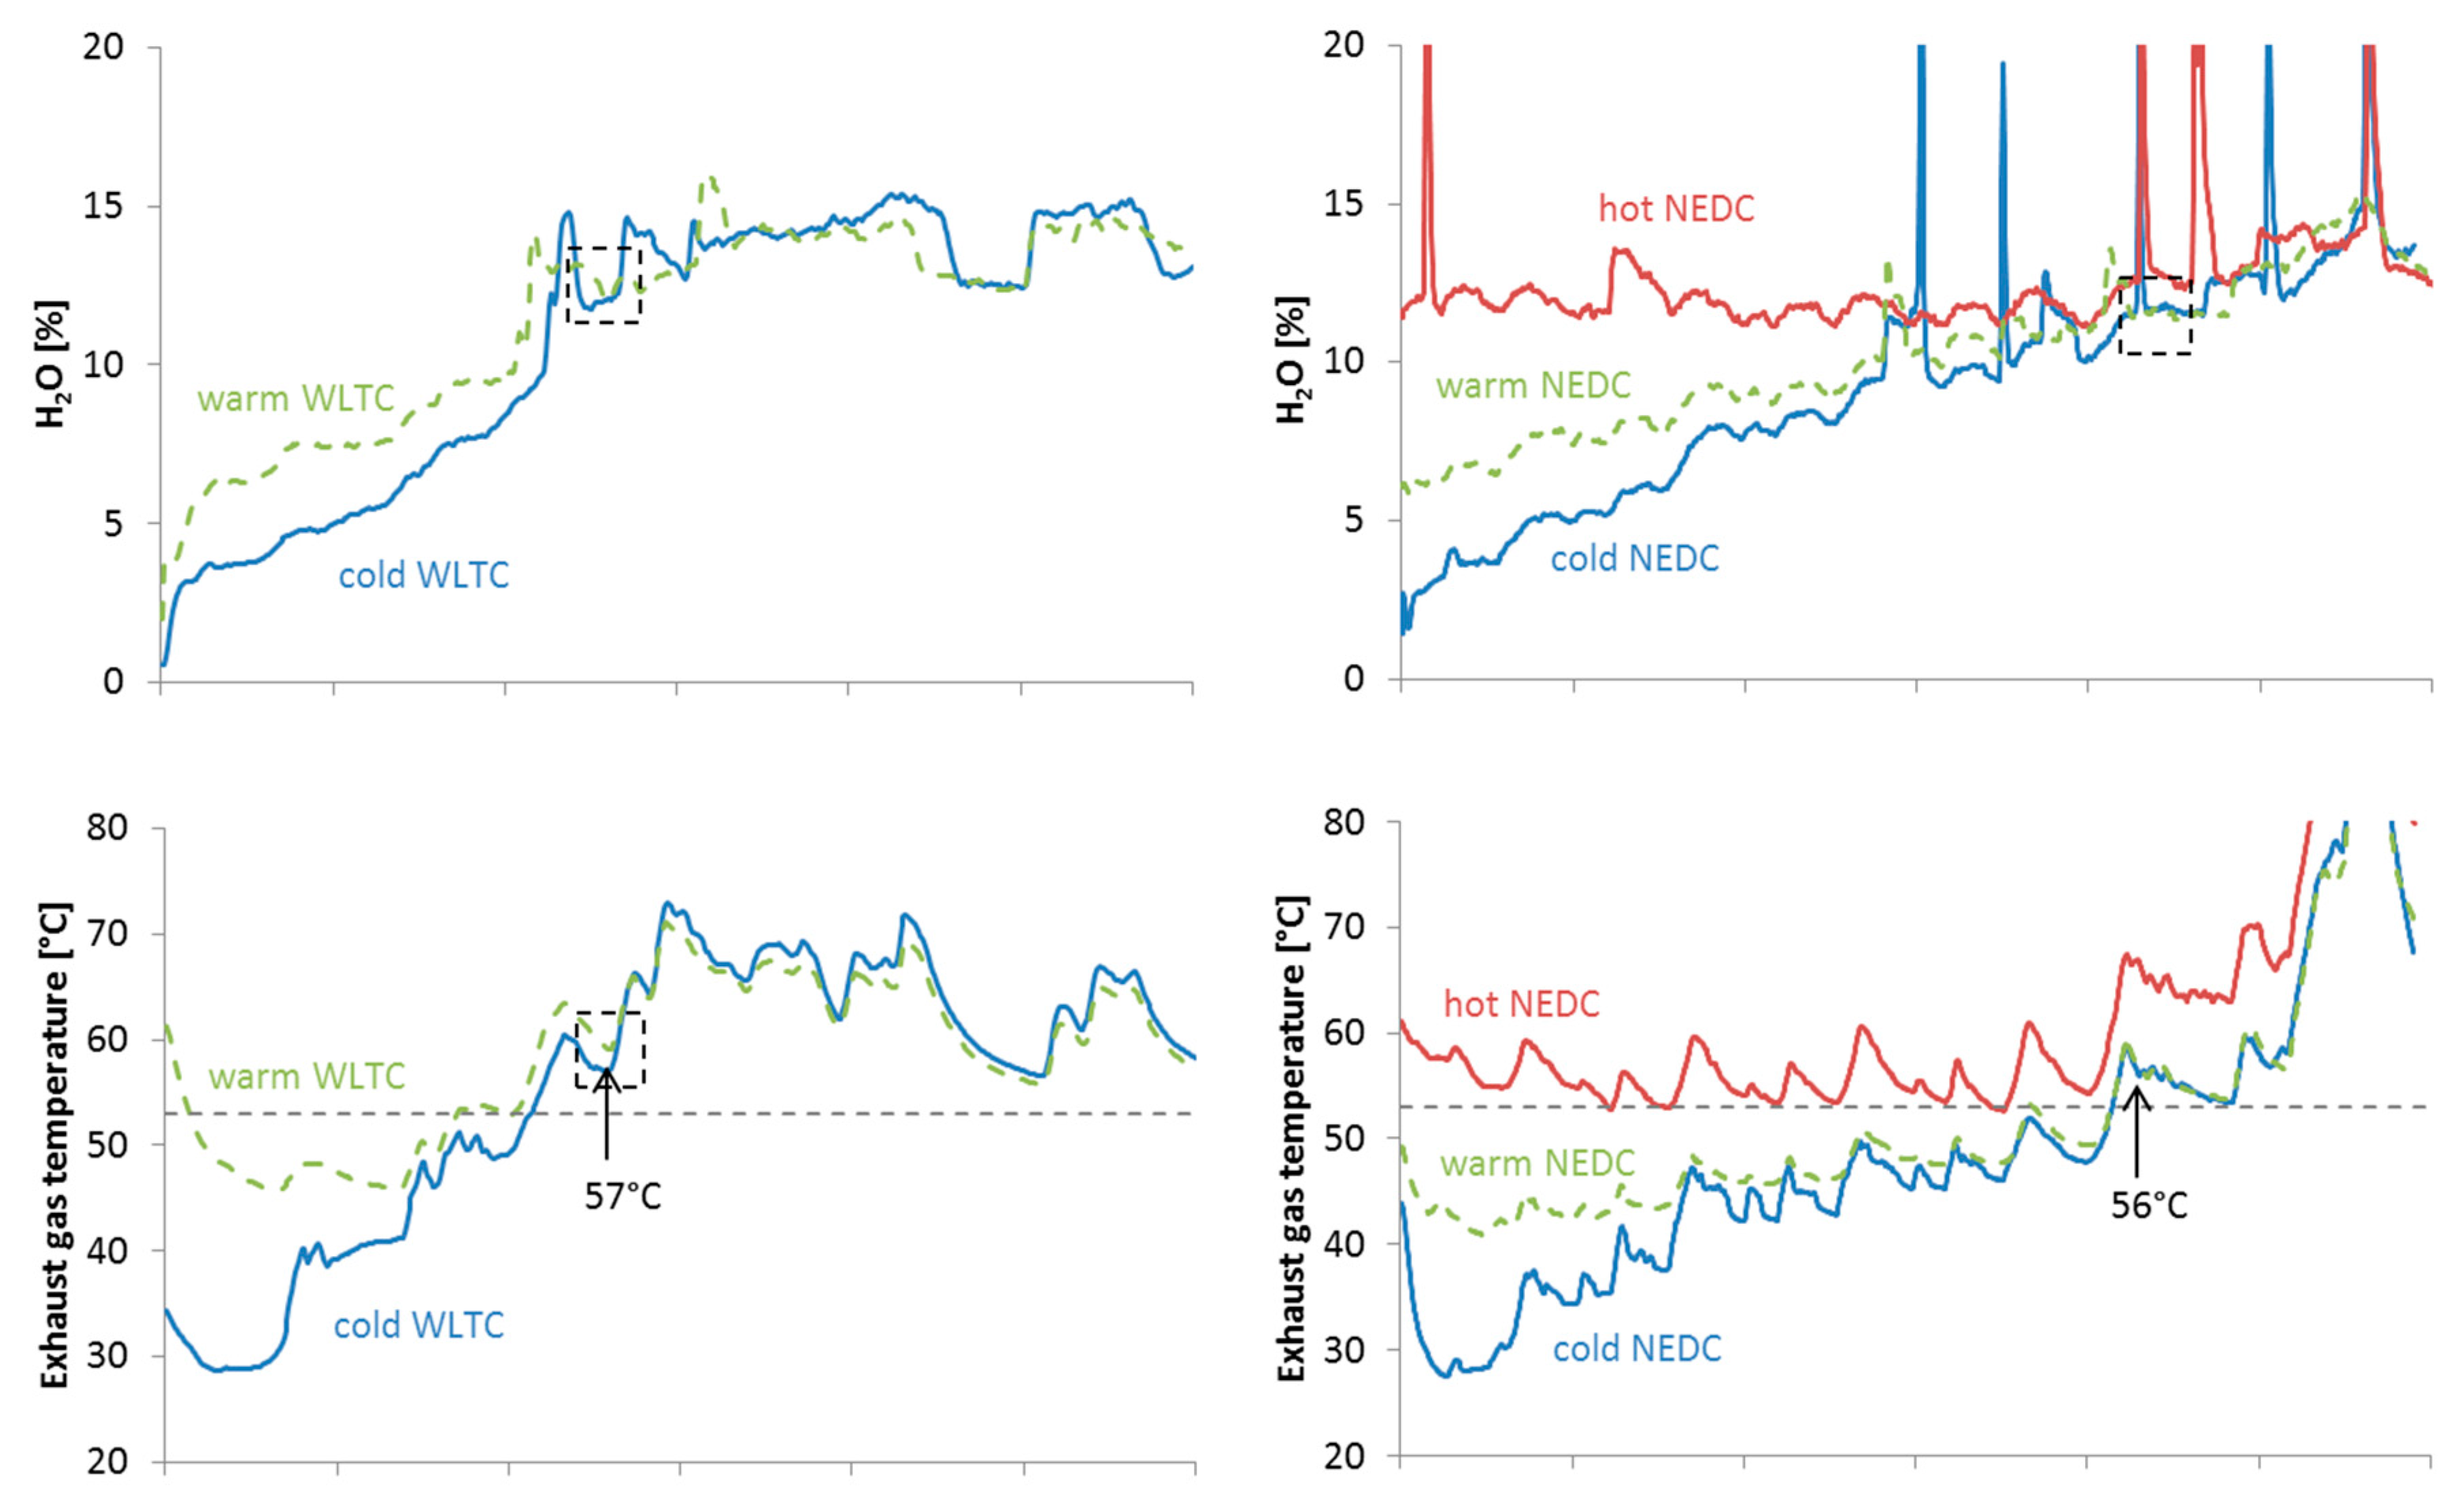
4.4. Exhaust Gas Temperature

To further understand the differences, different test cycles were conducted (WLTC or NEDC) with different engine conditions: cold start, hot start (immediately after the cold start test without switching off the engine), warm start (30 min after a cycle). Figure 5 summarizes the results. The H2O measurements based on FTIR are different at the beginning of the cycle. They reach similar levels after 250 s for the WLTC and after 850 s for the NEDC. These times correspond to a temperature of the exhaust gas at the sampling location of around 56 °C, which is just above the dew point of the gasoline exhaust gas (53 °C).

5. Discussion

The main observation of this study is that during cold start of spark ignition engines, the CO2 concentrations measured on a wet basis or estimated from a dry basis may have large differences. This is the first study to quantify this effect. The differences of the first seconds, which originate from the dry-wet correction, were up to 10% (Figure 3, Table 4). However, for the rest of the test cycle the differences were within experimental uncertainties (±2%). Such comparisons are rare in the literature, even though the engine cold start topic is widely investigated (see Introduction). One study that compared a heated NDIR with the corrected dry laboratory measurement found 7% for a gasoline vehicle, but it was attributed to the heated NDIR water corrections [37]. Another study that compared the FTIR with the laboratory analyzers showed that the differences of the gasoline vehicles were higher than of the diesel vehicles for CO2 [26].
The differences were not company, laboratory, or instrument dependent (Figure 4), but they were principle of measurement dependent, i.e., they were seen only between wet- and dry-based measurements. The various equations for the dry-wet correction factor (e.g., RDE or ISO) had a small difference (Figure 2) that could not explain the cold start differences in concentrations. Only using measured H2O the agreement between wet and corrected measurements was good. The conversion factors based on H2O or CO2 and CO had differences 4%–12% for the start of a test cycle, but <3% for the rest of the cycle (Table 3).
We believe that the differences during the first seconds of a test are due to condensation of water on the cold surfaces of the vehicle exhaust pipes (assuming that the instruments sampling lines are heated). When the surfaces reach the dew point temperature of the exhaust gas, the differences become negligible (as speculated in Figure 5). The water condensation at the tailpipe has been observed by some researchers [17,20]. The low H2O concentration at the beginning of a cold start test is something that has been seen [19], but no special attention has been given as until recently measurements from the tailpipe were not required by the legislation.
In order to further investigate this hypothesis, steady cycles at constant speed points were conducted with G-PFI #2 vehicle starting with cold engine at 23 °C (Figure 6). During the first 150 s the FTIR CO2 concentration was higher than the laboratory corrected CO2, indicating water vapor condensation. When the exhaust gas temperature reached 53 °C the two concentrations were similar. For the time period of 150–210 s the exhaust gas temperature remained relatively constant indicating that both condensation and evaporation were taking place. The two CO2 concentrations continued to be at the same level until the end of the 50 km/h point (exhaust gas temperature <66 °C). When the vehicle accelerated to 100 km/h, the exhaust gas temperature exceeded 100 °C and the FTIR CO2 concentration was lower than the laboratory corrected CO2, indicating evaporation of condensed water and that the Kd-w,RDE correction cannot capture it. At the end of the 100 km/h point the two concentrations were at the same level. When the vehicle accelerated to 130 km/h the exhaust gas temperature further increased but the two CO2 concentrations remained at the same level. This means that the condensed water during the cold start evaporated during the 100 km/h point and no further evaporation took place at 130 km/h. Going back to 50 km/h did not change the differences of the CO2 concentrations which remained at the same levels.
Based on the previous discussion, the existing equations which are based on fuel combustion without considering condensation or evaporation cannot capture correctly the first minutes. When the surfaces that the exhaust gas comes into contact exceed the dew point the differences become negligible. The time necessary to reach the dew point depends on various parameters such as ambient temperature, driving cycle, length of tubes (or sampling location), exhaust gas flow rate, fuel composition, etc. It should be emphasized that the differences have to do with condensation taking place at the tailpipe and aftertreatment devices and not with the engine temperature. A warm engine start with tailpipe surface temperatures below the dew point also showed similar (but smaller) effects (Figure 5). On the other hand, a hot engine start with tailpipe surface temperatures above the dew point showed no condensation (Figure 5).
In order to quantify the effect of the condensation in the emissions, the CO2 mass emissions (g) were calculated as described in Section 3.4 for the start of the cycle (“Start CO2” column in Table 5) and the complete cycle (“Total CO2” column in Table 5) using the Kd-w,H2O. Then the CO2 emissions for the start of the cycle were recalculated using the Kd-w,RDE and the difference to the Start CO2 emissions with Kd-w,H2O is given as “ΔCO2” in Table 5. The difference is negative because the RDE correction is underestimating the CO2 emissions at the beginning of the cycle. The results are summarized in Table 5, where also the Emission Factors (EF) of the specific tests are given using the Kd-w,H2O (EFCO2). The effect of condensation (ΔCO2/Start CO2 or ΔCO2/Total CO2) is significant for the beginning of the cycle (5%–13%) but almost negligible (diesel vehicles 0.1%) to very small (rest vehicles <1%) for the complete cycle. It should be mentioned that this water will completely evaporate when the temperature exceeds 100 °C and will result in the opposite effect (excess of water and underestimation of the emissions). The net effect during the entire cycle will be close to zero.
The same analysis was conducted for CO (Table 6). The effect of the correction expression was similar to the CO2 for the cold start: the values varied from 5% (diesel vehicles, half minute) and 7% (two-wheelers) to 8%–12% (PFIs) and 13% (CNG). The underestimation during the cold start though had a significant contribution to the total CO emissions, starting from 1%–3% for the low CO emitting vehicles and reaching 7%–10% with the CNG fueled vehicles. One of the CNG vehicles had 500 mg/km of CO emissions (half of the Euro 6 limit). The reason that the condensation at cold start remained significant for the full cycle is that CO emissions took place at cold start in most cases [22,38]. Thus, when the condensed water evaporates, the influence on the CO mass will be small due to the low CO concentrations at the hot part of the cycle. Only for a few cases some recent studies showed high CO emissions at the highway part of a trip [38,39].
One more area of interest is the cold start at low ambient temperatures and the laboratory type approval test at low ambient temperatures, the so called Type VI test [40]. It has been discussed to include a WLTC at −7 °C in the Regulation in future. A few tests at this temperature with Diesel #2 and G-PFI #2 showed that the additional CO2 underestimation is 5–10 g. The exact quantification is difficult because also the combustion and the exhaust gas recirculation strategy change and the tests at the two temperatures are not completely comparable.
The results of this study (Table 4 for concentrations or Table 5 for mass emissions) can be used to correct the emissions during the engine cold start period even when no direct “wet” measurement was taken.
Finally, our results can be used to correct “dry” concentrations after the engine cold start period with the following multiplicative correction factors: diesel 0.94, gasoline (including two-wheelers) 0.86, CNG 0.80 (Table 3). Instruments that need such corrections include for instance simplified on-board emissions monitoring systems (SEMS) [41] or garage analyzers that are used for on-road testing [42].

6. Implications and Outlook

The implications of water condensation at cold engine start touch many areas of research in the engine and automotive fields:
  • Cold start CO2 and CO emissions, either as absolute value or as contribution to total emissions can be underestimated.
  • Comparisons of instrument measuring on dry- or wet-based methodology at the same location: this is the case, for example, of comparison of PEMS or FTIR systems with laboratory grade analyzers for gases that are measured with analyzers that have interference effects from water (CO2 and CO).
  • Comparison of instruments at different sampling locations: differences can be observed due to condensation between the two locations. This is the case of tailpipe versus dilution tunnel with constant volume sampling (CVS) sampling.
  • Comparison (validation) of PEMS with bags measurement if done in phases (at the moment the comparison is done for the complete cycle).
  • Comparisons of different test cycles with the same instrument. The condensation takes place until the tailpipe and aftertreatment devices reach the dew point. However, this depends on the test parameters. As an example, the WLTC needed 250 s, while the NEDC 850 s to reach the dew point at the exit of the tailpipe.
  • Comparisons of tests with different ambient relative humidity, because the amount of stored water in the aftertreatment devices could be different. For example, porous, honeycomb ceramic substrates such as those commonly used in diesel and gasoline particulate filters can store water at relatively high levels (up to 100 g/L under worst case conditions at 85 °C and 85% relative humidity) [43].
  • Estimation of exhaust flow rate based on CO2 (or CO) measurements (e.g., the tracer method) or fuel consumption and air-to-fuel ratio.
It should be added that the condensation effect will be higher with the increasing adoption of engine stop-start technologies, vehicle hybridization, and improvements in engine efficiencies, which all contribute to lower exhaust temperatures.

7. Conclusions

In this study we compared CO and CO2 emissions from instruments measuring on a dry- and wet-basis using different measuring principles at the exhaust of gasoline, compressed natural gas (CNG), and diesel light-duty and L-category vehicles. The dry concentrations were converted to wet by applying formulas given in the regulation or based on H2O measurements.
At the beginning of a cold start test, when the exhaust gas temperature was below the dew point (i.e., 53 °C for gasoline vehicles) condensation at the unheated exhaust pipes took place. The condensation lasted 2–3 min for spark-ignition vehicles, but only half a minute for compression ignition vehicles. The duration depended on the ambient temperature and the test cycle. For the New European Driving Cycle it lasted almost 15 min for a gasoline vehicle. The condensation resulted in 5%–13% underestimation of the CO2 concentrations and emissions using a dry-wet correction factor. The effect was almost indistinguishable (<1%) from experimental uncertainties when considering the whole test cycles (20–30 min). It remained important for CO (10%) for the vehicles since the majority of CO emissions took place during the cold start period.

Author Contributions

Conceptualization, B.G.; formal analysis, B.G., M.C. and A.A.Z.; data curation, B.G.; writing—original draft preparation, B.G.; writing—review and editing, M.C. and A.A.Z.

Acknowledgments

The authors would like to acknowledge the VELA technical staff (in alphabetical order): A. Bonamin, C. Bonato, M. Cadario, P. Le Lijour, D. Lesueur, M. Sculati.

Conflicts of Interest

The opinions expressed in this manuscript are those of the authors and should in no way be considered to represent an official opinion of the European Commission. Mention of trade names or commercial products does not constitute endorsement or recommendation by the authors or the European Commission.

Abbreviations

CNGCompressed Natural Gas
CVSConstant Volume Sampling
DIDirect Injection
DOCDiesel Oxidation Catalyst
DPFDiesel Particulate Filter
EFEmission Factor
EGRExhaust Gas Recirculation
EUEuropean Union
FTIRFourier-Transform Infrared Spectroscopy
GGasoline
G-DIGasoline Direct Injection
G-PFIGasoline Port Fuel Injection
IRInfraRed
ISOInternational Organization for Standardization
MYModel Year
NDIRNon-Dispersive Infrared Detection
NEDCNew European Driving Cycle
PEMSPortable Emissions Measurement System
PFIPort Fuel Injection
RDEReal Driving Emissions
SCRSelective Catalytic Reduction for NOx
SEMSSimplified onboard Emissions Monitoring Systems
TWCThree-way Catalytic Converter
VELAVehicle Emissions LAboratory
WLTCWorldwide harmonized Light-duty vehicles Test Cycle
WMTCWorldwide harmonized Motorcycle Test Cycle

References

  1. European Environmental Energy. Air Quality in Europe—2018 Report; EEA Report No. 12/2018; Publication Office of the European Union: Luxembourg, 2018. [Google Scholar] [CrossRef]
  2. European Commission. Regulation (EU) No 333/2014 of the European Parliament and of the Council of 11 March 2014 amending Regulation (EC) No 443/2009 to define the modalities for reaching the 2020 target to reduce CO2 emissions from new passenger cars. Off. J. Eur. Union 2014, L103, 15–21. [Google Scholar]
  3. UNECE. Uniform Provisions Concerning the Measures to Be Taken against the Emission of Gaseous and Particulate Pollutants from Compression Ignition Engines and Positive Ignition Engines for Use in Vehicles; Regulation No. 49. Revision 6; United Nations Economic Commission for Europe: Geneva, Switzerland, 2013. [Google Scholar]
  4. Clairotte, M.; Adam, T.W.; Zardini, A.A.; Manfredi, U.; Martini, G.; Krasenbrink, A.; Vicet, A.; Tournié, E.; Astorga, C. Effects of low temperature on the cold start gaseous emissions from light duty vehicles fuelled by ethanol-blended gasoline. Appl. Energy 2013, 102, 44–54. [Google Scholar] [CrossRef]
  5. Code of Federal Regulations. Title 40: Protection of Environment. Part 1065—Engine-Testing Procedures. Subpart J—Field Testing and Portable Emission Measurement Systems. Available online: https://www.ecfr.gov/cgi-bin/text-idx?SID=6aca586aebc6de74a06dea2a85f5a5ab&mc=true&node=sp40.37.1065.j&rgn=div6 (accessed on 8 May 2019).
  6. European Commission. Commission Regulation (EU) No 582/2011 of 25 May 2011 implementing and amending Regulation (EC) No 595/2009 of the European Parliament and of the Council with respect to emissions from heavy-duty vehicles (Euro VI) and amending Annexes I and III to Directive 2007/46/EC of the European Parliament and of the Council. Off. J. Eur. Union 2011, L167, 1–168. [Google Scholar]
  7. European Commission. Commission Regulation (EU) 2016/427 of 10 March 2016 amending Regulation (EC) No 692/2008 as regards emissions from light passenger and commercial vehicles (Euro 6). Off. J. Eur. Union 2016, L82, 1–98. [Google Scholar]
  8. Adachi, M. Emission measurement techniques for advanced powertrains. Meas. Sci. Technol. 2000, 11, R113–R129. [Google Scholar] [CrossRef]
  9. Daham, B.; Andrews, G.; Li, H.; Ballesteros, R.; Bell, M.; Tate, J.; Ropkins, K. Application of a portable FTIR measuring on-road emissions. SAE Tech. Pap. 2005, 20, 171–192. [Google Scholar] [CrossRef]
  10. Zardini, A.A.; Suarez-Bertoa, R. Unregulated pollutants from tampered two-wheelers. Transp. Res. Procedia 2016, 14, 3109–3118. [Google Scholar] [CrossRef]
  11. Clairotte, M.; Adam, T.W.; Chirico, R.; Giechaskiel, B.; Manfredi, U.; Elsasser, M.; Sklorz, M.; De Carlo, P.F.; Heringa, M.F.; Zimmermann, R.; et al. Online characterization of regulated and unregulated gaseous and particulate exhaust emissions from two-stroke mopeds: A chemometric approach. Anal. Chim. Acta 2012, 717, 28–38. [Google Scholar] [CrossRef]
  12. ISO 8178-1:2017. Reciprocating Internal Combustion Engines—Exhaust Emission Measurement— Part 1: Test-Bed Measurement Systems of Gaseous and Particulate Emissions; ISO: Geneva, Switzerland, 2017. [Google Scholar]
  13. Silvis, W. An algorithm for calculating the air/fuel ratio from exhaust emissions. SAE Tech. Pap. 1997, 970514. [Google Scholar] [CrossRef]
  14. D’Ambrosio, S.; Spessa, E.; Vassallo, A. Methods for specific emission evaluation in spark ignition engines based on calculation procedures of air-fuel ratio: Development, assessment, and critical comparison. J. Eng. Gas Turbines Power 2005, 127, 869–882. [Google Scholar] [CrossRef]
  15. Garrido Gonzalez, N.; Baar, R.; Drueckhammer, J.; Kaeppner, C. The thermodynamics of exhaust gas condensation. SAE Tech. Pap. 2017, 10, 1411–1421. [Google Scholar] [CrossRef]
  16. Yang, B.; Mao, S.; Altin, O.; Feng, Z.; Michaelides, E. Condensation analysis of exhaust gas recirculation system for heavy-duty trucks. J. Therm. Sci. Eng. Appl. 2011, 3, 041007. [Google Scholar] [CrossRef]
  17. Sharma, M.; Laing, P.; Son, S. Modeling water condensation in exhaust A/T devices. SAE Tech. Pap. 2010, 2010-01-0885. [Google Scholar] [CrossRef]
  18. Barros, S.; Atkinson, W.; Piduru, N. Extraction of liquid water from the exhaust of a diesel engine. SAE Tech. Pap. 2015, 2015-01-2806. [Google Scholar] [CrossRef]
  19. Inoue, K.; Ishihara, M.; Akashi, K.; Adachi, M.; Ishida, K. Numerical analysis of mass emission measurement systems at low emission vehicles. SAE Tech. Pap. 1999, 1999-01-0150. [Google Scholar] [CrossRef]
  20. Meena, R.; Krusch, A.; Meister, K.; Holzknecht, C. Water load determination approach in two wheeler exhaust system. SAE Tech. Pap. 2018, 2018-32-0075. [Google Scholar] [CrossRef]
  21. Mohn, J.; Forss, A.-M.; Brühlmann, S.; Zeyer, K.; Lüscher, R.; Emmenegger, L.; Novak, P.; Heeb, N. Time-resolved ammonia measurement in vehicle exhaust. Int. J. Environ. Pollut. 2004, 22, 342–356. [Google Scholar] [CrossRef]
  22. Weilenmann, M.; Soltic, P.; Saxer, C.; Forss, A.; Heeb, N. Regulated and nonregulated diesel and gasoline cold start emissions at different temperatures. Atmos. Environ. 2005, 39, 2433–2441. [Google Scholar] [CrossRef]
  23. Weilenmann, M.; Favez, J.-Y.; Alvarez, R. Cold-start emissions of modern passenger cars at different low ambient temperatures and their evolution over vehicle legislation categories. Atmos. Environ. 2009, 43, 2419–2429. [Google Scholar] [CrossRef]
  24. Favez, J.-Y.; Weilenmann, M.; Stilli, J. Cold start extra emissions as a function of engine stop time: Evolution over the last 10 years. Atmos. Environ. 2009, 43, 996–1007. [Google Scholar] [CrossRef]
  25. Zardini, A.A.; Platt, S.M.; Clairotte, M.; El Haddad, I.; Temime-Roussel, B.; Marchand, N.; Ježek, I.; Drinovec, L.; Močnik, G.; Slowik, J.G.; et al. Effects of alkylate fuel on exhaust emissions and secondary aerosol formation of a 2-stroke and a 4-stroke scooter. Atmos. Environ. 2014, 94, 307–315. [Google Scholar] [CrossRef]
  26. Ko, J.; Son, J.; Myung, C.; Park, S. Comparative study on low ambient temperature regulated/unregulated emissions characteristics of idling light-duty diesel vehicles at cold start and hot restart. Fuel 2018, 233, 620–631. [Google Scholar] [CrossRef]
  27. Li, H.; Andrews, G.; Savvidis, D.; Daham, B.; Ropkins, K.; Bell, M.; Tate, J. Characterization of regulated and unregulated cold start emissions for different real world urban driving cycles using a SI passenger car. SAE Tech. Pap. 2008, 2008-01-1648. [Google Scholar] [CrossRef]
  28. Khalfan, A.; Li, H.; Andrews, G. Cold Start SI Passenger Car Emissions from Real World Urban Congested Traffic. SAE Tech. Pap. 2015, 2015-01-1064. [Google Scholar] [CrossRef]
  29. Giechaskiel, B. Solid particle number emission factors of Euro VI heavy-duty vehicles on the road and in the laboratory. Int. J. Environ. Res. Public Health 2018, 15, 304. [Google Scholar] [CrossRef] [PubMed]
  30. Giechaskiel, B.; Gioria, R.; Carriero, M.; Lähde, T.; Forloni, F.; Perujo, A.; Martini, G.; Bissi, L.M.; Terenghi, R. Emission factors of a Euro VI heavy-duty diesel refuse collection vehicle. Sustainability 2019, 11, 1067. [Google Scholar] [CrossRef]
  31. Giechaskiel, B.; Suarez-Bertoa, R.; Lahde, T.; Clairotte, M.; Carriero, M.; Bonnel, P.; Maggiore, M. Emissions of a Euro 6b diesel passenger car retrofitted with a solid ammonia reduction system. Atmosphere 2019, 10, 180. [Google Scholar] [CrossRef]
  32. Varella, R.; Giechaskiel, B.; Sousa, L.; Duarte, G. Comparison of portable emissions measurement systems (PEMS) with laboratory grade equipment. Appl. Sci. 2018, 8, 1633. [Google Scholar] [CrossRef]
  33. Giechaskiel, B.; Casadei, S.; Mazzini, M.; Sammarco, M.; Montabone, G.; Tonelli, R.; Deana, M.; Costi, G.; Di Tanno, F.; Prati, M.V.; et al. Inter-laboratory correlation exercise with portable emissions measurement systems (PEMS) on chassis dynamometers. Appl. Sci. 2018, 8, 2275. [Google Scholar] [CrossRef]
  34. European Commission. Regulation (EC) No 715/2007 of the European Parliament and of the Council of 20 June 2007 on type approval of motor vehicles with respect to emissions from light passenger and commercial vehicles (Euro 5 and Euro 6) and on access to vehicle repair and maintenance information. Off. J. Eur. Union 2007, L171, 1–16. [Google Scholar]
  35. European Commission. Regulation (EU) No 168/2013 of the European parliament and of the council of 15 January 2013 on the approval and market surveillance of two- or three-wheel vehicles and quadricycles. Off. J. Eur. Union 2013, L60, 52–128. [Google Scholar]
  36. Ohtsuki, S.; Inoue, K.; Yamagishi, Y.; Namiyama, K. Studies on emission measurement techniques for super-ultra low emission vehicles. SAE Tech. Pap. 2002, 2002-01-2709. [Google Scholar] [CrossRef]
  37. Ropkins, K.; Tate, J.; Li, H.; Andrews, G.; Hawley, G.; Bell, M. Chassis dynamometer evaluation of on-board exhaust emission measurement system performance in SI car under transient operating conditions. SAE Tech. Pap. 2008, 2008-01-1826. [Google Scholar] [CrossRef]
  38. Clairotte, M.; Valverde, V.; Bonnel, P.; Giechaskiel, B.; Carriero, M.; Otura, M.; Fontaras, G.; Pavlovic, J.; Martini, G.; Krasenbrink, A.; et al. Joint Research Centre 2017 Light-Duty Vehicles Emissions Testing; EUR 29302EN; Publications Office of the European Union: Luxembourg, 2018. [Google Scholar]
  39. Valverde, V.; Adria, B.; Clairotte, M.; Pavlovic, J.; Suarez-Bertoa, R.; Giechaskiel, B.; Astoga-Llorens, C.; Fontaras, G. Emission factors derived from thirteen Euro 6b light-duty vehicles based on laboratory and on-road measurements. Atmosphere 2019, 10, 243. [Google Scholar] [CrossRef]
  40. Suarez-Bertoa, R.; Astorga, C. Impact of cold temperature on Euro 6 passenger car emissions. Environ. Pollut. 2018, 234, 318–329. [Google Scholar] [CrossRef]
  41. Heepen, F.; Yu, W. SEMS for individual trip reports and long-time measurement. SAE Tech. Pap. 2019, 2019-01-0752. [Google Scholar] [CrossRef]
  42. Varella, R.; Duarte, G.; Baptista, P.; Sousa, L.; Mendoza Villafuerte, P. Analysis of the influence of outdoor temperature in vehicle cold-start operation following EU real driving emission test procedure. SAE Int. J. Commer. Veh. 2017, 10, 596–697. [Google Scholar] [CrossRef]
  43. Sappok, A.; Ragaller, P.; Guarino, A.; Mandelbaum, J.; Lapenta, L.; Kolberg, D.; Newman, R.; Lu, X.; Cors, D. Direct measurement of aftertreatment system stored water levels for improved dew point management using radio frequency sensing. SAE Tech. Pap. 2019, 2019-01-0739. [Google Scholar] [CrossRef]
Figure 1. Experimental setup. The tests were conducted with various vehicles (Table 1) at two laboratories with different equipment (Table 2).
Applsci 09 02263 g001
Figure 2. Dry-wet correction factor from dry-based carbon dioxide (CO2) and carbon monoxide (CO) laboratory measurements (non-dispersive infrared detection (NDIR)) or H2O measurements from Fourier-transform infrared spectroscopy (FTIR) during cold start cycles for some vehicles. The grey lines are the speed profiles of the WLTC (light-duty vehicles) and WMTC (L-category) (right-hand scale).
Applsci 09 02263 g002aApplsci 09 02263 g002b
Figure 3. Comparison of different analyzers during cold start for some vehicles using the Kd-w,RDE (wet corr.) or the Kd-w,H2O (wet corr. H2O) equations for the same cycles as in Figure 2.
Applsci 09 02263 g003
Figure 4. Comparison of different analyzers during a cold start WLTC of the Gasoline Port Fuel Injection (G-PFI) #1 vehicle. Left panel: Laboratory 1, portable emissions measurement system (PEMS) A, and PEMS B. Right panel: Laboratory 2, PEMS B, and FTIR.
Applsci 09 02263 g004
Figure 5. Vehicle Gasoline Direct Injection (G-DI). Left panels: First 600 s of WLTC. Right panels: NEDC (New European Driving Cycle). Upper: H2O concentrations. Middle: Exhaust gas temperatures. Low: Speed profiles. Dashed boxes indicate the time period where the H2O concentrations reached similar levels. The dashed line is the dew point of gasoline exhaust gas (53 °C).
Applsci 09 02263 g005aApplsci 09 02263 g005b
Figure 6. Steady speeds test with G-PFI #2. The arrow shows the time when the temperature reached 53 °C. On the right y-axis, “Texh” stands for the temperature of the exhaust gas.
Applsci 09 02263 g006
Table 1. Characteristics of the vehicles.
CodeEuro
(-)
MY
(-)
Fuel
(-)
Mass
(kg)
Power
(kW)
Displ.
(l)
Aftertreatment
(-)
Diesel #16b2017B71360901.6DOC + DPF
Diesel #26d-temp2018B71180961.5DOC + DPF + SCR
CNG #16c2018CNG1360801.0TWC
CNG #26b2018CNG23101003.0TWC
G-PFI #16b2014E101130571.4TWC
G-PFI #26d-temp2018E101200601.2TWC
G-DI #16c2017E1013901101.5TWC
Motorcycle42018E10150160.28TWC
Moped42018E10952.50.05TWC
MY: Model Year; CNG: Compressed Natural Gas; G: Gasoline; DI: direct injection; PFI: Port Fuel Injection; DOC: Diesel Oxidation Catalyst; DPF: Diesel Particulate Filter; SCR: Selective Catalytic Reduction for NOx; TWC: Three-way Catalytic Converter.
Table 2. Characteristics of the equipment.
ParameterPEMS APEMS BLab 1Lab 2FTIR
ManufacturerHoribaAVLAVLHoribaAVL
ModelOBS-ONEM.O.V.E.AMA i60MEXA 7100Sesam
Principle CO2Heated NDIRNDIRNDIRNDIRFTIR
Measurementwetdrydrydrywet
Max CO220%20%20%20%20%
Calibration gas15%15%15%15%-
Sampling line90 °C90 °C190 °C190 °C190 °C
NDIR: Non-dispersive infrared detection; FTIR: Fourier-Transform Infrared Spectroscopy.
Table 3. Dry-wet conversion factors Kd-w for the starting condensation period (“Start”) and the rest cycle (“Rest”) calculated before and after the “Start time” respectively. “Dev” stands for the relative deviation between the Kd-w, H2O and the Kd-w,RDE. Vehicles and acronyms as in Table 1.
VehicleStart
Time (s)
Start
Kd-w,H2O
Start
Kd-w,RDE
Dev
(%)
Rest
Kd-w,H2O
Rest
Kd-w,RDE
Dev
(%)
Diesel #1350.990.94−5.0%0.940.95+0.9%
Diesel #2450.990.96−3.7%0.940.95+1.0%
CNG #12000.930.82−12.0%0.800.82+3.1%
CNG #21350.880.82−7.1%0.800.82+1.9%
G-PFI #12300.940.87−7.6%0.860.88+2.0%
G-PFI #21600.950.88−7.4%0.870.89+2.3%
G-DI6000.920.88−4.6%0.850.87+2.6%
Motorcycle1000.920.87−5.2%0.860.87+1.5%
Moped 1400.940.88−6.0%0.860.88+2.7%
Table 4. Mean CO2 concentration measurements (%) measured with the FTIR for the starting condensation period of the cycle and the rest of the cycle. The laboratory to the FTIR differences are given using the two conversion factors (real driving emissions (RDE) or H2O). Vehicles and acronyms as in Table 1.
VehicleStart
Time (s)
FTIR Start
CO2 (%)
Lab with
Kd-w,RDE
Lab with
Kd-w,H2O
FTIR Rest
CO2 (%)
Lab with
Kd-w,RDE
Lab with
Kd-w,H2O
Diesel #1355.53−8.4%−2.0%4.85−1.4%−1.8%
Diesel #2453.79−5.4%+0.4%5.00−0.3%−0.5%
CNG #120010.01−9.7%−0.5%9.02−1.2%−0.1%
CNG #21359.38−6.3%−1.5%9.01+0.3%+3.0%
G-PFI #123013.04−5.3%−0.2%12.05−0.2%−1.4%
G-PFI #216013.31−7.3%+0.6%11.79+0.7%−1.5%
G-DI60013.22−9.3%−1.0%12.77−1.2%−2.2%
Motorcycle10013.11−6.6%−0.7%12.97−1.7%−1.0%
Moped 14012.57−4.6%+1.9%11.84+1.8%+1.4%
Table 5. Effect of condensation on CO2 mass emissions for the beginning (start) of the cycle and the full (total) cycle (WLTC or WMTC for two-wheelers). “ΔCO2” stands for the difference between the CO2 mass emissions calculated using the Kd-w,RDE and the Kd-w,H2O for the start duration of the cycle given in column “Time.”
VehicleStart TimeΔCO2Start CO2EffectTotal CO2EffectEFCO2
(s)(g)(g) (g) (g/km)
Diesel #135−2.749−5.6%3374−0.1%144.8
Diesel #245−2.846−6.0%2760−0.1%118.5
CNG #1200−24.8195−12.7%2842−0.9%122.0
CNG #2135−40.9455−9.0%6819−0.6%292.7
G-PFI #1230−23.5322−7.3%3669−0.6%157.5
G-PFI #2160−11.5123−10.5%3250−0.4%139.5
G-DI600−26.8318−8.4%3096−0.9%132.9
Motorcycle100−3.270−4.5%1058−0.3%80.8
Moped 140−3.153−5.9%451−0.7%59.3
EF: Emission Factor; CNG: Compressed Natural Gas; G: Gasoline; DI: Direct Injection; PFI: Port Fuel Injection.
Table 6. Effect of condensation on CO mass emissions for the beginning of the cycle and the full cycle (WLTC or WMTC for two-wheelers). “ΔCO” stands for the difference between the CO mass emissions calculated using the Kd-w,RDE and the Kd-w,H2O for the start duration of the cycle given in column “Time.”
VehicleStart TimeΔCOStart COEffectTotal COEffectEFCO
(s)(mg)(mg) (mg) (mg/km)
Diesel #13529511−5.7%884−3.3%38
Diesel #24512261−4.7%1253−1.0%54
CNG #12007986195−12.9%11,700−6.8%502
CNG #21351951467−13.3%1971−9.9%85
G-PFI #12305104354−11.7%16,204−3.1%695
G-PFI #21601451844−7.9%2914−5.0%125
G-DI6001021076−9.5%2172−4.7%93
Motorcycle1001131696−6.7%8336−1.4%636
Moped 140851319−6.4%6805−1.2%895
EF: Emission Factor; CNG: Compressed Natural Gas; G: Gasoline; DI: direct injection; PFI: Port Fuel Injection.

