Abstract
Tensile stresses and cracks in concrete slabs induced by a hogging moment have always been a disadvantage of steel-concrete composite structures and key issue of concern in the design of such structures. To reduce the tensile stress and control the crack width of the reinforced concrete (RC) slab, a new type of connector, called the uplift-restricted and slip-permitted (URSP) connector has been proposed and successfully applied in the area subjected to a negative bending moment in steel-concrete composite bridges. The feasibility of the URSP connector in steel-concrete composite frame buildings is investigated in this study based on a comprehensive parametric analysis. The effects of URSP connectors on the cracking behavior, as well as the stiffness and strength of composite frames, are systematically analyzed using an elaborate finite element model, which resembles a typical composite beam-column joint subjected to both lateral loads and vertical loads. In addition, an optimized arrangement length of URSP connectors is proposed for practical design. The research findings indicate that the application of URSP connectors greatly improves the crack resistance of RC slabs without an obvious reduction of the ultimate capacity and lateral stiffness of the composite frame. It is recommended that the distribution length of URSP connectors at each beam end should be 20–25% of the frame beam length.
1. Introduction
In recent decades, steel-concrete composite structures, such as concrete-filled steel tubes (CFST) [1,2,3], steel-plate concrete beams [4,5,6], partially encased composite (PEC) columns [7,8,9,10], and steel-concrete composite frames [11,12], have received much attention [13,14,15]. Among them, the steel-concrete composite frame is currently a widespread structural system in multistory and high-rise buildings since it combines the advantages of both steel and concrete frames, thus leading to, in many cases, a reduction of costs and optimization of the structural performance [16,17]. The mechanical behavior of composite frame systems including experimental and theoretical research, has been reported in detail over the last few decades [18,19,20,21], and previous research, has demonstrated that the presence of reinforced concrete (RC) slabs is beneficial to the flexural capacity, stiffness and lateral stability of steel beams, which also improves the seismic performance of the frame [22,23].
However, under vertical and seismic loads, tensile stresses and cracks may occur in the concrete slab at beam ends where a hogging moment exists, which has always been a critical issue hindering the widespread application of steel-concrete composite structures. Concrete cracking significantly influences the stiffness and durability of structures [24,25,26]. To reduce the tensile stress and control the cracks in the concrete slab, the prestressed technique has been widely used in the last few decades. However, most of the prestress applied to the composite beam is undertaken by the steel beam due to the strong composite effects between steel and concrete, which means that the prestressing efficiency is very low in composite structures. Moreover, construction the using prestressed technique is very complex and time-consuming.
The other approach employed to reduce tensile stress and control cracking in concrete is releasing the composite effects by adopting a new type of connector named the uplift-restricted and slip-permitted (URSP) connector instead of the traditional shear connectors [27,28,29,30,31], as illustrated in Figure 1. The traditional shear connectors are mainly the headed stud connector and the Perfobond strip [32,33]. To provide an alternative to replace the stud connector in special situation, an innovative connector named the truss-type shear connector has been proposed and received much attention recently, and has been proven to reduce the production cost and improve the resistance value [34]. However, to reduce the tensile stress and control the cracking in slabs in negative moments, a new type of connector in this paper is designed to partially release the slip constraints along the longitudinal direction while retaining the uplift resistance of the steel-concrete interface. To achieve the structural functions of connectors, foamed plastics are wrapped around the screw and nut. In this way, the slip between steel and concrete is partially allowed. Several theoretical and experimental studies on the performance of URSP connectors have been conducted. The slip and uplift performance has been investigated and a shear force-slip hysteresis model has been proposed based on the push-out tests [27]. In addition, an optimization analysis of URSP connectors in composite bridges and some practical design guidelines, as well as construction methods, have been provided by Li et al. [31]. However, theoretical and experimental studies on the practical application of this new type of connector in a composite frame system for building structures are still insufficient, and the influence of the URSP connector on the strength, stiffness and cracking performance of composite frame structures remains a research blank in this field.
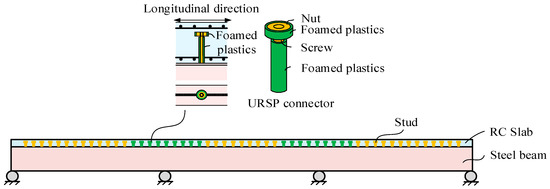
Figure 1.
Uplift-restricted and slip-permitted (URSP) connectors in a continuous composite beam bridge.
Therefore, this paper focuses on the application of the URSP connector in steel-concrete composite frame buildings. Firstly, the mechanism of the frame beam with URSP connectors is described. Then, an elasto-plastic elaborate finite element model of the typical side beam-column joint is established to investigate the effects of URSP connectors on the performance of a composite frame under vertical and lateral loads. A concentrated load is applied at the beam end to simulate frames subjected to lateral loads such as wind and earthquake. The lateral stiffness and strength are intensively studied based on a comprehensive parametric analysis. In addition, uniformly distributed loads are applied on the beam to simulate frames subjected to vertical loads. The stiffness of the beam, as well as the tensile stress and cracking behavior of the concrete slab at the beam end, are investigated. Finally, design suggestions are proposed for URSP connectors in composite frame systems, which are verified to be suitable for both side and middle joints. In this paper, only in-plane loading conditions are considered, and the application of URSP connectors in bi-directional loading cases will be investigated in further study.
2. Mechanism of a Frame Beam with URSP Connectors
The shear force at the steel-concrete interface in composite beams generates slip and induces additional deflections. A stress and strain analysis considering the interface slip behavior of the composite beam is depicted in Figure 2. When a composite beam section is subjected to a negative bending moment, the stress and strain generated on the section can be divided into two parts: truss mode and bending mode [35]. In the truss mode, the shear force at the steel-concrete interface provided by shear studs is considered. Therefore, the concrete and steel are subjected to axial tensile and compressive loads, respectively. While in the bending mode, the bending moments of the concrete slab and steel beam are considered, and the two components behave as two independent beam elements with individual neutral axes. It has been demonstrated that the contribution of the truss action is proportional to the degree of shear connection [36]. For composite beams using URSP connectors in regions of a negative moment, the longitudinal constraint along the span direction at the steel-concrete interface is released. Therefore, the truss mode can be neglected, and only the bending mode is taken into consideration. Since the flexural modulus of the concrete slab is much smaller than that of composite components, the tensile strain and stress of the concrete slab can be sharply decreased in beams under negative bending [37].

Figure 2.
Stress and strain analysis of a composite beam section under hogging moment.
Based on the above analysis, the tensile stress of the concrete slab is expected to be significantly reduced through the application of the URSP connectors in the hogging moment region of frame beams. However, the quantitative improvement of the anti-cracking performance of the frame beam and the influences on the ultimate capacity and overall stiffness remain unclear, which should be investigated to further promote the practical application of URSP connectors in steel-concrete composite building structures.
3. Finite Element (FE) Modeling of Side Joints with URSP Connectors
3.1. Model Definition
For a typical composite frame structure, as shown in Figure 3a, a single-span frame exhibited in Figure 3b,c is the basic unit. In this study, two load cases are considered to investigate the effects of URSP connectors on the performance of the single-span frame: lateral loads and vertical loads. Based on the structural symmetry, the single-span composite frame subjected to lateral loads can be simplified to a side joint consisting of a half-span beam and one column subjected to a concentrated load at the beam end, as illustrated in Figure 3b. Similarly, the single-span frame subjected to vertical loads can be approximately simplified to a side joint consisting of a quarter-span beam and one column subjected to uniformly distributed loads at the whole beam, as detailed in Figure 3c. With the simplified equivalent model, the computational efficiency can be greatly increased, which is beneficial to the parametric analysis in the following sections.
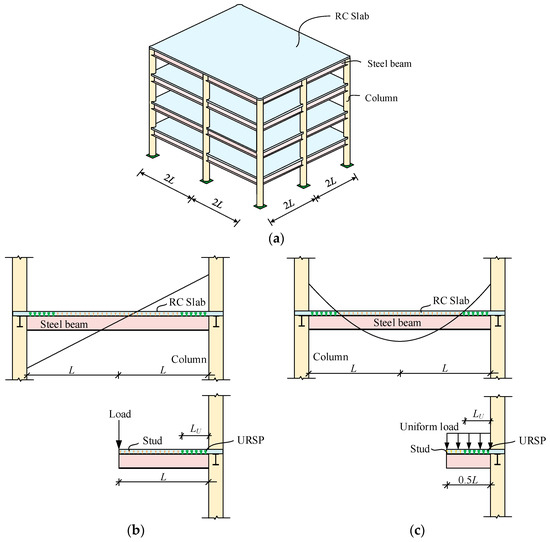
Figure 3.
Two load cases simplified from a typical frame structure. (a) Typical steel-concrete composite frame structure; (b) Load case 1; (c) Load case 2.
3.2. Geometry, Element and Materials of the FE Model
As shown in Figure 4a, the investigated side joint is composed of a rectangular concrete-filled steel tubular (CFST) column, a steel beam and a concrete slab. The length of the steel beam is L for load case 1 and 0.5L for load case 2 (L is 3 m in this example). The height of the column has the value of 3 m. The thickness and width of the concrete slab are 100 mm and 2 m, respectively.
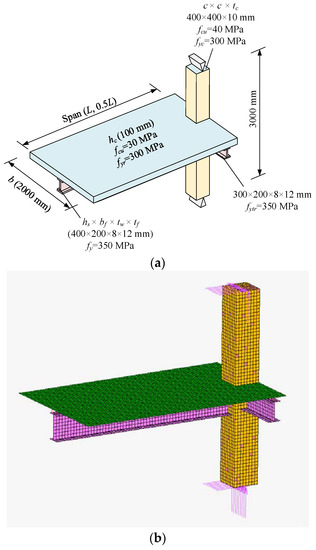
Figure 4.
Finite element model. (a) Geometrical configuration and material properties; (b) finite element model established with MSC-Marc.
The reinforcement ratios of transverse and longitudinal rebars are 1.5% and 1%, respectively. All the dimensions are determined based on the common sizes of high-rise buildings in China. To provide a fully shear connection between the RC slab and steel beam, the shear studs are adopted with the diameter and total height of 16 mm and 70 mm, respectively. The spacings of shear studs along transverse and longitudinal directions are both 100 mm, so the actual degree of shear connection is up to 2.0. The detailed model parameters and boundary condition of the joint model are illustrated in Figure 4a. The top and bottom ends of the column are set as hinges, while the beam end is free.
A shell-solid elaborate finite element model of the side joint is established using the software MSC. Marc (2015). As shown in Figure 4b, the steel beam, the steel tube of the column and the RC slab are modeled by a four-node shell element with six degrees of freedom per node and full integration schemes. The concrete of the CFST column is modeled by eight-node solid elements with three degrees of freedom per node and full integration schemes. The mesh size is selected to be 50 mm, and a mesh sensitivity study was performed, which ensures the precision of all FE models presented in this study. A multilayer material model composed of three rebar layers and four concrete layers is adopted to simulate the RC slab [38]. A Rüsch curve is employed as the uniaxial compressive stress-strain relationship of the slab concrete. In order to consider the cracking of concrete, the fracture energy can be calculated based on the calculation recommendations stated in CEB-FIP MC90 [39]. The steel and the reinforced bar in the RC slab are assumed to be an idealized elasto-plastic material with the Von Mises yield criterion. The concrete material of the column is assumed to be elastic based on the design criterion of the weak beam-strong column. The nodes corresponding to the steel tube and the concrete core are connected by the node-sharing approach.
The above model has already been adopted to investigate the behavior of steel-concrete composite joint and frame structures, and the feasibility and accuracy of the aforementioned finite element modeling strategy have been experimentally validated [40,41].
3.3. Modeling of Shear Connectors
To consider the interfacial slip between the RC slab and steel beam, shear connectors are simulated by springs along the longitudinal direction. Meanwhile, the uplift action is simulated by springs along the vertical direction as per the numerical simulation performed by Stitic, A. et al. [42]. As shown in Figure 5, to simulate each shear connector, the node on the shell element of the RC slab is connected to the corresponding node on the shell element of the top flange of the steel beam by two springs including one vertical spring and one longitudinal spring. In this paper, the springs along the vertical and longitudinal direction are independent.
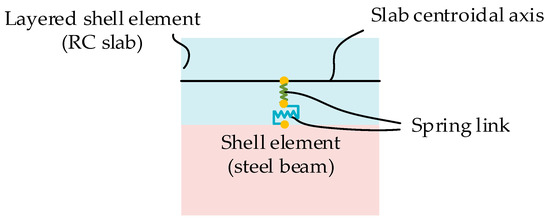
Figure 5.
Simulation of the shear connector in the finite element model.
For the shear connector, based on the theoretical analysis of the tensile stiffness of headed stud connectors in reference [43], a very large stiffness value is adopted for the definition of the spring in the vertical direction to simulate the uplift restraint, which is similar to the rigid link as reported in references [18,44]. The shear force-slip relationship curve for URSP connectors illustrated in Figure 6 is adopted to simulate the nonlinear behavior along the longitudinal direction of the steel-concrete composite interface, which is a critical factor for the simulation precision of the whole finite element model. The mathematical expression can be described in Equations (1)–(4). The proposed curve is based on the previous experimental and analytical research conducted by the authors’ research team [27,45], as well as the curve proposed for traditional shear studs [32,46,47].
where δ is the interfacial slip; δ0 is the slip corresponding to the failure of the interfacial bond; δu is the slip at the maximum capacity; δf is the slip at failure; k0 is the stiffness before the failure of the interfacial bond; ts is the thickness of foamed plastic; As is the area of screw, ds is the diameter of the screw; V is the shear force; Vu is the ultimate shear capacity; Ec and fc are the modulus of elasticity and compressive strength of the concrete, respectively; and fs is the yield strength of the screw material.
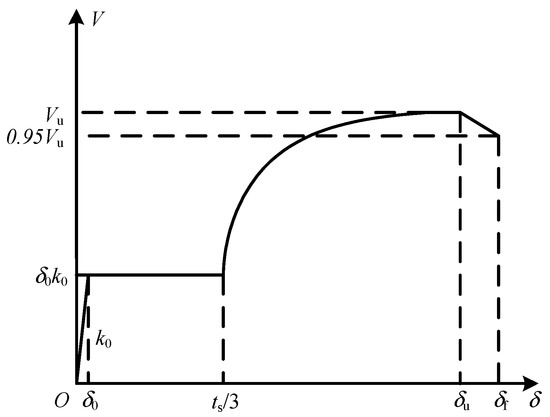
Figure 6.
Shear-slip model of the URSP connector.
At the beginning of the curve, the initial stiffness k0 represents the bond stiffness between the concrete slab and the steel beam. After a small slip δ0, the natural bonding surface fails, and the foamed plastic is pressed. Due to the small stiffness of foamed plastics, the stiffness in this stage is regarded as 0. When the slip δ reaches ts/3, the screw will be under shearing stress and the shear capacity Vu is also identical to that of the traditional headed stud. Lastly, when δ is larger than δu, the shear force descends and fracture occurs on the connector. For the URSP connectors, the key factors are determined by referring to the experimental findings of Han [45], namely, k0 = 3.75 kN/mm, δ0 = 0.15 mm, and ts = 5 mm.
For the traditional headed stud, the adopted constitutive relationship is proposed by Ollgaard et al. [32], as given in Equation (5) and Figure 7. Here, V is the shear force, Vu is the ultimate shear capacity, s is the interfacial slip, m and n are parameters obtained from experimental measurement. In most cases, m and n take the value of 0.558 and 1 mm−1, respectively [46].
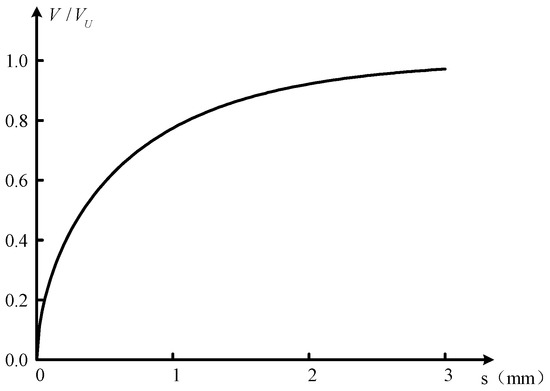
Figure 7.
Shear-slip model of the traditional headed stud.
3.4. Validation of Modeling with URSP Connectors
In order to validate the proposed finite element modeling approach for a URSP connector, an FEM-based verification test on a simply supported beam with URSP connectors along the entire span subjected to negative bending moment is performed in this section [45], since there has been no experiment on the structural performance of the composite frames with URSP connectors till now. The loading scheme, cross-section, URSP connector, and material information of the tested beam are depicted in Figure 8a–c. The numerical results are compared with the test results, as shown in Figure 8d. It can be seen that the predicted bending moment-deflection curve at the midspan is consistent with the experimental results presented in reference [45], which verifies the accuracy of the FE modeling methods in this study.
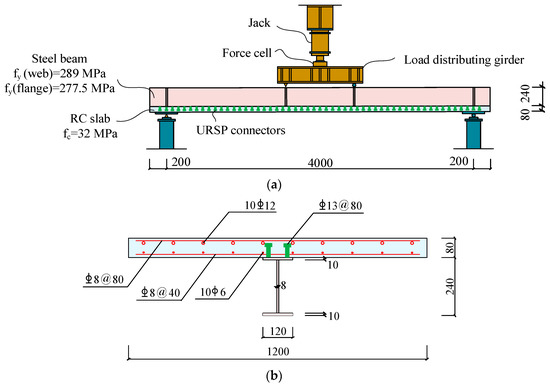
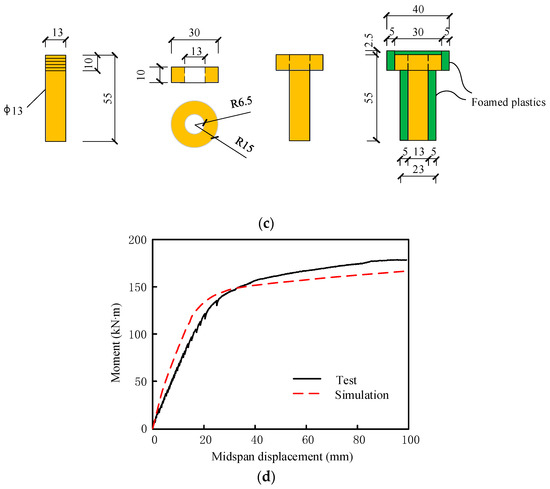
Figure 8.
Verification of the proposed model by reference [45]. (a) Loading scheme of the beam test (unit: mm); (b) cross-section of the beam specimen (unit: mm); (c) URSP connectors in the test (unit: mm); (d) comparison of test and simulation results.
4. Parametric Analysis of Side Joints
In order to investigate the effect of URSP connectors on the structural performance of the composite frame, a variety of critical parameters are chosen to be analyzed. Since the lateral capacity and stiffness are the two most basic characteristic indexes in seismic design [48,49], the load-displacement curves for the side joint under load case 1 with a concentrated load are analyzed. Furthermore, load case 2 is calculated to evaluate the crack performance of the slab concrete and the vertical stiffness of the beam by applying a uniformly distributed vertical load on the beam. The positive direction of loading is depicted in Figure 3, resulting in the hogging moment in the beam.
4.1. Lateral Resistance under Load Case 1
As listed in Table 1, several URSP lengths with different values are adopted for parametric analysis, and the URSP length is the most critical parameter influencing the effect of URSP connectors. Three levels of shear connection are considered by adjusting the spacing of connectors: two full shear connection design with the connection degree of 2.0 and 1.0, and one partial shear connection designs with the connection degree of 0.7. The ultimate loading capacity and stiffness of the side joint mainly depend on the RC slab and steel beam. Therefore, the key dimension parameters of the RC slab and steel beam within the range of usual values in the actual practice are chosen as variables.

Table 1.
Design parameters for load case 1.
4.1.1. Arrangement Length of URSP Connectors
As illustrated in Figure 3, LU is the length of regions where URSP connectors are placed along the beam. Load-displacement results at the beam end depicted in Figure 9 are the results corresponding to the side joint with different LUs and three extreme cases including the perfect interaction (nodes of the RC slab and steel beam are shared with each other), no interaction (the longitudinal stiffness of shear connectors at the interface is zero) and the bare steel beam (without an RC slab). It can be seen from Figure 9 that the ultimate resistances of the joint with perfect interaction are 8.7% and 7.7% larger than that with all studs (LU = 0) when subjected to a hogging and sagging moment, respectively. For the overall stiffness, the increases are 10.7% and 23%, respectively, which is consistent with the results presented in an earlier study [50]. Compared to the result with all studs (LU = 0), the differences corresponding to LU ranging from 0.2L to 0.9L are very small and can be neglected under a hogging and sagging moment. For simplicity, only the numerical result while LU is equal to 0.5L is plotted in the figures. However, compared to the result with all studs (LU = 0), the ultimate resistances with LU = L decrease by 10.9% and 23.3% under a hogging and sagging moment, respectively, and for overall stiffness, the decreases are up to 23.0% and 38.7%. Moreover, it can be observed that the curve with LU = L is very close to the results with no interaction, which demonstrates that the interfacial shear force can be effectively released by applying URSP connectors along the whole beam. Nevertheless, due to the contribution of the RC slab, the ultimate capacities corresponding to the hogging and sagging moment while the LU = L are 13.7% and 6.6% higher than those of the bare steel beam. Meanwhile, the increment ratios of structural stiffness are 9.3% and 7.5%, respectively. In addition, it can be observed that obvious buckling of the bottom flange of the steel beam occurs under the hogging moment with a high strain level, resulting in a rapid reduction of the load-bearing capacity of beams with perfect interaction and all studs, as presented in Figure 9a. The occurrence of buckling can be effectively postponed due to the application of URSP connectors, which increases the ductility of the beam hinge and the whole frame structures under seismic loads.
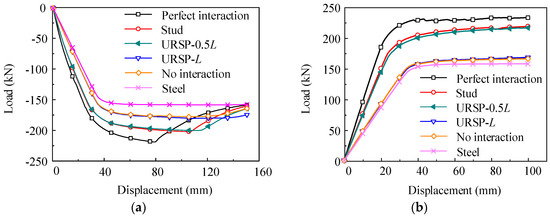
Figure 9.
Load-displacement results. (a) Hogging moment; (b) sagging moment. Note: For clarity, some of the data points are not drawn in the figure, which is the same for the following figures.
When subjected to the hogging moment, the load-strain curves of the bottom flange at the beam section where the max moment occurs are illustrated in Figure 10. As shown in Figure 10, the linear relationship between load-strain curves can be observed before the bottom flange reaches its yielding strength. With the increasing of cracks in the concrete slab and the yielding of the bottom flange, the specimen exhibits apparent nonlinear behavior. The buckling of the bottom flange occurs in several beams, as presented in Figure 9.
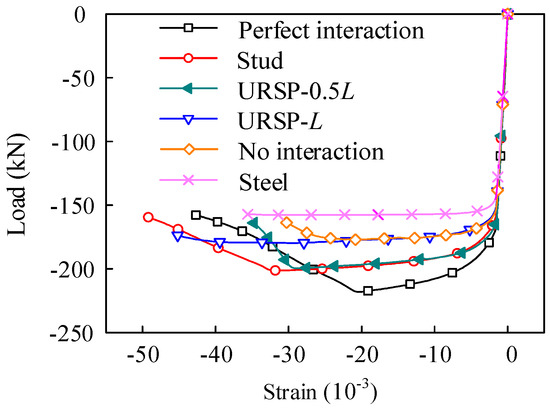
Figure 10.
Load-strain curves of the bottom flange.
For different beams, the strain distributions along the section height of the composite beam at the drift ratio of 1/50 (corresponding to the ultimate limit state) are shown in Figure 11. This figure shows that interface slip exists in the beam with all studs of a full shear connection degree. Moreover, the slip increases and the height of neutral axes in the steel girder decreases while using the URSP connectors. When LU = L, or no interaction between the concrete slab and steel girder exists, the two parts behave independently and the strain profile of the steel girder is similar to that of the bare steel beam. Since the truss action is proportional to the degree of shear connection as is mentioned above, compared with no interaction and without arranging the URSP connectors, the tensile strain at the slab top with studs is obviously larger.
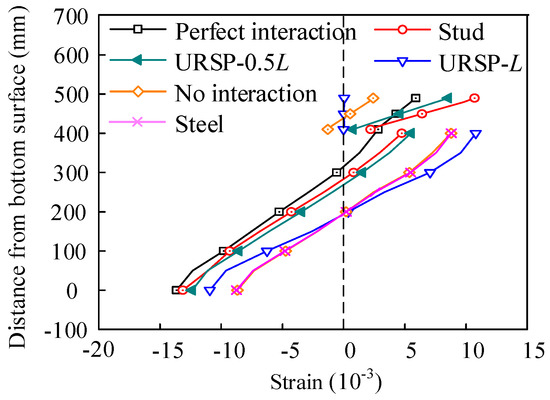
Figure 11.
Strain distribution along the section height.
Since the interface slip between the RC slab and steel beam always leads to a reduction of the overall structural stiffness [44,51,52], a detailed analysis of the slip effect under different cases is performed to interpret the results presented in Figure 9. The slip distributions along the beams under the hogging moment corresponding to the loading displacement (denoted as u in the following sections) of 10 mm, 70 mm and 150 mm, which represent the elastic state, ultimate state and maximum displacement state, respectively, are summarized in Figure 12a–c. The origin of the coordinate system is located at the beam-column interface. The values in the right direction are set to be positive. Therefore, the coordinate axis value at the left end of the beam is “−3000”. Compared with models merely connected with studs, the slip increases with the use of URSP connectors. In addition, with the increasing arrangement lengths of URSP connectors, the interface slip increases accordingly. The maximum slip value is still less than 1 mm.
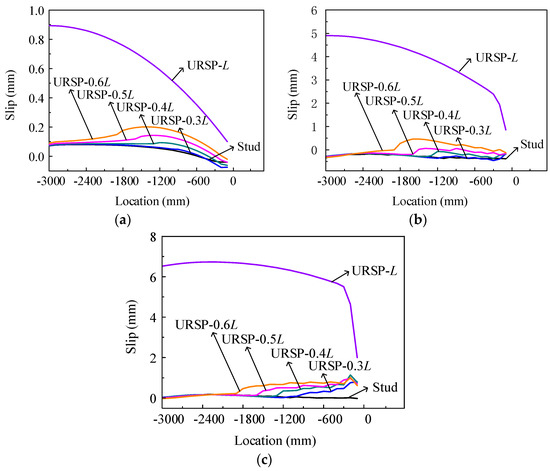
Figure 12.
Interface slip distribution under the hogging moment. (a) u = 10 mm; (b) u = 70 mm; (c) u = 150 mm.
For the extreme case where LU = L, the slip increases sharply, especially at the left end of the beam, which explains the decrease of the ultimate loading capacity in Figure 9a. The significant slip differences among beams with a partial (LU < L) and full (LU = L) arrangement of URSP connectors demonstrate that the studs can strongly restrain the slip at the left beam end. For LU < L, the slip shows an obvious increase at the transition point where URSP connectors are arranged instead of traditional studs.
Based on the simulation results above, it can be concluded that if the URSP connector’s length LU is less than L, small differences are observed among the load-displacement curves with different LUs. Therefore, only the model with a URSP arrangement length equal to 0.5L (denoted as URSP) is chosen to be compared with the model constructed with all studs (denoted as Stud) in the following parameter analysis for simplicity.
4.1.2. Shear Connector Spacing
The shear connection degree is defined as the ratio of the longitudinal shear force at the interface between the RC slab and steel beam that the connection has to resist to the shear capacity of the connectors. The effect of the shear connection degree on the performance of composite structures has been investigated in recent years [19,53,54]. A full or strong shear connection degree greater than 0.8 between the slab and the beam is considered in Eurocode 8 [55]. The effect of URSP connectors with different shear connection degrees is investigated in this section.
Here, the spacing of shear connectors is set to 100 mm, 200 mm and 300 mm in the longitudinal direction to simulate the shear connector degree of 2.0, 1.0 and 0.7, respectively. The load-displacement curves corresponding to different levels of shear connection degree are shown in Figure 13. For each shear connection degree, two models are constructed considering different LUs with the values of 0 and 0.5L. It can be seen from Figure 13 that the ultimate loading capacity and overall stiffness of the two models in each case are almost identical. Moreover, the variation of the shear connection degree poses a limited influence on the ultimate capacity and stiffness of the composite beam, which matches well with the research findings reported by Bursi et al. [19].
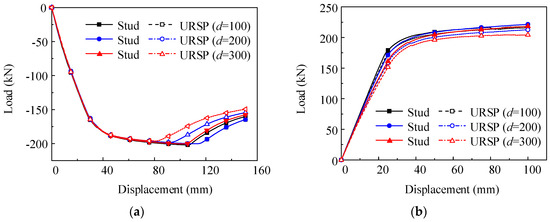
Figure 13.
Load-displacement curves with different degrees of shear connection. (a) Hogging moment; (b) sagging moment.
4.1.3. The Width and Height of the RC Slab
In a certain range, the width of the concrete slab is a critical factor that influences the effective width and the ultimate capacity of the composite beam. Within the range from 1000 mm to 3000 mm in most cases for building structures, the effect of URSP connectors on the performance of composite structures composed of concrete slabs with different widths is analyzed and the load-displacement curves are compared in Figure 14. For each slab width, the ultimate resistance and overall stiffness of the joint are almost identical between different types of connectors subjected to the positive and sagging moment. Because the ultimate negative effective width is around 1500 mm, the ultimate negative load obviously increases with the enlargement of the slab width when the width is less than 1500 mm. Moreover, the load remains almost constant when the slab width exceeds 1500 mm. Meanwhile, the ultimate positive load values are similar while changing the slab widths since the ultimate positive effective width is smaller than 1000 mm.
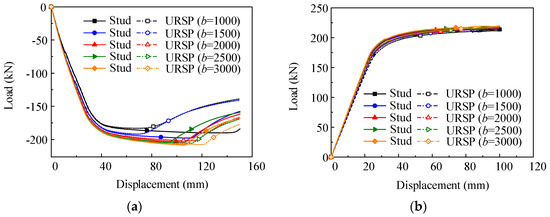
Figure 14.
Load-displacement curves with different slab widths b. (a) Hogging moment; (b) sagging moment.
The thickness of the concrete slab is another important factor that influences the structural performance of the composite frames. The thickness hc ranging from 100 mm to 150 mm is considered in this section and the load-displacement curves of FE models established with the URSP connectors (LU = 0.5L) and studs (LU = 0) are exhibited in Figure 15. It can be easily observed that the application of URSP connectors has little influence on the ultimate capacity and global stiffness of the joint under both the hogging and sagging moment, which is the common phenomenon in joints with different slab thicknesses.
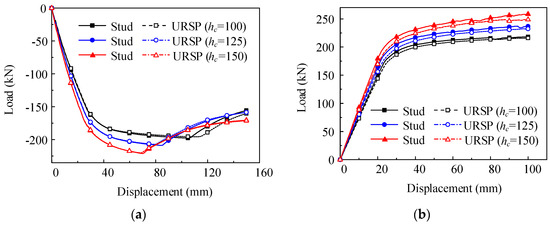
Figure 15.
Load-displacement curves with different slab thicknesses hc. (a) Hogging moment; (b) sagging moment.
4.1.4. The Height of the Steel Beam
Figure 16 shows the variation trend of the ultimate capacity and overall stiffness when the height of the steel beam varies within the range of usual values in practical engineering. It can be concluded that the height of the steel beam significantly influences the ultimate resistance and overall stiffness of the composite joint. However, as the height of the steel beam varies from 300 mm to 450 mm, the load-displacement curves of joints with partial URSP connectors and only studs are always almost the same.
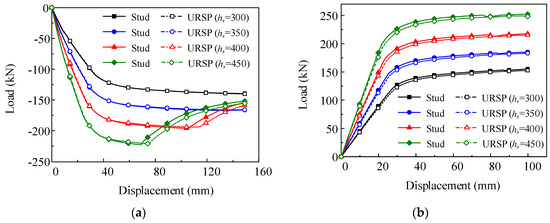
Figure 16.
Load-displacement curves with different steel beam heights hs. (a) Hogging moment; (b) sagging moment.
4.2. Cracking and Deflection under Load Case 2
When subjected to the vertical uniform pressure, the frame structure can be simplified to the side joint, as shown in Figure 3b. In order to study the performance of the composite frame under vertical loads, the crack performance of the concrete slab and the deflection of the whole beam are analyzed. The arrangement lengths of URSP connectors in the composite beam range from 0–0.5L, while the entire length of the beam in this side joint is 0.5L. Concrete stress distributions in the concrete slab of Stud and URSP-0.5L are shown in Figure 17. It is observed that the concrete stress decreases and the crack-opening-area reduces due to the presence of URSP connectors.
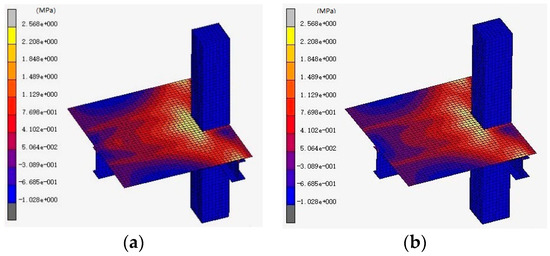
Figure 17.
Concrete tensile stress distributions in the concrete slab subjected to vertical loads. (a) Concrete stress in the Stud model; (b) concrete stress in the URSP-0.5L model.
For different arrangement lengths of URSP connectors, the variation of concrete stress, rebar stresses and the deflection at the loading point with the increase of loading displacement are illustrated in Figure 18. The location where the concrete and rebar stress investigated in the FE model is in the middle of the section, where the max moment occurs near the slab-to-column surface.
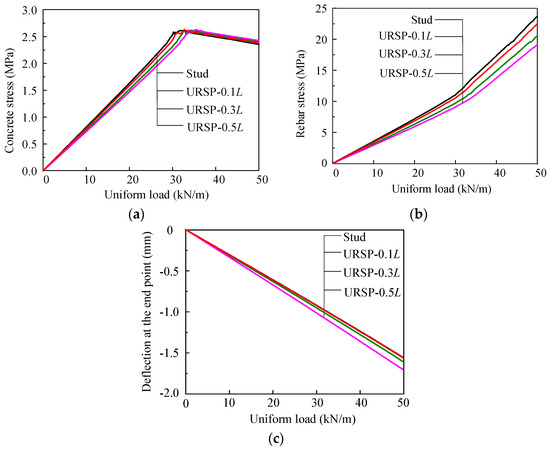
Figure 18.
Results of models subjected to vertical loads. (a) Concrete stress; (b) rebar stress; (c) deflection.
It can be seen from Figure 18a that the maximum concrete stress in the models with URSP connectors lags behind that in the model with only studs. Moreover, the concrete stress corresponding to the same load will decrease with the increment of the arrangement length of URSP connectors. In other words, compared with the model with only studs, the cracking of the RC slab with URSP connectors is postponed. It can be seen from Figure 18b that the rebar stress in the FE model with URSP connector is less than that of the model with only studs under the same uniformly distributed load. In addition, it can be observed in Figure 18c that under the same load, the deflection at the loading point of models with URSP connectors is larger than that of the model with only studs, and the deflection increases with the arrangement length growth of the URSP connectors.
In this case, the cracking load is defined as the value of the uniform pressure when the concrete stress reaches the peak. It can be seen from Figure 18 that the cracking load increases at most by 18% when the length of the region with URSP connectors is 0.5L. Compared with studs applied in composite frame beam only, for each arrangement length of URSP connectors LU applied in the composite frame, the amplification factor of the cracking load RF is defined as
where FURSP and FStud are the cracking loads of the composite frame beam while using URSP connectors and studs, respectively.
In the serviceability limit states, the stiffness amplification coefficient is an important factor which can be used to calculate the deflection of the composite beam and is inversely proportional to the deflection. It can be found in Figure 18c that the stiffness amplification coefficient decreases when the URSP connectors are arranged in the composite frame beam. In addition, it decreases to a greater extent with the increment of arrangement length LU of the URSP connectors. The ratio of the stiffness amplification coefficient RI is defined as
where and are the stiffness amplification coefficients of the composite frame beam when using URSP connectors and studs, respectively. and are the deflection of the composite frame beam when using URSP connectors and studs, respectively, which are obtained by deflection of the composite frame beam under a uniformly distributed load before cracking occurs.
In order to study the effect of the length of URSP connectors on the cracking performance of the side beam under different conditions, seven additional critical parameters varying in a usual range in practice are considered in the elaborate finite element models depicted in Figure 4, as shown in Table 2.

Table 2.
Design parameters for load case 2.
Similar trends to those shown in Figure 18 are observed after applying 0–0.5L URSP connectors when other variable parameters are adopted. Choosing the parameters slab thickness hc and steel beam height hs, which greatly influence the performance of composite structures, as the main variables in this section, the variation of RF and RI of composite beams with different URSP connectors arrangement lengths LUs is illustrated in Figure 19.
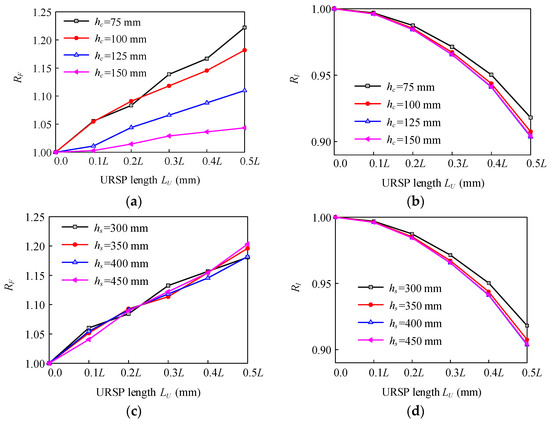
Figure 19.
Results with different URSP lengths. (a) RF with different hc; (b) RI with different hc; (c) RF with different hs; (d) RI with different hs.
It can be seen from Figure 19a,c that the amplification factor of the cracking load RF increases with the increase of URSP length, and the effect of cracking delay is more obvious and effective with the increase of URSP length. As illustrated in Figure 19b,d, the ratio of the stiffness amplification coefficient RI decreases with the increase of URSP length. In other words, the stiffness amplification coefficient decreases more with the increase of URSP length. Figure 19a indicates that the amplification factor of the cracking load RF almost decreases with the increase of slab thickness hc, which implies that the cracking load can be effectively enhanced with a relatively lower slab thickness.
5. Design Recommendations for URSP Connectors for Side Joints
URSP connectors have been adopted in continuous composite bridge in China. The design guidelines for bridge engineering have been provided by Li et al. [31]. In a composite frame system, the scientific design guideline will be proposed on the basis of intensive numerical analysis in this section.
As detailed in Table 2, a total of 17 different conditions are considered for each URSP length LU. The quantities of RF and RI obtained from elaborate finite element analysis are up to 102 in each diagram presented in Figure 20. For composite components arranged with URSP connectors of different lengths, the simplified design formula for the amplification factor of the cracking load RF and the ratio of stiffness amplification coefficient of the composite frame RI is proposed as
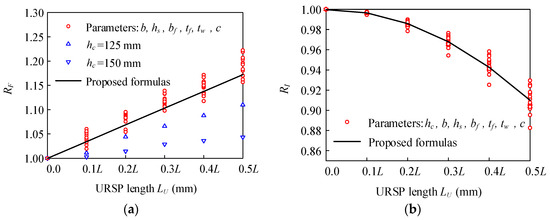
Figure 20.
Results of models with a variety of URSP lengths. (a) RF; (b) RI.
The calculated RF and RI based on the proposed formulas are in good agreement with the values obtained from numerical analysis, as shown in Figure 20, except for some conditions when slab thicknesses hc are 125 mm and 150 mm. As mentioned above, the RF is relatively low when the slab thickness is relatively high, which is not considered in the following section and suggested in practice.
The proposed formulas are helpful to understand the influence of arrangement lengths of URSP connectors on the improvement of the crack resistance performance, and can provide effective suggestions for the calculation of the stiffness amplification coefficient in the composite frame using URSP connectors.
According to Figure 20, a length of the region with URSP connectors equal to 0.4–0.5L in a composite frame beam is recommended for practical design, which improves the cracking load by 12–22% and controls the reduction of the stiffness amplification coefficient within 12%.
6. Design Recommendations for URSP Connectors for Middle Joints
In Section 5, the simplified design formulas for calculating the amplification factor of the cracking load RF and the ratio of the stiffness amplification coefficient of the composite frame RI for the side joint are proposed, as expressed in Equations (8) and (9). As for the middle joints, the beam end at one side is subjected to the ultimate sagging moment, and the other side is subjected to the ultimate hogging moment, as shown in Figure 21a. The uniformly distributed load is applied on the middle joint in Figure 21b to investigate the cracking behavior and the deflection of the composite beam.

Figure 21.
Two loading configurations of middle joints. (a) Load case 1; (b) Load case 2.
For load case 1, the capacity of middle joints with URSP connectors distributed in 0.5L is compared to that only arranged with stud connectors, and a limited difference can be observed in these two cases. As shown in Table 3, MStud-L and MURSP-0.5L represent the ultimate moment of middle joints with studs only and URSP connectors distributed in 0.5L, respectively. The application of URSP connectors with the arrangement length of 0.5L poses a limited influence on the capacity of the middle joints, which is similar to the research findings from the side joints discussed in Section 4.

Table 3.
The capacity of middle joints under load case 1.
For load case 2, in order to clarify whether the proposed formulas in Section 5 are suitable for the beam ends at the middle joints, Table 4 and Table 5 compare the RF and RI by the proposed formulas and the calculated values RF′ and RI′ by FE models of middle joints with different URSP connector lengths. Since almost all the results are similar to the theoretical results based on the formulas proposed in this study, Equations (8) and (9) for the side joints can also be suitable for the structural design of middle joints.

Table 4.
RF of middle joints under load case 2.

Table 5.
RI of middle joints under load case 2.
7. Recommendations for Future Work
In this paper, only numerical studies of the application of URSP connectors in the steel-concrete composite frame system are performed. Future work will mainly concentrate on experimental investigation to validate the URSP’s functions in reducing the cracking in concrete slabs and to verify the numerical parametric study. With the recent development of low cost and embedded piezoceramic smart aggregates for concrete structures [56,57,58,59], the cracking inside a concrete structure can be monitored through active sensing approach [60,61,62] and the imaging approach [63,64,65,66]. The piezoceramic smart aggregate can function as an actuator to generate stress/ultrasonic waves and also as a sensor to detect the stress/ultrasonic waves. In the experimental verification, the smart aggregates will be embedded in the concrete slab to monitor crack initiation and growth. On the other hand, to monitor the bond slip between the RC slab and the steel beam, the shear-type of small-size piezoceramic patches will be used. This work has been motivated by the reported research on the monitoring of bond-slip and debond between the reinforcement and concrete using piezoceramic transducers [67,68,69].
8. Summary and Conclusions
In this paper, the application of a URSP connector in the composite frame system was studied. Elaborate finite element models of side and middle joints, were built in MSC-Marc, in order to resemble the structural response of a composite frame under vertical and lateral loading conditions. The effects of URSP connectors on the structural performance of a composite frame based on the parametric analysis of several critical parameters were investigated. The ultimate load-carrying capacity of side joints and middle joints under a concentrated load and the crack performance under a vertical uniformly distributed load were discussed in depth. It has been demonstrated that the application of URSP connectors improves the crack resistance performance and has little influence on the lateral capacity and stiffness. In other words, applying URSP connectors in the composite frame has been demonstrated to:
- (a)
- Maintain the ultimate capacity and overall stiffness under lateral loads, which are comparable to those of a composite frame with all stud connectors;
- (b)
- Improve the cracking resistance of an RC slab under vertical loads, compared with the composite frame with stud connectors only, and the improvement increases with the increased arrangement length of URSP connectors;
- (c)
- Only decrease the initial vertical stiffness a bit compared with the composite frame with stud connectors only under vertical loads.
Furthermore, based on the FE results, the design recommendations of URSP connectors were given in terms of two factors, the amplification factor of the cracking load RF and the stiffness amplification coefficient ratio RI. A distribution length of 0.4–0.5L (0.2–0.25 times of the whole frame beam length) is recommended for URSP connectors adopted near both beam ends for practical design.
Author Contributions
Conceptualization, X.N.; methodology, L.D. and L.Z.; software, L.D. and L.Z.; validation, X.N. and R.D.; formal analysis, L.D.; investigation, L.D. and R.D.; resources, X.N.; data curation, L.Z.; writing—original draft preparation, L.D.; writing—review & editing, X.N. and R.D.; visualization, L.D. and R.D.; supervision, X.N. and R.D.; project administration, X.N. and R.D.; funding acquisition, X.N.
Funding
This research was supported by the National Key Research Program of China (Grant No. 2018YFC0705704) and Key Research Program of China Railway Corp. (Grant No. K2018G018).
Acknowledgments
The authors would like to thank the anonymous reviewers for their constructive comments and suggestions.
Conflicts of Interest
The authors declare no conflict of interest.
References
- Chen, H.B.; Xu, B.; Mo, Y.L.; Zhou, T.M. Multi-Scale stress wave simulation for aggregates segregation detection of concrete core in circular CFST coupled with PZT patches. Materials 2018, 11, 1223. [Google Scholar] [CrossRef]
- Xu, B.; Li, B.; Song, G.B. Active debonding detection for large rectangular CFSTs based on wavelet packet energy spectrum with piezoceramics. J. Struct. Eng. 2012, 139, 1435–1443. [Google Scholar] [CrossRef]
- Zhang, J.; Li, Y.; Du, G.F.; Song, G.B. Damage detection of L-shaped concrete filled steel tube (L-CFST) columns under cyclic loading using embedded piezoceramic transducers. Sensors 2018, 18, 2171. [Google Scholar] [CrossRef]
- Giri, P.; Mishra, S.; Clark, S.M.; Samali, B. Detection of gaps in concrete–metal composite structures based on the feature extraction method using piezoelectric transducers. Sensors 2019, 19, 1769. [Google Scholar] [CrossRef]
- Kong, Q.Z.; Robert, R.H.; Silva, P.; Mo, Y.L. Cyclic crack monitoring of a reinforced concrete column under simulated pseudo-dynamic loading using piezoceramic-based smart aggregates. Appl. Sci. 2016, 6, 6110341. [Google Scholar] [CrossRef]
- Qin, F.; Kong, Q.Z.; Li, M.; Mo, Y.L.; Song, G.B.; Fan, F. Bond slip detection of steel plate and concrete beams using smart aggregates. Smart Mater. Struct. 2015, 24, 115039. [Google Scholar] [CrossRef]
- Begum, M.; Driver, R.G.; Elwi, A.E. Parametric study on eccentrically-loaded partially encased composite columns under major axis bending. Steel Compos. Struct. 2015, 19, 1299–1319. [Google Scholar] [CrossRef]
- Yin, Z.Z.; Zhang, H.; Yang, W.W. Study on seismic performance and damage analysis of steel plate shear wall with partially encased composite (PEC) columns. Appl. Sci. 2019, 9, 907. [Google Scholar] [CrossRef]
- Zeng, L.; Parvasi, S.M.; Kong, Q.Z.; Huo, L.S.; Lim, I.; Li, M.; Song, G.B. Bond slip detection of concrete-encased composite structure using shear wave based active sensing approach. Smart Mater. Struct. 2015, 24, 125026. [Google Scholar] [CrossRef]
- Piquer, A.; Hernández-Figueirido, D. Protected steel columns vs partially encased columns: Fire resistance and economic considerations. J. Constr. Steel Res. 2016, 124, 47–56. [Google Scholar] [CrossRef]
- Qi, L.J.; Xue, J.Y.; Zhai, L.; Zhao, X.; Leon, R.T. Experimental and numerical studies on seismic performance of traditional style steel-concrete composite frame. Compos. Struct. 2018, 201, 514–527. [Google Scholar] [CrossRef]
- Kamaris, G.S.; Skalomenos, K.A.; Hatzigeorgiou, G.D.; Beskos, D.E. Seismic damage estimation of in-plane regular steel/concrete composite moment resisting frames. Eng. Struct. 2016, 115, 67–77. [Google Scholar] [CrossRef]
- Tan, Y.; Zhu, B.; Yan, T.; Huang, B.; Wang, X.; Yang, W.; Huang, B. Experimental study of the mechanical behavior of the steel–concrete joints in a composite truss bridge. Appl. Sci. 2019, 9, 854. [Google Scholar] [CrossRef]
- Du, G.F.; Li, Z.; Song, G.B. A pvdf-based sensor for internal stress monitoring of a concrete-filled steel tubular (CFST) column subject to impact loads. Sensors 2018, 18, 1682. [Google Scholar] [CrossRef]
- Yang, W.W.; Yan, R.H.; Suo, Y.Q.; Zhang, G.Q.; Huang, B. Experimental study on hysteretic behavior of the overlapped k-joints with concrete filled in chord. Appl. Sci. 2019, 9, 1456. [Google Scholar] [CrossRef]
- Udagawa, K.; Mimura, H. Behavior of composite beam frame by pseudodynamic testing. J. Struct. Eng. 1991, 117, 1317–1334. [Google Scholar] [CrossRef]
- Nakashima, M.; Matsumiya, T.; Suita, K.; Zhou, F. Full-Scale test of composite frame under large cyclic loading. J. Struct. Eng. 2007, 133, 297–304. [Google Scholar] [CrossRef]
- Nie, J.G.; Tao, M.X. Slab spatial composite effect in composite frame systems. I: Effective width for ultimate loading capacity. Eng. Struct. 2012, 38, 171–184. [Google Scholar] [CrossRef]
- Bursi, O.S.; Sun, F.F.; Postal, S. Non-linear analysis of steel-concrete composite frames with full and partial shear connection subjected to seismic loads. J. Constr. Steel Res. 2005, 61, 67–92. [Google Scholar] [CrossRef]
- Zhang, J.C.; Li, Y.; Zheng, Y.; Wang, Z.J. Seismic damage investigation of spatial frames with steel beams connected to L-shaped concrete-filled steel tubular (CFST) columns. Appl. Sci. 2018, 8, 1713. [Google Scholar] [CrossRef]
- Zhang, J.C.; Huang, Y.S.; Chen, Y.; Du, G.F.; Zhou, L.J. Numerical and experimental study on seismic behavior of concrete-filled T-section steel tubular columns and steel beam planer frames. J. Cent. South Univ. 2018, 25, 1774–1785. [Google Scholar] [CrossRef]
- Wang, J.; Wang, W.; Lehman, D.; Roeder, C. Effects of different steel-concrete composite slabs on rigid steel beam-column connection under a column removal scenario. J. Constr. Steel Res. 2019, 153, 55–70. [Google Scholar] [CrossRef]
- Amadio, C.; Bedon, C.; Fasan, M. Numerical assessment of slab-interaction effects on the behaviour of steel-concrete composite joints. J. Constr. Steel Res. 2017, 139, 397–410. [Google Scholar] [CrossRef]
- Bazant, Z.k.P.; Oh, B.H. Deformation of cracked net-reinforced concrete walls. J. Struct. Eng. 1983, 109, 93–108. [Google Scholar] [CrossRef]
- Song, G.; Mo, Y.L.; Otero, K.; Gu, H. Health monitoring and rehabilitation of a concrete structure using intelligent materials. Smart Mater. Struct. 2006, 15, 309–314. [Google Scholar] [CrossRef]
- Liao, W.I.; Wang, J.X.; Song, G.; Gu, H.; Olmi, C.; Mo, Y.L.; Chang, K.C.; Loh, C.H. Structural health monitoring of concrete columns subjected to seismic excitations using piezoceramic-based sensors. Smart Mater. Struct. 2011, 20, 125015. [Google Scholar] [CrossRef]
- Nie, J.G.; Li, Y.X.; Tao, M.X.; Nie, X. Uplift-restricted and slip-permitted T-shape connectors. J. Bridge Eng. 2015, 20, 04014073. [Google Scholar] [CrossRef]
- Nie, X.; Nie, J.G.; Tao, M.X.; Fan, J.S.; Zhang, Z.X.; Tang, H.Y. Study on steel-concrete continuous composite bridge connected by new type of steel-concrete connector without shear resistance. J. Harbin Inst. Tech. 2012, 44, 95–100. (In Chinese) [Google Scholar]
- Nie, J.G.; Tao, M.X.; Nie, X.; Fan, J.S.; Zhang, Z.X.; Tang, H.Y.; Zhu, L.; Li, Y.X. New technique and application of uplift-restricted and slip-permitted connection. China Civ. Eng. J. 2015, 4, 7–14. (In Chinese) [Google Scholar]
- Nie, J.G.; Wang, J.J.; Gou, S.K.; Zhu, Y.Y.; Fan, J.S. Technological development and engineering applications of novel steel-concrete composite structures. Front. Struct. Civ. Eng. 2019, 13, 1–14. [Google Scholar] [CrossRef]
- Li, Z.Y.; Tao, M.X.; Nie, J.G.; Fan, J.S. Analysis and optimization of a continuous composite bridge with uplift-restricted and slip-permitted connectors. In IABSE Symposium Report; International Association for Bridge and Structural Engineering: Zurich, Switzerland, 2017. [Google Scholar]
- Ollgaard, J.G.; Slutter, R.G.; Fisher, J.W. Shear strength of stud connectors in lightweight and normal- weight concrete. AISC Eng. J. Am. Inst. Steel Constr. 1971, 8, 55–64. [Google Scholar]
- He, S.H.; Fang, Z.; Fang, Y.W.; Liu, M.; Liu, L.Y.; Ayman, S.M. Experimental study on perfobond strip connector in steel–concrete joints of hybrid bridges. J. Constr. Steel Res. 2016, 118, 169–179. [Google Scholar] [CrossRef]
- Bezerra, L.M.; Barbosa, W.C.S.; Bonilla, J.; Cavalcante, O.R.O. Truss-type shear connector for composite steel-concrete beams. Constr. Build. Mater. 2018, 167, 757–767. [Google Scholar] [CrossRef]
- Dezi, L.; Gara, F.; Leoni, G.; Tarantino, A.M. Time-dependent analysis of shear-lag effect in composite beams. J. Eng. Mech. 2001, 127, 71–79. [Google Scholar] [CrossRef]
- Betti, R.; Gjelsvik, A. Elastic composite beams. Comput. Struct. 1996, 59, 437–451. [Google Scholar] [CrossRef]
- Abe, H.; Nakajima, A. Division of slabs and development of flexible connectors. IABSE Symp. Rep. 1990, 60, 107–112. [Google Scholar]
- Başar, Y.; Itskov, M.; Eckstein, A. Composite laminates: Nonlinear interlaminar stress analysis by multi- layer shell elements. Comput. Method Appl. Mech. Eng. 2000, 185, 367–397. [Google Scholar] [CrossRef]
- Pietro, C.; Paolo, F. Numerical Simulation of the Behavior of Cracked Reinforced Concrete Members. Mater. Sci. Appl. 2014, 5, 883–894. [Google Scholar]
- Nie, J.G.; Tao, M.X.; Cai, C.S.; Li, S.J. Analytical and numerical modeling of prestressed continuous steel- concrete composite beams. J. Struct. Eng. 2011, 137, 1405–1418. [Google Scholar] [CrossRef]
- Nie, J.G.; Huang, Y.; Yi, W.J.; Fan, J.S. Seismic behavior of CFRSTC composite frames considering slab effects. Steel Constr. 2012, 68, 165–175. [Google Scholar]
- Stitic, A.; Nguyen, A.; Rezaei Rad, A.; Weinand, Y. Numerical Simulation of the Semi-Rigid Behaviour of Integrally Attached Timber Folded Surface Structures. Buildings 2019, 9, 55. [Google Scholar] [CrossRef]
- Yang, F.; Liu, Y.; Liang, C. Analytical study on the tensile stiffness of headed stud connectors. Adv. Struct. Eng. 2019, 22, 1149–1160. [Google Scholar] [CrossRef]
- Wang, S.H.; Tong, G.S.; Zhang, L. Reduced stiffness of composite beams considering slip and shear deformation of steel. J. Constr. Steel Res. 2017, 131, 19–29. [Google Scholar] [CrossRef]
- Han, S.W. Experimental Study on Steel-Concrete Composite Beam with Uplift-Restricted and Slip-Permitted Connectors. Master’s Degree, Tsinghua University, Beijing, China, 2016. (In Chinese). [Google Scholar]
- Johnson, R.P.; Molenstra, I.N. Partial shear connection in composite beams for buildings. Proc. Inst. Civ. Eng. 1991, 91 Pt 2, 679–704. [Google Scholar] [CrossRef]
- Sved, G.; Oehlers, D.J. Composite beams with limited-slip-capacity shear connectors. J. Struct. Eng. 1995, 121, 932–938. [Google Scholar]
- Guo, L.; Wang, Y.; Zhang, S. Experimental study of rectangular multi-partition steel-concrete composite shear walls. Thin Wall Struct. Elsevier 2018, 130, 577–592. [Google Scholar] [CrossRef]
- Rezaei Rad, A.; Banazadeh, M. Probabilistic risk-based performance evaluation of seismically base-isolated steel structures subjected to far-field earthquakes. Buildings 2018, 8, 129. [Google Scholar] [CrossRef]
- Chiorean, C.G.; Buru, S.M. Practical nonlinear inelastic analysis method of composite steel-concrete beams with partial composite action. Eng. Struct. 2017, 134, 74–106. [Google Scholar] [CrossRef]
- Huo, L.; Cheng, H.; Kong, Q.; Chen, X. Bond-Slip monitoring of concrete structures using smart sensors—A review. Sensors 2019, 19, 1231. [Google Scholar] [CrossRef]
- Ho, S.C.M.; Ren, L.; Labib, E.; Kapadia, A.; Mo, Y.L.; Li, H.N.; Song, G.B. Inference of bond slip in prestressed tendons in concrete bridge girders. Struct. Control Health Monit. 2015, 22, 289–300. [Google Scholar] [CrossRef]
- Vasdravellis, G.; Valente, M.; Castiglioni, C.A. Dynamic response of composite frames with different shear connection degree. J. Constr. Steel Res. 2009, 65, 2050–2061. [Google Scholar] [CrossRef]
- Sanghyo, K.; Chiyoung, J.; Jinhee, A. Ultimate strength of composite structure with different degrees of shear connection. Steel Compos. Struct. 2011, 11, 375–390. [Google Scholar]
- Eurocode 8, Design Provisions for Earthquake Resistance of Structures. Part 1.3: General Rules. Specific Rules for Various Materials and Elements; CEN, European Committee for Standardisation: Brussels, Belgium, 2004.
- Kong, Q.Z.; Fan, S.L.; Bai, X.L.; Mo, Y.L.; Song, G.B. A novel embeddable spherical smart aggregate for structural health monitoring: Part I. Fabrication and electrical characterization. Smart Mater. Struct. 2017, 26, 095050. [Google Scholar] [CrossRef]
- Kong, Q.Z.; Fan, S.L.; Mo, Y.L.; Song, G.B. A novel embeddable spherical smart aggregate for structural health monitoring: Part II. Numerical and experimental verifications. Smart Mater. Struct. 2017, 26, 095051. [Google Scholar] [CrossRef]
- Zou, D.J.; Liu, T.J.; Qiao, G.F.; Huang, Y.C.; Li, B. An experimental study on the performance of piezoceramic-based smart aggregate in water environment. IEEE Sens. J. 2014, 14, 943–944. [Google Scholar] [CrossRef]
- Laskar, A.; Gu, H.C.; Mo, Y.L.; Song, G.B. Progressive collapse of a two-story reinforced concrete frame with embedded smart aggregates. Smart Mater. Struct. 2009, 18, 075001. [Google Scholar] [CrossRef]
- Moslehy, Y.; Gu, H.C.; Belarbi, A.; Mo, Y.L.; Song, G.B. Smart aggregate based damage detection of circular RC columns under cyclic combined loading. Smart Mater. Struct. 2010, 19, 065021. [Google Scholar] [CrossRef]
- Zou, D.J.; Liu, T.J.; Yang, A.T.; Zhao, Y.R.; Du, C.C. A primary study on the performance of piezoceramic based smart aggregate under various compressive stresses. Smart Mater. Struct. 2017, 26, 107003. [Google Scholar] [CrossRef]
- Xu, K.; Deng, Q.S.; Cai, L.J.; Ho, S.C.; Song, G.B. Damage detection of a concrete column subject to blast loads using embedded piezoceramic transducers. Sensors 2018, 18, 1377. [Google Scholar] [CrossRef]
- Lu, G.T.; Li, Y.R.; Wang, T.; Xiao, H.; Huo, L.S.; Song, G.B. A multi-delay-and-sum imaging algorithm for damage detection using piezoceramic transducers. J. Intell. Mater. Syst. Struct. 2017, 28, 1150–1159. [Google Scholar] [CrossRef]
- Gao, W.H.; Huo, L.S.; Li, H.N.; Song, G.B. Smart concrete slabs with embedded tubular PZT transducers for damage detection. Smart Mater. Struct. 2018, 27, 025002. [Google Scholar] [CrossRef]
- Lu, G.T.; Li, Y.R.; Song, G.B. A delay-and-Boolean-ADD imaging algorithm for damage detection with a small number of piezoceramic transducers. Smart Mater. Struct. 2016, 25, 095030. [Google Scholar] [CrossRef]
- Gao, W.H.; Huo, L.S.; Li, H.N.; Song, G.B. An embedded tubular PZT transducer based damage imaging method for two-dimensional concrete structures. IEEE Access 2018, 6, 30100–30109. [Google Scholar] [CrossRef]
- Mulligan, K.R.; Quaegebeur, N.; Ostiguy, P.C.; Masson, P.; Létourneau, S. Comparison of metrics to monitor and compensate for piezoceramic debonding in structural health monitoring. Struct. Health Monit. 2013, 12, 153–168. [Google Scholar] [CrossRef]
- Liang, Y.B.; Li, D.S.; Parvasi, S.M.; Kong, Q.Z.; Lim, I.; Song, G.B. Bond-slip detection of concrete-encased composite structure using electro-mechanical impedance technique. Smart Mater. Struct. 2016, 25, 095003. [Google Scholar] [CrossRef]
- Xu, K.; Ren, C.C.; Deng, Q.S.; Jin, Q.P.; Chen, X.M. Real-time monitoring of bond slip between GFRP bar and concrete structure using piezoceramic transducer-enabled active sensing. Sensors 2018, 18, 2653. [Google Scholar] [CrossRef]
© 2019 by the authors. Licensee MDPI, Basel, Switzerland. This article is an open access article distributed under the terms and conditions of the Creative Commons Attribution (CC BY) license (http://creativecommons.org/licenses/by/4.0/).