Article

Development of A Loss Minimization Based Operation Strategy for Embedded BTB VSC HVDC

1
School of Electrical Engineering, Korea University, Anam-ro, Sungbuk-gu, Seoul 02841, Korea
2
Department of Electrical Engineering, Tongmyong University, 428, Sinseon-ro, Nam-gu, Busan 48520, Korea
3
Department of Electrical Engineering, Hanbat National University, Daejeon 305-719, Korea
*
Author to whom correspondence should be addressed.
Appl. Sci. 2019, 9(11), 2234; https://doi.org/10.3390/app9112234
Submission received: 4 April 2019 / Revised: 26 May 2019 / Accepted: 28 May 2019 / Published: 30 May 2019
(This article belongs to the Special Issue HVDC for Grid Services in Electric Power Systems)

Abstract

:
Recently, there have been many cases in which direct current (DC) facilities have been placed in alternating current (AC) systems for various reasons. In particular, in Korea, studies are being conducted to install a back-to-back (BTB) voltage-sourced converter (VSC) high-voltage direct current (HVDC) to solve the fault current problem of the meshed system, and discussions on how to operate it have been made accordingly. It is possible to provide grid services such as minimizing grid loss by changing the HVDC operating point, but it also may violate reliability standards without proper HVDC operation according to the system condition. Especially, unlike the AC system, DC may adversely affect the AC system because the operating point does not change even after a disturbance has occurred, so strategies to change the operating point after the contingency are required. In this paper, a method for finding the operating point of embedded HVDC that minimizes losses within the range of compliance with the reliability criterion is proposed. We use the Power Transfer Distribution Factor (PTDF) to reduce the number of buses to be monitored during HVDC control, reduce unnecessary checks, and determine the setpoints for the active/reactive power of the HVDC through system total loss minimization (STLM) control to search for the minimum loss point using Powell’s direct set. We also propose an algorithm to search for the operating point that minimizes the loss automatically and solves the overload occurring in an emergency through security-constrained loss minimization (SCLM) control. To verify the feasibility of the algorithm, we conducted a case study using an actual Korean power system and verified the effect of systematic loss reduction and overload relief in a contingency. The simulations are conducted by a commercial power system analysis tool, Power System Simulator for Engineering (PSS/E).

1. Introduction

In recent years, the electric-power industry has changed from a conventional alternating current (AC) system to a hybrid system, in which special facilities such as high voltage direct current (HVDC) and flexible AC transmission system (FACTS) work together. In particular, HVDC has been used for over 50 years, mainly for asynchronous interconnection, long-distance transmission, submarine, and underground cable transmission, etc. The most commonly used system is the line-commutated converter (LCC) HVDC, which uses thyristor valves, but the development of voltage-sourced converter (VSC) HVDC technology is also on the rise with the advances in power electronics technology [1,2,3].
In general, HVDC is mainly used with point-to-point (PTP) type which is used for large-capacity, long-distance transmission. These HVDCs are intended to transmit power unidirectionally between the two regions, so no special operation strategies are required. Recently, however, small-and medium-scale VSC HVDCs were installed in the grid to provide additional grid services in addition to unidirectional power transmission, because of the independent control of active/reactive power and converter switching operation of the VSC HVDC, which can provide grid services for an AC system, as shown in Table 1 [2,4].
In particular, it is easy to provide grid services for the AC grid when embedded HVDC is installed in the grid, where embedded HVDC is defined as “a DC link with multiple ends that are physically connected from a single synchronous AC network. With such a connection, these connections allow DC to perform basic functions of bulk power transmission as well as some additional control functions within the AC network such as power flow control, voltage control, stability improvement” [5]. In other words, embedded HVDC is mainly used for AC power flow control by active power control at both ends of the converter, improvement of voltage stability by reactive power control, suppression of failure propagation in the AC system, and system stability through frequency control. With the introduction of embedded VSC HVDC, there have been various studies of embedded VSC HVDC operation strategies as shown in [6,7,8,9,10,11,12,13,14,15,16,17,18,19,20,21]. References [6,7,8] are early research on the operation strategy of the HVDC, which improves the stability of power facilities by Remedial Action Scheme (RAS). As defined [9,10], an RAS is designed to take corrective action to maintain system reliability and provide acceptable system performance. This operating strategy has been applied to many HVDC projects such as Manitoba HVDC, Eastern/Western Alberta Transmission Line, and the RAS is used as the basis of emergency control in this paper [11,12,13,14,15,16]. The operating point of HVDC should be determined prior to these emergency controls, and most HVDCs are intended for long-distance transmission, so the operating point is determined according to the rated capacity or N-1 failure without any special strategy [17]. However, by changing the HVDC operating point, system total loss can be reduced, and such studies have also been conducted. This method mainly focuses on reducing transmission loss with Multi-Terminal DC (MTDC) [18,19], and studies on finding operating points based on objective functions such as system loss, voltage deviation, and reliability criteria have been variously conducted on small scale systems [20,21]. These conventional studies have the drawback such as they were conducted in a small-scale radial system, not a large-scale meshed system; the studies manly consider only AC loss; and there is no integrated control scheme for HVDC operation considering system total loss.
In this paper, a method for determining the normal/contingency operation point of embedded back-to-back (BTB) VSC HVDC is proposed. In calculating the operation point during normal conditions, the system total loss minimization (STLM) control to minimize total losses within the grid reliability criterion is conducted using Powell’s direct set theory. At this time, by using the power transfer distribution factor (PTDF), we calculate the lines that are sensitive to HVDC operation beforehand, reduce the number of lines to be monitored, and exclude the investigation of unnecessary lines. In addition, the security-constrained loss minimization (SCLM) control for eliminating the overloads in N-1 contingencies operates additionally. The optimum HVDC operating point is determined by setting the system total loss reduction as the objective function even within the operating range in which the overload can be eliminated by a method different from the existing remedial control. This paper is structured as follows. Section 2 describes the Korean power system briefly and provides a concept of BTB VSC HVDC in a meshed system. The method for finding the operating point of embedded BTB VSC HVDC is described in Section 3. Section 4 shows the simulation results of the BTB VSC HVDC operating point decision process for the Korean power system and demonstrates the validity of the proposed algorithm. The simulations are conducted by Power System Simulator for Engineering (PSS/E) 33.4.0 and the optimization results are implemented in Python code.

2. System Description

2.1. Korean Power System

In South Korea, 40% of the total load is concentrated in the metropolitan area, so the system is composed of multi-looped types for improving system stability. This system is advantageous for most aspects of stability, but it makes the fault current problem more serious. In order to solve the fault current problem, current limiting reactor installation, increasing circuit breakers (CB), grid segmentation, and other suggestions have been proposed. However, none of the methods can solve the fault current problem ultimately. Recently, as an alternative to these, a grid segmentation using BTB HVDC has been proposed. In this aspect, fault current reduction can be cited as a criterion for deciding on the HVDC position in the meshed power system. Currently, two long-distance HVDCs are in operation in the Korean power system, and four HVDCs will be added in the future. One of them is an embedded-type HVDC, which will be installed in the Seoul metropolitan area to solve the fault current problem. Studies on the installation of BTB HVDC for resolving the fault current problem in the metropolitan area have been actively conducted, as shown in [22,23].

2.2. Embedded BTB HVDC Siting in Meshed System

When replacing the existing AC line of the system with HVDC, the equivalent impedance of the power system increases, and the magnitude of the fault current decreases accordingly. For short circuit analysis, HVDC normally operates as a PQ bus at both ends for load flow calculation, whereas the fault current mode acts as if the current source is connected to both ends as shown in Figure 1 [24].
The three-phase fault current is calculated as the sum of the system Thevenin impedance of the fault point and the fault impedance formed between the fault point and the ground divided by the voltage that was applied just before the fault occurred. In other words, it is represented by a model in which an open circuit voltage source having a voltage applied to a point just before a failure of a short circuit formed at the time of failure is connected as in Equation (1):
I f a u l t n = V p r e f a u l t n Z T h n + Z f a u l t n ,
in which
  • I f a u l t n is a fault current at the fault point n;
  • V p r e f a u l t n is a pre-fault voltage at the fault point n;
  • Z T h n is a thevenin impedance at the fault point n; and
  • Z f a u l t n is a fault impedance at the fault point n;
In Equation (1), V p r e f a u l t n and Z f a u l t n cannot be controlled arbitrarily, and when the AC line is replaced with BTB HVDC, Z T h n can be controlled according to the position. Studies have been conducted to find the position of HVDC to reduce the fault current caused by the increase of Z T h n . In this paper, using the HVDC decision algorithm defined in [23], the HVDC placement is chosen. Although it is possible to use the location selection criteria to reduce the fault current of the entire system or to reduce the number of fault current exceeding points, the location of HVDC is selected based on the fault current reduction of the most severe buses.

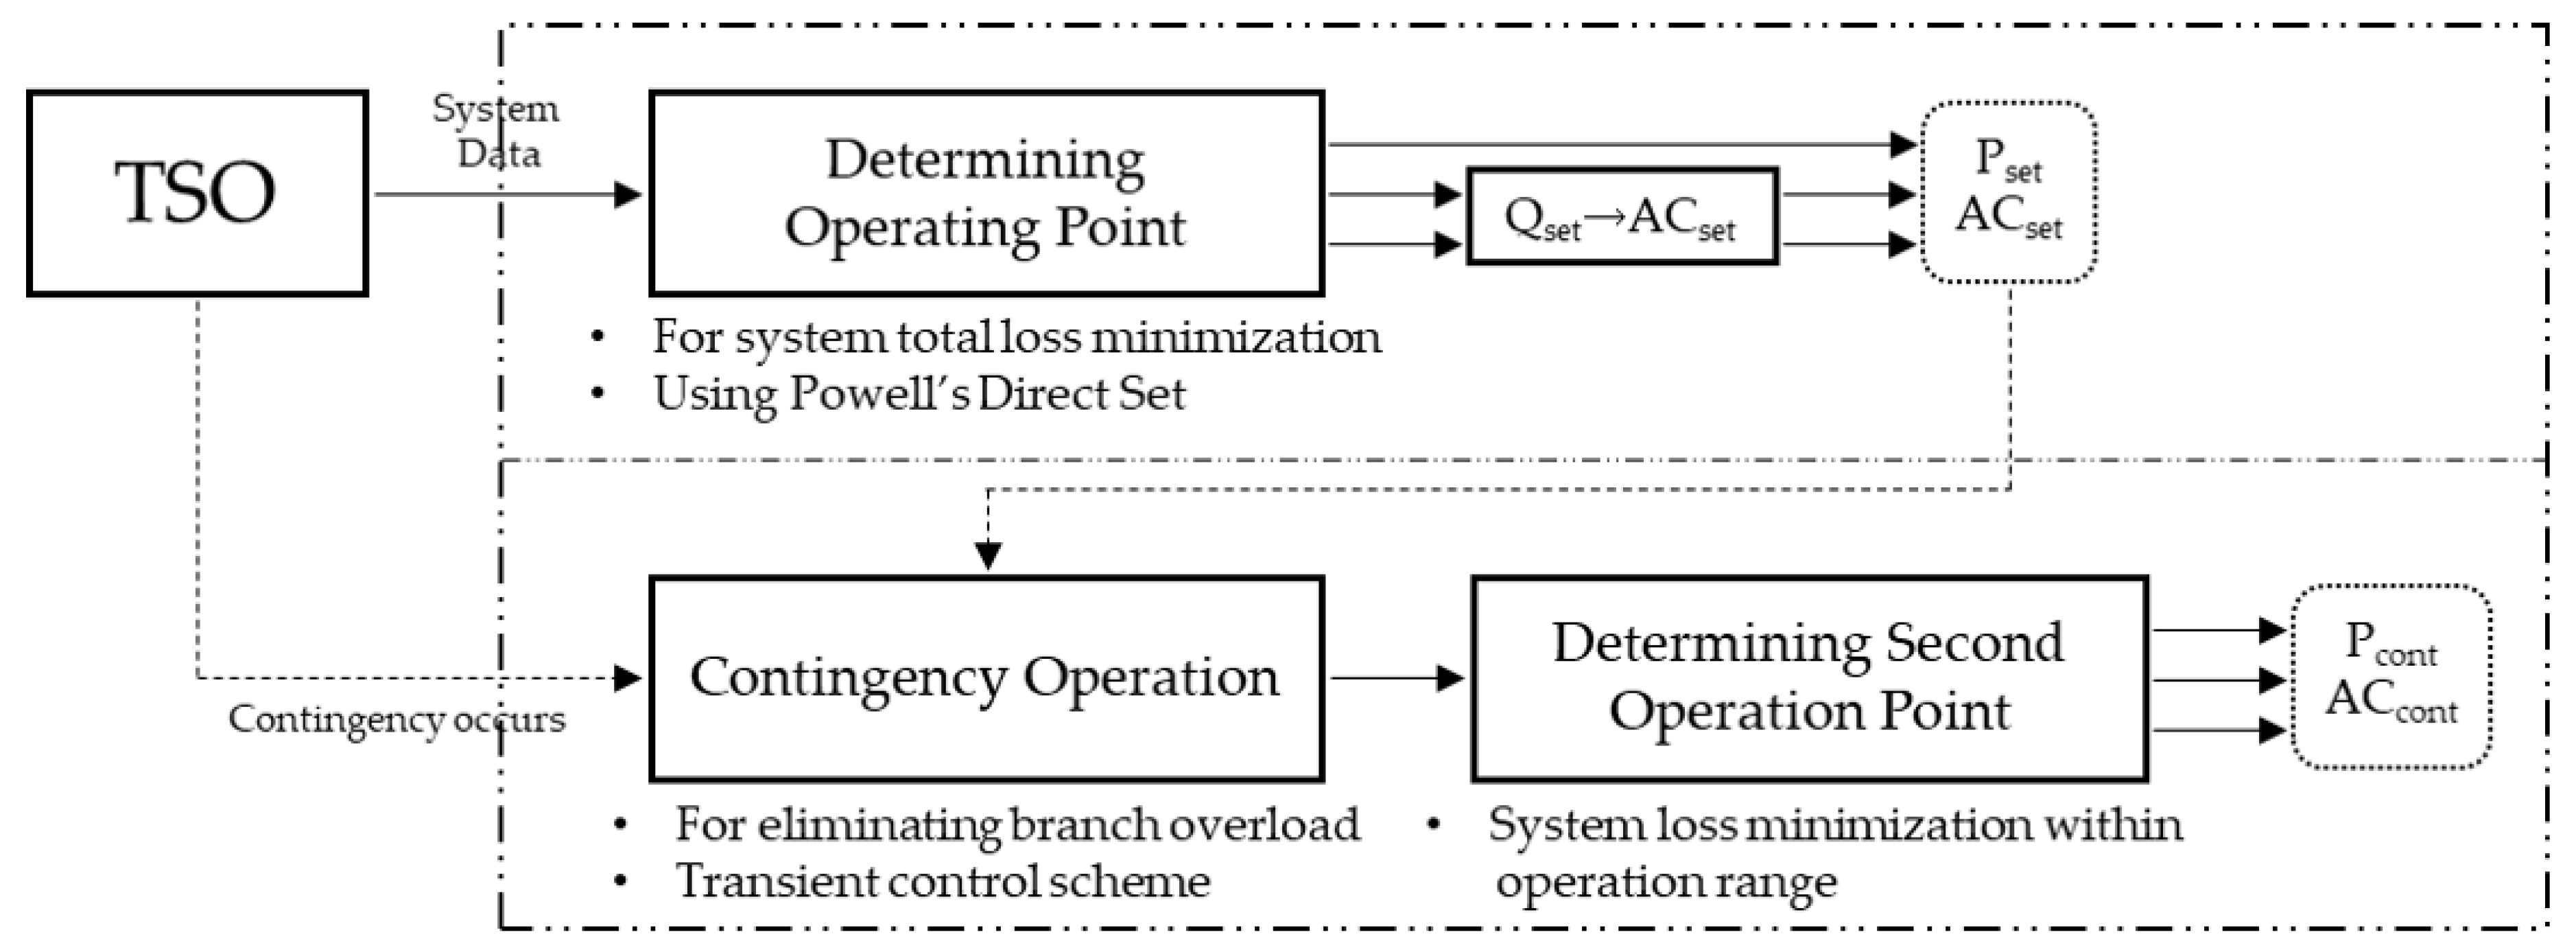
2.3. Proposed Control Scheme

Figure 2 briefly shows a block diagram of the BTB HVDC operating strategy proposed in this paper. The proposed HVDC operating point decision method can be divided into two major components. The first is the operating point in the steady state. It is the point that can minimize the loss of the entire system within the range of the system reliability criterion. In order to minimize the system total losses, AC voltage control at both ends of the HVDC is performed for proper reactive power output as well as active power control. The second is the operation strategy of HVDC at the time of disturbance occurrence. Unlike AC systems, HVDC produces a constant output regardless of system conditions without special control. This feature can cause overloads on other branches and can also have a detrimental effect in terms of losses, so an emergency control strategy of embedded HVDC is essential. In case of the emergency control, the operation point is changed to the range which eliminates the overload of the branches, and then the point is controlled to the operation point which can minimize the total losses at that system condition.

3. Determination of Embedded HVDC Operation Point

3.1. System Total-Loss Minimization (STLM) Control

In this paper, we consider the following points when determining the HVDC operating point at steady-state. After setting the constraints on each point, the optimum operating point of the embedded HVDC is calculated using the optimization method.
  • System total-loss minimization
  • Voltage criteria
  • Branch overloads

3.1.1. System Total-Loss Minimization

The most important factor that affects the determination of the operating point is the minimization of the total loss of the system. The most important advantage of VSC HVDC is independent control of active power and reactive power, which can be used to change the direction of the system’s power flow, leading to a change in system losses. Therefore, in this study, we decided on the operating point that minimizes the system’s total loss within the capacity of HVDC. The system’s total loss means the sum of the existing AC loss and HVDC loss.
P l o s s , t o t a l = n l P l o s s , A C + n l , D C ( P l o s s , D C + P l o s s , c o n v ) = n l P r ,   A C 2 + Q r 2 V r , A C 2 , R A C + n l , D C ( P r ,   D C 2 V r , D C 2 , R D C + ( P r , D C + P s , D C ) , λ )
in which
  • P l o s s , t o t a l 
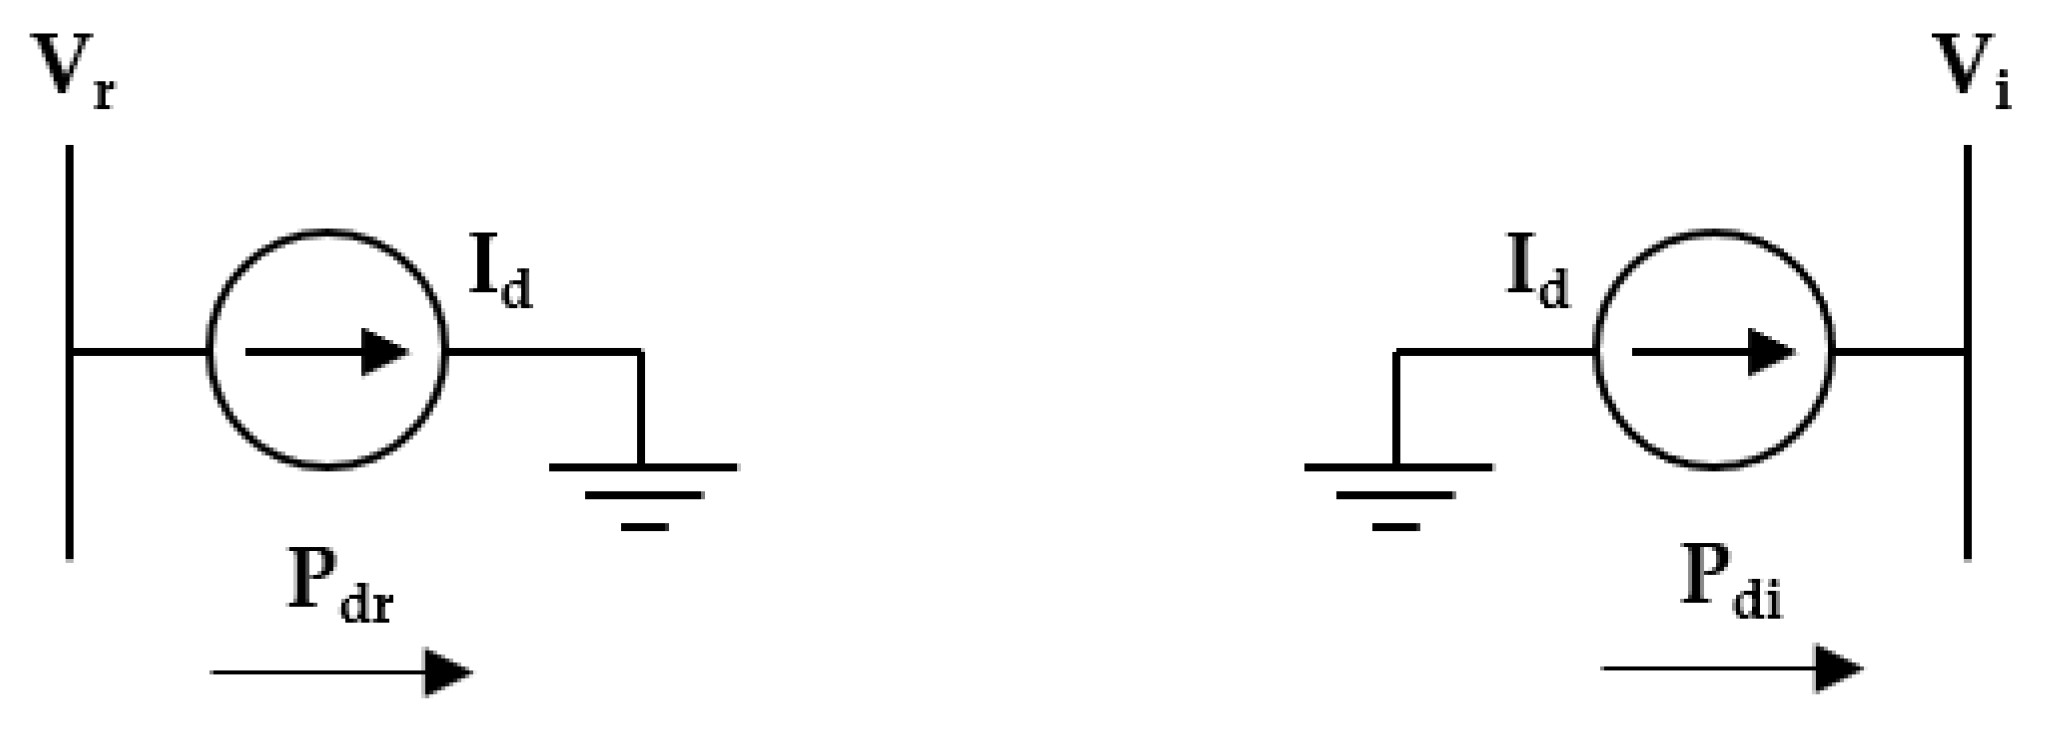
is the system total loss;
  • P l o s s , A C is the AC system loss;
  • P l o s s , D C is the HVDC line loss;
  • P l o s s , c o n v is the HVDC conversion loss;
  • P r ,   A C ,   P r , D C are the AC/DC line flow active powers at the receiving end;
  • P s , D C is the DC line flow active powers at the sending end;
  • Q r is the AC line flow reactive powers at the receiving end;
  • V r , A C ,   V r , D C are the AC/DC voltage at the receiving end;
  • R A C ,   R D C are the resistance values of the AC/DC line; and
  • λ is the loss rate of the converter.
The VSC DC losses have been decreasing over the years because of the application of Modular Multi-Level Converter (MMC) topology and optimization of switching logic. For example, the HVDC VSC loss of the fourth-generation technology is now comparable with the HVDC LCC (“Classic”) technology [25,26]. In this paper, conversion loss is considered to be 0.9% of the active power setpoint per converter, but the value of the technology can be lowered according to development.
In addition, since BTB HVDC has no line loss, the DC related losses did not include the DC line loss, but only the conversion loss of the converter, which has a big influence on the loss reduction of the entire system. Therefore, Equation (2) is simplified as in Equation (3), and from the viewpoint of loss reduction, the conversion loss of BTB HVDC can greatly influence the numerical value of the entire system. At this time, since the converter and the inverter are at the same position, it is assumed that P r , D C = P s , D C .
Minimize   P l o s s , t o t a l = n l P r ,   A C 2 + Q r 2 V r , A C 2 , R A C + n l , D C 2 , P r , D C , λ .

3.1.2. Voltage Criteria

The active/reactive power control of the BTB VSC HVDC can have a significant effect on the voltage of the near buses. Generally, embedded HVDC operates in AC voltage control mode. However, in this paper, we decided on the proper operating point in the reactive power setpoint control mode to maximize loss reduction and operate in AC voltage control mode to maintain the operating point.
V i _ V i V i ¯
in which
  • V i _ ,   V i ¯ is the minimum/maximum voltage at bus i; and
  • V i is voltage at bus i.

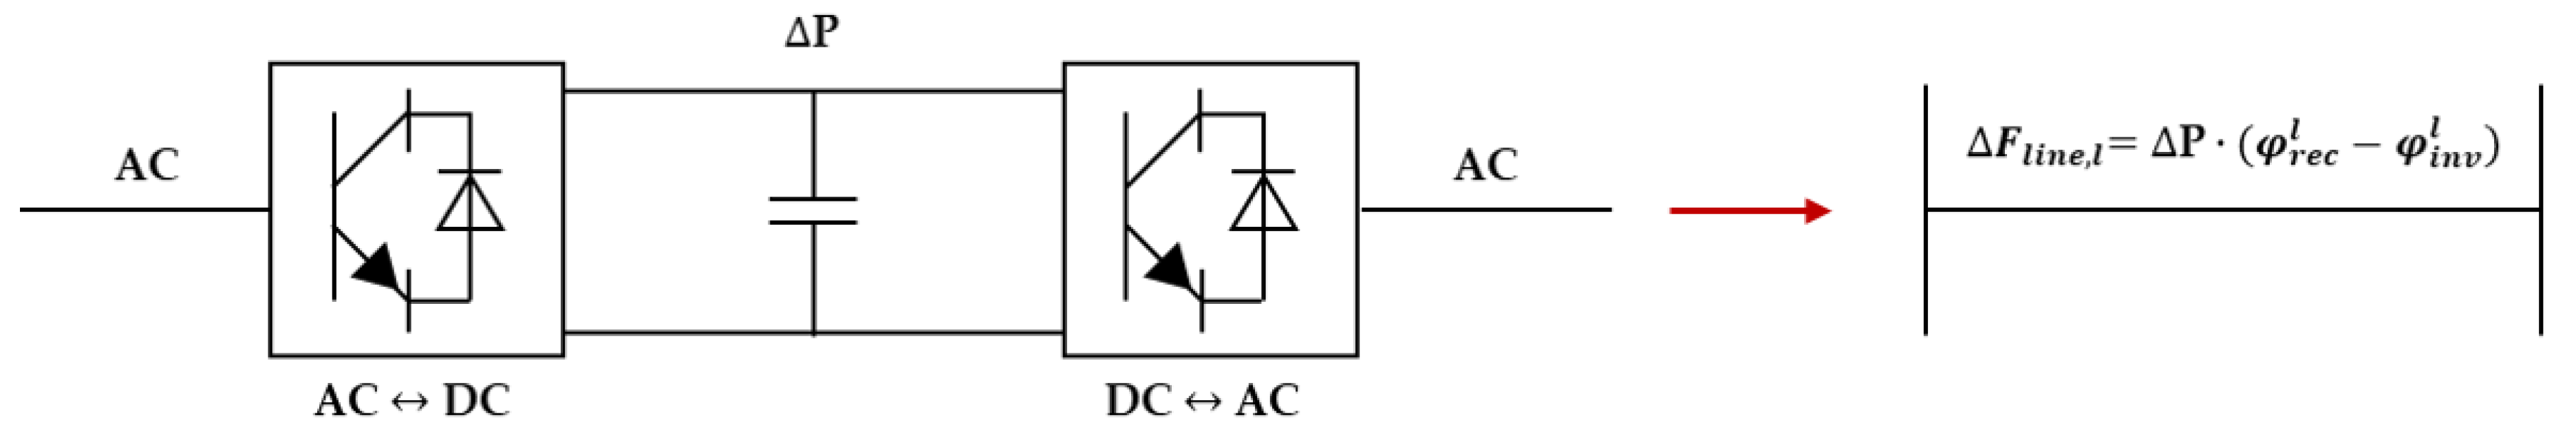
3.1.3. Line Overload

The active/reactive power control of HVDC also affects the power flow of nearby lines. In this paper, we restrict the operation of BTB VSC HVDC so that overloads do not occur on other lines in the steady state.
F l i n e , l _ F l i n e , l F l i n e , l ¯
in which
  • F l i n e , l _ ,   F l i n e , l ¯ is the minimum/maximum power flow on line l; and
  • F l i n e , l is power flow on line l.
The change of the BTB VSC HVDC operating point has a significant effect on some lines, but not all lines. Monitoring the overload of all the lines depending on the system conditions is a burden of communication. Therefore, it is necessary not to observe all the lines, but to find lines that are sensitive to the operation of the HVDC. At this time, the bus lines to be observed are chosen using the PTDF described in [27,28,29]. PTDF is an index of line sensitivity based on the DC power flow model, and it is easy to analyze system reconfiguration and installation of DC facilities. When the power to the specific bus changes, it is possible to determine the sensitivity of the lines by indicating the influence of the power flow change on the lines. The PTDF is expressed as shown in Equation (6).
φ m l = Δ F l Δ P m
in which
  • φ m l is the PTDF of line l with respect to bus m;
  • Δ F l is the amount of the power flow change in line l; and
  • Δ P m is the amount of the power change injected for bus m.
The AC line sensitivity caused by HVDC can be represented by the PTDF values at both ends and capacity of the HVDC as shown in Figure 3. For the HVDC operation, PTDF values at both ends of the HVDC are similar for the AC lines where the power change is not large (low sensitivity); and in the opposite case, the difference between the PTDF values is large, and the result of Equation (7) is large too. Equation (7) is obtained by multiplying the difference of the PTDF values at the end of the HVDC for any AC line by the capacity of the HVDC, and it predicts the maximum value that can be reached in the AC line when the operation of the HVDC is maximized. The obtained value can be compared with the reference value of each line to decide whether to consider the AC line in the monitoring line or not. The reference value is obtained by weighting the capacity of each line as shown in Equation (8). In Equation (8), W affects the number of monitoring lines. The larger the W value, the smaller the number of monitoring lines, and the smaller the value of W, the larger the number of monitoring lines. Therefore, even when the W value is large, the branches determined as the monitoring line can be regarded as a line that is highly influenced by the HVDC operation. On the contrary, when W is controlled to a lower value, relatively less sensitive lines are considered as monitoring branches, so that it is possible to operate the system in detail, but it can be a heavy burden for HVDC operators. The system operator should carefully determine the W value according to the purpose and convenience.
M n o r m a l l = 2 P c a p , ( φ r e c l φ i n v l ) ,
M r e f l = S M V A l × W ,
i f     M n o r m a l l     M r e f l   :   Choose   line   l   as   monitoring   line ,
  • Δ F l i n e , l is the power flow change of line l by HVDC control
  • M n o r m a l l is the maximum variation of line l;
  • M r e f l is the reference value of line l;
  • P c a p is the active power capacity of the HVDC;
  • φ r e c l is the PTDF of line l with respect to the rectifier end;
  • φ i n v l is the PTDF of line l with respect to the inverter end;
  • S M V A l is the capacity of line l; and
  • W is a weighting factor.
The monitoring lines determined using the PTDF should consider both normal and contingency conditions. Especially, in contingency, when the line is tripped after the accident, PTDF is calculated again, because the system topology changed. Therefore, it is necessary to pre-calculate the PTDF after the line is tripped for the main contingencies, and the sensitive lines should also be determined as the monitoring line.

3.1.4. Application of Three-Dimensional Powell’s Direct Set (3-PDS)

The operating point of the BTB VSC HVDC is found from the minimization of the total loss (Equation (3)), the voltage reference (Equation (4)), and the thermal limit (Equation (5)) as described above. In this paper, Powell Direct Set (PDS) theory was used in an optimization method to find the operating point [30]. The PDS method can directly search for optimum point, instead of using differential, and obtains the optimization point using its direction. Therefore, it is easy to apply and is not restricted by whether it can be differentiated [31,32].
Especially, VSC HVDC uses three-dimensional PDS because it has three controllable elements: { P ,   Q r e c , Q r e c } , that are independent of each other. In order to find the three-dimensional minimum point, we tried to find the operating point decision point of HVDC more easily by using 3-PDS instead of finding the differentiation point. The main steps to determine the point of operation using the 3-PDS method are shown as follows.
  • Set the initial point S 0 ( 1 ) and the independent directions used for initial searching ϵ . We set the values as S 0 ( 1 ) = ( 0 , 00 ) , ϵ = {   P   ,   Q r e c , Q i n v } .
  • A conjugate direction should be generated within each iteration.
    -
    Starting from S 0 ( k ) (k is the iteration number), sequentially search the directions in ϵ by finding the minimum.
    M i n   F o b j ( S i ( k ) ) = F o b j ( S i 1 ( k ) + δ Δ ϵ ) ,
    where δ is the step size.
    -
    A conjugate direction ϵ c o n j u . ( k ) is generated after searching down by
    ϵ c o n j u . ( k ) = S i ( k ) S 0 ( k ) .
  • Update the search direction ϵ by adding directions ϵ c o n j u . ( k ) to ϵ and replace the other direction. It is common to replace the first direction with a new ϵ c o n j u . ( k ) , but in this application, since the control of active power is much more influential than the control of reactive power in loss reduction, so the direction of active power (   P   ) is left and the new direction is updated. We can get ϵ = {   P   , ϵ c o n j u . ( k ) , ϵ c o n j u . ( k + 1 ) } .
  • Find the new optimal operation point S 0 ( k + 1 ) .
  • Convergence check.

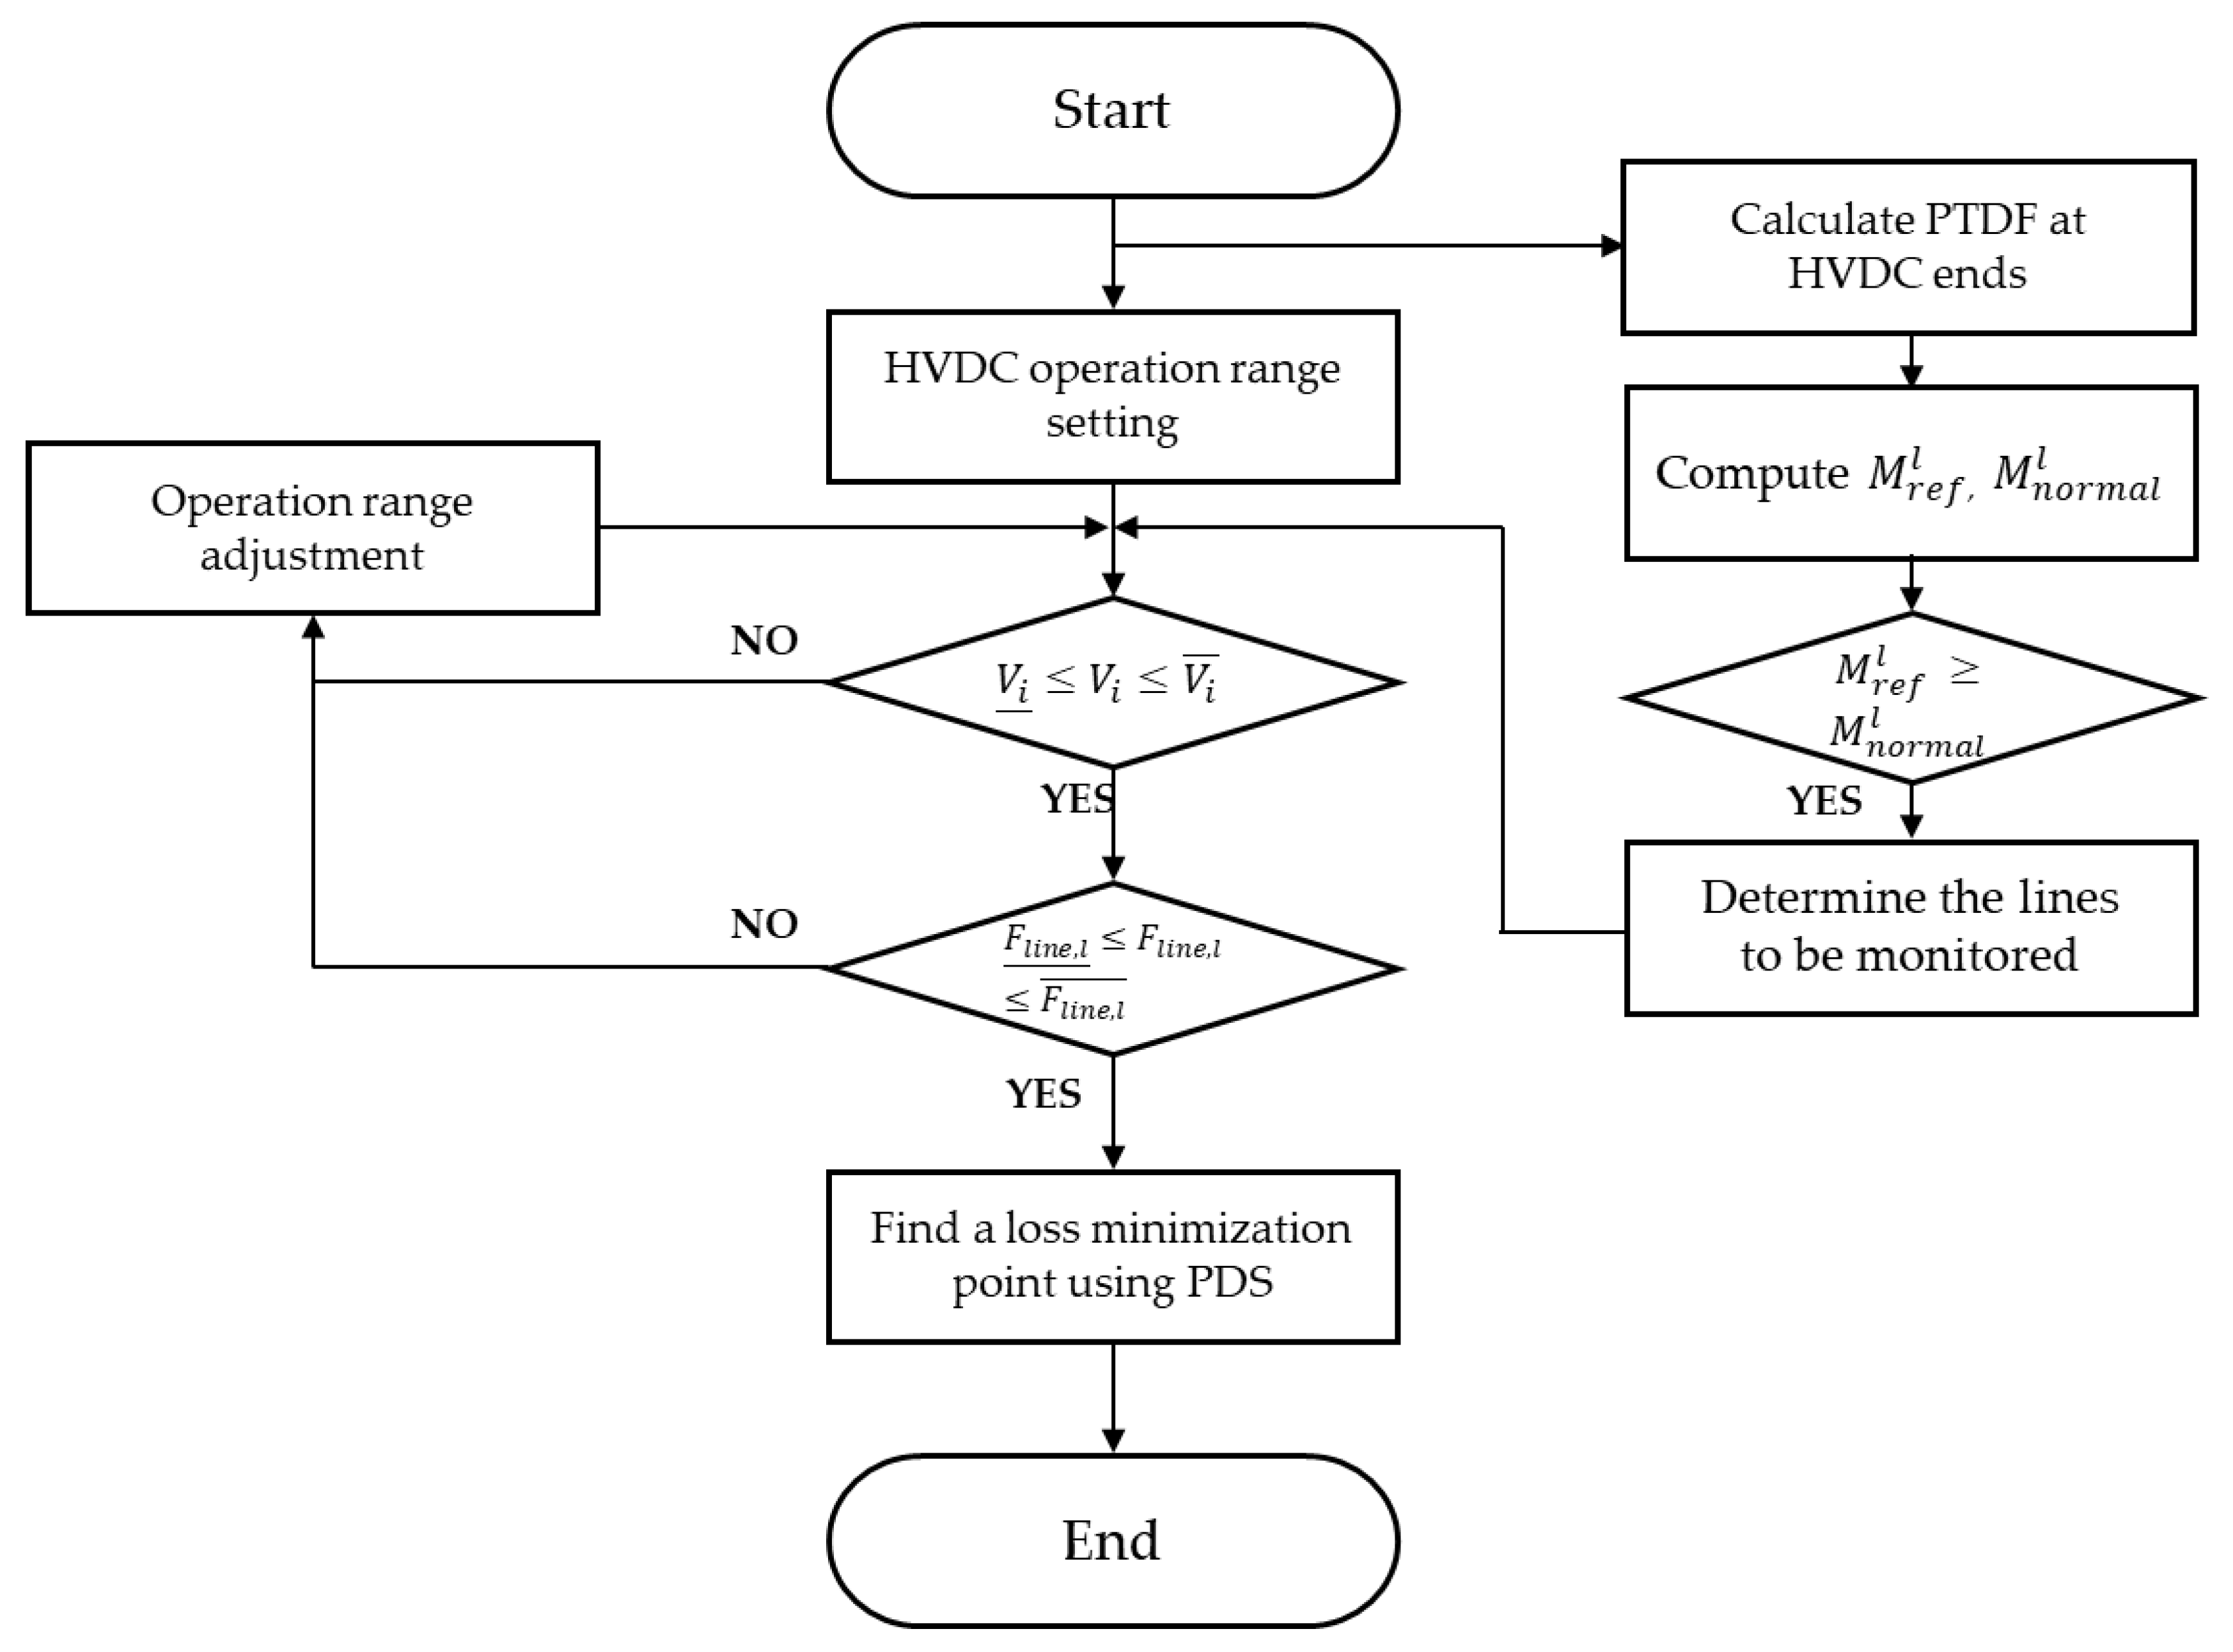
3.1.5. HVDC Operating Point with STLM Control

In this paper, the optimum operating point of HVDC is calculated by using Equations (4)–(9) as the constraint condition and Equation (3) as the objective function. Using the STLM control, we can establish the active/reactive power operation point of HVDC that minimizes total system loss by using the algorithm of Figure 4 and, in contingencies, apply other control strategies. The explanation of Figure 4 as follows.
  • The initial active/reactive power operation range is set with reference to the HVDC capacity.
  • The number of branches to be monitored could be reduced using PTDF. These represent branches where the amount of power flow varies greatly with HVDC operating point (Section 3.1.3).
  • The operating area should be adjusted so as not to deviate from the constraints. In the later operating point determination process, the operating range set here should not be exceeded.
  • The operation point that minimizes the system total loss is determined using the PDS. The active/reactive power output determined in this process are respectively input into the active power set value and the AC voltage set value.

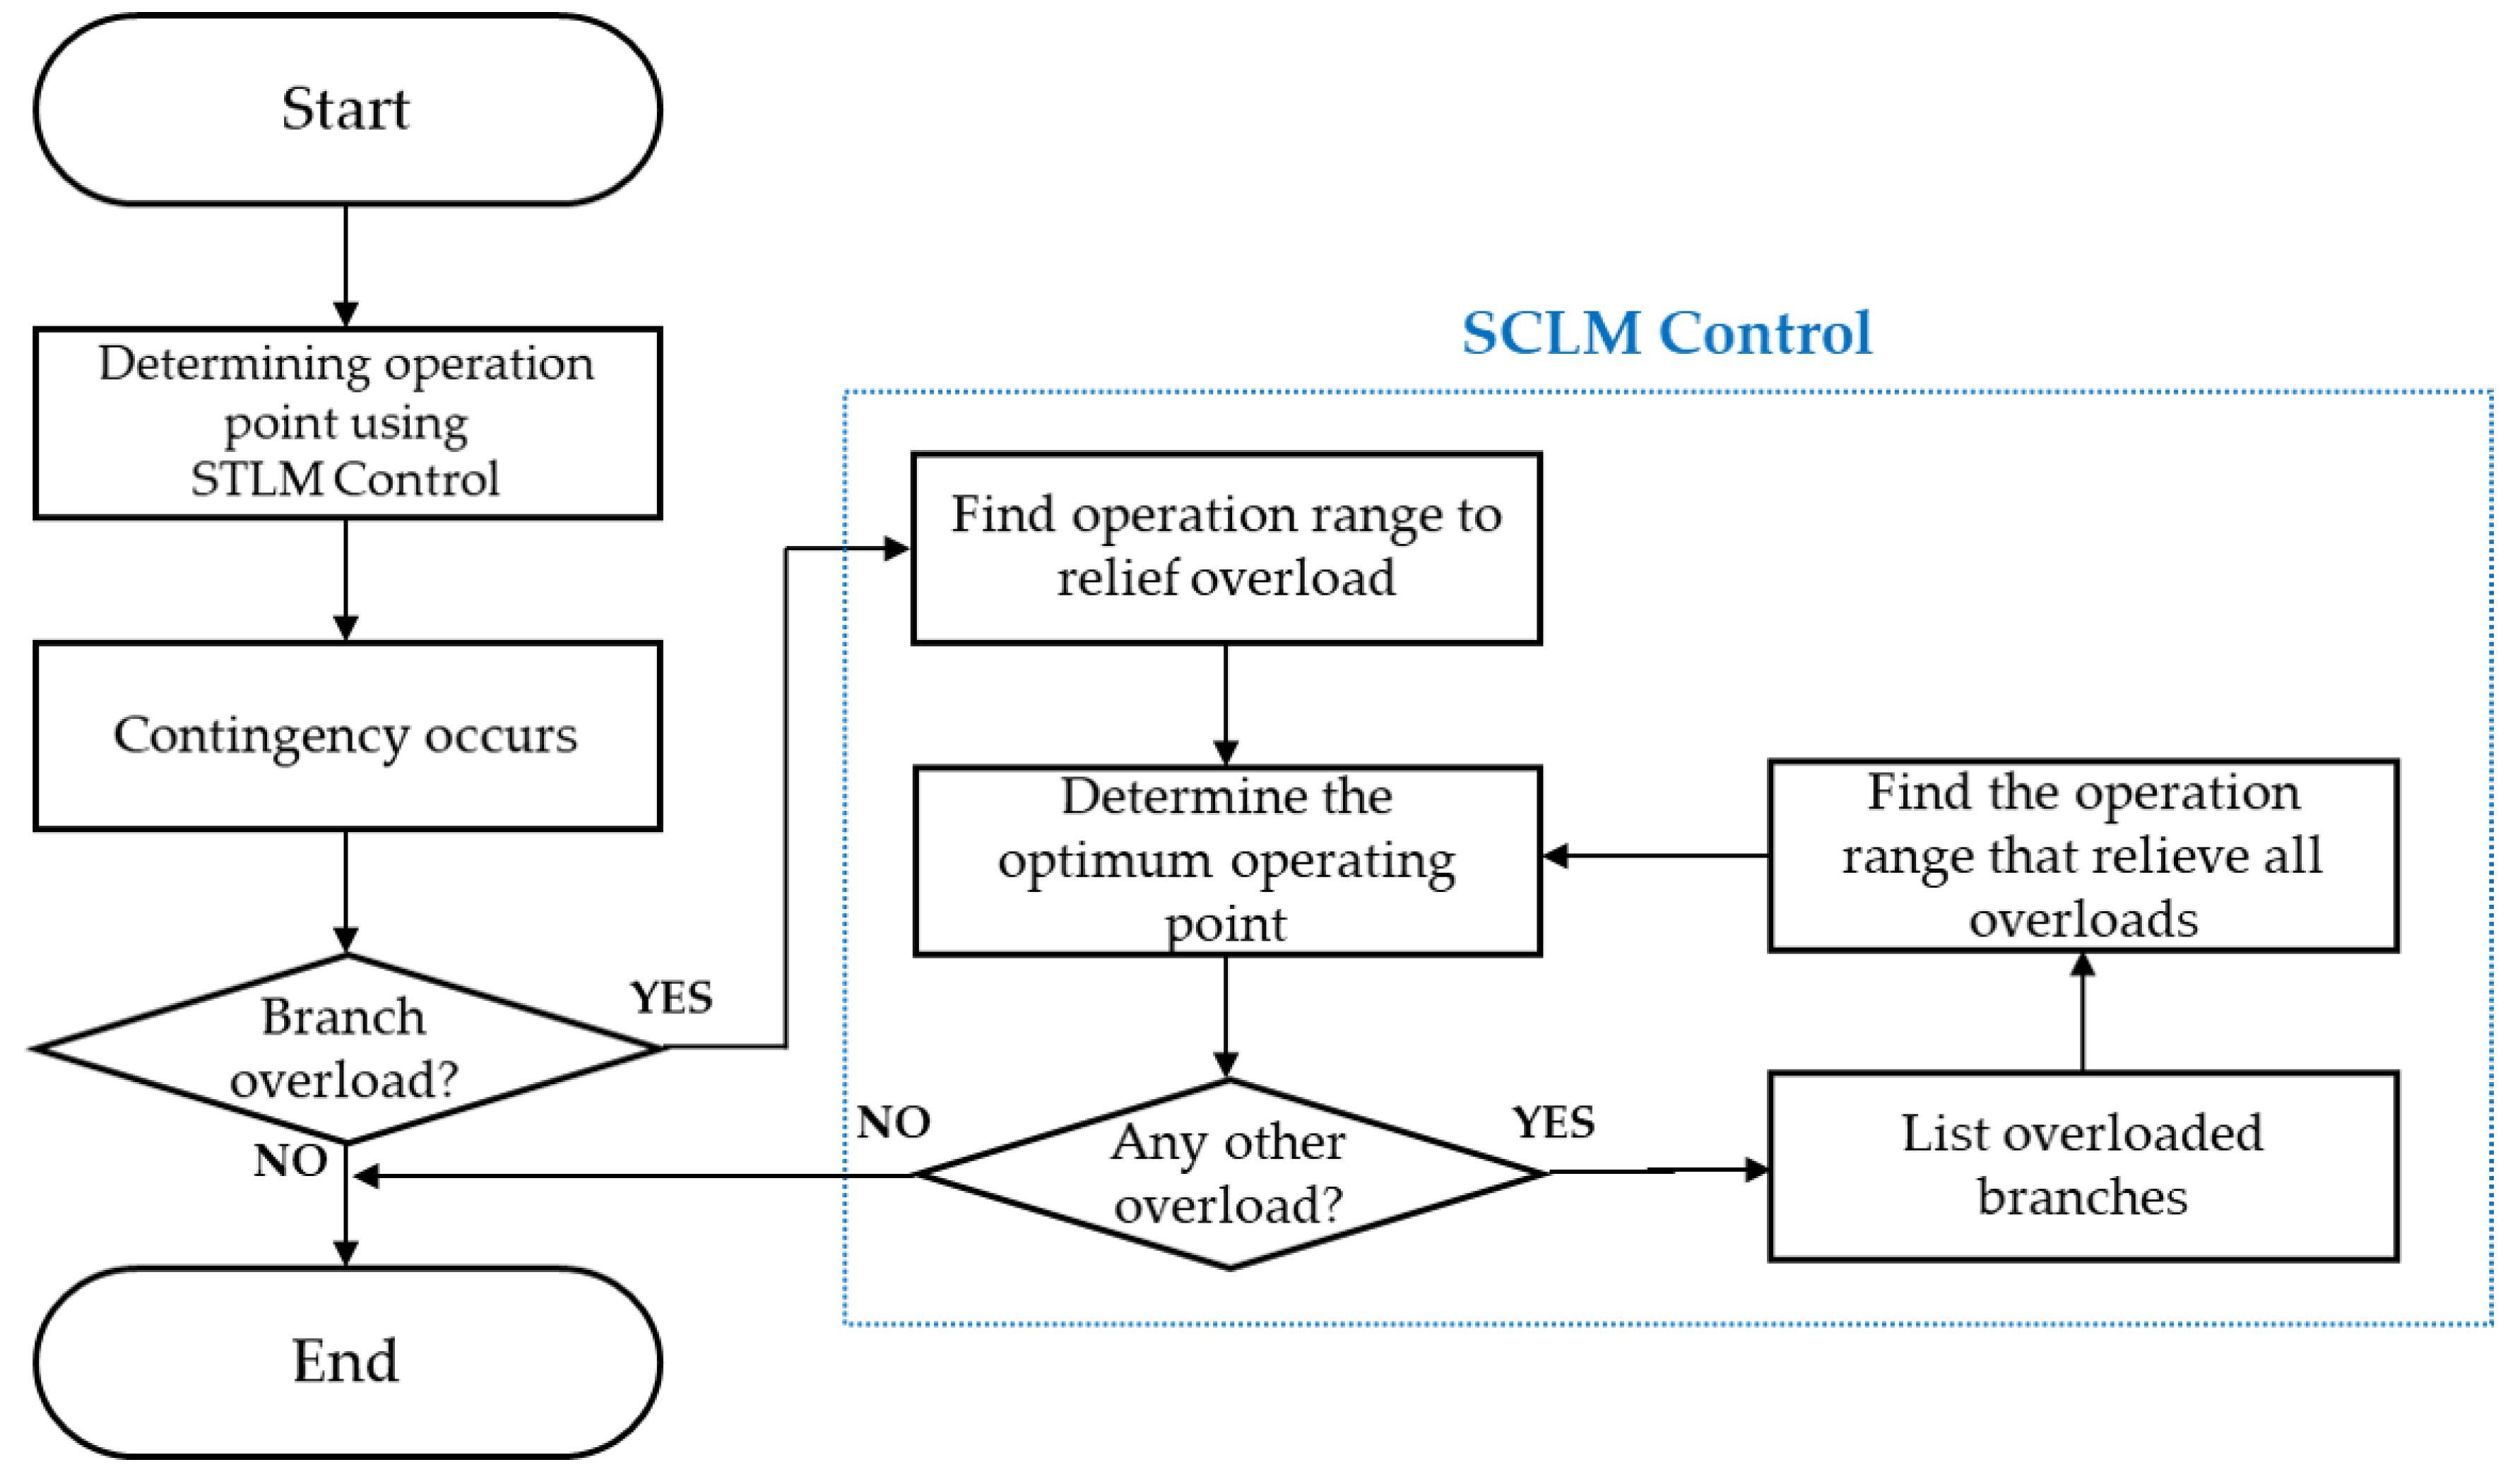
3.2. Security-Constrained Loss Minimization (SCLM) Control

When a disturbance occurs in the system, line and transformer overloads occur in the system. In order to eliminate the overloads, it is necessary to control the operating point of the HVDC, which is called a “security-constrained loss minimization (SCLM) control.” The action is as follows.
  • BTB VSC HVDC normally operates with the operating point calculated in Section 3.1.
  • In the event of a contingency, it detects the overloads of the other line and calculates the operation range where the overload of the line can be eliminated.
  • Within the previously determined operating area, a new operating point is calculated that minimizes losses and maintains system reliability.
  • At this time, it is necessary to check whether the other lines are overloaded at the determined operating point. If there are overloads of other lines, an optimum operating point should be found in the operating area where the overloads of the line are eliminated.
Figure 5 shows an algorithm of the SCLM control in the event of a contingency.

4. Case Study

4.1. System Information

For case studies, we used the Korean metropolitan power system in 2021, the features of which are as follows.
  • The load in the metropolitan area is about 40% of the total load, and a large amount of power is supplied from the non-metropolitan area.
  • In order to improve the system stability, it is configured as a looped system, and thereby the problem of fault current is serious.
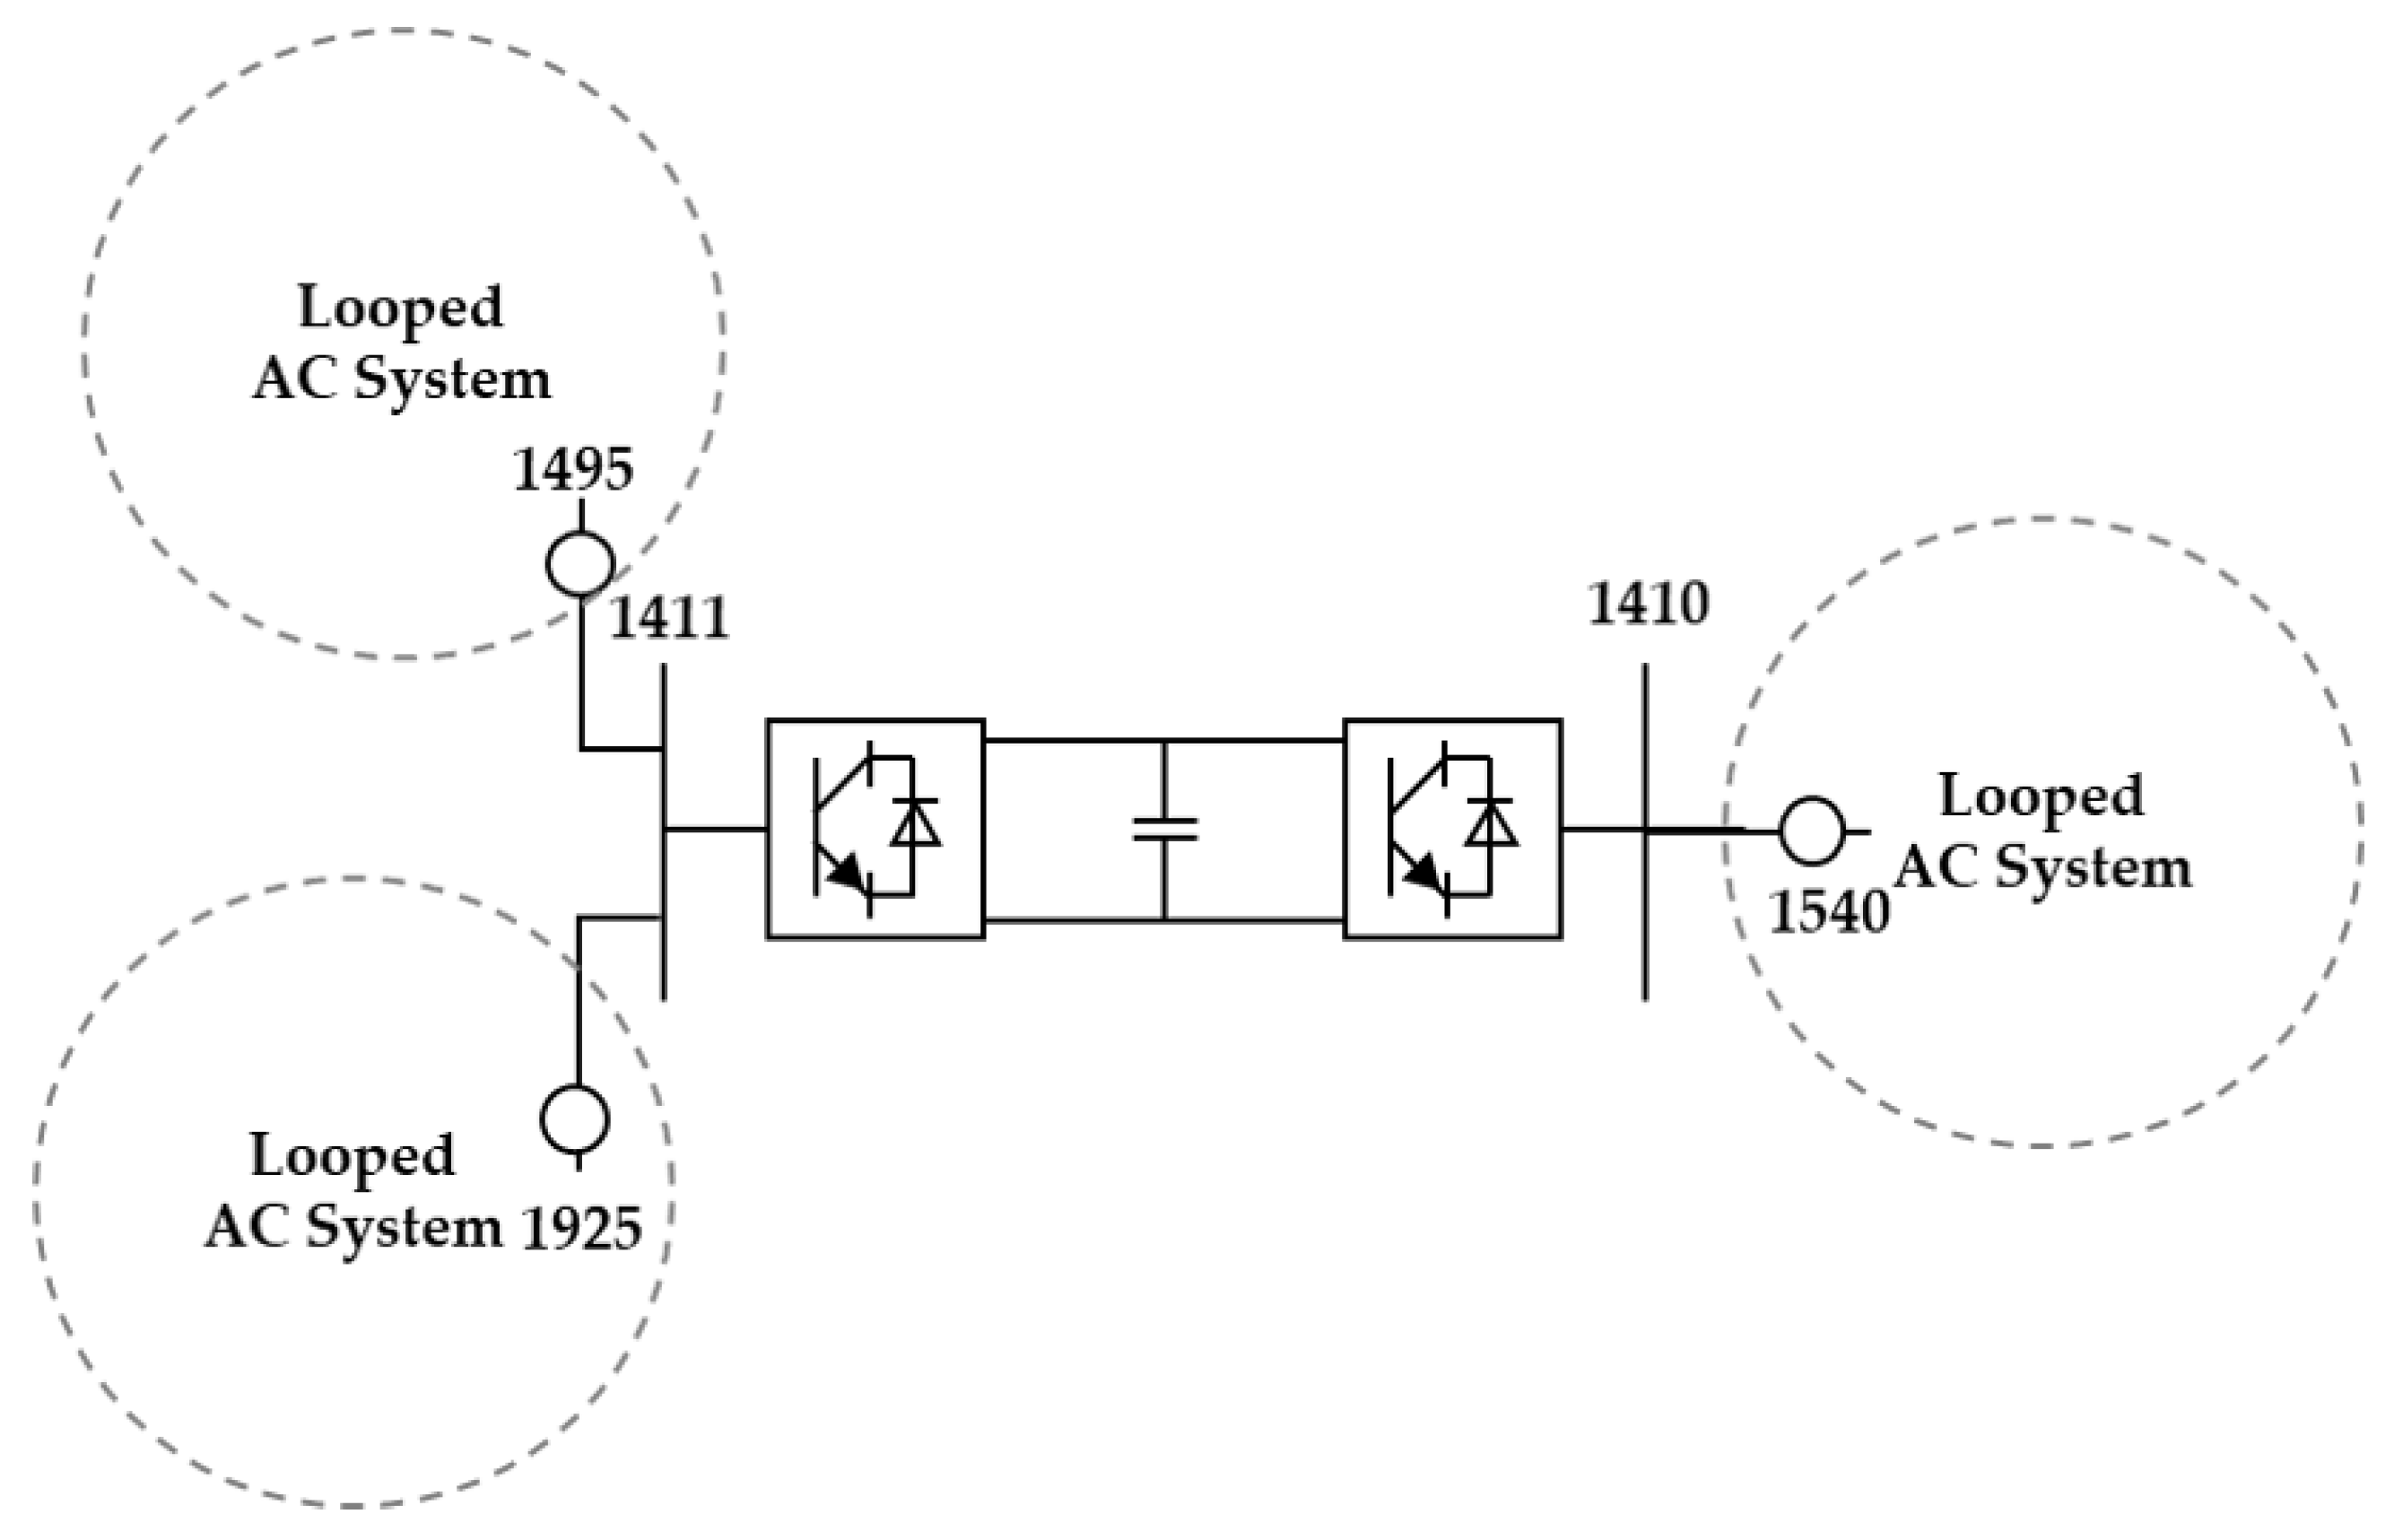
  • The 154kV Yangju bus (1410) will be separated and connected to VSC BTB HVDC to solve the fault current problems in the metropolitan area and to improve system stability.
  • Detailed information on the system is shown in Table 2; detailed specifications and system configuration of HVDC are shown in Table 3 and Figure 6.

4.2. BTB VSC HVDC Siting for Fault Current Reduction

The site of the BTB VSC HVDC is selected to solve the fault current problem in the Korean metropolitan area and its effect is shown in Table 4. With the BTB VSC HVDC, there is only one bus, bus 1200, at which the fault current is above the 50 kA limit, whereas without the BTB VSC HVDC, there are multiple buses at which fault currents are above the 50 kA limit. The benefit of the BTB VSC HVDC for reducing the fault current is demonstrated.

4.3. STLM Strategy in Normal Condition

Before determining the operating point in normal operation, Equations (7)–(9) were applied to reduce the number of observed branches to be considered in the overload constraint. The active power capacity P c a p is 400 MW, weighting factor W is 0.3, and other necessary values were applied using Korean power system data. The monitoring branches determined using Equations (7)–(9) are in Appendix A.
To apply the STLM strategy, the initial conditions must be found. The initial conditions of this case study are as follows.
  • Initial operating point S 0 ( 1 ) : (0, 0, 0),
  • Independent directions used for initial searching ϵ = { P ,   Q r e c , Q i n v } ,
  • Step size δ = 1 .
The loss reduction from the operating point found by using the STLM can be seen in Table 5 and Table 6. For the case when the HVDC is in operation, we compared the losses for (1) the case where the STLM strategy is applied and (2) the case where the operating condition is applied to the amount of power flow in the existing AC line without applying the STLM. The HVDC operating point in the case of “with HVDC (AC flow)” does not have a special strategy, and the operating point is determined based on the power flow through the AC line when there is no HVDC (when connected to the AC line instead of the separation between buses). More than 400 MW of power flowed to the AC line before the bus separation, and 200 MW × 2 was selected as the operation point according to the HVDC rating limit. When the STLM is applied, the system losses are the least and the technology of the conversion loss of the converter further develops, and the economy caused by the reduction of the loss can be improved. Additionally, at the operating point obtained by applying the STLM strategy, there are no overload lines, and the maximum/minimum voltage of the system is 1.060/0.984 at the 154 kV level, and 1.039/0.995 at the 345 kV level. These values meet the system overload and voltage criteria described in Table 2.

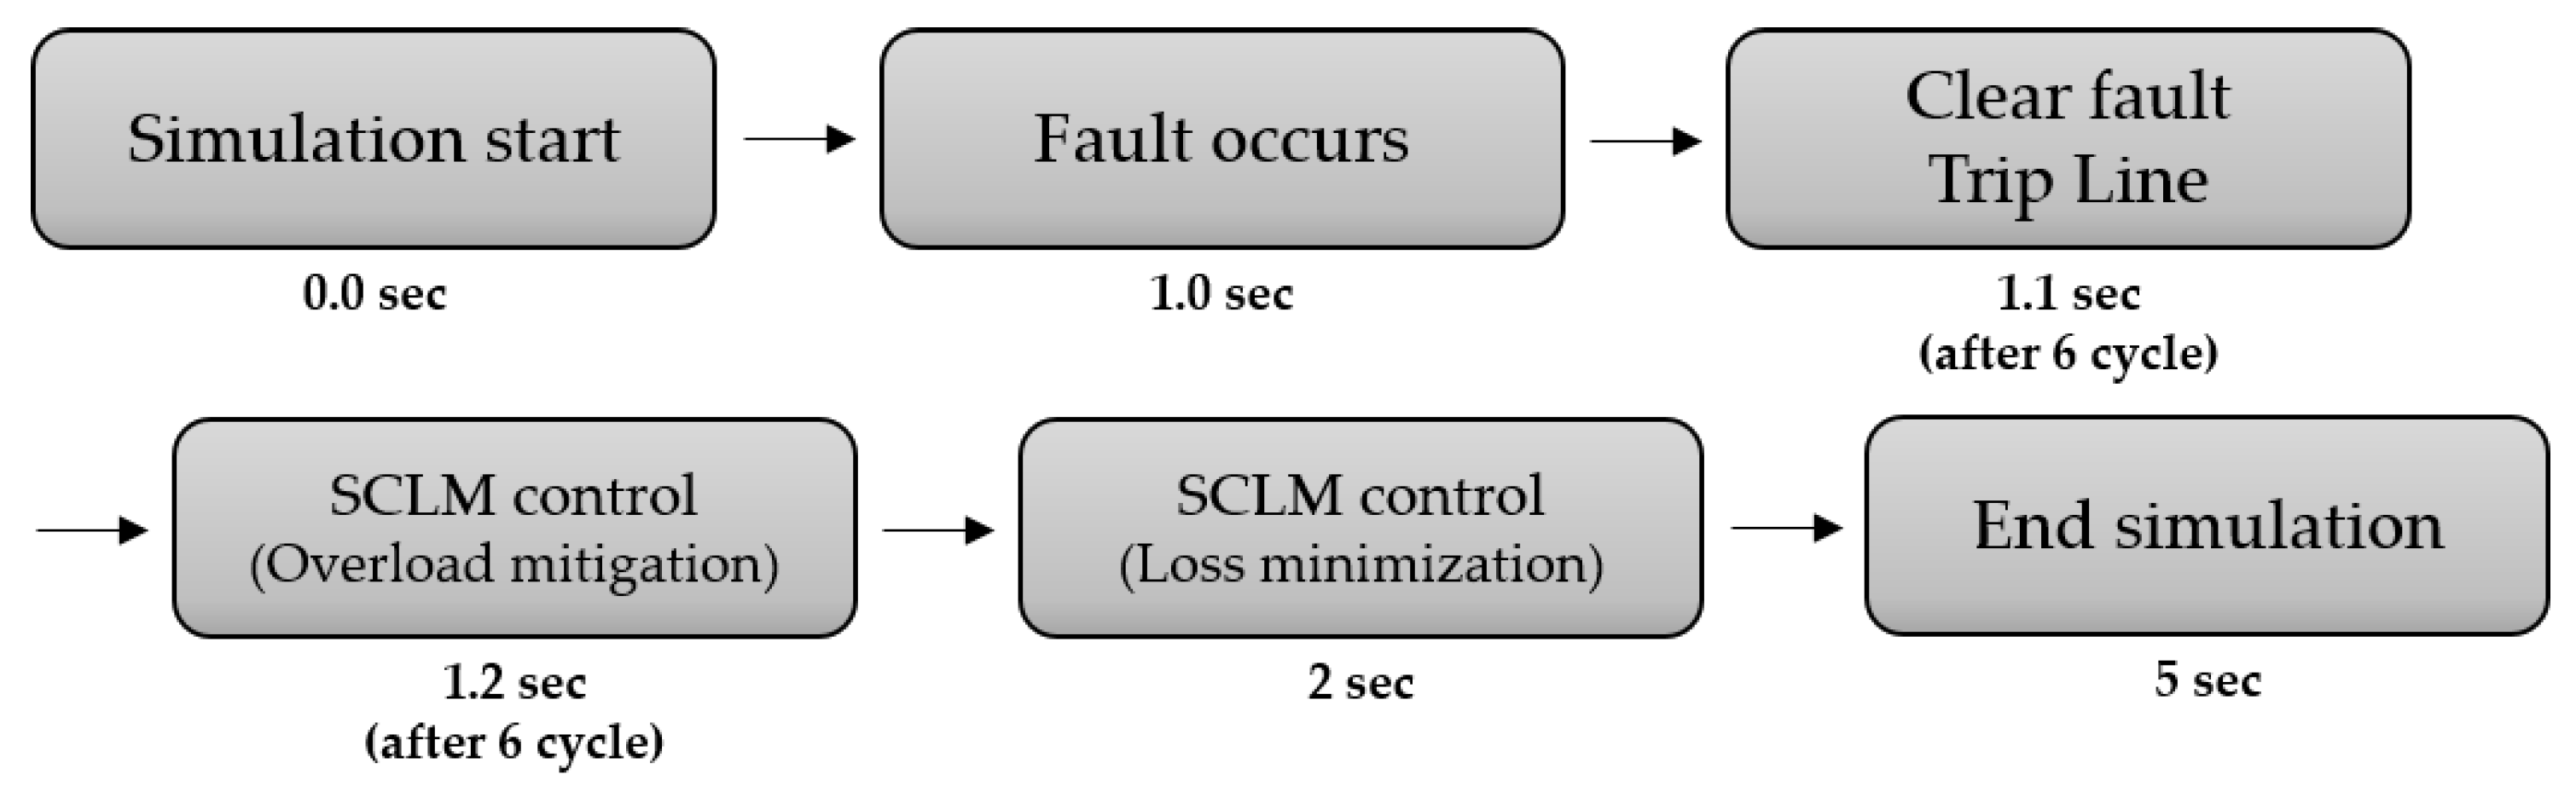
4.4. SCLM Control in Transient Condition

An example of the SCLM control for an overload condition that causes N-1 failures in a given system is shown. The transformer overload (over 100%) and the line overload (over 120%) are shown as examples. The simulation proceeds as shown in Figure 7. A fault occurred in 1 s; after six cycles (0.1 s) clear fault, trip line; six cycles later, the HVDC operating point was changed for branch overloads. In this process, fast operation is required to solve the thermal limit, so only active power control is used and the AC voltage control setpoint does not change. In addition, the operation point was changed again for loss minimization after 1 s from the failure occurrence.
In order to verify the effect of the SCLM control, this paper compares the results of conventional control, RAS control, and the proposed control. In conventional control, regardless of the disturbance, the active power and AC voltage setpoint of the HVDC are constant [33]. Therefore, it may not respond to disturbance, and overload and overvoltage may occur. In this case, the overload condition is maintained, and the transformer is in trouble. In the RAS control, as in the literature reviews, the operating point of the HVDC changes for system stabilization [6,7,8,9,10,11,12,13,14,15,16]. Using the control, the system instability is solved by the active power control, but the AC voltage setpoint is constant without control. Similar to RAS control, the SCLM control solves the overload problem with active power change, and then uses the STLM control to determine the operating point after a contingency. In this case, the operation point is changed first, and in the SCLM control considering the loss minimization, it can be confirmed that the operation point is changed secondarily.

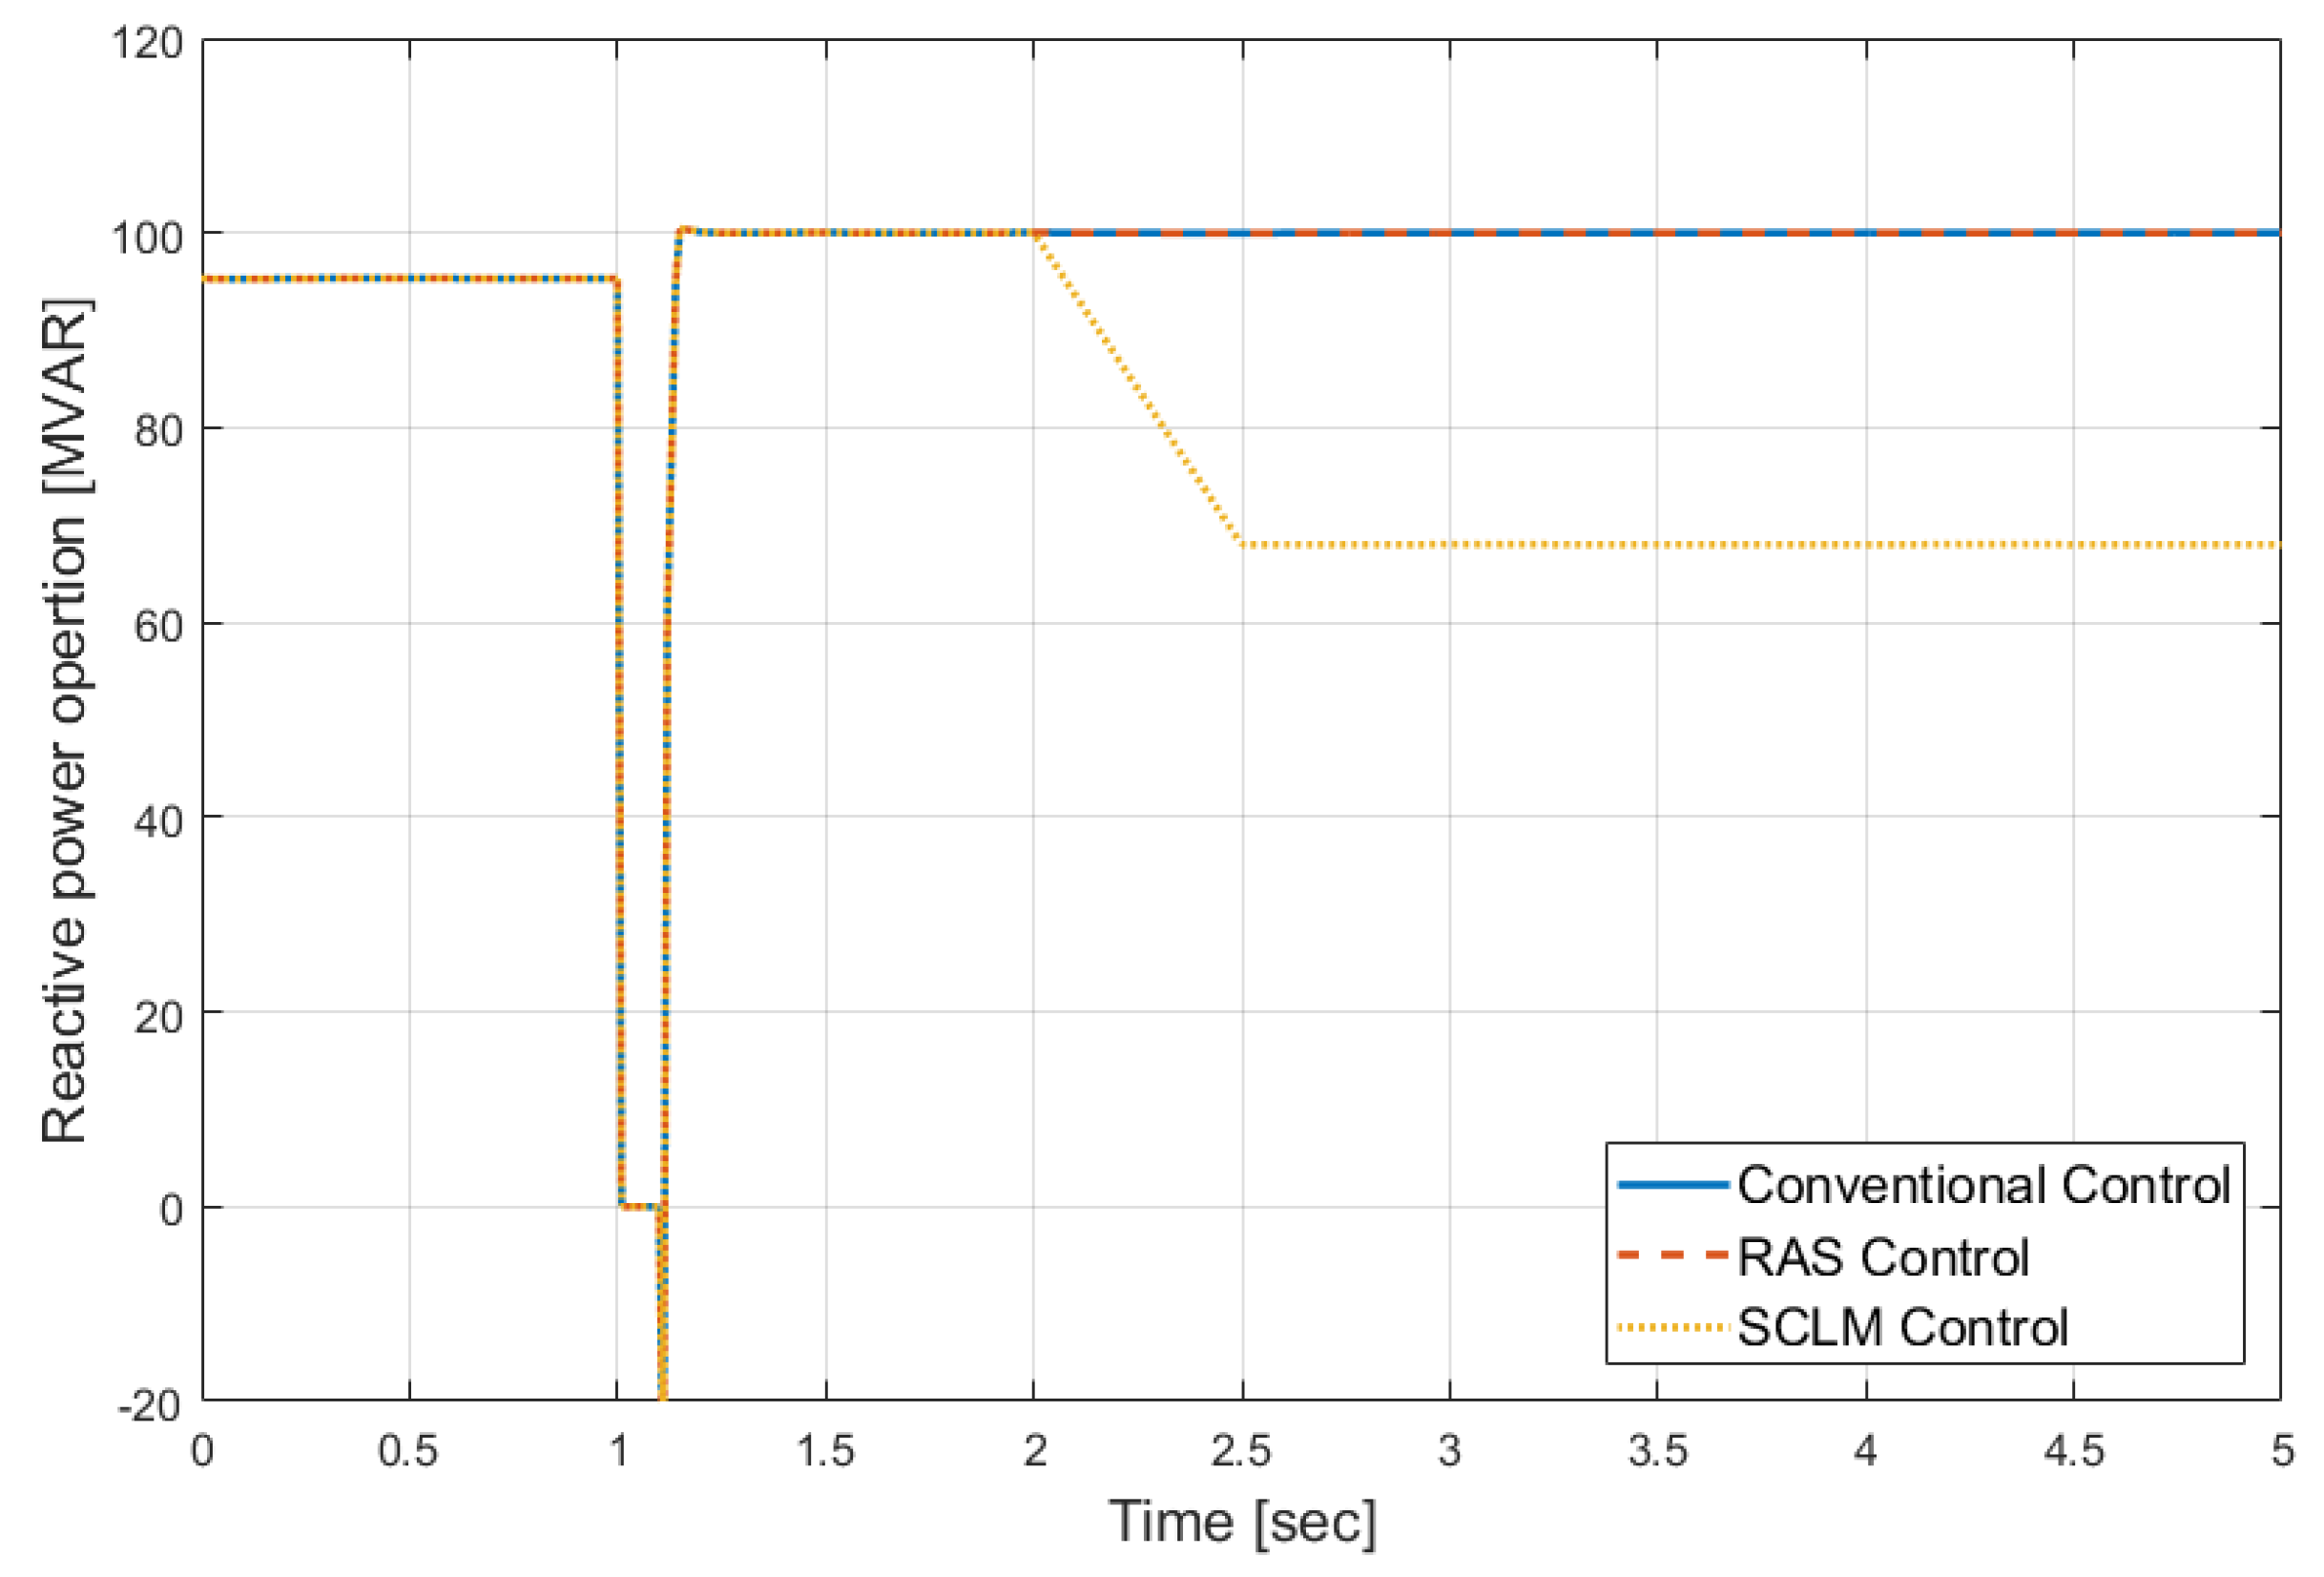
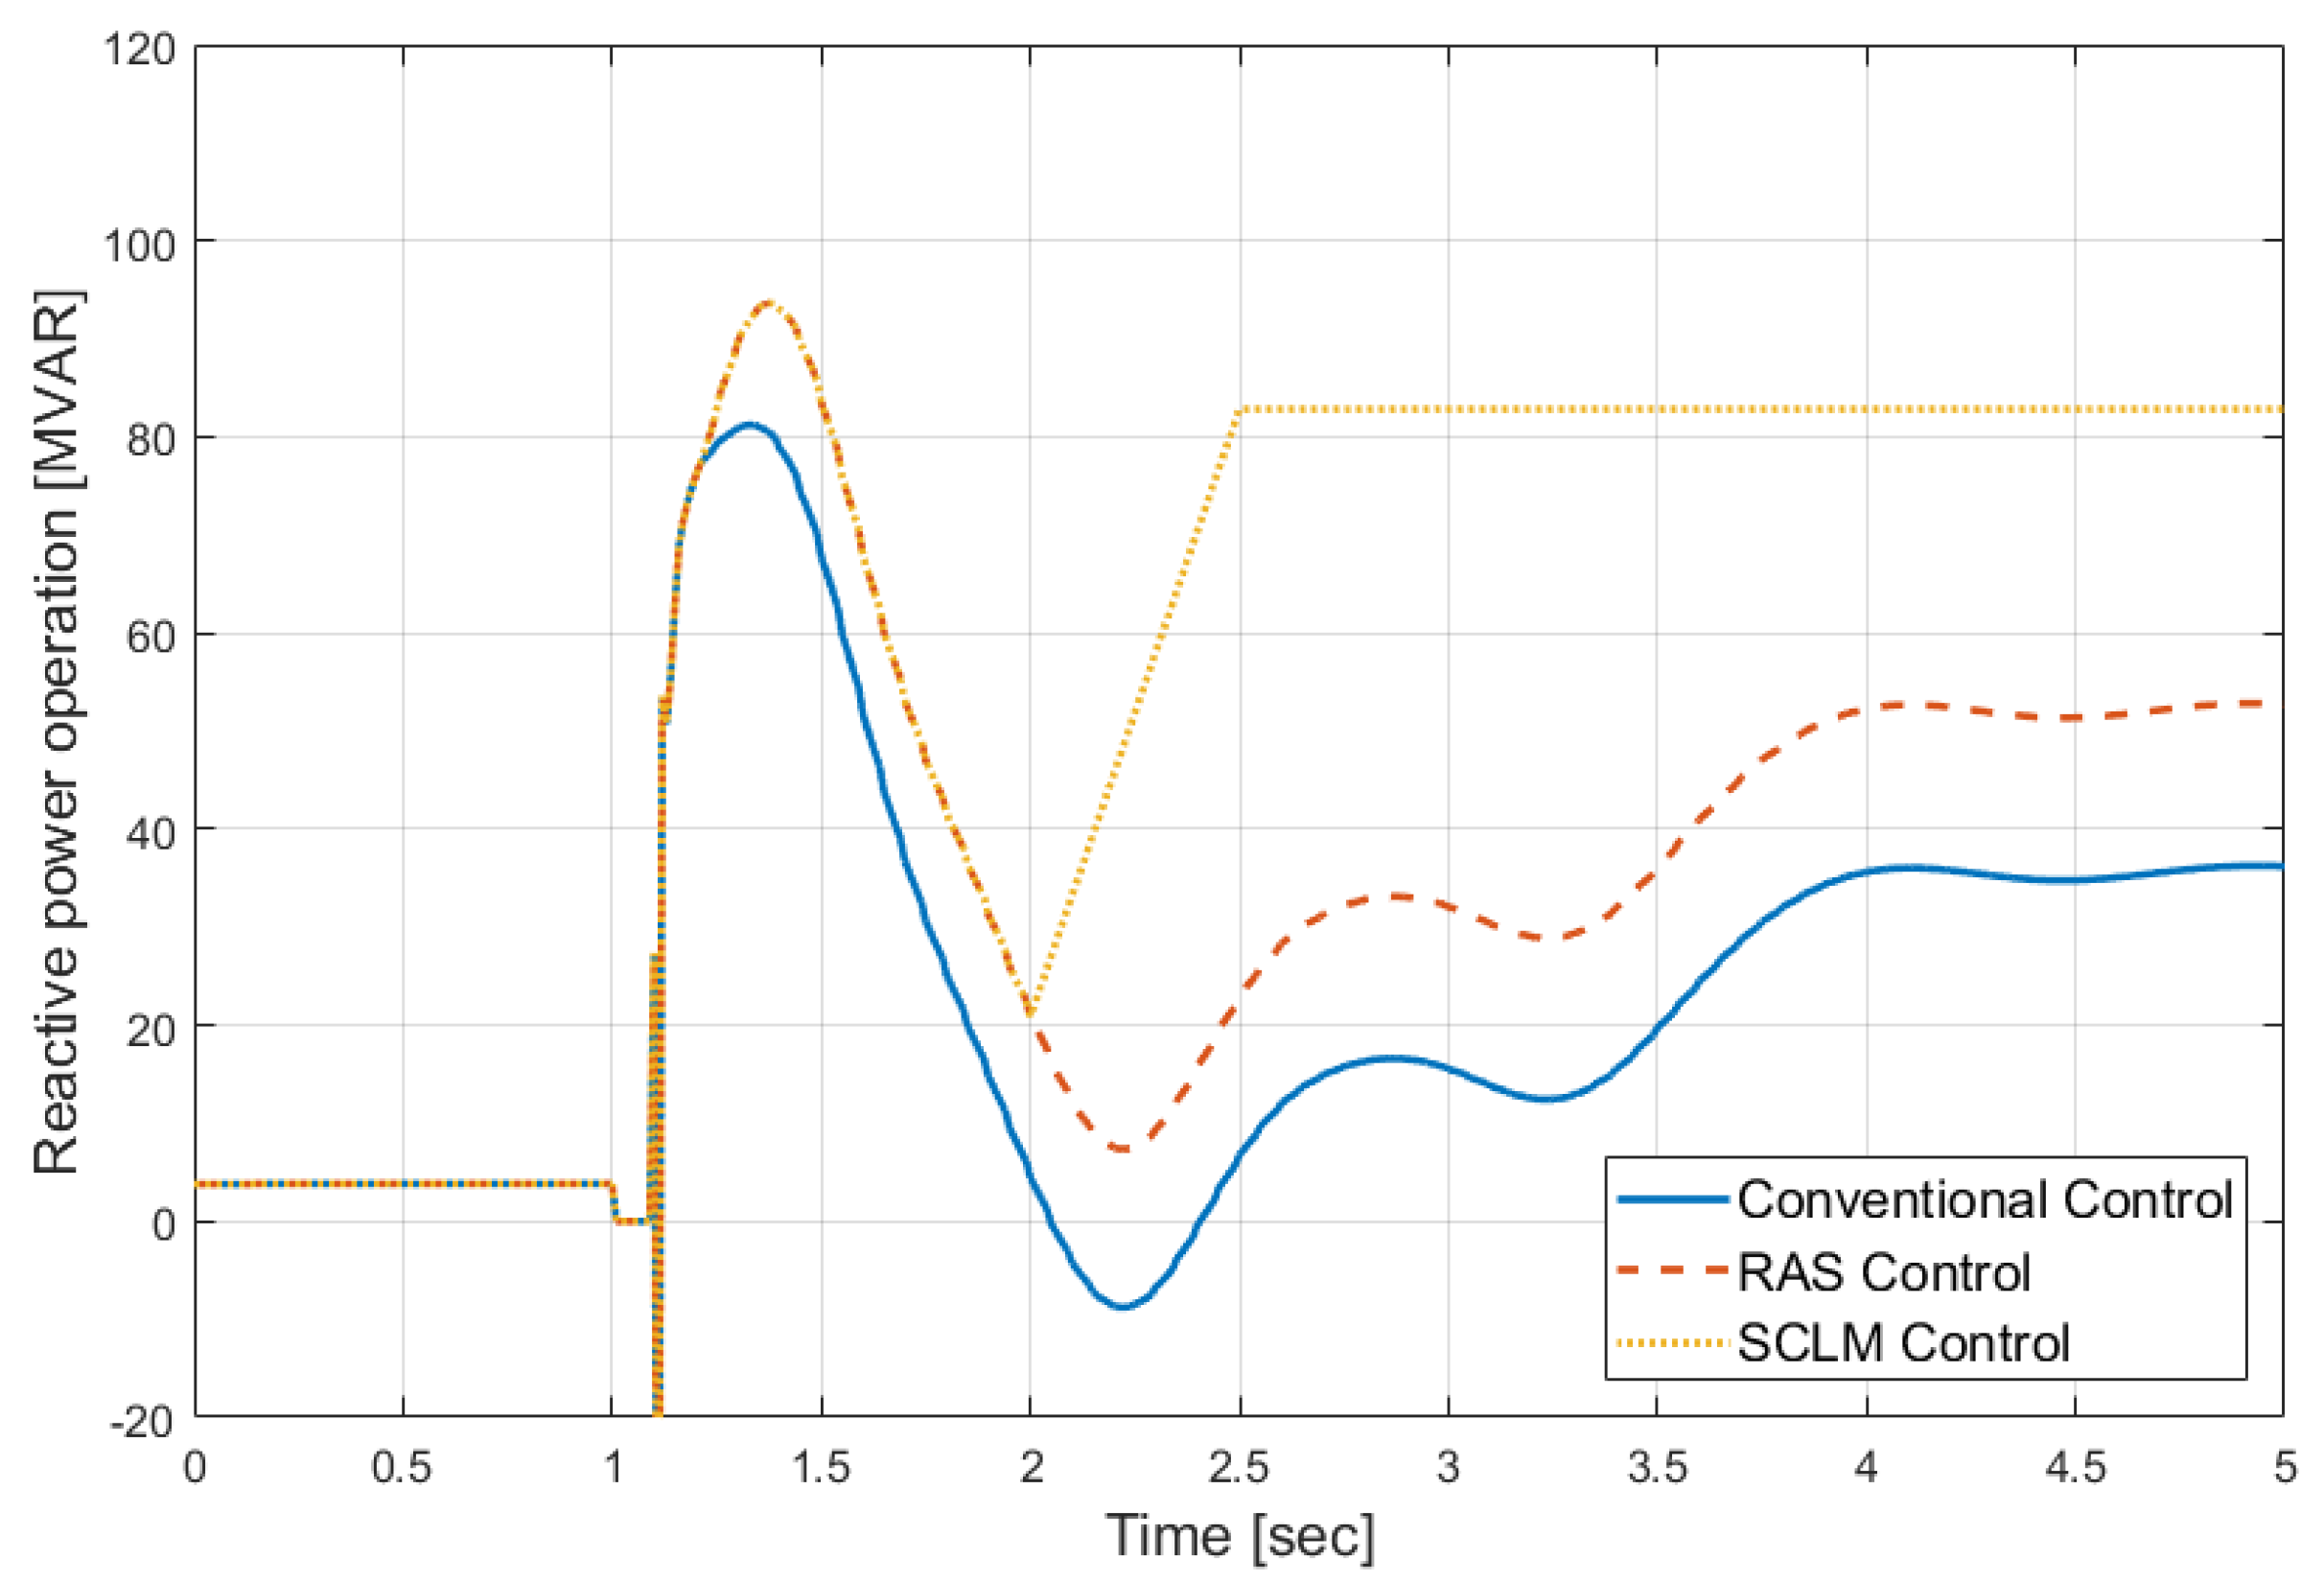
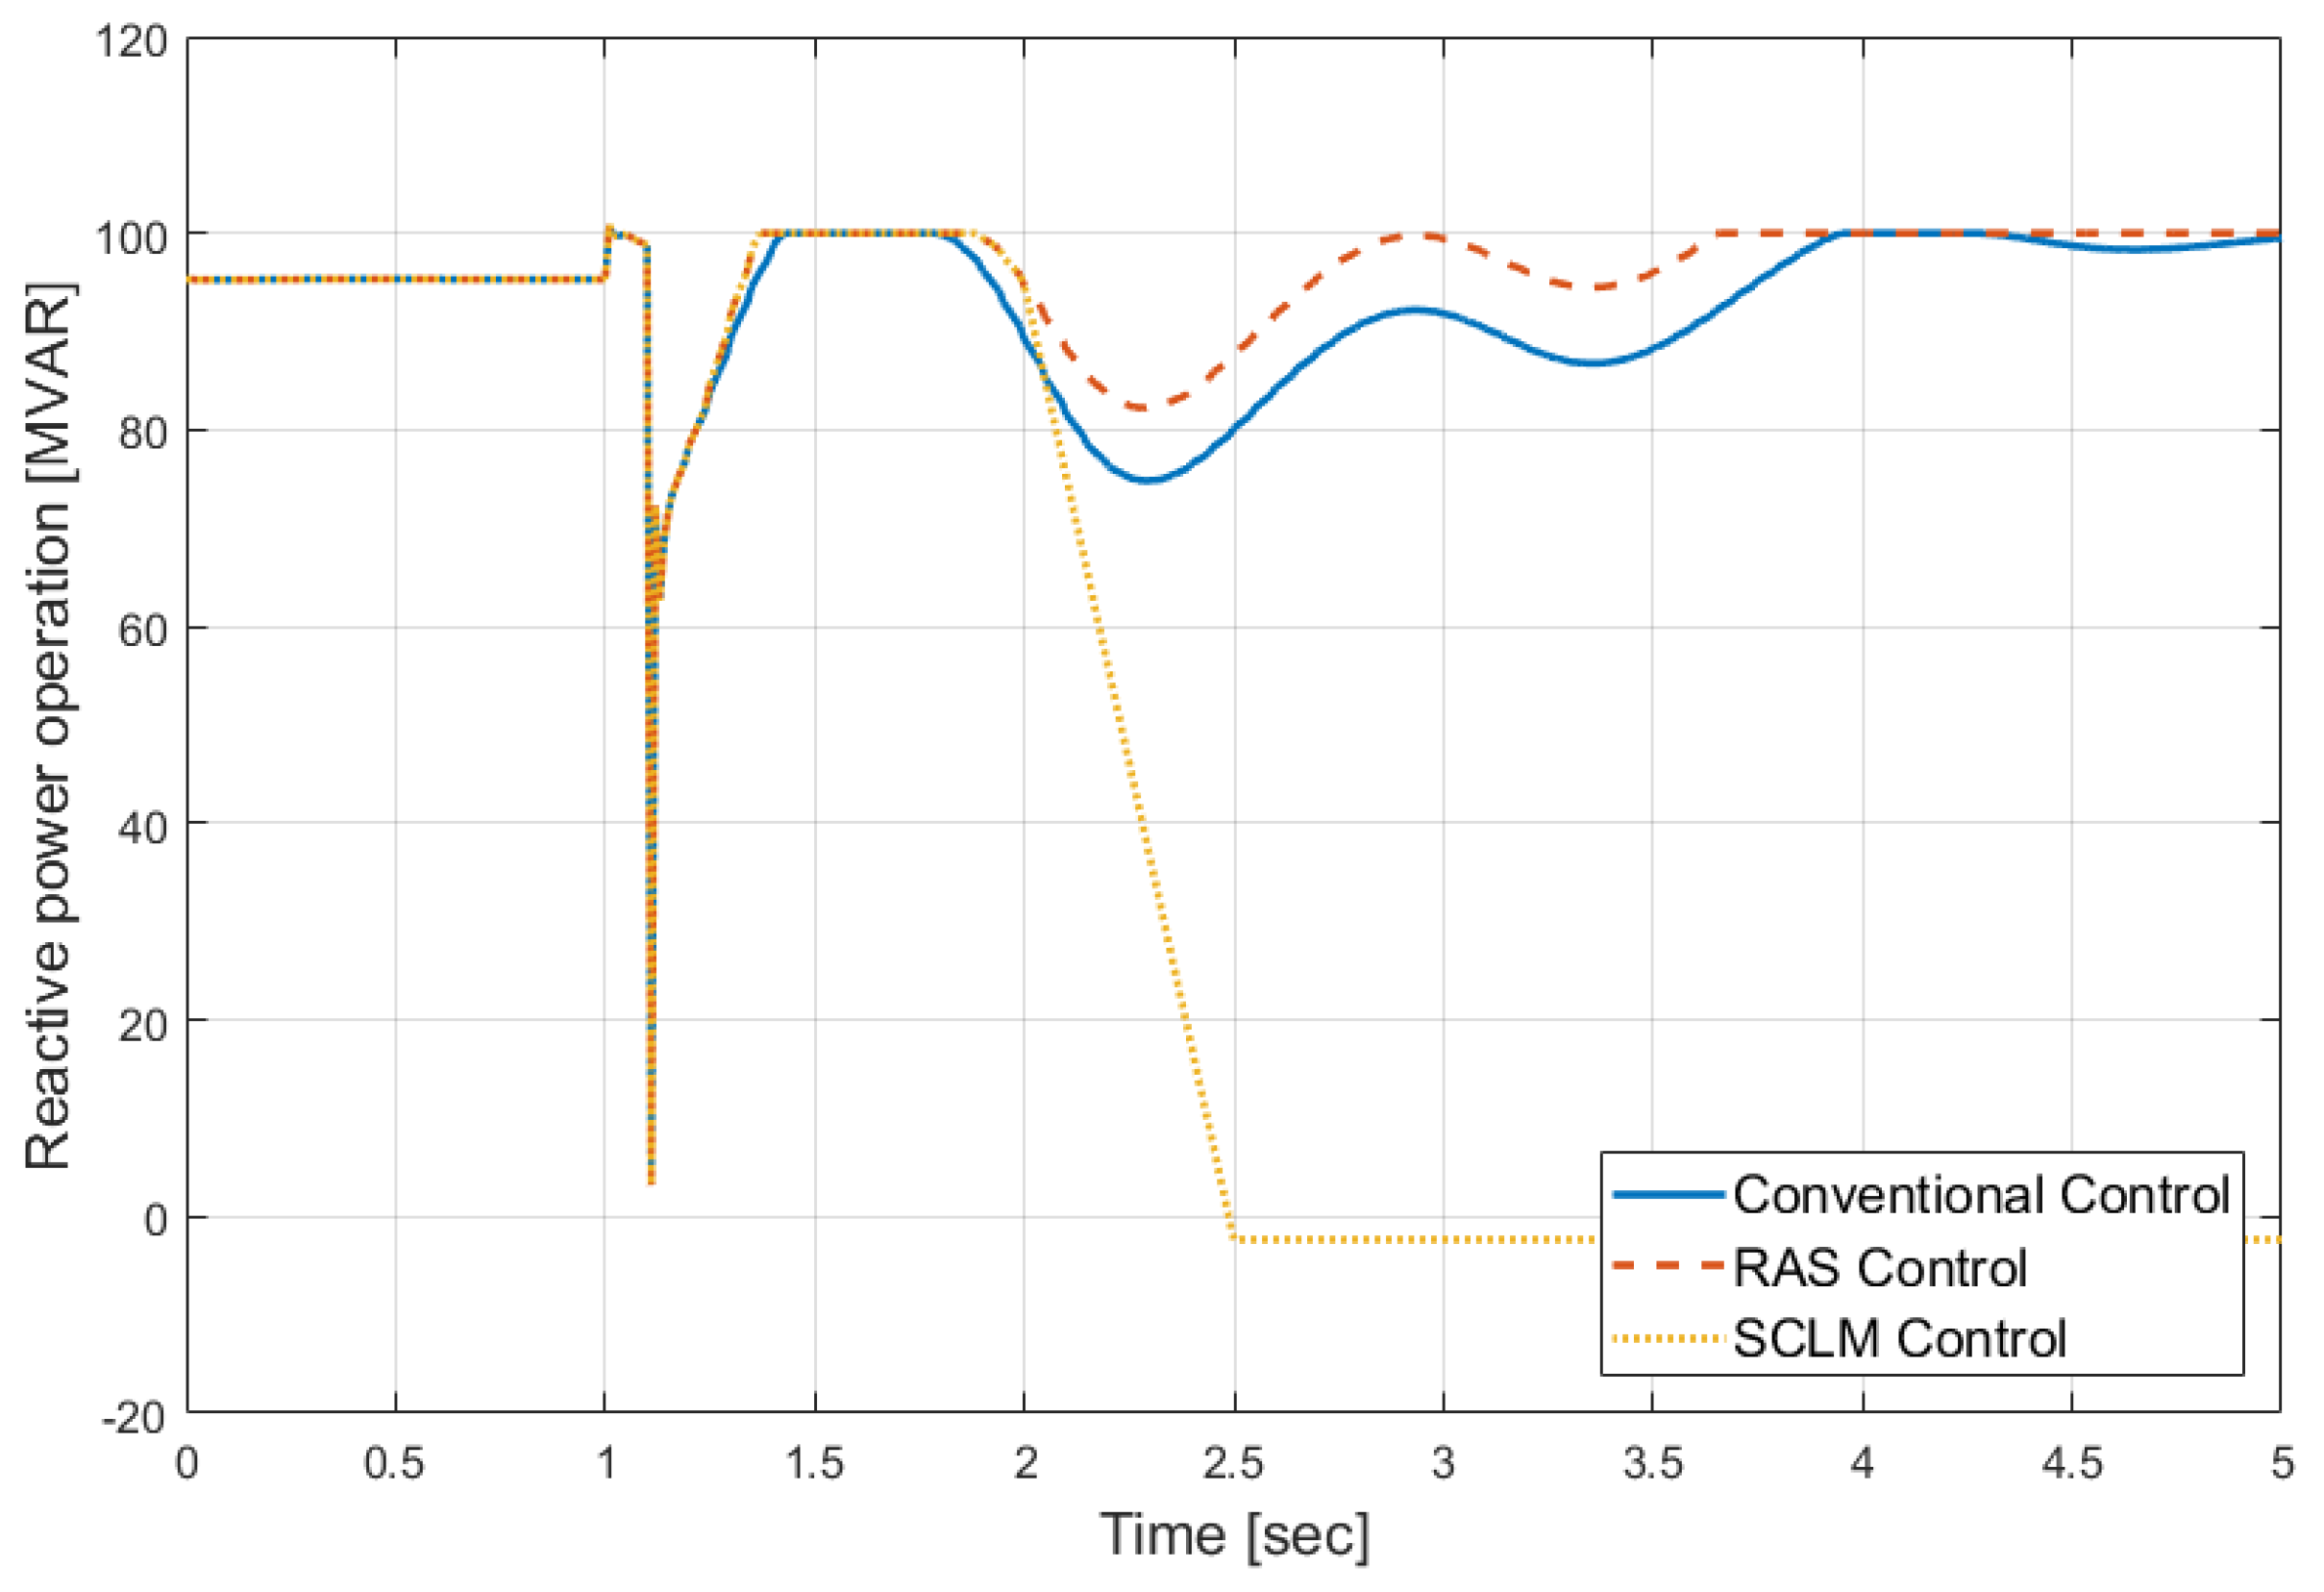
4.4.1. Transformer Overload (100%) Case

When a 1400–1800 2CKT contingency occurs, the overload of the transformer will be 112.51%. At this time, the overload is solved by using SCLM control, and then the operating point for loss minimization is found. The change in the operating point of the HVDC after the SCLM control and the result of the system control are shown in Table 7 and Table 8 and Figure 8, Figure 9, Figure 10 and Figure 11. As in the previous STLM control, after SCLM control, there are no overload lines, and the maximum/minimum voltage of the system is 1.059/0.984 at the 154 kV level, and 1.038/0.933 at the 345 kV level, which also meets the voltage criterion in Table 2.

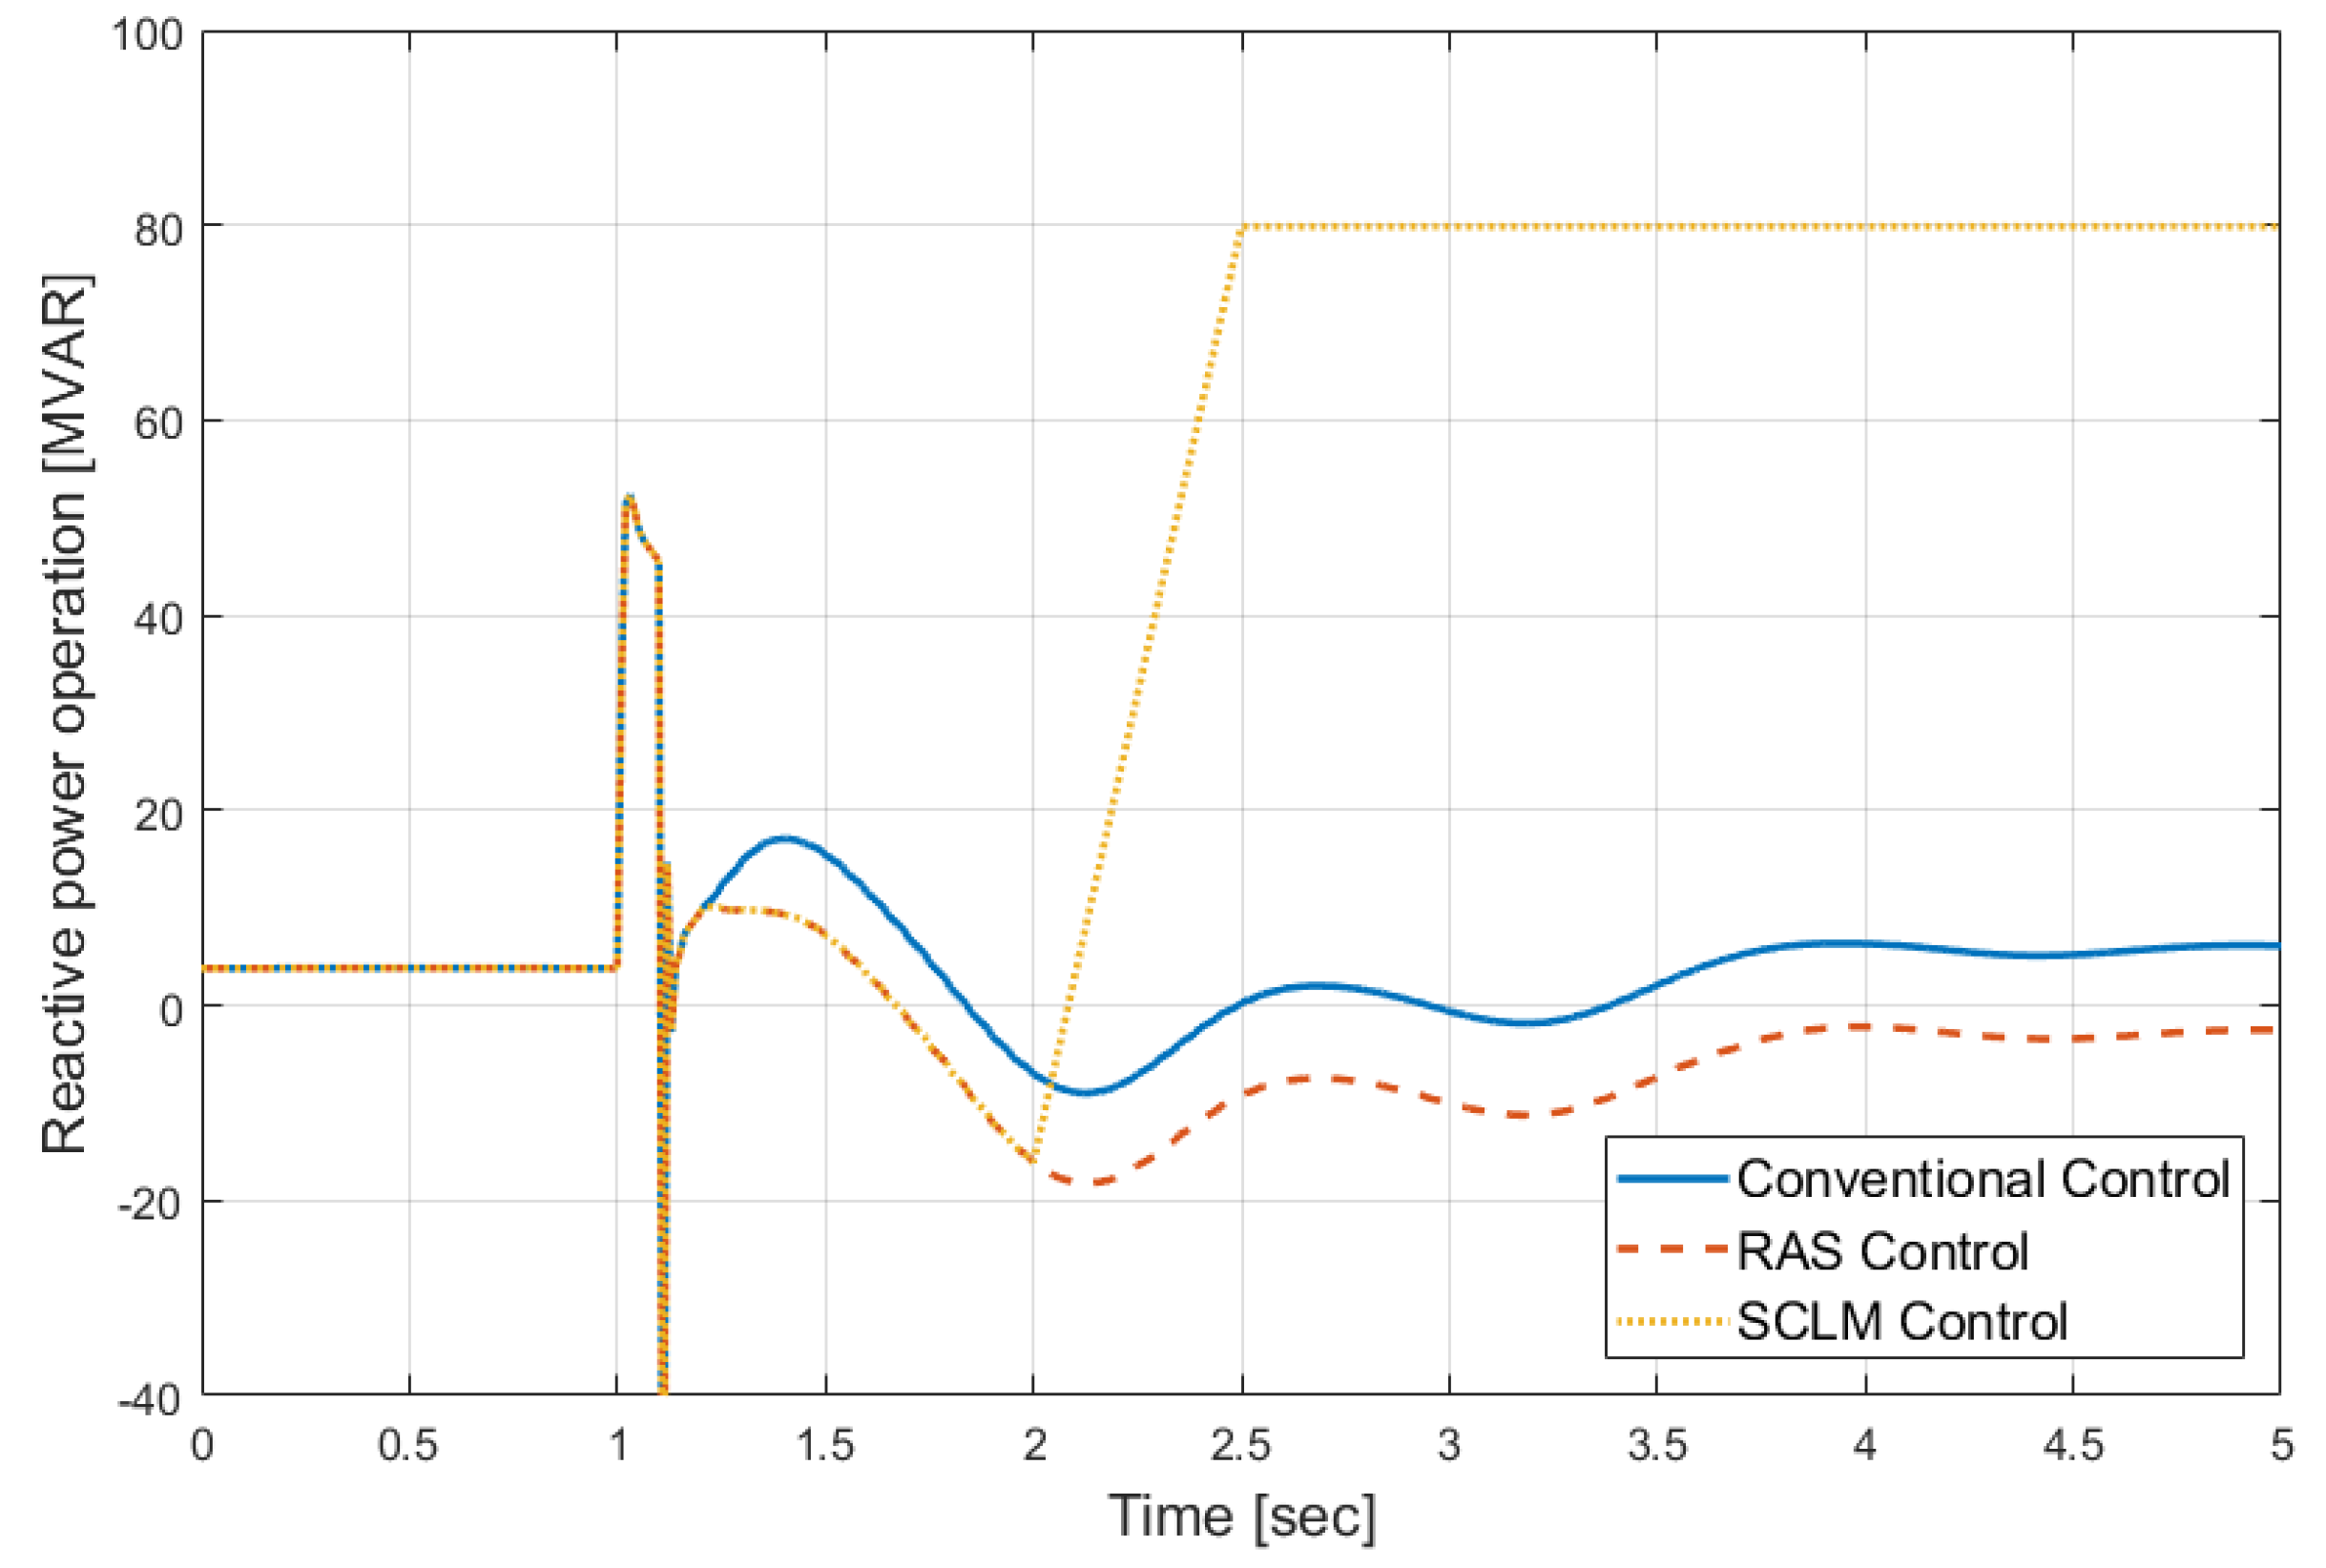
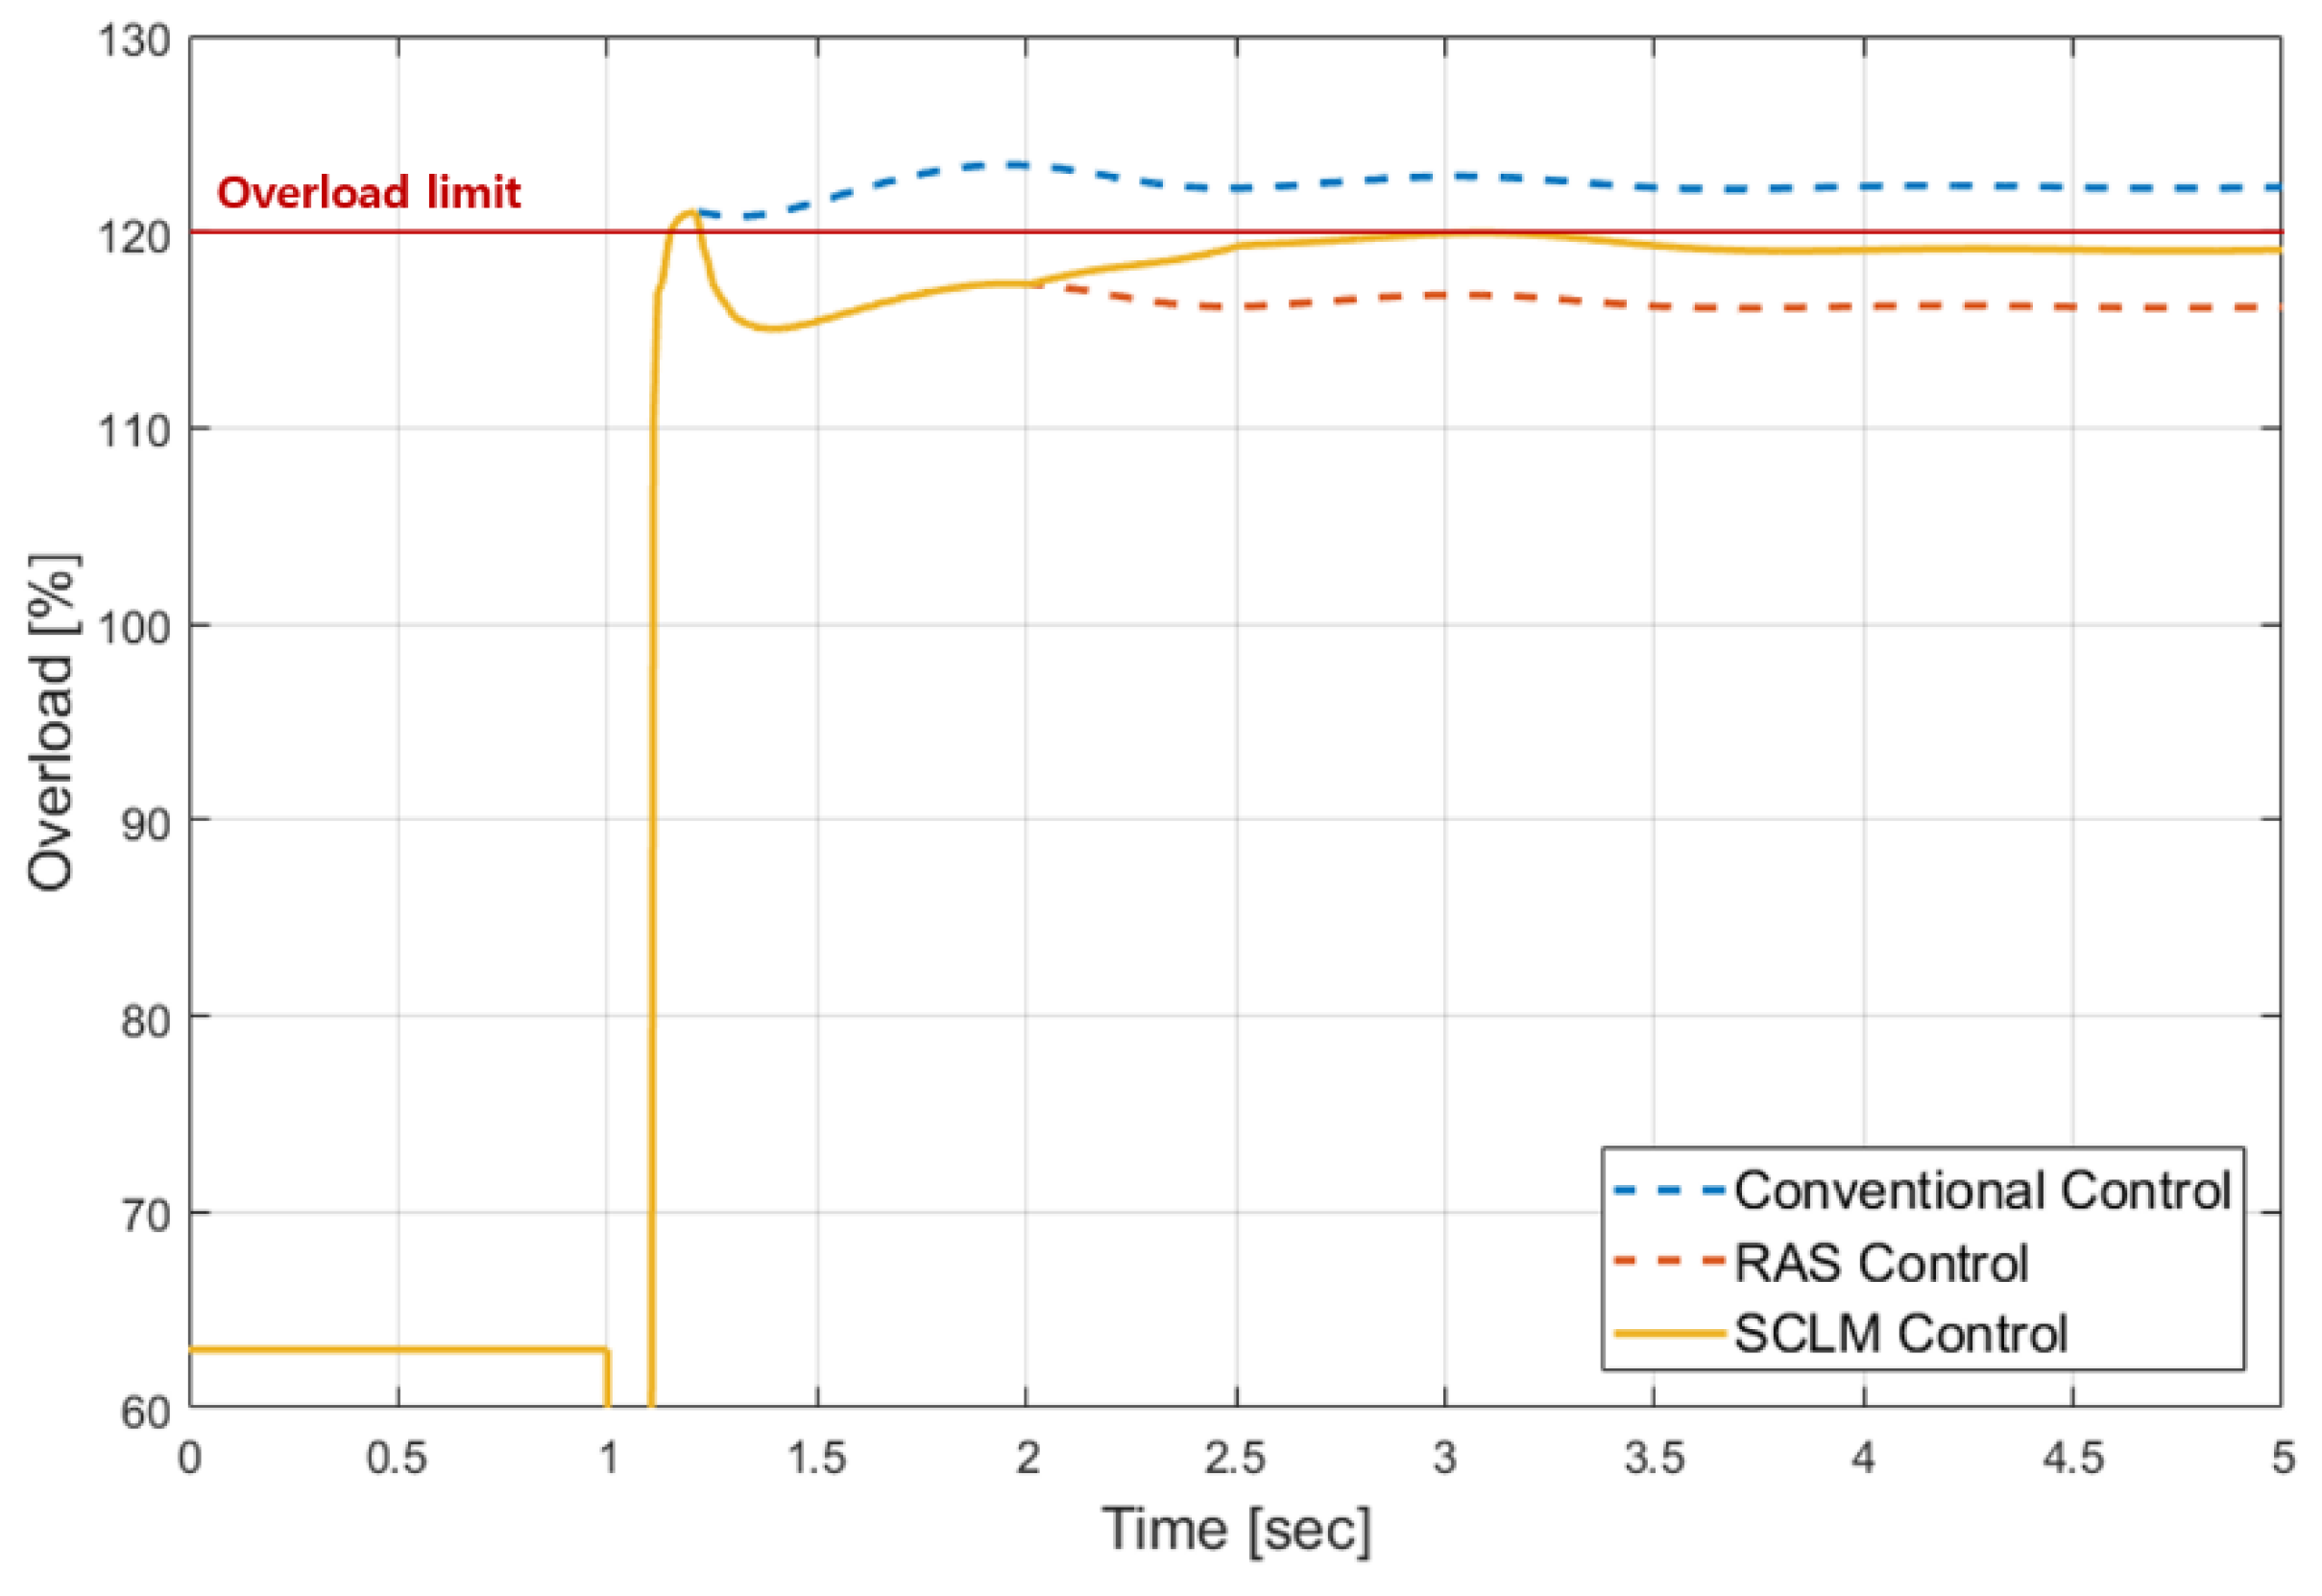
4.4.2. Line Overload (120%) Case

When a 1395–1415 1CKT contingency occurs, the overload of the remaining line will be 123.42%. Like the previous case, the overload is solved through the SCLM control, and then the operating point for minimum loss is determined. The change in the operating point of the HVDC after the SCLM control and the result of the system control are shown in Table 9 and Table 10 and Figure 12, Figure 13, Figure 14 and Figure 15. Additionally, in this case, there are no overload lines, and the maximum/minimum voltage of the system is 1.059/0.984 at the 154 kV level, and 1.039/0.994 at the 345 kV level, which also meets the voltage criterion in Table 2.

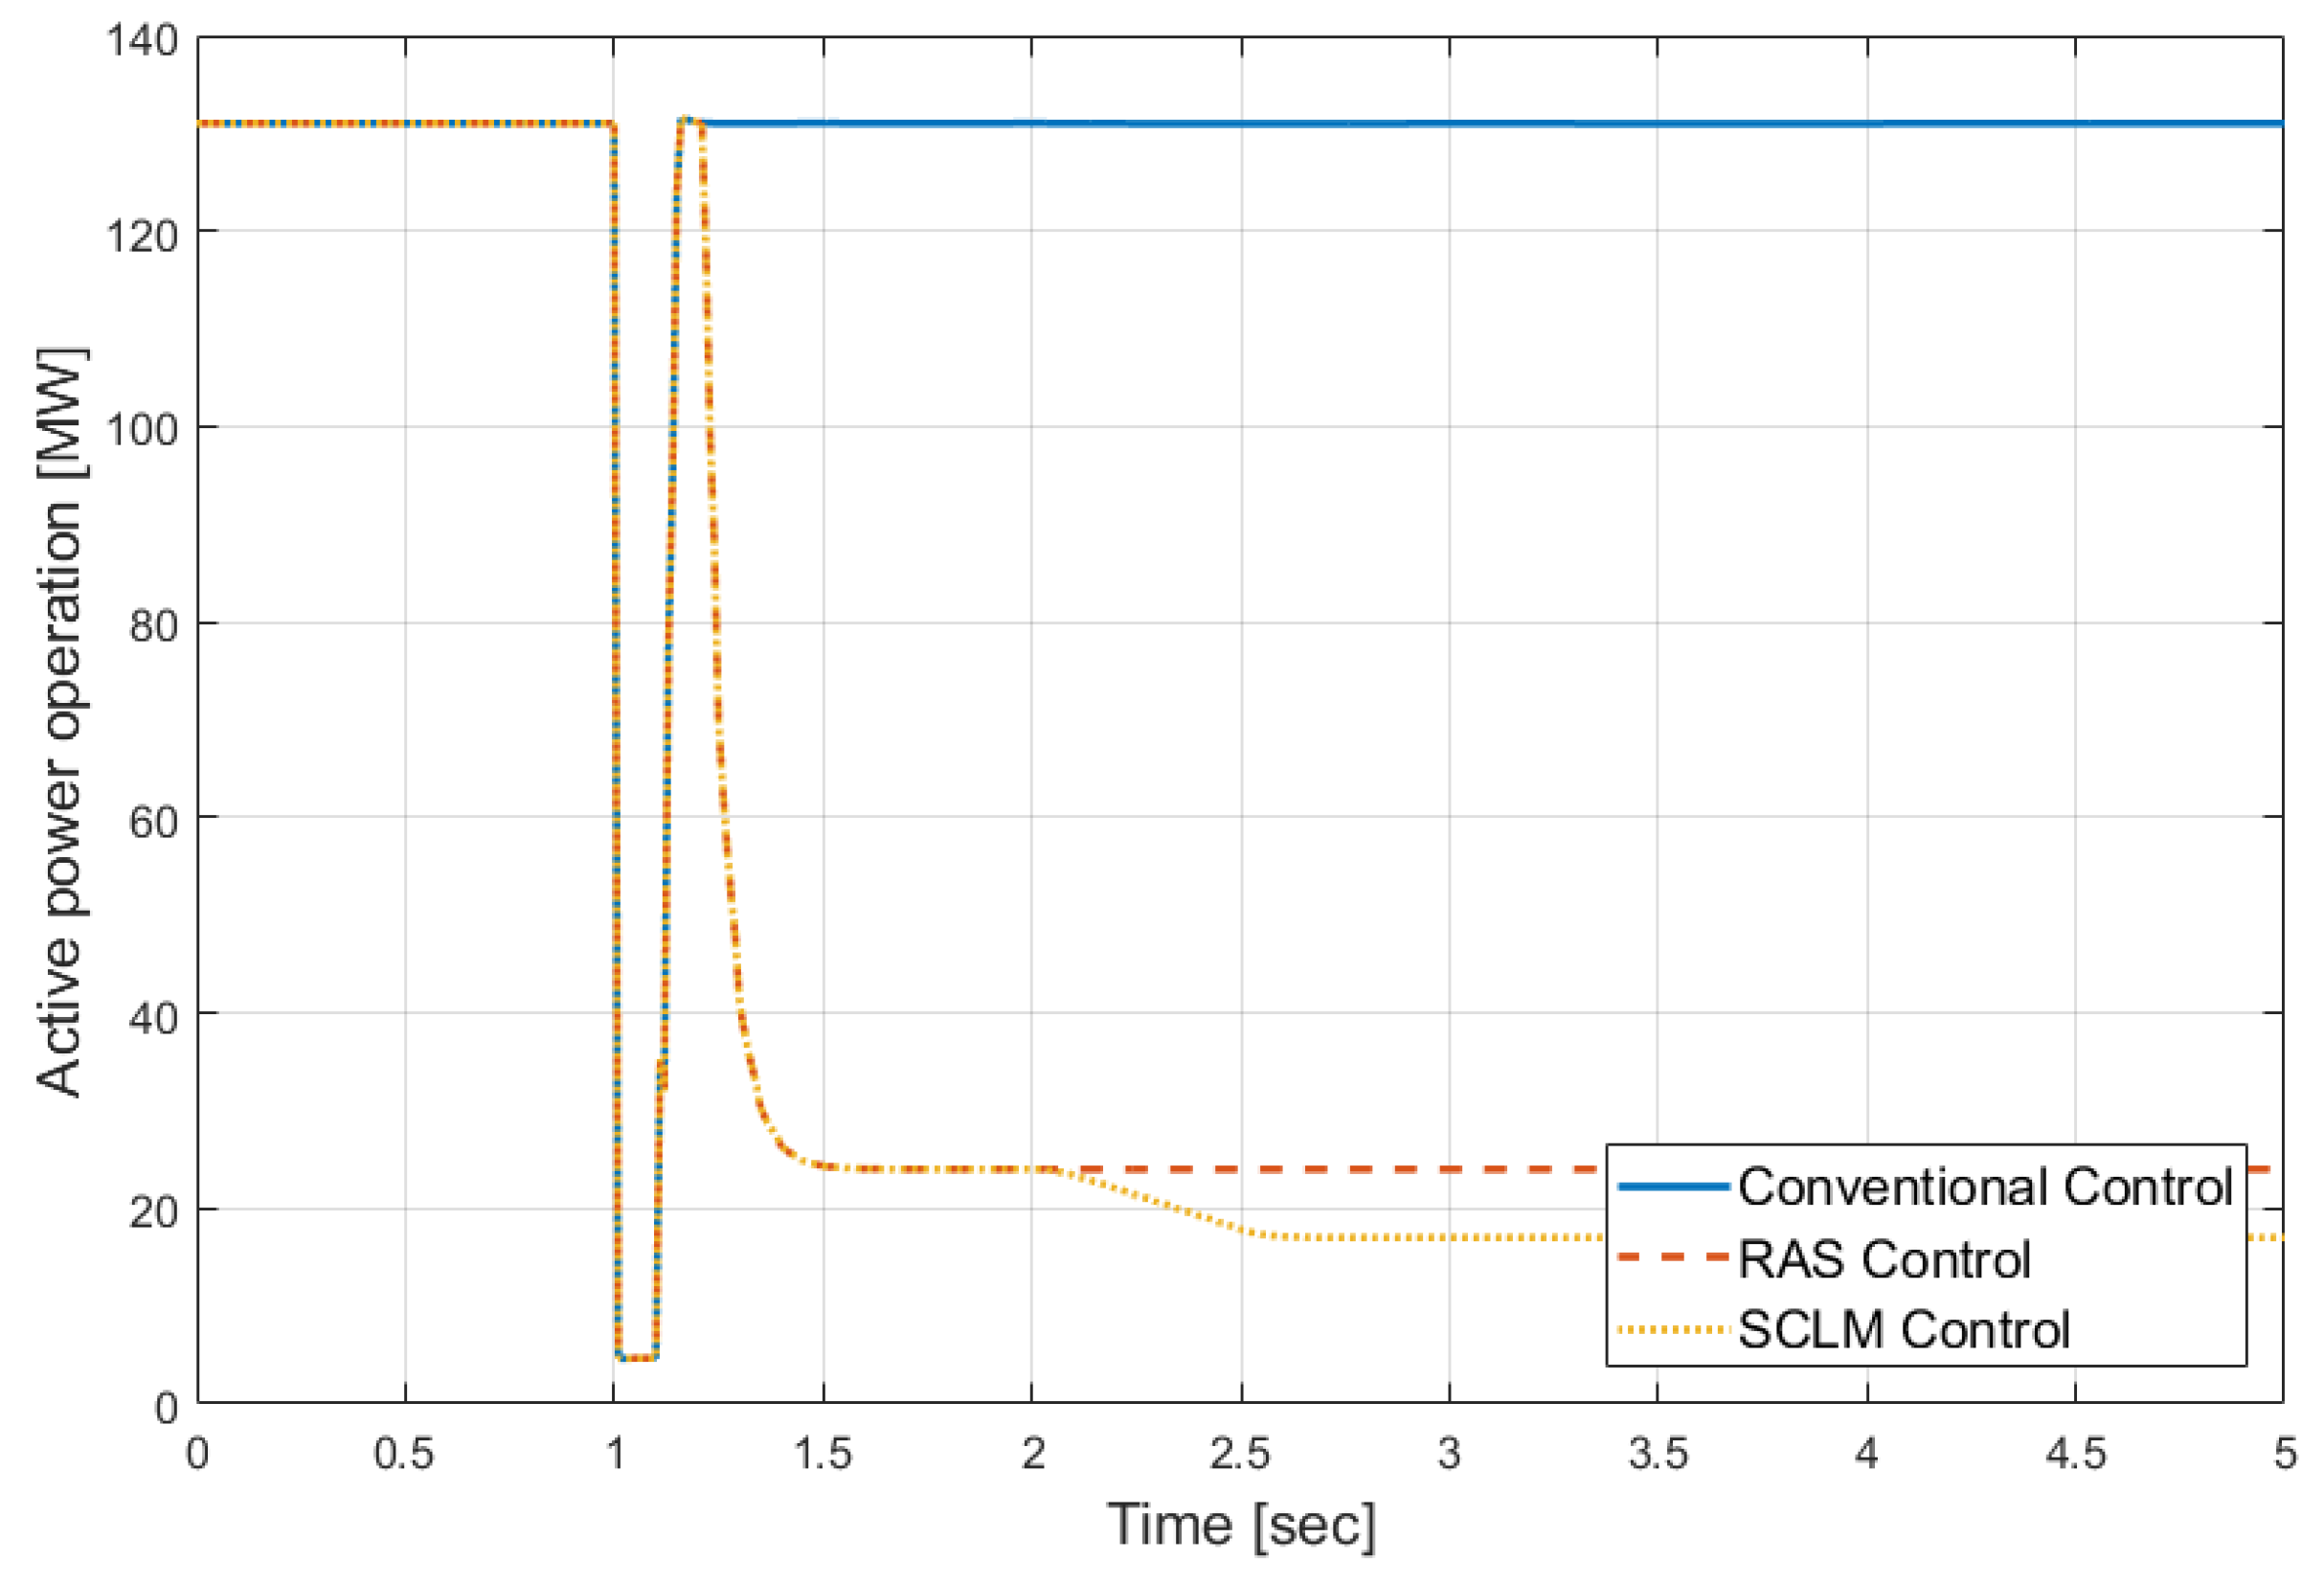
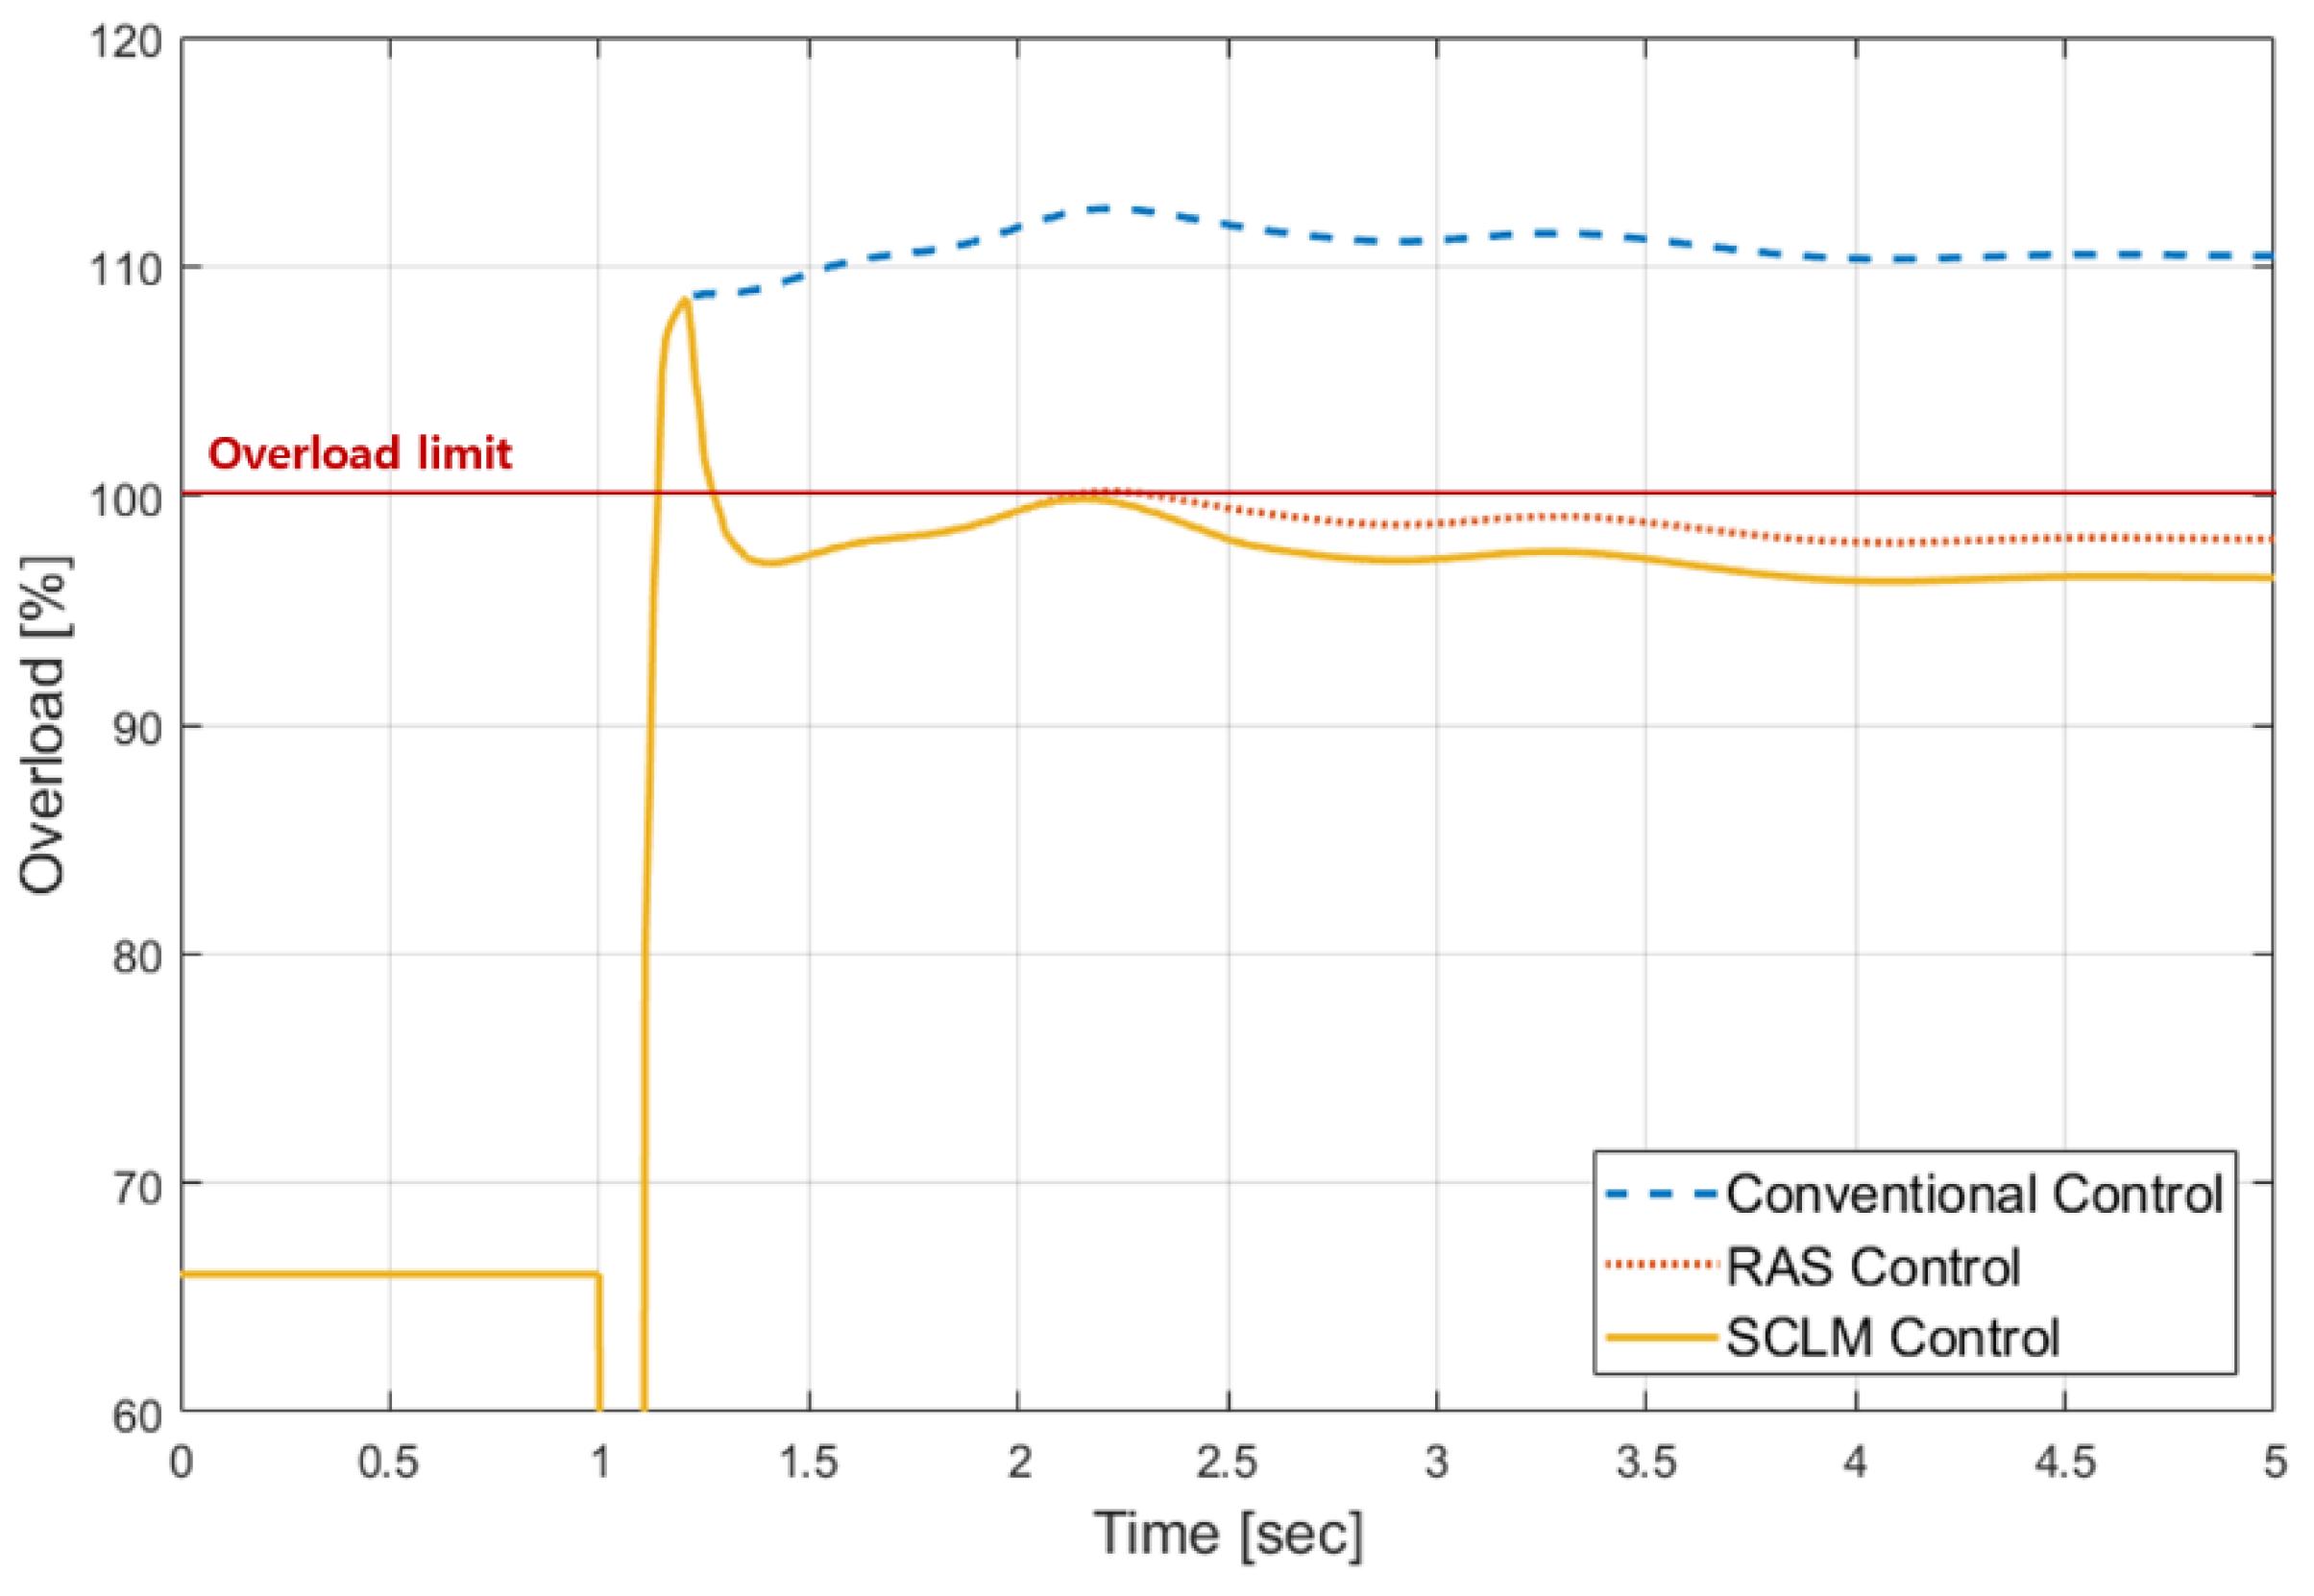
4.4.3. Comparison of Simulation Results

As shown in Figure 8 and Figure 12, in the conventional control, the HVDC system is controlled to sustain the constant power output, but when the RAS or the SCLM control is applied, the active power setpoint is changed to mitigate the overload. The reason why the active power is changed again after 2 s in the SCLM control is that the operating point is changed to minimize the system total loss within the operating range where the overload is mitigated. Additionally, Figure 9, Figure 10, Figure 13, and Figure 14 show the reactive power change at both ends of HVDC. In the conventional control and RAS control, the converters control the reactive power output to sustain the AC voltage setpoint in the pre-contingency condition, and the reactive power output fluctuated according to the system conditions. On the other hand, in the SCLM control, the reactive power output of HVDC for minimizing the system total loss is calculated and changed after 2 s. Accordingly, the total loss is 1.66 and 5.84 MW lower, respectively, compared to the RAS results as expressed in Table 8 and Table 10.
Comparisons of overload changes for each case can be seen in Figure 11 and Figure 15. In terms of the overload criteria, the load of the SCLM control is lower than that of RAS control in Figure 11, whereas the load of RAS control is lower than that of the SCLM control in Figure 15. In the SCLM control, since the operating point is determined to minimize the loss within the operating range for relieving the overload, the line load can be high, but it does not exceed the overload limit, so it is not a problem in terms of reliability.

5. Conclusions

This paper proposes a methodology for determining the operating point of embedded HVDC considering system losses and reliability criterion. In order to verify the effectiveness of the proposed control, we applied the methodology to the Korean power system, as a result, we proved that embedded BTB VSC HVDC can provide more efficient grid service for the AC system as follows.
  • In normal operation, the system loss is reduced by about 16 MW in the STLM control. This is 1% of the total loss, but an economic benefit can be gained during the lifetime of HVDC. Although we did not perform a detailed economic assessment, it is possible to obtain a loss reduction effect of about 85 million dollars a year considering energy charge and demand charge.
  • There are about 180 branches in the zone with HVDC. Using sensitivity analysis, the number of monitoring branches can be reduced to 14 lines and three transformers.
  • If a disturbance occurs in the AC system and there is no appropriate HVDC control accordingly, HVDC may adversely affect the AC system. Using the SCLM control, not only overload and overvoltage problems are solved, but also the system loss is reduced, which is advantageous in economy and reliability.
The proposed scheme can be operated well in a real system if a large-enough communication system like Supervisory control and data acquisition (SCADA) is applied. It is possible to reduce the communication burden by reducing the number of monitoring lines by precomputing the line that is greatly influenced by the HVDC control. Future research will need to be done on the overall embedded VSC HVDC operation strategy, not limited to the active/reactive power control, but considering all the other grid services it can provide.

Author Contributions

J.L. and M.Y. contributed equally to this work. The main algorithm and control scheme were proposed by J.L. and M.Y. The experiment results were collected by S.H., S.J. (Soseul Jeong) and S.J. (Seungmin Jung). The simulation results were analyzed by J.L., M.Y., G.J., J.L. and M.Y. wrote the paper.

Funding

This research received no external funding.

Acknowledgments

This work was supported by Korea Electric Power Corporation grant (R17XA05-4) and “Human Resources Program in Energy Technology” of the Korea Institute of Energy Technology Evaluation and Planning (KETEP), granted financial resource from the Ministry of Trade, Industry & Energy, Republic of Korea. (No.20174030201540).

Conflicts of Interest

The authors declare no conflict of interest.

Appendix A

Table A1. Monitoring branches for HVDC operation.
1310–13401340–18251360–19451361–19451411–14951411–1925
1495–16901690–19451825–18901865–18701890–19351925–1931
1931–19401935–19401360 M.Tr1361 M.Tr1410 M.Tr

References

  1. Van Hertem, D.; Ghandhari, M. Multi-terminal VSC HVDC for the European supergrid: Obstacles. Renew. Sustain. Energy Rev. 2010, 14, 3156–3163. [Google Scholar] [CrossRef]
  2. Van Hertem, D.; Gomis-Bellmunt, O.; Liang, J. HVDC Grids: For Offshore and Supergrid of the Future; John Wiley & Sons: Hoboken, NJ, USA, 2016; ISBN 9781118859155. [Google Scholar]
  3. Peake, O. The history of high voltage direct current transmission. Aust. J. Multi Discip. Eng. 2010, 8, 47–55. [Google Scholar] [CrossRef]
  4. Renner, R.H.; Van Hertem, D. Ancillary services in electric power systems with HVDC grids. IET Gener. Transm. Distrib. 2015, 9, 1179–1185. [Google Scholar] [CrossRef]
  5. Henry, S.; Despouys, O.; Adapa, R.; Barthold, C.; Bell, K.; Binard, J.-L.; Edris, A.; Egrot, P.; Hung, W.; Irwin, G.; et al. Influence of embedded HVDC transmission on system security and AC network performance. Electra 2013, 267, 79–86. [Google Scholar]
  6. Johnson, R.K.; Klemm, N.S.; De Laneuville, H.; Koetschau, S.G.; Wild, G. Power modulation of Sidney HVDC scheme. I. RAS control concept, realization and field tests. IEEE Trans. Power Deliv. 1989, 4, 2145–2152. [Google Scholar] [CrossRef]
  7. Johnson, R.K.; Klemm, N.S.; Schiling, K.H.; Thumm, G. Power modulation of Sidney HVDC scheme. II. Computer simulation. IEEE Trans. Power Deliv. 1989, 4, 2153–2161. [Google Scholar] [CrossRef]
  8. Lee, R.L.; Melvold, D.J.; Szumlas, D.J.; Le, L.M.; Finley, A.T.; Martin, D.E.; Wong, W.K.; Dickmander, D.L. Potential DC system support to enhance AC system performance in the Western United States. IEEE Trans. Power Syst. 1993, 8, 264–274. [Google Scholar] [CrossRef]
  9. Cholley, P.; Crossley, P.; Van Acker, V.; Van Cutsem, T.; Fu, W.; Soto Idia Òez, J.; Ilar, F.; Karlsson, D.; Kojima, Y.; McCalley, J.; et al. System protection schemes in power networks. In Proceedings of the 2001 Seventh International Conference on Developments in Power System Protection (IEE), Amsterdam, The Netherlands, 2001; pp. 450–453. [Google Scholar]
  10. Luo, J.; Gong, Y.; Li, H.; Yan, Y. Online emergency control and corrective control coordination strategy for UHVDC blocking faults. In Proceedings of the 2018 IEEE International Conference on Electronics Technology (ICET 2018), Chendu, China, 23–27 May 2018; pp. 5–10. [Google Scholar]
  11. Jiang, M.; Yu, H. Alberta’s experience of coordinating HVDC operation with under-voltage remedial action scheme. In Proceedings of the 2016 IEEE Power and Energy Society General Meeting (PESGM 2016), Boston, MA, USA, 17–21 July 2016; pp. 1–4. [Google Scholar]
  12. Bhuiyan, M.R.; Taylor, A.E.; Kezman, N.C. Designing the hardware and software of the Pacific HVDC intertie remedial action scheme using a programmable controller. In Proceedings of the 1991 IEEE Power Engineering Society Transmission and Distribution Conference, Dallas, TX, USA, 22–27 September 1991; pp. 790–796. [Google Scholar]
  13. Dolezilek, D. Case study examples of interoperable ethernet communications within distribution, transmission, and wide-area control systems. In Proceedings of the 2010 IEEE International Conference on Communications Workshops (ICC 2010), Cape Town, South Africa, 23–27 May 2010; pp. 1–7. [Google Scholar]
  14. Bahrman, M.; Bjorklund, P.-E. The new black start: System restoration with help from voltage-sourced converters. IEEE Power Energy Mag. 2014, 12, 44–53. [Google Scholar] [CrossRef]
  15. Yoon, M.; Yoon, Y.-T.; Jang, G. A study on maximum wind power penetration limit in island power system considering high-voltage direct current interconnections. Energies 2015, 8, 14244–14259. [Google Scholar] [CrossRef]
  16. Miao, Y.; Cheng, H. An optimal reactive power control strategy for UHVAC/DC hybrid system in east china grid. IEEE Trans. Smart Grid 2016, 7, 392–399. [Google Scholar] [CrossRef]
  17. Moslehi, K. Electricity market challenges—Efficient utilization of transmission. In Proceedings of the 2015 IEEE Smart Grids Seminar, Cuernavaca, Morelos, Mexico, 23–27 March 2015. [Google Scholar]
  18. Cao, J.; Du, W.; Wang, H.F.; Bu, S.Q. Minimization of transmission loss in meshed AC/DC grids with VSC-MTDC networks. IEEE Trans. Power Syst. 2013, 28, 3047–3055. [Google Scholar] [CrossRef]
  19. Han, M.; Xu, D.; Wan, L. Hierarchical optimal power flow control for loss minimization in hybrid multi-terminal HVDC transmission system. CSEE J. Power Energy Syst. 2016, 2, 40–46. [Google Scholar] [CrossRef]
  20. QI, Q.; Long, C.; Wu, J.; Yu, J. Impacts of a medium voltage direct current link on the performance of electrical distribution networks. Appl. Energy 2018, 230, 175–188. [Google Scholar] [CrossRef]
  21. QI, Q.; Wu, J.; Long, C. Multi-objective operation optimization of an electrical distribution network with soft open point. Appl. Energy 2017, 208, 734–744. [Google Scholar] [CrossRef]
  22. Vovos, P.N.; Song, H.; Cho, K.-V.; Kim, T.-S. A network reconfiguration algorithm for the reduction of expected fault currents. In Proceedings of the 2013 IEEE Power and Energy Society General Meeting (PES 2013), Vancouver, BC, Canada, 21–25 July 2013; pp. 1–5. [Google Scholar]
  23. Lee, J.-H.; Yoon, M.; Jung, S.; Jang, G. System reliability enhancement in a metropolitan area using HVDC technology. J. Int. Counc. Electr. Eng. 2015, 5, 1–5. [Google Scholar] [CrossRef] [Green Version]
  24. Tongsiri, S.; Hoonchareon, N. Fault current limitation in metropolitan power system using HVDC link. In Proceedings of the 8th IEEE Electrical Engineering/Electronics, Computer, Telecommunications and Information Technology (ECTI-CON 2011), Khon Kaen, Thailand, 17–20 May 2011; pp. 840–844. [Google Scholar]
  25. Pang, H.; Tang, G.; He, Z. Evaluation of losses in VSC-HVDC transmission system. In Proceedings of the 2008 IEEE Power and Energy Society General Meeting-Conversion and Delivery of Electrical Energy in the 21st Century, Pittsburgh, PA, USA, 20–24 July 2008; pp. 1–6. [Google Scholar]
  26. Sellick, R.L.; Åkerberg, M. Comparison of HVDC light (VSC) and HVDC classic (LCC) site aspects, for a 500 MW 400 kV HVDC transmission scheme. In Proceedings of the 10th IET International Conference on AC and DC Power Transmission (ACDC 2012), Birmingham, UK, 4–5 December 2012. [Google Scholar]
  27. Fradi, A.; Brignone, S.; Wollenberg, B.E. Calculation of energy transaction allocation factors. IEEE Trans. Power Syst. 2001, 16, 266–272. [Google Scholar] [CrossRef]
  28. Song, C.S.; Park, C.H.; Yoon, M.; Jang, G. Implementation of PTDFs and LODFs for power system security. J. Int. Counc. Electr. Eng. 2011, 1, 49–53. [Google Scholar] [CrossRef]
  29. Rahmani, M.; Kargarian, A.; Hug, G. Comprehensive power transfer distribution factor model for large-scale transmission expansion planning. IET Gener. Transm. Distrib. 2016, 10, 2981–2989. [Google Scholar] [CrossRef]
  30. Powell, M.J.D. An efficient method for finding the minimum of a function of several variables without calculating derivatives. Comput. J. 1964, 7, 155–162. [Google Scholar] [CrossRef]
  31. Lazarou, S.; Vita, V.; Ekonomou, L. Application of powell’s optimisation method for the optimal number of wind turbines in a wind farm. IET Sci. Meas. Technol. 2011, 5, 77–80. [Google Scholar] [CrossRef]
  32. Cao, W.; Wu, J.; Jenkins, N. Feeder load balancing in MV distribution networks using soft normally-open points. In Proceedings of the 2014 IEEE PES Innovative Smart Grid Technologies Conference Europe (ISGT-Europe 2014), Istanbul, Turkey, 12–15 October 2014; pp. 1–6. [Google Scholar]
  33. Asplund, G.; Eriksspon, K.; Jiang, H.; Lindberg, J.; Pålsson, R.; Swensson, K. DC transmission based on voltage source converters. In CIGRE SC14 Colloquium, South Africa; ABB Power Systems AB: Vasteras, Sweden, 1997; pp. 1–7. [Google Scholar]
Figure 1. HVDC fault calculation model (PQ bus mode).
Applsci 09 02234 g001
Figure 2. Proposed control scheme.
Applsci 09 02234 g002
Figure 3. Power flow change caused by back-to-back (BTB) HVDC active power operation.
Applsci 09 02234 g003
Figure 4. Algorithm of the system total loss minimization (STLM) control.
Applsci 09 02234 g004
Figure 5. Algorithm of the security-constrained loss minimization (SCLM) control.
Applsci 09 02234 g005
Figure 6. BTB siting in the Korean metropolitan area (1411–1410).
Applsci 09 02234 g006
Figure 7. Simulation proceeds for SCLM control.
Applsci 09 02234 g007
Figure 8. Active power operation change in the transformer overload case.
Applsci 09 02234 g008
Figure 9. Reactive power operation change in the transformer overload case at the rectifier end.
Applsci 09 02234 g009
Figure 10. Reactive power operation change in the transformer overload case at the inverter end.
Applsci 09 02234 g010
Figure 11. Comparison of HVDC control for overload mitigation in the transformer overload case.
Applsci 09 02234 g011
Figure 12. Active power operation change in the line overload case.
Applsci 09 02234 g012
Figure 13. Reactive power operation change in the line overload case at the rectifier end.
Applsci 09 02234 g013
Figure 14. Reactive power operation change in the line overload case at the inverter end.
Applsci 09 02234 g014
Figure 15. Comparison of HVDC control for overload mitigation in the line overload case.
Applsci 09 02234 g015
Table 1. Grid services of voltage-sourced converter (VSC) high voltage direct current (HVDC) for alternating current (AC) systems.
Control and SupportGrid Service
Active power control and frequency support - Primary control or frequency containment reserves (FCR)
 - Secondary control or frequency restoration reserves (FRR)
 - Tertiary control or replacement reserves (RR)
Reactive power control and voltage support - Reactive power absorb/supply
Rotor angle stability-related control - Avoiding loss of synchronism
 - Damping electromechanical oscillations
Other - Power oscillation damping capability
 - DC power flow control
 - Black start capability
 - Loss compensation
 - DC transmission reserve
Table 2. System information.
ItemInformation
Case dataKorea Power System (2021)
System total generation98,771.0 MW
System total load97,200.8 MW
Nominal frequency60 Hz
Voltage limit
(Steady state)
Base 345 kV0.95~1.05 p.u.
Base 154 kV0.90~1.10 p.u.
Voltage limit
(Transient state)
Base 345 kV0.90~1.05 p.u.
Base 154 kV0.90~1.10 p.u.
Branch Overload limit
(Steady state)
Branch100%
Branch Overload limit
(Transient)
Line120%
Transformer100%
Table 3. Specification of BTB VSC HVDC.
SpecificationBTB VSC HVDC
Site1410–1411
Active power capacity200 × 2 MW
Reactive power capacity100 × 2 MVAR
MVA rating224 × 2 MVA
AC terminal voltage154 kV
DC voltage100 kV
ConfigurationDouble monopole
Conversion loss1.8% of active power
AC voltage setpointDepend on the system condition
Table 4. Fault current comparison with/without HVDC [kA].
Bus NumberBase kVWith HVDCWithout HVDCBus NumberBase kVWith HVDCWithout HVDC
120034554.889955.0129181015448.244153.2228
140034548.234050.1957181115447.759652.6257
141015449.767265.5842186515446.222451.5447
141115425.795665.5842187015447.045552.7775
147515446.131551.8724189515447.178253.1212
149015446.256452.0078195515444.549850.1641
Table 5. HVDC setpoint using the STLM control.
P (1410 → 1411)AC Voltage (Rectifier)AC Voltage (Inverter)
Setpoint131 × 2 MW1.048 kV1.039 kV
(Supply 95.31 MVAR)(Supply 3.80 MVAR)
Table 6. Comparison of system losses by operating method.
LossesWith HVDC
(STLM Control)
With HVDC
(AC Flow)
Without HVDC
AC system losses 1564.38 MW1578.10 MW1571.16 MW
DC system losses4.72 MW7.20 MW-
Total losses1569.10 MW1585.30 MW1571.16 MW
Table 7. HVDC setpoint change using the SCLM control for the transformer overload.
Control ModeP (1410 → 1411)AC Voltage (Rectifier)AC Voltage (Inverter)
Normal operation
(STLM control)
131 × 2 MW1.048 kV1.039 kV
(Supply 95.31 MVAR)(Supply 3.80 MVAR)
SCLM control17 × 2 MW1.019 kV1.048 kV
(Supply 82.83 MVAR)(Supply 72.70 MVAR)
Table 8. Comparison of system losses by operating change (transformer overload case).
Normal OperationConventional ControlRAS ControlSCLM Control
AC system losses 1564.38 MW1583.92 MW1587.21 MW1585.80 MW
DC system losses4.72 MW4.72 MW0.86 MW0.61 MW
Total losses1569.10 MW1587.64 MW1588.07 MW1586.41 MW
% Loading66.02%110.44%
(Security violated)
98.08%96.41%
Table 9. HVDC setpoint change using the SCLM control for line overload.
Control ModeP (1410→1411)AC Voltage (Rectifier)AC Voltage (Inverter)
Normal operation
(STLM control)
131 × 2 MW1.048 kV1.039 kV
(Supply 95.31 MVAR)(Supply 3.80 MVAR)
SCLM control184 × 2 MW1.035 kV1.042 kV
(Absorb 2.34 MVAR)(Supply 79.86 MVAR)
Table 10. Comparison of system losses by operating change (line overload case).
Normal OperationConventional ControlRAS ControlSCLM Control
AC system losses 1564.38 MW1575.28 MW1573.28 MW1568.02 MW
DC system losses4.72 MW4.72 MW7.20 MW6.62 MW
Total losses1569.10 MW1580.00 MW1580.48 MW1574.64 MW
% Loading62.98%122.27%
(Security violated)
116.17%119.08%

