Abstract
In this study, different carob extract-based media containing Medium A (included all ingredients), Medium B (included yeast extract and salts), Medium C (included (NH4)2SO4 and salts), Medium D (included only salts) and Medium E (included no ingredients) were evaluated for ethanol fermentation by Saccharomyces cerevisiae in a biofilm reactor and their results were used for kinetic modeling. The logistic model for cell growth, Luedeking-Piret model for ethanol production and Modified Luedeking-Piret model for substrate consumption were studied. Kinetic parameters were determined by fitting the observed values of the models. The findings indicated that the predicted data with the suggested kinetic model for each medium fitted very well the experimental data. Estimated kinetics were also in good agreement with experimental kinetics. The techno-economic analysis was performed with the unit costs of the components used in the medium and ethanol. Medium-based process economic feasibility proved carob extract-based Medium E and subsequently Medium D as most economical for ethanol production. The present study verified the potential of carob extract-based medium for increased economical production of ethanol. In conclusion, the ethanol production in a biofilm reactor is growth-associated since α (gP/gX) was greater than β (gP/gX.h) and Media D and E increased the economic production of carob extract-based ethanol.
1. Introduction
Ethanol, a two-carbon aliphatic alcohol, can be produced from various renewable carbon resources such as rice hulls [1], tea processing wastes [2,3], carob pods [4,5,6,7], rice straw [8], barley husk, wheat bran, rye bran [9], waste potato mash [10,11,12], sugarcane [13], corn grain [14]. Among them, carob has been suggested to be an attractive raw material in the production of bioethanol from renewable sources due to its high carbohydrate content including sucrose, glucose, and fructose [5]. Bioethanol produced from these sources can be used as a fuel with high octane. Besides, it is a biodegradable product that is less toxic than methanol; its combustion causes a reduction in CO2 emissions and is associated with a lower risk of ozone formation than gasoline and diesel [15]. Therefore, it creates an alternative low-cost attractive energy source that can replace fossil fuels [4]. The annual ethanol production in the worldwide is above 80 billion liters [16] and the majority of this (90%–95%) is produced by fermentation [17]. Therefore, it is also a remarkable fuel as it can be used alone or with 10%–22% mixture with gasoline in recent years, especially in Brazil and the U.S. [18]. The most widely used and effective microorganisms for bioethanol production are Saccharomyces cerevisiae, Scheffersomycess stipitis, Zymomonas mobilis, and Candida species, either using fermentation of biomass rich in fermentable sugars or using lignocellulosic biomass and polysaccharides, which require several pre-treatment steps to obtain hydrolysable sugars. Almost 12% of the bioethanol produced by fermentation is beverage alcohol, 20% for various industries uses and the remaining 68% is used as fuel ethanol [4,19,20].
Biofilms are the forms of natural cell immobilization and can be employed in bioreactors [21,22]. Thereby, biofilm reactors can be defined as the reactors in which microbial cells are attached to the support materials to occur the biofilms [5]. Biofilm reactors have been widely used to generate the added-value products such as industrial enzymes, ethanol, vitamins, antibiotics, and biopolymers, since they provide unique environment and advantages including long-term fermentation, higher biomass accumulation, higher production yield, elimination of re-inoculation, time loss prevention (washing, sterilization of bioreactor, etc.), operation stability, additional nutrient releasing from plastic composite support material, high resistance to the microorganisms at the extreme conditions of pH and temperature, contaminations, shear force, hydraulic shocks, antibiotics and toxic substances, decreasing of medium viscosity (especially filamentous microorganisms) and increasing of nutrient and oxygen transfer (especially filamentous microorganisms) [21,22].
Kinetic models can capture information about the kinetic-metabolic nature of a fermentation process, and also assist the control and optimization of the fermentation process. Predictions of product formation and sugar consumption based on cell growth would be valuable for practical and scale-up purposes [23]. Various attempts have been made to develop a model describing the growth of a product producer, product formation and substrate consumption [24,25,26,27,28,29]. However, no kinetic modeling of ethanol fermentation based on the cell growth in carob extract-based biofilm reactor has been made. Therefore, the logistic model was originally used to describe cell growth and also to calculate the kinetics of microbial growth. The Luedeking-Piret (LP) model was used to correlate product formation with biomass growth and substrate consumption while a modified Luedeking-Piret (MLP) model was employed to describe the substrate consumption corresponding with cell growth.
Cost-effective ethanol production from renewable resources is essential since it primarily depends on the cost of the carbon sources and nutrients used in the fermentation media [30]. Therefore, techno-economic analysis of a fermentation process plays a critical role to see whether or not the process is cost-effective. Accordingly, investigation of economically suitable alternatives for raw materials and bioprocess technology platforms have gained momentum in the industrial and academic sectors. The goal is to get low-cost media for fermentation processes that increase the economics of the microbial metabolite production by microorganisms [31]. From this point of view of ethanol production in carob extract-based PCS-biofilm reactor, it could be interesting that fewer nutrients are used in the fermentation media since the PCS material used in the study, which contains organic components and minerals. In that case, this could make the carob extract-based ethanol production in PCS-biofilm reactor more economical.
In our previous study, the conditions of ethanol fermentation were optimized by Box-Behnken response surface methodology (RSM) and followed by the effect of nitrogen source requirement and medium enrichment on ethanol fermentation was also investigated [5]. As a continuation of our previous study, in this study, the experimental ethanol fermentation in carob extract-based biofilm reactor including different nutritional compositions was modelled. Various kinetic models that define cell growth, product formation and substrate consumption were studied by taking into account the impact of the carob extract-based different nutritional compositions in repeated-batch biofilm reactor on the kinetic parameters as well as the techno-economic analysis for ethanol production for the various media compositions.
2. Materials and Methods
2.1. Microorganism and Medium
Saccharomyces cerevisiae (ATCC 36858) was used for ethanol production in a biofilm reactor with CEM, which was obtained from the American Type Culture Collection (Manassas, VA, USA). The seed culture was grown at 30 °C for 48 h in media containing 50 g of glucose, 6 g of yeast extract, 4 g of (NH4)2SO4, 1.5 g of KH2PO4, 1 g of MgSO4.7H2O, and 0.3 g of CaCI2.2H2O per liter of deionized water. The working cultures were maintained at 4 °C and sub-cultured bi-monthly in order to have cell viability. For long-term storage, stock cultures were stored at -80 °C in 20% glycerol [5,7].
2.2. Fermentation Media
For ethanol fermentation in a biofilm reactor, the carob extract was used as an alternative carbon source instead of glucose, which was obtained to a method suggested by Turhan, Bialka, Demirci and Karhan [6]. Under optimized conditions, the fermentation medium (Medium A) contained 7.71°Bx of carob extract, 6 g/L of yeast extract, 4 g/L of (NH4)2SO4, 1.5 g/L of KH2PO4, 1 g/L of MgSO4.7H2O, and 0.3 g/L of CaCI2.2H2O. Additionally, the impacts of nitrogen source requirement and enrichment on ethanol fermentation were also examined at optimized fermentation conditions as follows: Medium B: Yeast extract (6 g/L) was only used as the organic nitrogen source in 7.71°Bx carob extract including 0.3 g/L of CaCI2.2H2O, 1 g/L of MgSO4.7H2O and 1.5 g/L of KH2PO4; Medium C: (NH4)2SO4 (4 g/L) was only used as the inorganic nitrogen source in 7.71°Bx carob extract including 0.3 g/L of CaCI2.2H2O, 1 g/L of MgSO4.7H2O and 1.5 g/L of KH2PO4; Medium D: Mineral salts were used in 7.71ºBx carob extract (0.3 g/L of CaCI2.2H2O, 1 g/L of MgSO4.7H2O, and 1.5 g/L of KH2PO4); Medium E: Non-enriched carob pod extract (7.71ºBx carob extract) was used for ethanol production.
2.3. Repeated-Batch Fermentations
Repeated-batch fermentations were performed in a bench stirred tank reactor (Sartorius Biostad B Plus, Goettingen, Germany) with a 5-L vessel (working volume of 3-L) with the selected plastic composite support (PCS) material, which consists of polypropylene (50%, w/w), soybean hull (35%, w/w), soybean flour (5%, w/w), yeast extract (5%, w/w), bovine albumin (5%, w/w), and mineral salts at trace quantity [32]. The prepared inoculum (24-h grown culture of S. cerevisiae) was used to inoculate the reactor at 1% (v/v) ratio [5]. Seven repeated-batch fermentations were performed for biofilm formation on the selected PCS material at 30 °C, pH 5.5 and 150 rpm agitation speed without aeration. Then, the fermentation conditions were optimized using Box-Behnken RSM in terms of initial sugar concentration (4–10ºBx), agitation speed (100–200 rpm) and pH (5.0–6.0), which were found to be 7.71ºBx (~60 g/L), 120 rpm, and 5.18, respectively. After optimization, the effects of inorganic and organic nitrogen sources used in the media and enrichment on ethanol fermentation were studied in the repeated-batch PCS biofilm reactor, as above. The samples were collected after 0, 2, 4, 8, 12, 24 and 30 h of fermentation and were stored at 4 °C until they were analyzed to determine the biomass concentration, ethanol concentration and residual sugar concentration [5].
2.4. Analysis
Biomass concentration (g/L) was determined by measuring the optical density (OD) with a UV/Vis spectrophotometer (Thermo Scientific 201 UV-Visible Evolution, Shanghai, China) at 620 nm [6]. Ethanol concentration (g/L) was measured by a bio-analyzer (Model YSI 2700, Yellow Springs, Ohio, USA) [6]. Residual sugar concentration (RSC, g/L) was also analyzed by using the 3,5-dinitrosalicylic acid method [33].
2.5. Kinetic Model Development and Determination of Kinetic Parameters
Fundamental kinetic behavior of carob extract-based ethanol fermentation in repeated batch biofilm reactor was defined by kinetic models for cell growth, product formation, and substrate consumption.
2.5.1. Cell Growth Model
In general, microorganisms gave a sigmoidal growth curve including lag phase, log phase, and stationary phase. The logistic function (Equation (6)), which is a sigmoidal equation includes biologically relevant parameters instead of mathematical parameters. When the inhibitory impacts of ethanol and substrate are absent, the cell growth rate follows the well-known exponential relationship as defined by following differential equation (Equation (1)).
where µ is the specific cell growth rate (h−1), which is given by the following equation (Equation (2)).
where µmax is the maximum specific cell growth rate (h−1), KS is the saturation constant (g/L), and S is the residual sugar concentration (g/L). Equation (2) can be employed to define the cell growth rate. When Equation (2) is written in Equation (1), Equation (3) is obtained as follows.
When Equation (3) is integrated with the limits X = X0 when t = 0 and X = Xt when t = t as follows, Equation (5) is yielded.
The cell growth model is expressed by a logistic equation in many fermentation systems, which represents the cell growth from the beginning of the log phase to the stationary phase (including the deceleration phase) [34]. The logistic equation (Equation (6)) is written as follows.
where Xmax is the maximum biomass concentration (g/L). The following equation (Equation (7)) is obtained by integrating Equation (6) with appropriate initial conditions (X = X0 at t = 0).
Or, with the rearrangement of Equation (7), Equation (8) is obtained as follows.
Xmax can directly be used from the experimental data. When is plotted versus t, µmax and X0 are calculated from the slope and the y-shift of the plot, respectively (Figure 1A,D,G,J,M).
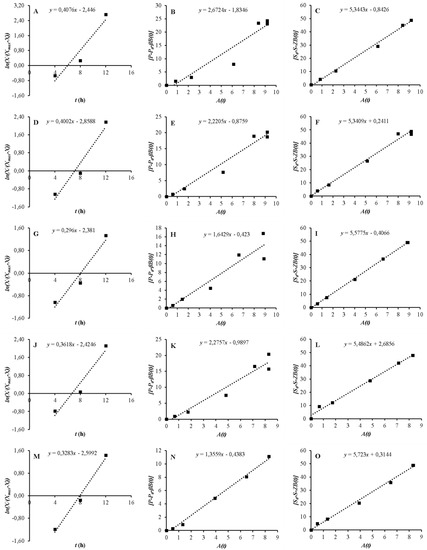
Figure 1.
Determination of µmax, X0 (A, D, G, J, and M), a (B, E, H, K, and N), and (C, F, I, L, and O).
2.5.2. Product Formation Kinetics
For product formation, the Luedeking-Piret (LP) model (Equation (9)) is the most commonly used kinetic model [35]. The LP model was implemented to fit the experimental ethanol production data in biofilm reactors with Media A–E under optimized conditions. As shown in Equation (9), the rate of product formation depends on X and dX/dt in a linear fashion.
where a and β are the product formation constants that may vary with the fermentation condition. If a ≠ 0 and β = 0, product formation is growth associated. If a ≠ 0 and β ≠ 0, product formation is mixed-growth-associated. If a = 0 and β ≠ 0, product formation is non-growth associated [36]. The β can be easily calculated from the data at the stationary phase (Equation (10)). At stationary phase, dX/dt = 0 and X = Xmax.
The product (P) is obtained as a function of time from Equation (9) as follows (Equation (11)).
Using Equation (7) for Xt, when Equation (11) is integrated by P = P0 initial condition at t = 0, the change of product concentration with time can be determined by the following equation (Equation (12)).
Equation (12) can be also written as follows (Equation (13)).
where and .
When is plotted versus , the growth-dependent product formation constant (a) can be found from the slope of the plot (Figure 1B,E,H,K,N).
2.5.3. Sugar Consumption Kinetics
The substrate consumption rate was represented by modified a Luedeking-Piret (MLP) model (Equation (14)) which takes account of substrate conversion to the cell mass and product and substrate consumption for maintenance [37]. MLP model was utilized to fit the actual data of substrate consumption in PCS-biofilm reactors including Media A–E under optimized conditions.
where m represents the substrate used to support cell maintenance. If Equation (9) is written in Equation (14), Equation (15) is obtained.
At stationary phase, dX/dt = 0 and X = Xmax. From Equation (15),
The substrate (S) is obtained as a function of time from Equation (15) as follows (Equation (17)).
If Equation (7) is written in Equation (17) and is integrated at t = 0 for S = S0, the following equation is obtained (Equation (18)).
To find , Equation (18) is written as follows (Equation (19)).
When is plotted versus A(t), is found from the slope of the plot (Figure 1C,F,I,L,O).
Besides, the following kinetics [2,8,9] were also calculated using the predicted data and compared with the experimental kinetics (Equations (20)–(31)):
where, ΔX is the biomass production (g/L), ΔP is the ethanol production (g/L), ΔS is the sugar consumption (g/L), Xmin, Pmin, and Smin are minimum biomass, ethanol, and sugar concentrations (g/L), respectively, Xmax, Pmax, and Smax are maximum biomass, ethanol, and sugar concentrations (g/L), respectively, YX/S is the biomass yield (%),YP/S is the ethanol yield (%),YP/X is the ethanol production per biomass (g ethanol/g biomass), YS/X is the sugar consumption per biomass (g sugar/g biomass), QX is the maximum growth rate (g/L/h), QP is the maximum production rate (g/L/h), QS is the maximum consumption rate (g/L/h), µmax is the maximum specific growth rate (h−1), SUY is the sugar utilization yield (%), and η is the theoretical ethanol yield (%). Additionally, the lag time (λ, h) was also calculated. Based on Figure 2, the linear equation of the steepest part of the biomass was obtained in the form of y = ax + b. Here, y is the lower asymptote for biomass and x is the lag time. Therefore, as the y, a, and b values are known, the x value (λ) is easily computed [2,38].
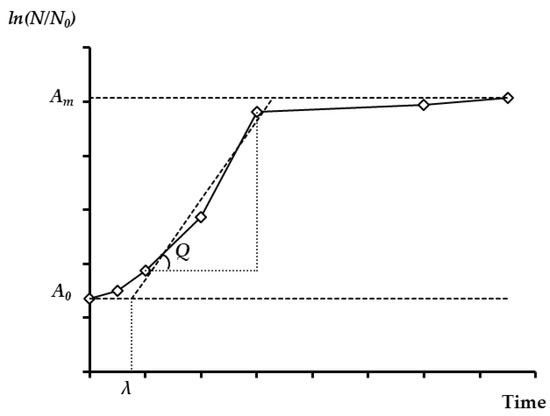
Figure 2.
A growth curve, where A0 is the lower asymptote, Am is the upper asymptote (Am = ln N/N0), Q is the maximum growth rate (g/L/h), lag-time (λ) is x-axis intercept of the tangent in the inflection point, ln (N/N0) is the logarithm of the relative population size.
2.6. Model Evaluation and Validation
To evaluate the kinetic model for each medium, root-mean-square-error (RMSE), mean-absolute-error (MAE), regression coefficient (R2), slope, bias factor (BF), and accuracy factor (AF) were used as follows: The RMSE (Equation (32)) has been applied to be a standard statistical metric to evaluate model performance in biotechnological processes or other processes and the MAE (Equation (33)) is also commonly used measure in model assessments [39]. After obtaining the predicted data using kinetic models, they were plotted versus experimental data and thus the R2 values were determined.
Additionally, the BF (Equation (34)) and AF (Equation (35)) have been suggested to validate the kinetic model [40]. A kinetic model would ideally have AF = BF = 1 in the case of no structural deviation, illustrating the exact match between actual observation and model predictions. If 1 ≤ AF < 1.20, the model is “good”, if 1.20 ≤ AF ≤ 1.30, the model is "acceptable", and if AF > 1.30, the model is “unacceptable”. If 0.95 ≤ BF ≤ 1.11, the model is “good”, if 0.87 ≤ BF < 0.95 or 1.11 < BF ≤ 1.43, the model is “acceptable”, and if BF < 0.87 or BF > 1.43, the model is “unacceptable” [41].
where n is the number of observations (n = 7) and xt and yt represent the experimental and predicted data at time “t” (g/L), respectively.
In order to assess the fitting accuracy of the kinetic models, the objective function (Φ-value, Equation (36)) was used. The parameters of kinetic models have been calculated to minimize Φ-value:
where Xmax, Pmax and Smax are the maximum observations of the relevant measurements and subscripts "exp" and "pre" denote the experimental and calculated values, respectively. Since the statistic is not dependent on the size of the measurements, the Φ-value was used. Predictions for model parameters were attained by minimizing the Φ-value [42].
2.7. Techno-Economic Analysis of Ethanol Production
Techno-economic feasibility of ethanol fermentation was analyzed by estimating economic yield (EY) and economic productivity (EP) [43]. EY and EP of ethanol production were computed utilizing Equations (37) and (38).
where P is the ethanol concentration (g/L), I is the selling price of ethanol (€/g), C is the cost of the nutrients used in the media (€/g), N is the nutrient concentration (g/L), and t is the fermentation time (h).
3. Results and Discussion
3.1. Kinetic Modeling of Cell Growth
In order to create a model for describing the growth of microorganisms, it is necessary to measure growth curves. A kinetic model can be used to define the growth curve. To achieve this, the logistic model was implemented and evaluated for biomass production to comply with the experimental data [23]. Table 1 shows the calculated parameters of the logistic equation. In Equation (8), X0 and µmax were found by plotting the values of against t. As shown in Figure 1A,D,G,J,M, the slope of the plots gives µmax, which were 0.4076, 0.4002, 0.296, 0.3618, and 0.3283 h−1 for Media A, B, C, D, and E, respectively (Table 1). Please note that Xo values for each medium in Table 1 are slightly different due to the nature of repeated biofilm fermentation without any new inoculation. When yeast extract was not used in the medium (Medium C), µmax considerably decreased. On the other hand, when ammonium sulfate was not used and yeast extract was used in the environment, µmax slightly reduced. Additionally, when mineral salts were only utilized in the medium and no nutrients were employed in the medium, µmax also reduced. It is thought that decrease of µmax in Medium C and relative increase of µmax in Media D and E compared to Medium C is probably related to the release of the nutrients in PCS materials used in the biofilm reactor [44]. Besides, X0 is calculated from the y-shift of the plots in Equation (8) (Table 1). It was found that the calculated X0 values were all lower than the experimental X0 values. The experimental and predicted cell growth data were also plotted versus time (Figure 3). It can be said that the logistic equation underestimated the actual cell growth at lag phase while it over-predicted the experimental cell growth data at log phase (Figure 3). Besides, the logistic equation only predicted the observed cell growth data at acceleration, deceleration, and stationary phases (Figure 3).

Table 1.
The calculated model parameters for logistic, Luedeking-Piret (LP), and Modified Luedeking-Piret (MLP) equations.
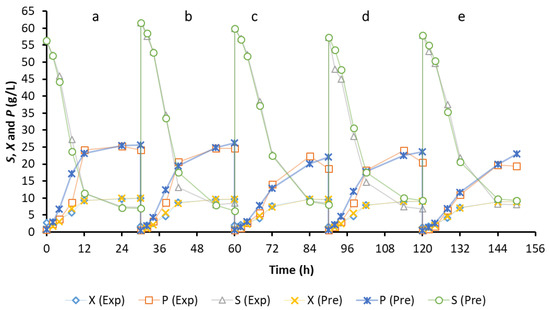
Figure 3.
Cell growth, ethanol production and substrate consumption curves fitted by the logistic model, LP model and MLP model.
Additionally, the cell growth in the biofilm reactor including Media A–E was described by the logistic function based on the experimental data, by applying the model parameters given in Table 1. The model results indicated that the lowest values of RMSE and MAE were achieved when Medium E was used in the biofilm reactor. On the contrary, the maximum levels were determined when using Medium A in the biofilm reactor. In addition, the resulting R2 and slope values ranged between 0.96 and 0.99 and between 1.06 and 1.19. Similarly, Medium A gave the lowest value of R2 while Medium E yielded its highest value. Therefore, it can be concluded that the estimated results gave a relatively good agreement with the experimental data, with R2 values above 0.9 [36]. This indicates that the suggested model was sufficient to define S. cerevisiae growth in batch cultivation. Similar to R2, Medium A yielded the highest slope value; however, Medium E gave the lowest slope value. The slope is a number that indicates how much and which direction a line of regression is fitting. It was used when estimating the variable Y (dependent), where Y represents the predicted values. Therefore, as long as the slope was close to 1, the estimated values were closer to the experimental values [45]. On the other hand, Table 1 shows the BF and AF values. Results indicated that the logistic equation was “acceptable” due to BF values (1.11 < BF < 1.43). According to the AF value, the logistic model was “acceptable” for Media C, D and E (1.20 ≤ AF ≤ 1.30), except for Media A and B (AF > 1.30) (Table 1). In conclusion, the logistic model adequately described the growth of the yeast S. cerevisiae in the biofilm reactor including different nutritional compositions. Numerous models have been utilized to define the sigmoidal curves of microbial growth, containing the logistic model which fitted microbial growth over time. In a study (Table 2), the logistic model was used to define the kinetics of the growth of Aspergillus terreus and Kluyveromyces marxianus in a batch fermentation system using banana and pineapple wastes. For validation, R2 and root-mean-square-deviation (RMSD) were used. It was reported that logistic model was good adapted to the observed data with high R2 (0.98) and low RMSD (0.49 g/L) for simultaneous saccharification and co-fermentation using banana waste in comparison with pineapple waste (R2 = 0.93 and RMSD = 1.64 g/L) (Teoh and Ooi, 2016). Similarly, the logistic model was employed to describe the growth of the recombinant Escherichia coli on the pyrolysate sugars derived from waste cotton. It was found that initial and maximum biomass levels (0.95 and 3.75 g/L, respectively) were calculated to be 0.95 and 3.75 g/L, respectively. Since a high R2 value (0.976) was obtained, it was determined that the model was reliable [24] (Table 2). Additionally, two different strains of S. cerevisiae were used for ethanol production from red beet juice and the results were kinetic modeled by researchers. Findings were almost the same as our results as seen in Table 2 [25]. Accordingly, these findings indicated that our results were highly compatible with the existing results in the literature.
Table 2.
Model parameters for different ethanol fermentations.
After modeling, the kinetic parameters including ∆X, YX/S, QX, λ, and µmax related to cell growth were also calculated and compared with their experimental results (Table 3). Based on the results in Table 3, the experimental values of ∆X and YX/S were slightly higher estimated by the model. Besides, during the batch culture with Media A–E, the values of QX and µmax of S. cerevisiae were predicted to be 0.77 g/L/h and 0.41/h, 0.79 g/L/h and 0.40/h, 0.65 g/L/h and 0.30/h, 0.67 g/L/h and 0.36/h, and 0.65 g/L/h and 0.33/h, which are in a very good agreement with their experimental results, respectively (Table 3). However, the lag times were all lower based on the model (Table 3), which might be due to the lower estimation of the initial biomass concentrations.
Table 3.
The calculated kinetics from the experimental and the predicted data related to cell growth, ethanol production and substrate consumption.
3.2. Kinetic Modeling of Product Formation
For product formation, the experimental data, which were utilized to calculate the model kinetic parameters, were used to build the LP model (Equation (12)). Satisfactory fitting results were achieved with R2, which ranged from 0.9217 to 0.9870. When the regression coefficients for the kinetic models analyzed were higher than 0.90, it can be accepted that they explain higher fractions of the total variation [38,46]. The calculated non-growth associate terms of ethanol (β) in different nutritional compositions were all close to zero, which ranged from 0.0011 to 0.0571 gP/gX.h (Table 1).
On the other hand, the growth-associated constants (a) for ethanol in different medium contents varied from 1.3559–2.6724 gP/gX (Table 1 and Figure 1B,E,H,K,N). Namely, the value of a was 24–2359 fold higher than that of β (Table 1). The results indicated that as a ≠ 0 and β value was obtained very close to zero, product formation was growth-associated in PCS biofilm reactor. Some existing results in the literature are given in Table 2. Teoh and Ooi [29] produced ethanol from banana and pineapple wastes and the experimental data obtained were predicted by the LP model. According to their findings, the empirical constants, a and β, were not equal to zero, even the β values were calculated negative. Therefore, it was reported that ethanol production was growth associated, which assisted the result obtained from this study. It was also stated that the experimental ethanol production data from banana and pineapple wastes fitted well the predicted data from LP model (R2 = 0.98 and 0.91 and RMSD = 0.0019 and 0.0178 g/L, respectively) [29]. In another study, the pyrolysate derived from untreated cotton waste was pretreated with 0.2 M H2SO4 at 120 °C for 25 min. After detoxification, the acid-hydrolysate pyrolytic sugars were used for ethanol production by E. coli. Then the experimental data were estimated by the LP model. It was noted that a and β were 0.05 gP/gX and 0.29 gP/gX.h, respectively (R2 = 0.996), indicating that ethanol formation was growth associated due to a very small β value [24]. On the other hand, the kinetic modeling of ethanol production from red beet juice using two different S. cerevisiae strains was also performed and the values of a and β were found to be 5.3143 gP/gX and -0.044 gP/gX.h for ITD00196 and 4.5326 gP/gX and 0.1047 gP/gX.h for ATCC 9763 (Table 2). Therefore, β values were 121 and 43-fold smaller than that of a and show that product formation is growth-associated (Jiménez-Islas et al., 2014). Similarly, Liu, et al. [47] modelled the ethanol production from the pretreated corn stover by the co-culture of S. cerevisiae and C. tropicalis. When the calculated kinetic parameters related to ethanol production, a (2.392 gP/gX) and β (0.013 gP/gX.h), were examined, it was observed that the ethanol production was growth associated due to very small β value, such that the a value was 184-fold higher than the β value. In conclusion, our results are highly compatible with the existing results in the literature.
Subjective comparison of the ethanol production curve with LP model was given by plotting both the observed and predicted data (Figure 3). LP model relatively high predicted the experimental data in the acceleration and log phases of the fermentation in Medium A, in acceleration and log phases of the fermentation in Medium B, in log and stationary phases of the fermentation in Medium C, in acceleration, log and stationary phases of the fermentation in Medium D, and in the stationary phase of the fermentation in Medium E. Besides, the deceleration phase data of the fermentation in Medium C were slightly underestimated with the LP model.
Additionally, Table 1 also shows the success of LP equation, which was evaluated in terms of RMSE, MAE, slope, BF, and AF. The results in Table 1 indicate that the RMSE and MAE values were between 1.43 and 3.46 g/L and between and 0.88 and 2.11 g/L, respectively, showing that higher error values were obtained from Medium A while lower errors were achieved by Medium E. The slope values also varied between 0.92 and 1.07, such that the slope values of Media C and D were equal to each other, which were yielded as 0.97. The values of the slope indicated that the predicted values were close to the experimental values as they were all close to 1. Additionally, the BF values from the predicted data with the LP model were less than 0.87 except for that of Medium C (0.91). On the other hand, AF values from the predicted data with the LP model were 1.00≤AF≤ 1.20 except for that of Media A (1.26) and D (1.21). Thus, although LP model was “unacceptable” for Media A, B and D based on the BF values, LP model was “good” for Media B, C, and D and was "acceptable" for Media A and D depending on the AF values in Table 1. Therefore, it can be concluded that the LP model satisfactorily can be used to predict ethanol production in biofilm reactors.
Afterwards, the experimental kinetic parameters related to ethanol production were also estimated using the data from the LP model (Table 3). The results indicate that, except for Medium E, the observed values of ΔP, YP/S and η were satisfactorily predicted by the LP model. For Medium E, their values were higher speculated by the LP model (Table 3). Nevertheless, the LP model forecasted slightly lower experimental values of YP/X, except for Medium E. During ethanol fermentation, the maximum volumetric productivities of ethanol were estimated to be 2.05, 1.90, 1.22, 1.64, and 1.13 g/L/h, respectively (Table 3). Generally, the fitting kinetic results were satisfactory.
3.3. Kinetic Modeling of Substrate Consumption
The sugar consumption rate was mainly a function of cell growth rate, product formation and rate of substrate uptake for Z [36]. The experimental values were fitted to Equation (18). The model parameters of substrate consumption for each medium are shown in Table 1. The values of Z and γ ranged from 0.0012 gS/gX.h to 0.0284 gS/gX.h and from 5.3409 gS/gX to 5.7230 gS/gX. Their minimum and maximum values were determined by the utilization of Media A and B for Z and Media B and E for γ, respectively (Table 1 and Figure 1C,F,I,L,O). The γ values coincided with the results in Table 3.
Typically, when energy and carbon sources were high, microorganisms tended to distribute excess energy and carbon through the formation of storage compounds or extracellular products. Some products such as acetic acid, lactic acid and even ethanol that occur during fermentation negatively affect cell growth [36]. Therefore, a maintenance coefficient (Z) was used to describe the specific substrate uptake rate for cellular maintenance, in which it is varied for each medium tested. It was reported that the Z may vary according to the specific growth rate [48]. Later on, it was stated that Z represents the energy expenditure needed to repair damaged cellular components, to transfer certain nutrients and products in and out of cells, to move and to adjust the osmolarity of the cells in the inner volume [30]. It was also mentioned that the values of Z may vary from 0.02 to 4 gS/gX.h based on the environmental conditions surrounding the cell and growth rate [36,49]. As seen from results in Table 1, the Z values of all fermentations were very low, indicating that the yeast mainly utilizes the sugars in the carob extract for ethanol and biomass production. Besides, this obviously indicated that the MLP model was capable of estimating the results of substrate consumption with a good amount of accuracy for each medium tested. On the other hand, the values of Z in Table 2 were close to zero except for that of Chang, Yu, Islam and Zhang [24], Martynova, Mednis, Vigants and Zikmanis [26] and Teoh and Ooi [29] (as a substrate banana waste), which assisted our results. The high values of Z in Table 2 indicate that an important part of the carbon source used was employed for maintenance in strains [25].
Subjective comparisons of the sugar consumption curve with MLP model were given by plotting both the actual data and the estimated values from the models (Figure 3). The results indicate that the MLP model estimated slightly lower values in the log phase of the fermentation in Medium A and in the stationary phase of the fermentation in Medium B. Besides, the data at the end of the log phase of the fermentation in Medium B were slightly overestimated with the MLP model. On the other hand, the experimental sugar consumption in all phases of the fermentation in Medium C was successfully estimated with the MLP model. However, the data in all phases of the fermentation in Medium D were predicted to be slightly higher with the MLP model. For Medium E, the experimental data in the stationary phase were only slightly high predicted by the model.
Finally, the comparison and validation of the MLP model were performed based on the values of RMSE, MAE, R2, slope, BF, and AF (Table 1). For different nutritional compositions, the values of RMSE and MAE varied between 0.38 and 2.19 g/L and 0.20 and 1.34 g/L, respectively. Their lowest and highest values were determined by the usage of Media C and D, respectively. On the other hand, satisfactory results were yielded with R2, which were above 0.992. Similar to R2, the slope values were equal to 1 for Media A, B, and C while it was 0.99 for Media D and E (Table 1). Additionally, BF values except for that of Medium D (0.86) were all between 0.96 and 1.04. This (BF with MLP mode l = 0.86 for Medium D) is because the predicted data are slightly higher than the experimental data in all phases (Figure 3). Similarly, AF values ranged from 1.02 to 1.16 (Table 1). Therefore, the MLP model was “good” based on the BF and AF values. Consequently, the MLP model can describe the experimental sugar consumption data in the biofilm reactor containing different medium compositions.
In addition, the kinetic parameters related to sugar consumption were predicted using the data obtained from the MLP model and the results were represented in Table 3. The results indicated that the predicted values of ΔS and SUY with MLP model were slightly higher than its experimental values, except for Media D and E. Besides, the MLP model estimated slightly lower experimental values of YS/X. Nevertheless, the maximum volumetric sugar consumption rates in Media A, B, C, D, and E were predicted to be 4.10, 4.40, 3.65, 3.77 and 3.71 g/L/h, which were in good agreement with the experimental results of 4.31, 5.00, 3.69, 3.80 and 3.47 g/L/h, respectively (Table 3). Accordingly, the predicted results were highly compatible with the experimental sugar consumption kinetics.
On the other hand, the Φ-values for Media A, B, C, D and E were calculated to be 0.212, 0.078, 0.075, 0.096 and 0.055, respectively (Table 1). Therefore, based on the Φ-values, the order to represent all the experimental data of the model determined for each medium is in the form of Media E, C, B, D and A, respectively. In a study, the Φ-value of the kinetic model related to ethanol production was found to be 0.1 [28]. Therefore, it can be concluded that the overall present models except for that of Medium A better represent all experimental data.
3.4. Techno-Economic Analysis of Ethanol Fermentations
Techno-economic analysis of ethanol fermentations at different nutritional contents was analyzed by calculating the economic yield (EY) and economic productivity (EP) from the experimental and predicted values. The major cost factors in the media used in fermentation are carbon, nitrogen and mineral sources [30]. Therefore, they were evaluated in economic analysis. The cost information of the components used in the fermentation medium and ethanol were taken from Sigma-Aldrich (www.sigmaaldrich.com) and given in Table 4. Besides, lower prices could be found for industrial grade ingredients at the commercial scale. Figure 4 shows the experimental and predicted EY and EP values for each nutritional composition. It is obvious that Medium E has indicated high EY (5.763 and 6.708 € of ethanol/€ of nutrient for experimental and predicted, respectively) and EP (0.266 and 0.283 € of ethanol/€ of nutrient.h for experimental and predicted, respectively) over Media A, B, C and D (Figure 4a,b). Media A and B gave very poor EY (0.367 and 0.432 € of ethanol/€ of nutrient for experimental and 0.372 and 0.460 € of ethanol/€ of nutrient for predicted, respectively) and EP (0.029 and 0.030 € of ethanol/€ of nutrient.h for experimental and 0.031 and 0.028 € of ethanol/€ of nutrient.h for predicted, respectively) values (Figure 4a,b). Media C and D also provided a significant increase in EY (1.115 and 2.858 € of ethanol/€ of nutrient for experimental and 1.102 and 2.807 € of ethanol/€ of nutrient for predicted, respectively) and EP (0.058 and 0.180 € of ethanol/€ of nutrient.h for experimental and 0.054 and 0.178 € of ethanol/€ of nutrient.h for predicted, respectively) values (Figure 4a,b). Accordingly, in terms of both experimental and predicted results, Medium E resulted in maximum EY and EP in the biofilm reactor.
Table 4.
Cost of nutrients used in different media compositions.
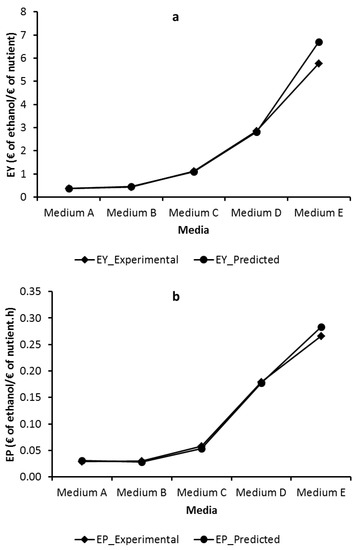
Figure 4.
Economic yield (EY, a) and economic productivity (EP, b) of ethanol on different nutritional compositions.
Additionally, the experimental and predicted EY and EP values would ensure foresight in the selection of medium composition for the production of economic ethanol. To study the variation in EY and EP during the course of the fermentation, dynamic ethanol values yielded during the experimental and kinetic studies (Figure 3) were employed and the results were demonstrated on Figure 5. Based on the results, the experimental and predicted EY values showed a similar trend with the experimental and predicted ethanol production data. On the other hand, since the experimental and predicted EY values of Media A and B during the whole fermentation period were less than 1 € of ethanol/€ of nutrient (Figure 5a,b), it indicates that ethanol production using Media A and B in a biofilm reactor is not economical. Besides, the experimental and predicted EY values reached over 1 € of ethanol/€ of nutrient after 24th, 8th and 8th hours of fermentation in Media C, D and E, respectively (Figure 5c,d,e), which substantiate that ethanol production in Media C, D and E is economical. On the other hand, the prolongation of fermentation led to a decrease in EP (Figure 5). When the experimental ethanol results, shown in Figure 3, were examined, although there was generally an improvement in ethanol production between 12 and 24 h, a severe decrease in EP can be seen after 12 h. The experimental optimum EP values (0.0293, 0.0301, 0.0581, 0.1795 and 0.2658 € of ethanol/€ of nutrient.h in Media A, B, C, D and E, respectively) were achieved at 12 h, therefore beyond 12 h of fermentation, the ethanol production processes were not economical. Similar EP results were also obtained from the predicted ethanol values (Figure 5). However, maximum EP values of Media A and D (0.0312 and 0.1776 € of ethanol/€ of nutrient.h, respectively) were yielded after the 8th hour of the predicted fermentation (Figure 5a,d). Accordingly, based on the results, a fermentation period of 12 h and the usage of Media C, D and E for the production of ethanol using S. cerevisiae in the biofilm reactor would be more economical.
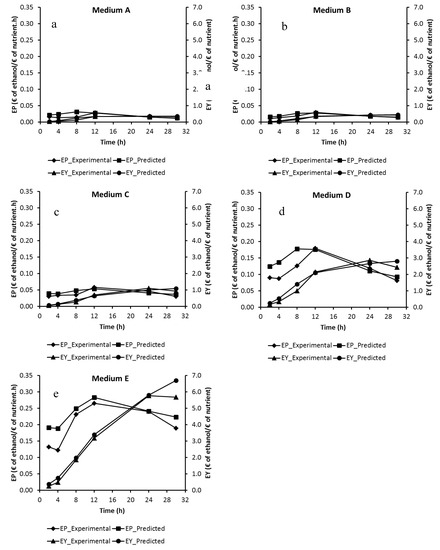
Figure 5.
Dynamic profiles of economic productivity, EP, and economic yield, EY, studied for the kinetic experiment at different nutritional compositions.
4. Conclusions
The suggested models for each medium satisfactorily estimated the cell growth, ethanol production and substrate consumption with higher R2 > 0.92. It was also shown that the predicted results with the suggested kinetic models were in good agreement with the experimental data based on the model evaluation, validation and fitting results. Besides, it was found that the carob extract-based ethanol productions in the biofilm reactor were growth-associated due to a higher α value than β value and a very small β value. Medium-based economic analysis substantiated Medium E and subsequently Medium D as the most economical for ethanol production from carob extract-based medium in a biofilm reactor. This kinetic modelling would be handy for optimal medium formulation and improved process design to develop the large-scale production of ethanol.
Author Contributions
All the authors designed and coordinated the research topic; M.G. carried out the laboratory studies and numerical analysis; all the authors were involved in research design, writing and revising the manuscript.
Funding
This study was partly funded by the Akdeniz University Research Foundation (Grant number #2014.02.0121.020) and the USDA National Institute of Food and Agriculture Federal Appropriations under Project #PEN04594 and Accession number #1007291.
Conflicts of Interest
The authors declare no conflict of interest.
References
- Germec, M.; Kartal, F.K.; Bilgic, M.; Ilgin, M.; Ilhan, E.; Güldali, H.; Isci, A.; Turhan, I. Ethanol production from rice hull using Pichia stipitis and optimization of acid pretreatment and detoxification processes. Biotechnol. Prog. 2016, 32, 872–882. [Google Scholar] [CrossRef] [PubMed]
- Germec, M.; Turhan, I. Ethanol production from acid-pretreated and detoxified tea processing waste and its modeling. Fuel 2018, 231, 101–109. [Google Scholar] [CrossRef]
- Germec, M.; Turhan, I.; Yatmaz, E.; Tetik, N.; Karhan, M. Fermentation of acid-pretreated tea processing waste for ethanol production using Saccharomyces cerevisiae. Sci. Bull Ser. F Biotechnol. 2016, 20, 269–274. [Google Scholar]
- Bahry, H.; Pons, A.; Abdallah, R.; Pierre, G.; Delattre, C.; Fayad, N.; Taha, S.; Vial, C. Valorization of carob waste: Definition of a second-generation bioethanol production process. Bioresour. Technol. 2017, 235, 25–34. [Google Scholar] [CrossRef]
- Germec, M.; Turhan, I.; Karhan, M.; Demirci, A. Ethanol production via repeated-batch fermentation from carob pod extract by using Saccharomyces cerevisiae in biofilm reactor. Fuel 2015, 161, 304–311. [Google Scholar] [CrossRef]
- Turhan, I.; Bialka, K.L.; Demirci, A.; Karhan, M. Ethanol production from carob extract by using Saccharomyces cerevisiae. Bioresour. Technol. 2010, 101, 5290–5296. [Google Scholar] [CrossRef] [PubMed]
- Yatmaz, E.; Turhan, I.; Karhan, M. Optimization of ethanol production from carob pod extract using immobilized Saccharomyces cerevisiae cells in a stirred tank bioreactor. Bioresour. Technol. 2013, 135, 365–371. [Google Scholar]
- Germec, M.; Turhan, I. Ethanol production from acid-pretreated and detoxified rice straw as sole renewable resource. Biomass Convers. Biorefinery 2018, 8, 607–619. [Google Scholar] [CrossRef]
- Germec, M.; Ozcan, A.; Yilmazer, C.; Tas, N.; Onuk, Z.; Demirel, F.; Turhan, I. Ethanol fermentation from microwave-assisted acid pretreated raw materials by Scheffersomyces stipitis. Agrolife Sci. J. 2017, 6, 112–118. [Google Scholar]
- Izmirlioglu, G.; Demirci, A. Ethanol production from waste potato mash by using Saccharomyces cerevisiae. Appl. Sci. 2012, 2, 738–753. [Google Scholar] [CrossRef]
- Izmirlioglu, G.; Demirci, A. Ethanol production in biofilm reactors from potato waste hydrolysate and optimization of growth parameters for Saccharomyces cerevisiae. Fuel 2016, 181, 643–651. [Google Scholar] [CrossRef]
- Izmirlioglu, G.; Demirci, A. Simultaneous saccharification and fermentation of ethanol from potato waste by co-cultures of Aspergillus niger and Saccharomyces cerevisiae in biofilm reactors. Fuel 2017, 202, 260–270. [Google Scholar] [CrossRef]
- Brinkman, M.L.; da Cunha, M.P.; Heijnen, S.; Wicke, B.; Guilhoto, J.J.; Walter, A.; Faaij, A.P.; van der Hilst, F. Interregional assessment of socio-economic effects of sugarcane ethanol production in Brazil. Renew. Sustain. Energy Rev. 2018, 88, 347–362. [Google Scholar] [CrossRef]
- Chen, X.; Khanna, M. Effect of corn ethanol production on Conservation Reserve Program acres in the US. Appl. Energy 2018, 225, 124–134. [Google Scholar] [CrossRef]
- Thangavelu, S.K.; Ahmed, A.S.; Ani, F.N. Review on bioethanol as alternative fuel for spark ignition engines. Renew. Sustain. Energy Rev. 2016, 56, 820–835. [Google Scholar] [CrossRef]
- RFA. Renewable Fuel Association of the United Nations. Available online: https://ethanolrfa.org/resources/industry/statistics/ (accessed on 4 September 2018).
- Sarris, D.; Papanikolaou, S. Biotechnological production of ethanol: Biochemistry, processes and technologies. Eng. Life Sci. 2016, 16, 307–329. [Google Scholar] [CrossRef]
- Wu, X.; McLaren, J.; Madl, R.; Wang, D. Biofuels from Lignocellulosic Biomass. In Sustainable Biotechnology; Singh, O.V., Harvey, S.P., Eds.; Springer: New York, NY, USA, 2010; pp. 19–41. [Google Scholar] [CrossRef]
- Brethauer, S.; Wyman, C.E. Continuous hydrolysis and fermentation for cellulosic ethanol production. Bioresour. Technol. 2010, 101, 4862–4874. [Google Scholar] [CrossRef]
- Waites, M.J.; Morgan, N.L.; Rockey, J.S.; Higton, G. Industrial Microbiology: An Introduction; John Wiley & Sons: Hoboken, NJ, USA, 2009. [Google Scholar]
- Cheng, K.-C.; Demirci, A.; Catchmark, J.M. Advances in biofilm reactors for production of value-added products. Appl. Microbiol. Biotechnol. 2010, 87, 445–456. [Google Scholar] [CrossRef]
- Ercan, D.; Demirci, A. Current and future trends for biofilm reactors for fermentation processes. Crit. Rev. Biotechnol. 2015, 35, 1–14. [Google Scholar] [CrossRef]
- Cheng, K.-C.; Demirci, A.; Catchmark, J.M.; Puri, V.M. Modeling of pullulan fermentation by using a color variant strain of Aureobasidium pullulans. J. Food Eng. 2010, 98, 353–359. [Google Scholar] [CrossRef]
- Chang, D.; Yu, Z.; Islam, Z.; Zhang, H. Mathematical modeling of the fermentation of acid-hydrolyzed pyrolytic sugars to ethanol by the engineered strain Escherichia coli ACCC 11177. Appl. Microbiol. Biotechnol. 2015, 99, 4093–4105. [Google Scholar] [CrossRef] [PubMed]
- Jiménez-Islas, D.; Páez-Lerma, J.; Soto-Cruz, N.O.; Gracida, J. Modelling of ethanol production from red beet juice by Saccharomyces cerevisiae under thermal and acid stress conditions. Food Technol. Biotechnol. 2014, 52, 93–100. [Google Scholar]
- Martynova, J.; Mednis, M.; Vigants, A.; Zikmanis, P. Kinetic modeling of ethanol fermentation by yeast Kluyveromyces marxianus from lactose- and inulin-containing substrates. Eng. Rural Dev. 2017, 88–97. [Google Scholar]
- Sasikumar, E.; Viruthagiri, T. Optimization of process conditions using response surface methodology (RSM) for ethanol production from pretreated sugarcane bagasse: Kinetics and modeling. Bioenergy Res. 2008, 1, 239–247. [Google Scholar] [CrossRef]
- Suresh, S.; Srivastava, V.; Sakthivel, S.; Arisutha, S. Kinetic Modeling of Ethanol Production for Substrate–Microbe System. In Biorefining of Biomass to Biofuels; Springer: Berlin/Heidelberg, Germany, 2018; pp. 361–372. [Google Scholar]
- Teoh, Y.; Ooi, Z. Evaluation of unstructured kinetic models for the production of bioethanol from banana and pineapple wastes. Bioresources 2016, 11, 4295–4305. [Google Scholar] [CrossRef]
- Shuler, M.L.; Kargi, F.; DeLisa, M. Bioprocess Engineering: Basic Concepts, 3rd ed.; Prentice Hall: Upper Saddle River, NJ, USA, 2017. [Google Scholar]
- Rohit, S.G.; Jyoti, P.K.; Subbi, R.R.T.; Naresh, M.; Senthilkumar, S. Kinetic modeling of hyaluronic acid production in palmyra palm (Borassus flabellifer) based medium by Streptococcus zooepidemicus MTCC 3523. Biochem. Eng. J. 2018, 137, 284–293. [Google Scholar] [CrossRef]
- Ho, K.; Pometto, A.; Hinz, P.N.; Dickson, J.S.; Demirci, A. Ingredient selection for plastic composite supports for L-(+)-lactic acid biofilm fermentation by Lactobacillus casei subsp. rhamnosus. Appl. Environ. Microbiol. 1997, 63, 2516–2523. [Google Scholar]
- Miller, G.L. Use of dinitrosalicylic acid reagent for determination of reducing sugar. Anal. Chem. 1959, 31, 426–428. [Google Scholar] [CrossRef]
- Pearl, R.; Reed, L.J. On the rate of growth of the population of the United States since 1790 and its mathematical representation. Proc. Natl. Acad. Sci. USA 1920, 6, 275–288. [Google Scholar] [CrossRef]
- Luedeking, R.; Piret, E.L. A kinetic study of the lactic acid fermentation. Batch process at controlled pH. J. Biochem. Microbiol. Technol. Eng. 1959, 1, 393–412. [Google Scholar] [CrossRef]
- Don, M.; Shoparwe, N. Kinetics of hyaluronic acid production by Streptococcus zooepidemicus considering the effect of glucose. Biochem. Eng. J. 2010, 49, 95–103. [Google Scholar] [CrossRef]
- Mohammad, F.; Badr-Eldin, S.; El-Tayeb, O.; El-Rahman, O.A. Polysaccharide production by Aureobasidium pullulans III. The influence of initial sucrose concentration on batch kinetics. Biomass Bioenergy 1995, 8, 121–129. [Google Scholar] [CrossRef]
- Germec, M.; Cheng, K.-C.; Karhan, M.; Demirci, A.; Turhan, I. Application of mathematical models to ethanol fermentation in biofilm reactor with carob extract. Biomass Convers. Biorefinery 2019. in print. [Google Scholar] [CrossRef]
- Chai, T.; Draxler, R.R. Root mean square error (RMSE) or mean absolute error (MAE)?–Arguments against avoiding RMSE in the literature. Geosci. Model. Dev. 2014, 7, 1247–1250. [Google Scholar] [CrossRef]
- Ross, T. Indices for performance evaluation of predictive models in food microbiology. J. Appl. Microbiol. 1996, 81, 501–508. [Google Scholar] [CrossRef]
- Ross, T. Predictive Food Microbiology Models in the Meat Industry; Meat and Livestock Australia: North Sydney, Australia, 1999. [Google Scholar]
- Feng, J.; Zhang, J.-S.; Jia, W.; Yang, Y.; Liu, F.; Lin, C.-C. An unstructured kinetic model for the improvement of triterpenes production by Ganoderma lucidum G0119 based on nitrogen source effect. Biotechnol. Bioprocess. Eng. 2014, 19, 727–732. [Google Scholar] [CrossRef]
- Bustos, G.; Moldes, A.; Alonso, J.; Vázquez, M. Optimization of D-lactic acid production by Lactobacillus coryniformis using response surface methodology. Food Microbiol. 2004, 21, 143–148. [Google Scholar] [CrossRef]
- Demirci, A.; Pometto, A., III; Ho, K.G. Ethanol production by Saccharomyces cerevisiae in biofilm reactors. J. Ind. Microbiol. Biotechnol. 1997, 19, 299–304. [Google Scholar] [CrossRef]
- Baranyi, J.; Pin, C. Modeling the history effect on microbial growth and survival: Deterministic and stochastic approaches. Modeling Microb. Responses Food 2004, 285–301. [Google Scholar]
- Cayré, M.A.E.; Vignolo, G.; Garro, O. Modeling lactic acid bacteria growth in vacuum-packaged cooked meat emulsions stored at three temperatures. Food Microbiol. 2003, 20, 561–566. [Google Scholar] [CrossRef]
- Liu, L.; Zhang, Z.; Wang, J.; Fan, Y.; Shi, W.; Liu, X.; Shun, Q. Simultaneous saccharification and co-fermentation of corn stover pretreated by H2O2 oxidative degradation for ethanol production. Energy 2019, 168, 946–952. [Google Scholar] [CrossRef]
- Zeng, A.P.; Ross, A.; Biebl, H.; Tag, C.; Günzel, B.; Deckwer, W.D. Multiple product inhibition and growth modeling of Clostridium butyricum and Klebsiella pneumoniae in glycerol fermentation. Biotechnol. Bioeng. 1994, 44, 902–911. [Google Scholar] [CrossRef]
- Sinclair, C.; Kristiansen, B. Fermentation kinetics and modeling. Milton Keynes. Open Univ. Press. J. Chem Tech. Biotech. 1987, 44, 330. [Google Scholar]
© 2019 by the authors. Licensee MDPI, Basel, Switzerland. This article is an open access article distributed under the terms and conditions of the Creative Commons Attribution (CC BY) license (http://creativecommons.org/licenses/by/4.0/).