Article

Cycle-to-Cycle Variation of a Diesel Engine Fueled with Fischer–Tropsch Fuel Synthesized from Coal

1
College of Mechanical and Vehicle Engineering, Taiyuan University of Technology, Taiyuan 030024, China
2
School of Computing and Engineering, University of Huddersfield, Queensgate, Huddersfield HD1 3DH, UK
*
Author to whom correspondence should be addressed.
Appl. Sci. 2019, 9(10), 2032; https://doi.org/10.3390/app9102032
Submission received: 2 April 2019 / Revised: 2 May 2019 / Accepted: 10 May 2019 / Published: 17 May 2019
(This article belongs to the Special Issue Clean Coal Combustion)

Abstract

:
Cycle-to-cycle variations during the combustion phase should be comprehensively investigated because these variations are among the most serious causes of higher emissions and lower efficiency. The main objective of this study was to evaluate the relationship between cyclic variations and combustion parameters. The combustion and cyclic variation characteristics were investigated using a diesel engine operating on Fischer–Tropsch (F–T) fuel synthesized from coal. Experiments were conducted under full load conditions at three engine speeds of 1200, 2000, and 2800 rpm. The results revealed that cyclic variations of F–T diesel were lower than those of 0# diesel, acquired the minimum value at the speed of 2000 rpm, and reached the maximum at the speed of 2800 rpm. The mean fluctuation intensity of F–T diesel was 0.185, 0.189, and 0.205 at speeds of 1200, 2000, and 2800 rpm, respectively, smaller than that of 0# diesel under the corresponding conditions. The relationships between cyclic variations and combustion parameters were analyzed by correlation methods. Maximum in-cylinder pressure (Pmax) increased linearly with increased ignition delay, while it decreased linearly with increased combustion duration. The Pearson’s correlations between Pmax and ignition delay were 0.75, 0.78, and 0.73; however, the corresponding values between Pmax and combustion duration were 0.61, 067, and 0.65 when fueled with F–T diesel at speeds of 1200, 2000, and 2800 rpm, respectively. Moreover, the Pearson’s correlations of 0# diesel were higher than those of F–T diesel at the same operating loads. Compared with combustion duration, the ignition delay had more important effects on cyclic variations with a higher Pearson’s correlation. Furthermore, the ignition delay significantly influenced cyclic variation under a high speed load, while the combustion duration had a marked effect under low speed conditions. Overall, the results revealed the importance of combustion parameters on cyclic variation, which has great significance for controlled cyclic variation in diesel engines.

1. Introduction

With the increasing drive towards energy savings and low-carbon living, greater demand for stringent emissions regulations, and huge fuel consumption, researchers have progressively paid more attention to exploring clean alternative fuels for internal combustion engines in recent years [1,2]. The Fischer–Tropsch (F–T) catalytic conversion process can be used to synthesize diesel fuels from a variety of feedstocks including coal, natural gas, and biomass. Moreover, liquid fuels produced via the F–T process promise an attractive, clean, carbon-neutral, and sustainable energy source for the transportation sector. In particular, the F–T diesel synthesized from coal by the F–T method has broad application prospects, as it has matured and entered the industrial stage [3,4].
Owing to the excellent specifications [5], F–T diesel can be used in unmodified diesel engines; therefore, many diesel engines powering large trucks, buses, and farm, railroad, marine, and construction equipment have been investigated to date [6,7,8,9,10,11,12,13].
Cycle-to-cycle variations were first analyzed in Spark engines, which are less significant in diesel engines due to the non-premixed combustion. However, this has been a research area of increased interest in the recent past since the two-stage injection strategies on the mixture formation were used in common rail diesel engines. These cyclic variations were considered to cause combustion instability and are detrimental to engine performance [14]. Koizumi et al. [15] found that variations in in-cylinder pressure were caused by increased ignition delay in cold-start engines. Zhong et al. [16] observed cyclic variations in the fuel path of diesel engines. Furthermore, Schmillen [17] reported that the in-cylinder pressure variations could not be explained in terms of injection variation. Later, a change in the intake pressure and intake temperature resulted in longer ignition delay, which led to an increase in the cycle-to-cycle variations [18,19]. Moreover, literature reports [18,20] showed that the variation of in-cylinder pressure decreased in fuels with high cetane number (CN). Furthermore, Panagiotis [21] predicted the influence of cyclic variations on NOx exhaust emissions, and the results showed that the NOx emissions increased by 5% when a point with fluctuating injection timing compared to a stable state. Jakob et al. [19] found that cyclic variation in soot was caused by combustion instabilities. Previous studies showed that the cyclic variability, together with in-cylinder pressure fluctuations, had a similar influence, increasing energy release during the combustion phase observed in homogeneous charge compression ignition engines [22,23,24].
It is well known that cycle-to-cycle variation in diesel engines can contribute to lower thermal efficiency and output power, as well as higher exhaust emissions [25,26]. The cycle-to-cycle variation is unexpected, which is harmful to diesel engine performance. Moreover, fuels with high CN and thus short ignition delay exhibited beneficial effects, decreasing cyclic variations of in-cylinder pressure. However, literature reviews showed that the research has been conducted on F–T diesel or F–T diesel blends, and mainly focused on emissions and combustion characteristics. Cycle-to-cycle variation in diesel engine fueled with F–T diesel has rarely been investigated. The main objective of this study was to investigate the variation performance in diesel engines with short ignition delay and long combustion duration conditions. For this purpose, F–T diesel and 0# diesel were used in a common rail engine for comparative analysis. Furthermore, the combustion parameters such as ignition delay and combustion duration were identified by analyzing the in-cylinder pressure and heat release rate (HRR). The cyclic variation coefficient under in-cylinder pressure condition and intensity of fluctuation under different ignition delay and combustion duration conditions were comprehensively analyzed. Finally, the effects of ignition delay and combustion duration on cyclic variation were presented through Pearson’s correlation under varying speed conditions.

2. Materials and Methods

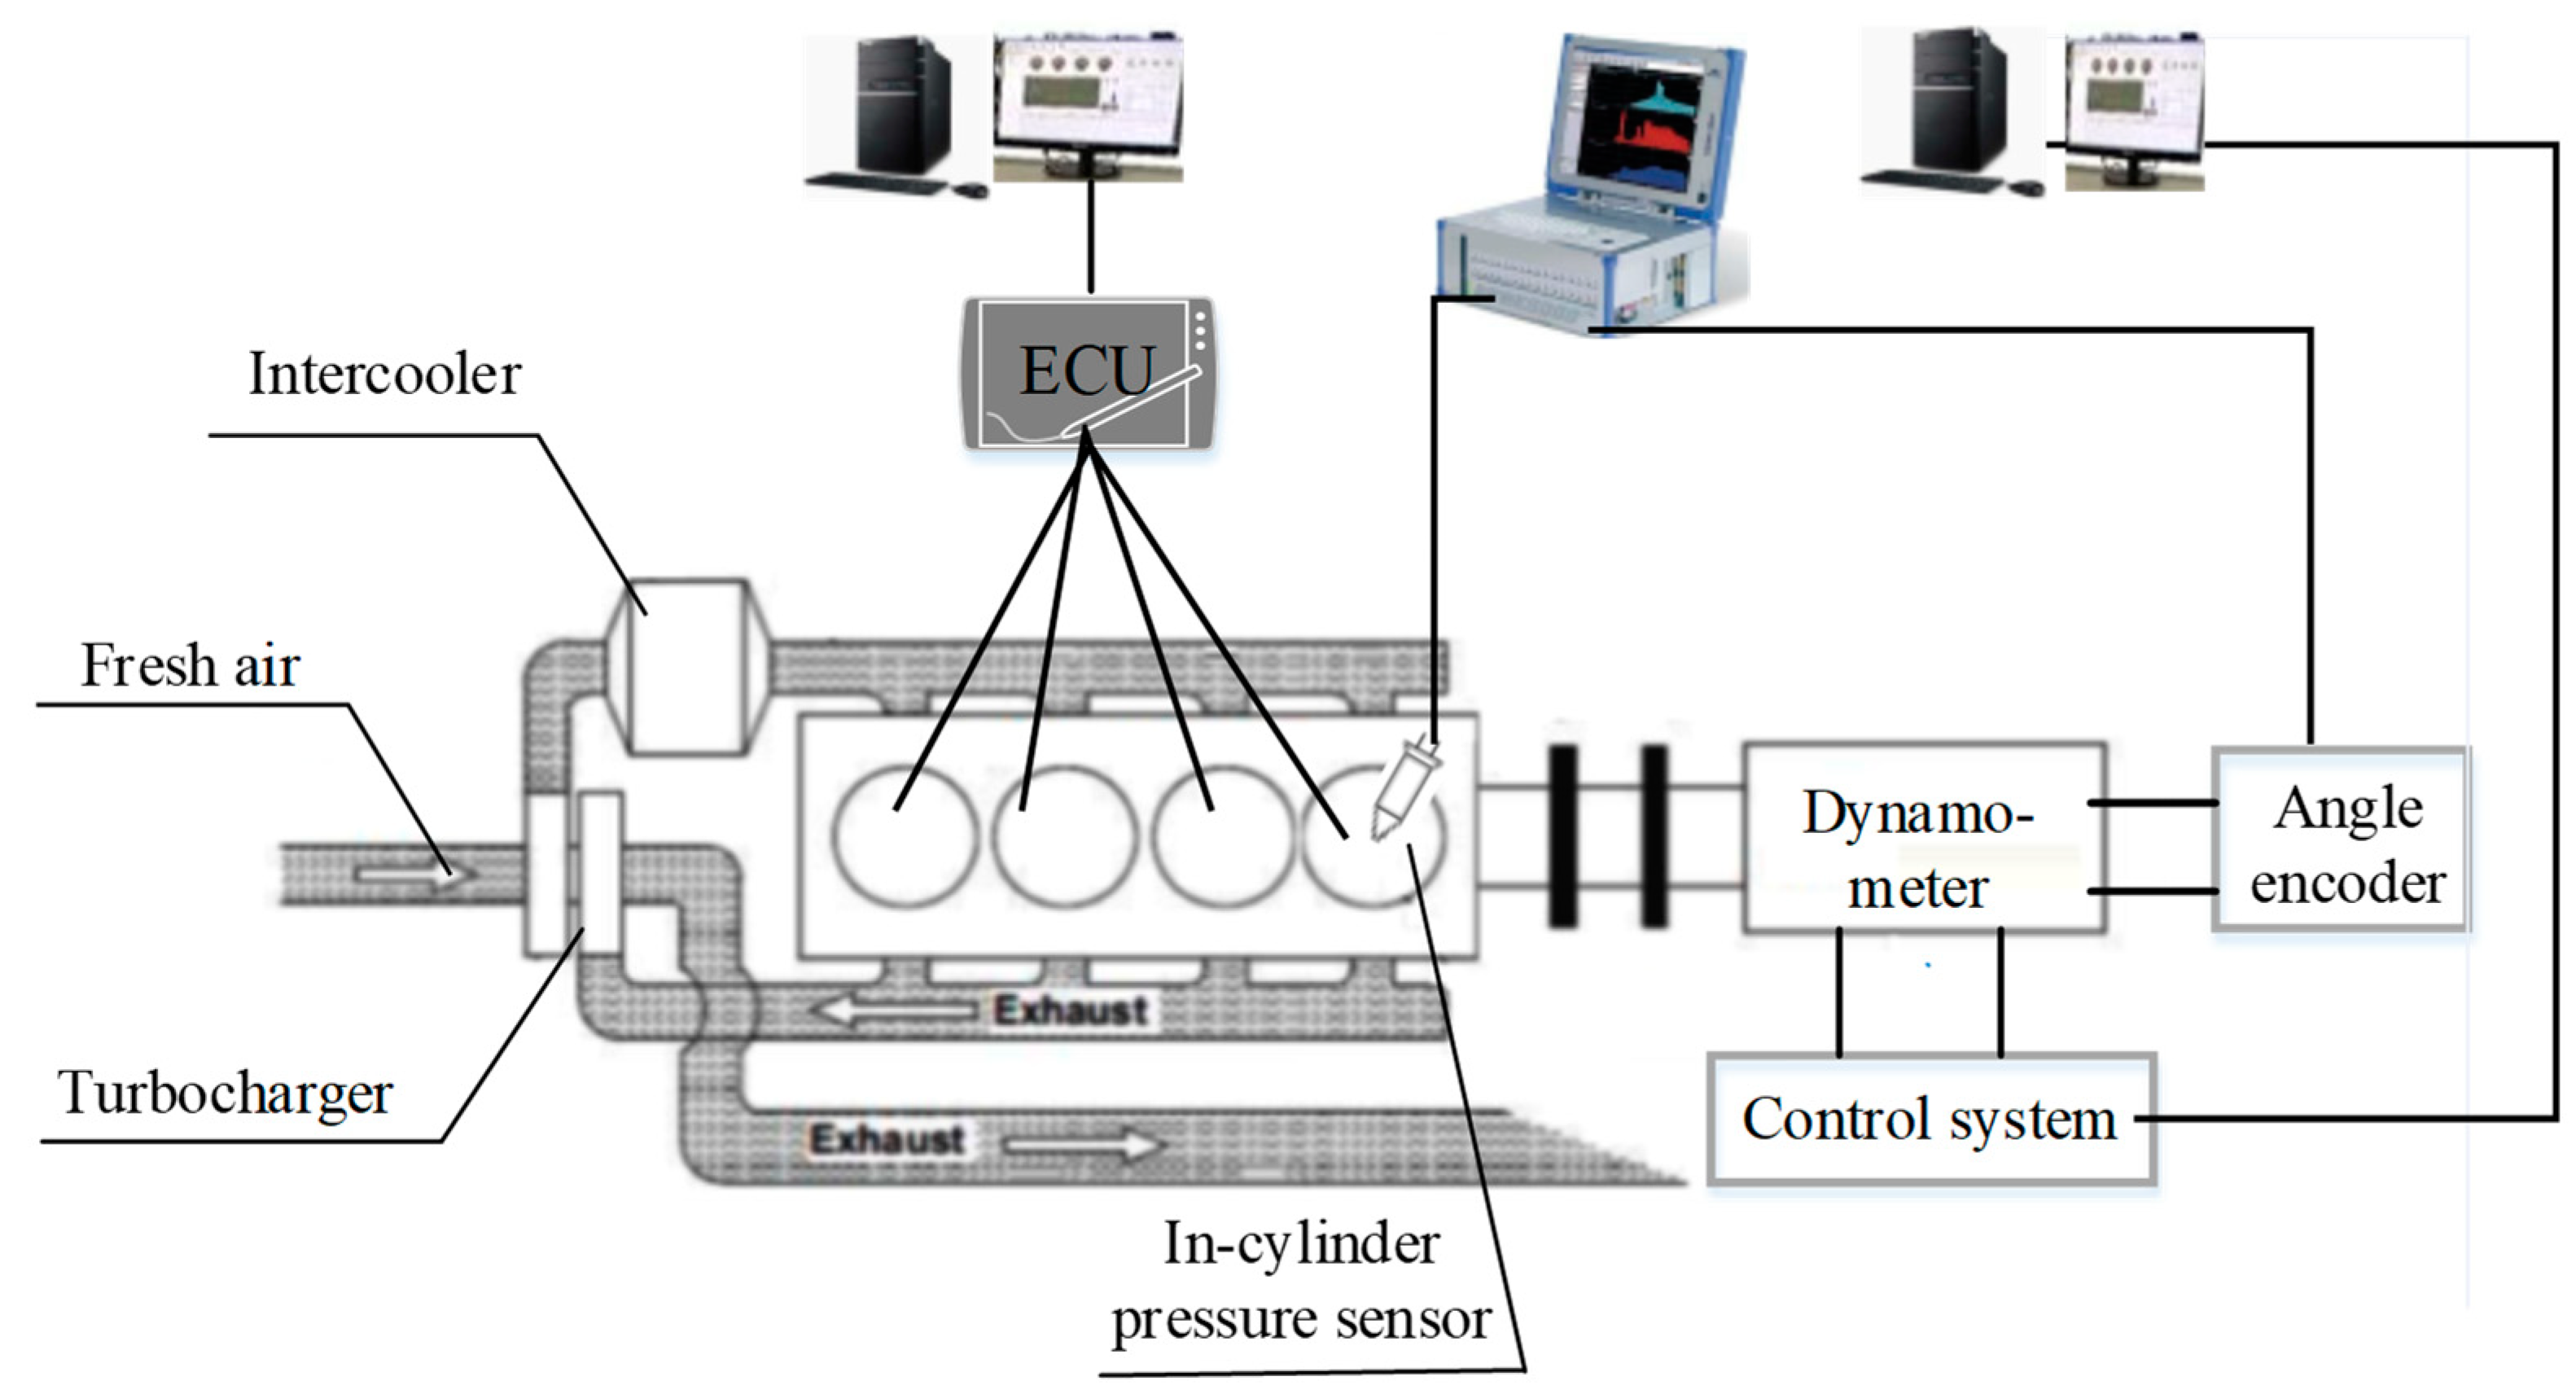
2.1. Research Engine Test Bench

Experiments were conducted in an inter-cooling, turbocharged, common rail diesel engine (Yun nei Group, Kunming, China) that was coupled to an electrical eddy current dynamometer and an external water circulation system. The detailed specifications of the diesel engine are listed in Table 1 and the test bench is schematically illustrated in Figure 1. A pressure sensor (Kistler 6050A41, Winterthur, Switzerland, sensitivity: 17 pc/bar) was installed to measure the in-cylinder pressure. An angle encoder (Kistler2613B1, Winterthur, Switzerland) was used to collect the top dead center (TDC) signal as well as crank angles. The in-cylinder pressure signal was collected for no less than 120 cycles under each load condition. Then the combustion parameters and combustion processes were derived by using MATLAB software (MathWorks, Natick, MA, USA) based on the data obtained from the in-cylinder pressure sensor and angle encoder. The final in-cylinder pressure data were cycle-averaged for 100 cycles. Fuel consumption was obtained by calculating the fuel mass (Chengbang Science & Technology, Chengdu, China) during the engine operation under different conditions. Under all the test conditions, the intake air temperature was kept at 50 ± 3 °C and the engine cooling water temperature was maintained in the range of 80 ± 5 °C for reliable comparison. The test data were collected when the engine was operating at steady state. The uncertainty and accuracy of the key equipment used in this research are listed in Table 2.

2.2. Test Fuels

F–T diesel and commercial 0# diesel that meets the China Stage VI standards were used in this study. The main specifications of the fuel are listed in Table 3, which were provided by the F–T diesel manufacturer. The F–T diesel is a type of industrial chemical and liquid fuel produced from coal as a raw material. It is an indirectly synthesized diesel with negligible sulfur and aromatic content. Compared to 0# diesel, F–T diesel has the properties of lower density and boiling point; however, its heating value and CN number are higher.

3. Results and Discussion

In order to enhance the contrast effects and analyze the engine performance under severe operating conditions, a series of experiments were conducted under full load conditions. The engine used had a low speed of 1200 rpm and a high speed of 2800 rpm; in addition, a maximum break torque speed of 2000 rpm was selected. For more accurate assessment, the in-cylinder pressure, in-cylinder pressure increase rate, and combustion parameters such as HRR, ignition point, ignition delay, combustion duration, and CA50 were analyzed. The cyclic variation characteristics of in-cylinder pressure were also studied. The combustion characteristics of different fuel samples under various conditions were estimated in the following sections.

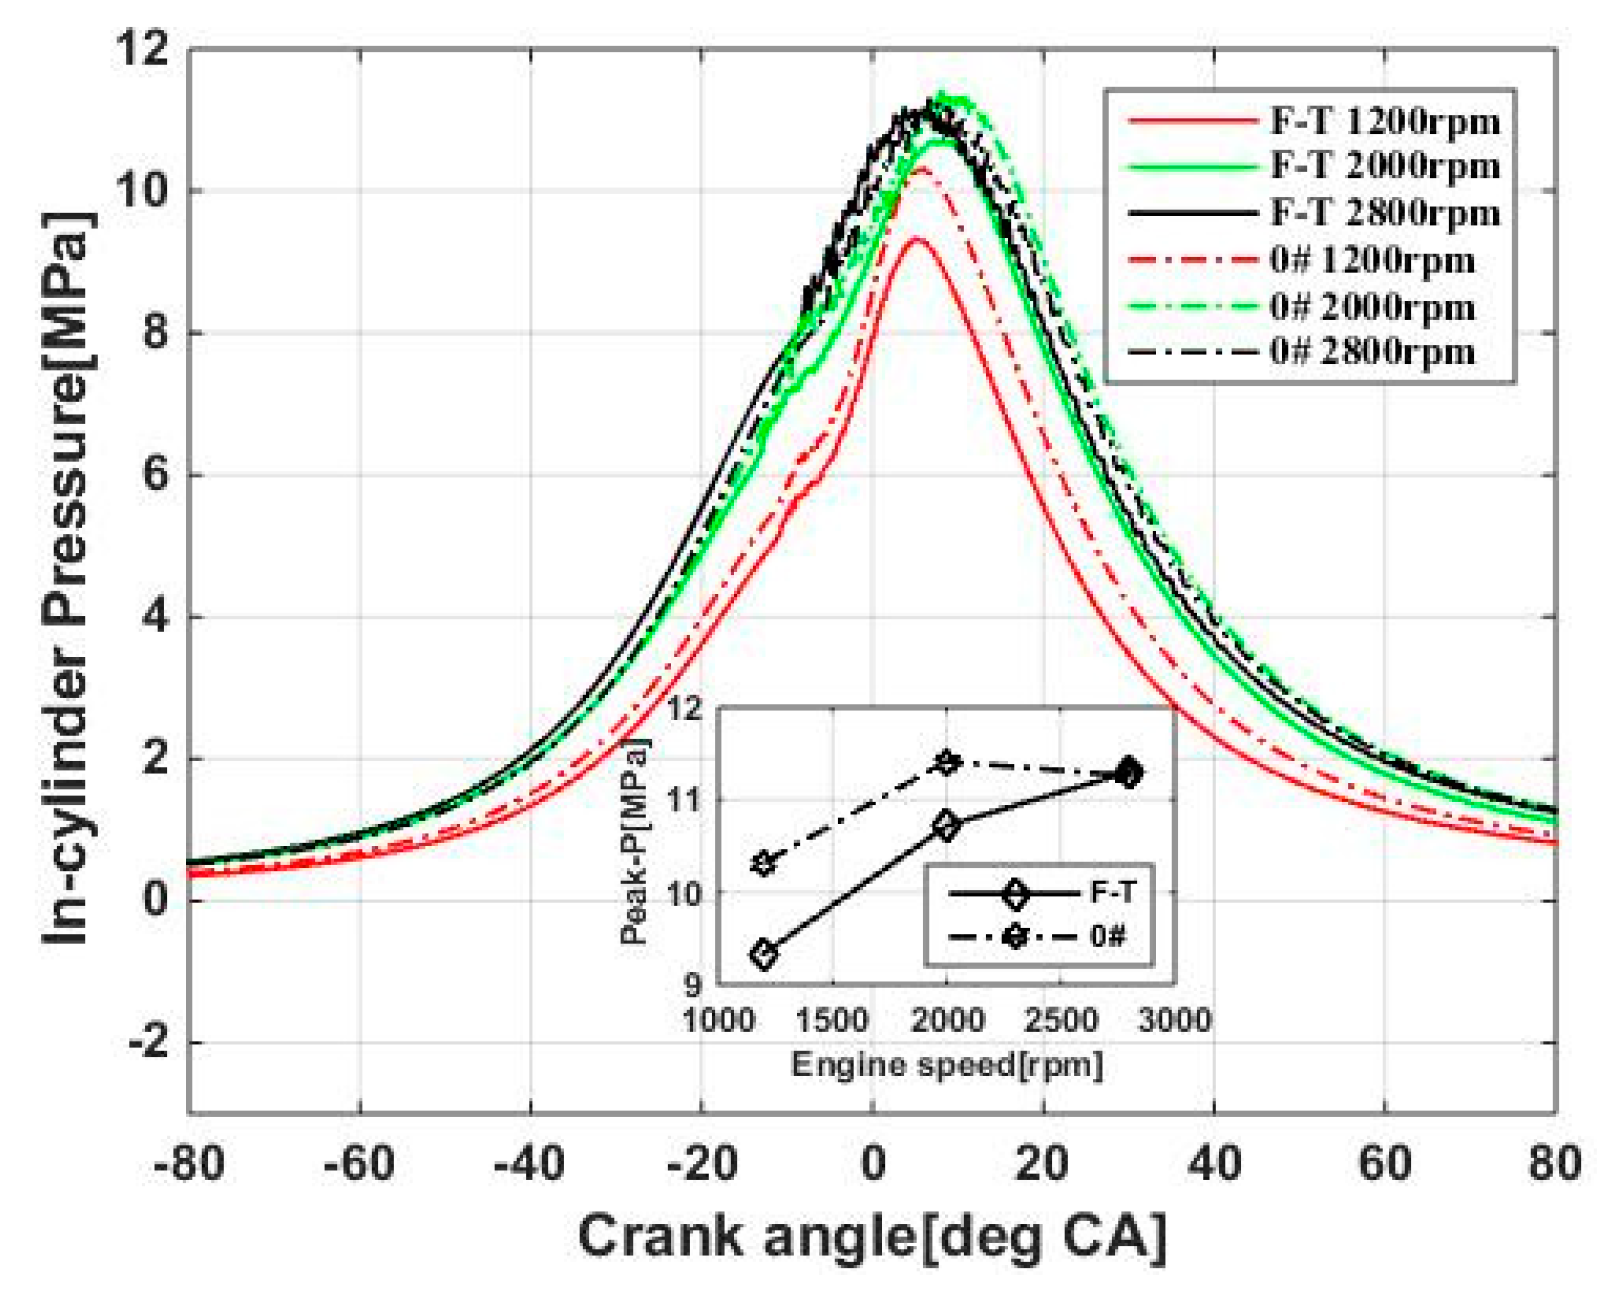
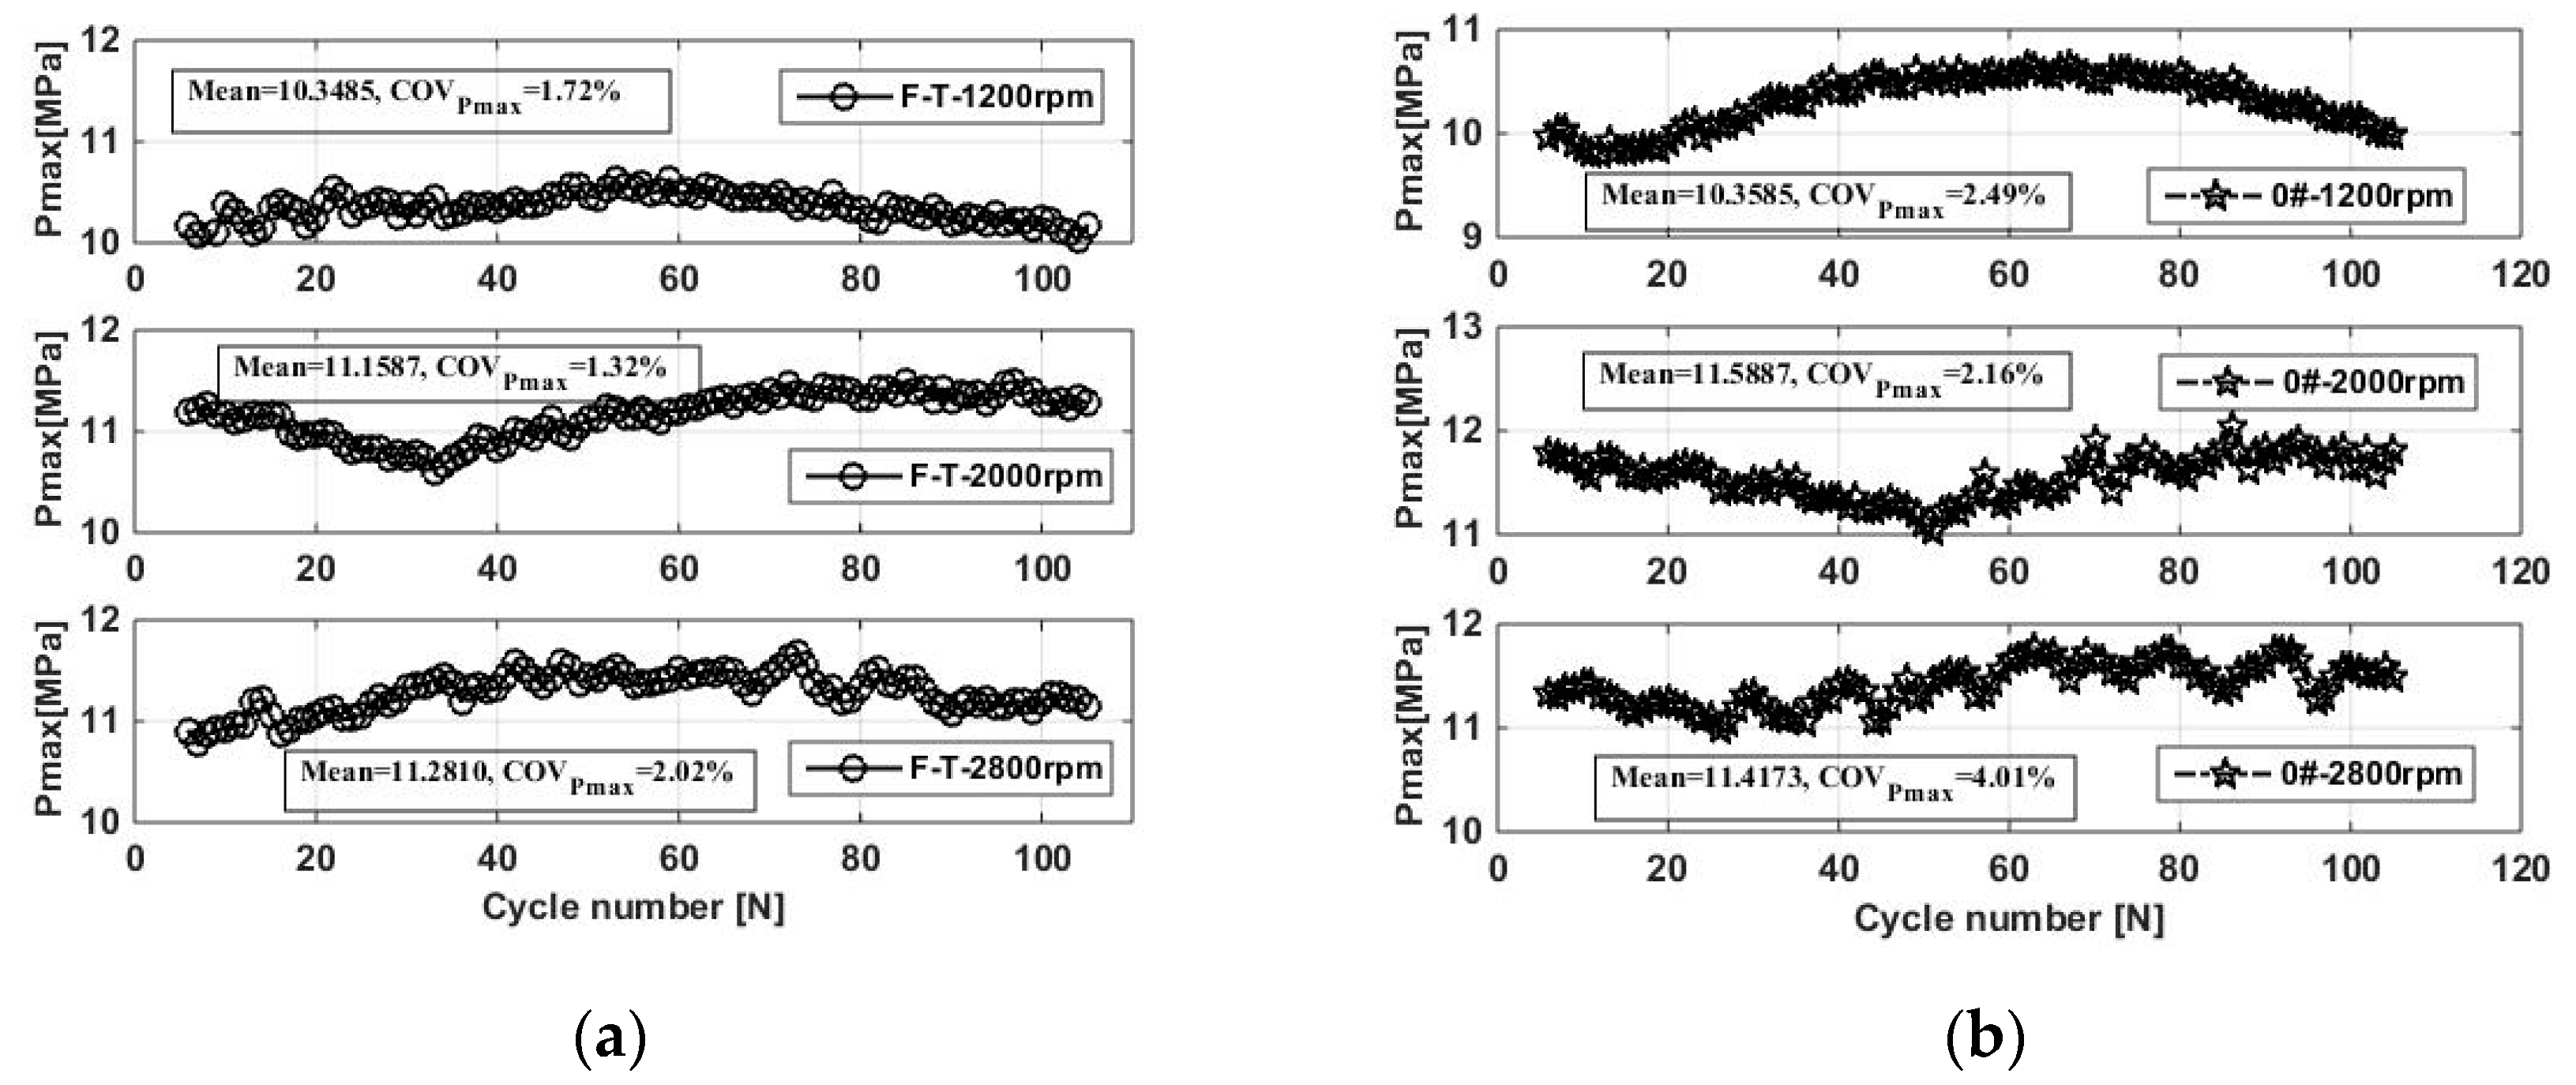
3.1. In-Cylinder Pressure

The variations of in-cylinder pressure for different fuels at various engine speeds are shown in Figure 2. Clearly, the F–T diesel leads to lower maximum in-cylinder pressure and the peak position is slightly advanced compared with 0# diesel under the same load conditions. This was genetically determined based on fuel properties, such as the CN and low heating value. Less combustible mixtures are formed due to the higher CN of F–T diesel, which leads to an obvious shortening of the ignition delay. The two fuels showed a similar trend in that the maximum in-cylinder pressure increased with increasing speed, and it was a downward trend when the engine was at the speed of 2800 rpm. This was attributed to the fact that the cycle time shortened and the residual exhaust gas rate increased with the further increase in the engine speed; thus, the dilution effect of residual exhaust gas became more obvious. The maximum in-cylinder pressure decreased and the corresponding peak position was retarded. Furthermore, visible roughness was observed at the speed of 2800 rpm, compared to that at other speeds. This was in accordance with the intensity of pressure oscillation; the combustion instabilities significantly increased and in-cylinder pressure fluctuation obviously enhanced when the engine was operated at the speed of 2800 rpm.

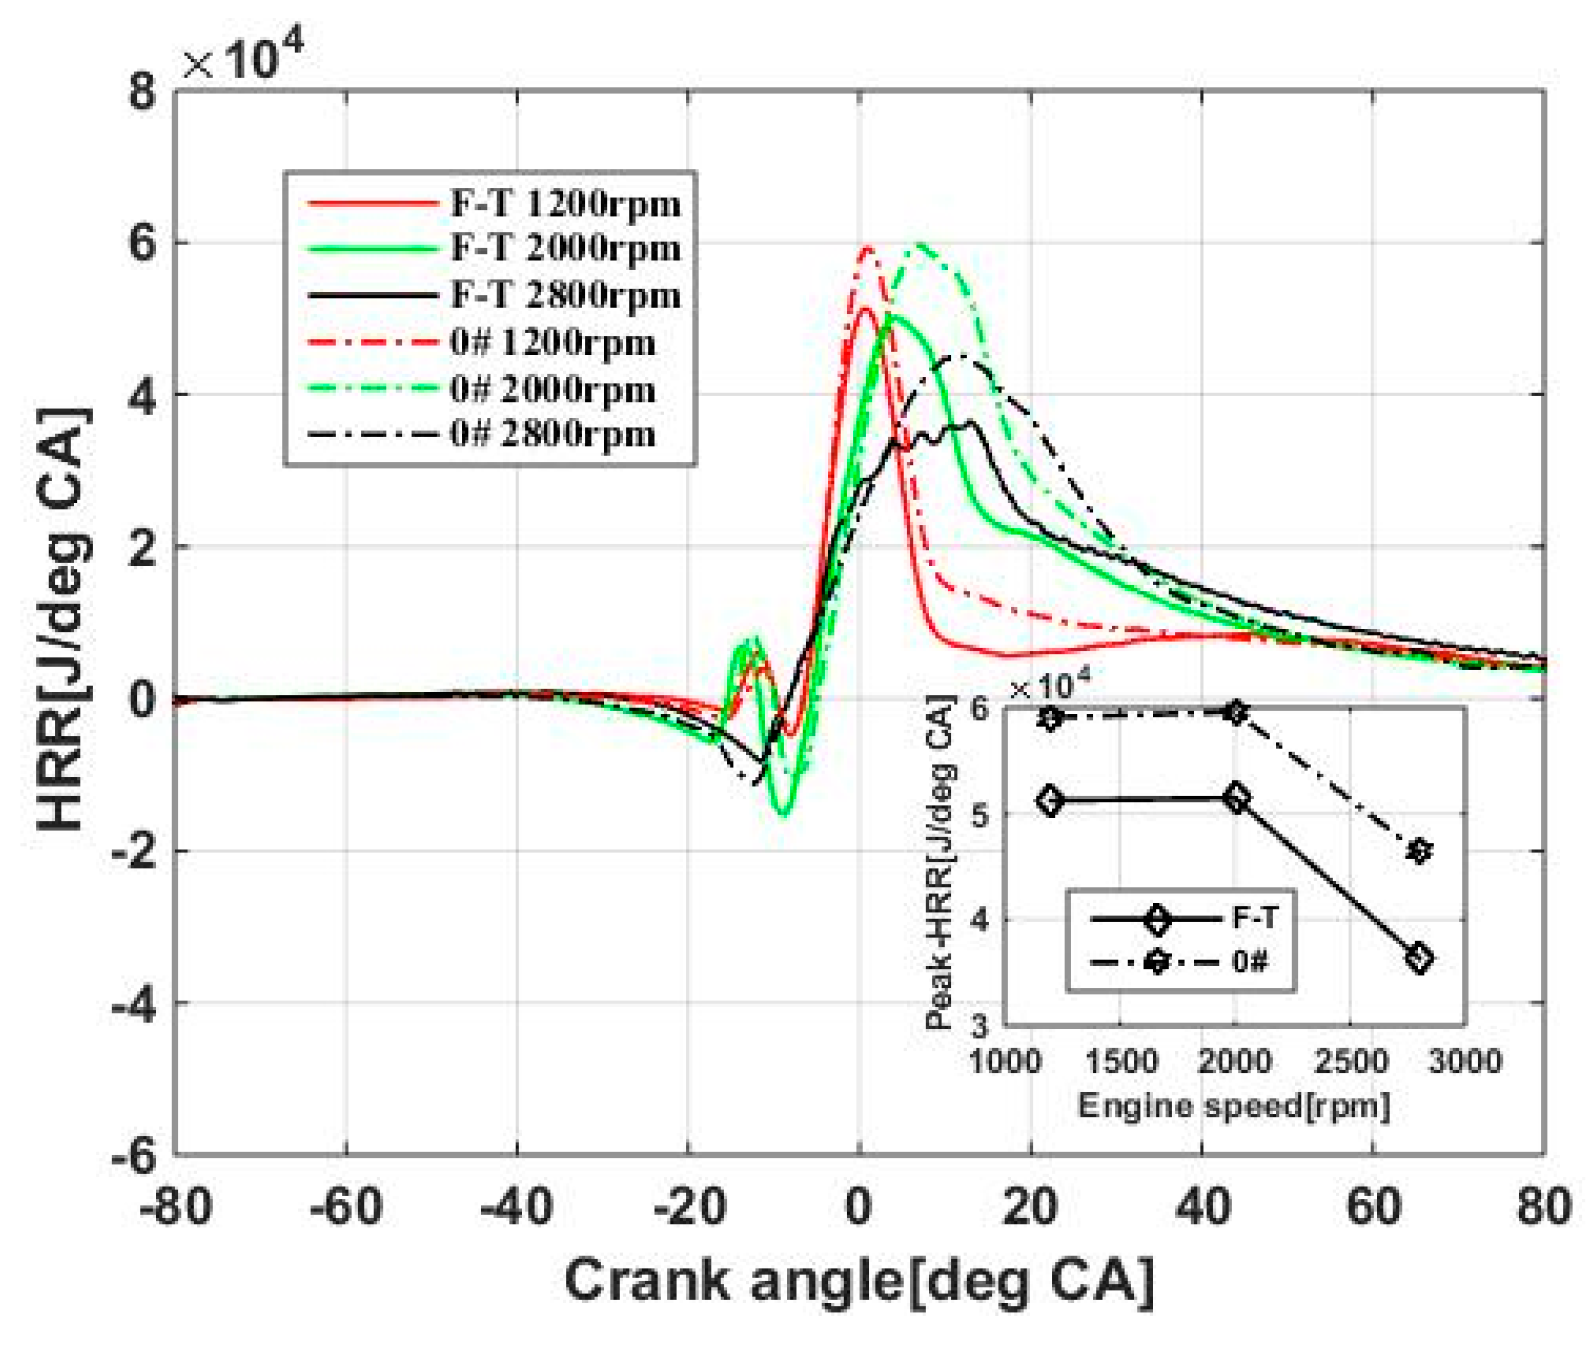
3.2. Heat Release Rate

HRR is an important combustion indicator and is calculated by using a single zone model based on the first law of thermodynamics, which has been widely used in previous studies [27,28,29]. HRR is defined by utilizing Equations (1) and (2), where the heat ratio is expressed in k, and A, h, n, Tg, and Tw represent the area of combustion chamber, the heat transfer coefficient, engine speed, gas temperature, and in-cylinder wall temperature, respectively [30,31,32,33].
dQ d θ = k k 1 P dV d θ + 1 k 1 V dp d θ + dQ heat d θ
dQ heat d θ = Ah 6 n ( T g T w )
Figure 3 shows the HRR under different speed conditions when the engine was fueled with the test fuels. As indicated in Section 3.1, the HRR variation was similar to the in-cylinder pressure. The maximum HRR increased with increasing speed, and it showed a downward trend when the engine operated at the speed of 2800 rpm. The peak HRR of premixed combustion and diffusion combustion can be obviously observed at the speeds of 1200 and 2000 rpm; however, the engine maintains the main injection only at the speed of 2800 rpm, and the HRR evolves from two peaks to a single peak. The F–T diesel was mainly mixed with the straight-chain paraffin with higher CN and burning rate. The maximum HRR phase decreased, and corresponding peak position was advanced under the fast combustion speed and less pre-mixed fuel.

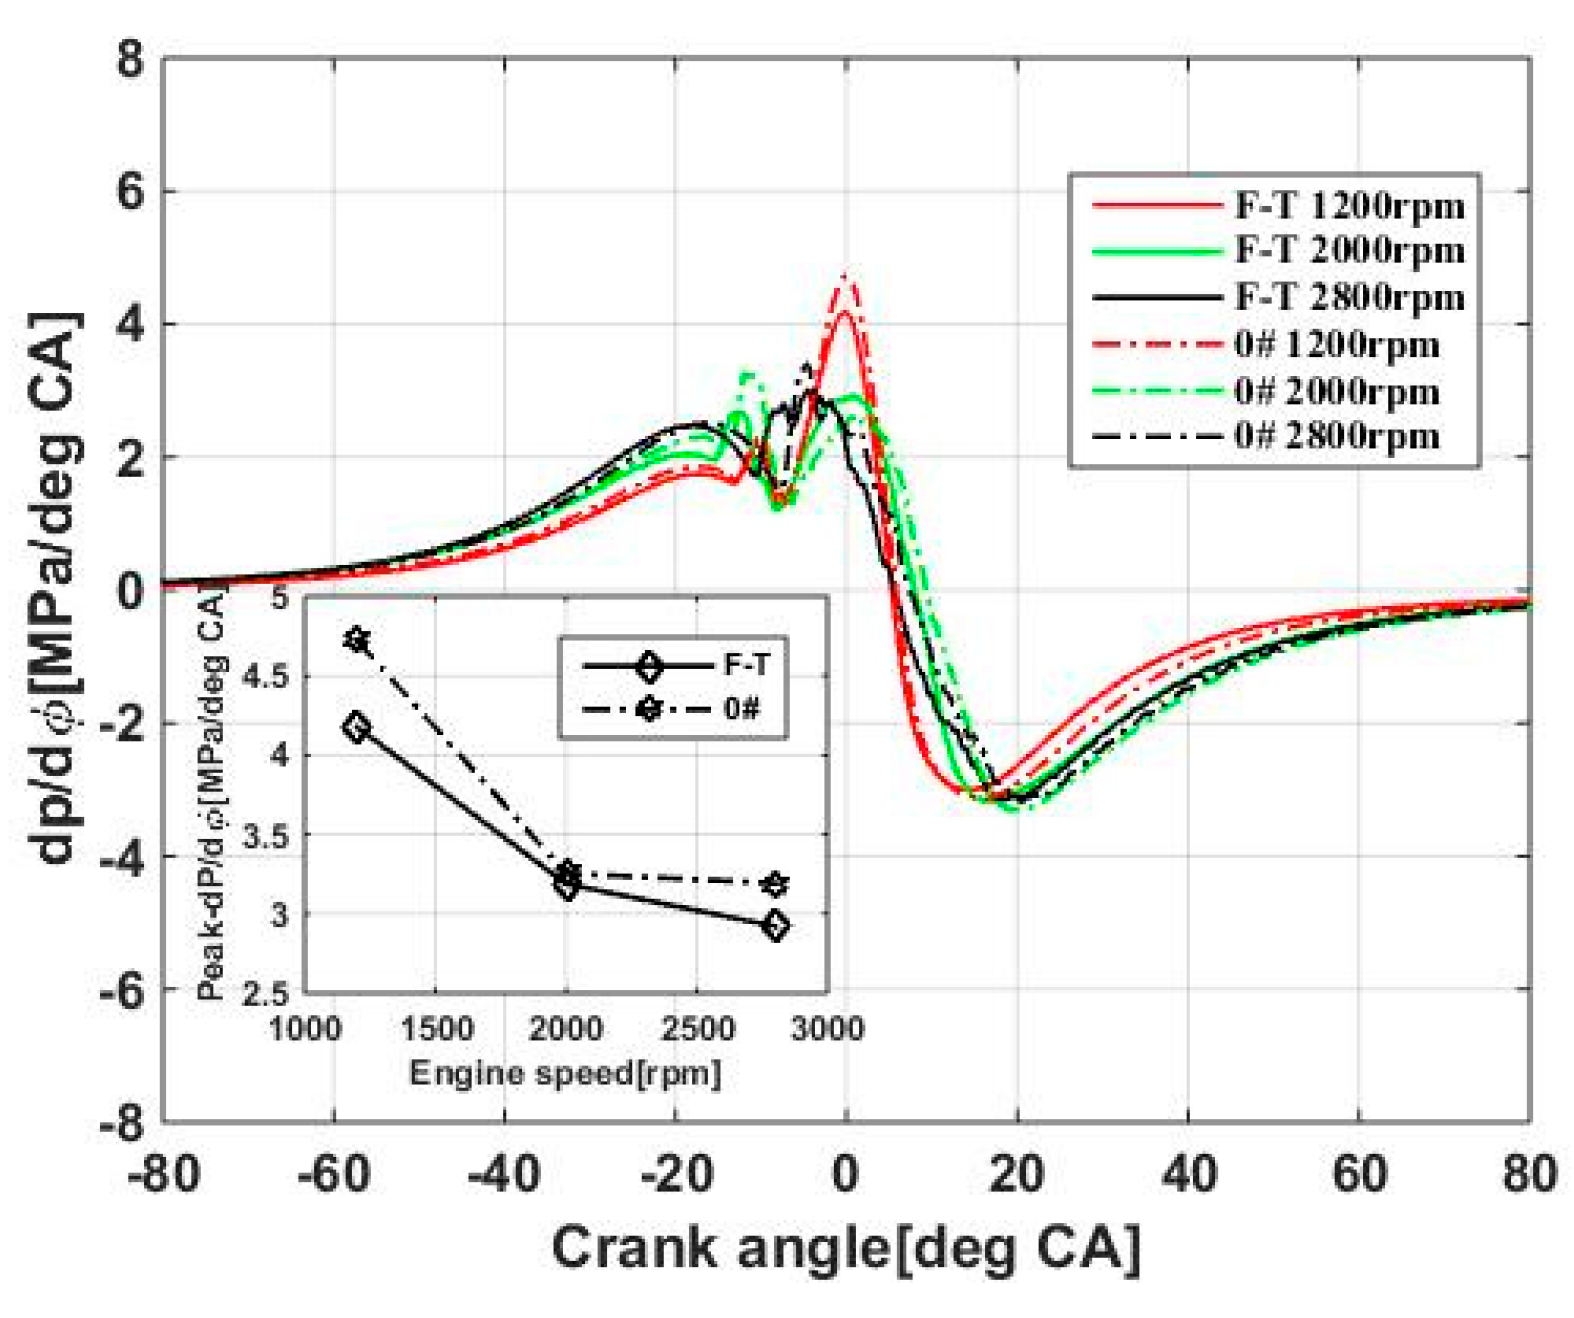
3.3. In-Cylinder Pressure Increase Rate

The dp/dφ is related to the combustion noise of the engine. When the dp/dφ increases, unacceptable noise may be caused, which eventually leads to damage to the engine [34].
Figure 4 presents the relationship between dp/dφ versus crank angle under different working conditions with the test fuels. The maximum dp/dφ of F–T diesel was lower than that of 0# diesel, and the peak position is slightly advanced compared to 0# diesel. The maximum dp/dφ decreased with increasing operating speed using the test fuels. This was mainly attributed to the fact that the ignition delay of F–T diesel was shorter than that of 0# diesel due to its higher CN. Thus, the gas and cylinder temperatures were lower for shorter air–fuel mixing process. Moreover, the constant volume combustion near TDC was decreased. The residual gas significantly affected the air–fuel mixture, as the speed increased for increasing residual exhaust gas rate. Thus, the dp/dφ was slightly decreased and the peak value was advanced with increasing engine speed.

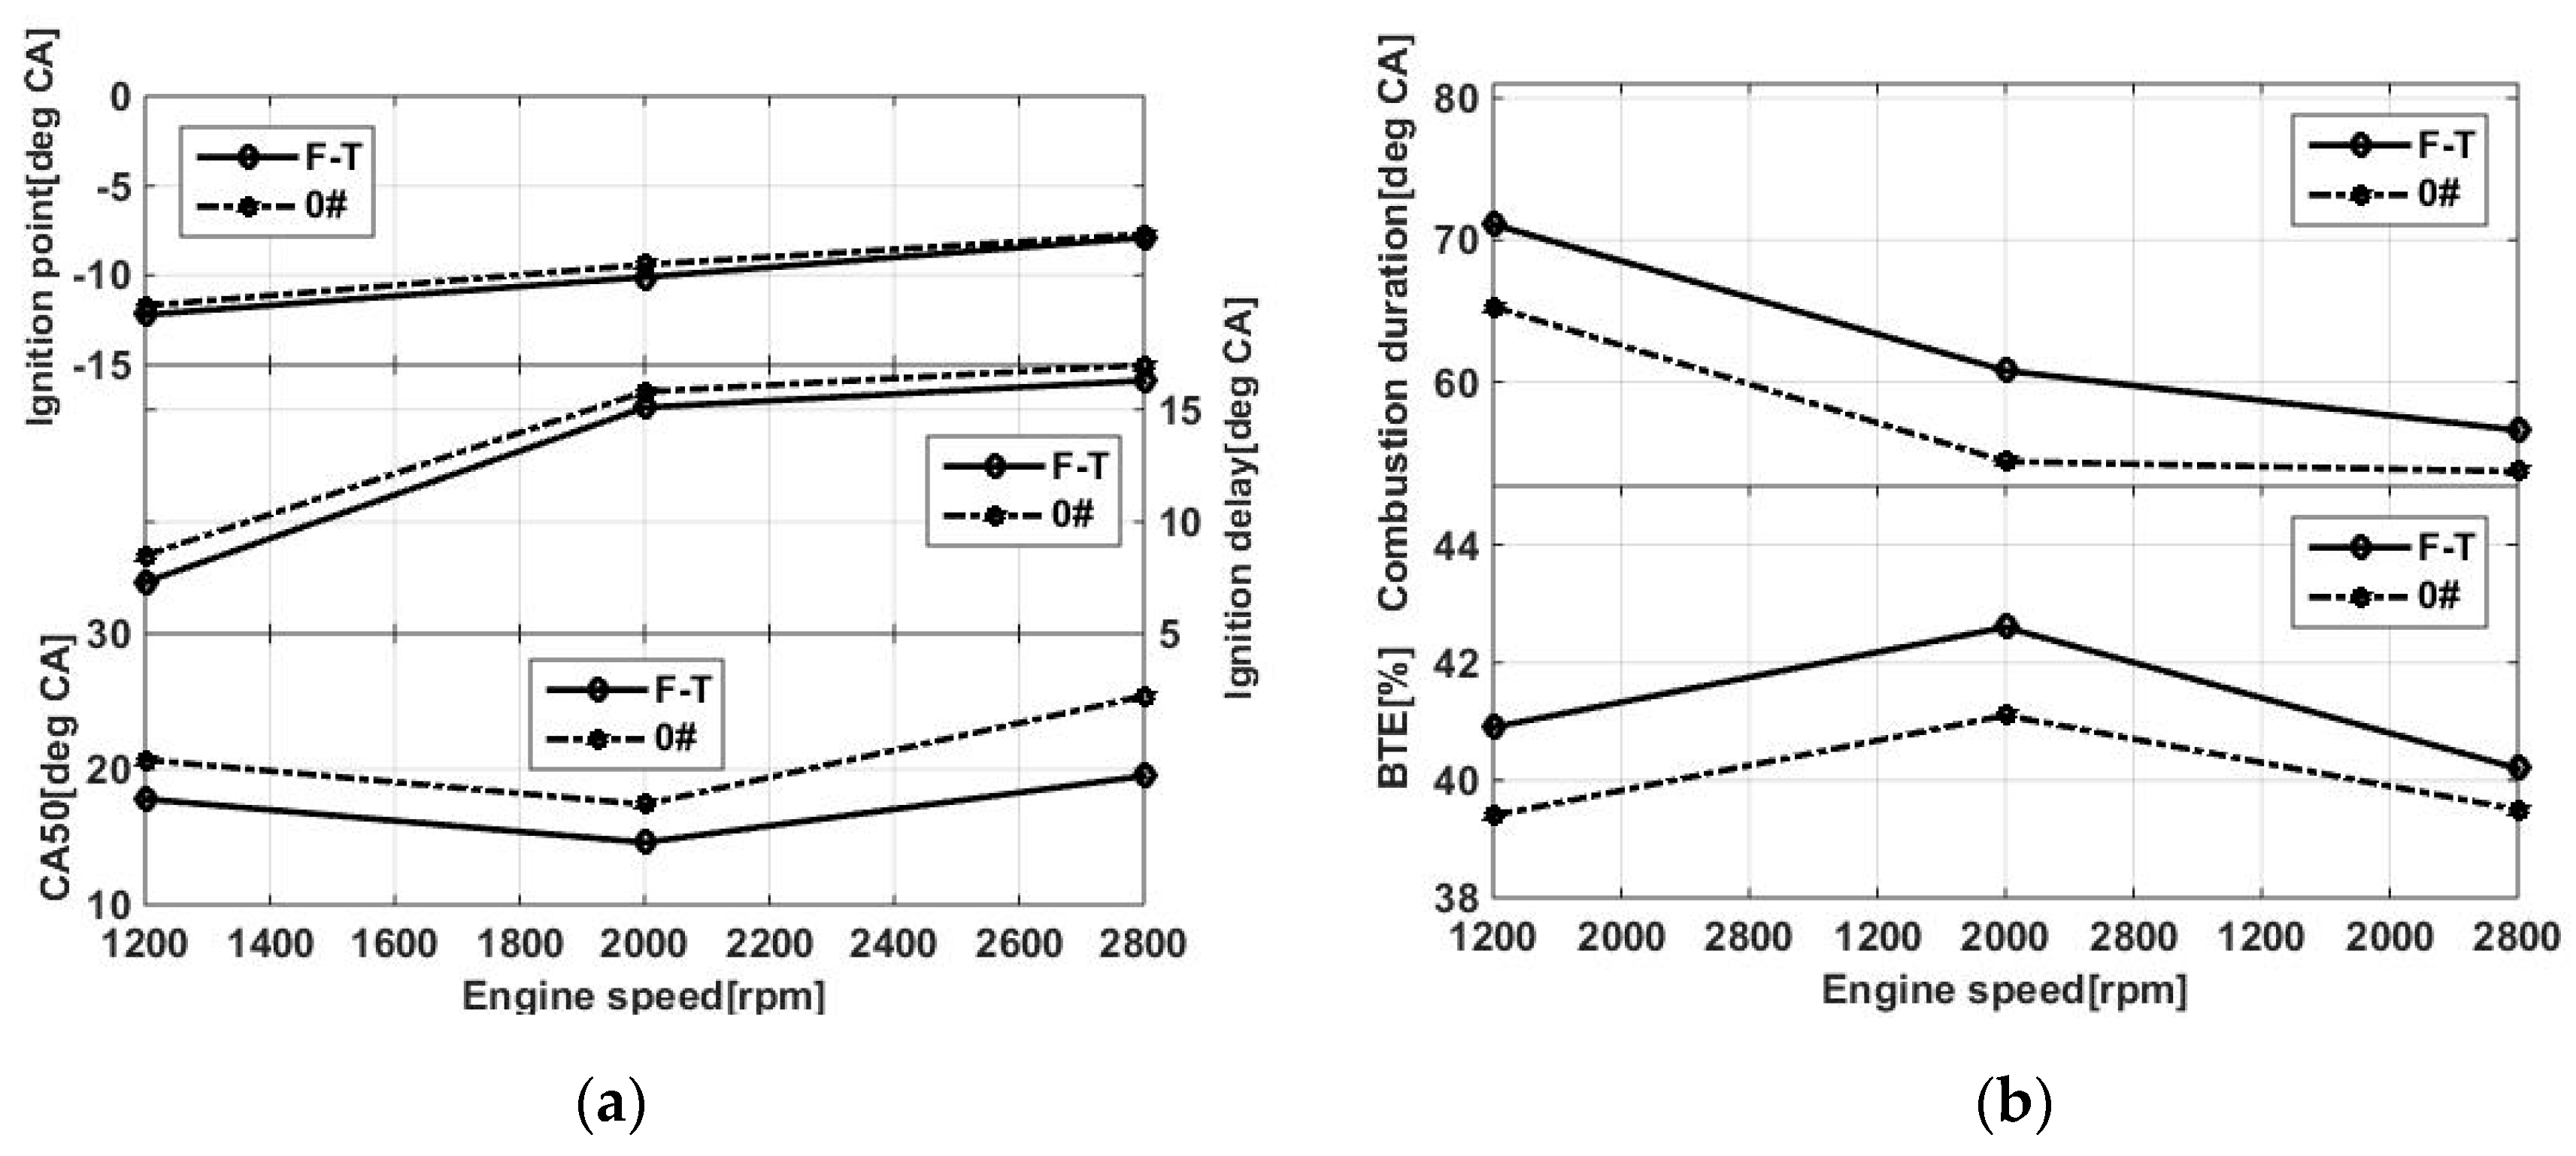
3.4. Combustion Parameters

The ignition point is the crank angle that forms the first flame kernel. Ignition delay is calculated as the crank angle between fuel injection timing and the ignition point. CA10, CA50, and CA90 are defined as the crank angles where 10%, 50%, and 90% of mixture undergoes combustion, respectively [35].
The combustion parameters mentioned above are shown in Figure 5a. For the F–T diesel, the ignition point was advanced and the ignition delay was shortened due to its higher CN. The ignition delay was advanced by 1.2, 0.9, and 0.7 deg CA, respectively, for the speeds of 1200, 2000, and 2800 rpm. Furthermore, the F–T diesel vaporized at a much faster rate because it has a lower boiling point. CA50 was basically advanced by 2 deg CA with the increase in the engine speed. The increase of engine speed caused the system to prepare more mixture, so the ignition point was retarded and ignition delay was increased. However, the air–fuel mixture uniformity and combustion processes were modified when the engine was operated at higher speed, and the impact of fuel properties on combustion was reduced.
The combustion duration refers to the crank angle between CA90 and CA10. The BTEis one of the key parameters that indicates the fuel conversion efficiency. Figure 5b shows the variations of combustion duration and BTE at different engine speeds.
Under different test conditions, F–T diesel showed a longer combustion duration than 0# diesel, and showed an opposite trend compared to ignition delay, as shown in Figure 5a. The combustion duration decreased with increasing engine speed using the test fuels. Moreover, the combustion duration was extended by about 5.8, 6.4, and 4.2 deg CA, respectively, for the speeds of 1200, 2000, and 2800 rpm compared to 0# diesel. Furthermore, the combustion duration decreased with the increase in engine speed. This is attributed to the fact that the shorter ignition delay resulted in a longer air–fuel mixing process to achieve a uniform result, thus leading to a slower premixed burning rate. The air–fuel mixing process was improved with the increase in the engine speed. The combustion speed was quicker, the combustion rate was higher, and the combustion process was shorter. Compared to 0# diesel, the BTE of F–T diesel was increased by 1.5%, 1.4%, and 0.7%, respectively, for the speeds of 1200, 2000, and 2800 rpm. The BTE exhibited great relevance at CA50. The BTE was increased as CA50 was advanced for the improved constant volume combustion near TDC [34,36,37,38,39]. Figure 5a,b exhibit good agreement between BTE and CA50. More heat leaked between the cylinder wall and the cooling water as CA50 was retarded, and the corresponding BTE was lower.

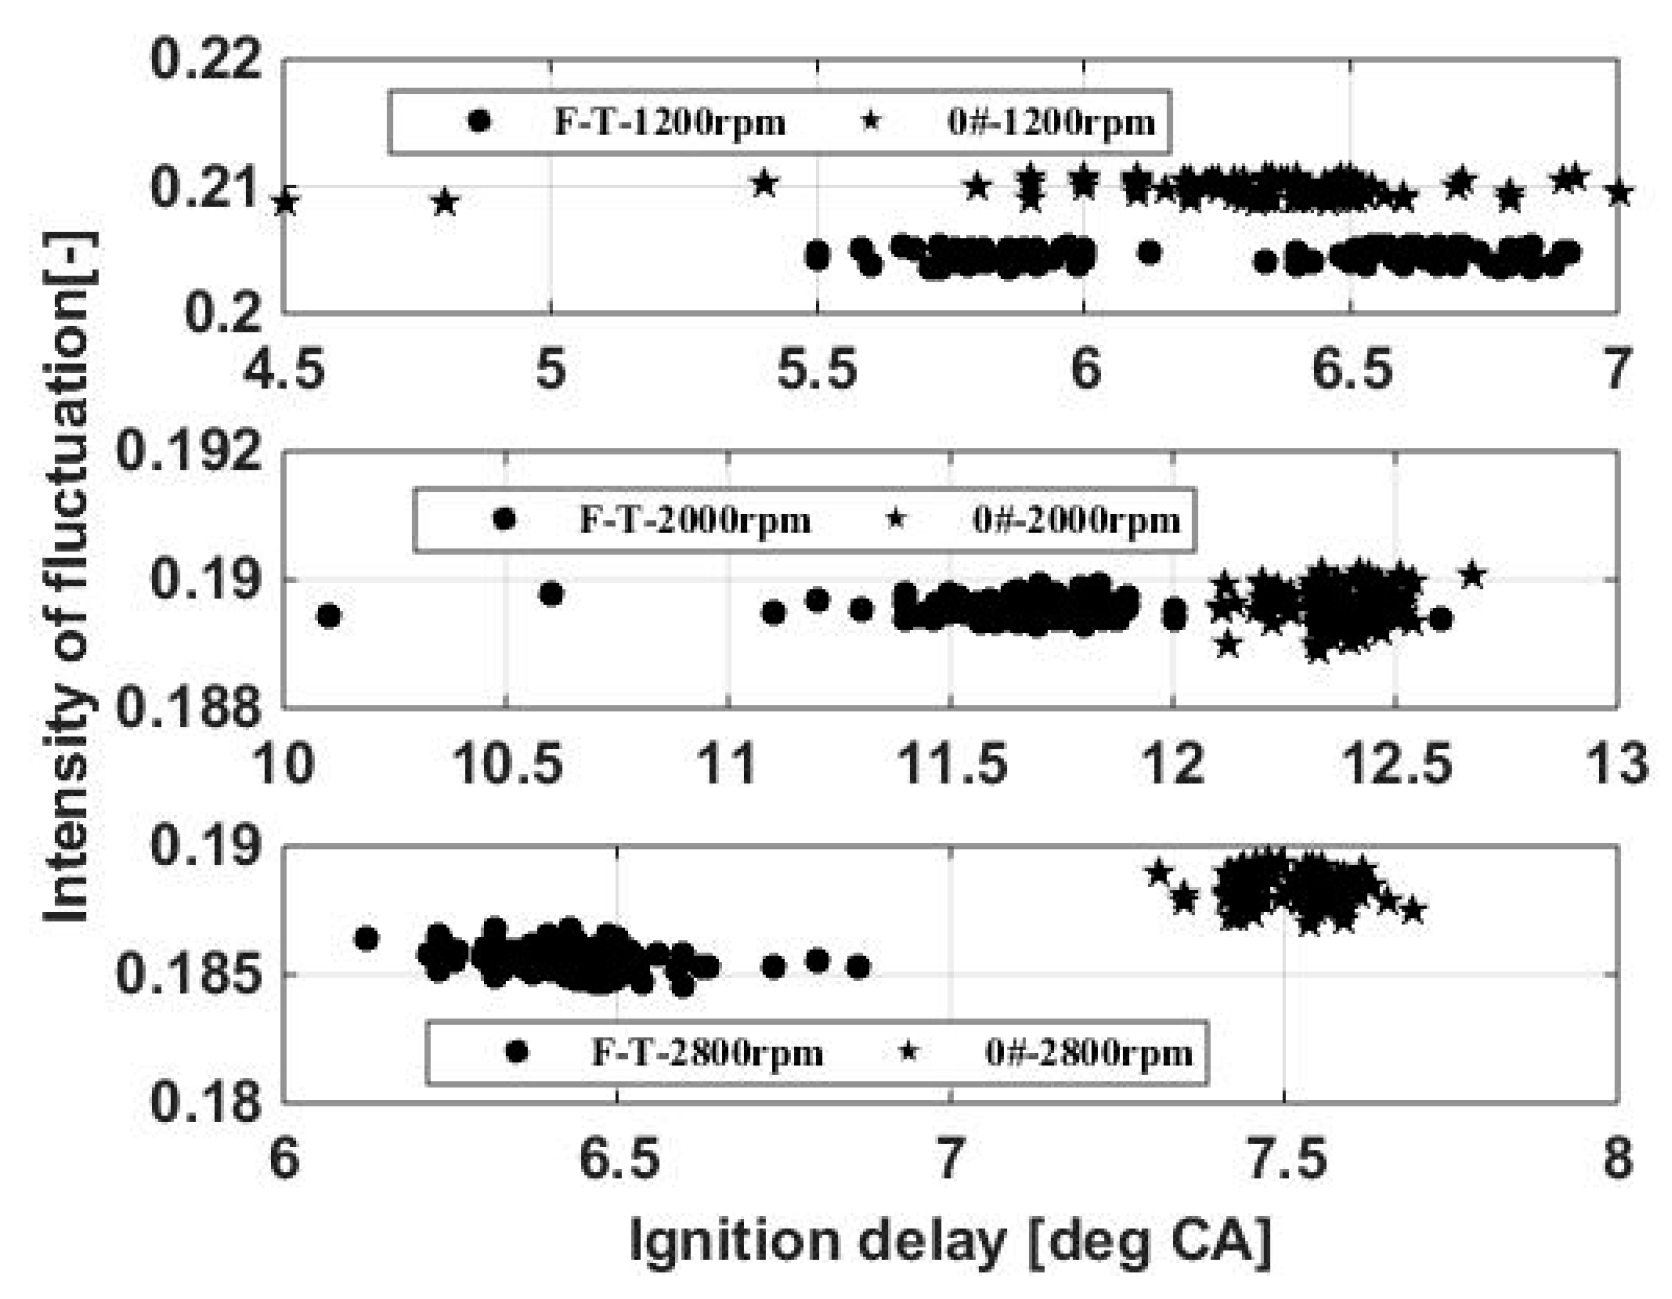
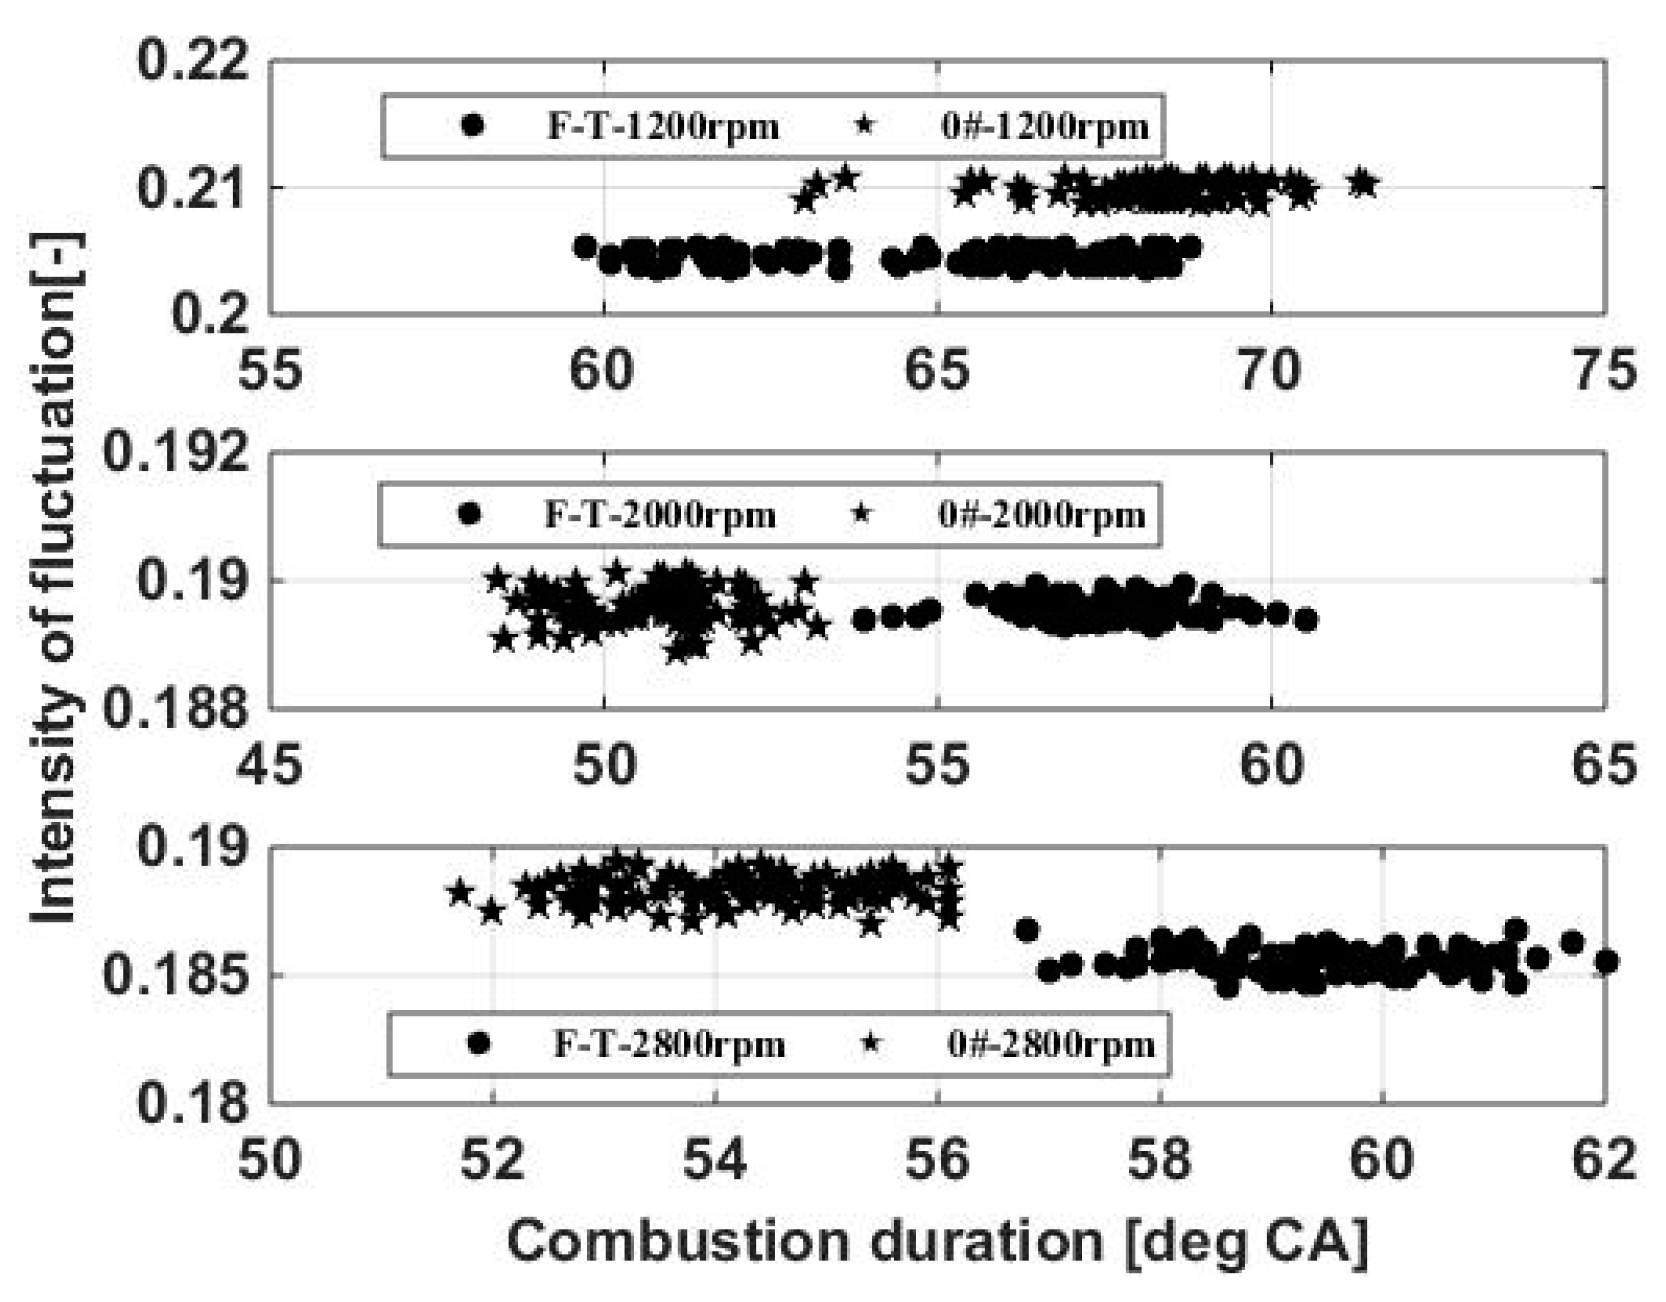
3.5. Cyclic Variation Characteristics

The inequality of fuels injected into the engine caused cycle-to-cycle variations, which significantly affected the combustion stability. The Pmax has “easy to measure” and “sensitive to cyclic variations” characteristics, so the coefficient of variation (COV) was analyzed to characterize the difference based on the published research [40,41]. COV was defined by using Equations (3)–(5); the linear dependence of relativity on peak in-cylinder pressure and combustion parameters ( R ( P max , y ) ) was measured in terms of the Pearson’s correlation, as presented in Equation (6), where the mean value of in-cylinder pressure is expressed in P max ¯ , N is the total cycle number, i represents the cycle index, and σ P is the standard deviation [42,43,44]. A significant correlation was observed among parameters when R was in the range of 0.5–1.0.
P max ¯ = 1 N i = 1 N P i
σ P = i = 1 N ( P i P max ¯ ) 2 N 1
Cov P = σ P P max ¯ × 100 %
R ( P max , y ) = i = 1 N ( P i P ¯ ) ( y i y ¯ ) ( N 1 ) ( σ P · σ y )
Pmax is an important mechanical indicator in modern compression engine [34,45]. Figure 6 demonstrates the variations of Pmax for 100 consecutive cycles under three speed conditions with the test fuels. Furthermore, the differences between the mean Pmax and COV under 100 cycles were calculated. Pmax changed stochastically under different speed conditions. However, the mean Pmax increased with the increase in the speed, and the F–T diesel showed a lower mean value than 0# diesel at the same speed, which was in line with the results presented in Section 3.1. Notably, values of COV of F–T diesel are 1.72, 1.32, and 2.02%, respectively, for the speeds of 1200, 2000, and 2800 rpm, which are lower than 2.49, 2.16, and 4.01% of 0# diesel. The F–T diesel with higher CN and lower viscosity was found to be beneficial to improve air–fuel mixture. Moreover, fuel atomization was in accordance with gas turbulence intensity during the kernel formation phase owing to its advanced combustion. Ascribed to these factors mentioned above, the F–T diesel exhibited excellent properties of combustion stability with little variation. On the other hand, cyclic variations at the speed of 2000 rpm were minimal and the maximum was obtained at the speed of 2800 rpm. This was mainly because the quality of air–fuel mixtures was further improved with a higher in-cylinder temperature and airflow motion as the engine speed increased. Thus, the combustion stability increased, and finally the COV decreased at a speed of 2000 rpm compared to that at 1200 rpm. At the speed of 2800 rpm, the time for proper combustion phasing was reduced; moreover, the residual exhaust gas was increased and therefore it was easier to cause combustion instability, so the cyclic variation sharply increased.
Figure 7 displays the fluctuation intensity of 100 consecutive cycles versus ignition delay under different conditions with the test fuels. Correspondingly, the intensity of fluctuation versus combustion duration is shown in Figure 8. Notably, the intensity of fluctuation follows a trend similar to that of the COV, which acquired the minimum average value at the engine speed of 2000 rpm and the maximum value at the speed of 2800 rpm. The F–T diesel presents a lower mean fluctuation intensity than 0# diesel; moreover, the mean intensity of fluctuation was 0.185, 0.189, and 0.205 at the speeds of 1200, 2000, and 2800 rpm during the entire test conditions, respectively. Furthermore, the mean intensity of fluctuation of 0# diesel was 0.187, 0.191, and 0.211, respectively, under the corresponding speed conditions. As mentioned above, F–T diesel showed excellent properties of combustion stability, so the mean and variance of in-cylinder pressure were small, which resulted in lower fluctuation intensity. When the engine was operated at the speed of 2800 rpm, the in-cylinder pressure increased and the intensity of fluctuation was enhanced with the increase in combustion instability.
To explore the trend of peak in-cylinder pressure with ignition delay, the relationship between Pmax and ignition delay was established as shown in Figure 9. Figure 9 shows that the Pmax increases linearly with a longer ignition delay. The relationship can be described by the equation in the figure and R was 0.75, 0.78, and 0.73 when the engine was fueled with F–T diesel at the speeds of 1200, 2000, and 2800 rpm, respectively. A similar method was used to state the relationship between Pmax and ignition delay under different working conditions using 0# diesel. The results are displayed in the corresponding figure and the R was 0.81, 0.86, and 0.83, respectively. It can be concluded that Pmax and ignition delay were highly correlated, and a longer ignition delay was useful in increasing in-cylinder pressure. However, the cyclic variation enhanced and the tendency of combustion instability increased. The results indicated that cyclic variability rapidly increased with ignition delay under high speed, which was relatively small under lower speed conditions according to the fitting equations between Pmax and ignition delay. Compared to 0# diesel, ignition delay had relatively little effect on the cyclic variation since the R of F–T diesel was smaller than that of 0# diesel at the corresponding speed conditions.
The relationship between Pmax and combustion duration is shown in Figure 10. In contrast to the results presented in Figure 9, the Pmax decreases linearly with increased combustion duration. The relationship can be described in terms of the equations displayed in the figure and R was 0.61, 0.67, and 0.65 when the engine was fueled with F–T diesel at the speeds of 1200, 2000, and 2800 rpm, while for 0# diesel R was 0.73, 0.79, and 0.75 under the corresponding speed conditions, respectively. Similar findings are displayed under other operating conditions. This indicates that Pmax increases with short combustion duration, which is correct since the higher constant volume combustion leads to a shorter combustion duration. Within a certain range, combustion stability might be improved by decreasing the combustion duration. According to the fitting equations, the combustion duration significantly influenced the Pmax under the lower speed condition. Similarly, the correlation of F–T diesel was smaller than that of 0# diesel. Moreover, combustion duration had a more obvious effect on cyclic variation when fueling with F–T diesel compared to 0# diesel, because the absolute slope of linear regression was greater than that of 0# diesel at the same speed condition due to its higher CN and shorter combustion duration.

4. Conclusions

The main objective of this study was to research the performance characteristics when using Fischer–Tropsch (F–T) fuel in diesel engines and highlight the importance of a short ignition delay and a long combustion duration on cyclic variation. The following conclusions can be drawn compared to 0# diesel.
The F–T diesel has the properties of high CN and low boiling point, which led to a short ignition delay and a long combustion duration. Compared to 0# diesel, owing to these superior characteristics that are beneficial to improve the air–fuel mixture and reduce the gas turbulence during the kernel formation phase, the cyclic variation and fluctuation intensity of F–T diesel were smaller. To a certain extent, cyclic variation was improved with increased speed, and then the average fluctuation intensity decreased when the engine was fueled with the test fuels. A strong linear relationship was observed between cyclic variation and ignition delay. The cyclic variation linearly increased with ignition delay because pre-mixed reactivity increased with long ignition delay. Moreover, the influence was more obvious under high speed conditions. Compared to ignition delay, the combustion duration made less impact on cyclic variation, which resulted in a smaller value of R at the same speed. Furthermore, the cyclic variation linearly decreased with long combustion duration; the F–T diesel showed lower R than 0# diesel under all the test conditions. Moreover, the combustion duration had a significant influence on cyclic variation at low speeds due to the large absolute slope of linear regression.
In all, in-cylinder pressure fluctuations and the effect of short ignition delay and long combustion duration on cycle-to-cycle variations were further analyzed. These effects can be used to improve combustion stability and control the harmful damage caused by cyclic variation. Furthermore, the diesel engine can run stably and effectively without any modifications with F–T diesel.

Author Contributions

Data curation, Z.Z. (Zhao Zhen) and Z.Z. (Zhang Zhengwu); Writing—review & editing, S.J., W.T., and W.Z.

Funding

This research received no external funding.

Acknowledgments

The authors acknowledge the Lu’an group for providing the F‒T diesel and the specifications of CTL.

Conflicts of Interest

The authors declare no conflict of interest.

Nomenclature

CAcrank angle
CA50crank angle at which 50% of the fuel has burnt
BTEbreak thermal efficiency
ECUelectronic control unit
Pmaxmaximum in-cylinder pressure
EGRexhaust gas recirculation
TDCtop dead center
RPearson’s correlation efficiency
CNcetane number
HRRheat release rate
Idignition delay
Cdcombustion duration
CovPmaxcoefficient of variation of maximum in-cylinder pressure

References

  1. Ogunkoya, D.; Roberts, W.L.; Fang, T.; Thapaliya, N. Investigation of the effects of renewable diesel fuels on engine performance, combustion, and emissions. J. Fuel 2015, 140, 541–554. [Google Scholar] [CrossRef]
  2. Chen, Z.; Liu, J.; Han, Z. Study on performance and emissions of a passenger-car diesel engine fueled with butanol–diesel blends. J. Energy 2013, 55, 638–646. [Google Scholar] [CrossRef]
  3. Shi, J.H.; Wang, T.; Zhao, Z.; Yang, T.T.; Zhang, Z.W. Experimental study of injection parameters on the performance of a diesel engine with Fischer–Tropsch fuel synthesized from coal. Energies 2018, 11, 3280. [Google Scholar] [CrossRef]
  4. Höök, M.; Aleklett, K. A review on coal-to-liquid fuels and its coal consumption. Int. J. Energy Res. 2010, 34, 848–864. [Google Scholar] [CrossRef]
  5. Gill, S.S.; Tsolakis, A.; Dearn, K.D.; Rodríguez-Fernández, J. Combustion characteristics and emissions of Fischer-Tropsch diesel fuels in IC Engines. J. Prog. Energy Combust. Sci. 2011, 37, 503–523. [Google Scholar] [CrossRef]
  6. Torregrosa, A.J.; Broatch, A.; Plá, B.; Mónico, L.F. Impact of Fischer–Tropsch and biodiesel fuels on trade-offs between pollutant emissions and combustion noise in diesel engines. J. Biomass Bioenergy 2013, 52, 22–33. [Google Scholar] [CrossRef] [Green Version]
  7. Basha, S.A.; Gopal, K.R.; Jebaraj, S. A review on biodiesel production, combustion, emissions and performance. Renew. Sustain. Energy Rev. 2009, 13, 1628–1634. [Google Scholar] [CrossRef]
  8. Armas, O.; Ballesteros, R.; Cardenas, M.D. Thermodynamic diagnosis of diesel and biodiesel combustion processes during load-increase transient sequences. J. Appl. Energy 2012, 97, 558–568. [Google Scholar] [CrossRef]
  9. Tijmensen, M.J.; Faaij, A.P.; Hamelinck, C.N.; van Hardeveld, M.R. Exploration of the possibilities for production of Fischer Tropsch liquids and power via biomass gasification. J. Biomass Bioenergy 2002, 23, 129–152. [Google Scholar] [CrossRef]
  10. Armas, O.; García-Contreras, R.; Ramos, A. On-line thermodynamic diagnosis of diesel combustion process with paraffinic fuels in a vehicle tested under NEDC. J. Clean. Prod. 2016, 138, 94–102. [Google Scholar] [CrossRef]
  11. Alleman, T.L.; McCormick, R.L. Fischer−Tropsch Diesel Fuels Properties and Exhaust Emissions: A Literature Review; SAE: Thessaloniki, Greece, 2003. [Google Scholar] [CrossRef]
  12. Armas, O.; Yehliu, K.; Boehman, L.A. Effect of alternative fuels on exhaust emissions during diesel engine operation with matched combustion phasing. Fuel 2010, 89, 438–456. [Google Scholar] [CrossRef]
  13. Yehliu, K.; Boehman, L.A.; Armas, O. Emissions from different alternative diesel fuels operating with single and split fuel injection. Fuel 2010, 89, 423–437. [Google Scholar] [CrossRef]
  14. Yang, Z.; Steffen, T.; Stobart, R. Disturbance Sources in the Diesel Engine Combustion Process; SAE International: Michigan, MI, USA, 2013. [Google Scholar]
  15. Koizumi, I.; Gyakushi, N.; Takamoto, Y. Study on the cycle-by-cycle variation in diesel engines. Bull. Jsme 1977, 20, 7. [Google Scholar]
  16. Zhong, L.; Singh, I.P.; Han, J.S.; Lai, M.C.; Henein, N.A.; Bryzik, W. Effect of Cycle-to-Cycle Variation in the Injection Pressure in a Common Rail Diesel Injection System on Engine Performance; SAE International: Michigan, MI, USA, 2003. [Google Scholar] [CrossRef]
  17. Schmillen, K.; Wolschendorf, J. Cycle-to-Cycle variations of combustion noise in diesel engines. SAE Trans. 1989, 89, 60–70. [Google Scholar] [CrossRef]
  18. Rakopoulos, C.D.; Giakoumis, E.G.; Rakopoulos, D.C. Study of the short-term cylinder wall temperature oscillations during transient operation of a turbocharged diesel engine with various insulation schemes. Int. J. Engine Res. 2008, 9, 177–193. [Google Scholar] [CrossRef]
  19. Jakob, M.; Hülser, T.; Janssen, A.; Adomeit, P.; Pischinger, S.; Grünefeld, G. Simultaneous high-speed visualization of soot luminosity and OH chemiluminescence of alternative-fuel combustion in a HSDI diesel engine under realistic operating conditions. Combust. Flame 2012, 159, 2516–2529. [Google Scholar] [CrossRef]
  20. Sczomak, D.P.; Henein, N.A. Cycle-to-Cycle Variation with Low Ignition Quality Fuels in a CFR Diesel Engine; SAE International: Michigan, MI, USA, 1979. [Google Scholar] [CrossRef]
  21. Kyrtatos, P.; Zivolic, A.; Brückner, C.; Boulouchos, K. Cycle-to-cycle variations of NO emissions in diesel engines under long ignition delay conditions. J. Combust. Flame 2017, 178, 82–96. [Google Scholar] [CrossRef]
  22. Kyrtatos, P.; Hoyer, K.; Obrecht, P.; Boulouchos, K. Apparent effects of in-cylinder pressure oscillations and cycle-to-cycle variability on heat release rate and soot concentration under long ignition delay conditions in diesel engines. Int. J. Engine Res. 2014, 15, 325–337. [Google Scholar] [CrossRef]
  23. Eng, J.A. Characterization of Pressure Waves in HCCI Combustion; SAE International: California, CA, USA, 2002. [Google Scholar]
  24. Griffiths, J.F.; Whitaker, B.J. Thermokinetic interactions leading to knock during homogeneous charge compression ignition. J. Combust. Flame 2002, 131, 386–399. [Google Scholar] [CrossRef]
  25. Kyrtatos, P.; Bruckner, C.; Boulouchos, K. Cycle-to-cycle variations in diesel engines. Appl. Energy 2016, 171, 120–132. [Google Scholar] [CrossRef]
  26. Murayama, T.; Yamada, T.; Miyamoto, N.; Chikahisa, T. Nature and reduction of cycle-to-cycle combustion engine with ethanol–diesel fuel blends. J. Appl. Entomol. 1983, 135, 320–325. [Google Scholar]
  27. Yammamoto, k.; Tsuji, Y.; Aso, Y.; Hamasaki, T.; Shirahata, S.; Katakura, Y. Effect of diazinon exposure on antioxidant reactions in the silkmoth, Bombyx mori. J. Appl. Entomol. 2011, 135. [Google Scholar] [CrossRef]
  28. Zheng, Z.Q.; Yue, L.; Liu, H.F.; Zhu, Y.X.; Zhong, X.F.; Yao, M.F. Effect of two-stage injection on combustion and emissions under high EGR rate on a diesel engine by fueling blends of diesel/gasoline, diesel/n-butanol, diesel/gasoline/n-butanol and pure diesel. Energy Convers. Manag. 2015, 90, 1–11. [Google Scholar] [CrossRef]
  29. An, H.; Yang, W.M.; Li, J.; Zhou, D.Z. Modeling study of oxygenated fuels on diesel combustion: Effects of oxygen concentration, cetane number and C/H ratio. J. Energy Convers. Manag. 2015, 90, 261–271. [Google Scholar] [CrossRef]
  30. Lapuerta, M.; Armas, O.; Bermudez, V. Sensitivity of diesel engine thermodynamic cycle calculation to measurement errors and estimated parameters. J. Appl. Therm. Eng. 2000, 20, 843–861. [Google Scholar] [CrossRef]
  31. Karmakar, A.; Karmakar, S.; Mukherjee, S. Properties of various plants and animals feedstocks for biodiesel production. Bioresour. Technol. 2010, 101, 7201–7210. [Google Scholar] [CrossRef]
  32. Stone, R. Introduction to Internal Combustion Engines; Macmillan Press Ltd.: London, UK, 1999; pp. 295–300. ISBN 0-333-74013-0. Tesseraux, I.; Toxicoll, Let., 2004, 149. [Google Scholar]
  33. Zhao, H. HCCI and CAI Engines for the Automotive Industry; Woodhead Publishing Limited: England, UK, 2007. [Google Scholar]
  34. Heywood, J.B. Internal Combustion Engines Fundamentals; McGraw-Hill: New York, NY, USA, 1988. [Google Scholar]
  35. Maurya, R.K.; Agarwal, A.K. Experimental investigation on the effect of intake air temperature and air–fuel ratio on cycle-to-cycle variations of HCCI combustion and performance parameters. J. Appl. Energy 2011, 88, 1153–1163. [Google Scholar] [CrossRef]
  36. Uyumaz, A. Combustion, performance and emission characteristics of a DI diesel engine fueled with mustard oil biodiesel fuel blends at different engine loads. Fuel 2018, 212, 256–267. [Google Scholar] [CrossRef]
  37. Tsurushima, T. A new skeletal PRF kinetic model for HCCI combustion. J. Proc. Combust. Inst. 2009, 32, 2835–2841. [Google Scholar] [CrossRef]
  38. Amano, T.; Morimoto, S.; Kawabata, Y. Modeling of the Effect of Air/Fuel Ratio and Temperature Distribution on HCCI Engines; SAE Technical Paper: Michigan, MI, USA, 2001. [Google Scholar]
  39. Al-Dawody, M.F.; Bhatti, S.K. Effect of soybean oil biofuel blending on the performance and emissions of diesel engine using diesel-rk software. Int. J. Eng. Sci. Technol. 2011, 3, 4539–4555. [Google Scholar]
  40. Lu, X.C.; Ji, L.B.; Ma, J.J.; Huang, Z. Combustion stabilities and cycle-by-cycle variations of n-Heptane homogeneous charge compression ignition combustion. Energy Fuels 2007, 21, 1468–1473. [Google Scholar] [CrossRef]
  41. Lu, X.C.; Ji, L.B.; Ma, J.J.; Huang, Z. Experimental study on the cycle-by-cycle variations of homogeneous charge compression ignition combustion using primary reference fuels and their mixtures. Proc. Inst. Mech. Eng. Part D J. Automob. Eng. 2007, 221, 859–866. [Google Scholar] [CrossRef]
  42. Wang, Y.; Xiao, F.; Zhao, Y.; Li, D.; Lei, X. Study on cycle-by-cycle variations in a diesel engine with dimethyl ether as port premixing fuel. Appl. Energy 2015, 143, 58–70. [Google Scholar] [CrossRef]
  43. Chen, Z.; Yao, C.; Yao, A.; Dou, Z.C.; Wang, B.; Wei, H.Y.; Liu, M.J.; Chen, C.; Shi, J.J. The impact of methanol injecting position on cylinder-to-cylinder variation in a diesel methanol dual fuel engine. Fuel 2017, 191, 150–163. [Google Scholar] [CrossRef]
  44. Duan, X.B.; Liu, J.P.; Yuan, Z.P.; Guo, G.M.; Liu, Q.; Tang, Q.J.; Deng, B.D.; Guan, J.H. Experimental investigation of the effects of injection strategies on cycle-to-cycle variations of a DISI engine fueled with ethanol and gasoline blend. J. Energy 2018, 165, 455–470. [Google Scholar] [CrossRef]
  45. Maurya, R.K.; Agarwal, A.K. Statistical analysis of the cyclic variations of heat release parameters in HCCI combustion of methanol and gasoline. Appl. Energy 2012, 89, 228–236. [Google Scholar] [CrossRef]
Figure 1. Research engine test bench. ECU: electronic control unit.
Applsci 09 02032 g001
Figure 2. Variations of in-cylinder pressure.
Applsci 09 02032 g002
Figure 3. Variations of heat release rate.
Applsci 09 02032 g003
Figure 4. Variations of in-cylinder pressure increase rate.
Applsci 09 02032 g004
Figure 5. Comparison of combustion parameters: (a) Ignition point, ignition delay, and CA50; (b) combustion duration and break thermal efficiency (BTE).
Applsci 09 02032 g005
Figure 6. COV of Pmax under different speeds with the test fuels. (a) F‒T diesel, (b) 0# diesel.
Applsci 09 02032 g006
Figure 7. Intensity of fluctuation versus ignition delay under different speeds with the test fuels.
Applsci 09 02032 g007
Figure 8. Intensity of fluctuation versus combustion duration under different speeds with the test fuels.
Applsci 09 02032 g008
Figure 9. The correlation between peak in-cylinder pressure and ignition delay with (a) F–T diesel, (b) 0# diesel.
Applsci 09 02032 g009
Figure 10. The correlation between peak in-cylinder pressure and combustion duration with (a) F–T diesel, (b) 0# diesel.
Applsci 09 02032 g010
Table 1. Main specifications of the engine.
Specifications-
ModelElectronically controlled
TypeWater cooled, turbo-charged
Engine displacement (L)3.298
Bore × Stroke (mm × mm)100 × 105
Fuel injection systemCommon Rail fuel system
Compression ratio17.5
Calibration power (kW)/speed(rpm)85/3200
Maximum torque (Nm)/speed(rpm)315/1600‒2400
Table 2. Uncertainty and accuracy of the measuring equipment.
InstrumentParametersRangeAccuracyUncertainty (%)
Electric eddy current dynamometerTorque Speed0–600 (nm)
0–8000 (rpm)
0.4%
0.1%
-
Fuel consumption meterFuel mass0–20 (kg)0.4%-
Pressure sensorIn-cylinder pressure0–250 (MPa)0.05 (MPa)0.3
Table 3. The main specifications of the fuel.
Specifications0#-DieselFT-Diesel
Density (g/cm3)0.810.76
Initial boiling point (°C)200180.5
End boiling point (°C)375311.5
Sulfur content (ppm)100
Aromatic content (%)≤70.009
Heating value (J/g)42,65247,128
CN55.862.5

