Article

Sustainable Removal of Cr(VI) by Lime Peel and Pineapple Core Wastes

Centro de Investigación Tecnolóxico Industrial–MTI, University of Vigo, Campus As Lagoas-Marcosende, 36310 Vigo, Spain
*
Author to whom correspondence should be addressed.
Appl. Sci. 2019, 9(10), 1967; https://doi.org/10.3390/app9101967
Submission received: 6 April 2019 / Revised: 8 May 2019 / Accepted: 9 May 2019 / Published: 14 May 2019
(This article belongs to the Special Issue Advanced or Conventional Materials as Sorbent)

Abstract

:

Featured Application

Sustainable management of heavy metals by low-cost agroindustrial adsorbents.

Abstract

The search for efficient and environmentally friendly adsorbents has positioned lignocellulosic materials as attractive and low-cost alternatives instead of synthetic materials. Consequently, the present work investigates the efficacy of untreated lime peel (LM) and pineapple core (PP) as biosorbents for Cr(VI) removal. The maximum adsorption capacities (acquired at 24 h) of these sorbents were 9.20 and 4.99 mg/g, respectively. The use of these sorbents is expected to offer a rapid and efficient solution to treat effluents containing Cr(VI). Pineapple core showed the best biosorption properties and good distribution coefficients (distribution coefficient KD 8.35–99.20 mL/g) and the optimization of the adsorption was carried out by a response surface methodology using the Box–Behnken design. Thus, the effect of pH, biosorbent dosage, and temperature were assessed during the whole procedure. Three different responses were studied—Cr(VI) removal, Cr biosorption, and distribution coefficient—and the optimal conditions for maximizing the responses were identified by numerical optimization applying the desirability function. The resulting optimal conditions were: initial solution pH 2.01, biosorbent dosage 30 g/L, and temperature 30.05 °C. Finally, the process scale-up was evaluated by the simulation of the process working with a column of 100 L using the Fixed-bed Adsorption Simulation Tool (FASTv2.1). This research presents the obtained environmental benefits: i) reduction of pineapple waste, ii) Cr(VI) reduction and biosorption, iii) shortest sorption time for Cr, iv) properties that allow the biosorption process on the flow system, and v) low-cost process.

1. Introduction

Industrial development, responsible for providing welfare to society today, is one of the chief causes of environmental contamination. This pollution involves several aspects including the generation of solid wastes as a result of different activities (e.g., agroindustrial) or the release of untreated effluents containing a variety of organic and inorganic contaminants (dyes, pesticides, heavy metals, etc.), which causes pollution in different water bodies [1]. They are a subject of great concern that requires the development of efficient treatments and disposal.
Changing the economic model from one based on producing, using, and throwing away, to a new model focused on a circular economy that involves the reuse of natural resources for the longest possible time themselves. Therefore, waste recycling and valorization become an economic and environmental issue [2].
Agroindustrial wastes have been shown as suitable raw materials to produce adsorbents with the ability to remove different kinds of pollutants by adsorption [3] due to their high lignocellulosic content, which improves the adsorption capacity of these materials. Moreover, adsorption has been demonstrated as a successful methodology for treating effluents containing inorganic and organic pollutants [1,4]. Their use overcomes some of the drawbacks of conventional adsorbents (e.g., activated carbons) such as the elevated cost and limitation by the nature of the pollutants present in the wastewater [5]. Agroindustrial wastes are becoming a viable option as biosorbents because they have a low or null cost [6], are readily available [7], and are easily removable because several microorganisms can use them as a carbon source [8].
Waste generated in the food and beverage industry of pineapples and limes are suitable candidates to be used as adsorbents. More and more consumers, particularly in Europe and North America, demand fresh pineapples and its manufactured products are an important, fast, increasing, booming market [9]. The main wastes from the pineapple industry (peel, core, stem, crown, and leaves) constitute roughly 50% (w/w) of the total pineapple weight. Moreover, lime green processing plants produce large amounts of waste materials annually, including peel from the extraction of citrus juice [9]. The management of all these wastes, which produce odor and soil pollution, poses a problem for the industries mentioned above. With that in mind, the utilization of these raw waste materials would be an excellent opportunity to handle the high volume of residues and connect it to the circular economy.
On the other hand, chromium (Cr) is utilized in a wide variety of manufacturing industries including leather tanning, metallurgical industry, textile manufacturing, and processes like wood preservation. The poor treatment of the generated waste is a source of pollution of watercourses [10]. Cr is known as a carcinogenic and mutagenic compound and its release into water bodies at concentrations higher than 0.05 mg/L for Cr(VI) and 5.0 mg/L for Cr(III) [10,11] generates toxic effects in the environment. It has been demonstrated that some different raw and modified lignocellulosic materials are convenient, low-cost biosorbents for Cr(VI) and Cr(III) disposal [12,13].
According to our knowledge, this research is one of the first attempts where both lime peel and pineapple core are used as cost-effective adsorbents of a toxic metal. In this context, the present study intends to ascertain the use of these raw agroindustrial residues as a viable low-cost approach for Cr(VI) elimination. Then, the optimization of the adsorption process variables was performed by a Box–Behnken experimental design. Finally, the isothermal parameters were determined and the viability of the adsorption process scale-up to a column of 100 L was simulated and analyzed by the Fixed-bed Adsorption Simulation Tool (FAST) v2.1.

2. Materials and Methods

2.1. Pollutants

The synthetic polluted solution was prepared using deionized water at desired concentrations of Cr(VI) by dissolving K2CrO4 (Riedel de Haën AG, Seelze, Germany). The reagents used in the development of the work were of analytical grade. The purified water used for the preparation of the solutions was obtained by reverse osmosis technology (AquaMax-Basic 360, Young Lin Instruments Anyang, Gyeonggi-do, Korea).

2.2. Biosorbents

The selected wastes were lime peel (LM) and pineapple core (PP) provided by two local factories, Compañía Española de Algas Marinas S.A. (Porriño, Pontevedra, Spain) and Freshcut S.L. (Vigo, Pontevedra, Spain), respectively. LM and PP were rinsed off and oven-dried (80 °C) for 48 hours and, after that, the wastes were ground to a particle size of ≤0.2 mm using a cutting mill (Retsch SM 100, Retsch GmbH, Haan, Germany). Then, they were stored in hermetic plastic bags until use.

2.3. Adsorption Tests

Adsorption assays were conducted in triplicate inside 250 mL Erlenmeyer flasks. A synthetic solution was put into contact with the biosorbents (150 mg/L for kinetics and 50–500 mg/L for isotherms) and the maximum adsorption capacity was attained after 24 h. pH was monitored and adjusted when necessary using 1 M NaOH or 1M HCl solutions. Flasks were shaken in an incubator (Thermo scientific MaxQ800, Thermo Fisher Scientific, Alcobendas, Madrid, Spain) at 150 rpm at studied temperatures (20–35 °C). The assays were performed in triplicates and the results are expressed by the average values.

2.4. Biosorbent Characterization

2.4.1. Biosorbent Point of Zero Charge

The mass titration method was applied to the determination of the zero charge point (pHPZC) determination [13]. Succinctly, 50 mL of a background electrolyte, NaNO3, was mixed with 1 g of biosorbent at different pH values (from 2 to 8) for a period of 24 h. The pH was adjusted to the chosen values with diluted HNO3 and NaOH. A Jenway 3520 pH Meter (Thermo Fisher Scientific, Alcobendas, Madrid, Spain) was employed to measure pH.

2.4.2. Fourier Transform Infrared Spectroscopy (FTIR)

All the measures were obtained by a spectrometer Jasco FT/IR-4100 (Jasco Inc., Easton, MD, USA), fitted with an attenuated total reflectance (ATR) accessory. Previously, the samples were finely ground and oven-dried at 60 °C for 1 h and the pellets were obtained by the potassium bromide (KBr) pellet press method. All of them were analyzed among 4000 and 400 cm−1 with a resolution of 4 cm−1 and performing 32 scans. The different biosorbents were studied initially and after the adsorption.

2.4.3. Scanning Electron Microscopy (SEM) Analyses

In order to provide a morphological characterization and elemental analysis of biosorbents, SEM images and Energy Dispersive Microanalysis (EDS) were carried out on a JEOL JSM-6700F instrument (Jeol Ltd., Akishima, Tokyo, Japan) equipped with an Oxford Inca Energy 300 X-ray Energy Dispersive Spectrometer. (Oxford Instruments NanoAnalysis & Asylum Research, High Wycombe, UK) An acceleration voltage of 15 kV was used (Service of Electronic Microscopy, C.A.C.T.I., University of Vigo, Vigo, Spain).

2.5. Experimental Design

Statistical methods based on response surface methodology (RSM) have been widely applied in engineering for the optimization of several treatment processes. Box–Behnken design enables the optimization of the factors affecting the biosorption process and to ascertain its effect on the response. To optimize the chromium removal process, a Box–Behnken design for three factors was utilized and the biosorbent that showed the best performance was selected. The experimental design was composed of 2 levels and three variables (23). The number of experiments was obtained as detailed below:
N = k2 + k + cp
where cp is the replicates number at the central point and k is the factor number. In order to find the optimal level of the selected factors (initial pH (x1), waste dosage in 50 mL (x2) and working temperature (x3)), 17 runs were conducted in duplicate. The previous variables were selected as the aspects that could condition the response functions: Cr(VI) removal, and total Cr removal. The assays were accomplished similarly to previous ones in 250 mL Erlenmeyer flask at 150 rpm and with a Cr(VI) initial concentration of 50 mg/L. The obtained experimental results are provided in the design matrix (Table 1).

2.6. Statistical Analysis of the Experimental Model

Data were analyzed using a one-way analysis of variance (ANOVA) by Design Expert® 8.0.0 software (Stat-Ease Inc., Minneapolis, MN, USA). In the RSM, the dependent and independent variables are usually correlated by applying a quadratic equation:
Y i =   β 0 +     β i x i +     β ii x i 2 +     β ij x i x j
where the independent parameters are xi and xj, the response is Yi, the slope or linear effect of the input factor is βi, the two-way linear by linear interaction effect is βij, the quadratic effect is βii, and the constant is β0 [14]. Equation (2) shows the connection linking the independent variables and the forecasted responses and in terms of coded values.

2.7. Cr Analysis

The concentrations of Cr(VI) and total Cr were determined in the liquid by the colorimetric 1,5-diphenylcarbazide method at 540 nm using a spectrophotometer JASCO V-630 (Jasco Inc., Easton, MD, USA) [15]. The determination of Cr(III) was obtained from the difference between total Cr and Cr(VI).
Cr(VI) and total Cr removal efficiencies reflect the decrease of Cr(VI) in the solution and the reduction of the Cr(VI) concentration due to the generation of Cr(III) for the oxidation process and their adsorption, respectively. They were expressed in percentages terms using the Equation (3).
Removal   efficiency   ( % )   =   100   ×   ( C 0 C t ) / C 0
where the concentration of Cr(VI) or total Cr in the solution after 24 hours is Ct and the initial Cr(VI) concentration is C0.
In the isotherm analysis, the amount of Cr adsorbed per gram of adsorbent was expressed applying the equation below:
q e = ( C 0 C e ) × V / m
where qe is the equilibrium contaminant adsorption (mg/g), C0 and Ce are the initial and equilibrium Cr concentrations (mg/L), respectively, V the solution volume (L) and m the biosorbent dosage (g).
The uptake distribution coefficient is defined as the ratio of the quantity of the adsorbate adsorbed per mass of solid to the amount of the adsorbate remaining in solution at equilibrium and related to the partitioning of a contaminant between the solid and aqueous phases [16]. In this coefficient, the adsorbed species in the adsorbent were divided by their concentration in the aqueous phase, and it was expressed according to the equation shown below [17]:
K D = ( C 0 C e ) × V / ( m × C e ) ( mL / g )

3. Results and Discussion

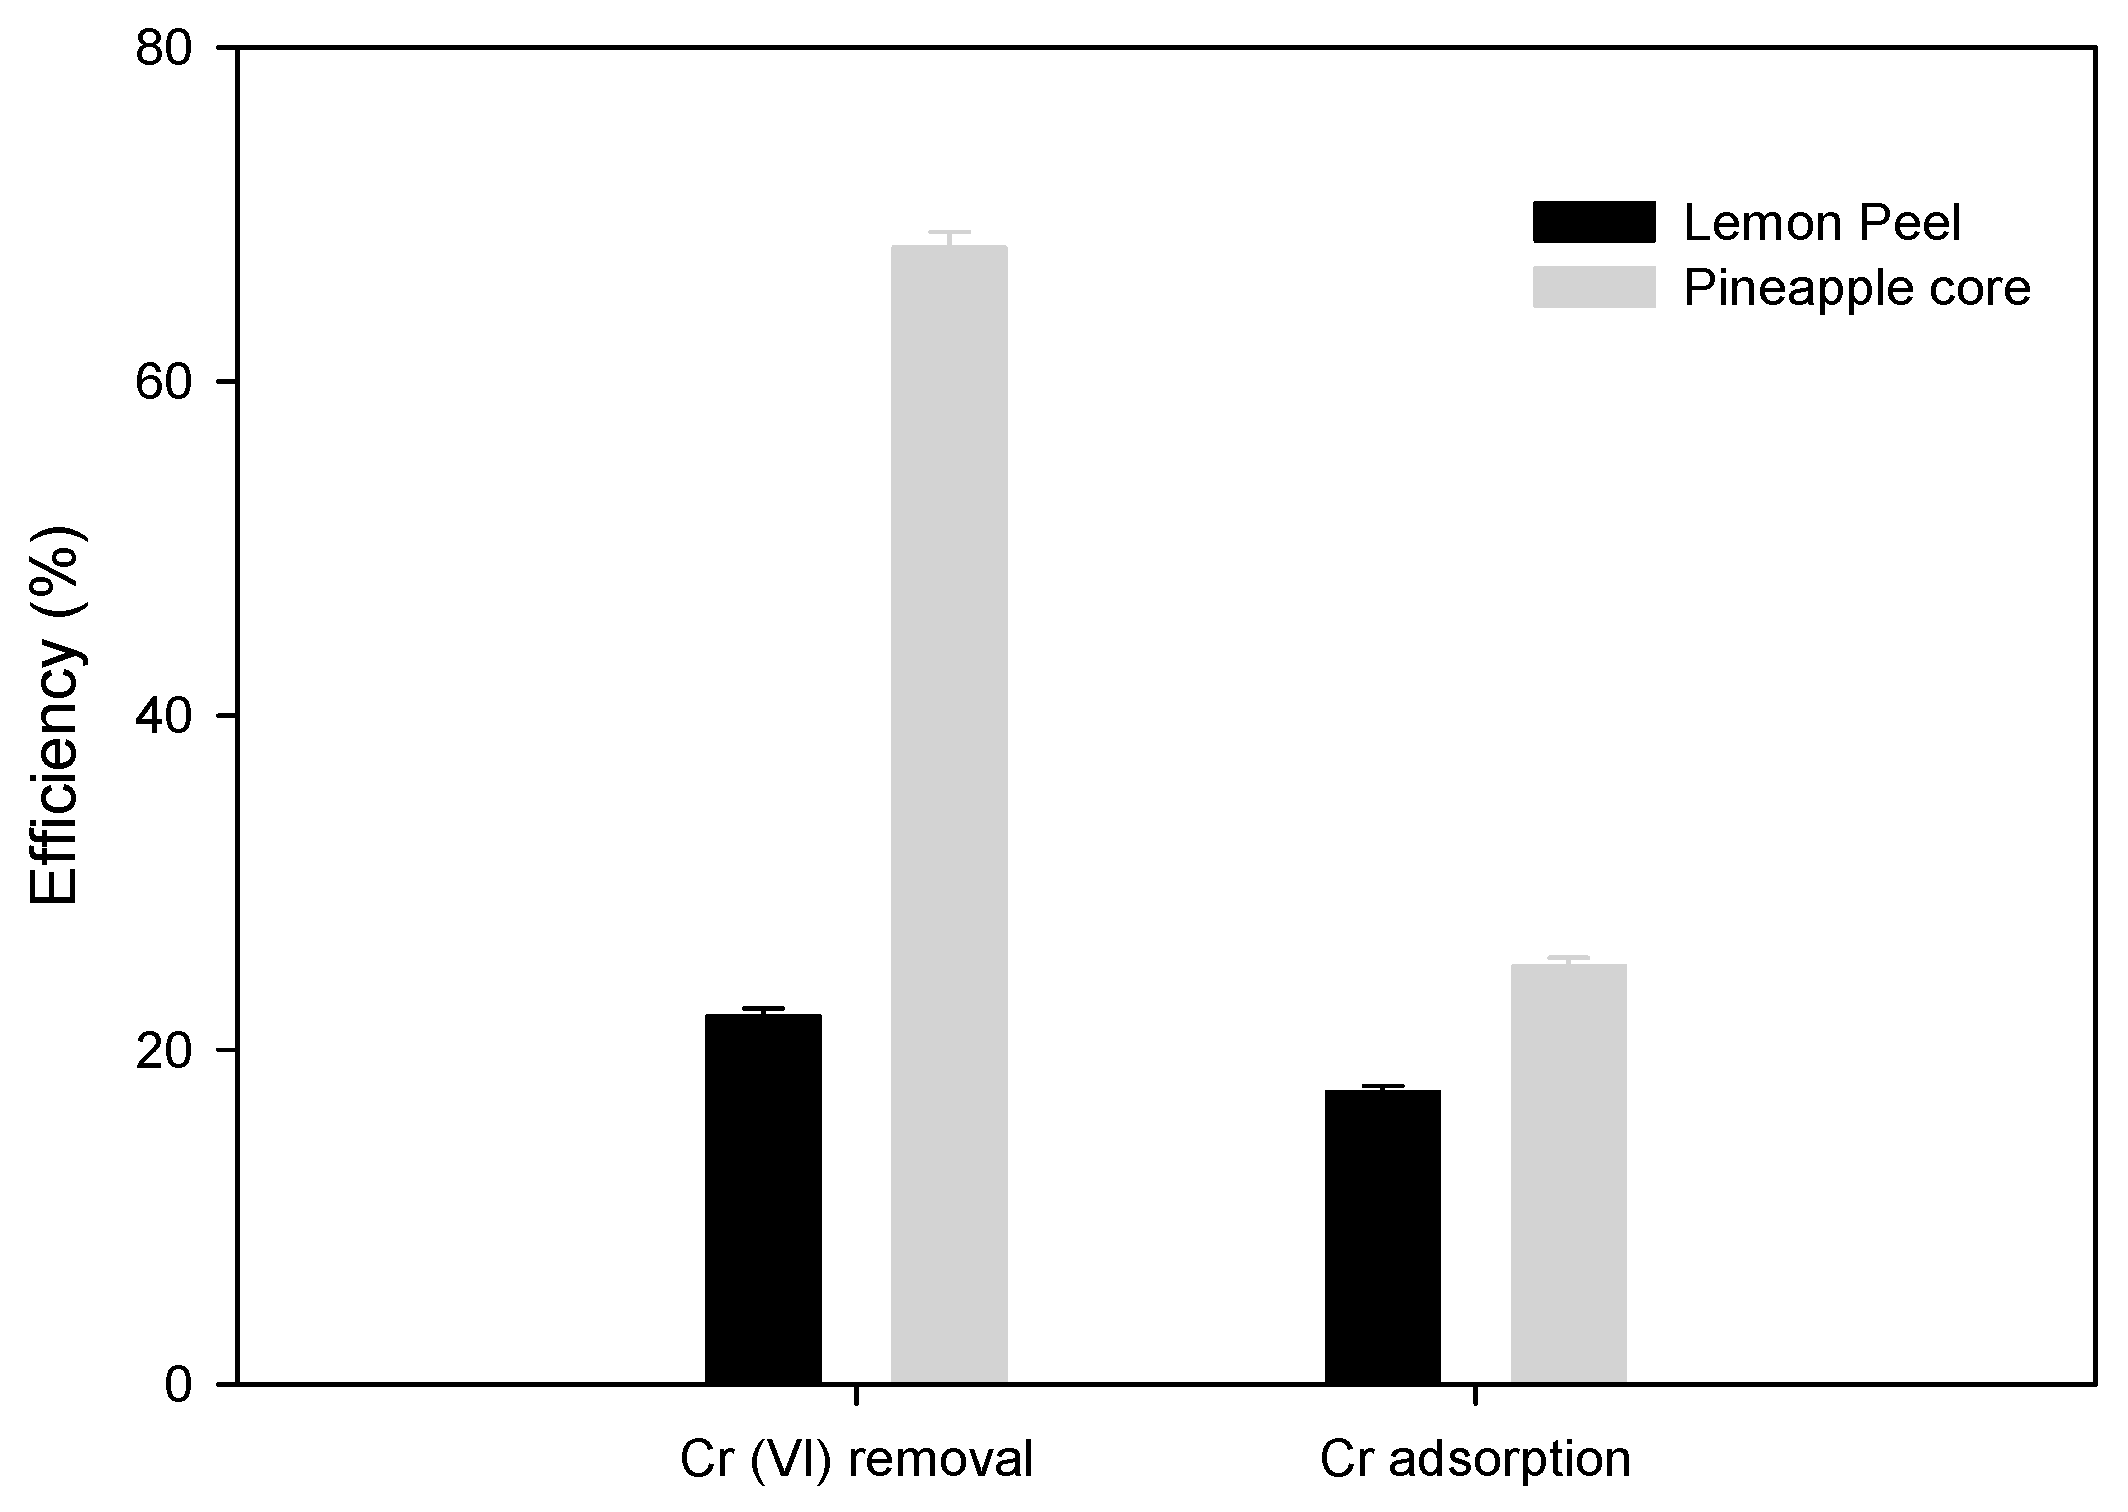
3.1. Screening of Biosorbents

The selected PP wastes (lignin 5.78, cellulose 24.53, and hemicellulose 28.53 g/100 g dry weight [18]) and LM wastes (lignin 1.73, cellulose 12.72, and hemicellulose 6.30 g/100 g dry weight with around 46% w/w of carbon content) are lignocellulosic-rich materials; this fact provides these biosorbents a quite complex structure that contains a wide range of active sites that makes them able to adsorb different pollutants from wastewater [5]. Thus, the adsorption ability of the selected residues was analyzed using a synthetic Cr(VI) solution at a natural pH, around 4.
As can be seen in Figure 1, for both biosorbents Cr(VI) removal levels are higher than Cr adsorption, showing PP waste the best performance in terms of Cr(VI) removal (around 70%) after reaching the equilibrium at 24 h (Figure S1). These facts can be explained by the “adsorption-coupled reduction” reaction that takes place and is fully recognized as the Cr(VI) adsorption mechanism in natural biosorbents operating at acidic conditions [12]. According to Park et al. [19,20], this Cr(VI) to Cr(III) reduction can happen through two distinct reduction mechanisms (direct and indirect). Miretzky and Cirelli [12] found that a biomaterial with a reduction potential lower than Cr(VI) can reduce Cr(VI) in an aqueous phase due to the contact with electron-donor groups (such as thiol, phenolic, and carboxylic functional groups). In addition, indirect reduction includes 3 stages: (i) binding of anionic Cr(VI) onto the biomaterial positively charged groups (amino and carboxyl groups), (ii) reduction of Cr(VI) by adjacent electron-donor groups to Cr(III) and (iii) release of the generated Cr(III) directly into aqueous phase or complexation with adjacent groups.
Regarding the Cr adsorbed, it is concluded that although the best adsorption capacity was also displayed by the PP waste, the total Cr concentration measured in the supernatant was greater than Cr(VI). This fact corroborates that the elimination of Cr(VI) in PP and LM takes place by both mechanisms, direct and indirect, as previously described by Park et al. [19,20].
The best performance was attained when the adsorption was carried out with PP as a biosorbent with an adsorption uptake of 2.49 mg/g increasing 2.8-fold the values attained for LM. This is also in consonance with the KD values obtained for the biosorbents: 99.20 and 21.19 mL/g for PP and LM, respectively. Therefore, the next assays were carried out using this PP biosorbent.

3.2. PP Characterization

Once PP was established as the best biosorbent, a deep physical-chemical characterization of this waste was accomplished.
The morphology and structural aspects were determined by SEM-EDS. Related to the biosorbents composition, EDS analyses determined that the main constituents were C and O (Figure 2a). SEM images confirmed that this biosorbent has a heterogeneous surface with rough areas and micropores (inset Figure 2a) with an average of size ranging from 10 to 200 µm. The chemical structure of the biosorbent was analyzed using FTIR spectroscopy with the purpose of determining the functional groups that exist in the surface of the sorbent (Figure 2c and Table 2). A considerable quantity of oxygen-functional groups (O-H, C=O, C-O) were observed. As it is shown in Table 2, the main functional groups identified into the biosorbents belonged to the polymers cellulose, hemicellulose, and lignin, which are present in the waste. This fact is in accordance with the composition of PP (hemicellulose 28.5%; cellulose 24.5%, lignin 5.8; pectin 1.6%) determined by Pardo et al. [18]. Furthermore, the presence of hydroxyl, amines, and carbonyl functional groups demonstrates that the adsorption and binding of heavy metals could be possible and the process occurs [21].
It is clear that the biosorbent surface charge is a fundamental parameter regarding the disposal of ionic forms. The pHPZC of the biosorbent was around 3.5 and determined the affinity of this biosorbent. Thus, the surface of the biosorbent is positively charged at pH < pHPZC which lead to an electrostatic attraction for Cr(VI) as oxyanion. On the other hand, the charge of the biosorbent surface is negative at pH > pHPZC and this circumstance generates electrostatic repulsion of Cr(VI), however, it favors Cr(III) adsorption. Therefore, pH has proven to be a crucial factor in the adsorption process and ought to be considered to optimize the adsorption process.

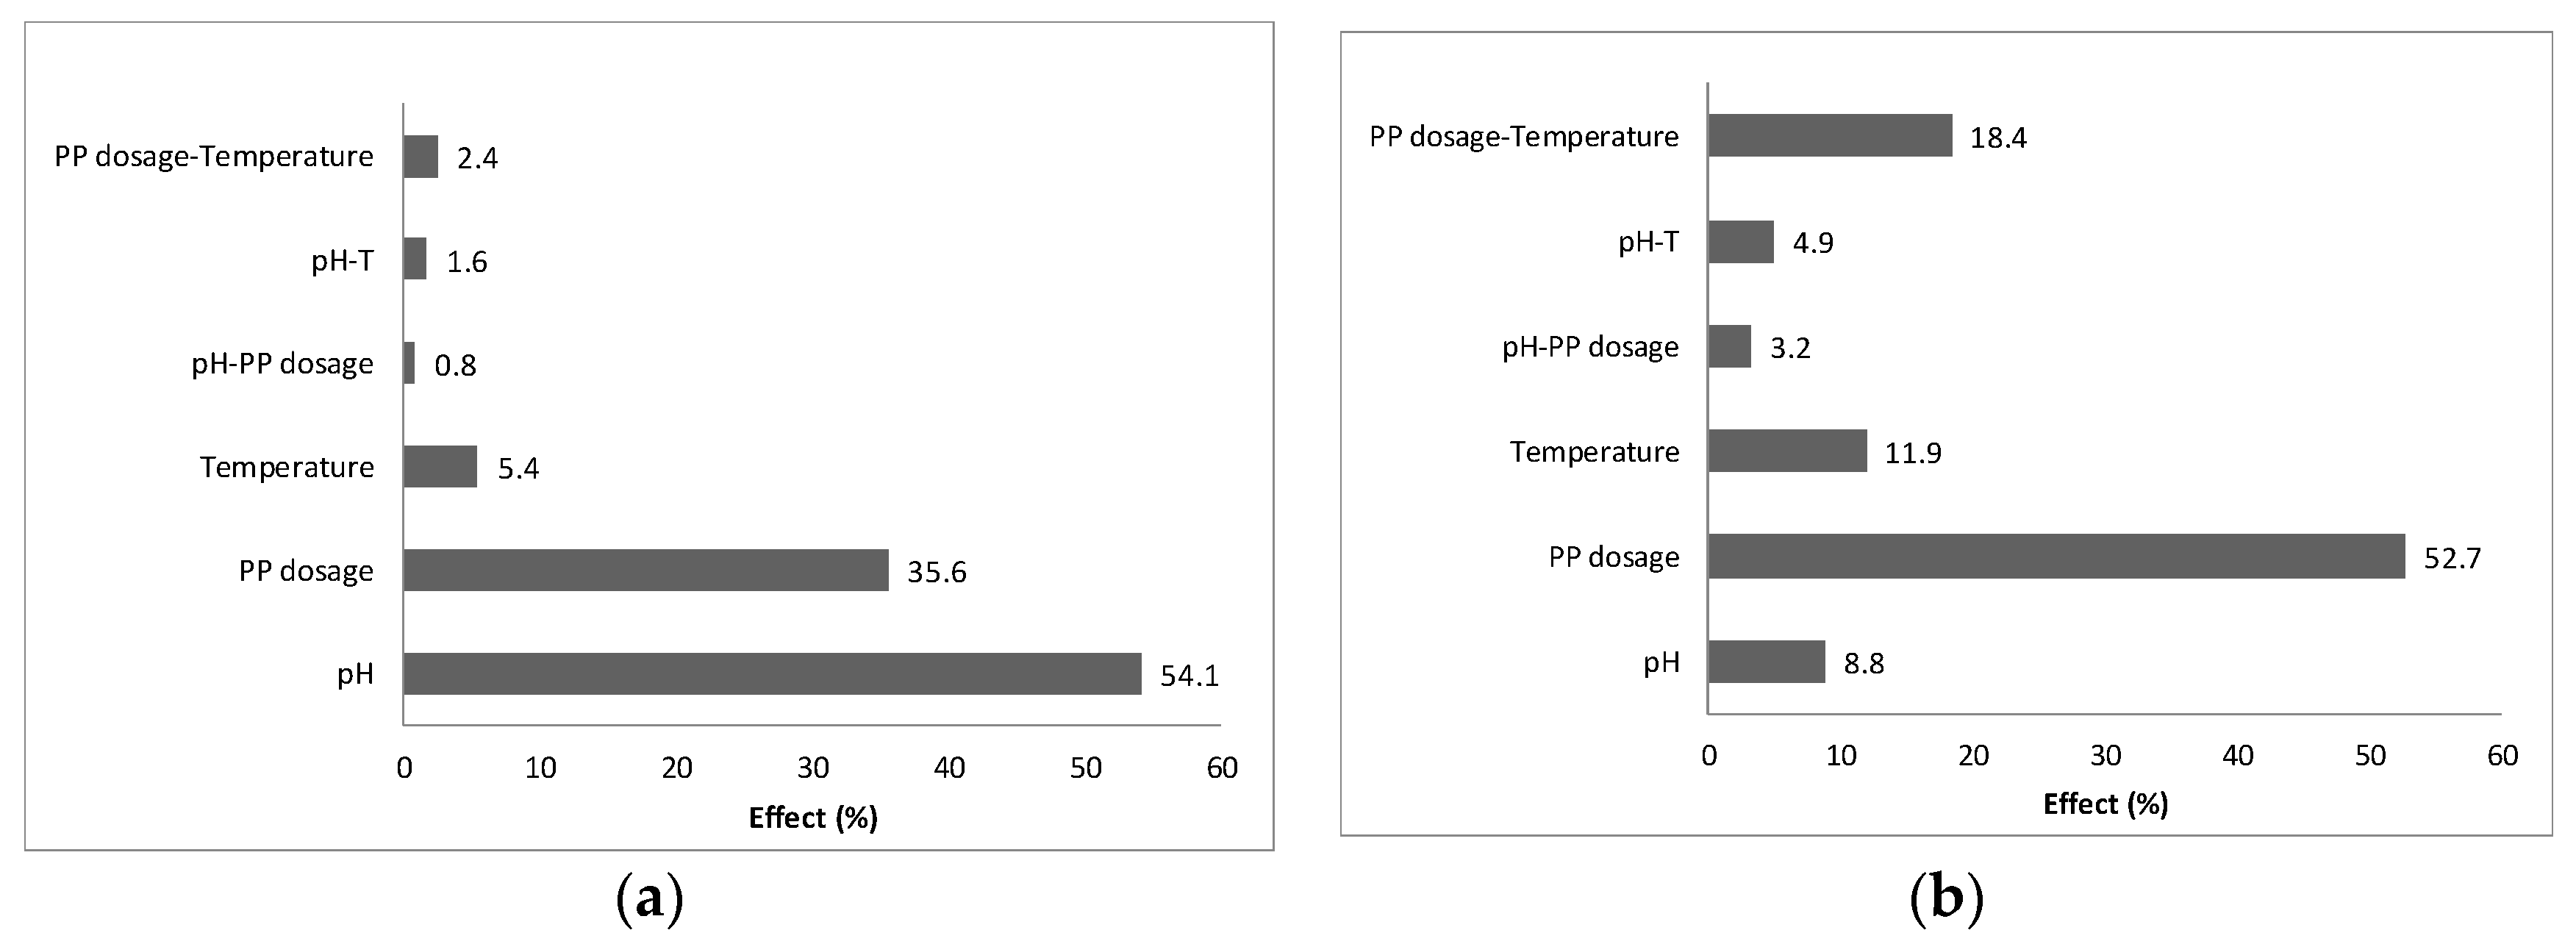
3.3. Experimental Design

Based on the methodology of design of experiments, a series of experiments were completed according to the three-level Box–Behnken matrix. In this study design, while one of the items was fixed at its center level, combinations of the different levels of the remaining factors were put into practice [23].
Cr removal/adsorption is related to solution pH because pH exerts influence on Cr speciation and also affects active functional groups (–OH, –COOH, –NH2) influencing their dissociation [12]. Moreover, the temperature of the wastewater containing Cr may also vary depending on the industrial procedure and it is a factor to be considered in the efficiency of the process because it has great influence both in the redox reaction and in the adsorption process [24,25].
Accordingly, temperature, pH and biosorbent dosage were selected as independent variables, and Cr(VI) and total Cr removal were established as responses of the 17 runs performed (Table 1). Cr(VI) removal values close to 90% were obtained in runs 4 and 12, when the lowest pH was used and operating at medium and highest values of the biosorbent dosage, as well as temperature. Therefore, it was confirmed the great influence of the initial pH on the Cr(VI) removal. This fact is in agreement with the indirect and direct mechanisms previously described in Section 3.1, since protons participate in the Cr(VI) to Cr(III) redox reaction and at low pH the amino and carboxyl groups turn out to be protonated, increasing the rate of anionic Cr(VI) elimination from aqueous phase [26]. On the other hand, as it is shown in Table 1 the removal of Cr(VI) enhanced with an increase of temperature and biosorbent dosage. It is in concordance with the fact previously reported by Rawajfih and Nsour [27] where the endothermic nature of the Cr(VI) removal procedure was established.
Following the tendency detected in the initial experiments (Section 3.1) the percentages of total Cr removal onto the PP were lower than Cr(VI) removal percentages. The highest adsorptions (around 35%) were obtained in runs 2 and 4, when the highest biomass dosage was used. According to Miretzky and Cirelli [12], this trend indicates a first-order kinetic model adsorption. In addition, the total Cr removal is clearly favored at high temperatures and low pHs (Table 1). These facts corroborate the endothermic essence of adsorption procedure and the great influence of pH in the removal process.
Apart from the selected responses, adsorption capacity and distribution coefficient were calculated to confirm the attained results (Table 1). Similarly to the selected responses, the uptake increased operating at more acidic pH value and reaching the highest value at medium and highest values of temperature. On the other hand, KD presented the highest values operating at the maximum value of temperature. Those results confirm the influence of the selected variables in the performance of the biosorbent.

3.4. Box–Behnken Analysis

For each obtained response, Cr(VI) and total Cr removal, the analysis of variance (ANOVA) as well as tests for evaluating the significance of the regression model were performed (Table 3). In the following sections, the details for each response will be discussed.

3.4.1. Cr(VI) Removal

ANOVA analysis is crucial to determine if the model is significant and adequate. It split the total variance of the results into the model inaccuracy and the experimental error, showing if the divergence from the model is significant in comparison with the variation because of residual error [28].
Values of F and p-values were employed to specify the model significance and the magnitude of each coefficient. Thus, the obtained F-value is statistically significant, (typically p-values <0.05), this means that the model made a good approach to forecast the output factor and also, that there is a notable connection linking the set of predictions and the dependent factor indicating that the model has significance. The F-value (66.88) implies the model is significant (p-value <0.0001) (Table 3). The odds that an F-value this large would occur due to noise are only 0.01%. The significance of each model term was elucidated based on its p-value. According to these values the terms pH (x1), PP dosage (x2), temperature (x3), PP dosage-temperature (x2 x3), and the square of pH (x12) are significant model terms. The high correlation coefficient (R2 = 0.9885) demonstrated the good connection linking the forecasted and experimental values. In addition, the predicted (Pred R2) and the adjusted (Adj R2) correlation coefficients are in good concordance.
Adeq-Precision measures the ratio signal to noise and a ratio higher than 4 is desirable. A ratio of 27.377 was obtained in this model, which evidences the adequacy of the signal. Thus, the model may be applied to navigate the design space. Furthermore, the variation coefficient percentage (CV) was lower than 15% and according to Rossi [29] this value demonstrates exactness and trustworthiness of the performed experiments.
The obtained expression of the selected response, Cr(VI) removal, according to the studied variables coded factors is described in the Equation (6):
Cr(VI) removal (%) = 65.20 − 8.45 × x1 + 6.85 × x2 +2.68 × x3 − 1.03 × x1x2 − 1.47 × x1x3 + 1.79 × x2x3 + 8.97 × x12 + 1.23 × x32
The Pareto analysis of the resulting RSM model equation (Equation (7)) was performed to study the percentage effect (Pi) of each item on the response [30]. Pi is calculated as a function of the equation below:
P i = ( β i 2 /   β i 2 ) ( i 0 )
The graph corresponding to the Pareto analysis of the Cr(VI) removal response is presented in Figure 3a. As can be observed in this figure, among the variables, the pH (54.1%) and biosorbent dosage (35.6%) are the most significant variables on the Cr(VI) removal. These outcomes are in accord with those reported by Prabhul et al. [31], where pH and biomass dosage presented the maximum effect in the removal efficiency of Cr(VI) by the marine algae, Sargassum sp.
Response surface plots offer a helpful instrument to forecast the selected responses for several conditions of the assessed variables and determine the potential relationship among these variables. Figure 4a depicts the graphical illustration of the response surface of pH and PP dosage holding the temperature constant at 27.5 °C (central level). As shown, the Cr(VI) removal improves with a pH decrease and an increase of the biosorbent dosage.

3.4.2. Total Cr removal

The tested model for the Cr adsorption was highly significant (Table 3), as evidenced by a really small probability value (p-values <0.0001). For this response, pH (x1), PP dosage (x2), temperature (x3), pH-PP dosage (x1x2), pH-temperature (x1x3), PP dosage-temperature (x2x3) and the square of PP dosage (x22) are significant model terms. The correlation coefficient value (R2 0.9876) was lower than Cr(VI) removal response, however, it is an acceptable value and the Pred R2 is in good concordance with the Adj R2.
Similarly to previous section, the expression relating the response, total Cr removal, with the selected variables was obtained (Equation (8)):
Total Cr removal (%)= 25.47 − 3.01 × x1 + 7.38 × x2 +3.51 × x3 − 1.82 × x1x2 + 2.26 × x1x3 + 4.36 × x2x3 − 7.5·10−4 × x12 − 3.62 × x22 − 1.03 × x32
The total Cr removal response was analyzed by Pareto (Equation (8)) (Figure 3b). This analysis evidences biosorbent dosage (52.7%) has the biggest influence in the total Cr removal, followed by the interaction between PP dosage and temperature. This is in accord with Anupam et al. [32] who found out that adsorbent dosage is the governing factor of the Cr(VI) removal.
Figure 4b shows the response surface plot for total Cr removal in the function of temperature and PP dosage keeping pH stable at the central level (3.5). According to the response surface, the total Cr removal grows when the PP dosage and temperature increase. These outcomes confirm that the Cr(VI) removal and the Cr adsorption took place by different mechanisms in the studied biosorbent.

3.4.3. Desirability Function and Validation

The optimization of the obtained responses simultaneously was performed by a desirability function approach. In this approach by their combination in a single objective function, which in essence point out the connection of all responses that are to be optimized by their combination in [33]. The optimum conditions for the desirability function provided by the Design Expert 8.0 software were pH 2.01, PP dosage 1.50 g, and 30.10 °C. The low pH and moderate temperature around 30 °C are in accordance with previous studies where lignocellulosic materials were used for Cr(VI) removal [27,34]. In order to validate these conditions, a new experiment was performed. Under this environment, a 92.39% of Cr(VI) removal and 35.81% of Cr was forecasted. Comparing the experimental results with the predicted ones, an absolute error of 0.18% and 5.2% for Cr(VI) removal and Cr adsorption, respectively and with a distribution coefficient of 19.17 mL/g. Therefore, it can be concluded that the obtained desirability function can be effectively employed in the optimization of the considered procedure.

3.4.4. Characterization of PP after the Adsorption

To know the process of adsorption and the main functional groups implicated in the Cr adsorption, SEM-EDS analyses, and FT-IR spectra were performed to the PP after the adsorption process in the optimized conditions. The SEM image (Figure 2b) shows that the physical appearance of the PP was not modified even working at extreme pH conditions (pH 2) and EDS evidenced the Cr sorption (Figure 2b). The FT-IR peaks (Figure 2c) shifted the wavenumbers because of the biosorbent-functional group interaction. An increase in the bond strength caused the change of the bands to higher frequencies. On the other hand, the weakening of the bond caused a decrease in the frequencies [35]. The broad and intense band observed in the initial PP sample at 3311 cm−1 displaced to 3345 cm−1 after the absorption of Cr. Similar results were obtained for carboxyl and amine groups. These results imply that these groups might be involved in the adsorption process.

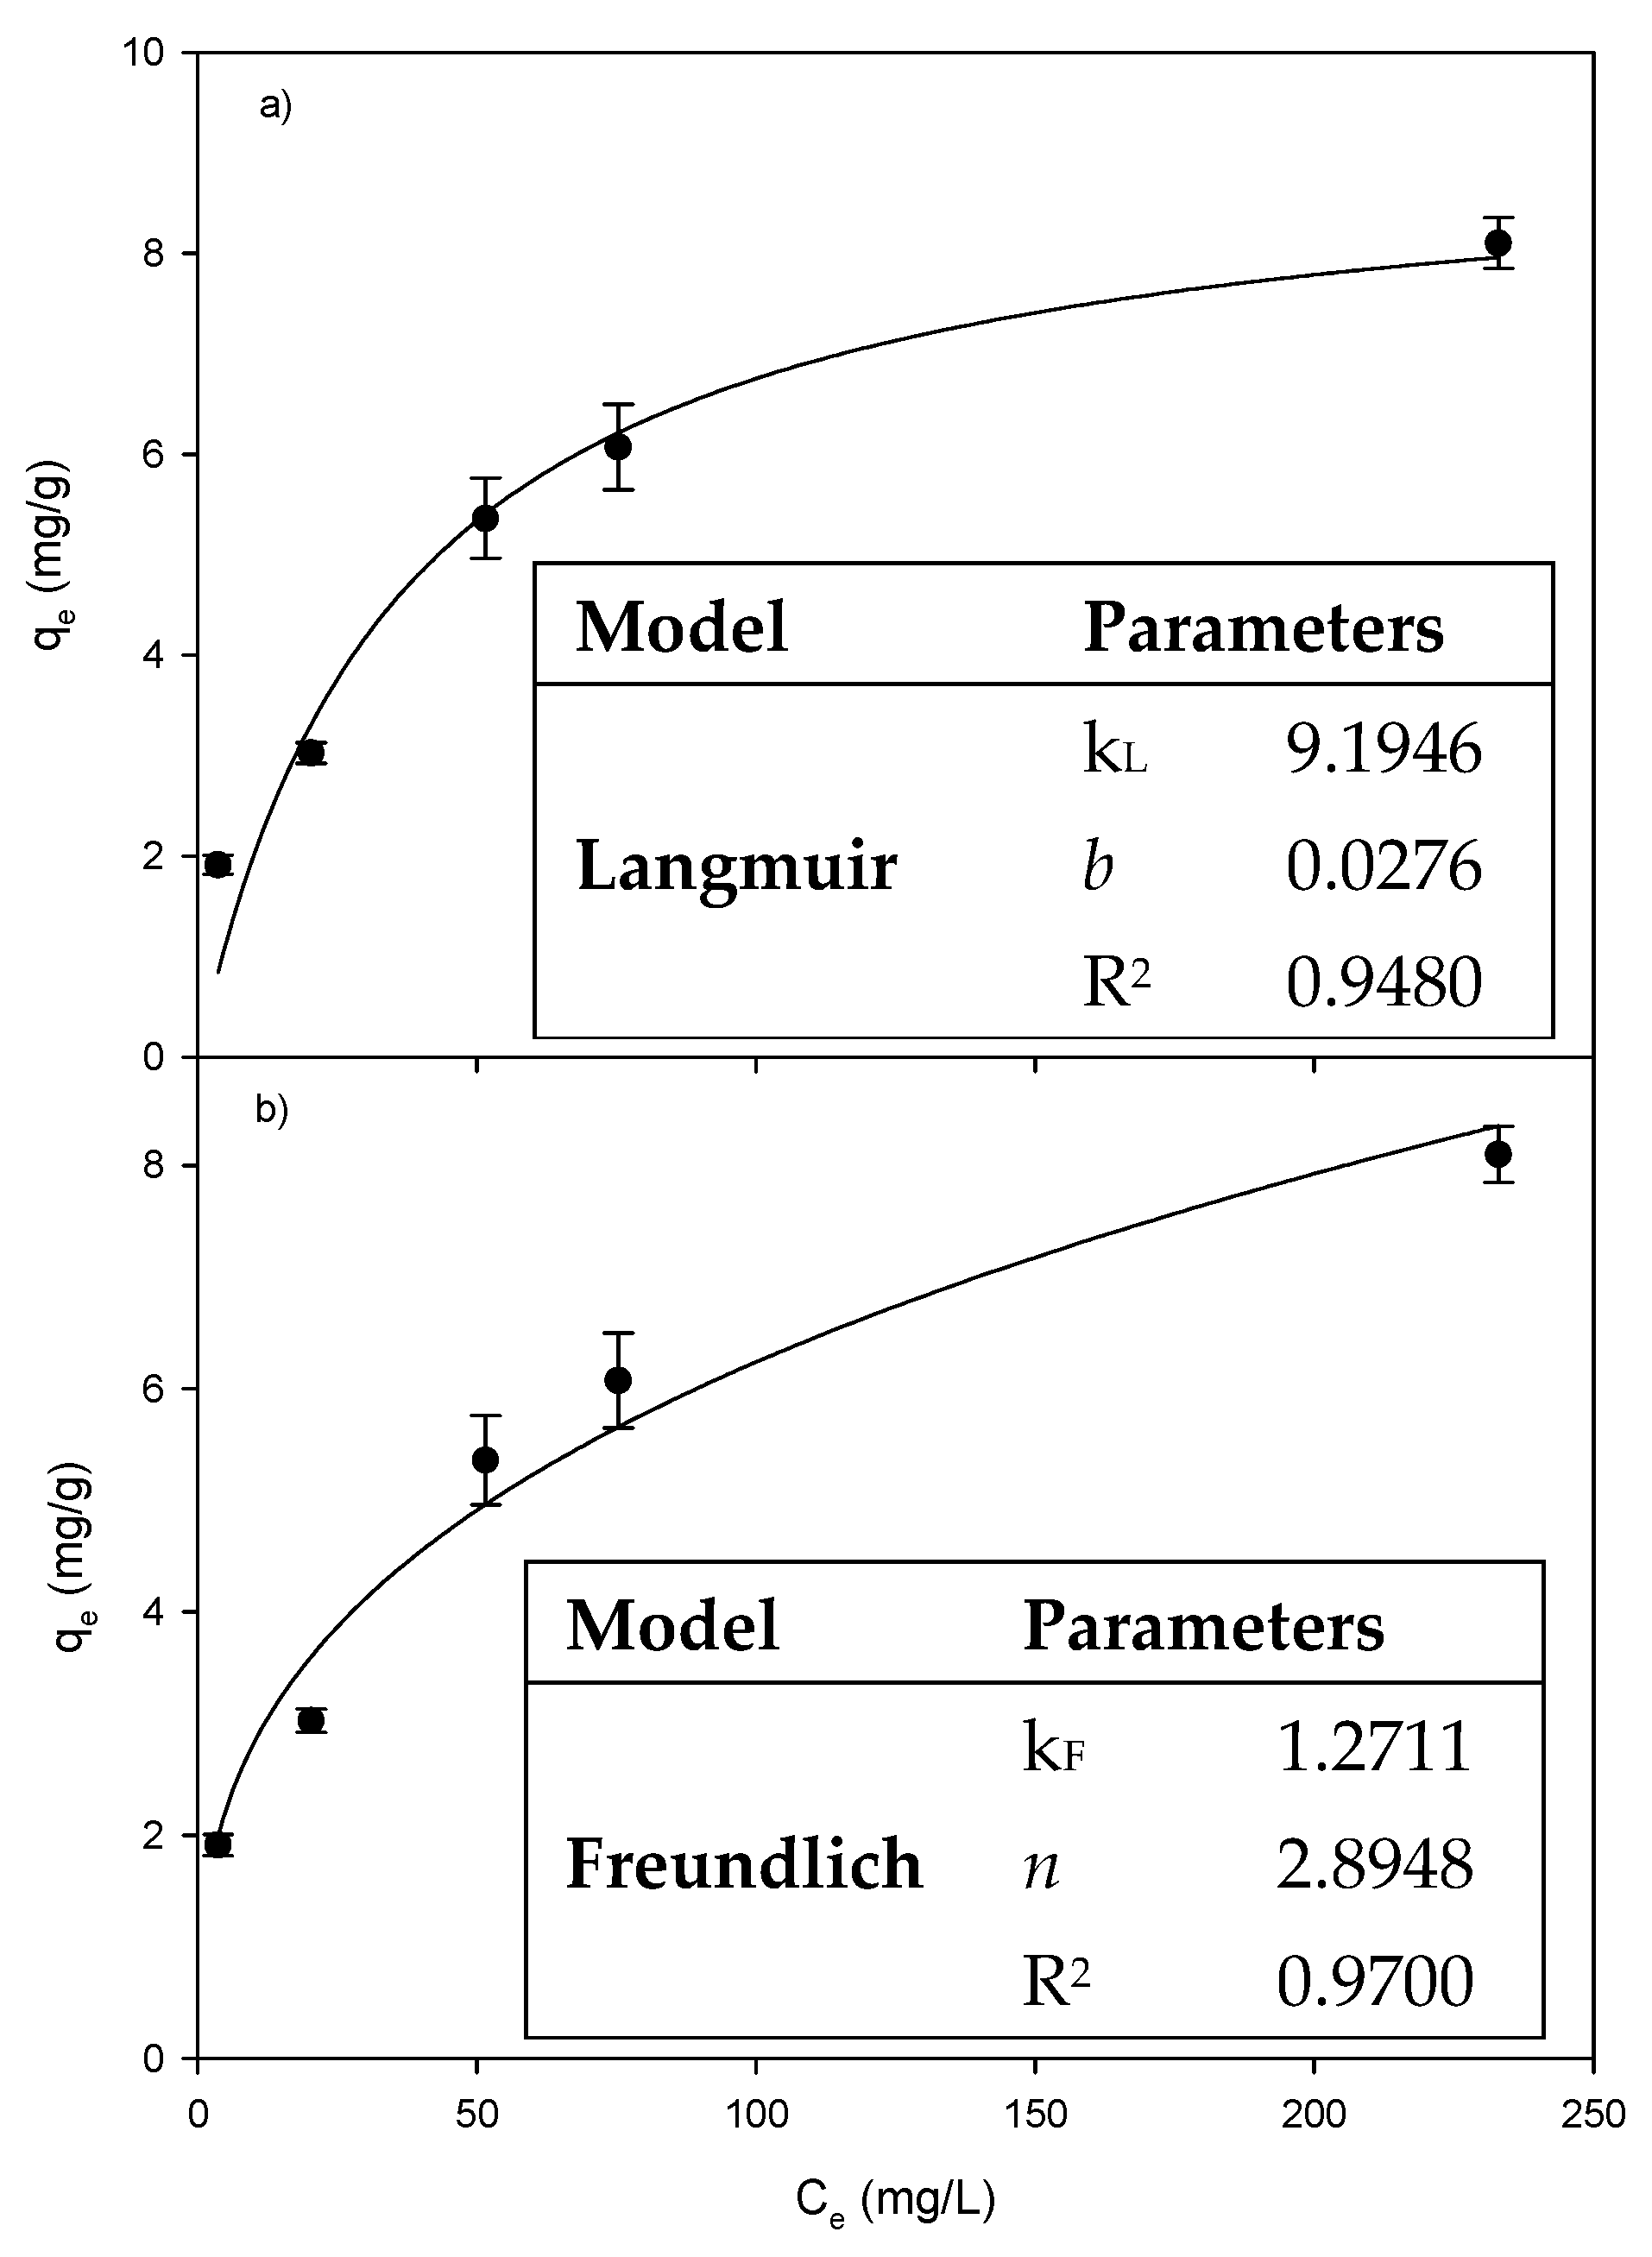
3.5. Adsorption in the Optimized Conditions

Finally, the scale-up of the adsorption system was studied through the simulation by using FAST v2.1 software. This software was developed according to the homogeneous surface diffusion model (HSDM) under the following assumptions: (i) one-dimensional plug-flow, (ii) the adsorbent particles behave as a pseudo-homogeneous medium wherein the pollutant diffuses, (iii) external mass-transfer limitation is accounted for, (iv) adsorption equilibrium prevails at the fluid-solid external surface [36].
The usage of this software requires the input of several parameters: (i) operational conditions (working volume, influent concentration, and flow rate), (ii) adsorbent characteristics (bed density, particle density, and diameter), (iii) mass transfer coefficient and equilibrium parameters (Freundlich or Langmuir constants) obtained in the adsorption isotherm assays.
Initially, the experimental determination of the required parameters was performed. Thus, adsorption equilibrium isotherms at optimal conditions (pH 2.01, PP dosage 1.50 g, and 30.05 °C) were evaluated with concentration ranging from 50–500 mg/L of Cr(VI) for 24 h (Figure 5). The maximum experimental uptake reached (8.8 mg/g) for the Cr adsorption was compared with the maximum uptake those reported in the literature for different adsorbents and shown in Table 4. This value was much the same to that determined by Chen et al. [37] (approximately 10 mg/g) using the by-product of Lentinus edodes and by Elangovan et al. [38] using reed mat as a biosorbent (7.18 mg/g). Notable enhance those reported by Gao et al. [39] (3.15 mg/g) using untreated rice straw. This fact demonstrated the reliability of using this untreated material for the remediation of Cr(VI) that is present in many affluents.
Langmuir and Freundlich, two commonly used models, were applied to the experimental data (Figure 5). The two equations below (Equations (9) and (10)) determine Langmuir and Freundlich models, respectively:
qe = kL × b × Ce/(1 + b × Ce)
qe = kF × Ce1/n
where kL (mg/g) and b (L/ mg) are the Langmuir constants which reflect the adsorption capacity and rate of adsorption, respectively, and the Freundlich constants are kF (mg/g)(L/mg)n, the adsorption capacity, and n is the adsorption intensity.
According to the correlation coefficient (inset Figure 5), the adsorption of Cr on PP showed good correspondence to Freundlich isotherm. The n constant of the Freundlich isotherm also provided information about the intensity of the adsorption. Widely, it is accepted that values of n between 1–10 and lower than 1 correspond to good and poor adsorption features respectively. In this study, the n value was found to be above 1, indicating that Cr has a great affinity onto PP which is in concordance with the high uptake obtained [34].
After compiling all the input parameters required to run the FAST v2.1 model (Table 5), the simulation of the breakthrough curves of a column of the working volume of 100 L (internal diameter 30 cm) was performed for treating a synthetic solution with a Cr(VI) concentration of 40 mg/L.
The breakthrough curves were simulated at various flow rates and the results are presented in Figure 6a. Comparing these curves, it was demonstrated that the time frame in which the contaminant is totally adsorbed is dependent on the operation time under which no contaminant is detected in the outflow. Therefore, the breakthrough curves obtained with the simulation proved the feasibility of the scale up.
Based on these curves, valuable information can be predicted like the exhaustion bed time. In Figure 6b, the exhaustion bed time, in which concentration attained in the outflow was 90% of its initial value, is represented versus the flow rate. As depicted the power function fitted well the obtained data. Thus, this new function can be used for predicting the behavior of the simulated column adsorption.

4. Conclusions

In the present study, two different raw wastes were evaluated as feasible biosorbents for Cr(VI) elimination and Cr adsorption. PP showed the utmost adsorption capacity and RSM based on the Box–Behnken experimental design was employed to optimize the procedure. Numerical optimization applying the desirability function determined that the optimal conditions were: initial solution pH 2.01, biosorbent dosage 1.50 g, and temperature 30.10 °C. Finally, the scale-up of this process was demonstrated by simulation using FAST v2.1 for a flow system operating in a column of 100 L and the exhaustion bed times were determined as a function of the flow rate.

Supplementary Materials

Supplementary Materials are available at https://www.mdpi.com/2076-3417/9/10/1967/s1.

Author Contributions

Conceptualization, M.P. and M.A.S.; methodology, E.R., M.P., and M.A.S.; software, E.R.; validation, E.R., M.P., and M.A.S.; formal analysis, S.E. and E.R.; investigation, S.E. and E.R.; resources, M.P. and M.A.S.; data curation, S.E. and E.R.; writing—original draft preparation, M.P.; writing—review and editing, E.R. and M.A.S.; visualization, S.E., M.P., and M.A.S.; supervision, M.P. and M.A.S.; project administration, M.P. and M.A.S.; funding acquisition, M.A.S.

Funding

This research was funded by Xunta de Galicia and ERDF Funds (ED431C 2017/47).

Conflicts of Interest

The authors declare that there are no competing interests. The funders had no role in the design of the study; in the collection, analyses, or interpretation of data; in the writing of the manuscript, or in the decision to publish the results.

References

  1. Fernández-López, J.A.; Angosto, J.M.; Roca, M.J.; Doval Miñarro, M. Taguchi design-based enhancement of heavy metals bioremoval by agroindustrial waste biomass from artichoke. Sci. Total Environ. 2019, 653, 55–63. [Google Scholar] [CrossRef]
  2. Lee, P.; Sims, E.; Bertham, O.; Symington, H.; Bell, N.; Pfaltzgraff, L.; Sjögren, P.; Wilts, H.; O’Brien, M. Towards a Circular Economy-Waste Management in the EU. Study IP/G/STOA/FWC/2013-001/LOT 3/C3; European Parliamentary Research Service: Brussels, Belgium, 2017. [Google Scholar]
  3. Rovani, S.; Censi, M.T.; Pedrotti, S.L.; Lima, T.C.; Cataluña, R.; Fernandes, A.N. Development of a new adsorbent from agro-industrial waste and its potential use in endocrine disruptor compound removal. J. Hazard. Mater. 2014, 271, 311–320. [Google Scholar] [CrossRef]
  4. Gadd, G.M. Biosorption: Critical review of scientific rationale, environmental importance and significance for pollution treatment. J. Chem. Technol. Biotechnol. 2009, 84, 13–28. [Google Scholar] [CrossRef]
  5. De Gisi, S.; Lofrano, G.; Grassi, M.; Notarnicola, M. Characteristics and adsorption capacities of low-cost sorbents for wastewater treatment: A review. Sustain. Mater. Technol. 2016, 9, 10–40. [Google Scholar] [CrossRef] [Green Version]
  6. Abdolali, A.; Guo, W.S.; Ngo, H.H.; Chen, S.S.; Nguyen, N.C.; Tung, K.L. Typical lignocellulosic wastes and by-products for biosorption process in water and wastewater treatment: A critical review. Bioresour. Technol. 2014, 160, 57–66. [Google Scholar] [CrossRef] [PubMed]
  7. Krishnani, K.K.; Ayyappan, S. Heavy metals remediation of water using plants and lignocellulosic agrowastes. Rev. Environ. Contam. Toxicol. 2006, 188, 59–84. [Google Scholar]
  8. Cobas, M.; Sanromán, M.A.; Pazos, M. Box-Behnken methodology for Cr (VI) and leather dyes removal by an eco-friendly biosorbent: F. vesiculosus. Bioresour. Technol. 2014, 160, 166–174. [Google Scholar] [CrossRef]
  9. Putnik, P.; Bursac Kovacevic, D.; Režek Jambrak, A.; Barba, F.J.; Cravotto, G.; Binello, A.; Lorenzo, J.M.; Shpigelman, A. Innovative “green” and novel strategies for the extraction of bioactive added value compounds from citruswastes-A review. Molecules 2017, 22, 680. [Google Scholar] [CrossRef]
  10. Pérez Marín, A.B.; Aguilar, M.I.; Meseguer, V.F.; Ortuño, J.F.; Sáez, J.; Lloréns, M. Biosorption of chromium (III) by orange (Citrus cinensis) waste: Batch and continuous studies. Chem. Eng. J. 2009, 155, 199–206. [Google Scholar] [CrossRef]
  11. Acar, F.N.; Malkoc, E. The removal of chromium(VI) from aqueous solutions by Fagus orientalis L. Bioresour. Technol. 2004, 94, 13–15. [Google Scholar] [CrossRef]
  12. Miretzky, P.; Cirelli, A.F. Cr(VI) and Cr(III) removal from aqueous solution by raw and modified lignocellulosic materials: A review. J. Hazard. Mater. 2010, 180, 1–19. [Google Scholar] [CrossRef]
  13. Gogoi, S.; Chakraborty, S.; Saikia, M.D. Surface modified pineapple crown leaf for adsorption of Cr(VI) and Cr(III) ions from aqueous solution. J. Environ. Chem. Eng. 2018, 6, 2492–2501. [Google Scholar] [CrossRef]
  14. Simsek, E.B.; Özdemir, E.; Beker, U. Process optimization for arsenic adsorption onto natural zeolite incorporating metal oxides by response surface methodology. Water Air Soil Pollut. 2013, 224, 1614. [Google Scholar] [CrossRef]
  15. Eaton, A.D.; Clesceri, L.S.; Greenberg, A.E. Standard Methods for the Examination of Water and Wastewater; American Public Health Association, American Water Works Association (AWWA), Water Environment Federation (WEF): Washington, DC, USA, 1992. [Google Scholar]
  16. Krupka, K.M.; Kaplan, D.I.; Whelan, G.; Serne, R.J.; Mattigod, S.V. Understanding variation in partition coefficient, Kd, values. In Volume II: Review of Geochemistry and Available Kd Values, for Cadmium, Cesium, Chromium, Lead, Plutonium, Radon, Strontium, Thorium, Tritium (3H), and Uranium; EPA: Washington, DC, USA, 1999. [Google Scholar]
  17. Barkat, M.; Nibou, D.; Chegrouche, S.; Mellah, A. Kinetics and thermodynamics studies of chromium(VI) ions adsorption onto activated carbon from aqueous solutions. Chem. Eng. Process.: Process Intensif. 2009, 48, 38–47. [Google Scholar] [CrossRef]
  18. Pardo, M.; Casellis, E.; Escobedo, R.; García, E. Chemical Characterisation of the Industrial Residues of the Pineapple (Ananas comosus). J. Agric. Chem. Environ. 2014, 3, 53–56. [Google Scholar] [CrossRef]
  19. Park, D.; Ahn, C.K.; Kim, Y.M.; Yun, Y.S.; Park, J.M. Enhanced abiotic reduction of Cr(VI) in a soil slurry system by natural biomaterial addition. J. Hazard. Mater. 2008, 160, 422–427. [Google Scholar] [CrossRef]
  20. Park, D.; Lim, S.; Yun, Y.S.; Park, J.M. Development of a new Cr(VI)-biosorbent from agricultural biowaste. Bioresour. Technol. 2008, 99, 8810–8818. [Google Scholar] [CrossRef]
  21. Hossain, M.A.; Ngo, H.H.; Guo, W.S.; Nguyen, T.V.; Vigneswaran, S. Performance of cabbage and cauliflower wastes for heavy metals removal. Desalin. Water Treat. 2014, 52, 844–860. [Google Scholar] [CrossRef]
  22. Xu, F.; Yu, J.; Tesso, T.; Dowell, F.; Wang, D. Qualitative and quantitative analysis of lignocellulosic biomass using infrared techniques: A mini-review. Appl. Energy 2013, 104, 801–809. [Google Scholar] [CrossRef] [Green Version]
  23. Montgomery, D.C. Design and Analysis of Experiments, 5th ed.; John Wiley and Sons: New York, NY, USA, 2001. [Google Scholar]
  24. Li, R.; Zhang, Z.; Meng, Z.; Li, H. Biosorption of Cr (VI) by corn stalk biomass: Thermodynamics and mechanism. Huanjing Kexue Xuebao 2009, 29, 1434–1441. [Google Scholar]
  25. Prabhakaran, S.K.; Vijayaraghavan, K.; Balasubramanian, R. Removal of Cr(VI) ions by spent tea and coffee dusts: Reduction to Cr(III) and biosorption. Ind. Eng. Chem. Res. 2009, 48, 2113–2117. [Google Scholar] [CrossRef]
  26. Daneshvar, N.; Salari, D.; Aber, S. Chromium adsorption and Cr(VI) reduction to trivalent chromium in aqueous solutions by soya cake. J. Hazard. Mater. 2002, 94, 49–61. [Google Scholar] [CrossRef]
  27. Rawajfih, Z.; Nsour, N. Thermodynamic analysis of sorption isotherms of chromium(VI) anionic species on reed biomass. J. Chem. Thermodyn. 2008, 40, 846–851. [Google Scholar] [CrossRef]
  28. Segurola, J.; Allen, N.S.; Edge, M.; Mc Mahon, A. Design of eutectic photoinitiator blends for UV/visible curable acrylated printing inks and coatings. Prog. Org. Coat. 1999, 37, 23–37. [Google Scholar] [CrossRef]
  29. Rossi, R.J. Applied Biostatistic for the Health Sciencies; Wiley: Hoboken, NJ, USA, 2010. [Google Scholar]
  30. Khuri, A.I.; Cornell, J.A. Response Surfaces; Dekker Inc.: New York, NY, USA, 1996. [Google Scholar]
  31. Prabhul, A.A.; Dhaneshwar, A.D.; Mrudula, C.M.; Kannan, N. Evaluation of process parameters for biosorption of chromium (VI) using full factorial design and response surface methodology. ESAIJ 2014, 9, 263–273. [Google Scholar]
  32. Anupam, K.; Dutta, S.; Bhattacharjee, C.; Datta, S. Adsorptive removal of chromium (VI) from aqueous solution over powdered activated carbon: Optimisation through response surface methodology. Chem. Eng. J. 2011, 173, 135–143. [Google Scholar] [CrossRef]
  33. Aksezer, C.S. On the sensitivity of desirability functions for multiresponse optimization. J. Ind. Manag. Optim. 2008, 4, 685–696. [Google Scholar] [CrossRef] [Green Version]
  34. Rosales, E.; Meijide, J.; Tavares, T.; Pazos, M.; Sanromán, M.A. Grapefruit peelings as a promising biosorbent for the removal of leather dyes and hexavalent chromium. Process Saf. Environ. Prot. 2016, 101, 61–71. [Google Scholar] [CrossRef]
  35. Gutha, Y.; Munagapati, V.S.; Naushad, M.; Abburi, K. Removal of Ni(II) from aqueous solution by Lycopersicum esculentum (Tomato) leaf powder as a low-cost biosorbent. Desalin. Water Treat. 2015, 54, 200–208. [Google Scholar] [CrossRef]
  36. Richard, D.; Delgado Núñez, M.d.L.; Schweich, D. Adsorption of complex phenolic compounds on active charcoal: Breakthrough curves. Chem. Eng. J. 2010, 158, 213–219. [Google Scholar] [CrossRef]
  37. Chen, G.Q.; Zeng, G.M.; Tu, X.; Niu, C.G.; Huang, G.H.; Jiang, W. Application of a by-product of Lentinus edodes to the bioremediation of chromate contaminated water. J. Hazard. Mater. 2006, 135, 249–255. [Google Scholar] [CrossRef]
  38. Elangovan, R.; Philip, L.; Chandraraj, K. Biosorption of chromium species by aquatic weeds: Kinetics and mechanism studies. J. Hazard. Mater. 2008, 152, 100–112. [Google Scholar] [CrossRef] [PubMed]
  39. Gao, H.; Liu, Y.; Zeng, G.; Xu, W.; Li, T.; Xia, W. Characterization of Cr(VI) removal from aqueous solutions by a surplus agricultural waste-Rice straw. J. Hazard. Mater. 2008, 150, 446–452. [Google Scholar] [CrossRef]
  40. Dupont, L.; Guillon, E. Removal of hexavalent chromium with a lignocellulosic substrate extracted from wheat bran. Environ. Sci. Technol. 2003, 37, 4235–4241. [Google Scholar] [CrossRef] [PubMed]
Figure 1. Screening of wastes pineapple core (PP) and lime peel (LM) for the removal of Cr(VI) and total Cr. Operational conditions: 0.5 g of biosorbent, 50 mL of a solution 50 mg/L Cr(VI) at 25 °C and 150 rpm during 24 h.
Applsci 09 01967 g001
Figure 2. Characterization of PP waste: EDS energy spectrum and SEM image (inset photos) (a) initially and (b) after Cr adsorption and (c) pineapple core FTIR spectra initially (1) and after the adsorption (2).
Applsci 09 01967 g002
Figure 3. Pareto analysis of (a) Cr(VI) removal and (b) total Cr removal.
Applsci 09 01967 g003
Figure 4. Response surface methodology (RSM) plot: (a) Cr(VI) removal to assess the pH and PP dosage with the temperature held constant at central level; (b) Cr adsorption to estimate the temperature and PP dosage with the pH held unchanging at the central level.
Applsci 09 01967 g004
Figure 5. Isotherms models: (a) Langmuir; and (b) Freundlich. Operational conditions: Cr(VI) concentration 50–500 mg/L, PP dosage 1.50, pH 2 and temperature 30.05 °C during 24 h.
Applsci 09 01967 g005
Figure 6. Breakthrough curves obtained from the FAST v2.1 simulation: (a) at different flow rates; (b) exhaustion bed time versus flow rate.
Applsci 09 01967 g006
Table 1. Box–Behnken experimental design matrix and responses in terms of real factors and calculated uptake and KD.
RunpH, x1PP Dosage (g), x2Temperature (°C), x3Cr(VI) Removal (%)Total Cr Removal (%)Uptake (mg/g)KD (mL/g)
13.51.52069.8120.041.008.35
23.51.53577.9635.791.7918.58
33.5127.566.4724.031.8015.82
421.527.589.8535.021.7517.96
53.50.53559.4612.891.9314.80
6212079.3425.541.9217.15
73.5127.564.8826.82.0118.31
85 13568.5227.882.0919.33
93.50.52058.4814.582.1917.07
1020.527.575.2916.032.4019.09
1150.527.560.5512.321.8514.05
12213588.4428.032.1019.47
133.5127.562.3424.951.8716.62
143.5127.566.4226.642.0018.16
1551.527.570.9924.031.2010.54
16512065.2916.341.239.77
173.5127.565.8924.951.7116.62
Table 2. FTIR analysis of functional groups.
Wavelength (cm−1)Bond VibrationRelated Structure
3311O-H stretchinglignin [22]
2900–3000 C-H stretchinglignin [22]
1720–1730 C=O stretchingcarbonyl group
1624O-H bendingPolysaccharides
1600N-H bending amine amide
1420C-H in-plane deformationlignin [22]
1370C-H bendingcellulose, hemicellulose, lignin [22]
1247O-H bendingcellulose, hemicellulose [22]
1030C-O, C=C, and C-C-O stretchingcellulose, hemicellulose, lignin [22]
960 and 730Glycosidic linkagecellulose, hemicellulose [22]
Table 3. ANOVA evaluation for both Cr(VI) and total Cr removal response surface quadratic models.
Cr(VI) Removal (%)Total Cr Removal (%)
SourceSum of SquaresDegrees of FreedomMean SquareF-Valuesp-ValuesSum of SquaresDegrees of FreedomMean SquareF-Valuesp-Values
Model1382.129153.5666.88<0.0001 significant778.51986.5060.46<0.0001 significant
x1570.711570.71248.56< 0.000172.30172.3050.540.0002
x2375.791375.79163.67< 0.0001436.011436.01304.77< 0.0001
x357.57157.5725.070.001698.63198.6368.94< 0.0001
x1x24.2414.241.850.216213.25113.259.260.0188
x1x38.6118.613.750.094020.48120.4614.310.0069
x2x312.85112.855.600.049976.04176.0453.150.0002
x12338.781338.78147.55< 0.00012.37·10−612.37·10−61.66·10−60.9990
x220.0001001.000055.28155.2838.640.0004
x326.3416.342.760.14044.4314.433.100.1219
Std. Dev1.52R20.9885 Std. Dev1.20R20.9873
Mean70.00Adj R20.9737 Mean23.29Adj R20.9710
CV %2.16Pred R20.9385 CV %5.14Pred R20.9021
Adeq-Precision27.377 Adeq-Precision25.601
Table 4. Adsorption test conditions and uptake capacities of various adsorbents for Cr(VI) removal.
AdsorbentOptimum Adsorption ConditionsMaximum Cr(VI) Removal (%)Maximum Cr Uptake (mg/g)Estimated KD (mL/g)Reference
pHDosage (g/L)Temp. (ºC)
Chitosan31324.85-7.9482.04[5]
Pineapple core23030.0592.398.899.29This work
Lentinus edodes3.9–4.42025-10-[37]
Reed mat4.5–5.5103052.837.1825.18[38]
Mangrove leaves4.5–5.5103099.358.87189.02[38]
Water lily4.5–5.5103096.498.44126.44[38]
Untreated rice straw2.0102769.253.1545.49[39]
Lignocellulosic substrate from wheat bran3.1825-9.9-[40]
Activated carbon3.72104565.75.09191.55[17]
Table 5. Parameters required for the simulation using FAST V2.1 model.
ParametersUnitValue
Biosorbentkg62500
Bed densityg/cm30.45 1
Particle densityg/cm31.25 1
Particle diametermm0.2
Flow rateL/min0.1–1
Influent concentrationmg/L40
Freundlich constant (KF)(mg/g)(L/mg)n1.2711
Freundlich exponent (n) 2.8948
Surface diffusion coefficient (Ds)m2/s8.20·10−13
Film diffusion coefficient (kL)m2/s 0.82-8.41·10−8
1 determined experimentally.

