Abstract
In the current study, we investigated the kinetics and thermodynamics of phosphorus removal by zeolite/steel slag/fly ash/basalt (ZSFB) composite fiber. Kinetic analysis indicated that the adsorption of phosphorus is best fitted with the pseudo-second-order model. The maximum adsorption capacity of the fiber calculated by the Langmuir model was found to be 4.18 mg/g and the partition coefficient was 1.49 mg/g/µM. Thermodynamics results revealed that the Gibbs free energy ΔG0 of the composite fiber was negative, indicating that the adsorption is a spontaneous process; the standard enthalpy of reaction ΔH0 was positive, indicating that the adsorption is endothermic. Adsorption under different influencing factors and desorption experiments were conducted to investigate the phosphorus removal characteristics of ZSFB composite fiber. Dynamic adsorption and the phosphorus removal experiment were also conducted in a fixed-bed reactor to study factors affecting the time of breakthrough. Results indicate that the performance of ZSFB composite fiber was not relatively outstanding compared with nanomaterials and magnetic composites. However, its performance has already met the class A demands of “discharge standard of pollutants for municipal wastewater treatment plant” (GB18918-2002) which means it can be applied to remove phosphorus from real wastewater in a cost-effective way with low-priced raw materials.
1. Introduction
With growing population levels, urbanization and the development of industry and agriculture, a large amount of wastewater is discharged into natural water, resulting in deteriorating water quality and frequent eutrophication [1]. Phosphorus is the minimum limiting factor for eutrophication, and phosphorus removal is the key to preventing eutrophication [2]. Therefore, the development of a cost-effective and widely applicable phosphorus removal material is an important research direction for reducing phosphorus emissions and controlling eutrophication.
The removal methods of phosphorus from wastewater mainly include biological methods, chemical methods and adsorption methods. The biological phosphorus removal process is complicated and the effluent stability is poor [3]. Although the chemical treatment method has a good treatment effect, the phosphorus removal materials are mostly industrial products, such as lime, aluminum salt, iron salt, ferrous salt and magnesium salt. The high cost of phosphorus removal materials, large amount of sludge and risk of secondary pollution is a major barrier to utilize the chemical method in practical applications [4]. However, the adsorption method is suitable for treating solute contaminants in low-contaminant solution, and has the advantages of high efficiency and low consumption, and at the same time, the purpose of fully utilizing the adsorbent and recovering phosphorus resources can be achieved by desorption [5]. High-efficiency phosphorus removal materials with strong adsorption capacity, good chemical stability and low water flow resistance need to be investigated to separate phosphorus from wastewater.
The traditional adsorbents are mostly granular or powdered (such as granular activated carbon (GAC), powdered activated carbon (PAC), iron oxide and alumina) and it is difficult to separate the solids from the liquid [6]. Researchers have made many improvements, for example, Qin et al. created a ceramic granular adsorbent with fly ash as the main raw material [7]. Hu et al. prepared a Fe3O4-BC (biochar-supported nano-ferric oxide) composite by chemical coprecipitation method using biochar as a carrier, and applied it to the adsorption and removal of phosphate from wastewater [8]. Niu et al. prepared a functional fiber from chitosan and cotton fiber and used it to remove Cu2+ and Pb2+ from aqueous solution. The maximum adsorption capacity of Cu2+ and Pb2+ was 95.24 mg/g and 144.93 mg/g, respectively [9]. However, these adsorbent preparation processes are complicated and difficult to apply in large-scale wastewater treatment projects. This paper has developed a new fibrous composite adsorbent with traditional adsorbents as the substrates.
This study investigated zeolite and two kinds of industrial waste residue (steel slag and fly ash), and prepared zeolite/steel slag/fly ash/basalt (ZSFB) composite fiber. Static adsorption experiments were carried out to investigate the isothermal adsorption characteristics, adsorption kinetics, influencing factors and desorption of ZSFB composite fiber. To simulate the actual flow, a continuous flow fixed-bed dynamic adsorption experiment was conducted to investigate the characteristics of dynamic adsorption and phosphorus removal. The time of breakthrough was set as the reference index to investigate the influence of influent flow rate, filler mass and influent concentration on phosphorus removal. The results can provide guidance for the further development and engineering application of this material.
2. Materials and Methods
The ZSFB composite fiber was prepared by wet spinning using 400 mesh modified zeolite, steel slag, fly ash as adsorption substrates, cellulose acetate as a forming substrate, basalt fiber as a reinforcement substrate and acetone solution as the solvent. The optimum mass ratio of ZSFB composite fiber was 100:5:15:10:0.8 (cellulose acetate:zeolite:steel slag:fly ash:basalt fiber). With an average diameter of 0.5~0.6 mm, specific surface area of 26.194 m2/g, total pore volume of 0.145 cm3/g and average aperture of 43.014 nm, the ZSFB composite fiber had good water stability.
2.1. Static Adsorption and Phosphorus Removal Experiment of ZSFB Composite Fiber
2.1.1. Adsorption Isotherm Model
Langmuir Adsorption Isotherm Model
The model assumes that the adsorption is a monolayer adsorption and the adsorption sites on the surface have the same force on the adsorbate. If a site is occupied by the adsorbate, the site no longer adsorbs other adsorbates. In the process of adsorption, as the adsorption sites are occupied, it is more and more difficult for the adsorbates to find available adsorption sites, so the adsorption rate slows down until the adsorption equilibrium is reached [10], as shown in Equation (1):
Qe = QmKLCe/(1 + KLCe).
Converted to a linear form:
Ce/Qe = Ce/Qm + 1/QmKL.
In the equations above, Qe indicates the adsorbed amount (mg/g) of the adsorbate per unit mass of adsorbent until adsorption equilibrium, Qm represents the maximum adsorbed amount in the saturated state (mg/g), Ce indicates the concentration of the adsorbate in the solution at adsorption equilibrium (mg/L) and KL is the Langmuir constant (L/mg), which represents the affinity of the adsorbent for the adsorbate. Ce/Qe is plotted against Ce and linearly fitted, Qm can be obtained from the slope of the line and KL can be obtained from the intercept.
Freundlich Adsorption Isotherm Model
The Freundlich model is an empirical model that assumes that the adsorption process is a monolayer adsorption that occurs on an uneven surface and is suitable for lower concentration. The disadvantage is that the maximum adsorption capacity cannot be estimated [11]. The equation is as follows:
Qe = KFCe1/n.
Converted to a linear form:
Among these equations, KF and n are Freundlich constants. The value of KF can reflect the adsorption affinity and the maximum adsorption capacity of the adsorbent to some extent. The larger the KF, the larger the maximum adsorption capacity. The value of n can reflect the difficulty of adsorption, and the larger the value of n, the easier the adsorption occurs. It is generally considered that the value of n of the effective adsorbent is between 2 and 10 [12]. logQe is plotted against logCe and linearly fitted, n can be obtained from the slope, and KF can be obtained from the intercept [13].
2.1.2. Adsorption Thermodynamics
According to adsorption thermodynamics, the adsorption mechanism can be further investigated. The most commonly used adsorption thermodynamic model is the van ’t Hoff model, and the Gibbs free energy (ΔG0, the part of the internal energy that can be converted into external work), the standard enthalpy of reaction (ΔH0, the enthalpy change in a system by a given chemical reaction when all reactants and products are in their standard states) and the entropy of the system (ΔS0, a measure of the unavailable energy in a closed thermodynamic system [14]) can be calculated using the van ’t Hoff equation. The equations are as follows:
lnKD = −ΔH0/RT + ΔS0/R,
ΔG0 = ΔH0 − TΔS0,
ΔG0 = −RTlnKD.
Among them, KD is the equilibrium constant, R is the gas constant (8.314 J/mol·K) and T is the absolute temperature (K). According to the calculation, if the value of ΔG0 is a negative, the adsorption reaction can conduct spontaneously, and the larger the absolute value of ΔG0, the higher the degree of spontaneous reaction.
2.1.3. Experiment on Isothermal Adsorption
Seven groups of 1 g of ZSFB composite fiber were prepared and placed in 250 mL conical flasks, and 100 mL potassium dihydrogen phosphate (KH2PO4) solution was added with a concentration of 5, 10, 30, 60, 100, 150 or 200 mg/L (calculated by phosphorus concentration) for each group, respectively. The conical flasks were placed in a water bath thermostatic oscillator for 48 h adsorption at 25 °C with a speed of 150 r/min. Then, the adsorption solution was extracted with a syringe, and the concentration of phosphorus in the adsorption solution was measured by the ammonium molybdate spectrophotometric method. The phosphorus adsorption capacity of the composite fiber was calculated, and the adsorption isotherm was drawn based on the results. The experiments were also conducted at 15 and 35 °C with the same method.
2.1.4. Experiment on Adsorption Kinetics
Eight groups of 1 g of ZSFB composite fiber were prepared and placed in 250 mL conical flasks, and 100 mL KH2PO4 solution was added with a concentration of 5 mg/L. The conical flasks were placed in a water bath thermostatic oscillator for adsorption at 25 °C with a speed of 150 r/min. The adsorption time for each group was 2, 4, 8, 12, 18, 24, 30, and 48 h, respectively. Then, the adsorption solution was extracted with a syringe, and the concentration of phosphorus was measured by the ammonium molybdate spectrophotometric method. The phosphorus adsorption capacity of the composite fiber was calculated, and the adsorption kinetic curve was drawn based on the results. The experiments were also conducted with the same method at 15 and 35 °C, and conducted with a different initial phosphorus concentration (10, 15 and 20 mg/L) at each temperature.
2.1.5. Influencing Factors
Experimental influencing factors, such as the dosage of the composite fiber, pH value, type of anion in solution and ammonium concentration were considered.
- Dosage: 0.5, 1.0, 1.5, 2.0, 2.5, 3.0, 3.5, 4.0, 4.5 and 5.0 g of ZSFB composite fibers were placed respectively in a 250 mL conical flask, and 100 mL KH2PO4 solution was added with a concentration of 10 mg/L.
- pH level: three groups of KH2PO4 solution with a concentration of 10 mg/L were prepared, and the pH level of the solution of each group was adjusted to 4, 7, and 10 by adding HCl and NaOH solution. Then, 100 mL of three different pH level KH2PO4 solutions were placed into 250 mL conical flasks, and 1 g of the composite fiber was added to each group.
- Anion: 24 groups of KH2PO4 solution with a concentration of 10 mg/L were prepared. By adding Na2SO4, NaCl, NaNO3 and Na2CO3 solutions, the concentrations of anions (SO42−, Cl−, NO3− and CO32−) in solution were adjusted to 0, 2, 4, 6, 8 and 10 mmol/L, respectively. Then, 100 mL six-different-anion-concentration KH2PO4 solutions were taken and placed in 250 mL conical flasks. For each group, 1 g of the composite fiber was added and put into a water bath thermostatic oscillator.
- Ammonium concentration: seven groups of KH2PO4 solution with a concentration of 10 mg/L were prepared, and NH4Cl solution was added to each group to adjust the concentration of NH4+ to 0, 100, 200, 300, 400, 500 and 600 mg/L. Then, 100 mL KH2PO4 solution of each group was placed into a 250 mL conical flask, and 1 g of the composite fiber was added to each group.
The conical flasks were placed in a water bath thermostatic oscillator for 48 h adsorption at 25 °C with a speed of 150 r/min. After adsorption, the solution was extracted with a syringe, and the concentration of phosphorus was measured by the ammonium molybdate spectrophotometric method [15]. The adsorption capacity and the removal rate were then calculated.
2.1.6. Desorption
- Desorption in clear water: seven groups of 1 g of ZSFB composite fiber were placed into 250 mL conical flasks, and 100 mL of KH2PO4 solution was added with concentrations of 5, 10, 30, 60, 100, 150 and 200 mg/L. The conical flasks were placed in a water bath thermostatic oscillator for 48 h adsorption at 25 °C with a speed of 150 r/min. After adsorption, the solution was extracted with a syringe, and the concentration of phosphorus was measured by the ammonium molybdate spectrophotometric method. The adsorption capacity and the removal rate of phosphorus were calculated. Then, the composite fiber was rinsed with distilled water three times, then air-dried and placed in a 250 mL conical flask. 100 mL distilled water was added thereto, and the conical flasks were placed in a water bath thermostatic oscillator at 25 °C and at 150 r/min for 48 h desorption.
- Desorption in hot water: the steps are the same as that in clear water, but in the last step, the conical flasks were placed in a water bath thermostatic oscillator at 80 °C and at 150 r/min for 48 h desorption.
- Desorption in sulfuric acid solution: five groups of 1 g of the composite fiber were placed into 250 mL conical flasks, and 100 mL KH2PO4 solution was added with a concentration of 10 mg/L. The conical flasks were placed in a water bath thermostatic oscillator for 48 h adsorption at 25 °C with a speed of 150 r/min. After adsorption, the solution was extracted with a syringe, and the concentration of phosphorus was measured by the ammonium molybdate spectrophotometric method. The adsorption capacity and the removal rate of phosphorus were calculated. Then, the composite fiber was rinsed with distilled water three times, then air-dried and placed in a 250 mL conical flask. After that, 100 mL H2SO4 solution with concentrations of 0.01, 0.05, 0.1, 0.5 and 1.0 mol/L were prepared and put into the conical flasks, and the conical flasks were placed in a water bath thermostatic oscillator at 25 °C and at 150 r/min for 48 h desorption.
After desorption, the solutions were collected using syringes, and the concentrations of phosphorus were measured by the ammonium molybdate spectrophotometric method to calculate the desorpbed amount and the desorption rate.
2.2. Dynamic Adsorption and Phosphorus Removal Experiment of ZSFB Composite Fiber
The dynamic phosphorus removal characteristics of the adsorbent were analyzed by fixed-bed adsorption. When the wastewater continuously flowed through the adsorption layer of the fixed bed, the pollutants in the wastewater were adsorbed and removed by the adsorbent, and the concentration of effluent pollutant was almost zero. However, as the adsorption progressed, the adsorbent in the upper part of the bed tended to be saturated, and the active area moved downward. When moving to the bottom of the bed, the concentration of effluent pollutants exceeded the threshold, at which breakthrough occurred [16]. When the concentration of effluent pollutants reaches 2~5% of the influent pollutant concentration, it can be considered that the adsorbent bed is saturated [17]. In the actual wastewater treatment, if the breakthrough occurs, the concentration of effluent pollutants will soon exceed the standard [18]. Therefore, the absorbents need to be reactivated, regenerated or replaced.
2.2.1. The Fixed-Bed Dynamic Adsorption Experimental Apparatus
The adsorption column used in the fixed-bed reactor was an acrylic plexiglass tube with a diameter of 20 mm. The peristaltic pump was used to extract the phosphorus-containing wastewater (simulated by KH2PO4 solution) through the adsorption column from the bottom to the top at a certain flow rate. Samples were taken every 0.5 h to measure phosphorus concentrations until the adsorption column was saturated. In this experiment, we set the standard for adsorption column breakthrough when the effluent phosphorus concentration reached 5% of the influent phosphorus concentration [19]. The schematic diagram of the dynamic adsorption experimental apparatus is shown in Figure 1.
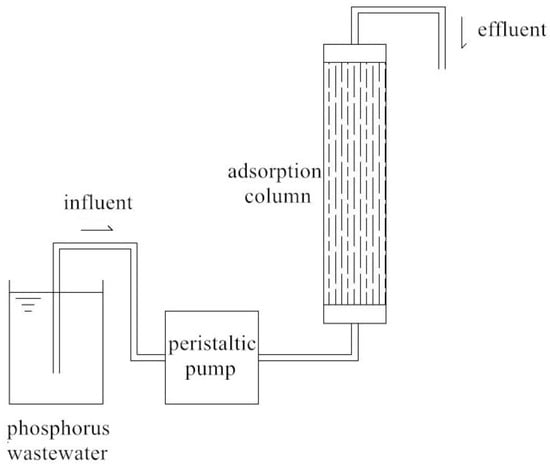
Figure 1.
Schematic diagram of the dynamic adsorption experimental apparatus.
2.2.2. Experiment on Factors Affecting Bed Breakthrough
- The effect of influent flow rate: 30 g of the composite fiber was packed in the adsorption column. KH2PO4 solution of 10 mg/L was used to simulate phosphorus-containing wastewater. The influent flow rates were 1.0, 1.5 and 2.0 mL/min. Samples were taken every 0.5 h until breakthrough, and the concentration of phosphorus in the adsorbent was measured by the ammonium molybdate spectrophotometric method.
- The effect of filler mass: 20, 30 and 40 g of the composite fibers were packed in the adsorption column. KH2PO4 solution of 10 mg/L was used to simulate phosphorus-containing wastewater. The influent flow rates were 1.5 mL/min. Samples were taken every 0.5 h until breakthrough, and the concentration of phosphorus in the adsorbent was measured by the ammonium molybdate spectrophotometric method.
- The effect of influent concentration: 30 g of the composite fiber was packed in the adsorption column. KH2PO4 solutions of 5, 10 and 20 mg/L were used to simulate phosphorus-containing wastewater. The influent flow rates were 1.5 mL/min. Samples were taken every 0.5 h until breakthrough, and the concentration of phosphorus in the adsorbent was measured by the ammonium molybdate spectrophotometric method.
3. Results and Discussion
3.1. Experiment on Static Adsorption and Phosphorus Removal
3.1.1. Adsorption Thermodynamics
Adsorption Isotherm
Figure 2 shows the adsorption isotherms of the composite fiber at different temperatures—the equilibrium adsorption capacity Qe of the composite fiber increased with increasing temperature (from 15 to 35 °C) as equilibrium concentration Ce increased. When Ce was low, Qe increased rapidly with the increase of Ce. As Ce continued to increase, the increase of Qe gradually declined, and nearly stopped, which can be explained by the saturation of the composite fiber. The data were fitted by the Langmuir isotherm equation and the Freundlich equation [20]. The calculated parameters are listed in Table 1.
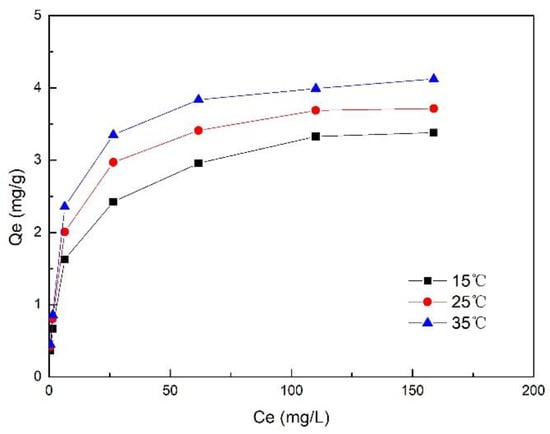
Figure 2.
Adsorption isotherm of ZSFB composite fiber.

Table 1.
Langmuir and Freundlich parameters of zeolite/steel slag/fly ash/basalt (ZSFB) composite fiber.
The fitting results indicate that the adsorption of phosphorus by ZSFB composite fiber is better fitted with the Langmuir adsorption isotherm model (Table 1). The value of R2 of >0.99 indicates that the adsorption of phosphorus by the composite fiber was mainly monolayer adsorption [21]. At 15, 25 and 35 °C, the maximum adsorption capacity Qm was 3.745, 3.905 and 4.177 mg/g, respectively. It can be seen that Qm increased with the increase of temperature, indicating that in a proper temperature range, higher temperature is conducive to the adsorption. The Freundlich adsorption isotherm model can also fit the isothermal adsorption process on phosphorus, but the accuracy of fitting deteriorates with increasing temperature. The constants KL and KF increased with the increase of temperature, indicating that the temperature rise is beneficial to enhance the adsorption capacity for phosphorus. The constant n was greater than 2, and increased with the increase of temperature, indicating that the adsorption of phosphorus is easy and the temperature rise has a promotive effect on adsorption.
Thermodynamic Parameters
The equilibrium constant KD can be replaced by the Langmuir coefficient KL for adsorption occurring in low concentration solutions, but the unit of KL must be L/mol [22]. The unit used in this test is L/mg, so the unit conversion is required. Combining the molar mass of phosphorus (31 g/mol), KD can be calculated, which is 31000 KL. By substituting KD into the equation, ΔG0 can be obtained; then, by linearly fitting lnKD with 1/T (Figure 3), ΔH0 can be obtained from the slope and ΔS0 can be obtained from the intercept. The thermodynamic parameters are shown in Table 2.
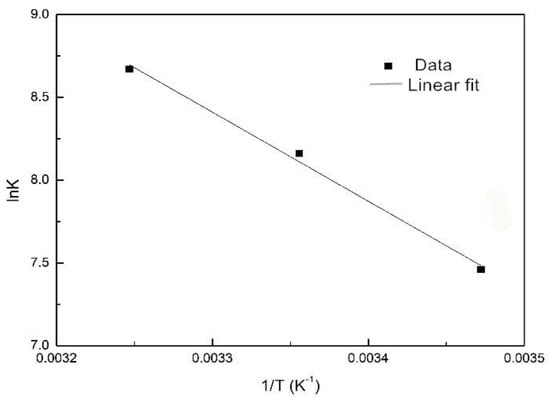
Figure 3.
The relationship of lnK and 1/T during adsorption of phosphorus.
Table 2.
Thermodynamic parameters of phosphorus adsorption.
3.1.2. Adsorption Kinetics
Adsorption Kinetics at Different Initial Concentrations
The adsorption rate was fast after the start of adsorption, and gradually became slower with time until the adsorption equilibrium was reached (Figure 4). When the adsorption time was the same, the higher the initial concentration, the larger the adsorbed amount of phosphorus. The initial concentration affected the phosphorus removal performance mainly in two aspects: First, the higher the initial concentration, the denser the phosphorus in the solution, and the easier it was to collide with the surface of the composite fiber to be adsorbed. Second, higher concentration led to greater concentration difference between the liquid film on the surface of the composite fiber and phosphorus. It also increased the driving force for the diffusion of phosphorus to the surface of the composite fiber. It can also be seen from the trend of the curve that the higher the initial concentration, the longer the time required for the adsorption to reach equilibrium. For example, when the initial concentration was 5 mg/L, the composite fiber reached the adsorption equilibrium after 18 h; while when the initial concentration was 20 mg/L, it took more than 48 h. The experimental data were put into pseudo-first-order and pseudo-second-order kinetic equations, and the relevant parameters were obtained (as described in Table 3).
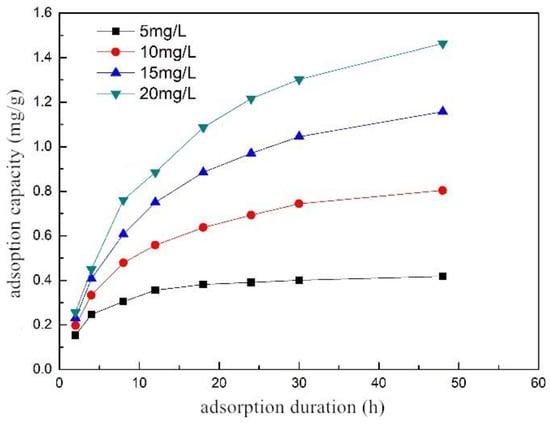
Figure 4.
Adsorption kinetic curve of ZSFB composite fiber at different initial concentrations.
Table 3.
Kinetics of phosphorus removal by ZSFB composite fiber at different initial concentrations.
The fitting results show that the pseudo-second-order kinetic model can accurately describe the adsorption kinetics, and the value of R2 > 0.99, indicating that the adsorption of phosphorus by the composite fiber, was mainly the chemical adsorption process [23]. At the initial concentrations of 5, 10, 15 and 20 mg/L, the R2 of the pseudo-second-order kinetic model was higher than that of the pseudo-first-order kinetic model. It was found that the adsorption rate constant K2 decreased as the initial concentration increased, as the surface area and the adsorption sites of the adsorbent were constant when the amount of the adsorbent was constant. When the solution concentration increased, the total amount of the adsorbate increased, which reduced the probability of a single adsorbate binding to the adsorbent site, and thus K2 decreased [24]. Using the pseudo-second-order kinetic model, the equilibrium adsorption capacity Qe at initial concentrations of 5, 10, 15 and 20 mg/L was 0.452, 0.918, 1.395 and 1.826 mg/g, respectively. It shows that increasing the concentration can increase the adsorption capacity of the composite fiber.
Adsorption Kinetics at Different Temperatures
The adsorption rate was fast after the start of adsorption, and gradually became slower with time until the adsorption equilibrium was reached (Figure 5). When the adsorption time was the same, the higher the initial concentration, the larger the adsorption amount of phosphorus. The experimental data were put into the pseudo-first-order kinetic model and the pseudo-second-order kinetic model equations, and the relevant parameters were calculated (Table 4). The equilibrium adsorption capacity Qe of ZSFB composite fiber at 15, 25 and 35 °C was 0.831, 0.918 and 0.976 mg/g, respectively, which revealed that the increase of temperature could increase the adsorption capacity of the composite fiber.
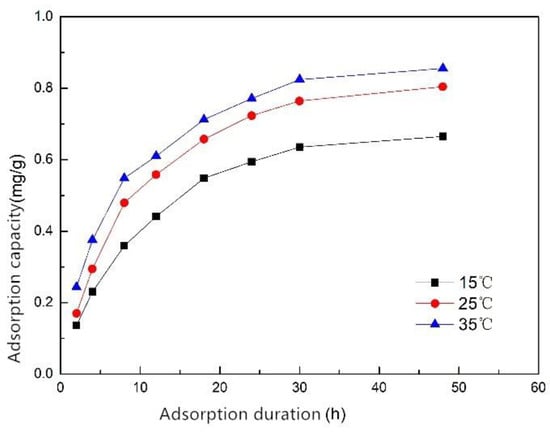
Figure 5.
Adsorption kinetic curve of ZSFB composite fiber at different temperatures.
Table 4.
Kinetics of phosphorus removal by ZSFB composite fiber at different temperatures.
3.1.3. Influencing Factors
Effect of Adsorbent Dosage on Phosphorus Removal
The more the fiber was dosed, the higher the phosphorus removal rate, but the lower the adsorption capacity (Table 5). When the fiber dosage increased, the usable surface area of the fiber increased. More adsorption sites for phosphorus exist, and the phosphorus was more easily combined with the active sites and hence was removed; however, since the total amount of phosphorus in the solution was constant, the amount of phosphorus adsorbed per unit mass of the composite fiber decreased as the dosage of the composite fiber increased. When the dosage was small, the removal rate of phosphorus increased rapidly. For example, the removal rate of adding 1 g of the composite fiber was 14.71% higher than that of adding 0.5 g. When continuing to increase the dosage, the positive effect on removal rate gradually decreased until it stopped as the phosphorus was completely removed. When the dosage was 3.5g, the residual phosphorus concentration was 0.327 mg/L, which met the class A demands of “discharge standard of pollutants for municipal wastewater treatment plant” (GB18918-2002) with an adsorption capacity of 0.276 mg/g. Therefore, the ZSFB composite fiber can be applied to the advanced phosphorus removal, and it can be considered that the optimum dosage is 3.5 g at a phosphorus concentration of 10 mg/L. However, for the difference in phosphorus concentration in different sewage treatment plants, it is necessary to conduct experiments to determine the optimal dosage for each plant.
Table 5.
Effect of dosage of ZSFB composite fiber on phosphorus removal.
Effect of pH Level on Phosphorus Removal
The phosphorus removal performance was best when the pH level was 4 with a removal efficiency of 90%, and the phosphorus removal performance at pH 10 was slightly better than that at pH 7 (Figure 6). Therefore, we can conclude that in the range of pH 4 to 10, the acidic condition is beneficial to improve the phosphorus removal performance of the composite fiber, and the alkaline condition has little effect on that. This is because under acidic conditions, the composite fiber releases more metal ions, such as Fe3+ and Ca2+, which combine with the phosphate to form precipitates, and the phosphorus is removed. Under alkaline conditions, although the release of metal ions is inhibited, Fe3+ combined with the modified adsorption substrates easily forms Fe(OH)3 flocculant on the surface of the fiber, which is beneficial to the adsorption and precipitation of phosphate. Moreover, the activity of the alkali-activated adsorption substrates will be improved, so the overall performance of the composite fiber is slightly improved under alkaline conditions [25]. Therefore, compared with the neutral condition, the acidic or alkaline conditions (4 ≤ pH ≤ 10) did not reduce the phosphorus removal effect of the composite fiber. It can be seen that the composite fiber performed well under both acidic and alkaline conditions.
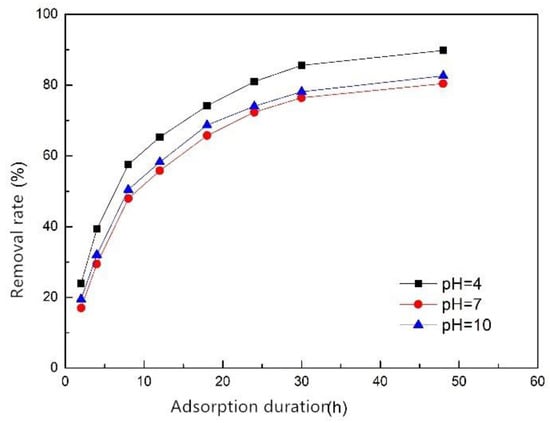
Figure 6.
Effect of pH level on phosphorus removal efficiency of ZSFB composite fiber.
Effect of Ammonium on Phosphorus Removal
The removal rate of phosphorus increased with the increase of ammonium concentration (Figure 7). When the ammonium concentration was lower than 100 mg/L, the removal rate was obviously smaller than 88%. When the ammonium concentration was higher than 100 mg/L, the removal rate increased slowly with the increase of ammonium concentration. When the ammonium concentration exceeded 400 mg/L, the removal rate no longer increased. The reason for this was that the metal cations, such as Fe3+ and Ca2+, in the adsorbent substrate can be ion-exchanged with NH4+ and combined with the phosphate to form precipitates [26]. The result indicates that ammonium promotes the adsorption of phosphorus by the composite fiber.
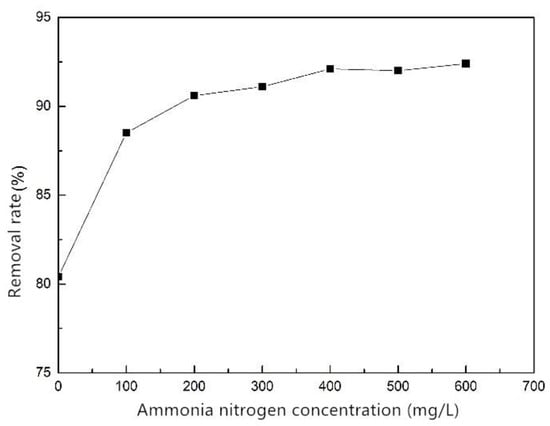
Figure 7.
Effect of ammonium on phosphorus removal of ZSFB composite fiber.
Effect of Anions on Phosphorus Removal
The effects of SO42−, Cl−, NO3− and CO32− on the phosphorus removal efficiency of ZSFB composite fiber were studied (Figure 8). The figure indicates that SO42−, Cl− and NO3− had little effect on the phosphorus removal in the concentration range of 0~10 mmol/L. However, CO32− had an inhibitory effect on the phosphorus removal. The higher the CO32− concentration, the lower the removal rate of phosphorus. The reason is that Ca2+ can also combine with CO32− to form CaCO3 precipitate, which will compete with the phosphate and cause the removal rate to reduce.
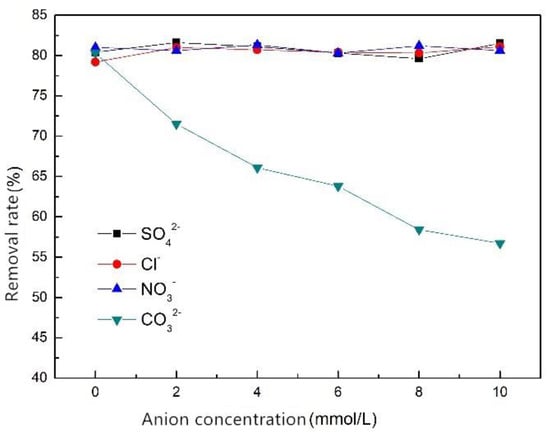
Figure 8.
Effect of anion on phosphorus removal efficiency of ZSFB composite fiber.
3.1.4. Adsorption Stability
Desorption in Clean Water
In Table 6, the results for the desorption of ZSFB composite fiber in clean water are listed. We can see that the desorption rate increased with the increase of the adsorption mass (as phosphorus), but the overall desorption rate was very low (< 1%), which indicates that the composite fiber had strong adsorption to phosphorus and can be applied to remove phosphorus in wastewater and surface water. According to the previous analysis, the adsorption of phosphorus by the composite fiber was mainly chemical adsorption, that is, the metal ion in the composite fiber combined with the phosphate ion in the water to form a phosphate precipitate. Since the solubility of the phosphate precipitate was low, the desorption rate of the composite fiber was also low.
Table 6.
Desorption of ZSFB composite fiber in clean water.
Desorption in Hot Water
Table 7 shows the desorption of ZSFB composite fiber in hot water. The results show that the desorption rate increased with the increase of the adsorbed amount of the composite fiber, but the overall desorption rate was still low (< 1.1%). Compared with the previous section, the desorption rate of the composite fiber in hot water was higher than that in clean water, which was due to the increase in the solubility of the phosphate precipitate as the temperature increased [27].
Table 7.
Desorption of ZSFB composite fiber in hot water.
Desorption in Sulfuric Acid Solution
Table 8 shows the desorption of ZSFB composite fiber in a sulfuric acid solution. The results show that the desorption rate increased with the increase of the sulfuric acid concentration. When the sulfuric acid concentration was 0.5 mol/L, the desorption rate reached 99%, which can be regarded as complete desorption. This was caused by sulfuric acid reacting with the calcium phosphate to form calcium sulfate precipitates and phosphoric acid [28]. At lower concentrations, the phosphate in the composite fiber did not completely react with the sulfuric acid. As the concentration of sulfuric acid increased, the phosphate and sulfuric acid reacted more thoroughly until a complete reaction. Since the desorption rate of the composite fiber in the sulfuric acid solution was high, the saturated composite fiber could be regenerated by the sulfuric acid solution.
Table 8.
Desorption of ZSFB composite fiber in sulfuric acid solution.
3.1.5. Performance of Phosphorus Removal Adsorbents
The partition coefficient is often used in solid–liquid adsorption system representing the ratio of adsorbate concentration in the solid phase to the concentration in the liquid phase at equilibrium. It is an objective performance metric to assess sorbents, despite of differences in operating conditions [29]. Some phosphorus removal adsorbents are evaluated in Table 9. Among these adsorbents, ZSFB composite fiber had comparative performance with the partition coefficient of 1.49 mg/g/µM. Nanomaterials and their composites generally showed enhanced performance for the removal of phosphorous from an aqueous solution compared with others. Among these adsorbents, hollow magnetic Fe3O4@NH2-MIL-101(Fe) had the best performance in terms of partition coefficient (24.65 mg/g/µM). The reason behind these chemical interactions was the presence of partially positively-charged metal sites in the metal organic frameworks [30,31]. These positively charged metal sites can interact with negatively charged sites through electrostatic interactions, leading to the adsorption of phosphate ions [32].
Table 9.
Performance of different adsorbents for adsorptive removal of phosphorus from aqueous solution.
3.2. Dynamic Adsorption and Phosphorus Removal Characteristics of ZSFB Composite Fiber
3.2.1. Effect of Influent Flow Rate
Figure 9 shows the breakthrough curves for different influent flow rates of 1.0, 1.5 and 2.0 mL/min; the filler mass was 30 g, the influent concentration was 10 mg/L and the effluent phosphorus concentration was 0.5 mg when breakthrough occurred. The results show that the influent flow had a great influence on the time of breakthrough, and as the influent flow increased, the time of breakthrough decreased. When the influent flow rate was 1.0, 1.5 and 2.0 mL/min, the time of breakthrough was 6.5, 5 and 3.5 h, respectively, and the treated water volume was 390, 450 and 420 mL, respectively. To sum up, excessive or too small influent flow was not conducive to phosphorus removal. The optimum influent flow rate was 1.5 mL/min, at which most water is treated. This was because when the flow rate was too large, the hydraulic retention time was short, and the phosphorus was insufficiently contacted with the composite fiber, so the amount of treated water was reduced. Moreover, the larger the flow rate, the higher the total amount of water treated at the same time, and the shorter the time of breakthrough. However, when the flow rate was too small, the flow rate in the adsorption column was too slow, and it seemed that the wastewater in the column diffused and mixed in the longitudinal direction, which was unfavorable for adsorption and resulted in a decrease in the amount of treated water [39]. Therefore, it is reasonable to control the influent flow rate at 1.5 mL/min, and this flow rate was also used in subsequent tests.
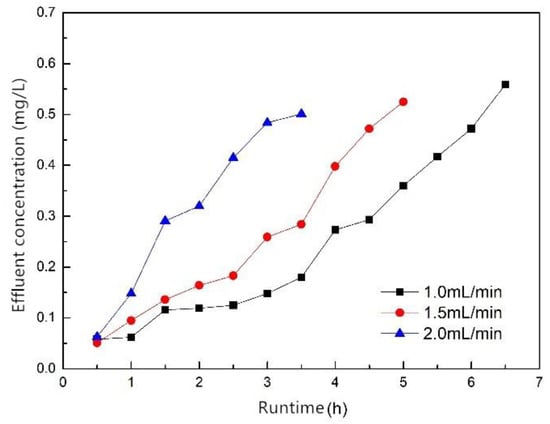
Figure 9.
Breakthrough curves of different influent flow rates.
3.2.2. Effect of Filler Mass
Figure 10 shows the breakthrough curves when the filler masses were 20, 30 and 40 g; the influent flow rate was 1.5 mL/min, the influent concentration was 10 mg/L and the effluent phosphorus concentration was 0.5 mg/L when breakthrough occurred. The results show that the filler mass had a great influence on the time of breakthrough. As the filler mass increased, the time of breakthrough was also prolonged, and the effluent phosphorus concentration also decreased with the same runtime. The time of breakthrough of the fillers of 20, 30 and 40 g were 3.5, 5 and 6 h, respectively, and the treated water volumes were 315, 450 and 540 mL, respectively. The results indicate that increasing the filler mass facilitated the removal of phosphorus. The reason was that adsorption mass increased as filler mass increased, which led to an increase of treated water. According to the effect of the dosage on the phosphorus removal performance (Section 3.1.3), the larger the dosage, the higher the phosphorus removal rate. This is consistent with the conclusion that the effluent phosphorus concentration decreases as the filler mass increases.
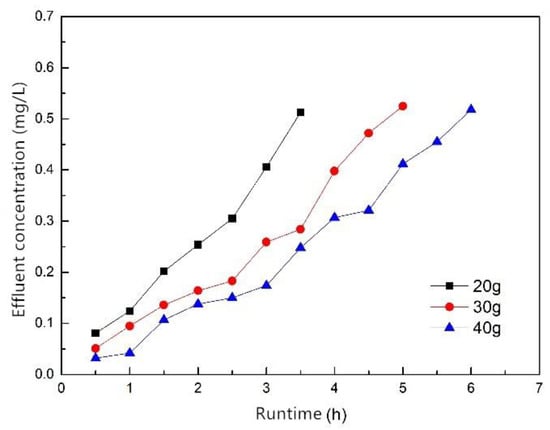
Figure 10.
Breakthrough curves of different filler mass.
3.2.3. Effect of Influent Concentration
Figure 11 shows the breakthrough curves for influent concentrations of 5, 10 and 20 mg/L; the mass of the filler was 30 g, the influent flow rate was 1.5 mL/min and the effluent phosphorus concentrations were 0.25, 0.5 and 1.0 mg/L when breakthrough occurred. The results show that the influent concentration had a certain influence on the time of breakthrough. As the influent concentration increased, the time of breakthrough decreased. When the influent concentration was 5, 10 and 20 mg/L, the time of breakthrough was 6.5, 5 and 4 h, respectively, and the treated water volume was 585, 450 and 360 mL, respectively. This was because the higher the influent concentration, the faster the adsorption rate, and the easier it was for the adsorption to reach saturation, and the adsorption column breakthrough occurred more easily. To sum up, the ZSFB composite fiber was more suitable for treating phosphorus-containing wastewater with a lower concentration.
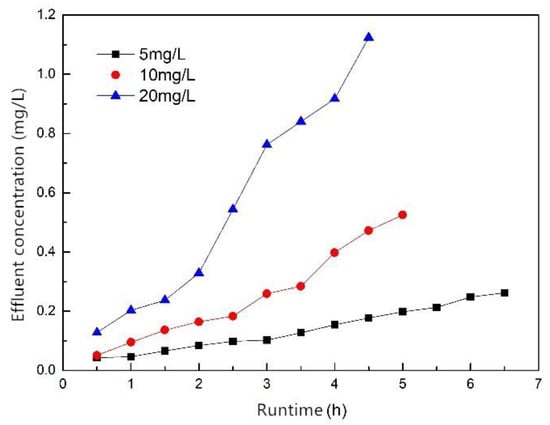
Figure 11.
Breakthrough curves of different influent concentration.
4. Conclusions
The kinetics of phosphorus removal utilizing the ZSFB composite fiber under different conditions were well fitted with the pseudo-first-order and pseudo-second-order models (R2 > 0.9674). The maximum adsorption capacity of the fiber calculated by the Langmuir model was found to be 4.18 mg/g. The phosphorus removal effect was positively correlated with initial concentration, dosage, temperature and ammonium concentration in a proper range, and the best phosphorus removal effect was at pH 4, 35 °C and with an initial concentration of 10 mg/L and dosage of 3.5 g. The ZSFB composite fiber has good adsorption stability—the desorption rate in clean water and hot water is less than 1.1%. When the sulfuric acid concentration was 0.5 mol/L, the desorption rate was 99%, which can be used to regenerate the composite fiber. Under the same operating conditions, the greater the influent flow rate, the shorter the time of breakthrough; the higher the filler mass, the longer the time of breakthrough, and the more water was treated; the higher the influent concentration, the shorter the time of breakthrough, and the less water was treated.
In conclusion, the ZSFB composite fiber can be applied in phosphorus removal, and it also shows a new direction for deep phosphorus removal in wastewater treatment. However, the phosphorus-containing wastewater used in this experiment was simulated by KH2SO4 and distilled water, but the actual types of pollutants in the wastewater are complex, which may have a certain influence on the phosphorus removal performance of the composite fiber. This article gives a promising result for applying the ZSFB composite fiber in phosphorus adsorption from an aqueous solution. Further investigation is needed to study the phosphorus removal performance with real wastewater and the stability of the recyclability of the composite fiber.
Author Contributions
Conceptualization, Y.L.; methodology, Y.L. and X.H.; software, Y.L. and X.H.; validation, Y.L. and X.H.; formal analysis, X.H.; investigation, X.H.; resources, Y.L.; data curation, X.H.; writing—original draft preparation, X.H.; writing—review and editing, Y.L. and X.H.; visualization, Y.L. and X.H.; supervision, Y.L.; project administration, Y.L.
Funding
This research received no specific grant from any funding agency in the public, commercial or not-for-profit sectors.
Acknowledgments
I would like to show my deepest gratitude to Rajendra Prasad Singh, School of Civil Engineering, Southeast University, who has provided me with valuable guidance in every stage of the writing of this thesis.
Conflicts of Interest
The authors declare no conflict of interest.
References
- Dodds, W.K.; Smith, V.H. Nitrogen, phosphorus, and eutrophication in streams. Inland Waters 2016, 6, 155–164. [Google Scholar] [CrossRef]
- Conley, D.J.; Paerl, H.W.; Howarth, R.W.; Boesch, D.F.; Seitzinger, S.P.; Havens, K.E.; Lancelot, C.; Likens, G.E. Controlling Eutrophication: Nitrogen and Phosphorus. Science 2009, 323, 1014–1015. [Google Scholar] [CrossRef]
- Liu, F.; Ma, M. Process characteristics of catalytic phosphorus removal coupled with biological method. J. Environ. Eng. 2014, 8, 429–435. [Google Scholar]
- Guo, H.; Chen, D. Study on phosphorus removal by chemical method. Environ. Prot. Sci. 2010, 36, 50–52. [Google Scholar]
- He, X.; Yi, L.; Wang, C.; Chou, F. Research status and development trend of phosphorus recovery technology. J. Environ. Sci. 2010, 30, 897–907. [Google Scholar]
- Rajakovic, V.; Aleksic, G.; Radetic, M.; Rajakovic, L. Efficiency of oil removal from real wastewater with different sorbent materials. J. Hazard. Mater. 2007, 143, 494–499. [Google Scholar] [CrossRef]
- Qin, J.; Cui, C.; Cui, X.Y.; Hussain, A.; Yang, C.M. Preparation and characterization of ceramsite from lime mud and coal fly ash. Constr. Build. Mater. 2015, 95, 10–17. [Google Scholar] [CrossRef]
- Hu, X.; Yang, L.; He, S.; Fang, F.; Zhou, Y. Preparation of Fe304/BC composite and its adsorption and phosphorus removal performance. Res. Environ. Sci. 2018, 31, 143–153. [Google Scholar]
- Niu, Y.; Li, K.; Ying, D.; Wang, Y.; Jia, J. Novel recyclable adsorbent for the removal of copper (II) and lead (II) from aqueous solution. Bioresour. Technol. 2017, 229, 63–68. [Google Scholar] [CrossRef] [PubMed]
- Jiang, C.; Jia, L.; He, Y.; Zhang, B.; Kirumba, G.; Xie, J. Adsorptive removal of phosphorus from aqueous solution using sponge iron and zeolite. J. Colloid Interface Sci. 2013, 402, 246–252. [Google Scholar] [CrossRef]
- Foo, K.Y.; Hameed, B.H. Insights into the modeling of adsorption isotherm systems. Chem. Eng. J. 2010, 156, 2–10. [Google Scholar] [CrossRef]
- Krishna, R.H.; Swamy, A. Physico-Chemical Key Parameters, Langmuir and Freundlich isotherm and Lagergren Rate Constant Studies on the removal of divalent nickel from the aqueous solutions onto powder of calcined brick. Int. J. Eng. Res. Dev. 2012, 4, 29–38. [Google Scholar]
- Chung, H.-K.; Kim, W.-H.; Park, J.; Cho, J.; Jeong, T.-Y.; Park, P.-K. Application of Langmuir and Freundlich isotherms to predict adsorbate removal efficiency or required amount of adsorbent. J. Ind. Eng. Chem. 2015, 28, 241–246. [Google Scholar] [CrossRef]
- Perrot, P. A to Z of Thermodynamics; Oxford University Press on Demand: New York, NY, USA, 1998. [Google Scholar]
- Guomei, C. Ammonium Molybdate Spectrophotometric Method for Determination of Total Phosphorus in Municipal Sewage Sludge. China Water Wastewater 2006, 22, 85–86. [Google Scholar]
- Ahmad, A.A.; Hameed, B.H. Fixed-bed adsorption of reactive azo dye onto granular activated carbon prepared from waste. J. Hazard. Mater. 2010, 175, 298–303. [Google Scholar] [CrossRef]
- Linga, P.; Daraboina, N.; Ripmeester, J.A.; Englezos, P. Enhanced rate of gas hydrate formation in a fixed bed column filled with sand compared to a stirred vessel. Chem. Eng. Sci. 2012, 68, 617–623. [Google Scholar] [CrossRef]
- Chandrasekara, N.G.N.; Pashley, R. Study of a new process for the efficient regeneration of ion exchange resins. Desalination 2015, 357, 131–139. [Google Scholar] [CrossRef]
- Mohammed, N.; Grishkewich, N.; Waeijen, H.A.; Berry, R.M.; Tam, K.C. Continuous flow adsorption of methylene blue by cellulose nanocrystal-alginate hydrogel beads in fixed bed columns. Carbohydr. Polym. 2016, 136, 1194–1202. [Google Scholar] [CrossRef]
- Fu, J.; Chen, Z.; Wang, M.; Liu, S.; Zhang, J.; Zhang, J.; Han, R.; Xu, Q. Adsorption of methylene blue by a high-efficiency adsorbent (polydopamine microspheres): Kinetics, isotherm, thermodynamics and mechanism analysis. Chem. Eng. J. 2015, 259, 53–61. [Google Scholar] [CrossRef]
- Scheufele, F.B.; Módenes, A.N.; Borba, C.E.; Ribeiro, C.; Espinoza-Quiñones, F.R.; Bergamasco, R.; Pereira, N.C. Monolayer–multilayer adsorption phenomenological model: Kinetics, equilibrium and thermodynamics. Chem. Eng. J. 2016, 284, 1328–1341. [Google Scholar] [CrossRef]
- Liu, Y. Is the Free Energy Change of Adsorption Correctly Calculated? J. Chem. Eng. Data 2009, 54, 1981–1985. [Google Scholar] [CrossRef]
- Simonin, J.-P. On the comparison of pseudo-first order and pseudo-second order rate laws in the modeling of adsorption kinetics. Chem. Eng. J. 2016, 300, 254–263. [Google Scholar] [CrossRef]
- Huang, J.; Liu, Y.; Song, Z.; Jin, Q.; Wang, X. Adsorption of Tannic Acid by Attapulgite Adsorbent. For. Chem. Ind. 2011, 31, 50–54. [Google Scholar]
- Ong, Y.K.; Li, F.Y.; Sun, S.-P.; Zhao, B.-W.; Liang, C.-Z.; Chung, T.-S. Nanofiltration hollow fiber membranes for textile wastewater treatment: Lab-scale and pilot-scale studies. Chem. Eng. Sci. 2014, 114, 51–57. [Google Scholar] [CrossRef]
- Tanaka, Y.; Moon, S.-H.; Nikonenko, V.V.; Xu, T. Ion-exchange membranes. Int. J. Chem. Eng. 2012. [Google Scholar] [CrossRef]
- Boanini, E.; Gazzano, M.; Bigi, A. Ionic substitutions in calcium phosphates synthesized at low temperature. Acta Biomater. 2010, 6, 1882–1894. [Google Scholar] [CrossRef]
- Ren, W.; Zhou, Z.; Huang, X.; Hu, D.; Jiang, Y.; Dong, F.; Hou, Y.; Shen, X. Optimization of Simultaneous Removal of Phosphorus and Humus from Sludge by Calcium Phosphate Precipitation. Acta Sientiae Circumstantiae 2015, 35, 3545–3551. [Google Scholar]
- Vikrant, K.; Kim, K.-H. Nanomaterials for the adsorptive treatment of Hg (II) ions from water. Chem. Eng. J. 2019, 358, 264–282. [Google Scholar] [CrossRef]
- Xie, Q.; Li, Y.; Lv, Z.; Zhou, H.; Yang, X.; Chen, J.; Guo, H. Effective adsorption and removal of phosphate from aqueous solutions and eutrophic water by Fe-based MOFs of MIL-101. Sci. Rep. 2017, 7, 3316. [Google Scholar] [CrossRef]
- Li, Y.; Xie, Q.; Hu, Q.; Li, C.; Huang, Z.; Yang, X.; Guo, H. Surface modification of hollow magnetic Fe3O4@ NH2-MIL-101(Fe) derived from metal-organic frameworks for enhanced selective removal of phosphates from aqueous solution. Sci. Rep. 2016, 6, 30651. [Google Scholar] [CrossRef]
- Nehra, M.; Dilbaghi, N.; Singhal, N.K.; Hassan, A.A.; Kim, K.-H.; Kumar, S. Metal organic frameworks MIL-100 (Fe) as an efficient adsorptive material for phosphate management. Environ. Res. 2019, 169, 229–236. [Google Scholar] [CrossRef]
- Xiong, W.; Tong, J.; Yang, Z.; Zeng, G.; Zhou, Y.; Wang, D.; Song, P.; Xu, R.; Zhang, C.; Cheng, M. Adsorption of phosphate from aqueous solution using iron-zirconium modified activated carbon nanofiber: Performance and mechanism. J. Colloid Interface Sci. 2017, 493, 17–23. [Google Scholar] [CrossRef]
- Pan, M.; Lin, X.; Xie, J.; Huang, X. Kinetic, equilibrium and thermodynamic studies for phosphate adsorption on aluminum hydroxide modified palygorskite nano-composites. Rsc Adv. 2017, 7, 4492–4500. [Google Scholar] [CrossRef]
- Liu, X.; Zhang, L. Removal of phosphate anions using the modified chitosan beads: Adsorption kinetic, isotherm and mechanism studies. Powder Technol. 2015, 277, 112–119. [Google Scholar] [CrossRef]
- Li, G.; Gao, S.; Zhang, G.; Zhang, X. Enhanced adsorption of phosphate from aqueous solution by nanostructured iron (III)–copper (II) binary oxides. Chem. Eng. J. 2014, 235, 124–131. [Google Scholar] [CrossRef]
- Ray, J.; Jana, S.; Tripathy, T. Synthesis of dipolar grafted hydroxyethyl cellulose and its application for the removal of phosphate ion from aqueous medium by adsorption. Int. J. Biol. Macromol. 2018, 109, 492–506. [Google Scholar] [CrossRef]
- Fu, H.; Yang, Y.; Zhu, R.; Liu, J.; Usman, M.; Chen, Q.; He, H. Superior adsorption of phosphate by ferrihydrite-coated and lanthanum-decorated magnetite. J. Colloid Interface Sci. 2018, 530, 704–713. [Google Scholar] [CrossRef]
- Ghosh, D.; Gopal, B. Effect of hydraulic retention time on the treatment of secondary effluent in a subsurface flow constructed wetland. Ecol. Eng. 2010, 36, 1044–1051. [Google Scholar] [CrossRef]
© 2019 by the authors. Licensee MDPI, Basel, Switzerland. This article is an open access article distributed under the terms and conditions of the Creative Commons Attribution (CC BY) license (http://creativecommons.org/licenses/by/4.0/).