Communication

Degradation Rates of Pure Zinc, Magnesium, and Magnesium Alloys Measured by Volume Loss, Mass Loss, and Hydrogen Evolution

1
National Science Foundation-Engineering Research Center for Revolutionizing Metallic Biomaterials, North Carolina Agricultural and Technical State University, Greensboro, NC 27401, USA
2
FIT BEST Laboratory, Department of Chemical, Biological, and Bioengineering, North Carolina Agricultural and Technical State University, Greensboro, NC 27401, USA
3
Jeonbuk Technopark, Regional Industry Promotion Office, Chonbuk Province, Jeonju 54853, Korea
*
Author to whom correspondence should be addressed.
These authors contributed equally to this work.
Appl. Sci. 2018, 8(9), 1459; https://doi.org/10.3390/app8091459
Submission received: 8 August 2018 / Revised: 23 August 2018 / Accepted: 23 August 2018 / Published: 25 August 2018
(This article belongs to the Special Issue Permanent and Long-Term Biodegradable Biomaterials)

Abstract

:
Degradation rate is an important property to evaluate bioabsorbable metallic material; however, values vary depending on the method of measurement. In this study, three different methods of measuring corrosion rate are compared. The degradable samples to analyze corrosion rates include pure magnesium (Mg), lab produced Mg–Zn–Ca alloy (47-7-2), Mg–Zn–Zr–RE (rare earth) alloys (60-13, 60-14), Mg–Zn–Ca–RE alloy (59B), and pure zinc (Zn). A eudiometer was used to measure hydrogen evolution from the reaction of degradable alloys in Hank’s Balanced Salt Solution (HBSS). Corrosion rates based on volume loss of tested alloys in 30 days were calculated using Micro-computed tomography (micro-CT). Final mass change due to corrosion and corrosion removal was measured with a scale. We observed that the corrosion rates indicated by hydrogen evolution were high initially, and slowed down sharply in the following measurements. The corrosion rates of tested alloys calculated by volume loss and mass loss from high to low are: 60–13 ≈ 60–14 ≈ 47–7–2 > 59B > Mg > Zn (p < 0.05). The results provide instruction to experimental methodology to measure corrosion rates of degradable alloys.

1. Introduction

Biodegradable magnesium (Mg) alloys are becoming key materials for biomedical orthopedic applications because of their light weight and high strength md [1]. Mg alloys’ density of 1.7 g/cm3 to 2.0 g/cm3 is close to the natural bone density which ranges from 1.8 to 2.1 g/cm3 [2]. The stiffness modulus of pure magnesium is 45 GPa, which is in the range of human bone modulus of elasticity (40 to 57 GPa) [3,4]. The similarity in mechanical properties of magnesium with natural bone makes it an excellent candidate for biomedical applications for developing biodegradable orthopedic medical devices [1]. However, the high corrosion rate of Mg alloys limits its orthopedic applications. Zinc (Zn) has been used to alloy Mg (Mg–Zn alloy) to improve the corrosion resistance [5]. Zn also was alloyed with Mg to Zn–Mg alloy showing homogenous microstructure, slowly uniform degradation, improved mechanical properties, and good biocompatibility [6]. Zn–Mg alloy was believed to be an excellent candidate material for the application of load-bearing biodegradable implant [6]. Biodegradable alloys have been studied in various physiological environments to understand the corrosion behavior of these biomaterials [1,5,6,7,8,9,10,11,12,13,14,15,16,17,18]. Corrosion rate is one of the most studied properties of biodegradable alloys due to the importance of describing the corrosion behavior quantitatively in wide-ranging application environments.
Volume loss, mass loss, and hydrogen evolution have been used to determine corrosion rate of biodegradable alloys in in vitro tests; though these methods often give different rates [19]. There are discrepancies between degradation rate of magnesium in vitro tests, weight loss, and evolution of hydrogen gas, as compared to in vivo studies in orthopedics applications [20,21]. Corrosion rate of Mg–Gd–Zn alloys calculated by mass loss was lower than that calculated by hydrogen evolution from a eudiometer [22]. The corrosion rates obtained from the mass loss measurements were presumably because it is difficult to remove the corrosion products completely after these samples corroded severely in the long immersion test [22]. Corrosion rates of magnesium and its alloys in vitro is studied extensively to find a relationship on the weight loss to evolution of hydrogen gas after immersion testing [7,18,23]. However, accumulation of non-soluble products on the samples during immersion time makes weight loss not viable to accurately determine degradation [24]. The tendency of the corrosion rates obtained from in vitro corrosion tests calculated by mass loss were in the opposite direction as those obtained from the in vivo study measured by volume loss [25]. Methodology to evaluate the corrosion rates in vitro and in vivo has been reviewed, in which mass loss was used in an in vitro immersion test [26,27] and strictly speaking not an in vivo method [28]. Volume loss to calculate corrosion rate has been used in studies in vivo [26,29] as well as ex vivo and in vitro [30,31].
In this study, mass loss, volume loss, and hydrogen evolution were used to calculate corrosion rate of four Mg-based alloys, pure Mg and Zn. The approach of this research effort used eudiometric set ups to immerse biodegradable samples, and then conducted measurement of volume of hydrogen gas evolution every 48 h up to 14 days. The weight loss by a scale and volume loss by Micro-computed tomography (micro-CT) measurements were collected after 30 days’ immersion in the eudiometer chambers. Corrosion rates of tested biodegradable samples calculated by hydrogen evolution, mass loss, and volume loss were compared statistically.

2. Materials and Methods

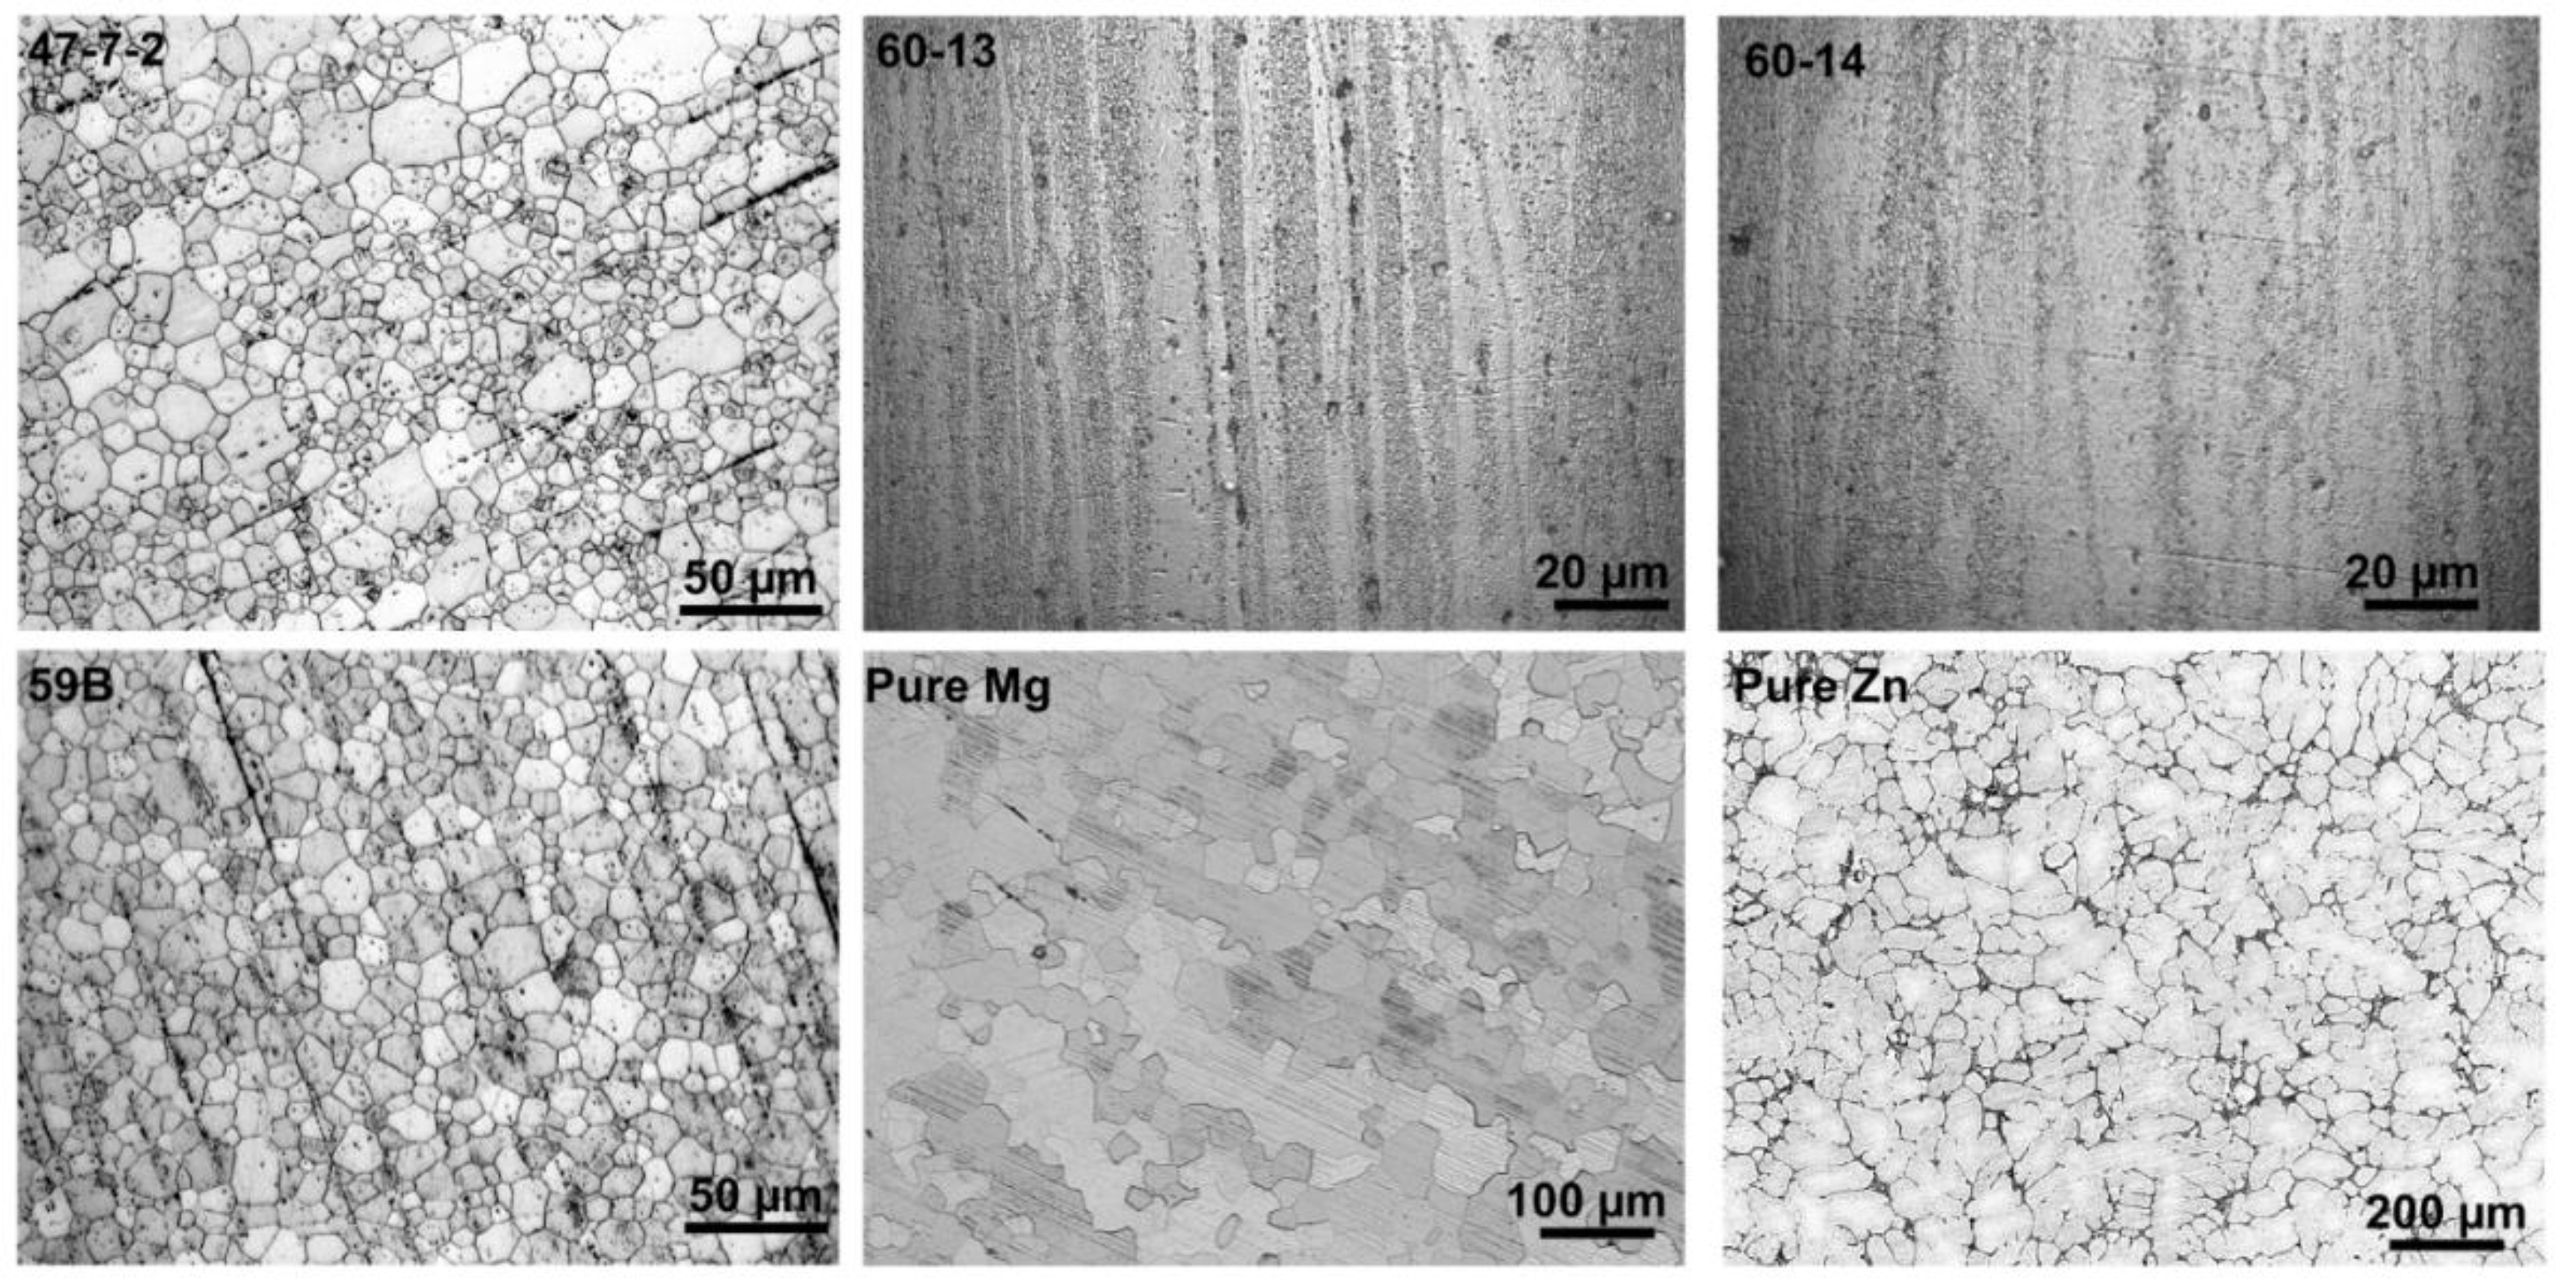
2.1. Materials Preparation

Commercially available pure magnesium and zinc ≥99.99 wt. % were purchased from SIGMA-ALDRICH® (St. Louis, MO, USA). Four magnesium alloys with different compositions were used for the immersion experiment. The magnesium alloys (Table 1) were extruded at Engineering Research Center for Revolutionizing Metallic Biomaterials (ERC-RMB) in North Carolina A&T State University. The samples were cut by using electrical discharge machine and surfaces were sequentially polished with silicon carbide films of 30 μm, 15 μm, 9 μm, 5 μm, 3 μm and 1 μm discs. After polishing, the samples were cleaned with 5% Nital for about 6–8 s and 8 mL isopropanol at room temperature and air dried before exposure to physiological medium. The grain structures (Figure 1) of tested alloys were observed optical microscope (ZEISS, Oberkochen, Germany) after etching by 20% natal and acetic picral solution (10 mL acetic acid + 4.2 g picric acid + 10 mL distilled water + 70 mL 95% ethanol). Grain sizes were measured using ImageJ software (version 1.5, US National Institutes of Health, Bethesda, MD, USA).

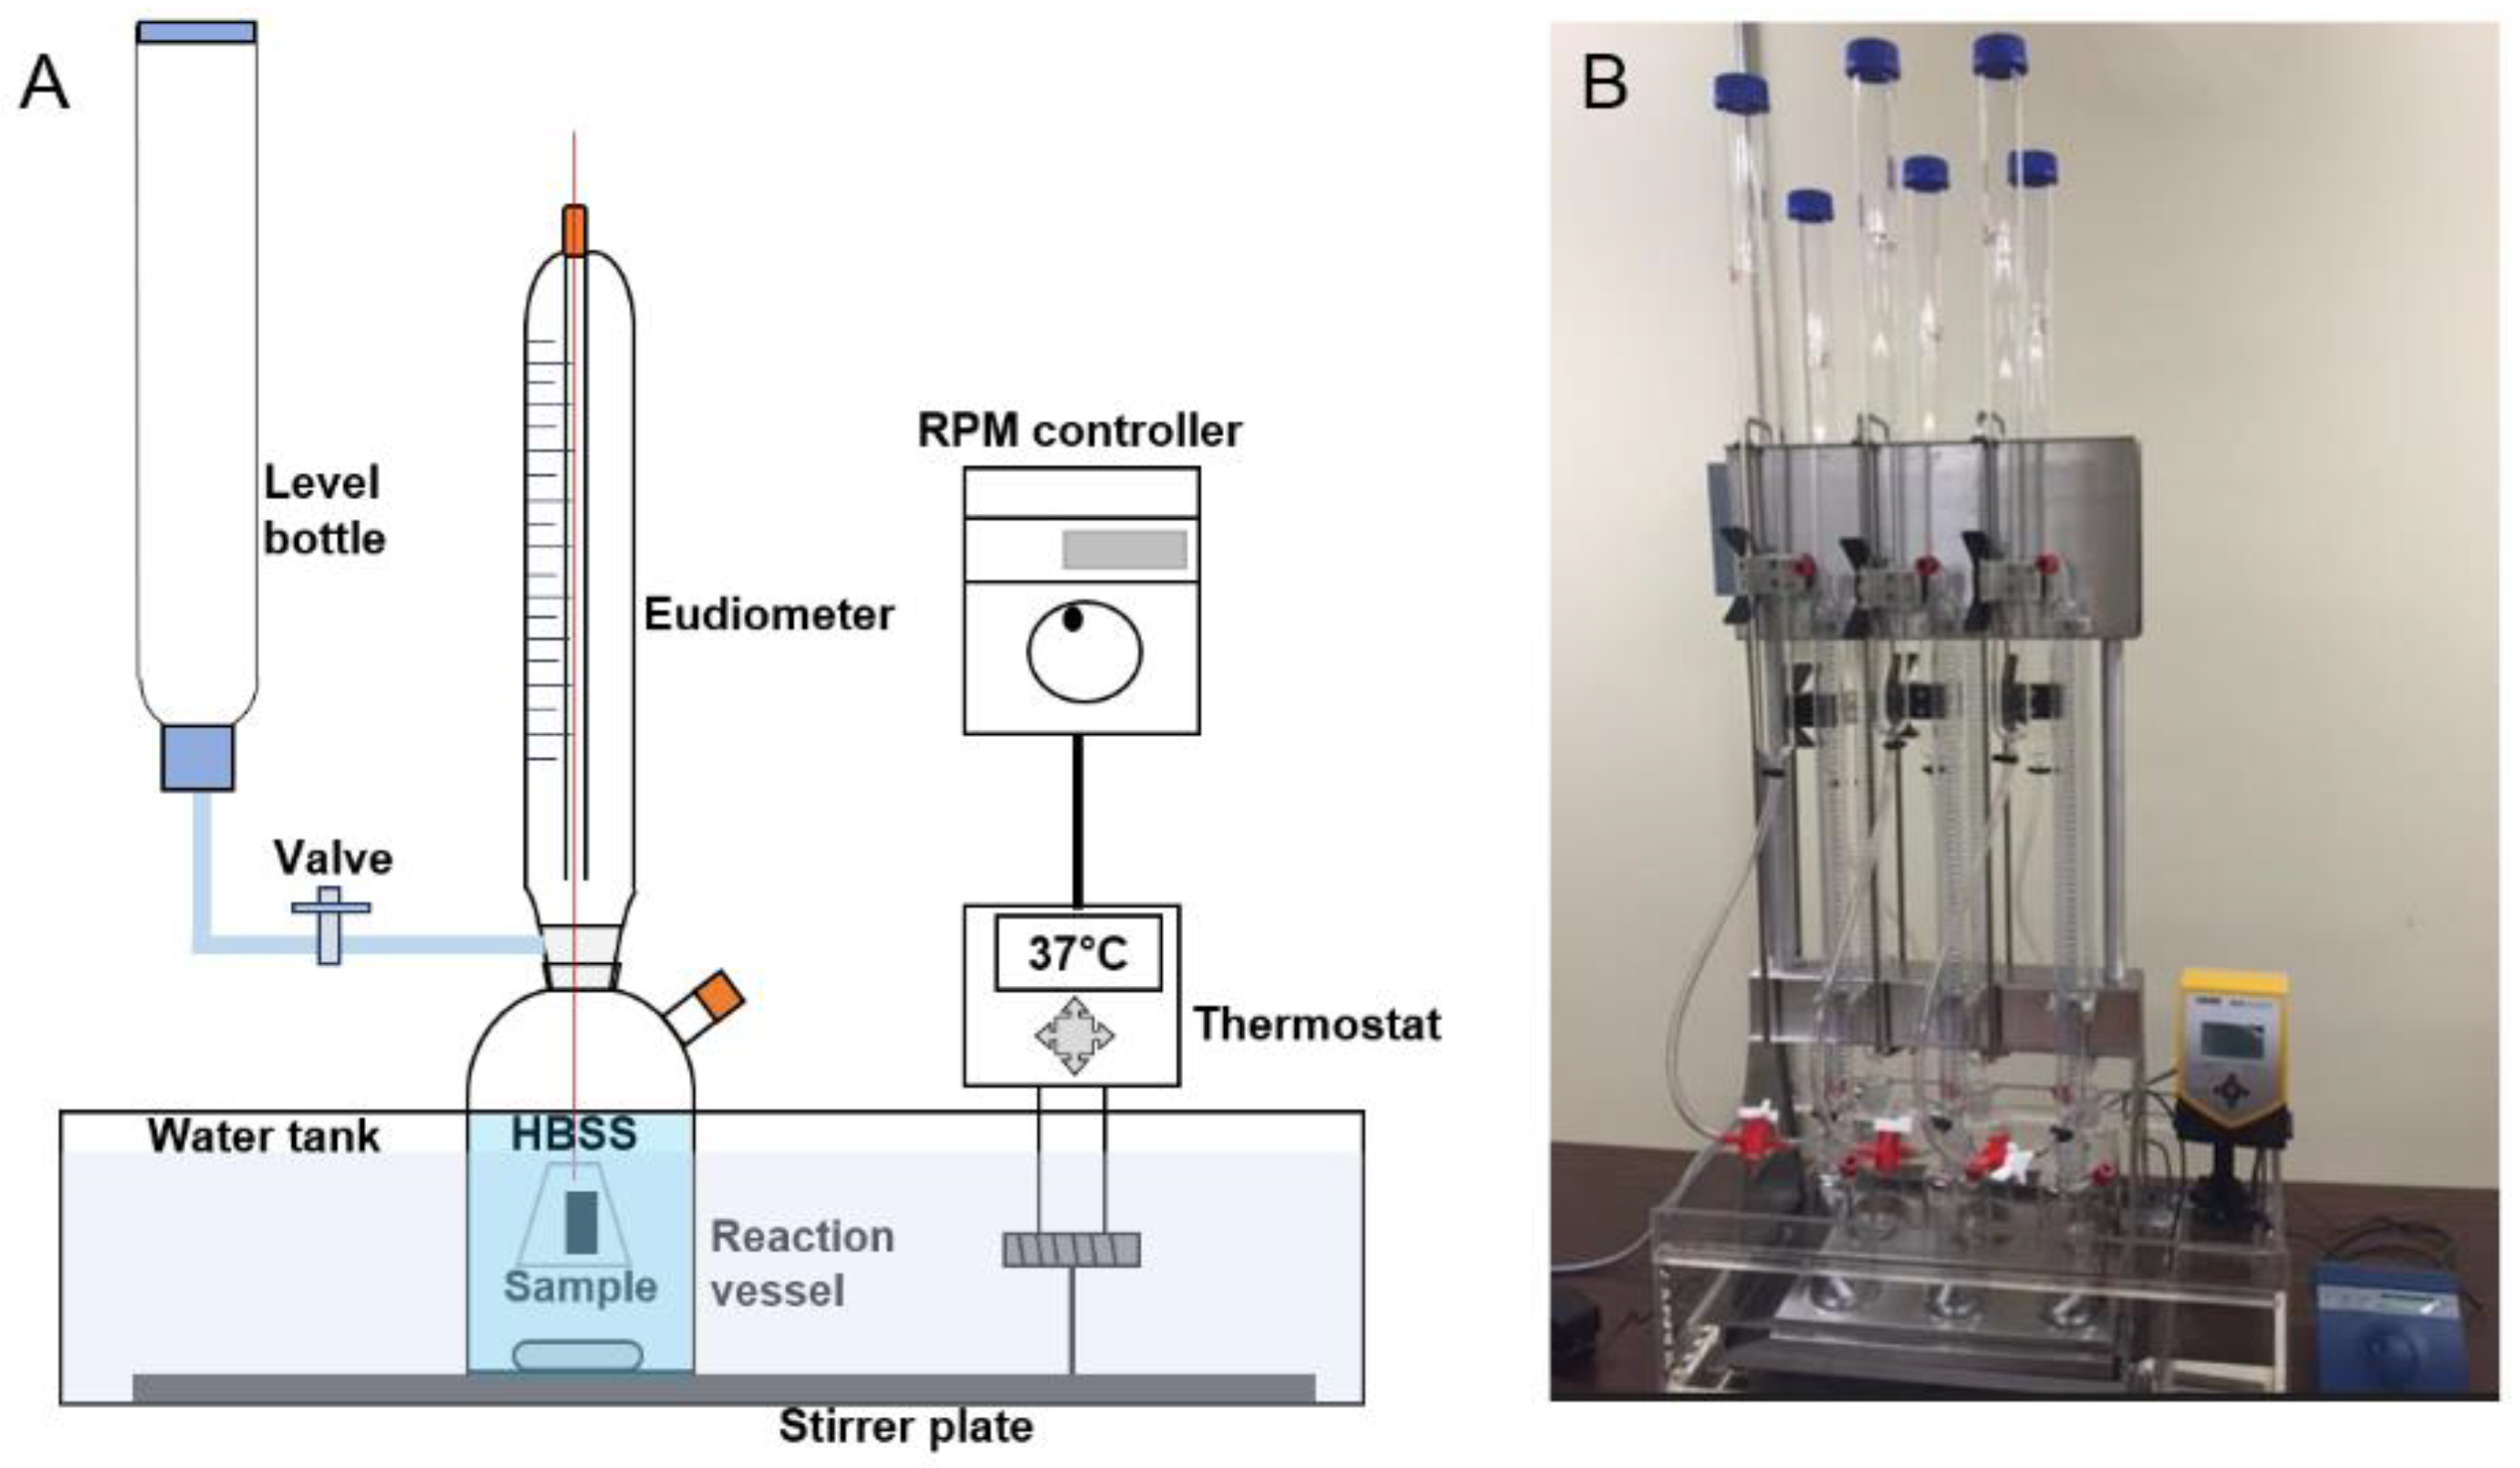
2.2. Eudiometer Test and Hydrogen Evolution

A eudiometric system (Figure 2) was purchased from Weinkauf Medizin & Umwelttechnik (Hallerndorf, Germany), which was set up by a Cimarec™ i Telesystem Multipoint Stirrers (Thermo scientific, Stuttgart, Germany), sealed eudiometers, level bottle and reaction bottles (Selutec, Walkenmühleweg, Hechingen, Germany), a LAUDA ECO Silver immersion thermostat bath system (Lauda-Koenigshofen, Stuttgart, Baden-Württemberg, Germany), and a RMP controller (Thermo Scientific, Germany). The tested alloys were installed into a plastic net-basket and immersed into Hank’s Balanced Salt Solution (HBSS, Sigma-Aldrich, St. Louis, MO, USA) in eudiometer bottles to measure the hydrogen gas evolution (Figure 1). The hydrogen volume was recorded from the eudiometer every 48 h. Thus the volume of hydrogen gas generated every 2 days was used to calculate the corrosion rate of magnesium and its alloys based on the chemical equation Mg + 2H2O ⇌ Mg2+ + 2OH + H2. The volume of hydrogen gas generated by pure zinc was used to calculate corrosion rate based on the chemical equation Zn + 2H2O ⇌ Zn2+ + 2OH + H2.

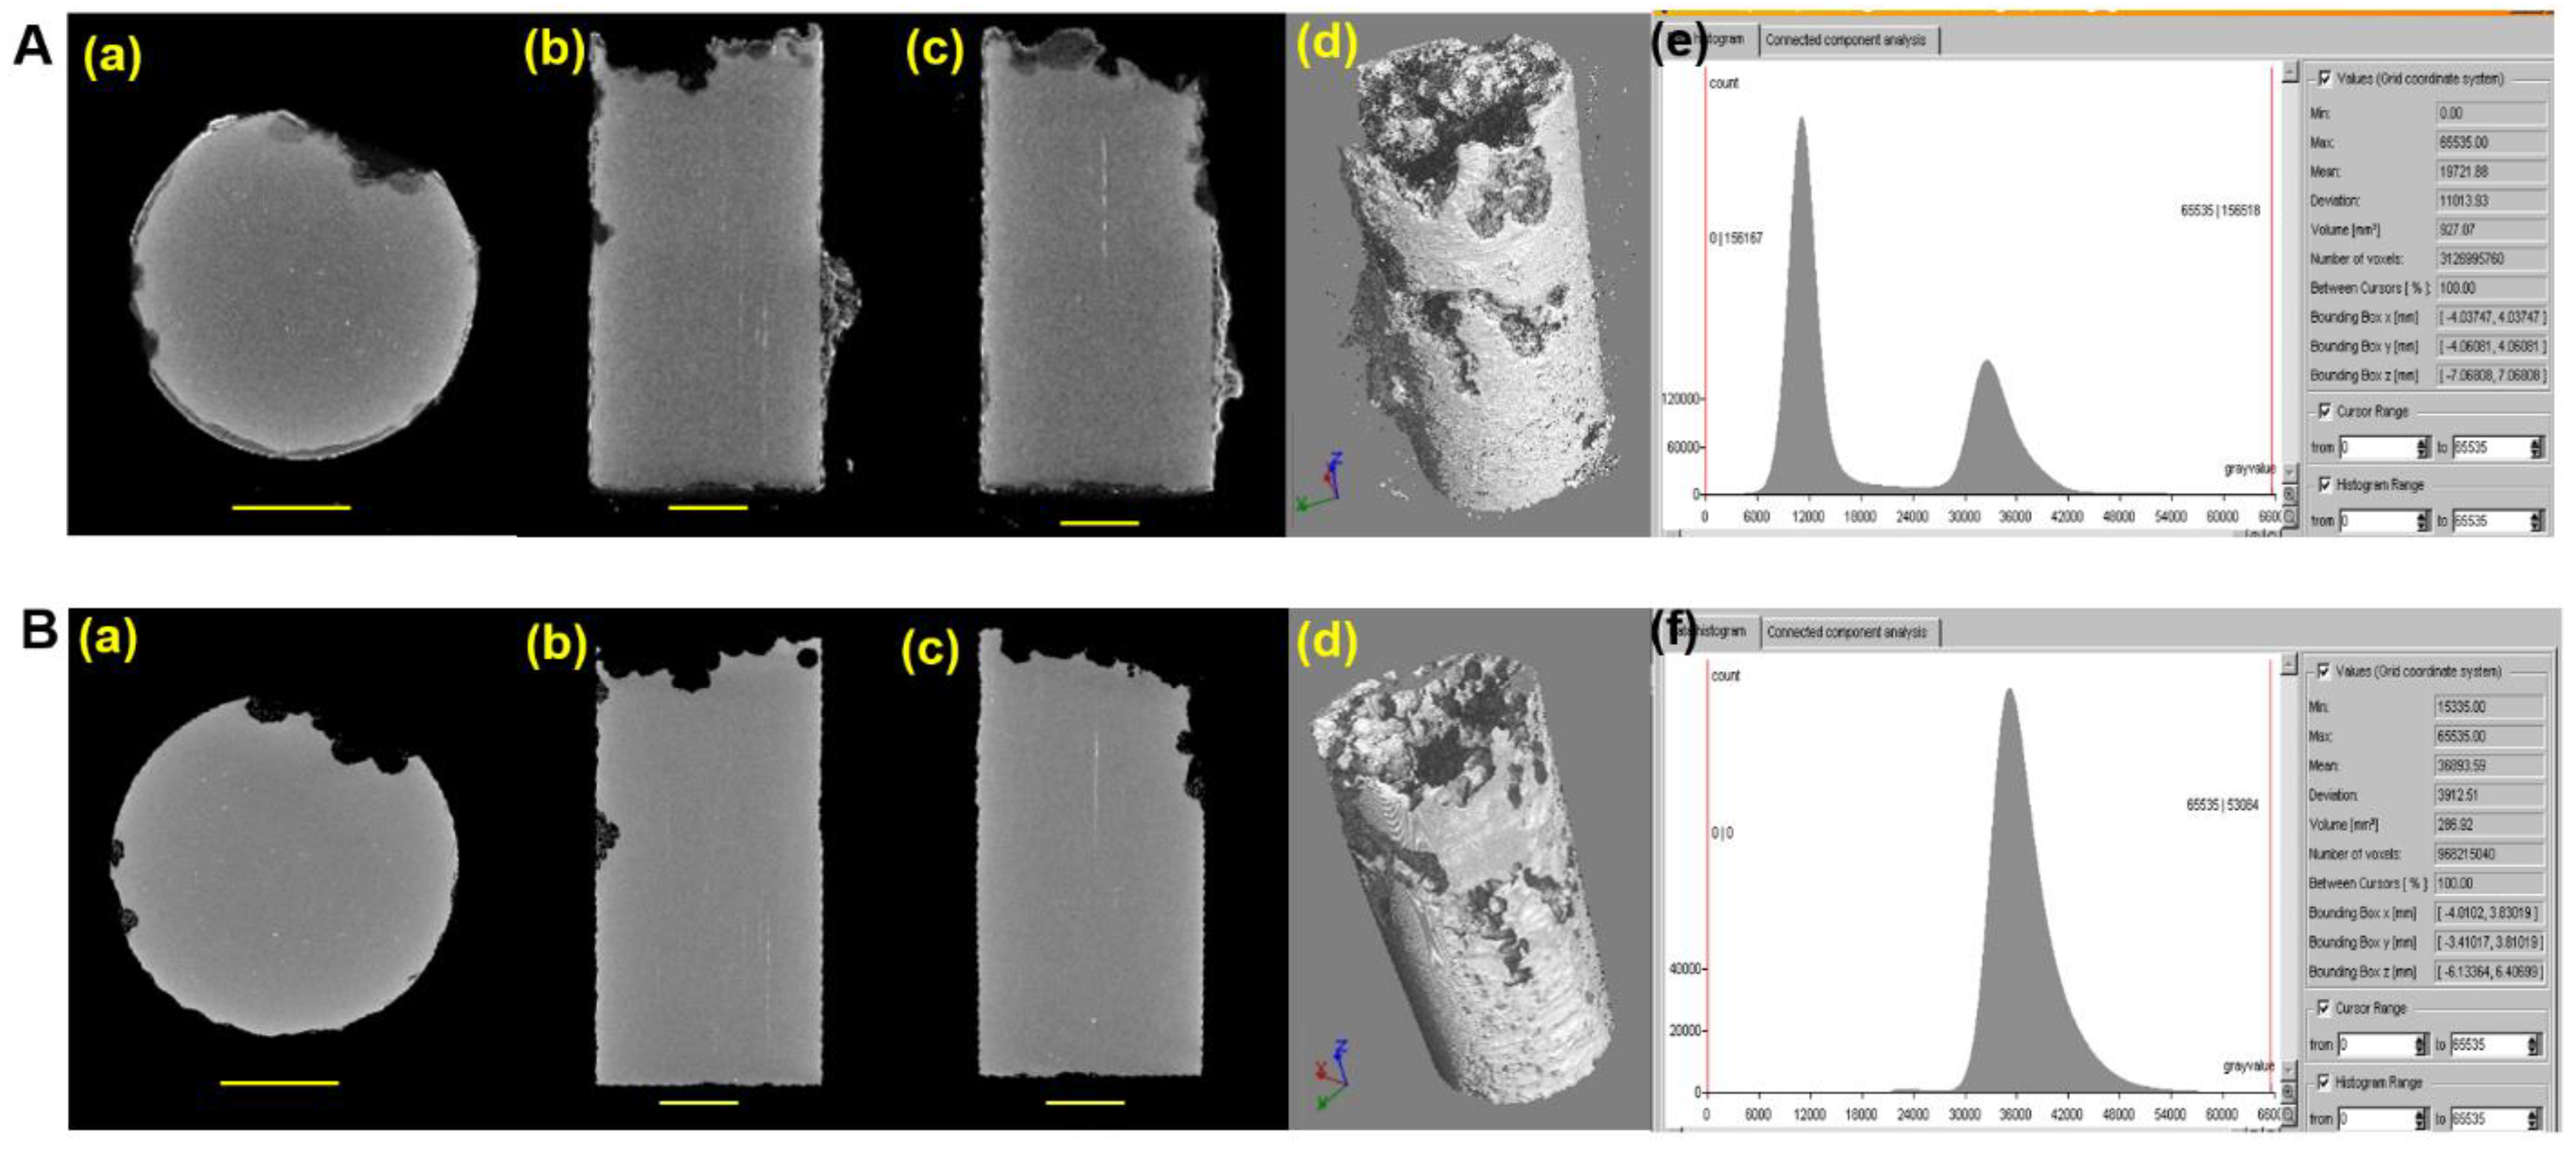
2.3. Corrosion Rate Calculation by Volume Loss and Mass Loss

The experiments to analyze corrosion rates were conducted based on the ASTM in vitro testing standard (ASTM-G31-72 [32]). Pure Zn, Mg and Mg alloys were scanned by micro-computed tomography (micro-CT, GE Phoenix Nanotom-M™, GE Sensing & Inspection Technologies GmbH, Boston, MA, USA). The materials were scanned at 6.7 μm voxel resolution with X-ray emission parameters 110 kV, 90 μA. Each rotational position 2D X-ray was collected from averaging 3 images. The volumes were reconstructed using Phoenix datos|x software. The volume of residual samples was calculated using VG Studio Max software (v 2.1). The micro-CT images before and after removing corrosion product (Figure 3) were used in the software to calculate the volume loss.
Calculated change in volume used numerically to compute the volume loss. The empirical equation for corrosion rates determination from volume change of individual samples [25] is given as:
CR = V A · t
where:
CR: Corrosion rate (mm/year);
ΔV: reduction in volume that is equal to the remaining implant volume subtracted from the initial implant volume (mm3);
A: the initial surface area exposed to corrosion (mm2);
t: immersion time (year).
The mass loss obtained from by subtracting the corroded mass (mass without corrosion products) from the original mass of degradable samples. The corrosion rate unit used here chosen to be consistent with the literature in this dissertation. The empirical equation used to compute corrosion rate of magnesium by mass loss as the following formula [33]:
CR = K · W D · A · t
where:
CR: Corrosion rate (mm/year);
K: the constant, 8.76 × 10⁴;
ΔW: weight loss, which is calculated by reduction of corrosion products-removed remaining mass from initial mass (mg);
D: density of alloy (g/cm3);
A: the initial surface area exposed to corrosion (cm2);
t: immersion time (hour).

2.4. Statistical Analysis

Statistical analysis (one-way ANOVA and t-test) of released hydrogen volume and corrosion rates were performed in MS Excel. Significance was established at p < 0.05. Data are expressed as mean ± standard deviation (SD).

3. Results

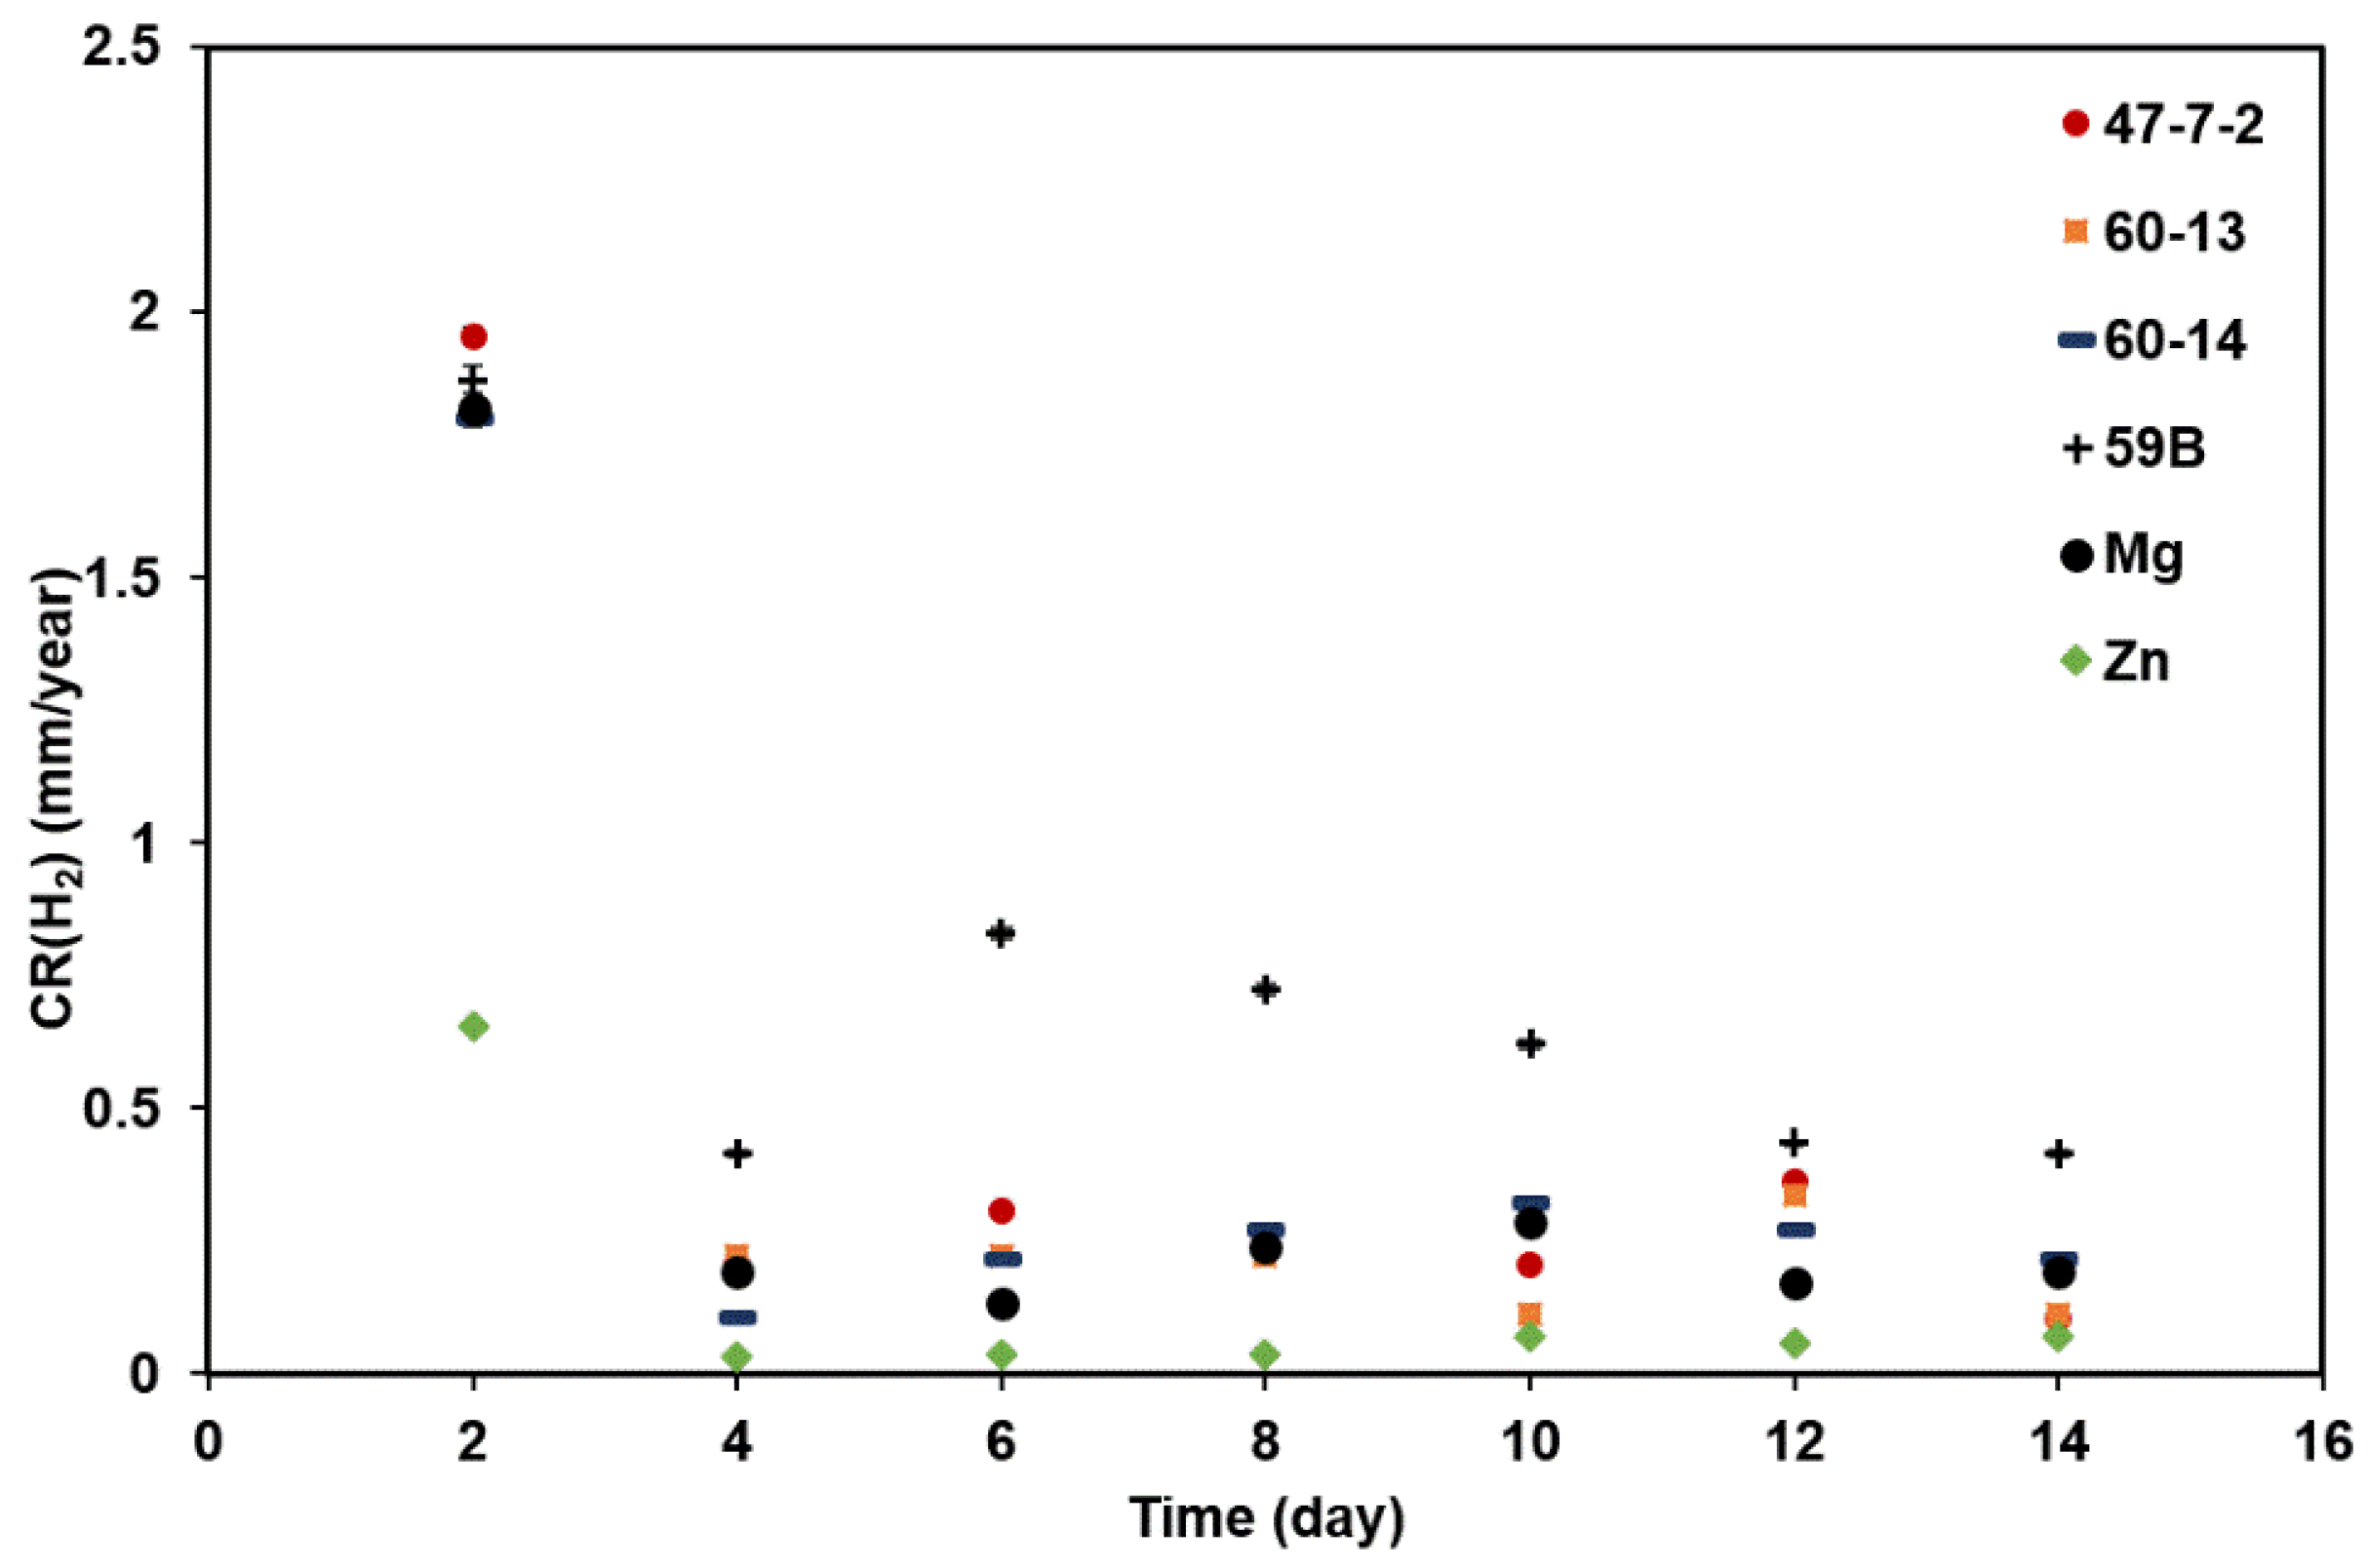
3.1. Real-Time Corrosion Rate by Hydrogen Evolution

The volume of hydrogen evolution from Mg and its alloys in HBSS in the eudiometer system was measured every 48 h (Figure 4). All samples were observed to have a burst of corrosion initially as measured by the relatively high volumes at day 2. Pure Zn had the lower initial corrosion rate than other alloys (p < 0.05). Evolution of hydrogen gas became steady after the 4th day of immersion time. Mg alloy, 59B, released significant hydrogen volume during immersion compared with other alloys (p < 0.05).

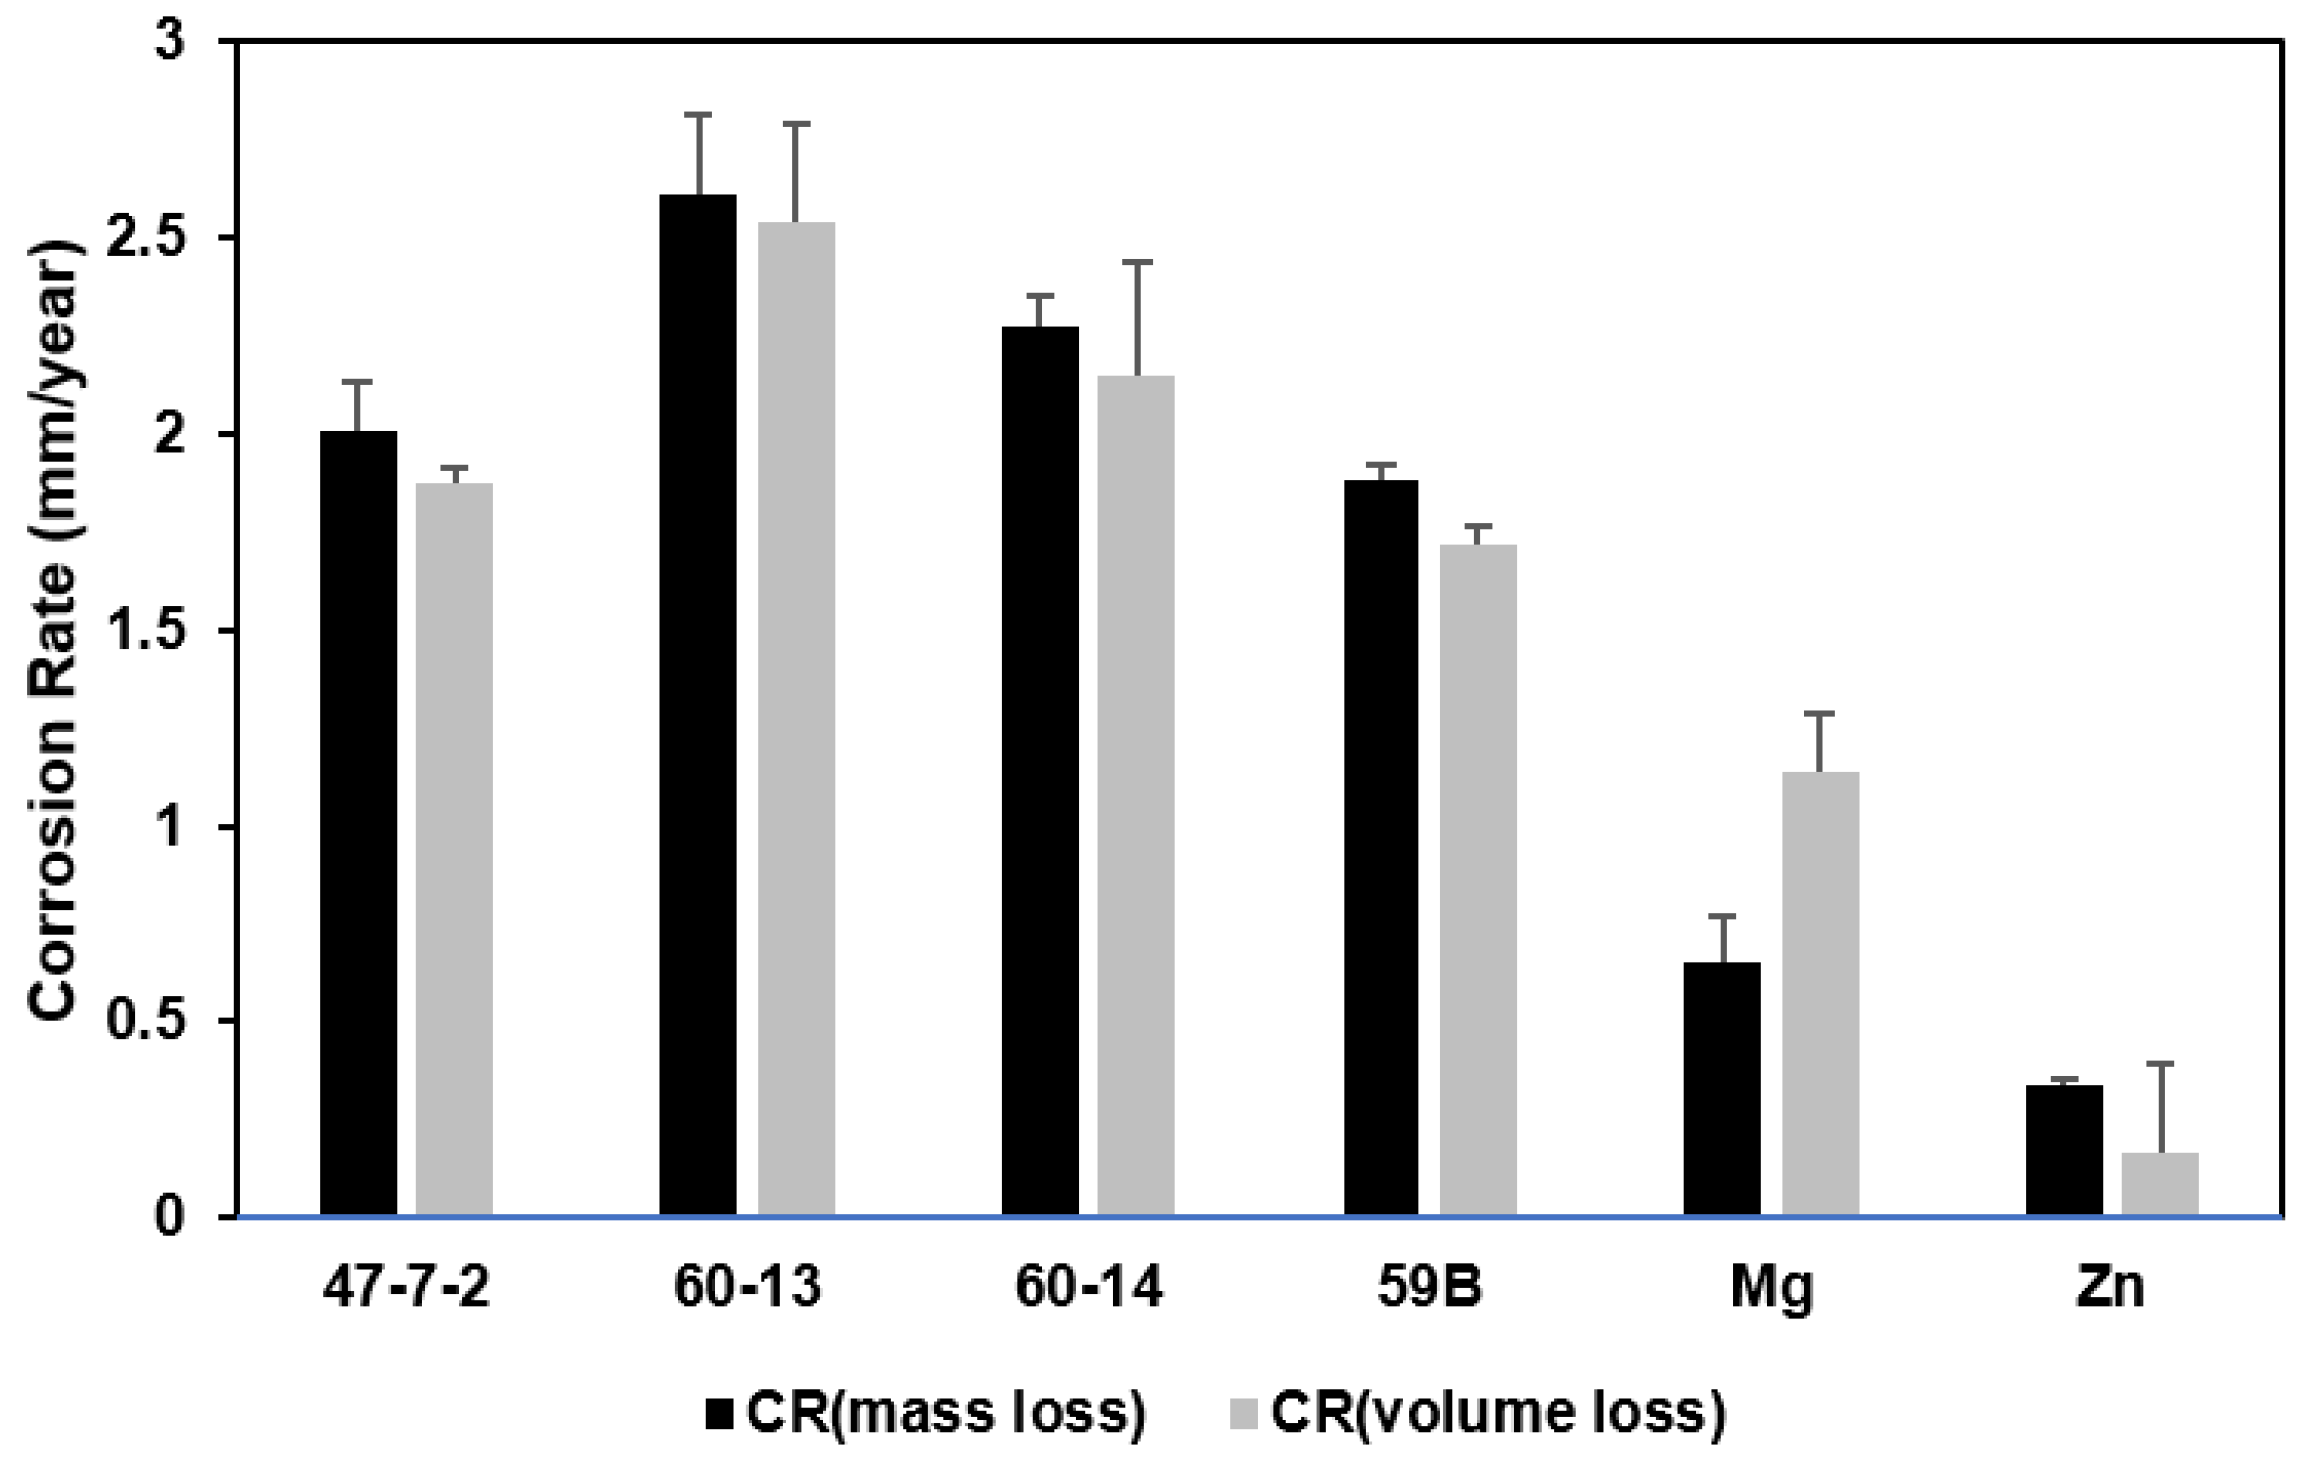
3.2. Corrosion Rates

The sample morphologies after corrosion for 30 days’ test in the eudiometer system were collected from micro-CT data of the samples after removing corrosion product (Figure 5). The selected side and front views are at the center of the sample rod. The corrosion morphologies of pure Mg and Zn showed less corrosion than the other Mg-based alloys. Corrosion rates calculated based on volume loss according to Equation (1) are shown in Figure 6. Corrosion rates calculated by mass loss were also shown in Figure 6. The corrosion rates calculated from high to low are: 60–13 ≈ 60–14 ≈ 47–7–2 > 59B > Mg > Zn (p < 0.05). The corrosion rates of tested alloys calculated by mass loss had no significant difference with that calculated by volume loss (p > 0.05).

4. Discussion

There was steep drop in corrosion rates of tested alloys calculated by hydrogen volume (Figure 4). This was due to the formation of corrosion products, which formed a layer on alloy surfaces, protecting alloys from further corrosion [34,35,36]. Pure Zn had significant lower initial corrosion rate calculated by hydrogen evolution (Figure 4) indicating that pure Zn had better initial corrosion resistance. The corrosion rates calculated by hydrogen evolution was real-time with multiple time points, however, the overall corrosion rates were calculated by mass loss and volume loss in this study.
By the volume loss and mass loss methods, the corrosion rates of pure Mg are higher than that of pure Zn calculated by volume loss and mass loss. This result is consistent with published data [37]. Corrosion rates of pure Zn and Mg were relatively lower than tested alloys. This was due to possible impurity and secondary intermetallic phase of alloying elements (Zn, Ca, and Zr), which may induce galvanic corrosion [38,39,40]. The volume loss and mass loss data are consistent to calculate the corrosion rates of the six biodegradable samples, since there is no significant difference between volume loss and mass loss in corrosion rates calculation of all tested alloys. A lot of researchers measured the corrosion rates in various conditions by volume loss and mass loss [25]. Corrosion rates are calculated by volume loss when: (1) the tested samples are too small to measure mass loss (e.g., Mg wire [31]); (2) the change of mass is not measurable due to the short corrosion duration [30,31]; or (3) the corrosion product is not accessible to remove (e.g., in vivo [25]). Micro-CT can provide high resolution of three-dimensional images of small and light samples, and the volume changed can be measured by the software and corrosion rates can be calculated by Equation (1). However, equipment access is often limited. Not every lab can afford to maintain micro-CT equipment. Mass loss method provides the most accessible way to calculate the corrosion rates. By measuring the weight of the intact sample material before and after corrosion (after corrosion product removal), the corrosion rate can be calculated according to Equation (2).
The eudiometer system allowed real-time record of hydrogen evolution volume and corrosion rate changing over time. The initial burst of corrosion rate (Figure 4) indicates the importance of initial corrosion resistance of biodegradable material. The difficulty of using hydrogen volume to calculate corrosion rate is that the eudiometer has to be calibrated and well-sealed, since dihydrogen is the smallest molecule [41]. A eudiometer is recommended when the experiment duration is long and there are multiple measurements of time points. By a well-sealed eudiometer system, the real-time hydrogen evolution results can facilitate monitoring the process of corrosion without touching the samples. However, to measure volume and mass in different time points in a long-term experiment, the samples must be handled to measure the mass loss or volume loss, and there is a risk of damage to the sample to measure the mass or volume multiple times.

5. Conclusions

Corrosion rates calculated by mass loss, volume loss, and hydrogen evolution volume are selected according to the experimental design. Mass loss and volume loss provided consistent corrosion rate and are recommended to be used in experiments with few time points to minimize the damage during the measuring process. Eudiometer can provide better real-time measurement of alloys’ corrosion rates according to hydrogen volume evolution. Eudiometer allows the access of measurement without touching the samples, which is not accessible by mass loss and volume loss.

Author Contributions

Conceptualization was contributed by K.G., B.C., and Y.Y.; Methodology was designed and performed by K.G., B.C., H.Z., and Y.Y., Validation was done by L.L. and B.C.; Formal Analysis was done by L.L. and B.C.; Investigation Resources was from Z.X. and B.C.; Data Curating was done by L.L. and B.C.; Original Draft Preparation was written by L.L.; Writing—Review and Editing was done by L.L., B.C., and Y.Y.; Supervision was Y.Y.; Project Administration was B.C., J.S., and Y.Y.; Funding acquisition was from J.S., Y.L., and Y.Y.

Funding

This work was partially funded by NIH NIGMS grant (NIH-ISC3GM113728), NSF EAGER (NSF-1649243), and NSF ERC-RMB (NSF-0812348).

Acknowledgments

The authors thank the support from all colleagues of National Science Foundation (NSF) Engineering Research Center (ERC) for Revolutionizing Metallic Biomaterials (RMB) at North Carolina A&T State University.

Conflicts of Interest

The authors declare no conflict of interest.

References

  1. Staiger, M.P.; Pietak, A.M.; Huadmai, J.; Dias, G. Magnesium and its alloys as orthopedic biomaterials: A review. Biomaterials 2006, 27, 1728–1734. [Google Scholar] [CrossRef] [PubMed]
  2. Yang, K.; Tan, L. Corrosion Prevention of Magnesium Alloys: 19. Control of Biodegradation of Magnesium (Mg) Alloys for Medical Applications; Elsevier Inc.: New York, NY, USA, 2013. [Google Scholar]
  3. Zhang, X.; Zhao, Z.; Wu, F.; Wang, Y.; Wu, J. Corrosion and wear resistance of az91d magnesium alloy with and without microarc oxidation coating in hank’s solution. J. Mater. Sci. 2007, 42, 8523–8528. [Google Scholar] [CrossRef]
  4. Carter, A.J.; Aggarwal, M.; Kopia, G.A.; Tio, F.; Tsao, P.S.; Kolata, R.; Yeung, A.C.; Llanos, G.; Dooley, J.; Falotico, R. Long-term effects of polymer-based, slow-release, sirolimus-eluting stents in a porcine coronary model. Cardiovasc. Res. 2004, 63, 617–624. [Google Scholar] [CrossRef] [PubMed] [Green Version]
  5. Chen, D.; He, Y.; Tao, H.; Zhang, Y.; Jiang, Y.; Zhang, X.; Zhang, S. Biocompatibility of magnesium-zinc alloy in biodegradable orthopedic implants. Int. J. Mol. Med. 2011, 28, 343–348. [Google Scholar] [PubMed] [Green Version]
  6. Gong, H.; Wang, K.; Strich, R.; Zhou, J.G. In vitro biodegradation behavior, mechanical properties, and cytotoxicity of biodegradable Zn–Mg alloy. J. Biomed. Mater. Res. Part B Appl. Biomater. 2015, 103, 1632–1640. [Google Scholar] [CrossRef] [PubMed]
  7. Brar, H.S.; Platt, M.O.; Sarntinoranont, M.; Martin, P.I.; Manuel, M.V. Magnesium as a biodegradable and bioabsorbable material for medical implants. JomUs 2009, 61, 31–34. [Google Scholar] [CrossRef]
  8. Cha, P.R.; Han, H.S.; Yang, G.F.; Kim, Y.C.; Hong, K.H.; Lee, S.C.; Jung, J.Y.; Ahn, J.P.; Kim, Y.Y.; Cho, S.Y.; et al. Biodegradability engineering of biodegradable Mg alloys: Tailoring the electrochemical properties and microstructure of constituent phases. Sci. Rep. 2013, 3, 2367. [Google Scholar] [CrossRef] [PubMed]
  9. Hermawan, H.; Dube, D.; Mantovani, D. Developments in metallic biodegradable stents. Acta Biomater. 2010, 6, 1693–1697. [Google Scholar] [CrossRef] [PubMed]
  10. Yun, Y.H.; Dong, Z.Y.; Lee, N.; Liu, Y.J.; Xue, D.C.; Guo, X.F.; Kuhlmann, J.; Doepke, A.; Halsall, H.B.; Heineman, W.; et al. Revolutionizing biodegradable metals. Mater. Today 2009, 12, 22–32. [Google Scholar] [CrossRef]
  11. Jang, Y.; Collins, B.; Sankar, J.; Yun, Y. Effect of biologically relevant ions on the corrosion products formed on alloy az31b: An improved understanding of magnesium corrosion. Acta Biomater. 2013, 9, 8761–8770. [Google Scholar] [CrossRef] [PubMed]
  12. Windhagen, H.; Radtke, K.; Weizbauer, A.; Diekmann, J.; Noll, Y.; Kreimeyer, U.; Schavan, R.; Stukenborg-Colsman, C.; Waizy, H. Biodegradable magnesium-based screw clinically equivalent to titanium screw in hallux valgus surgery: Short term results of the first prospective, randomized, controlled clinical pilot study. Biomed. Eng. Online 2013, 12, 62. [Google Scholar] [CrossRef] [PubMed]
  13. Witte, F.; Feyerabend, F.; Maier, P.; Fischer, J.; Stormer, M.; Blawert, C.; Dietzel, W.; Hort, N. Biodegradable magnesium-hydroxyapatite metal matrix composites. Biomaterials 2007, 28, 2163–2174. [Google Scholar] [CrossRef] [PubMed]
  14. Gastaldi, D.; Sassi, V.; Petrini, L.; Vedani, M.; Trasatti, S.; Migliavacca, F. Continuum damage model for bioresorbable magnesium alloy devices—Application to coronary stents. J. Mech. Behav. Biomed. Mater. 2011, 4, 352–365. [Google Scholar] [CrossRef] [PubMed]
  15. Henderson, S.E.; Verdelis, K.; Maiti, S.; Pal, S.; Chung, W.L.; Chou, D.T.; Kumta, P.N.; Almarza, A.J. Magnesium alloys as a biomaterial for degradable craniofacial screws. Acta Biomater. 2014, 10, 2323–2332. [Google Scholar] [CrossRef] [PubMed] [Green Version]
  16. Kramer, M.; Schilling, M.; Eifler, R.; Hering, B.; Reifenrath, J.; Besdo, S.; Windhagen, H.; Willbold, E.; Weizbauer, A. Corrosion behavior, biocompatibility and biomechanical stability of a prototype magnesium-based biodegradable intramedullary nailing system. Mater. Sci. Eng. C Mater. Biol. Appl. 2016, 59, 129–135. [Google Scholar] [CrossRef] [PubMed]
  17. Mao, L.; Yuan, G.; Niu, J.; Zong, Y.; Ding, W. In vitro degradation behavior and biocompatibility of Mg-Nd-Zn-Zr alloy by hydrofluoric acid treatment. Mater. Sci. Eng. C Mater. Biol. Appl. 2013, 33, 242–250. [Google Scholar] [CrossRef] [PubMed]
  18. Song, G.L.; Song, S.Z. A possible biodegradable magnesium implant material. Adv. Eng. Mater. 2007, 9, 298–302. [Google Scholar] [CrossRef]
  19. Kirkland, N.T.; Birbilis, N.; Staiger, M. Assessing the corrosion of biodegradable magnesium implants: A critical review of current methodologies and their limitations. Acta Biomater. 2012, 8, 925–936. [Google Scholar] [CrossRef] [PubMed]
  20. Pellicer, E.; Gonzalez, S.; Blanquer, A.; Surinach, S.; Baro, M.D.; Barrios, L.; Ibanez, E.; Nogues, C.; Sort, J. On the biodegradability, mechanical behavior, and cytocompatibility of amorphous Mg72 Zn23 Ca5 and crystalline Mg70 Zn23 Ca5 Pd2 alloys as temporary implant materials. J. Biomed. Mater. Res. A 2013, 101, 502–517. [Google Scholar] [CrossRef] [PubMed]
  21. Witte, F.; Fischer, J.; Nellesen, J.; Crostack, H.A.; Kaese, V.; Pisch, A.; Beckmann, F.; Windhagen, H. In vitro and in vivo corrosion measurements of magnesium alloys. Biomaterials 2006, 27, 1013–1018. [Google Scholar] [CrossRef] [PubMed]
  22. Srinivasan, A.; Blawert, C.; Huang, Y.; Mendis, C.; Kainer, K.; Hort, N. Corrosion behavior of Mg–Gd–Zn based alloys in aqueous nacl solution. J. Magnes. Alloy. 2014, 2, 245–256. [Google Scholar] [CrossRef]
  23. Gu, X.-N.; Zheng, Y.-F. A review on magnesium alloys as biodegradable materials. Front. Mater. Sci. China 2010, 4, 111–115. [Google Scholar] [CrossRef]
  24. Pietak, A.; Mahoney, P.; Dias, G.J.; Staiger, M.P. Bone-like matrix formation on magnesium and magnesium alloys. J. Mater. Sci. Mater. Med. 2008, 19, 407–415. [Google Scholar] [CrossRef] [PubMed]
  25. Witte, F.; Fischer, J.; Nellesen, J.; Crostack, H.-A.; Kaese, V.; Pisch, A.; Beckmann, F.; Windhagen, H. In vitro and in vivo corrosion measurements of magnesium alloys. Biomaterials 2006, 27, 1013–1018. [Google Scholar] [CrossRef] [PubMed]
  26. Wong, H.M.; Yeung, K.W.; Lam, K.O.; Tam, V.; Chu, P.K.; Luk, K.D.; Cheung, K.M. A biodegradable polymer-based coating to control the performance of magnesium alloy orthopaedic implants. Biomaterials 2010, 31, 2084–2096. [Google Scholar] [CrossRef] [PubMed] [Green Version]
  27. Ren, Y.; Huang, J.; Zhang, B.; Yang, K. Preliminary study of biodegradation of AZ31B magnesium alloy. Front. Mater. Sci. China 2007, 1, 401–404. [Google Scholar]
  28. Sanchez, A.H.M.; Luthringer, B.J.; Feyerabend, F.; Willumeit, R. Mg and Mg alloys: How comparable are in vitro and in vivo corrosion rates? A review. Acta Biomater. 2015, 13, 16–31. [Google Scholar] [CrossRef] [PubMed] [Green Version]
  29. Kraus, T.; Fischerauer, S.F.; Hänzi, A.C.; Uggowitzer, P.J.; Löffler, J.F.; Weinberg, A.M. Magnesium alloys for temporary implants in osteosynthesis: In vivo studies of their degradation and interaction with bone. Acta Biomater. 2012, 8, 1230–1238. [Google Scholar] [CrossRef] [PubMed]
  30. Liu, L.; Koo, Y.; Collins, B.; Xu, Z.; Sankar, J.; Yun, Y. Biodegradability and platelets adhesion assessment of magnesium-based alloys using a microfluidic system. PLoS ONE 2017, 12, e0182914. [Google Scholar] [CrossRef] [PubMed]
  31. Wang, J.; Liu, L.; Wu, Y.; Maitz, M.F.; Wang, Z.; Koo, Y.; Zhao, A.; Sankar, J.; Kong, D.; Huang, N. Ex vivo blood vessel bioreactor for analysis of the biodegradation of magnesium stent models with and without vessel wall integration. Acta Biomater. 2017, 50, 546–555. [Google Scholar] [CrossRef] [PubMed] [Green Version]
  32. ASTM International. Standard Practice for Laboratory Immersion Corrosion Testing of Metals; ASTM-G31–72; ASTM: West Conshohocken, PA, USA, 2004. [Google Scholar]
  33. Bowen, R. Geothermal Resources; Springer Science & Business Media: Berlin, Germany, 2012. [Google Scholar]
  34. Shaw, B.A. Corrosion resistance of magnesium alloys. ASM Handb. 2003, 13, 692–696. [Google Scholar]
  35. Persaud-Sharma, D.; McGoron, A. Biodegradable Magnesium Alloys: A Review of Material Development and Applications. J. Biomim. Biomater. Tissue Eng. 2011, 12, 25–39. [Google Scholar] [CrossRef] [PubMed]
  36. Feliu, S., Jr.; Llorente, I. Corrosion product layers on magnesium alloys AZ31 and AZ61: Surface chemistry and protective ability. Appl. Surf. Sci. 2015, 347, 736–746. [Google Scholar] [CrossRef] [Green Version]
  37. Cheng, J.; Liu, B.; Wu, Y.; Zheng, Y. Comparative in vitro study on pure metals (Fe, Mn, Mg, Zn and W) as biodegradable metals. J. Mater. Sci. Technol. 2013, 29, 619–627. [Google Scholar] [CrossRef]
  38. Lambertin, D.; Rooses, A.; Frizon, F. Galvanic corrosion of Mg-Zr alloy and steel or graphite in mineral binders. In Magnesium Technology 2013; Springer: Cham, Switzerland, 2013; pp. 153–155. [Google Scholar]
  39. Radha, R.; Sreekanth, D. Insight of magnesium alloys and composites for orthopedic implant applications—A review. J. Magnes. Alloy. 2017, 5, 286–312. [Google Scholar] [CrossRef]
  40. Song, G.; Johannesson, B.; Hapugoda, S.; StJohn, D. Galvanic corrosion of magnesium alloy AZ91D in contact with an aluminium alloy, steel and zinc. Corros. Sci. 2004, 46, 955–977. [Google Scholar] [CrossRef]
  41. Sekimoto, S.; Nakagawa, H.; Okazaki, S.; Fukuda, K.; Asakura, S.; Shigemori, T.; Takahashi, S. A fiber-optic evanescent-wave hydrogen gas sensor using palladium-supported tungsten oxide. Sens. Actuators B Chem. 2000, 66, 142–145. [Google Scholar] [CrossRef]
Figure 1. Grain micro-structures of tested biodegradable alloys. Grain sizes in diameter are: D (47–7–2) = 17 ± 16 μm, D (59B) = 11 ± 5 μm, D (Mg) = 60 ± 19 μm, D (Zn) = 78 ± 43 μm, D (60-13) and D (60-14) <1 μm.
Applsci 08 01459 g001
Figure 2. Eudiometer system. (A) Schematic design of one eudiometer; (B) image of eudiometer system.
Applsci 08 01459 g002
Figure 3. Images of micro-CT example procedure. Micro-CT images and volume analysis of a selected sample with corrosion product (A) and after corrosion product removed (B): (a) cross section view; (b) front view; (c) side view, (d) 3D view; (e) VG Studio Max analysis of greyscale histogram of cylinder B and background; (f) VG Studio Max analysis of greyscale histogram of digitally isolated (segmented) cylinder B. Scale bar = 2 mm.
Applsci 08 01459 g003
Figure 4. Real-time corrosion rate based on hydrogen evolution every two days.
Applsci 08 01459 g004
Figure 5. Micro-CT images of tested alloys of front view and vertical section view.
Applsci 08 01459 g005
Figure 6. Corrosion rates of tested alloys calculated by mass loss and volume loss in the eudiometer system.
Applsci 08 01459 g006
Table 1. Mechanical composition of tested alloys.
AlloysComposition
47–7–2Zn 1% wt., Ca < 0.5% wt., Mg remainder
60–13Zn 4% wt., REE 1% wt., Zr 1% wt., Mg 94% wt.
60–14Zn 3% wt., REE < 0.5% wt., Zr 1% wt., Mg remainder
59BZn 1% wt., Ca < 0.5% wt., REE 1% wt., Mg remainder
Mg≥99.99% Mg
Zn≥99.99% Zn

