Article

Measurement and Quantification of Effective Slip Length at Solid–Liquid Interface of Roughness-Induced Surfaces with Oleophobicity

Key Laboratory of Micro-Systems and Micro-Structures Manufacturing, Ministry of Education, School of Mechatronics Engineering, Harbin Institute of Technology, Harbin 150001, China
*
Author to whom correspondence should be addressed.
Appl. Sci. 2018, 8(6), 931; https://doi.org/10.3390/app8060931
Submission received: 16 May 2018 / Revised: 28 May 2018 / Accepted: 29 May 2018 / Published: 5 June 2018
(This article belongs to the Special Issue Nanofluids and Their Applications)

Abstract

:

Featured Application

Our study focuses on inhibiting hydrodynamic drag in many applications of mirco-/nano-fluidic channels, including micro-/nano-electromechanical systems (MEMS/NEMS), micro-/nano-fluidic systems, confined biological system, etc.

Abstract

Boundary conditions of the liquid–solid interface of micro/nano fluid flow are of great interest, as slippage is linked with decreased drag. However, previous studies have seldom included a systematic analysis of the effect of roughness on the measurement and quantification of slip length. For the measurement of slip length using atomic force microscopy (AFM), which is believed to be the most accurate method, a theoretical description of the drainage of thin liquid films between sphere and surface, with realistic roughness, is yet to be published. This study focuses on the measurement and quantification of slip length on rough surfaces immersed in liquids, based on AFM and laser confocal scanning microscopy. A reformulation of the boundary condition is presented, taking into account the effect of surface roughness. The correction to the effective slip length is analyzed, then surfaces with various degrees of spacing roughness Rsm were fabricated. Quantitative analysis of the effective slip length is presented. Results show that the corrected effective slip length remains constant with increased spacing roughness Rsm of surfaces. The results are discussed for the coagulation process of colloids and measurement of slip lengths on roughness-induced surfaces with AFM.

Graphical Abstract

1. Introduction

At the micro or nano scale, fluid flow is subjected to high drag with decreasing dimensions and increasing surface-to-volume ratio in confined systems. Reducing hydrodynamic drag is a crucial issue in many applications of micro-/nano-fluidic channels, including micro-/nano-electromechanical systems (MEMS/NEMS), micro-/nano-fluidic systems, confined biological systems, etc., and has been of wide scientific interest [1]. It is obvious that boundary conditions at the solid–liquid interface have a direct influence on hydrodynamic drag, as published studies show that boundary slip is believed to inhibit hydrodynamic drag [2,3,4,5].
Slippage of fluid flow at the solid–liquid interface, the so-called boundary slip, is of great importance in hydrodynamics. Boundary slip is characterized by slip length according to Navier’s slip condition [6], via v = b d v d y | y = 0 , where b is the slip length, v is the tangential velocity, and y is the axis perpendicular to the wall. At the micro or nano scale, slip lengths of various surfaces immersed in liquid have been investigated in theoretical and experimental studies [7,8,9,10,11,12,13,14,15,16,17]. For the measurement technique, slip length can be derived via measurement of surface force or hydrophobic force using surface force apparatus (SFA) or atomic force microscopy (AFM). Vinogradova [18,19,20] investigated the drainage of a thin liquid film confined between two spheres, where hydrophobic force could apply to obtain slip length by employing Navier’s slip condition for liquid flow near the surface. Fang and Mi [21] presented a reformulation of the hydrodynamic conditions based on Vinogradova’s work, taking into account the boundary curvature effects of spheres. The Reynolds equation for hydrodynamic lubrication is generalized to obtain analytic expressions of the pressure and drag force for arbitrary values of slip length and for arbitrary radii of the approaching sphere, which has been widely used. Zhu and Granick [22] studied boundary slip on chemically modified octadecyltrichlorosilane (OTS) and octadecyltriethoxysilane (OTE) samples by using SFA. The Craig group [23] utilized AFM to measure the slip length of deionized (DI) water on silicon wafers roughened by treatment with KOH. The Bhushan group [24,25] studied boundary slip on SiO2 particle composite-coated surfaces with varying degrees of roughness by using AFM.
Roughness is believed to have an effect on measurement. For the technique using hydrodynamic forces to derive slip length on a rough surface, the measured slip length should be replaced by the effective slip length. However, previous studies have not included the effect of roughness on measurement and quantification, and the positions of the “reference surface,” i.e., the surface from which the slip velocity is determined, in boundary slip measurement are ambiguous. For the technique using hydrodynamic forces to derive the slip, different choices of reference surface can lead to a shift of the fitting force curve and result in different calculated values of slip length, as pointed out by the Vinogradova group [20] and Craig group [26]. Studies have focused on smooth surfaces, and set the reference surface at the peak of the surface. If the reference surface is located on the peak of the rough surface, the calculated value of the measured slip length will tend to be larger than the true value, as the liquid molecules can still flow between the peaks and valleys. Thus, studies on the boundary slip of surfaces with various degrees of roughness must locate the position of the reference surface. Kunert and Harting [27] investigated slippage lengths on randomly generated surfaces with Gaussian distribution heights, and reported that slippage was independent of detailed surface profile, and they suggested that the location of the reference surface was related to Ra roughness. A complete theoretical description of reference surface on realistic surface roughness to derive effective slip length is yet to be published. Surface roughness most commonly refers to the average height and width of the topography relative to a reference plane, and it can be characterized by amplitude roughness and spacing roughness. Studies have reported the effect of amplitude roughness on slip length; however, there is no experimental data on the effect of spacing roughness. Investigating the boundary conditions for the flow of liquids on surfaces with varying spacing roughness can provide a fundamental understanding of the interaction of solid and liquid at interfaces.
In this paper, the effect of roughness on effective slip length at the solid–liquid interface was investigated. We reformulate the theory of thin liquid film drainage between sphere and superoleophobic/superoleophilic surfaces, taking into account the roughness effect. A measurement technique is established to obtain effective slip length on roughness-induced surfaces immersed in oil by using AFM and laser confocal scanning microscopy. Due to the wide application of hexadecane and ethylene glycol in the lubrication and antifreeze of MEMS/NEMS, these two kinds of oil were selected. A series of multilayered compositing surfaces with adjusted roughness and the same chemical properties were fabricated, and then were used to investigate the effect of spacing roughness on effective slip length. The results and mechanisms are discussed in this paper.

2. Experiment

The measurement and quantification technique of effective slip length on roughness-induced superoleophilic/superoleophobic surfaces is described first. The location of the reference surface is discussed and the calculation of effective slip length is presented, followed by the procedures for preparing the superoleophilic and superoleophobic surfaces with varying degrees of spacing roughness and the oils used for the experimental study. Finally, measurement techniques of surface roughness and wetting properties are presented.

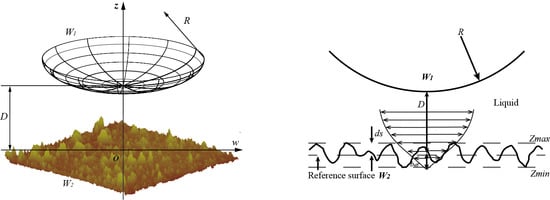
2.1. Measurement of Slip Length by AFM

An AFM in contact mode under liquid was used to measure slip length [18]. A colloidal AFM probe was prepared by gluing a borosilicate sphere to the end of a rectangular AFM cantilever (ORC 8, Bruker, Billerica, MA, USA). As shown in Figure 1, the borosilicate sphere was driven toward the surface immersed in liquid at a certain driving velocity, and the hydrodynamic force detected on the probe as a function of deflection was recorded. The measured deflection data of the probe was used to calculate the hydrodynamic force data using Hooke’s law (Fhydro = k × Def, where Fhydro is the hydrodynamic force, k is the stiffness of the AFM probe, and Def is the deflection of the probe).
For smooth surfaces, the hydrodynamic force can be written in the limit of large separation distance (D >> b) as [28]:
V F h y d r o = 1 6 π μ R 2 ( D + b ) ,
where V is the approaching velocity of the sphere, μ is the dynamic viscosity of the liquid, R is the radius of the sphere, and D is the separation distance between the surface and the bottom of the sphere. By analyzing the hydrodynamic force, electrostatic force, van der Waals force, and Stokes’ force obtained on the probe, the boundary slip can be calculated.

2.2. Quantitation of Effective Slip Length on the Rough Surface

For rough surfaces, drainage of the thin film between sphere and surface is investigated in order to determine the effective slip length, as shown in Figure 2. Consider a spherical particle W1 having radius R and a flat particle W2 immersed in the Newtonian liquid. W2 is located on the peak of the rough surface. We assume that the particles are sufficiently rigid that any deformation due to hydrodynamic pressure is negligible. The distance D between two particles is assumed to be much less than radius R (D << R). The particle W1 approaches W2 along the line connecting their centers with velocity v (the Reynolds problem). The origin of cylindrical coordinates (w, z) coincides with the W2 particle, with the z-axis oriented in the direction of W1.
In the inner region, which is close to the origin of the coordinates, the surfaces W1 and W2 can be expressed as follows:
{ z = D + 1 2 w 2 R + O ( w 4 ) W 1 z = 0 W 2 .
The steady-state flow between particles develops while in the approaching process, and the motion of liquid is axisymmetric and follows the continuity equation:
p w = μ 2 v w z 2 , p z = 0 ,
where p is the pressure of the liquid flow, μ is dynamic viscosity, and vw is the projection of the liquid flow rate on the w-axis. If the thin flow is incompressible liquid, then the system of motion equation takes the form:
1 w w ( w v w ) + v z z = 0 ,
where vz is the projection of the liquid flow rate on the z-axis.
The quantity of motion follows the w-component and z-component hydrodynamic equations:
{ ρ ( v z v w z + v w v w w ) = p w + μ [ 2 v w z 2 + 1 w w ( w v w w ) v w w 2 ] = μ w w ( w v w w ) μ v w w 2 ρ ( v z v z z + v w v z w ) = p z + μ [ 2 v z z 2 + 1 w w ( w v z w ) ] = μ 2 v z z 2 + μ w w ( w v z w ) ,
where ρ is the density of the liquid.
In order to characterize the state of the fluid flow, the boundary conditions of two surfaces are set. We assume that the solid–liquid interface of two surfaces is a Navier slip condition, and the slip lengths for surfaces W1 and W2 are b1 = b and b2 = k (b + 1), respectively. Therefore, the boundary condition of W1 is given by:
{ z = D + 1 2 w 2 R + O ( r 4 ) v z = z v z R + v = v v w = b ( k + 1 ) v w z ,
and the boundary condition of W2 is given by:
{ z = 0 v z = 0 v w = b v w z .
Assume the reference surface is located on the positon below surface W1 at a distance ds, as shown in Figure 3, and parallel to surface W1. The effective slip length for the reference surface is beff. Therefore, the boundary condition of the reference surface is given by:
{ z = d s v z = 0 v w = b e f f v w z .
In addition, assume that the pressure of the fluid outside the two surfaces is negligible, while w → ∞, p = 0.
The solution of Equation (3), taking into account boundary conditions (6) and (8), leads to an expression about vw:
v w = 1 2 μ p w [ z 2 z H ( H + 2 b e f f ( 1 + k ) H + b e f f ( 2 + k ) ) b H ( H + 2 b e f f ( 1 + k ) H + b e f f ( 2 + k ) ) ] ,
where H = D + 1 2 w 2 R . The solution of Equation (4), taking into account Equation (9) and integrating, leads to an expression about the relationship between v and z. This formula determines the differential equation for pressure. Integrating this formula two times, we obtain the expression for the hydrodynamic force of surface W1:
F h y d r o = 2 π w 0 + [ p ( w ) + 2 μ d v z d z ] d w = 6 π μ R 2 v D + d s f ,
where
f = b e f f b 2 ( D + d s ) 6 { [ 1 + b e f f b 2 ( D + d s ) ] ln [ 1 + 3 b e f f b 2 ( D + d s ) ] 1 } .
As the effective slip beff is much less than the distance between two surfaces, Equation (10) can be simplified as:
F h y d r o = 6 π μ R 2 v ( D + d s ) ( D + d s D + d s + b 2 + b e f f ) = 6 π μ R 2 v ( D + d s + b 2 + b e f f ) .
Note that the effective slip length is obtained by analyzing the velocity of liquid flow at the reference surface. Therefore, the velocity at the reference surface shall be representative of the average velocity of liquid flow between the peaks and valleys. According to the study of Pan et al. on the correction of slip length [29], the Rq roughness of the profile is a typical case to describe surface roughness based on the standard of International Organization for Standardization (ISO), and is suitable to describe the average velocity of liquid flow. The Rq roughness, which is defined as the Root Mean Square (RMS) value of the ordinate values within a sampling length, is selected to describe the amplitude of roughness in this paper, as it is more sensitive than Ra roughness, via R q = 1 l 0 l z ( x ) 2 d x . The position within the surface near the height of Rq on the surface is also a more reasonable choice than the tops of peaks. Thus, the reference surface is defined as the position of Rq roughness, and the height of asperities ds is defined by b e f f = b b 2 d s , via d s = R z R q .

2.3. Preparation of Superoleophilic and Superoleophobic Surfaces

To prepare the superoleophilic surface, layer-by-layer compositing surfaces were fabricated to prepare samples with varying spacing roughness [30]. Soda–lime glass (Cat. No. 7101, Sail Brand, Yancheng, China) with 1.0 mm thickness was used as a substrate. SiO2 nanoparticles with a diameter of 7 nm (Aerosil RX50, Evonik Industries, Essen, Germany) were used to form a layer of roughness-induced nanostructure. Methyltrichlorosilane was used to obtain a functional layer for the property of superoleophilicity. Polydiallyldimethylammonium chloride (PDDA) was used to adsorb particles of each layer. The procedure was applied three times to the substrates with a spray-coating method using a spray gun (Airbrush-S130, U-star Company, Hong Kong, China) at a distance of about 15 cm and a pressure of 200 kPa, as shown in Figure 4a. Then the samples were annealed in an oven at 140 °C for 1 h. For the chemical vapor deposition (CDV) process, a drop of methyltrichlorosilane (methylsilane, Sigma Aldrich, St. Louis, MO, USA) was deposited near the samples to form a functional layer, which was then sealed and left for 10 h. Figure 4b shows that the SiO2 nanoparticles coalesced to a larger group and enhanced volume with increasing concentration from 10 mg mL−1 to 15 mg mL−1. Therefore, pitches with increasing average width of the roughness pitch (Rsm roughness) were formed on the surfaces. There were five groups of samples (a1 to a5) for superoleophilic surface.
To prepare the superoleophobic surface, the same substrate and processes as for the superoleophilic samples were used, except for the final step. The fluorosurfactant solution (1 mL) was coated as a functional layer with spray deposition, and the samples were allowed to air-dry for 10 h. When the SiO2 nanoparticles increased from 10 mg mL−1 to 15 mg mL−1, a topography with increasing Rsm was formed on the surfaces. There were five groups of samples (b1 to b5) for superoleophobic surface.

2.4. Characterization of Surfaces

2.4.1. Morphology of Roughness

To measure effective slip length on the rough surfaces, the morphology of the superoleophilic and superoleophobic surfaces was measured using a laser confocal scanning microscope (OLS 3000, Olympus, Tokyo, Japan) with a magnification of 100× in 3D scanning mode. The surfaces were imaged with a scan size of 128 μm × 128 μm at a step length of 20 nm. Then surface roughness, including amplitude roughness and spacing roughness, was obtained by image processing.

2.4.2. CA and CAH Measurement

Surface wettability is believed to affect boundary slip. Therefore, to distinguish the individual effects of roughness and wettability on slip length, the contact angle (CA) and contact angle hysteresis (CAH) are should be constant. CAs and CAHs were measured by using a goniometer (DropMeterTM Element A-60, MAIST Vision Inc., Ningbo, China). A 5 μL droplet each of hexadecane and ethylene glycol was deposited on the superoleophilic and superoleophobic surfaces, respectively, and images of the droplets on the surfaces were captured and analyzed to obtain the CAs by Dropmeter software. Reproducibility of all CA and CAH data was obtained from measurements.

3. Results and Discussion

3.1. Morphology and Surface Roughness

Figure 5a,b shows the laser confocal scanning microscopy images of samples a1, a2 and b1, b2 in air with calculated RMS and Rz roughness, respectively. A 128 μm × 128 μm scan size was used to present data. For both the superoleophilic and superoleophobic surfaces, the SiO2 nanoparticles coalesced together to form a random morphology with certain roughness. It can be noted that the Rsm roughness of sample a2 was larger than that of a1. This result can be explained by the SiO2 nanoparticles with increasing concentration coalescing together into a larger group, which enhanced the spacing parameters of the surfaces. Therefore, the Rsm roughness increased from a1 to a5 and b1 to b5, as shown in Table 1, and the Rz roughness kept consistent at ~1100 ± 100 nm for all samples.

3.2. CA and CAH

Table 1 shows the CAs and CAHs of hexadecane and ethylene glycol on the superoleophilic and superoleophobic surfaces. For the superhydrophilic surfaces, the CAs and CAHs of the hexadecane droplets on the surfaces remained ~0 and were smaller than that of ethylene glycol, which was ~10° with increasing Rsm roughness from a1 to a5. For the superhydrophobic surfaces, the CAs of the hexadecane droplets on the surfaces remained ~150°, and were smaller than that of ethylene glycol, which was ~160° with increasing Rsm roughness from b1 to b5, since the surface tension of ethylene glycol is larger than that of hexadecane, leading to a larger contact angle. For each type of sample, the CAs and CAHs kept constant with increasing roughness, and the effect of wettability on the slip length was decoupled.

3.3. Effective Boundary Slip

3.3.1. Superoleophilic Surfaces

  • Hydrodynamic forces.Figure 6a shows the measured hydrophobic forces Fhydro applied on the AFM probe approaching the superoleophilic surface immersed in hexadecane with varying Rsm roughness as a function of separation distance D. The plots of experimental data exhibit nonlinear behavior at separation distances of 0 nm to 400 nm and are indicative of a slip boundary condition. In order to obtain the slip length, the V/Fhydro applied on the AFM probe is used for superoleophilic surfaces immersed in hexadecane and ethylene glycol as a function of separation distance D, as shown in Figure 6a. In the case of hexadecane, the plots of V/Fhydro on superoleophilic surfaces exhibit linear behavior at separation distances of 0 nm to 800 nm, and show a trend of the linear parts shifting to the left with increasing Rsm from samples a1 to a5. This means that the interceptions of V/Fhydro on the horizontal ordinate shift to the left, and lead to an increasing slip length from samples a1 to a5. For ethylene glycol, the plots of V/Fhydro are similar to those of hexadecane. This means that the increasing Rsm roughness leads to a larger slip length, as shown in Figure 6b. It can be noted that the tendencies are more obvious, because the surface tension of ethylene glycol is greater than that of hexadecane.
  • Slip length. Measured slip length was obtained from the hydrophobic forces according to Equation (1). Figure 7a shows the measured slip length data as a function of Rsm roughness. For samples a1 to a5, the slip length of the superoleophilic surface immersed in hexadecane and ethylene glycol increased with increasing Rsm roughness. The effective slip length was obtained according to Equation (11). Figure 7b shows the effective slip length data as a function of Rsm roughness. Results show that all of the slip lengths are negative and remain constant from samples a1 to a5 after correction by compensation f*. This means that the flow velocity at the reference surface is discontinuous due to the rough structure, and the slippage is independent of spacing roughness, where the slip length of the sphere and the location of the reference surface are taken into account.
  • Discussion. It should be noted that slip boundary conditions at the reference surface are complex, as there is rough topography, and slip length at the interface of liquid, and rough superoleophilic surface is discontinuous, which should be studied by the average hydrodynamic forces detected using AFM. The effect of spacing roughness on slip length can be described by the following model, shown in Figure 8. The boundary of rough topography were replaced by a flat plane of reference surface, and the pitches were divided into square zones, where the average length of side ε was the value of Rsm roughness. We assumed that each zone was divided into two areas: (i) the no-slip area Sε, corresponding to a cross-section of the pitch of the rough surface, containing a circle of radius α centered in the origin, which is relative to the area of Sε; and (ii) the slip area, corresponding to a cross-section of the slippery part of fluid flow.
We assume that the average no-slip area Sε contains a circle of radius aεα, via a ε α =   1 m i 1   m α i , where αε is a numerical prefactor. The no-slip area Sε is defined by:
S ε = ( ε k 1 + ε 2 ε k 2 + ε 2 ) + a ε S ,
where Sε is expected to depend on the underlying geometry of the surface, and ( ε k 1 + ε 2 , ε k 2 + ε 2 ) is the center of the average no-slip area Sε.
The slip length can be estimated by the solid friction Φs between solid and liquid, which is defined by the relative area of the no-slip area Sε in the square of ( ε k ,   ε k + 1 ) 2 . It can be found that solid friction at the no-slip area Sε is Φs~∞. The expression of solid friction Φs is given by Bonnivard et al. [31]:
Φ s = ( a ε ε ) 2 | S ε | ,
where | S ε | is the area of the average no-slip area Sε. Since lim ε = 0 Φ s = 0 , the slip length can be obtained by:
b = α ϕ s = α ( a ε ε ) | S ε | = α a ε ( ε | S ε | ) ,
where α a ε is the constant and remains unchanged. Thus, the effect of spacing roughness on the effective slip length depends on the value of ε | S ε | . With increased Rsm, the values of ε | S ε | remain constant, therefore the results of effective slip length remain constant.

3.3.2. Superoleophobic Surfaces

  • Hydrodynamic forces. The plots of measured hydrodynamic forces Fhydro between the colloidal AFM probe and the superoleophobic surfaces immersed in hexadecane and ethylene glycol, as a function of separation distance D, are shown in Figure 9. In order to obtain slip length, the V/Fhydro applied on the AFM probe is used for superoleophilic surfaces immersed in hexadecane and ethylene glycol as a function of separation distance. In the case of superoleophobic surfaces, it can be noted that the plots of V/Fhydro shift to the left with increasing Rsm from samples a1 to a5. The results are similar to those of superoleophilic surfaces. This means that the interception of V/Fhydro on the axis of separation distance shifts to the left from b1 to b5 and leads to increased slip length. The change of hydrodynamic forces Fhydro can be expressed by the varying Rq roughness of surfaces, by the effect of the morphology of surfaces on the measured hydrodynamic forces.
  • Slip length. Measured slip length of the superoleophobic surface is obtained from the hydrophobic forces Fhydro and V/Fhydro according to Equation (1). Figure 10a shows the data of measured slip length as a function of Rsm roughness. With increased roughness from b1 to b5, the slip length of the superoleophilic surface in hexadecane and ethylene glycol increases with increasing Rsm roughness. Then the effective slip length is obtained according to Equation (11). Figure 10b shows the data of effective slip length as a function of Rsm roughness. The results are similar to those of the superoleophilic surface, and show that all slip lengths are negative and remain constant from b1 to b5. This also can be explained by the existence of rough topography, leading to a discontinuity of boundary slip, and the values of ε | S ε | remain constant with varying Rsm. For the superoleophobic surfaces, the reference surface of the morphology in a Cassie regime remains an open question. Consider the case of drainage between sphere and rough surface; the reference surface should be located at the height of Rq, as in a Wenzel regime. In this paper, application in micro-/nano-fluidic channels with rough walls on both sides has been considered, so the reference surface should still be considered as Rq of the roughness profile, which leads to a discontinuity of boundary slip.

4. Conclusions

Although numerous investigations addressing the question of drainage of the thin film between two surfaces represent an improvement over Reynolds’ theory, the effects of surface roughness were ignored; thus, it could not be applied to obtain slip length on rough surfaces, such as superoleophilic/superoleophobic surfaces. Roughness is known to be a considerable parameter influencing the flow aptitude of liquids at the solid–liquid interface on surfaces. We have further improved the quantitation and measurement of effective slip length by using a colloidal probe AFM and laser confocal scanning microscopy. We conducted experiments with hexadecane and ethylene glycol, two kinds of oil, to study slip length on superoleophilic and superoleophobic surfaces with varying surface Rsm roughness. We also addressed the issues of experimental studies of boundary slip on rough surfaces. Negative slip length was found on superoleophilic and superoleophobic surfaces immersed in hexadecane and ethylene, as the viscosity of the liquids at reference surface were discontinuous. According to the results, the effective slip lengths kept constant with increasing Rsm roughness, as they depend on the value of ε / | S ε | , which is constant. These results contribute to further study on the behavior of liquid flowing near a rough solid interface, and the inhibition of hydrodynamic drag in micro-/nano-fluidic systems with omiphobic surfaces.

Author Contributions

Y.L. conceived the idea to perform this research. X.Z. and Y.P. guided the research scientifically and technically throughout. Y.L. performed all experiments and analyzed data. Y.L. and Y.P. wrote the paper. All authors discussed the content of this work and reviewed the manuscript. The manuscript was written through contributions of all authors. All authors have given approval to the final version of the manuscript.

Acknowledgments

This research was supported by the National Natural Science Foundation of China (grant No. 51475118 and No. 51505108).

Conflicts of Interest

The authors declare no conflicts of interest.

References

  1. Bhushan, B. Springer Handbook of Nanotechnology, 3rd ed.; Springer: Heidelberg, Germany, 2010; pp. 1–5. ISBN 9787560339498. [Google Scholar]
  2. Wolynes, P.G.; Deutch, J.M. Slip boundary conditions and the hydrodynamic effect on diffusion controlled reactions. J. Chem. Phys. 1976, 65, 450–454. [Google Scholar] [CrossRef]
  3. Watanabe, K.; Udagawa, Y.; Udagawa, H. Drag reduction of Newtonian fluid in a circular pipe with a highly water-repellent wall. J. Fluid Mech. 1999, 381, 225–238. [Google Scholar] [CrossRef]
  4. Ou, J.; Perot, B.; Rothstein, J.P. Laminar drag reduction in microchannels using ultrahydrophobic surfaces. Phys. Fluids 2004, 16, 4635–4643. [Google Scholar] [CrossRef]
  5. Shirtcliffe, N.J.; McHale, G.; Newton, M.I.; Zhang, Y. Superhydrophobic copper tubes with possible flow enhancement and drag reduction. ACS Appl. Mater. Interfaces 2009, 1, 1316–1323. [Google Scholar] [CrossRef] [PubMed]
  6. Navier, C.L.M.H. Memoire Sur les Lois du Mouvement Des Fluides. Mem. Acad. R. Sci. 1823, 6, 389–440. [Google Scholar]
  7. Bonaccurso, E.; Kappl, M.; Butt, H.J. Hydrodynamic force measurements: Boundary slip of water on hydrophilic surfaces and electrokinetic effects. Phys. Rev. Lett. 2002, 88, 76103. [Google Scholar] [CrossRef] [PubMed]
  8. Cottin-Bizonne, C.; Cross, B.; Steinberger, A.; Charlaix, E. Boundary slip on smooth hydrophobic surfaces: Intrinsic effects and possible artifacts. Phys. Rev. Lett. 2005, 94, 056102. [Google Scholar] [CrossRef] [PubMed]
  9. Zhu, L.; Neto, C.; Attard, P. Reliable measurements of interfacial slip by colloid probe atomic force microscopy. III. Shear-rate-dependent slip. Langmuir 2012, 28, 3465–3473. [Google Scholar] [CrossRef] [PubMed]
  10. Pan, Y.; Bhushan, B.; Zhao, X. The study of surface wetting, nanobubbles and boundary slip with an applied voltage: A review. Beilstein J. Nanotechnol. 2014, 5, 1042–1065. [Google Scholar] [CrossRef] [PubMed] [Green Version]
  11. Vo, T.Q.; Park, B.S.; Park, C.H.; Kim, B.H. Nano-scale liquid film sheared between strong wetting surfaces: Effects of interface region on the flow. J. Mech. Sci. Technol. 2015, 29, 1681–1688. [Google Scholar] [CrossRef]
  12. Vo, T.Q.; Barisik, M.; Kim, B.H. Near-surface viscosity effects on capillary rise of water in nanotubes. Phys. Rev. E Stat. Nonlin. Soft Matter Phys. 2015, 92, 053009. [Google Scholar] [CrossRef] [PubMed]
  13. Bakli, C.; Chakraborty, S. Slippery to sticky transition of hydrophobic nanochannels. Nano Lett. 2015, 15, 7497–7502. [Google Scholar] [CrossRef] [PubMed]
  14. Vo, T.Q.; Kim, B. Transport phenomena of water in molecular fluidic channels. Sci. Rep. 2016, 6, 1–8. [Google Scholar] [CrossRef] [PubMed]
  15. Jing, D.; Pan, Y. Electroviscous effect and convective heat transfer of pressure-driven flow through microtubes with surface charge-dependent slip. Int. J. Heat Mass. Transf. 2016, 101, 648–655. [Google Scholar] [CrossRef]
  16. Li, Y.; Pan, Y.; Zhao, X. Boundary condition of the roughness induced superoleophilic and superoleophobic surfaces immersed in hexadecane and ethylene glycol. Beilstein J. Nanotechnol. 2017, 8, 2504–2514. [Google Scholar] [CrossRef] [PubMed]
  17. Di Federico, V.; Longo, S.; King, S.; Chiapponi, L.; Petrolo, D.; Ciriello, V. Gravity-driven flow of Herschel–Bulkley fluid in a fracture and in a 2D porous medium. J. Fluid Mech. 2017, 821, 59–84. [Google Scholar] [CrossRef] [Green Version]
  18. Vinogradova, O.I. Drainage of a thin liquid film confined between hydrophobic surfaces. Langmuir 1995, 11, 2213–2220. [Google Scholar] [CrossRef]
  19. Vinogradova, O.I.; Yakubov, G.E. Surface roughness and hydrodynamic boundary conditions. Phys. Rev. E 2006, 73, 1–4. [Google Scholar] [CrossRef] [PubMed]
  20. Vinogradova, O.I.; Belyaev, A.V. Wetting, roughness and flow boundary conditions. J. Phys. Condens. Matter 2011, 23, 045302. [Google Scholar] [CrossRef] [PubMed]
  21. Fang, A.; Mi, Y. Drainage of a thin liquid film between hydrophobic spheres: Boundary curvature effects. Langmuir 2014, 30, 83–89. [Google Scholar] [CrossRef] [PubMed]
  22. Zhu, Y.; Granick, S. Limits of the hydrodynamic no-slip boundary condition. Phys. Rev. Lett. 2002, 88, 106102. [Google Scholar] [CrossRef] [PubMed]
  23. Bonaccurso, E.; Butt, H.J.; Craig, V.S.J. Surface roughness and hydrodynamic boundary slip of a Newtonian fluid in a completely wetting system. Phys. Rev. Lett. 2003, 90, 144501. [Google Scholar] [CrossRef] [PubMed]
  24. Li, Y.; Bhushan, B. The effect of surface charge on the boundary slip of various oleophilic/phobic surfaces immersed in liquids. Soft Matter 2015, 11, 7680–7695. [Google Scholar] [CrossRef] [PubMed]
  25. Jing, D.; Bhushan, B. The coupling of surface charge and boundary slip at the solid-liquid interface and their combined effect on fluid drag: A review. J. Colloid Interface Sci. 2015, 454, 152–179. [Google Scholar] [CrossRef] [PubMed]
  26. Neto, C.; Craig, V.S.J.; Williams, D.R.M. Evidence of shear-dependent boundary slip in Newtonian liquids. Eur. Phys. J. E 2003, 12, 59–62. [Google Scholar] [CrossRef] [PubMed]
  27. Kunert, C.; Harting, J. Roughness induced boundary slip in microchannel flows. Phys. Rev. Lett. 2007, 99. [Google Scholar] [CrossRef] [PubMed]
  28. Cottin-Bizonne, C.; Steinberger, A.; Cross, B.; Raccurt, O.; Charlaix, E. Nanohydrodynamics: The intrinsic flow boundary condition on smooth surfaces. Langmuir 2008, 24, 1165–1172. [Google Scholar] [CrossRef] [PubMed]
  29. Pan, Y.; Jing, D.; Zhao, X. Effect of surface roughness on the measurement of boundary slip based on Atomic Force Microscope. Sci. Adv. Mater. 2017, 9, 122–127. [Google Scholar] [CrossRef]
  30. Brown, P.S.; Bhushan, B. Mechanically durable, superoleophobic coatings prepared by layer-by-layer technique for anti-smudge and oil-water separation. Sci. Rep. 2015, 5, 8701. [Google Scholar] [CrossRef] [PubMed] [Green Version]
  31. Bonnivard, M.; Dalibard, A.L.; Gérard-Varet, D. Computation of the effective slip of rough hydrophobic surfaces via homogenization. Math. Model Methods Appl. Sci. 2014, 24, 2259–2285. [Google Scholar] [CrossRef] [Green Version]
Figure 1. Schematic illustration of slip length measurement on a rough surface by using a colloidal atomic force microscopy (AFM) probe in contact mode. As the sphere approaches the sample, liquid is driven and drained to become fluid flow. The arrows above and below the solid–liquid interface represent magnitude and direction of fluid flow with boundary slip.
Applsci 08 00931 g001
Figure 2. Schematic illustration of drainage of a thin liquid film between sphere and rough surface. The distance of closest approach between the two surfaces is D, and the approaching velocity of surfaces is v. The appropriate cylindrical coordinate system (w, z) is established as shown.
Applsci 08 00931 g002
Figure 3. Schematic illustrating possible definitions of the reference at a rough surface and the boundary condition when the reference surface is located between the peak and valley of sample.
Applsci 08 00931 g003
Figure 4. Schematic illustration of the preparation procedures for superoleophilic samples (a) a1 and (b) a2. The dashed arrow is the moving direction of the spray gun, which is parallel to the samples. With increasing concentration from 10 mg mL−1 to 15 mg mL−1, the SiO2 nanoparticles coalesce together into larger groups, leading to increased Rsm roughness.
Applsci 08 00931 g004
Figure 5. Confocal laser scanning images in the air, and measured Rsm, Rz roughness of (a) superoleophilic surface samples a1 and a2, and (b) superoleophobic surface samples b1 and b2.
Applsci 08 00931 g005
Figure 6. Hydrodynamic force Fhydro and V/Fhydro of a borosilicate sphere on superoleophilic surfaces immersed in (a) hexadecane and (b) ethylene glycol with various Rsm roughness at a sphere velocity of 38.5 μm/s.
Applsci 08 00931 g006
Figure 7. (a) Measured slip length and (b) effective slip length on superoleophilic surfaces with varied Rsm roughness.
Applsci 08 00931 g007
Figure 8. Mechanism of effect of spacing roughness on effective slip length on superoleophilic and superoleophobic surfaces with varied Rsm roughness. The cross-section of the surface was obtained by cutting at a height of reference surface h = Rq in the horizontal direction. (a) S is the no-slip area; and (b) Sε is the average no-slip area.
Applsci 08 00931 g008
Figure 9. Hydrodynamic forces Fhydro and V/Fhydro of a borosilicate sphere on superoleophobic surfaces immersed in (a) hexadecane and (b) ethylene glycol with varied Rsm roughness at a sphere velocity of 38.5 μm/s.
Applsci 08 00931 g009
Figure 10. (a) Measured slip length and (b) effective slip length on superoleophobic surfaces with varied Rsm roughness.
Applsci 08 00931 g010
Table 1. Rz, Rsm, contact angle (CA), and contact angle hysteresis (CAH) of superoleophilic and Superoleophobic surfaces.
TypeRz (nm)Rsm (nm)HexadecaneEthylene Glycol
CA (°)CAH (°)CA (°)CAH (°)
a11040 ± 150620 ± 90010 ± 1
a21100 ± 1001080 ± 100010 ± 1
a31160 ± 1001480 ± 110010 ± 1
a41050 ± 802050 ± 100010 ± 1
a51110 ± 1002740 ± 100010 ± 1
b11100 ± 100760 ± 100150 ± 310 ± 2159 ± 57 ± 1
b21120 ± 801170 ± 150150 ± 38 ± 1160 ± 35 ± 1
b31150 ± 1001690 ± 100152 ± 26 ± 1158 ± 36 ± 1
b41150 ± 802050 ± 150151 ± 28 ± 1160 ± 35 ± 2
b51180 ± 1002670 ± 100155 ± 38 ± 2158 ± 55 ± 1

