Review

A Review of Data Mining with Big Data towards Its Applications in the Electronics Industry

1
College of Engineering, South China Agricultural University, Guangzhou 510642, China
2
Department of Industrial, Manufacturing and Systems Engineering, Texas Tech University, Lubbock, TX 79409, USA
*
Author to whom correspondence should be addressed.
Appl. Sci. 2018, 8(4), 582; https://doi.org/10.3390/app8040582
Submission received: 11 March 2018 / Revised: 2 April 2018 / Accepted: 4 April 2018 / Published: 8 April 2018

Abstract

:

Featured Application

This review not only benefits researchers to develop strong research themes and identify gaps in the field but also helps practitioners for DM and Big Data application system development.

Abstract

Data mining (DM) with Big Data has been widely used in the lifecycle of electronic products that range from the design and production stages to the service stage. A comprehensive analysis of DM with Big Data and a review of its application in the stages of its lifecycle will not only benefit researchers to develop strong research themes and identify gaps in the field but also help practitioners for DM application system development. In this paper, a brief clarification of DM-related topics is presented first. A flowchart of DM and the main content of the flowchart steps are given in which commonly used data preparation and preprocessing approaches, DM functions and techniques, and performances indicators are summarized. Then, a comprehensive review covering 105 articles from 2007 to 2017 on DM or Big Data applications in the electronics industry is provided according to the flowchart from various points of view such as data handling, applications of DM, or Big Data at different lifecycle stages, and the software used in the applications. On this basis, a diagram of data content for different knowledge areas and a framework for DM and Big Data applications in the electronics industry are established. Finally, conclusions and future research directions are given.

1. Introduction

Since the internet of things and advanced information technologies (for example, radio frequency identification (RFID) tags and smart sensors) are widely used in manufacturing enterprises for their daily production and management, the product lifecycle management (PLM) processes produce a huge amount of data [1]. Furthermore, the accumulation of historical data in enterprise resource planning (ERP), supply chain management (SCM), customer relationship management (CRM), and order management system (OMS), as well as the timely collected data by the widely used manufacturing execution system (MES) and distributed control system (DCS) contributed to the sharp increase of data over the decades. The era of industrial Big Data has come.
Leaders of manufacturing enterprises are becoming increasingly interested in benefiting their companies by effectively using Big Data [1]. Big data related technologies such as knowledge discovery in databases (KDD) and data mining (DM) have been widely employed to enhance the intelligence and efficiency of the design, production, and service processes in many manufacturing scenes such as product design improvement, manufacturing process optimization, production management and optimization (PMO), production process monitoring and control, quality management, CRM, SCM, and so forth. Intel employs Big Data for predictive maintenance of equipment and greatly reduces the unnecessary equipment stop and idle time. A Taiwan Semiconductor Manufacturing Company adopts Big Data based advanced equipment control/advanced process control (AEC/APC) to improve production efficiency and wafer yield. Many reviews of these applications in the manufacturing industry have been reported and summarized in Table 1, from which we can see most of the achievements related to DM application in manufacturing before 2015 [2,3,4,5,6], and many researchers have started to adopt the concept of Big Data [7,8,9,10,11] in smart manufacturing since then. However, the aforementioned reviews provide no comprehensive analysis of DM with Big Data nor a summarization of them in the electronics industry from the view of their lifecycle, considering the special requirement of this manufacturing industry to the best of our knowledge.
Electronics is one of the fastest evolving, most innovative, and most competitive industries. The research and development of new and improved products are of great importance, where companies often compete fiercely to bring the newest technology to the market first. The past five years, from 2012 to 2017, have been characterized by growth in emerging markets and introduction of new products, leading more people to buy consumer electronics. The global consumer electronics industry was valued at $283 billion in 2015 [12]. Grand view research predicted that the global consumer electronics market is expected to reach $838.85 billion by 2020 [13]. The newly developed products are featured by high precision, long and complex manufacturing/test processes with high purity environments, diverse and high-quality requirements from customers, and a large amount of data generated at different stages of their lifecycle from design and production to sale and service. Thus, the electronics industry is currently in the midst of a data-driven revolution [7] which has pushed forward many data excavation related research over the past decades for the better utilization of these data that can facilitate quality or service improvement, production optimization, and so forth. [14]. A review of DM with Big Data application in the electronics industry not only benefits researchers to develop strong research themes and identify gaps in the field but also helps practitioners for DM application system development.
In the following sections, DM with Big Data and related techniques are given in Section 2 in which a brief introduction of the concepts of DM and Big Data is presented, and also the flowchart and the main content of the flowchart steps are summarized. In Section 3, the article selection condition and distribution of the selected articles in different years and different lifecycle stages are discussed. A comprehensive analysis of the reviewed literature from various points of view is provided subsequently, in Section 4, which summarizes data handling, discusses the DM with Big Data application in different stages of the product lifecycle, and surveys the software used in these applications. On this basis, the data content and a framework for DM application in the electronics industry are established in Section 5. Finally, the conclusions and future research directions are given in Section 6.

2. Data Mining with Big Data

2.1. Concepts of Data Mining and Big Data

There are many concepts such as DM, KDD, and Big Data that are closely related to each other. DM, as an interdisciplinary subject including database design, statistics, pattern recognition, machine learning, and data visualization [6], can be defined in many different ways. Romero and Ventura [15] specified DM as “the nontrivial process of identifying valid, novel, potentially useful, and ultimately understandable patterns in data”. Han et al. [16] defined DM as “the process of discovering interesting patterns and knowledge from large amounts of data”.
Many researcher and practitioners treat DM as a synonym for KDD as IBM [17] deems KDD and DM the same as “an interdisciplinary area focusing on methodologies for extracting useful knowledge from data”. However, others think that “KDD refers to the overall process of discovering knowledge from data while DM (in a narrow sense) refers to application of algorithms for extracting patterns from data without the additional steps of the KDD process” [16], in which the additional steps include data preparation, preprocessing, incorporation of appropriate prior knowledge, and proper interpretation of the results of mining [16]. Here, we take DM as a synonym for KDD whereas DM in a narrow sense refers only to the step to generate a specific pattern using a particular algorithm within an acceptable computational efficiency limit [11,16].
There are various definitions of Big Data from 3 Vs to 4 Vs [18]. Volume, velocity, and variety are the well-known 3Vs and the fourth V can be value, variability, or virtual [8,18]. Wikipedia specifies that “Big Data is data sets that are so voluminous and complex that traditional data processing methods are inadequate to deal with them” [19]. Gartner gives a more detailed definition as follows: “Big Data is high-volume, high-velocity, and/or high-variety information assets that require new forms of processing to enable enhanced decision making, insight discovery and process optimization” [20]. Big Data analysis is strongly connected with classical data analysis and DM approaches to access and process these amounts of data very fast [2,10].
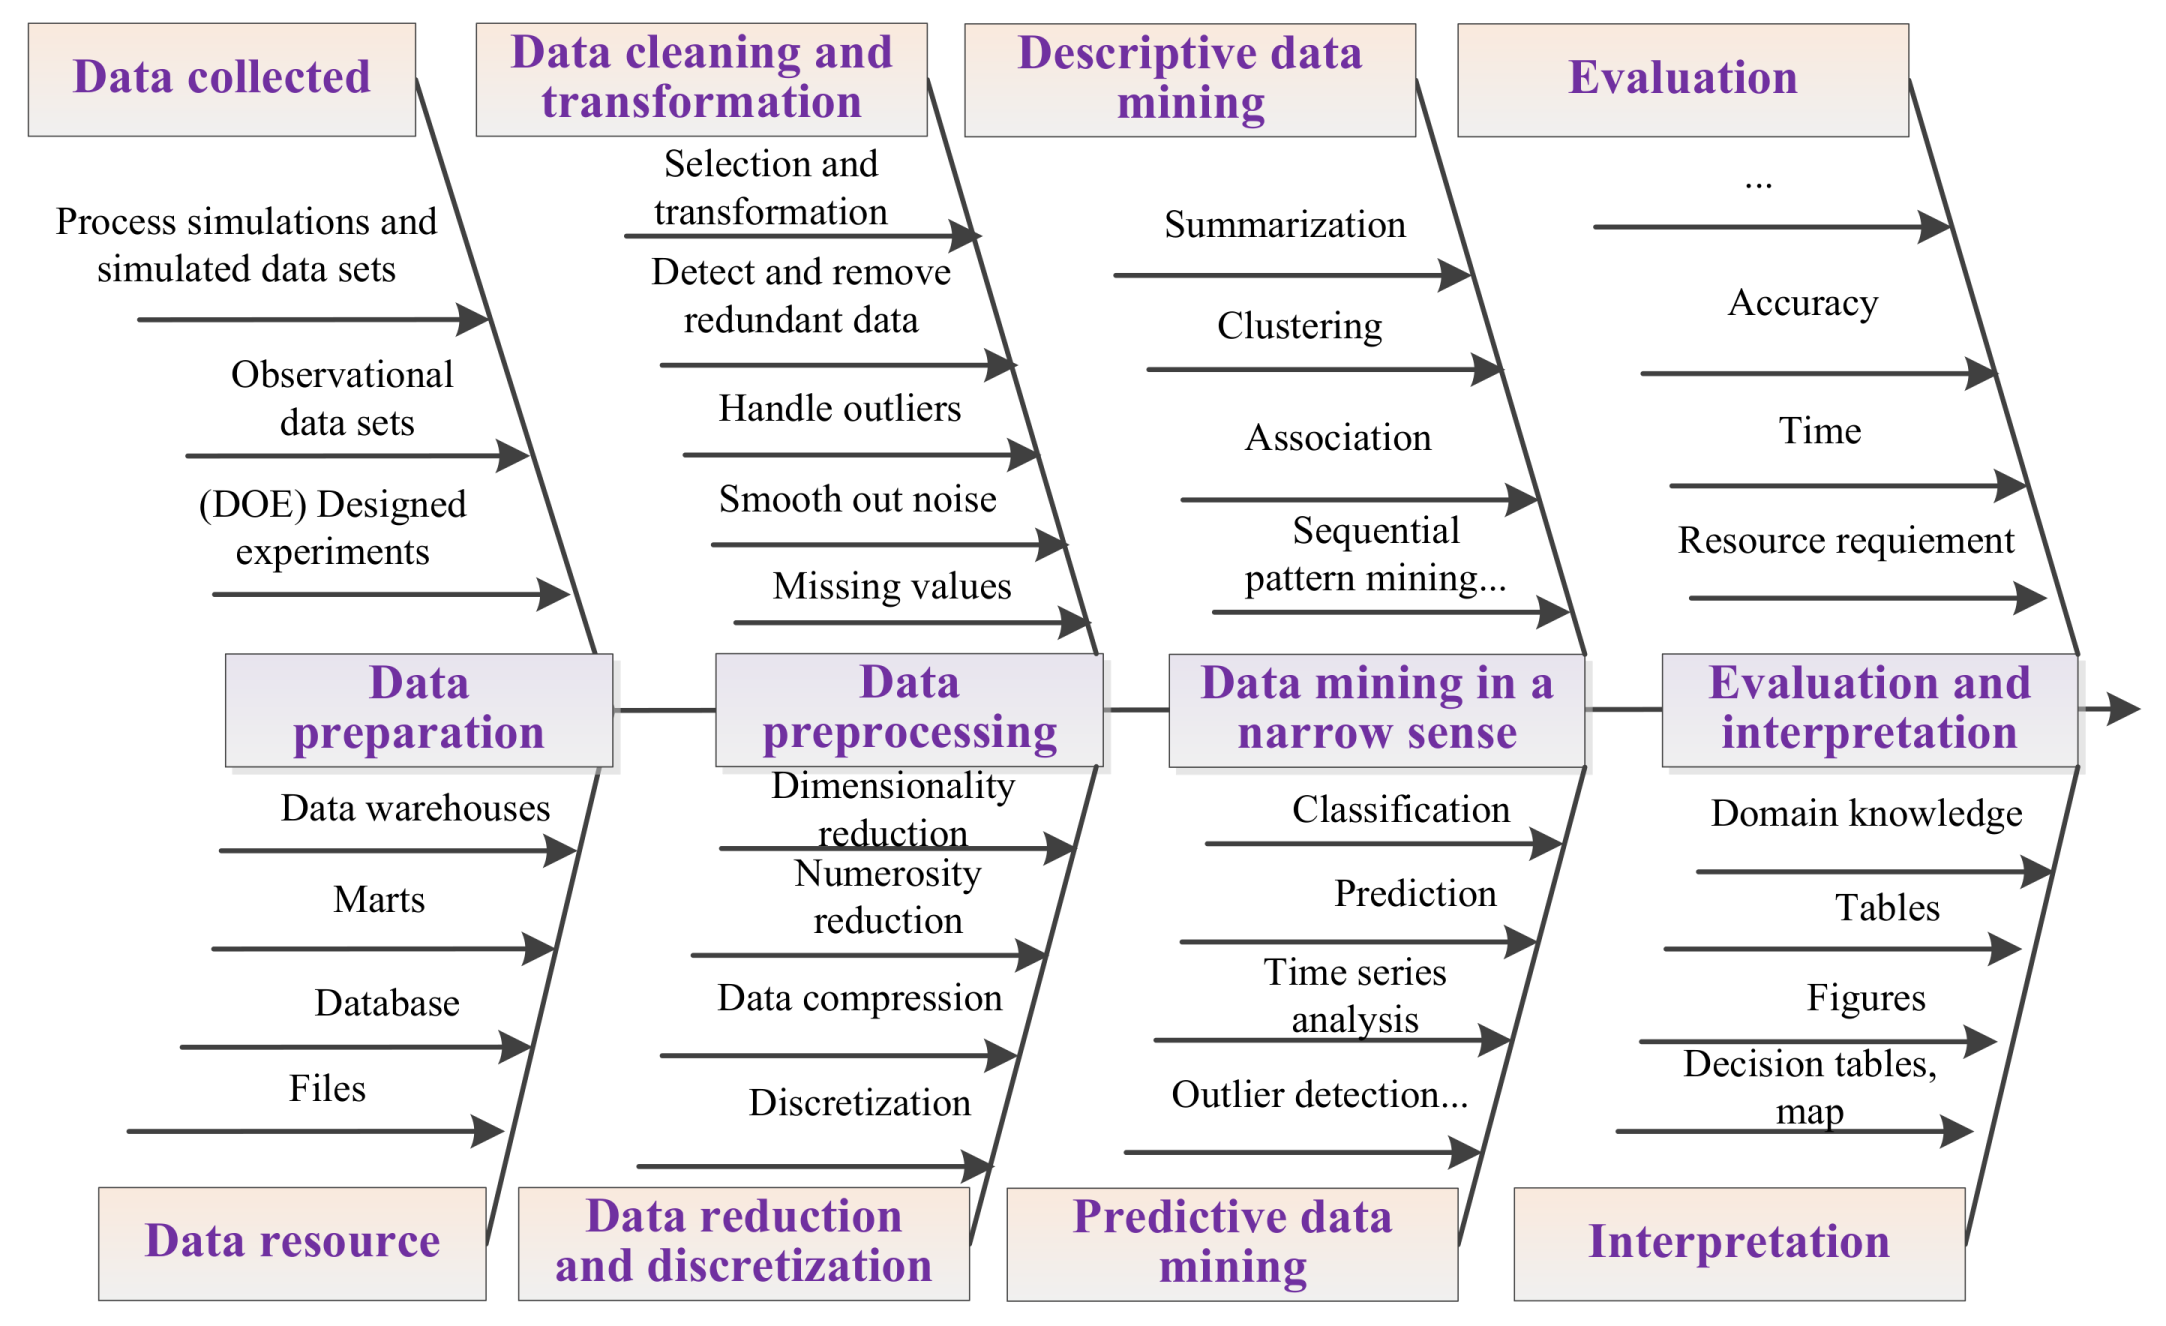
The flowchart of DM with Big Data is illustrated in Figure 1. The main content of each step includes data preparation, preprocessing, DM in a narrow sense, and evaluation. The interpretation of the results will be discussed in the following sections.

2.2. Data Preparation and Preprocessing

The data preparation includes problem clarification and collecting the targeted data. The problem clarification is to understand the industry domain including the relevant prior knowledge related to different applications and targeted goals [4]. The targeted data can be obtained by experimental observations, historical accumulated records, online sensor measurement, real-time status of RFID tags, and simulation results. These data sets can be stored in different formats such as data warehouse, marts, database, files, and so on [4,16], and the data relevant to the mining tasks are retrieved and selected before data preprocessing.
The preprocessing consists of data cleaning, transformation, reduction, and discretization. Data cleaning operation involves techniques for filling in missing values, smoothing out noise, handling outliers, detecting, and removing redundant data. Data transformation puts the data into appropriate forms for mining when necessary. Data reduction is performed to obtain a smaller representation of the original data without sacrificing its integrity. Dimensionality reduction, numerosity reduction, and data compression are the three ways for data reduction. Dimensionality reduction is a technique to detect and remove irrelevant, weakly relevant or redundant attributes [16]. Numerosity reduction replaces the original data volume by alternative and smaller forms of data representation. In data compression, transformations are applied so as to obtain a reduced or compressed representation of the original data, such as principal components analysis (PCA). Discretization reduces the number of levels of an attribute by collecting and replacing low-level concepts with high-level concepts [4].

2.3. Data Mining in a Narrow Sense

Data mining in a narrow sense, as the core of DM, is to derive the model and mining the patterns/knowledge in the data. The patterns to be mined determine the DM functions to be performed which can always be divided into descriptive and predictive DM. The descriptive function is to characterize properties of the data in a target data set that mainly includes the functions of summarization, clustering, and association/sequential pattern mining. While the predictive DM performs induction on the current data in order to make predictions that mainly consists of the functions of classification, prediction, outlier detection (anomaly detection), and time series analysis [4,11,16]. The corresponding data mining techniques (DMTs) to realize different functions can be categorized into statistical analysis-oriented (SA-oriented) and knowledge discovery-oriented (KD-oriented). SA-oriented techniques make assumptions about data distribution and relationships between variables based on prior knowledge in advance and verify or deny the assumptions. Common SA-oriented DMTs include the algorithms such as regression, k-nearest neighbor (k-NN), k-means, Bayesian classifier [21], and so on. On the contrary, KD-oriented DMTs search for the relationship automatically under no clear assumptions [11]. The details of the DM functions and the related DMTs are summarized in Table 2 [4,11,16].

2.4. Performance Indicators

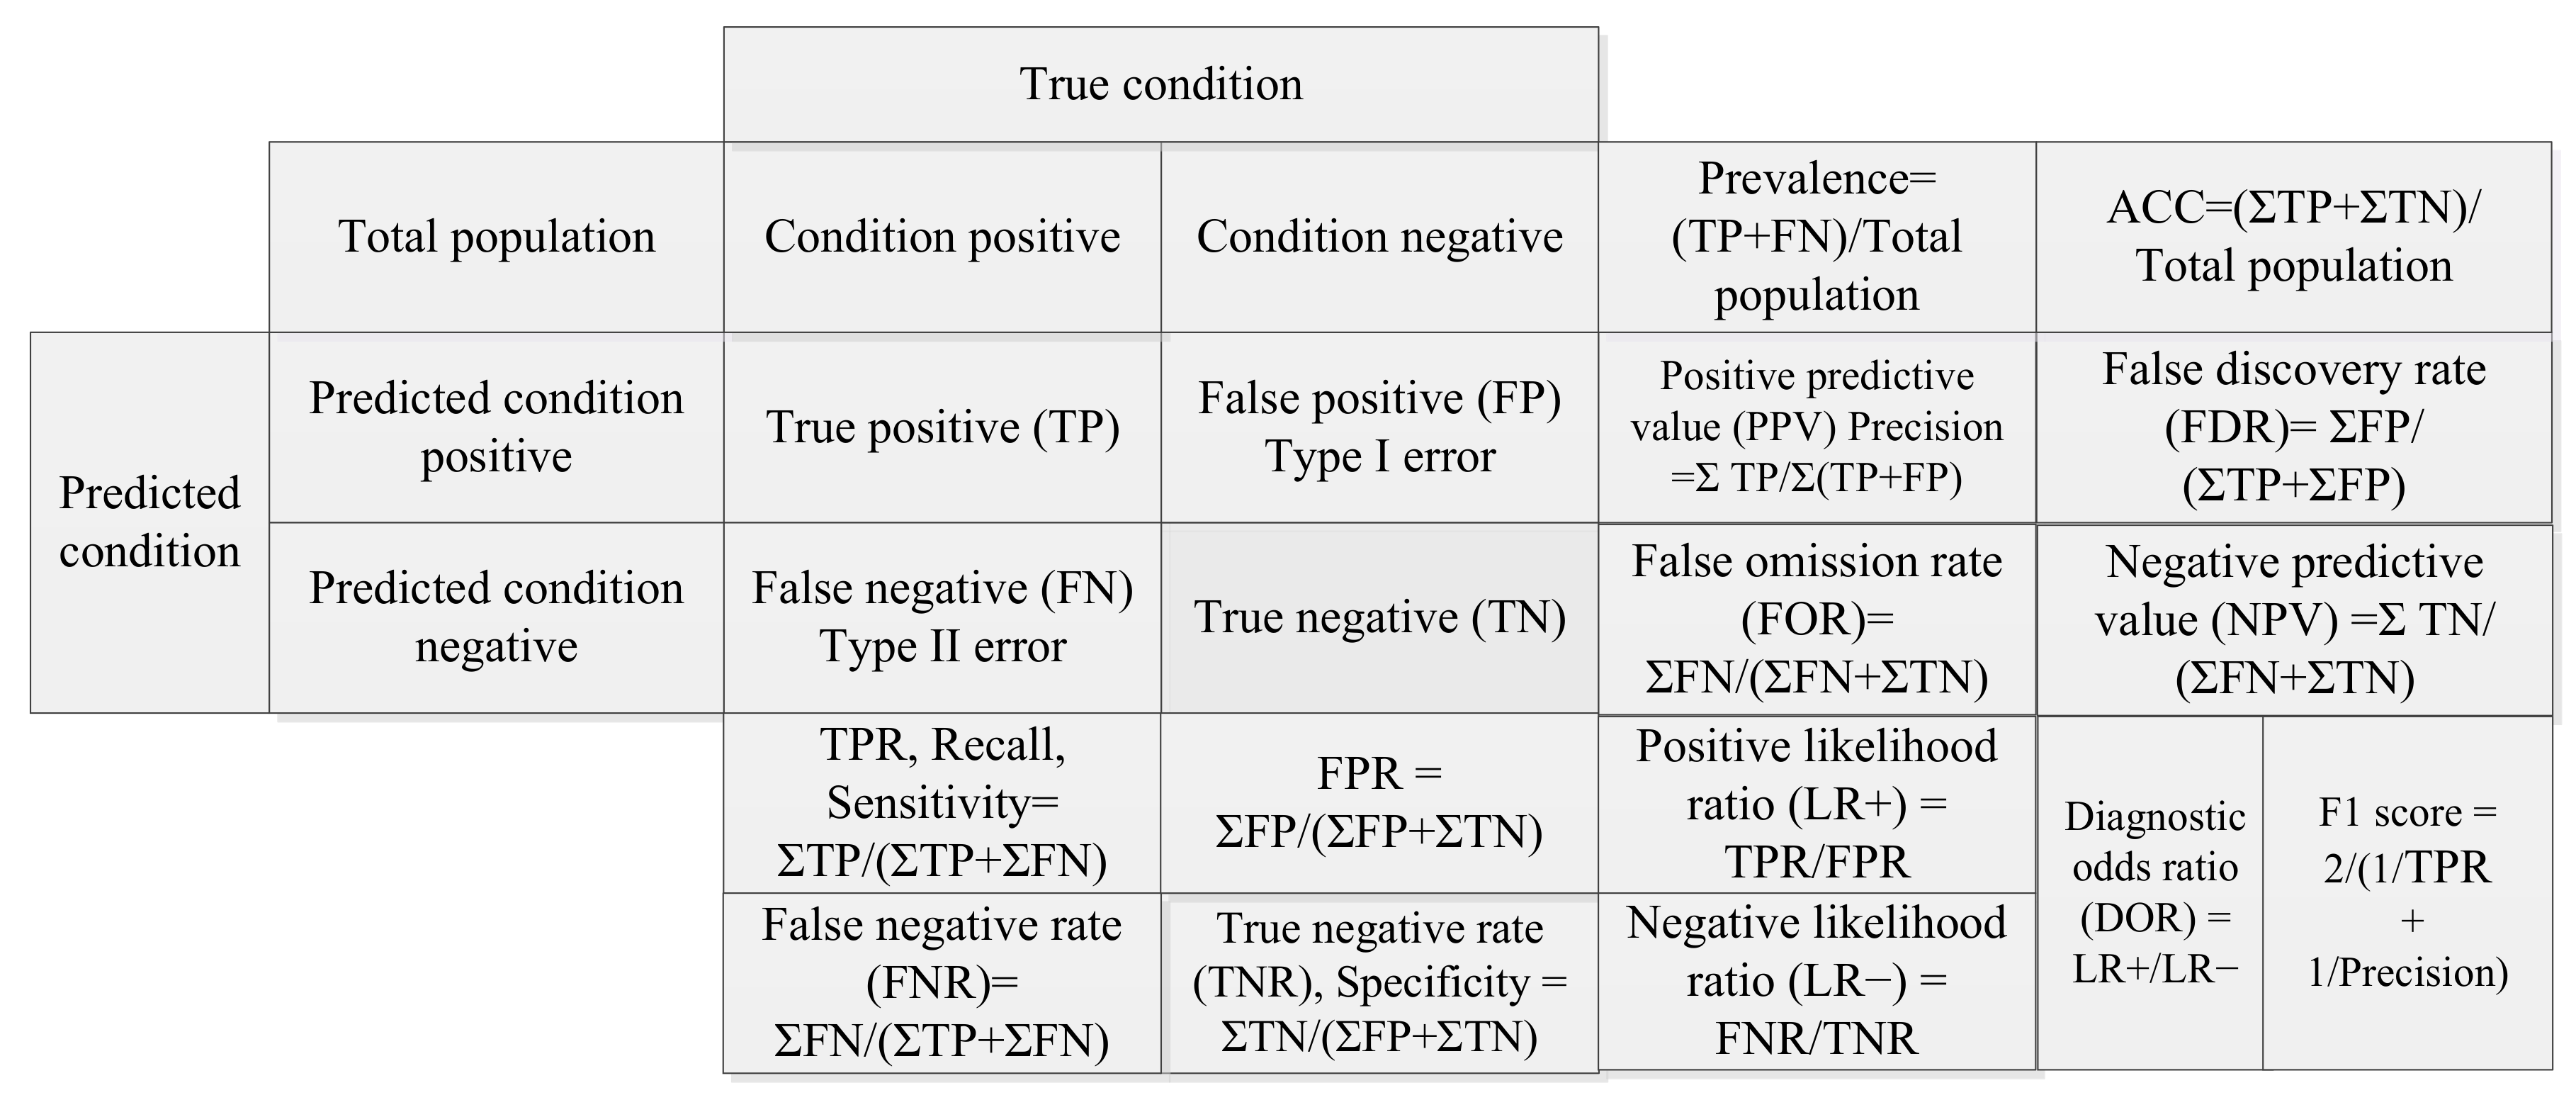
The knowledge extracted should be evaluated and interpreted correctly to obtain reliable results. The evaluation of the DM methods to reach a final decision requires a comparison of results obtained from various DM methods using several measures [4]. The performance indicators employed to evaluate classifiers based on a confusion matrix are illustrated in Figure 2. The indicators widely used for the measurement of prediction, clustering, and association of DM functions are summarized in Table 3, Table 4 and Table 5 respectively.
Accuracy (ACC), precision, sensitivity or recall, specificity, and so forth, given in Figure 2, are the commonly employed indicators. Meanwhile, the receiver operating characteristic curve (ROC) created by plotting the true positive rate (TPR) against the false positive rate (FPR) at various threshold settings is always taken to illustrate the diagnostic ability of a binary classifier system as its discrimination threshold is varied.
The performance indicators for prediction mainly include the mean absolute percentage error (MAPE), the mean squared error (MSE), the mean absolute error (MAE), the root-mean-square error (RMSE), the root absolute error (RAE), the mean error (ME), the variance of errors (VARER), the relative error (RE), the goodness of fit (R2), the index of agreement (IA), and so on. Typical objective functions to assess the quality of clustering include internal and external criteria. The internal criterion for the quality of a clustering can be evaluated by the Davies–Bouldin index (DBI), Dunn index (DI), and so on, while the most used external criteria includes purity, normalized mutual information (NMI), rand index (RI), F measure, and so on. Meanwhile, some indicators like the quantization error (QE) and the topographic error (TE) are for a special algorithm like self-organizing map (SOM). The support, confidence, lift, and conviction are pervasive performance indicators for association. The outlier detection can be taken as a binary classification, and the performance indicators for classification can be used to evaluate the results. Time series analysis can be used for clustering, classification, and anomaly detection, as well as forecasting, and therefore, the related performance can be verified by the corresponding indicators for clustering, classification, and prediction.

3. Article Selection and Distribution

The electronics industry is composed of organizations involved in the design, development, manufacture, assembly, and service of electronic equipment and components. These organizations offer a wide variety of products that range from government products, industrial products, consumer products, and electronic components as four primary segments. Each category serves a specific market, which allows it to focus on components and products geared toward their customers. The government market is primarily developed for aircraft and military products, as well as communication technology and medical devices. Industrial products include large-scale computers, radio and television broadcasting equipment, telecommunications equipment, and electronic office equipment, while consumer products are the well-known televisions, cell phones, DVD players, smartphones, radios, video game systems, personal computers, electronic ovens, and home intercommunication and alarm systems. The final segment the manufacturers produce and sell includes electron tubes, semiconductors, printed circuit boards (PCB), and passive components [25].
Based on the initial search from databases with keywords such as DM, Big Data, and electronics, we found that most of the articles were related to consumer products and components. Therefore, articles related to DM with Big Data applications in consumer electronics and components were selected here. On this basis, the article selection was conducted in which the period of interest for this literature survey ranges from 2007 to 2017. In October 2017, a search was made according to the following conditions:
(1) Database: Science Direct, IEEE Xplore Digital Library, Springer Link, Taylor & Francis Online, Wiley Online Library, SAGE Journal, Web of Science, and Google Scholar
(2) Stages: design, production, sale, service, and recycling
(3) Products: electronic products, integrated circuit, wafer, semiconductor, PCB, phone, and computer
(4) DM-related concepts: data mining, Big Data, and knowledge discovery
(5) DM functions: Prediction, classification, clustering, association, product/process characterization, time series analysis, outlier detection, and anomaly detection.
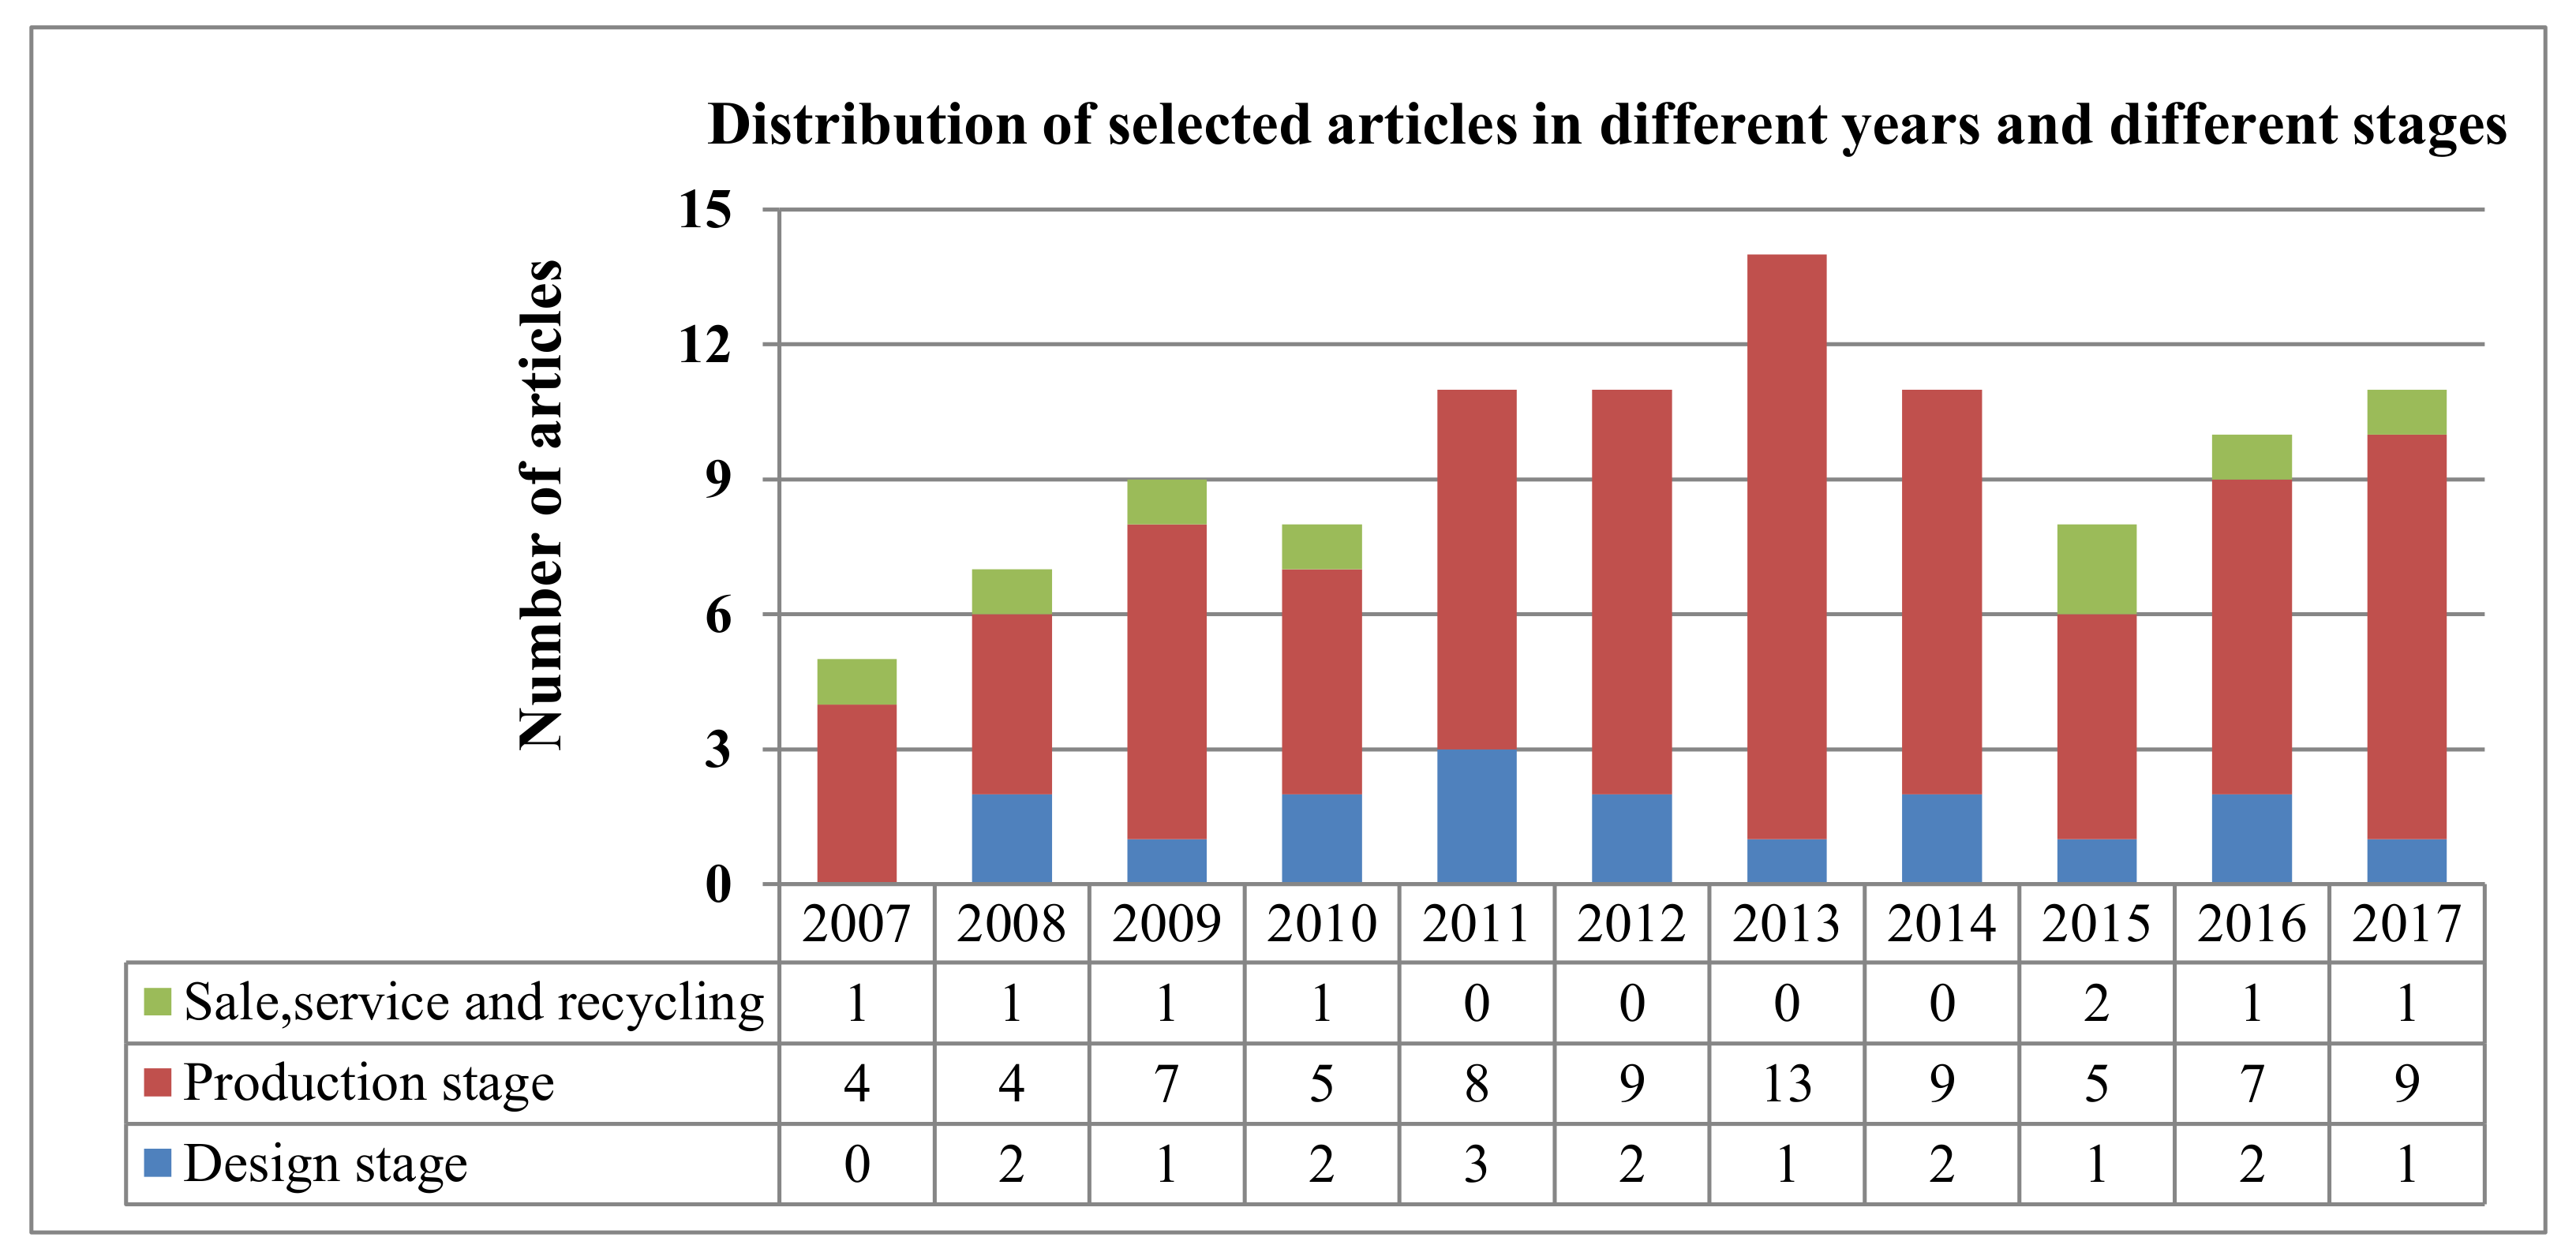
A total of 105 application studies within the scope of this review were found. The distribution of the selected articles in different years and different stages are illustrated in Figure 3. It can be seen that 17% (17 articles) were related to the stage of product and manufacturing process design [26,27,28,29,30,31,32,33,34,35,36,37,38,39,40,41,42], and more than 75% (80 articles) applied DM and Big Data to production management and control in the stage of production [43,44,45,46,47,48,49,50,51,52,53,54,55,56,57,58,59,60,61,62,63,64,65,66,67,68,69,70,71,72,73,74,75,76,77,78,79,80,81,82,83,84,85,86,87,88,89,90,91,92,93,94,95,96,97,98,99,100,101,102,103,104,105,106,107,108,109,110,111,112,113,114,115,116,117,118,119,120,121,122], but less than 8% (8 articles) of applications focused on the stage of sale, service, and recycling [123,124,125,126,127,128,129,130]. The fluctuation in quantity of the selected articles in different years presents no obvious tendency, however, it indicates that the topic has attracted ongoing attention and research during the past decades, and the application areas have been extended and many new approaches have been developed.

4. Data Mining with Big Data Applications in the Electronics Industry

In the following, we examine and discuss the reviewed literature from various points of view based on the flowchart given in Figure 1. Data handling, or more specifically, data preparation and data preprocessing before performing the DM functions, are discussed first. Next, DM with Big Data applications in different stages of the electronics industry, including the knowledge area, DM functions, developed DMTs, and performance indicators, are summarized. In addition, findings of these applications in each knowledge area are given, and the summarization of these reviews is also presented. Finally, the software tools used in these applications are examined.

4.1. Data Handling

Data preparation is the initial step of DM to collect the necessary data recording the feature values directly from the experimental data and historical observations or indirectly from the simulation results [4], in which the experimental data are the records of full factorials or fractional factorials while historical observations can be obtained either through online measurements or from historical accumulated records. The data preparation from the reviewed literature is summarized in Table 6.
Through Table 6, we can see that the data for the verification of product design improvement and manufacturing process optimization were mainly based on experimental observation and historical records. The DM application in the production process monitoring and control for the tasks of fault detection and classification (FDC), run to run (R2R), statistical process control (SPC), and so on, worked mainly on the data obtained through online measurements while DM in production and quality management for the tasks such as scheduling, yield/cost/cycle time prediction, and so forth was conducted mainly based on historical records from ERP and MES along with some process simulation. The task of SCM and CRM is conducted mainly based on interactions and transaction records accumulated in the system of SCM, OMS, and CRM.
Data preprocessing techniques used in the selected applications are summarized in Table 7, from which we can see that most of the cleaning techniques were used for the observational data sets. Some imputation techniques such as the missing values-patient rule induction method (m-PRLM) [30], k-NN [84,87], syndromes imputation [109] and so on were developed for filling in missing values. SVM [54], moving average smoothing [90], King-move neighborhood [93], Winter’s exponentials smoothing [126,127], and so on were employed for noise smoothing. Meanwhile, the methods of box plot [79,88], PCA [97], clustering [122], and so forth were applied for outliers detection. However, the missing values, noise, outliers, and redundant data were omitted directly in most cases.
Data transformation is the process of converting data from one format or structure into another. The pervasive method is normalization for the selected articles but few were conducted based on variance scaling [35,63], text mining [42,123], Fisher Z-transformation [44,47], binary vector transformation [91,93,117], Box-Cox transformation [84], and numerical into binary [85].
Dimensionality reduction, as one of the important approaches to data reduction, is to remove the irrelevant and redundant variables to reduce the complexity of analysis and the generated models, and also to improve the efficiency of the whole modeling processes. The widely used approaches from the reviewed articles include regression [34,44,45,83,86,89,110,126,127], analysis of variance (ANOVA) [27,79], GA [55,83], Las Vegas filter [60,78], Pearson coefficient [79], Cramer’s V correlation coefficients [85,87], and so on. Clustering [38,90,101,126], aggregation [34,87], and sampling [82] based approaches were applied to reduce the data numerosity. PCA or the modified PCA [64,65,83,92,94], and multi-dimensional scaling [84] were employed to compress the representation of the original data. Only a few of the researchers conducted discretization for continuous attributes at the stage of preprocessing.

4.2. Application of DM with Big Data in Different Stages

DM with Big Data has been applied in different stages including design, production, sale, service, and recycling for different scenes, such as product design improvement, manufacturing process optimization, PMO, production process monitoring and control, quality management, CRM, SCM, and so forth. The application of DM with Big Data for the procurement of electronics components at the production stage has not been studied in the reviewed articles. Meanwhile, few reviewed articles have devoted their research into product distribution and logistics that mainly includes order process, inventory management, and product transportation at the stage of sale and service, and thus, we take them into SCM as a whole. The order management as an extension of CRM will also be considered as CRM. Quality improvement (QI), development time/cost estimation (DTCE), PMO, AEC/APC, CRM, and SCM considered in the review are the typical knowledge areas to enhance the intelligence and efficiency of lifecycle management and control in which the data-driven QI is closely related to product design improvement, manufacturing process optimization, and quality management. AEC/APC, as the core of production process monitoring and control in the electronics industry, is also used to enhance product quality or yield. The task of AEC/APC is always conducted online during the manufacturing process and has attracted a lot of research. The description of these knowledge areas and their tasks is summarized in Table 8.
In the following sections, from Section 4.2.1 to Section 4.2.3, the summarization will not be taken as a function alone because it is employed to characterize the product/process and then to facilitate the functions of prediction, classification, clustering, and so forth. The SA-oriented and/or KD-oriented categories of different DMTs in an article will also be included.

4.2.1. Application of DM and Big Data for Design

The design stage includes the product design followed by process planning. Product design is to create a new product while process planning is to translate product design requirements to manufacturing process details that act as a bridge between product design and manufacturing. Capodieci [14] presented a review of the data analysis and machining learning for the design process yield optimization in electronic design and semiconductor manufacturing. Another 17 articles related to DM application in the stage of design have been retrieved and summarized in Table 9, and the following findings can be achieved:
(1) The quality improvement of product design [28], the prediction of development cost and time [34,37], and the product customization [38,42] are the main applications of DM in product design.
(2) The optimization of the manufacturing process parameter is the main task of process planning, such as the parameter optimization of stencil printing process (SPP) [26,27,36], reflow soldering [29,31,32], fluid dispensing for microchip encapsulation [33], wave soldering [35,41], and hot solder dip [39] for component surface mounts on PCBs. These models always combined ANN, SVR, and regression for the quality prediction with GA for parameters optimization [26,31,32,33].
(3) KD-oriented ANN is the widely used DMT. The pervasive function is prediction and has been widely employed for parameter optimization and determination of its effect [26,27,32,33,34,35,36] followed by clustering and association. Clustering was mainly employed to identify similarity products, process plans, and parameters and no supervision classification was conducted to support more efficient and reasonable manufacturing [39,40,41]. Association was mainly used to identify purchase behavior and therefore, develop marketing competitive products [38,42].

4.2.2. Application of DM and Big Data for Production

The product in its final shape is obtained in the production phase. The knowledge areas of DM with Big Data application in the stage of production include PMO, AEC/APC, and quality improvement. The reviewed studies are summarized in Table 10, Table 11 and Table 12 for PMO, AEC/APC, and quality improvement, respectively. The following conclusions can be obtained for the application of DM with Big Data for PMO:
(1) The scheduling optimization, cycle time, complete time, and output time prediction for wafer fabs have attracted most of the research. The reason may be that wafer fab usually takes several months and is the top priority for improvement. Therefore, cycle time reduction is always an important task in controlling a wafer fab factory. To become an agile supplier, shortening the cycle time of every operation is critical [51].
(2) Hybrid approaches combining fuzzy logic/clustering with ANN have been developed for different applications because of the un-deterministic characteristic factors that require fuzzy expressions, such as the release time, average fab utilization, total queue length on the processing route, and cycle time. Since they cannot be determined accurately, a certain probability distribution is needed. The fuzzy based DM approaches facilitate more realistic pattern extraction.
(3) The tasks realized by ensemble approaches combining fuzzy c-means (FCM) or SOM-based clustering with ANN-based prediction were pervasive. The purpose of clustering is to classify objects according to its similarity considering various features and therefore, improve the accuracy of prediction. The results show that the hybrid approaches with clustering-based pre-classification or post-classification are some of the most accurate approaches used to estimate the cycle/lead time or the complete date and obtain an optimization scheduling plan [51].
Tens of thousands of monitoring and online detection measurement values, and hundreds of electrical test parameters timely measured at different positions on a wafer during the fab process facilitates the Big Data application for production control. The typical knowledge area of these applications is AEC/APC that is a collection of tasks including FDC, R2R control, SPC, and VM to reduce the process variation and meet the process target for yield (quality) enhancement.
The related literature is summarized in Table 11 from which we can see that the outlier detection was conducted online and the time series analysis was employed for anomaly detection while the prediction function was mainly used for VM and R2R. Classification and clustering have been widely used for FDC. Some preprocessing like regression [87,88,89] was conducted to identify the main effects on observation variables before classification or clustering model establishment.
The data-driven mechanism is one of the pervasive approaches to FDC [114] and the summarization in Table 11 also indicates that FDC (or FD only) is the most researched task of AEC/APC [84,85,86,87,88,89,90,91,92,93,95,97,98,99]. The wafer fab is a complex and lengthy process that involves hundreds of process steps, and early FD gives engineers more time to perform appropriately to avoid serious equipment abnormalities [84,85,86] while fault classification can be considered as the combination of fault identification and diagnosis in order to identify the main effects on observation variables, concentrate on the process variables related to diagnosing abnormalities, and then to determine the cause of the observed out-of-control status that can facilitate the process recovery by removing the cause of the fault to reduce yield loss [86,90].
R2R control consists of several levels including real-time control, single-process R2R control, inter-process R2R control, and factory-level R2R [79]. FDC stands for a representative technique of real-time control. Single-process R2R control focuses on an individual process module while the selected R2R related articles concentrate mainly on inter-process R2R that deals with the process control of two or more inter-related process modules [80,86] combined with other tasks like FDC. The factory-level R2R has only been considered by a few research papers [79] that are used to enhance the results of electronic tests in wafer acceptance tests and yield circuit probe tests.
The reviewed VM-related literature utilized MLR [80], ANN [81], SVM(R), and DT [82,83] based on the production equipment data and preceding metrology results to predict every wafer’s metrology measurements, which fills a lack of physical measurement by prediction that enables the measurement of every wafer for every process step on all capable equipment available in the fab, thus, allowing significant improvement of process control and product quality, reduction of operational cost, and production cycle time [81,83].
In SPC, significant characteristics are monitored such as the failure percentage of wafer bin maps [93] and the soldering quality [94]. The process control chart, as a widely used approach to SPC [93,94], has been used to diagnose and identify the variability of the fab process. The statistical process system can help detect defects that might originate from the process steps to improve quality and eliminate the need for expensive post inspections [94,96]. With increasing the demand for high-quality products and reliable processes, multivariate statistical process control (MSPC) has been developed to ensure that equipment is “statistically controlled” by monitoring two or more related quality characteristics simultaneously [105].
The above review indicates that AEC/APC conducts monitoring of online measurements of specific process steps, and undertakes corrective action to ensure that the parameter being measured remains within the desired limits. However, the integration of FDC, R2R, SPC, and VM has been considered only in a few research papers [86], requiring further research from different aspects such as the consistency and integration of data, unified frameworks, high-efficiency algorithms and platforms, and so on.
The application of DM with Big Data for quality improvement of electronic products, especially for wafer fab at the production stage was summarized in Table 12. One of the research papers deals with predicting the performance (yield) of a manufacturing process or system in terms of critical functional characteristics. Months may pass before a chip is completed; hence, there is a great interest in mining production data to predict its performance prior to the final testing of the wafers [100,101,102,103,104,105,106,107,108]. In order to infer to the possible causes of faults and manufacturing process variations in semiconductor manufacturing after the whole fab process is completed, the clustering, classification, and association analyses are conducted based on different DMTs such as k-means, SOM, SVM, and decision tree to identify critical poor yield factors and determine the root cause of low yield. On this basis, the related process parameters can be adjusted to ensure future quality based on post hoc diagnosis [110,111,112,113,114,115,116,117,118,121]. Some studies combined with sequential pattern mining to identify the sequence association events between different operations during the manufacturing [119,120].
Moreover, more than hundred test items and millions of rows of data for wafers will be generated after testing, per day. According to the basic requirements of quality management, an essential work is to analyze these test items one by one according to different specifications and requirements. In accordance with the traditional mode of work, more than a hundred process capability indexes should be calculated step by step and the quality characteristics should be evaluated one by one with enormous and complicated operations. Meanwhile, it is difficult to determine the association between these indexes and present a comprehensive summary of the overall performance of the product. The application of Big Data for the quality management and analysis can easily generate a traditional single index process capability analysis report. More importantly, it can excavate many new results from the Big Data set [114].

4.2.3. Application of DM and Big Data for Sale, Service, and Recycling

The stage of sale, service, and recycling (SSR) is to store produced products in a warehouse and transport them to customers in logistics, and then the customers use the product while a manufacturer provides remote service. If it can no longer be used, it comes to the end of its life such as remanufacturing and disposal [8].
The summarization of DM application in the SSR stage is given in Table 13 and it can be seen that most of the applications related to CRM involve marketing and sales prediction [125,126,127], customer service [129], and the SCM to achieve greater efficiencies and effectiveness in delivering customer value [130]. The detailed information indicates that one direction of the research is to mine the behavioral characteristics of customers on the product and maintenance, and therefore, identify customer’s requirement for customer attraction and retention [123,129]. Another one is to predict the marketing demand and price for customer identification and development, and therefore, to facilitate the plan optimization of production, procurement, and resource [125,126,127]. Only one article is related to the recycling of electronic products considering the storage behavior of customers [124]. From Table 13, it can also be seen that the prediction of marketing requirement and determination of a more reasonable price are the main functions while the clustering and classification have been taken to classify products and customer’s requirement and identify the purchase feature of different customers. Text mining was utilized to excavate the knowledge from interaction records in some cases [123].

4.2.4. Summarization of DM with Big Data Application in Different Stages

Figure 4 illustrates different functions used by the selected articles applied in different stages. It can be seen that the prediction, classification, and clustering functions are the top three functions employed for mining patterns at different stages. The six functions have been used in the production stage which indicates that there are diverse requirements of DM and Big Data application at this stage for different purposes, while the time series analysis and outlier detection function have seldom been used in the stage of design and SSR.
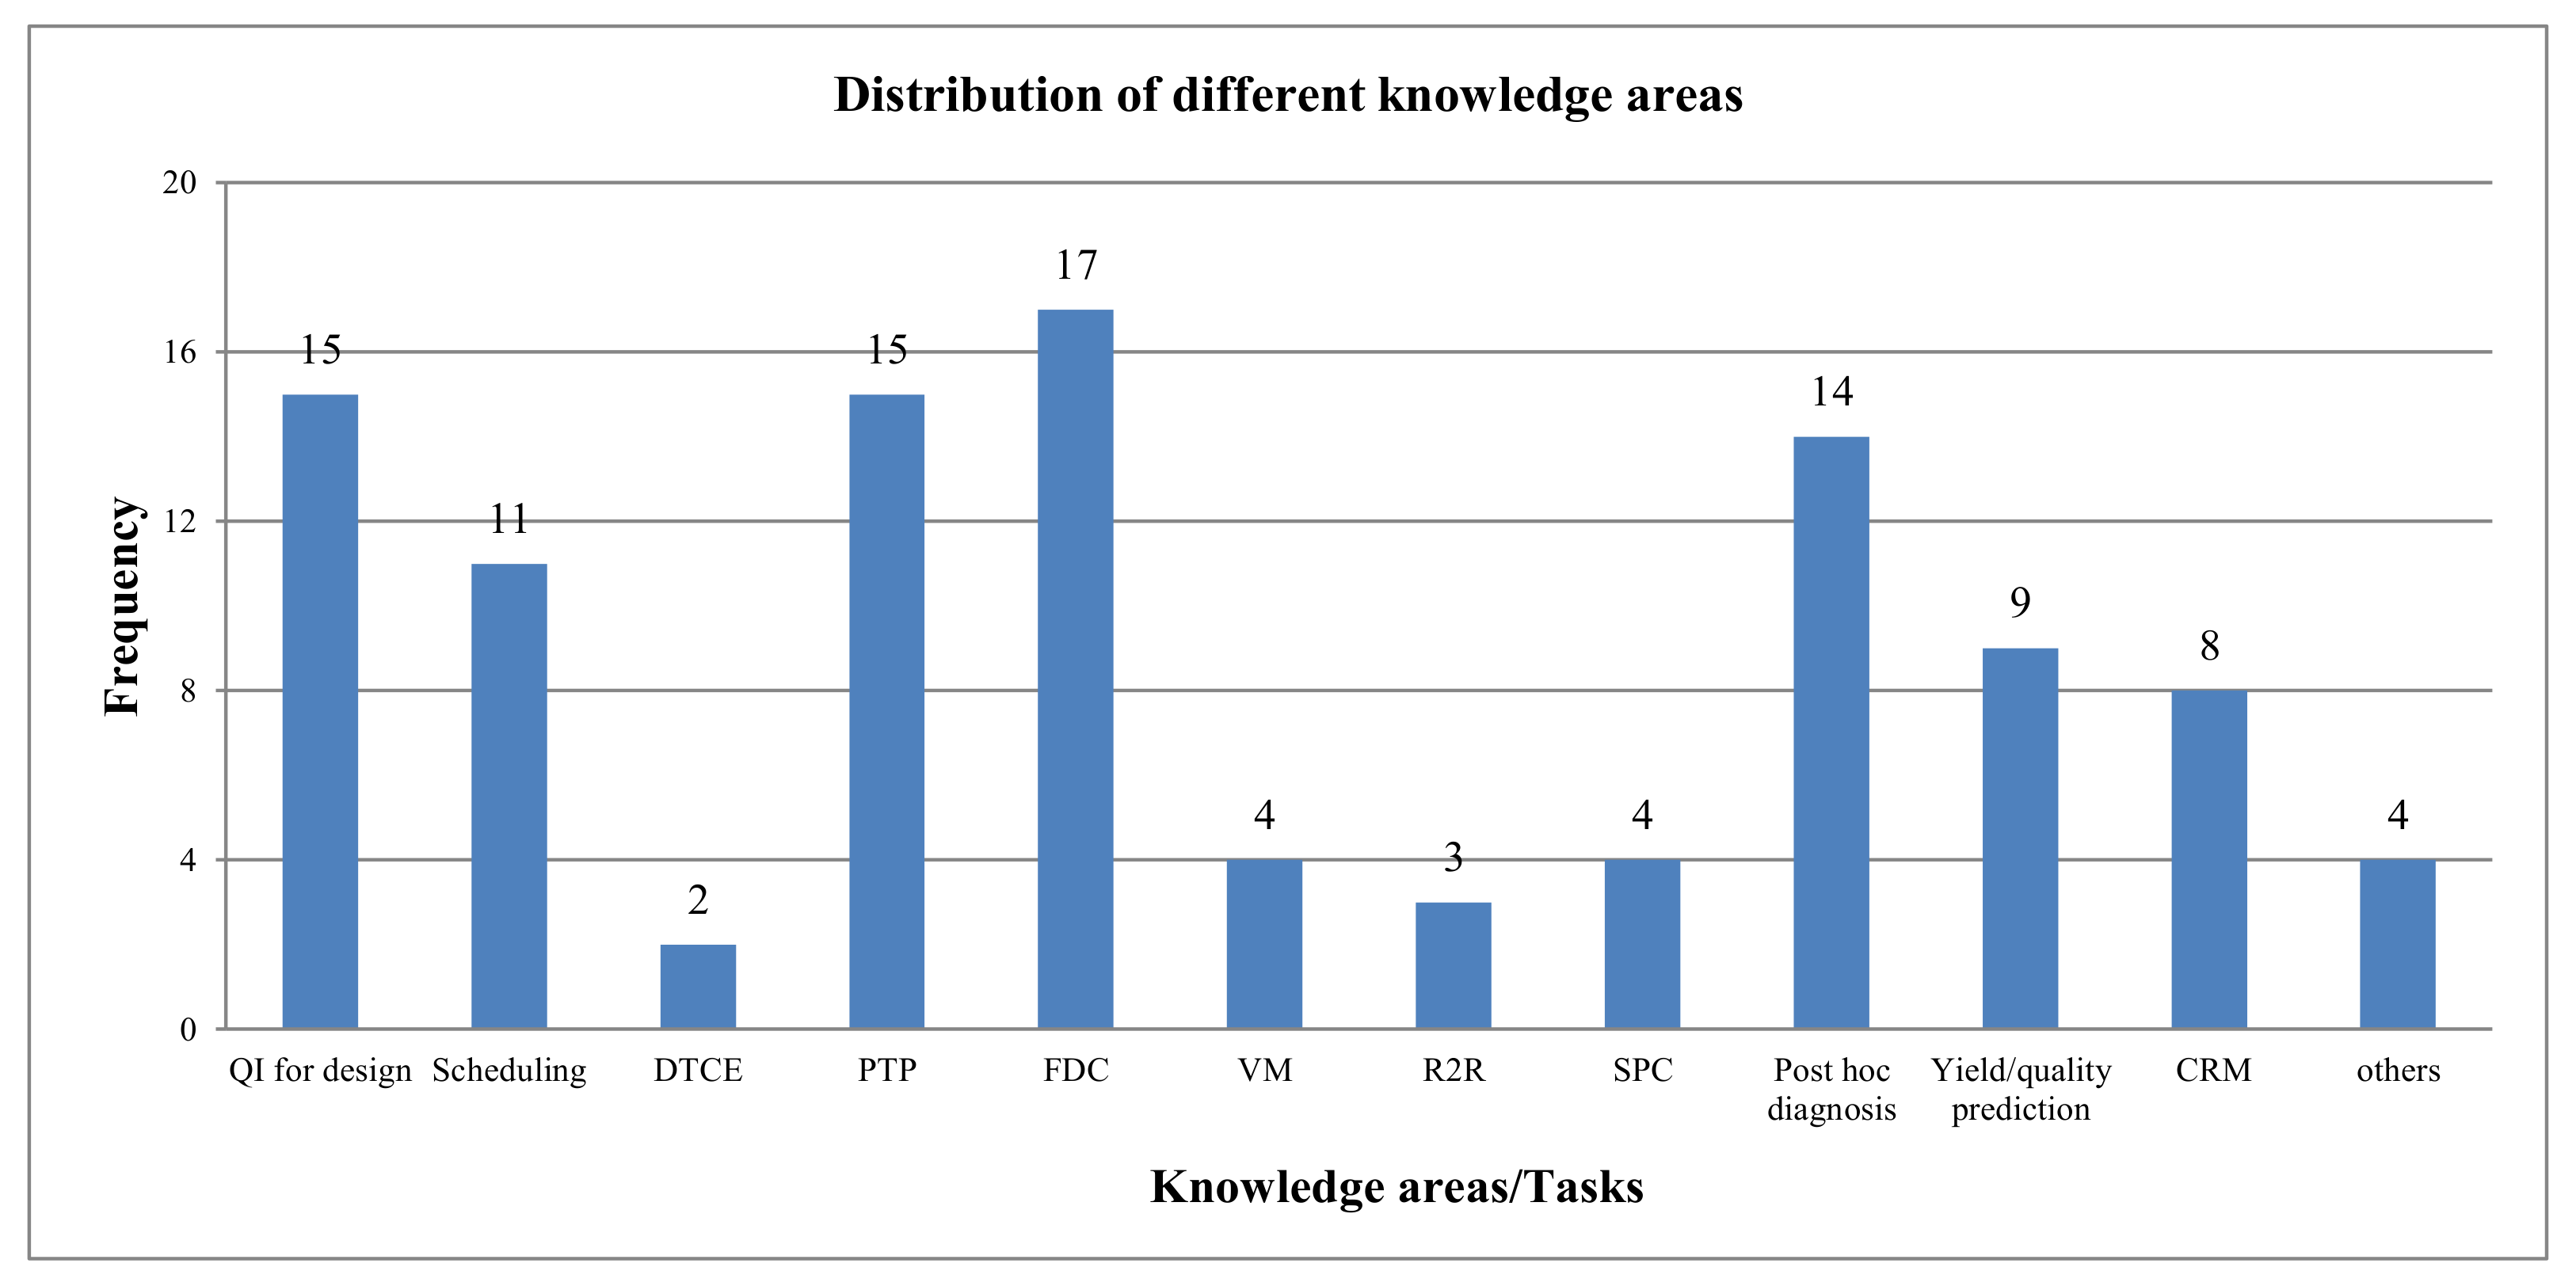
Figure 5 illustrates the distribution of different knowledge areas considering the tasks of QI for design/production, DTCE, PTP, FDC, VM, R2R, SPC, CRM, and SCM according to Table 9, Table 10, Table 11, Table 12 and Table 13. The frequency in Figure 5 indicates that the QI for design, scheduling optimization, production time prediction, FDC, post hoc diagnosis, production yield/quality prediction, and optimization of sale and service for CRM are pervasive knowledge areas and tasks.
The statistic of different categories of DMTs adopted in the 105 articles for different knowledge areas are conducted and the results are illustrated in Figure 6 from which we can see that the pervasively used DMTs are hybrids or integrations of the SA-oriented and KD-oriented DMTs, especially for the knowledge areas of PMO, AEC/APC, and QI for production, followed by the combination of different KD-oriented DMTs or only one KD-oriented DMT. However, only one SA-oriented approach and the ensemble of SA-oriented DMTs have been widely adopted by researchers compared to other approaches.
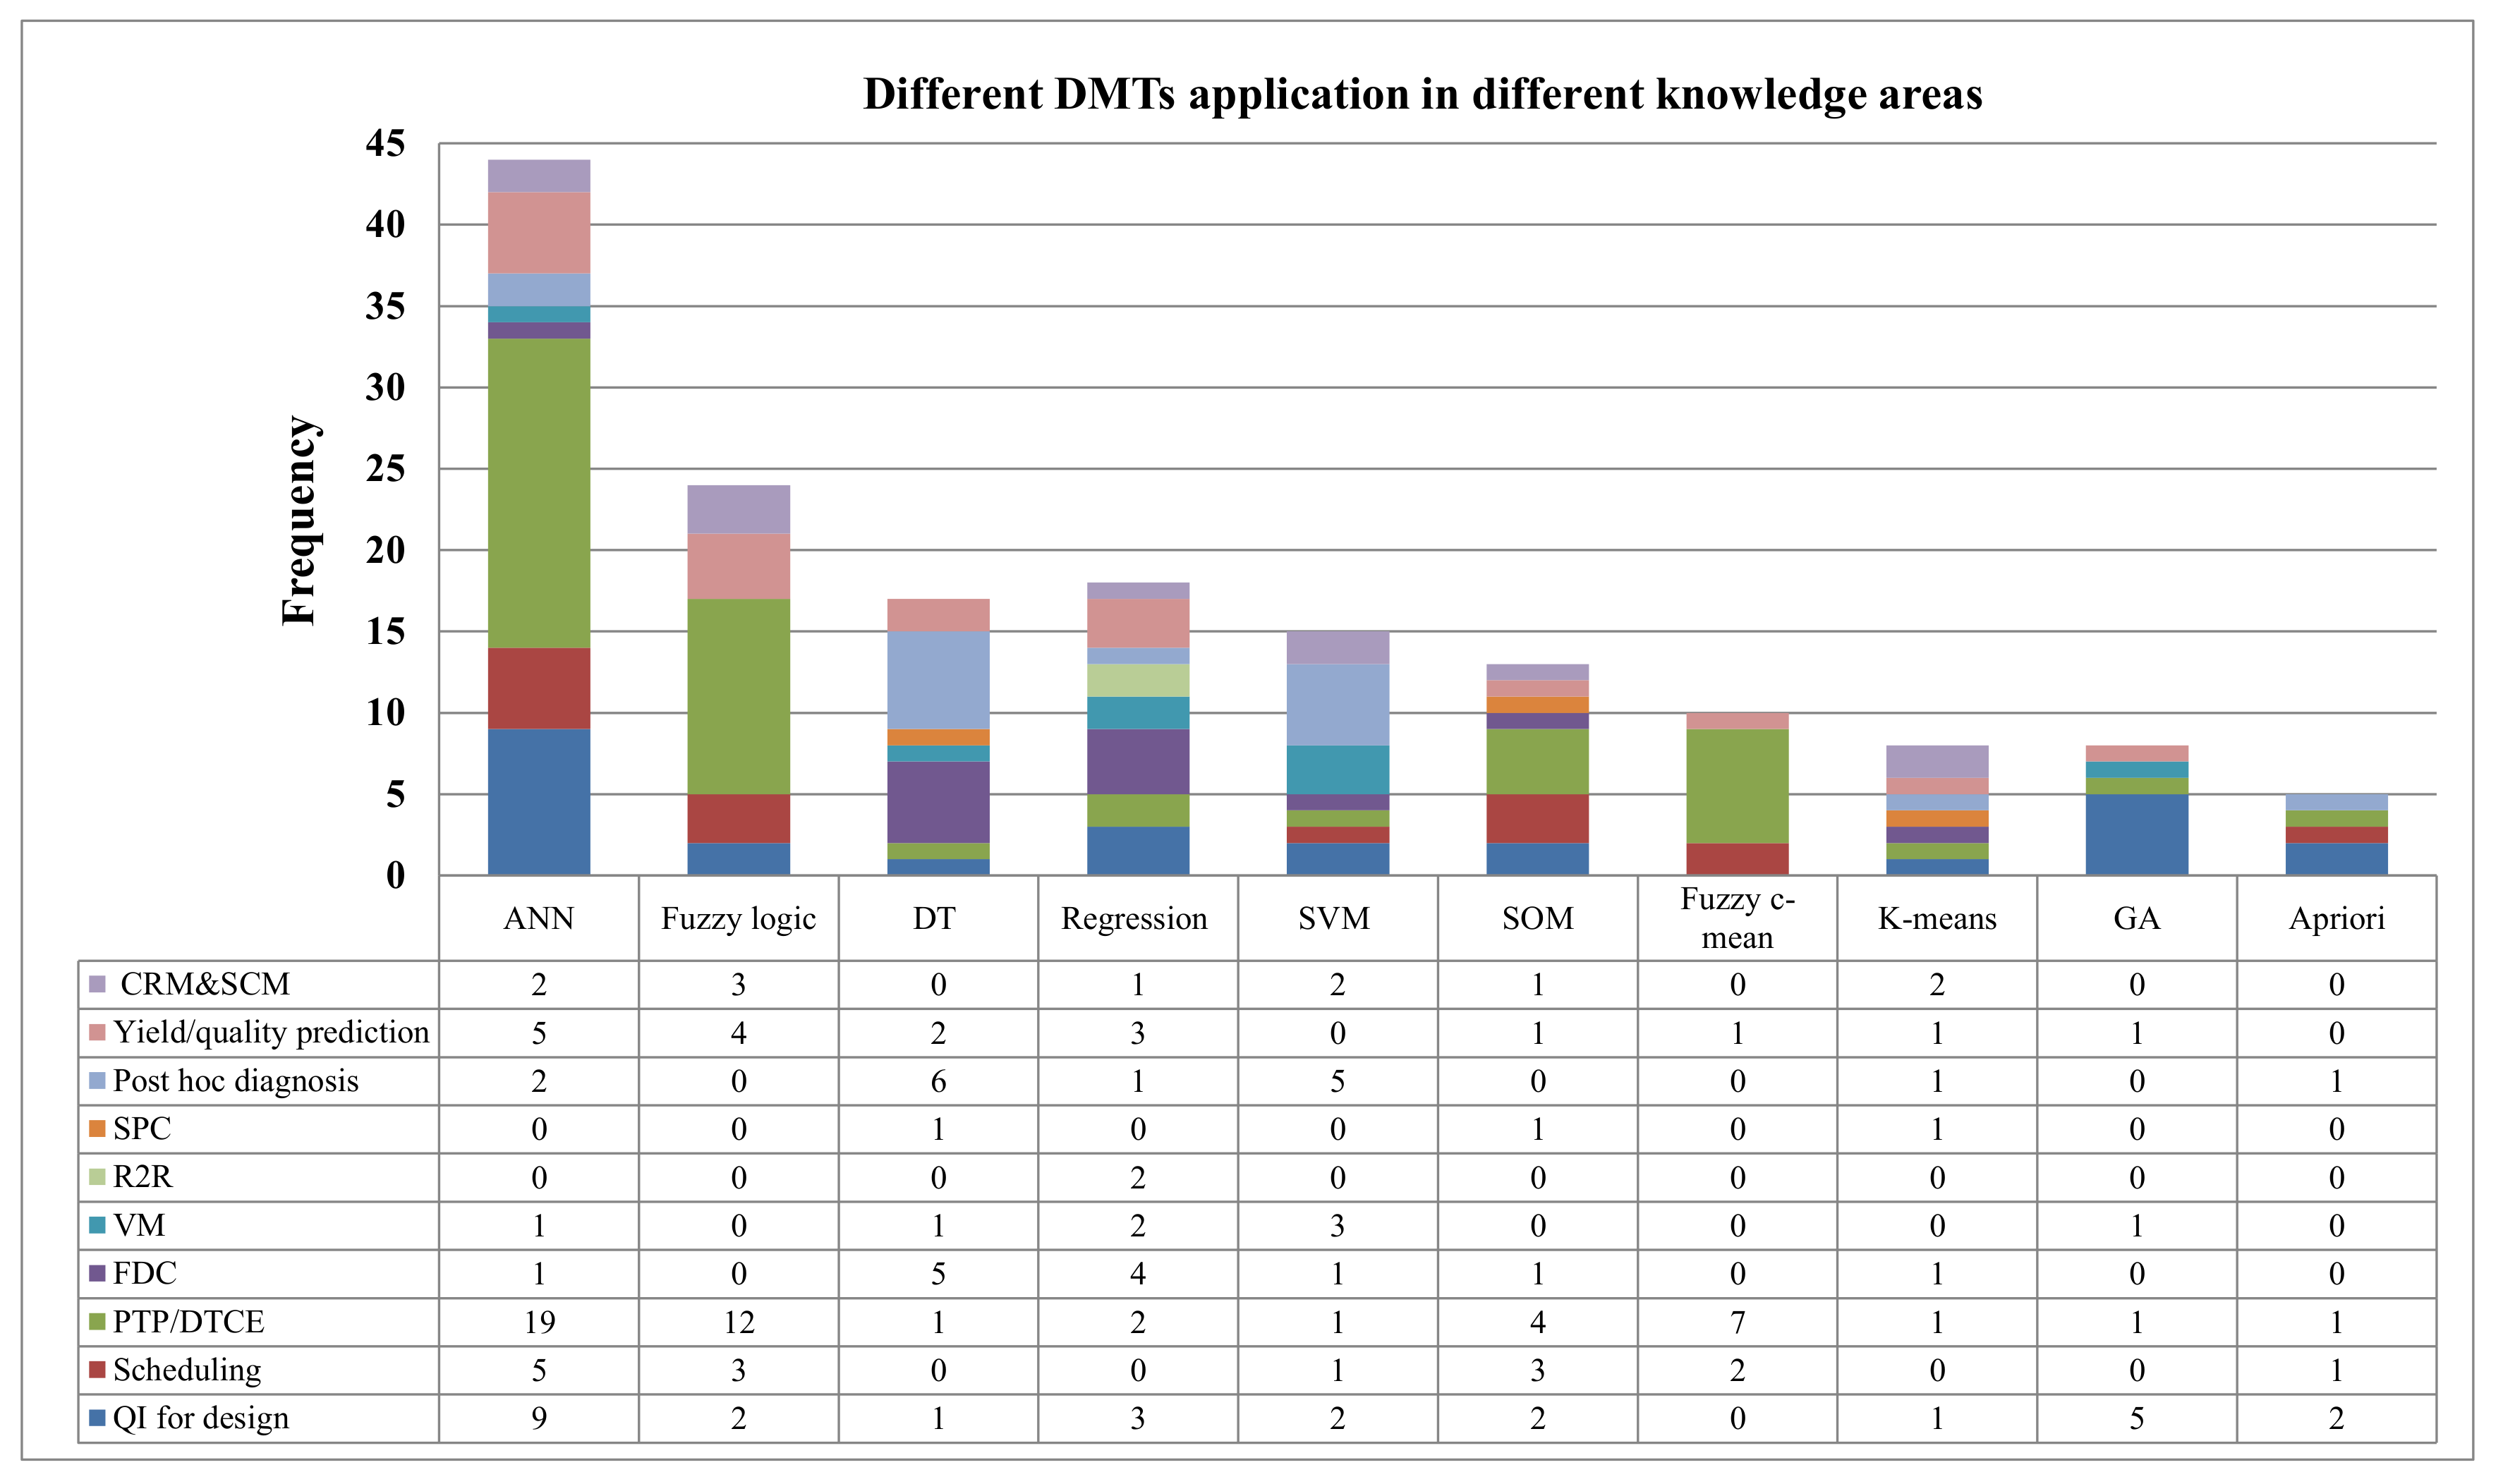
The commonly used 10 DMTs including ANN (back propagation neural network, fuzzy neural network, and so forth), fuzzy logic, DT (CART, CHAID, C5.0, and so forth), regression (MLR, MRA, stepwise regression, PLSR, logistic regression, and so forth), SVM (SVR, ASVR, and so forth), SOM, FCM, K-means, GA, and Apriori are given in Figure 7. Figure 8 presents different DMTs in different knowledge areas.
It can be seen that the top DMT used is ANN followed by fuzzy logic because many ANNs are combined with fuzzy logic to solve the scheduling optimization and production time prediction. ANN has been applied in eight areas of the above-mentioned knowledge areas except for SPC and R2R. Fuzzy logic has been used mainly for the production time prediction, yield/quality prediction, and the optimization of CRM/SCM. The DT has been widely employed for FDC and post hoc diagnosis. The regression has been pervasively used for feature selection and prediction of quality, yield, development cost, VM, and so on. The SOM, K-means, and FCM have been used for clustering, especially for the pre-classification of jobs while conducting scheduling optimization and production time prediction. GA has been used to find optimal levels of process/product parameters [26,27,31,32,33,34,35,36], which can also be used to optimize parameters of DMTs such as SVM [55,83] and fuzzy clustering [105].

4.3. Software Used for the Selected Articles

Many algorithm engines, tools, and platforms have been developed to implement functions and related DMTs. Predictive analytics today summarized the top 50 free DM software [131], including Orange, RapidMiner, Weka, KNIME, SpagoBI, Anaconda, Octave, and so forth. Some commercial software including Sisense, Oracle Data Mining, Microsoft SharePoint, IBM Cognos, Dundas BI, SAP Business Objects, Matlab, Statistic, SAS EM, SPSS Clementine (IBM SPSS Modeler after 2009), Tanagra, Qlik Sense, and so forth have also been widely used by researchers and practitioners.
The different tools shown in Table 14 have been used for various purposes in mining applications from the reviewed literature. The category of software in the reviewed articles can be categorized into spreadsheets, statistical software package, DM software package, general purpose software, special purpose tools, and high-level languages.
Some statistical software packages such as MiniTab, SAS, SPSS, and Statistics were preferred for implementing SA-oriented methods such as MRA and ANOVA. Spreadsheet-application excel was mainly used for data preparation and preprocessing. However, commercial software packages such as SPSS Modeler, SAS Enterprise Miner (SAS EM), were only used in a few of the applications.
The general purpose software Matlab and special purpose packages based on Matlab were used in various applications for the design and production of QI, PMO, and CRM. They were mostly utilized to realize ANN, fuzzy logic, SVM, and SOM supported by several open source toolboxes such as NeuroSolutions, Neural Network, NeuralPower, Fuzzy Logic, LibSVM, and SOM. The association, outlier detection, and time series analysis functions were mainly conducted by commercial software packages such as SAS EM [38], and RapidMiner [42].
Some high-level languages such as C/C++ [94,120] and Visual Basic [70,71,72,73,75,76,77] were used for SOM, fuzzy c-means, fuzzy logic, ANN, and the combination of these approaches for its flexibility for researcher to design or combine particular methodologies considering domain knowledge in handling and analyzing the data. Meanwhile, some platforms such as the online system [79], fab-wide FDC [80], VM system [83], online time series prediction system [88], and wafer bin of map clustering and classification systems [117] have been developed for different tasks of AEC/APC based on high-level languages. However, the commonly used platforms for developing DM or Big Data application system such as WEKA [28], RapidMiner [42], R software environment [122], and Python [84] have been utilized by only a few of the researchers, indicating that the systematized applications of these results still require further development by practitioners.

5. Diagram of Data Content for Different Knowledge Areas and DM Framework for the Electronics Industry

The product lifecycle processes carry a huge number of structured, semi-structured, and unstructured data. Big Data analytics and DM technology can be used to make a deep analysis of historical lifecycle data, to discover knowledge, and to optimize the process of PLM. A framework with four modules including data sensing and acquisition, data processing and storage, DM model development, and Big Data application in PLM was presented by Zhang et al. [1]. However, the summarization and classification of lifecycle related data and its utilization by different knowledge areas have not been discussed. Meanwhile, the special application scheme for electronics manufacturing has not been considered. Therefore, the establishment of a diagram of data content for different knowledge areas and DM with Big Data framework for the electronics industry can guide companies to accumulate related data and develop DM strategy from the view of lifecycle and overall business chain, which can also facilitate researchers and practitioners to select appropriate techniques and better utilization of data for knowledge discovery.

5.1. Diagram of Data Content for Different Knowledge Areas

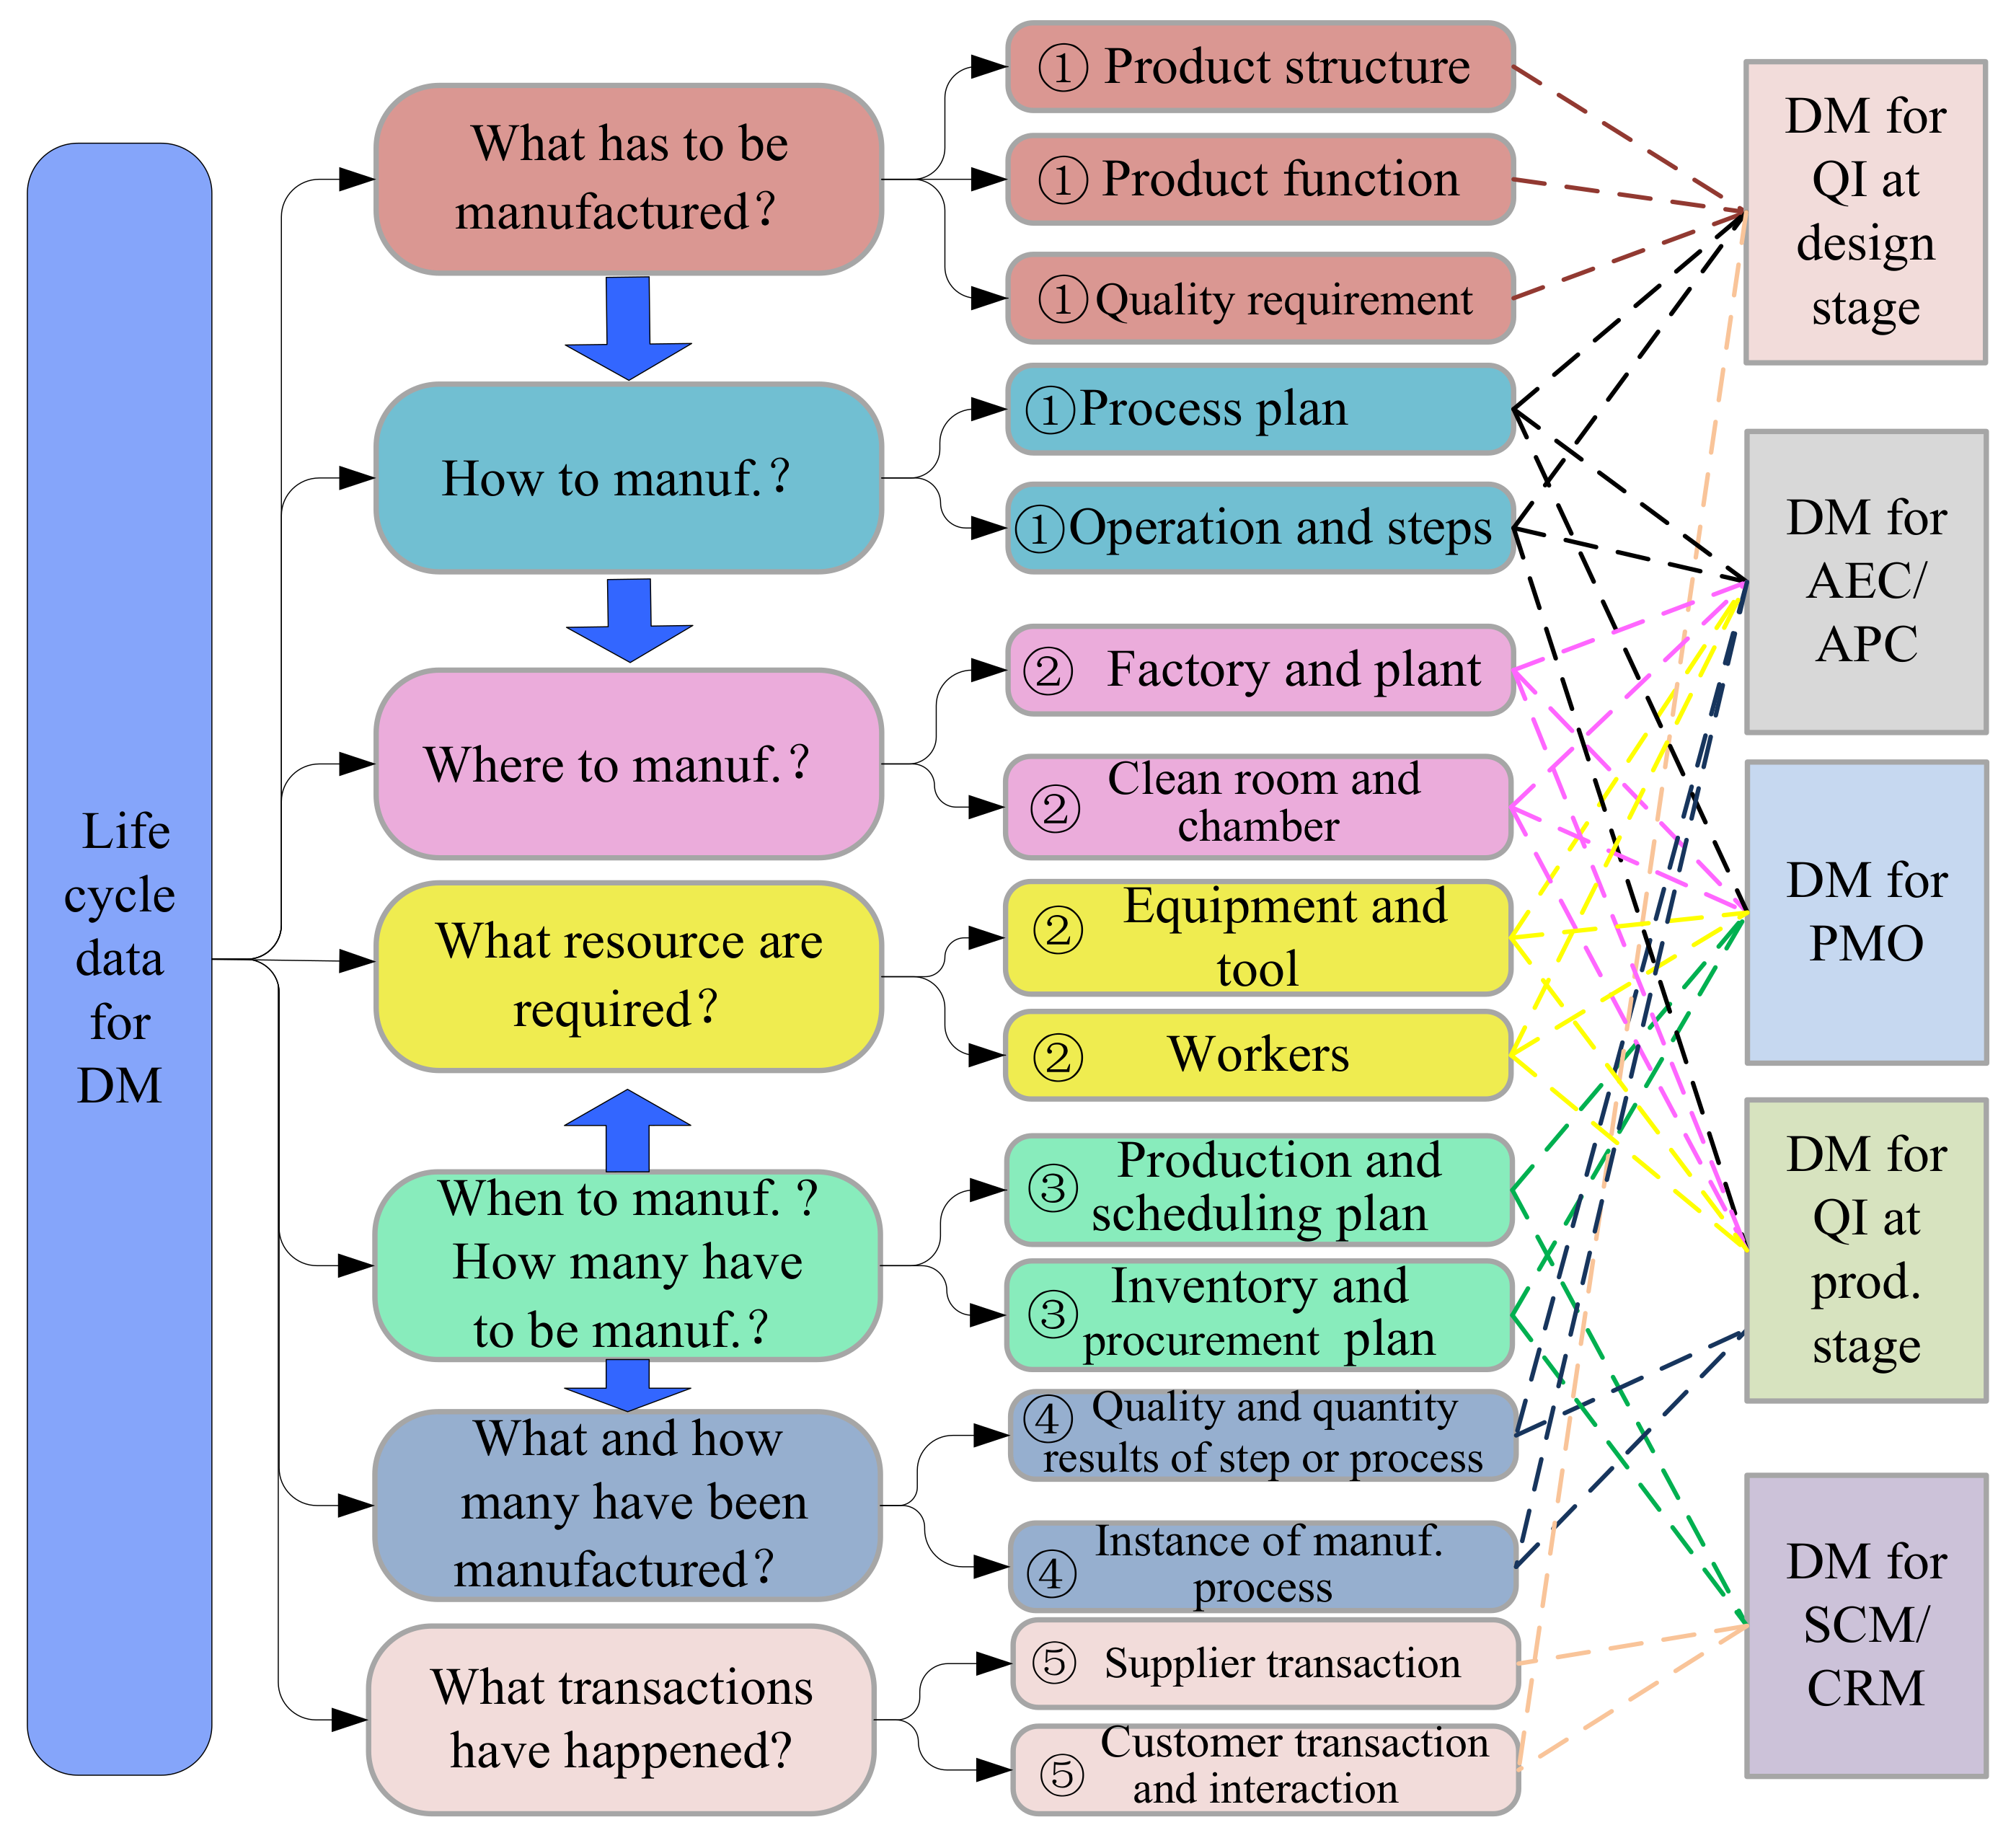
From the view of electronics lifecycle, the main data for different knowledge areas can be divided into engineering data, enterprise resource and environment data, production plan and arrangement data, manufacturing result data, and transaction and interaction related data. Figure 9 illustrates the main content of each category and its application for different knowledge areas. The detailed description of each category is given as follows.
① Engineering data: It includes product structure and function, manufacturing process plans, and quality requirements to define what is to be manufactured and how to manufacture. Relevant DM with Big Data applications have been conducted to improve product quality and customers’ satisfaction or to optimize process parameters. This data can be stored in different systems such as PLM and computer-aided process planning system with structured (bill of materials), semi-structured (requirement reports), and unstructured (design model or drawing) styles.
② Enterprise resource and environment data: Resource data relates to the workplace, equipment, and tools that specify where and what resource are required to manufacture the product, which also includes data on process statuses, collected in real time by smart sensors and the traced data based on RFID placed on transportation robots. In common, these data are structurally stored in ERP, MES, and DCS that can be used for the optimization of process control such as AEC/APC and production management. Taking an example from wafer fab, the equipment status data such as chamber pressure, gases flow, and chuck temperature are collected in real time by sensors placed on tools, and valuable data that are generated from clean room environment monitoring [101].
③ Production plan and arrangement data: These data include the plan of the project, the hierarchy production plan, the inventory/material and procurement plan, and scheduling that defines when and how many products have to be manufactured. Different plans can be stored in ERP and MES with a structured style, which has been widely used for the optimization of PMO tasks such as production time prediction and scheduling optimization at the production stage.
④ Manufacturing result records: Result records define the quality and quantity of products at a certain time and workplace. They are always accumulated in MES, quality management system, ERP, and storage management system with a structured style. RFID has been widely used for product lifecycle management in recent years, and the traced data generated automatically at different stages through RFID placed on materials, semi-products, and finished products can also be taken as the data of manufacturing result. Taking an example from the data involved in the wafer fab, it is generated at various steps including inline through metrology steps that measure test wafers and product wafers such as parameters of critical dimension, film thicknesses, film resistances, and so forth. It also includes electrical test and final yield data. DM-based post hoc diagnosis, yield prediction, and parameters adjustment are used to ensure the future quality has been conducted based on different steps of the result. They can also be combined with enterprise resource and environment data for AEC/APC.
⑤ Interaction and transaction data: Owing to the fast development of online trading and electronic commerce in the past decades, a large amount of records related to transactions and online interactions between upper stream supplier, middle collaborator, downstream customer have been accumulated. The structured transaction data, semi-structured or unstructured interactions have been widely used for the optimization of SCM and CRM such as marketing analyses and product design improvement based on the feedback from customers at the design stage, procurement and inventory optimization at the production stage, price and demand prediction, customer identification, attraction, retention, and development at the SSR stage. Text mining techniques have also been used to excavate the pattern from the interaction text and were combined with DM for the final knowledge discovery [123]. Meanwhile, RFID-based records can be used for product tracing in transaction, service, and recycling.

5.2. Data Mining with Big Data Frameworks for the Electronics Industry

On the basis of the aforementioned review, a framework of DM with Big Data applications in the electronics industry is presented in Figure 10 in which the stage of design and production corresponds to the beginning of lifecycle, and the sale and service can be taken as the middle of lifecycle, while recycling is at the end of lifecycle, respectively [1,8].
Each stage of the lifecycle corresponds to different application scenes. The DM application of product and manufacturing process design mainly includes the product design, manufacturing process design, and marketing with relevant knowledge areas, such as quality improvement, development cost and time prediction, product customization, manufacturing parameter optimization, and SCM. The equipment management, production management, and procurement are the main application areas of DM with Big Data in the production stage with typical knowledge areas such as AEC/APC, PMO, QI, and SCM. The application of the DM with Big Data for sale and service cannot only be support for quality improvement and customization design but also optimize logistics and facilitate customer service and maintenance. The recycling attracted less attention from DM with Big Data application in the electronics industry, which could be used in remanufacturing, reuse, and environment protection, considering the knowledge areas of product recovery, remaining life prediction, and reverse logistics optimization.
The details of knowledge areas of different stages have been summarized in Section 4.2. The quality improvement for design and production can be further divided into quality (yield) prediction, classification, description, and parameter optimization. Post hoc diagnosis can be taken as the quality description at the production stage with the purpose of process parameters adjustment to ensure future quality. The tasks of AEC/APC that consists of FDC, R2R control, SPC, VM, and so forth are also for quality enhancement, and therefore, the quality improvement at the production stage and AEC/APC are not a disjoint division here. The DM and Big Data application in PMO is a collection of scheduling optimizations, cost/time prediction, and so on.
SCM is used to optimize the logistics for material supply at the beginning stage of the lifecycle and it can also be used to achieve greater efficiencies and effectiveness in delivering customer value at the end of the lifecycle. The application of DM or Big Data tools in CRM is an emerging trend in the global economy. Analyzing and understanding customer behaviors and characteristics is the foundation of the development of a competitive CRM strategy so as to acquire and retain potential customers and maximize customer value [3]. The tasks of customer identification, attraction, retention, and development of CRM can be realized through Big Data-based marketing prediction, personalized service, predictive maintenance, remote online diagnosis and so on.
Data preparation such as data acquisition, accumulation, and storage for different knowledge areas and applications can be guided by the diagram of data content for different knowledge areas given in Section 5.1. The commonly used data preprocessing techniques including data cleaning, transformation, reduction, and discretization that can utilize the preprocessing approaches summarized in Section 2.2 and Section 4.1, based on the requirement of application areas and the quality of data. DM, in a narrow sense, for each function, can be implemented based on some pervasive DMTs summarized in Section 4.2.4. The interpretation, evaluation, and implementation software can be conducted by combing experts’ knowledge with performance indicators given in Section 2.4, which is not given in the framework because it has many selections in practice. The final purpose of the DM application has been proved by many researchers and practitioners. This framework provides an option for different types of companies and expects for further extension.

6. Conclusions and Future Research Directions

This paper presents a comprehensive review of DM with Big Data towards its applications in the electronics industry. We can see that the DM with Big Data has been applied to different scenes including product design improvement, manufacturing process optimization, PMO, production process monitoring and control, quality improvement, CRM, and so forth.
Customer-oriented product development and process plan optimization are the main applications for product design improvement and manufacturing process optimization in the stage of design. Prediction was the most frequently used DM function observed in the reviewed articles. ANN and regression were the widely used DMTs for the prediction.
The application of DM with Big Data for process monitoring and control, PMO, and quality improvement in the stage of production has attracted the interest of most research. On the one hand, sophisticated DM and Big Data related techniques such as FDC and R2R have been developed for the wafer production process monitoring and control to reduce defects and improve the quality/yield based on the data collected from manufacturing processes, equipment/tool/environment statuses, and process parameters. The functions of classification and clustering were widely used for FDC based on related DMTs such as DT, SVM and ANN, k-means and SOM, while the prediction function was widely presented for VM based on ANN, regression, and SVM. On the other hand, prediction, clustering, and the combination of the two are the most frequently employed functions for the optimizing scheduling plan and prediction of cycle time/due date based on ANN, FCM, SOM, and a hybrid of fuzzy logic and ANN. Additionally, post hoc diagnosis, quality prediction, and classification were conducted based on the functions of prediction, classification, clustering, and association for future production quality improvement.
Most of the DM applications are related to CRM at the stage of SSR for the purpose of acquiring and retaining potential customers and maximizing customer value based on the records of transaction and online feedback from customers. Prediction, classification, clustering, and time series analysis functions were conducted based on ANN, regression, and SVM for sale and service to mine the consumption habits and predict the marketing price.
The achievement of the reviewed articles facilitates theoretical study and practical application of DM with Big Data to the electronics industry. Nevertheless, the limitation and challenges still exist for future research.
(1) Data preparation and preprocessing. The data of the product lifecycle are characterized by multisource (for example, design, production, and service data), heterogeneity (for example, structured, semi-structured, and unstructured data), and “noise” (for example, incomplete, incorrect, redundant, and inconsistent data) [1]. These problems increase the difficulties of data preparation, preprocessing, and subsequent mining, and also generate misleading patterns. However, little effort has been devoted to handling these problems. Manufacturing organizations with well-established and integrated data collection systems would benefit from a larger application of DM and Big Data [4]. Unified management and storage of the multi-source and heterogeneous data are necessary, and this motivates enterprises to develop DM strategies with dedicated consideration to data accumulation, integration, and consistency. Multi-business requirements integration, concept standardization, unified model establishment, and data/system interface development should be conducted collaboratively to facilitate data utilization. The standardization of operations such as data entry, storage, and maintenance should also be conducted accordingly to ensure the data quality and reduce data redundancy.
(2) The knowledge area of DM application. DM has been widely used in the stage of design and production especially for wafer fab and PCB assembly, and the pervasive knowledge areas include QI, PMO, AEC/APC, and so forth. However, potential applications such as customization production, procurement, warehouse management and inventory balance, and equipment maintenance and repair require more relevant data accumulation and extended mining. The global logistics industry has a large ever-growing amount of Big Data and is flooded with real-time data ranging from smartphones, sensors, and digital machines [9]. However, the application of DM with Big Data in SCM and logistics for electronic products has attracted few special discussions. Meanwhile, little effort has been put on CRM and order management combining the features of electronics such as a large amount of consumers, fast replacement of new products, and fierce market competition.
The patterns and knowledge hidden in Big Data are multidimensional (for example, various departments and lifecycle stages) and scattered, which hinders the effective mining and utilization of the knowledge. Therefore, further studies can be conducted to mine consumer habits and market characteristics to support more reasonable decision for customization product development, market pricing, and maintenance based on the association, prediction, and time series analysis functions. The fast upgrading of electronic products resulting in a large number of e-waste and the use of DM and Big Data to improve the efficiency and effectiveness of its energy saving, recycling, reverse logistics, and reduction of environmental risks are a worthwhile attempt. More importantly, the macro strategy for integrated mining and integration applications for the whole lifecycle should be considered and developed by enterprises.
(3) DM functions and DMTs. The prediction, classification, and clustering are the most frequently used DM functions while the other three functions (outlier detection, association and time series analysis) have been used only in a few situations. The extended investigation of outlier detection, sequential pattern mining, and time series analysis considering time information for online model development and updating could enable companies to respond promptly to dynamic and emerging situations. For DMTs, the parameter optimization of DMTs, such as ANN and SVM, requires continuous study. While FCM and fuzzy logic have been combined with ANN to handle uncertainty, they might be combined with other related mechanisms such as SVM and regression. Additionally, these approaches would handle Big Data with easy implementation and high performance, and more deliberate consideration for industrial applications is required.
(4) Algorithm performance. In general, it is difficult to obtain results with obviously competitive advantage in the existing single algorithm. Generally, a hybrid mining algorithm needs to be constructed based on the characteristics of the problem by integrating different functions and different DMTs so as to ensure the validity and advantage of the algorithm. How to set and optimize algorithm parameters, such as parameters of ANN and SVM, also remains to be further studied. Meanwhile, how to evaluate the advantages and disadvantages of the developed algorithm dynamically and ensure the robustness of the algorithm under certain data loss and redundancy needs to be further compared. How to evaluate the under-fitting and overfitting of algorithms and balance of the two has been paid less attention and requires further consideration.
(5) Software and implementation: Many researchers employed special purpose tools, such as NeuroSolutions, Neural Network Toolbox, LibSVM, Fuzzy Logic Toolbox, and SOM toolbox to implement the developed algorithms. Meanwhile, many approaches were developed by Matlab. A dedicated software package and Matlab integration of the basic engine allowed researchers to implement the proposed algorithm and verify the results more easily. The FDC was always conducted based on online analysis related platforms that were developed independently because of its high-efficiency requirements for data preprocessing and algorithm execution. However, application-oriented software platforms, such as Orange, IBM SPSS modeler, WEKA, and RapidMiner were employed only by few researchers in the reviewed articles. In order to strengthen the connection between enterprises and research, one of the important directions is to directly develop the application platform and then, to validate and optimize the results through practical feedback. In addition, DM technology should be combined with data management and visualization tools that can facilitate user understanding, operating, and utilizing data efficiently.
(6) Knowledge maintenance and updating. Most of the mining was conducted statically and the corresponding data handling was conducted based on batch data. These approaches were difficult to learn by themselves and the patterns obtained were often difficult to update dynamically based on newly accumulated data. Nowadays, data is generated continuously and typically sent in the data records simultaneously and in small sizes. This data needs to be processed sequentially and incrementally on a record-by-record basis or over sliding time windows and also used for a wide variety of analytics and mining. Online mining and learning will be an important challenge for further research.
Acknowledgments

This paper is supported by the National Natural Science Foundation of China (Grant No. 51605169) and Natural Science Foundation of Guangdong, China (Grant No. 2014A030310345). This study also supported by the State Scholarship Fund of China (Grant No. 201608440414).

Author Contributions

Shengping Lv wrote the paper. Hoyeol Kim edited the paper and improved the quality of the article. Binbin Zheng conducted literature retrieval and statistics. Hong Jin proposed the paper structure and wrote the Section 5 and Section 6 of the paper.

Conflicts of Interest

The authors declare that they have no conflict of interest.

Abbreviations

ABODAngle based outlier detectionMRAMultiple regression analysis
ACCAccuracyMROMulti-response optimizations
AEC/APCAdvanced equipment control/advanced process controlMSEMean squared error
ANOVAAnalysis of variance;NBNaive Bayesian
ASVRAdaptive support vector regressionNMINormalized mutual information
AICAkaike information criterionNPVNegative predictive value
CARTClassification and regression treeOLSOrdinary least square
CBRCase-based reasoningOMSOrder management system
CHAIDChi-squared automatic interaction detectiononlinePCAOnline PCA
CRMCustomer relationship managementosPCAOnline oversampling PCA
CUSUMCumulative sumPCAPrinciple component analysis
DBIDavies–Bouldin indexPCBPrinted circuit board
DCSDistributed control systemPLMProduct lifecycle management
DIDunn indexPLSPartial least square regression
DTCEdevelopment time/cost estimationPMOProduction management and optimization
DMData miningPSLAProcess sensor log analysis
DMTsData mining techniquesPTPProduction time prediction
DORDiagnostic odds ratioQEQuantisation error
DTDecision treeQIQuality improvement
EBITEntropy based information theoreticRAERoot absolute error
ERPEnterprise resource planningRBFNNRadial basis function neural network
FACRsFuzzy association classification rulesRERelative error
FCMFuzzy c-meansRFIDRadio frequency identification
FDFault detectionRIRand index
FDCFault detection and classificationRMSESquared root of mean squared error
FDRFalse discovery rateROCReceiver operating characteristic curve
FNFalse negativeRSTRough set theory
FNNFuzzy neural networkR2RRun to run
FORFalse omission rateSCMSupply chain management
FPFalse positiveSDCSegmentation, detection, and cluster-extraction
FPRFalse positive rateSLRStepwise linear regression
PPVPositive predictive valueSNBCSelective naive Bayesian classifier
GAGenetic algorithmSOMSelf-organizing map
GNRGauss-Newton regressionSPCStatistical process control
IAIndex of agreementSPPStencil printing process
KDDKnowledge discovery in databasesSSRSale, service and recycling
LASSOLeast absolute shrinkage and selection operatorSVMSupport vector machine
LB-ABODLower bound-ABODSVRSupport vector regression
LOFLocal outlier factorTETopographic error
MAPEMean absolute percentage errorTNTrue negative
MEMean errorTNRTrue negative rate
MESManufacturing execution systemTPTrue positive
MLRMultiple linear regressionTPRTrue positive rate
m-PRLMMissing values-patient rule induction methodVARERVariance of errors

References

  1. Zhang, Y.; Ren, S.; Liu, Y.; Sakao, T.; Huisingh, D. A framework for Big Data driven product lifecycle management. J. Cleaner Prod. 2017, 159, 229–240. [Google Scholar] [CrossRef]
  2. Choudhary, A.K.; Tiwari, M.K.; Harding, J.A. Data mining in manufacturing a review based on the kind of knowledge. J. Intell. Manuf. 2009, 20, 501–521. [Google Scholar] [CrossRef] [Green Version]
  3. Ngai, E.W.T.; Xiu, L.; Chau, D.C.K. Application of data mining techniques in customer relationship management: A literature review and classification. Expert Syst. Appl. 2009, 36, 2592–2602. [Google Scholar] [CrossRef]
  4. Koksal, G.; Batmaz, I.; Testik, M.C. A review of data mining applications for quality improvement in manufacturing industry. Expert Syst. Appl. 2011, 38, 13448–13467. [Google Scholar] [CrossRef]
  5. Liao, S.H.; Chu, P.; Hsiao, P.Y. Data mining techniques and applications-A decade review from 2000 to 2011. Expert Syst. Appl. 2012, 39, 11303–11311. [Google Scholar] [CrossRef]
  6. Rostami, H.; Dantan, J.Y.; Homri, L. Review of data mining applications for quality assessment in manufacturing industry: Support vector machines. Int. J. Metrol. Qual. Eng. 2015, 6, 1–18. [Google Scholar] [CrossRef]
  7. Donovan, P.O.; Leahy, K.; Bruton, K.; O’Sullivan, D.T.J. Big data in manufacturing: A systematic mapping study. J. Big Data 2015, 2, 2–22. [Google Scholar]
  8. Li, J.; Tao, F.; Cheng, Y.; Zhao, L.J. Big Data in product lifecycle management. Int. J. Adv. Manuf. Technol. 2015, 81, 667–684. [Google Scholar] [CrossRef]
  9. Zhong, R.Y.; Newman, S.T.; Huang, G.Q.; Lan, S.L. Big data for supply chain management in the service and manufacturing sectors: Challenges, opportunities, and future perspectives. Comp. Ind. Eng. 2016, 101, 572–591. [Google Scholar] [CrossRef]
  10. Nagorny, K.; Lima-Monteiro, P.; Barata, J.; Colombo, A.W. Big data analysis in smart manufacturing: A Review. Int. J. Commun. Netw. Syst. Sci. 2017, 10, 31–58. [Google Scholar] [CrossRef]
  11. Cheng, Y.; Chen, K.; Sun, H.M.; Zhang, Y.P.; Tao, F. Data and knowledge mining with big data towards smart production. J. Ind. Inform. Integr. 2017, 9, 1–13. [Google Scholar] [CrossRef]
  12. Global Consumer Electronics Manufacturing-Global Market Research Report. Available online: https://www.ibisworld.com/industry-trends/global-industry-reports/manufacturing/consumer-electronics-manufacturing.html (accessed on 10 October 2017).
  13. Personal/Consumer Electronics Market Analysis by Product (Smartphones, Tablets, Desktops, Laptops/Notebooks, Digital Cameras, Hard Disk Drives, E-Readers) and Segment Forecasts to 2020. Available online: http://www.grandviewresearch.com/industry-analysis/personal-consumer-electronics-market (accessed on 12 October 2017).
  14. Capodieci, L. Data analytics and machine learning for design process-yield optimization in electronic design automation and IC semiconductor manufacturing. In Proceedings of the China Semiconductor Technology International Conference (CSCTI), Shanghai, China, 12–13 March 2017; pp. 1–3. [Google Scholar]
  15. Romero, C.; Ventura, S. Data mining in education. Wiley Interdiscip. Rev. Data Min. Knowl. Discov. 2013, 3, 12–27. [Google Scholar] [CrossRef]
  16. Han, J.W.; Kamber, M.; Pei, J. Data Mining, Concepts and Techniques, 3rd ed.; Morgan Kaufmann: Waltham, MA, USA, 2012; Chapter 1–3; pp. 6–12. [Google Scholar]
  17. Knowledge Discovery and Data Mining. Available online: http://researcher.ibm.com/researcher/view_group.php?id=144 (accessed on 15 October 2017).
  18. Philip, C.C.L.; Zhang, C. Data-intensive applications, challenges, techniques and technologies: A survey on big data. Inform. Sci. 2014, 275, 314–347. [Google Scholar] [CrossRef]
  19. Big Data. Available online: https://en.wikipedia.org/wiki/Big_data (accessed on 15 October 2017).
  20. Big Data. Available online: https://www.gartner.com/it-glossary/big-data (accessed on 15 October 2017).
  21. Wu, X.; Kumar, V.; Quinlan, J.R.; Ghosh, J.; Yang, Q.; Motoda, H.; McLachlan, G.J.; Ng, A.; Liu, B.; Yu, P.S.; et al. Top 10 algorithms in data mining. Knowl. Inform. Syst. 2008, 14, 1–37. [Google Scholar] [CrossRef]
  22. Confusion Matrix. Available online: https://en.wikipedia.org/wiki/Confusion_matrix (accessed on 16 October 2017).
  23. Wang, G.; Xu, T.; Tang, T.; Yuan, T.; Wang, H. A Bayesian network model for prediction of weather-related failures in railway turnout systems. Expert Syst. Appl. 2017, 69, 247–256. [Google Scholar] [CrossRef]
  24. Evaluation of Clustering. Available online: https://nlp.stanford.edu/IR-book/html/htmledition/evaluation-of-clustering-1.html (accessed on 17 October 2017).
  25. Electronics Manufacturing. Available online: http://www.vault.com/industries-professions/industries/electronics-manufacturing.aspx (accessed on 17 October 2017).
  26. Khader, N.; Yoon, S.W.; Li, D.B. Stencil printing optimization using a hybrid of support vector regression and mixed-integer linear programming. Procedia Manuf. 2017, 11, 1809–1817. [Google Scholar] [CrossRef]
  27. Tsai, T.; Liukkonen, M. Robust parameter design for the micro-BGA stencil printing process using a fuzzy logic-based Taguchi method. Appl. Soft Comp. 2016, 48, 124–136. [Google Scholar] [CrossRef]
  28. Chien, C.; Hsu, C. Data Mining for optimizing IC feature designs to enhance overall wafer effectiveness. IEEE Trans. Semicond. Manuf. 2014, 27, 71–82. [Google Scholar] [CrossRef]
  29. Sun, Z.L.; Guo, Y.; Pan, E.S.; Song, W. Reflow soldering process virtual test based on BPNN-GA and ANSYS. Appl. Mech. Mater. 2013, 281, 417–421. [Google Scholar] [CrossRef]
  30. Kwak, D.; Kim, K. A data mining approach considering missing values for the optimization of semiconductor-manufacturing processes. Expert Syst. Appl. 2012, 39, 2590–2596. [Google Scholar] [CrossRef]
  31. Tsai, T. Thermal parameters optimization of a reflow soldering profile in printed circuit board assembly: A comparative study. Appl. Soft Comp. 2012, 12, 2601–2613. [Google Scholar] [CrossRef]
  32. Pan, E.; Jin, Y.; Xu, H.; Liao, W.Z. Forecasting and parameters optimization of reflow soldering profile based on BPNN and GA. Adv. Mater. Res. 2011, 139–141, 990–995. [Google Scholar]
  33. Chan, K.Y.; Kwong, C.K.; Tsim, Y.C. Modelling and optimization of fluid dispensing for electronic packaging using neural fuzzy networks and genetic algorithms. Eng. Appl. Artif. Intell. 2010, 23, 18–26. [Google Scholar] [CrossRef]
  34. Chou, J.; Tai, Y.; Chang, L.J. Predicting the development cost of TFT-LCD manufacturing equipment with artificial intelligence models. Int. J. Prod. Econ. 2010, 128, 339–350. [Google Scholar] [CrossRef]
  35. Liukkonen, M.; Hiltunen, T.; Havia, E.; Leinonen, H.; Hiltunen, Y. Modeling of soldering quality by using artificial neural networks. IEEE Trans. Electron. Packag. Manuf. 2009, 32, 89–96. [Google Scholar] [CrossRef]
  36. Barajas, L.G.; Egerstedt, M.B.; Kamen, E.W.; Goldstein, A. Stencil printing process modeling and control using statistical neural networks. IEEE Trans. Electron. Packag. Manuf. 2008, 31, 9–18. [Google Scholar] [CrossRef]
  37. Kwon, Y.; Omitaomu, O.A.; Wang, J.N. Data mining approaches for modeling complex electronic circuit design activities. Comput. Ind. Eng. 2008, 54, 229–241. [Google Scholar] [CrossRef]
  38. Bae, J.K.; Kim, J. Product development with data mining techniques: A case on design of digital camera. Expert Syst. Appl. 2011, 38, 9274–9280. [Google Scholar] [CrossRef]
  39. Stoyanov, S.; Bailey, C.; Tourloukis, G. Similarity approach for reducing qualification tests of electronic components. Microelectron. Reliab. 2016, 67, 111–119. [Google Scholar] [CrossRef]
  40. Haneda, H.; Kodama, H.; Hirogaketi, T.; Aoyama, E.; Ogawa, K. Investigation of drilling conditions of printed circuit board based on data mining method from tool catalog data-base. Adv. Mater. Res. 2014, 939, 547–554. [Google Scholar] [CrossRef]
  41. Liukkonen, M.; Havia, E.; Leinonenb, H.; Hiltunena, Y. Quality-oriented optimization of wave soldering process by using self-organizing maps. Appl. Soft Comp. 2011, 11, 214–220. [Google Scholar] [CrossRef]
  42. Li, S.; Nahar, K.; Fung, B.C.M. Product customization of tablet computers based on the information of online reviews by customers. J. Intell. Manuf. 2015, 26, 97–110. [Google Scholar] [CrossRef]
  43. Yu, C.; Kuo, C. Data mining approaches to optimize the allocation of production resources in semiconductor wafer fabrication. In Proceedings of the 2016 International Symposium on Semiconductor Manufacturing (ISSM), Tokyo, Japan, 12–13 December 2017; pp. 1–4. [Google Scholar]
  44. Wang, J.; Zhang, J. A hybrid data driven approach for cycle-time forecasting in semiconductor wafer fabrication system. In Proceedings of the 20th world multi-conference on systemics, cybernetics and informatics (WMSCI), SeaWorld, Orlando, FL, USA, 5–8 July 2016; pp. 74–78. [Google Scholar]
  45. Chen, T. An efficient and effective fuzzy collaborative intelligence approach for cycle time estimation in wafer fabrication. Int. J. Intell. Syst. 2015, 30, 620–650. [Google Scholar] [CrossRef]
  46. Chen, T. An effective fuzzy collaborative forecasting approach for predicting the job cycle time in wafer fabrication. Comp. Ind. Eng. 2013, 66, 834–848. [Google Scholar] [CrossRef]
  47. Zhang, J.; Qin, W.; Wu, L.H.; Zhai, W.B. Fuzzy neural network-based rescheduling decision mechanism for semiconductor manufacturing. Comput. Ind. 2014, 65, 1115–1125. [Google Scholar] [CrossRef]
  48. Chien, C.; Hsu, C.; Hsiao, C.W. Manufacturing intelligence to forecast and reduce semiconductor cycle time. J. Intell. Manuf. 2012, 23, 2281–2294. [Google Scholar] [CrossRef]
  49. Vainio, F.; Maier, M.; Knuutila, T.; Alhoniemi, E.; Johnsson, M.; Nevalainen, O.S. Estimating printed circuit board assembly times using neural networks. Int. J. Prod. Res. 2010, 48, 2201–2218. [Google Scholar] [CrossRef]
  50. Zhang, L.; Liu, T.; Liu, M.; Wang, X.H. Scheduling semiconductor wafer fabrication using a new fuzzy association classification rules based on dynamic fuzzy partition. Chin. J. Electron. 2017, 26, 112–117. [Google Scholar] [CrossRef]
  51. Chen, T. A job-classifying and data-mining approach for estimating job cycle time in a wafer fabrication factory. Int. J. Adv. Manuf. Technol. 2012, 62, 317–328. [Google Scholar] [CrossRef]
  52. Tirkel, I. Cycle time prediction in wafer fabrication line by applying data mining methods. In Proceedings of the 2011 22nd Annual IEEE/SEMI Advanced Semiconductor Manufacturing Conference, Saratoga Springs, NY, USA, 16–18 May 2011; IEEE Press: New York, NY, USA, 2011; pp. 1–5. [Google Scholar]
  53. Meidan, Y.; Lerner, B.; Rabinowitz, G.; Hassoun, M. Cycle-time key factor identification and prediction in semiconductor manufacturing using machine learning and data mining. IEEE Trans. Semicond. Manuf. 2011, 24, 237–248. [Google Scholar] [CrossRef]
  54. Chen, L.; Chien, C. Manufacturing intelligence for class prediction and rule generation to support human capital decisions for high-tech industries. Flex. Serv. Manuf. J. 2011, 23, 263–289. [Google Scholar] [CrossRef]
  55. Shiue, Y.R. Data-mining-based dynamic dispatching rule selection mechanism for shop floor control systems using a support vector machine approach. Int. J. Prod. Res. 2009, 47, 3669–3690. [Google Scholar] [CrossRef]
  56. Chen, T. A fuzzy rule for job dispatching in a wafer fabrication factory—A simulation study. Int. J. Adv. Manuf. Technol. 2013, 67, 47–58. [Google Scholar] [CrossRef]
  57. Wu, H.; Chen, T. A fuzzy-neural ensemble and geometric rule fusion approach for scheduling a wafer fabrication factory. Math. Probl. Eng. 2013, 2013, 956978. [Google Scholar] [CrossRef]
  58. Chen, T. A fuzzy-neural DBD approach for job scheduling in a wafer fabrication factory. Int. J. Innov. Comp. Inform. Control 2012, 8, 4025–4044. [Google Scholar]
  59. Chen, T. Intelligent scheduling approaches for a wafer fabrication factory. J. Intel. Manuf. 2012, 23, 897–911. [Google Scholar] [CrossRef]
  60. Shiue, Y.; Guh, R.; Lee, K.C. Study of SOM-based intelligent multi-controller for real-time scheduling. Appl. Soft Comp. 2011, 11, 4569–4580. [Google Scholar] [CrossRef]
  61. Chen, T. Dynamic fuzzy-neural fluctuation smoothing rule for jobs scheduling in a wafer fabrication factory. Proc. Inst. Mech. Eng. I-J. Syst. Control Eng. 2009, 223, 1081–1094. [Google Scholar] [CrossRef]
  62. Chen, T.; Wang, Y. A nonlinear scheduling rule incorporating fuzzy-neural remaining cycle time estimator for scheduling a semiconductor manufacturing factory—A simulation study. Int. J. Adv. Manuf. Technol. 2009, 45, 110–121. [Google Scholar] [CrossRef]
  63. Wang, J.; Zhang, J. Big data analytics for forecasting cycle time in semiconductor wafer fabrication system. Int. J. Prod. Res. 2016, 54, 7231–7244. [Google Scholar] [CrossRef]
  64. Chen, T.; Wang, Y. An iterative procedure for optimizing the performance of the fuzzy-neural job cycle time estimation approach in a wafer fabrication factory. Math. Probl. Eng. 2013, 2013, 740478. [Google Scholar] [CrossRef]
  65. Chen, T.; Romanowski, R. Precise and accurate job cycle time forecasting in a wafer fabrication factory with a fuzzy data mining approach. Math. Probl. Eng. 2013, 2013, 496826. [Google Scholar] [CrossRef]
  66. Chen, T. Job cycle time estimation in a wafer fabrication factory with a bi-directional classifying fuzzy-neural approach. Int. J. Adv. Manuf. Technol. 2011, 56, 1007–1018. [Google Scholar] [CrossRef]
  67. Chen, T.; Lin, Y. A collaborative fuzzy-neural approach for internal due date assignment in a wafer fabrication plant. Int. J. Innov. Comp. Inform. Control 2011, 7, 5193–5210. [Google Scholar]
  68. Chen, T.; Wang, Y. Incorporating the FCM-BPN approach with nonlinear programming for internal due date assignment in a wafer fabrication plant. Probl. Comp. Integr. Manuf. 2010, 26, 83–91. [Google Scholar] [CrossRef]
  69. Chen, T.; Wang, Y. A bi-criteria nonlinear fluctuation smoothing rule incorporating the SOM-FBPN remaining cycle time estimator for scheduling a wafer fab—A simulation study. Int. J. Adv. Manuf. Technol. 2010, 49, 709–721. [Google Scholar] [CrossRef]
  70. Chen, T.; Lin, Y. A fuzzy back propagation network ensemble with example classification for lot output time prediction in a wafer fab. Appl. Soft Comp. 2009, 9, 658–666. [Google Scholar] [CrossRef]
  71. Chen, T.; Wu, H.; Wang, Y.C. Fuzzy-neural approaches with example post-classification for estimating job cycle time in a wafer fab. Appl. Soft Comp. 2009, 9, 1225–1231. [Google Scholar] [CrossRef]
  72. Chen, T.; Jeang, A.; Wang, Y.C. A hybrid neural network and selective allowance approach for internal due date assignment in a wafer fabrication plant. Int. J. Adv. Manuf. Technol. 2008, 36, 570–581. [Google Scholar] [CrossRef]
  73. Chen, T.; Wang, Y. Lot cycle time prediction in a ramping-up semiconductor manufacturing factory with a SOM-FBPN-ensemble approach with multiple buckets and partial normalization. Int. J. Adv. Manuf. Technol. 2009, 42, 1206–1216. [Google Scholar] [CrossRef]
  74. Chen, T. An intelligent mechanism for lot output time prediction and achievability evaluation in a wafer fab. Comp. Ind. Eng. 2008, 54, 77–94. [Google Scholar] [CrossRef]
  75. Chen, T. An intelligent hybrid system for wafer lot output time prediction. Adv. Eng. Inform. 2007, 21, 55–65. [Google Scholar] [CrossRef]
  76. Chen, T. A hybrid look-ahead SOM-FBPN and FIR system for wafer-lot-output time prediction and achievability evaluation. Int. J. Adv. Manuf. Technol. 2007, 35, 575–586. [Google Scholar] [CrossRef]
  77. Chen, T. A SOM-FBPN-ensemble approach with error feedback to adjust classification for wafer-lot completion time prediction. Int. J. Adv. Manuf. Technol. 2008, 37, 782–792. [Google Scholar] [CrossRef]
  78. Shiue, Y.; Guh, R.S.; Tseng, T.Y. Study on shop floor control system in semiconductor fabrication by self-organizing map-based intelligent multi-controller. Comp. Ind. Eng. 2012, 62, 1119–1129. [Google Scholar] [CrossRef]
  79. Chien, C.; Chen, Y.; Hsu, C.Y. A novel approach to hedge and compensate the critical dimension variation of the developed-and-etched circuit patterns for yield enhancement in semiconductor manufacturing. Comput. Oper. Res. 2015, 53, 309–318. [Google Scholar] [CrossRef]
  80. Tsuda, T.; Inoue, S.; Akihiro, K.; Shin-ichi, I.; Tomoya, T.; Naoaki, S.; Satoshi, Y. Advanced semiconductor manufacturing using big data. IEEE Trans. Semicond. Manuf. 2015, 28, 229–235. [Google Scholar] [CrossRef]
  81. Lenz, B.; Barak, B. Data mining and support vector regression machine learning in semiconductor manufacturing to improve virtual metrology. In Proceedings of the 46th Hawaii International Conference on System Sciences(HICSS), Wailea, Maui, HI, USA, 7–10 January 2013; pp. 3447–3456. [Google Scholar]
  82. Lenz, B.; Barak, B. Virtual metrology in semiconductor manufacturing by means of predictive machine learning models. In Proceedings of the 12th International Conference on Machine Learning and Applications, Miami, FL, USA, 4–7 December 2014; pp. 174–177. [Google Scholar]
  83. Kang, P.; Lee, H.; Cho, S.; Kim, D.; Park, J.; Park, C.K. A virtual metrology system for semiconductor manufacturing. Expert Syst. Appl. 2009, 36, 12554–12561. [Google Scholar] [CrossRef]
  84. Guo, W.; Banerjee, A.G. Identification of key features using topological data analysis for accurate prediction of manufacturing system outputs. J. Manuf. Syst. 2017, 43, 225–234. [Google Scholar] [CrossRef]
  85. Chien, C.; Liu, C.; Chuang, S.C. Analyzing semiconductor manufacturing big data for root cause detection of excursion for yield enhancement. Int. J. Prod. Res. 2017, 55, 5095–5107. [Google Scholar] [CrossRef]
  86. Moyne, J.; Iskandar, J. Big data analytics for smart manufacturing: Case studies in semiconductor manufacturing. Processes 2017, 5, 39. [Google Scholar] [CrossRef]
  87. Chien, C.; Chen, Y.; Wu, J.Z. Big data analytics for modeling WAT parameter variation induced by process tool in semiconductor manufacturing and empirical study. In Proceedings of the 2016 Winter Simulation Conference, Washington, DC, USA, 11–14 December 2016; pp. 2512–2522. [Google Scholar]
  88. Hessinger, U.; Chan, W.K.; Schafman, B.T. Data Mining for significance in yield-defect correlation analysis. IEEE Trans. Semicond. Manuf. 2014, 27, 347–356. [Google Scholar] [CrossRef]
  89. Chien, C.; Chuang, S.C. A framework for root cause detection of sub-batch processing system for semiconductor manufacturing big data analytics. IEEE Trans. Semicond. Manuf. 2014, 27, 475–488. [Google Scholar] [CrossRef]
  90. Chien, C.F.; Diaz, A.C.; Lan, Y.B. A data mining approach for analyzing semiconductor MES and FDC data to enhance overall usage effectiveness (OUE). Int. J. Comp. Intell. Syst. 2014, 72, 52–65. [Google Scholar] [CrossRef]
  91. Chien, C.; Hsu, C.; Chen, P.N. Semiconductor fault detection and classification for yield enhancement and manufacturing intelligence. Flex. Serv. Manuf. J. 2013, 25, 367–388. [Google Scholar] [CrossRef]
  92. Ko, J.M.; Hong, S.R.; Choi, J.Y.; Kim, C.O. Wafer-to-wafer process fault detection using data stream mining techniques. Int. J. Precis. Eng. Manuf. 2013, 14, 103–113. [Google Scholar] [CrossRef]
  93. Chien, C.; Hsu, S.; Chen, Y.J. A system for online detection and classification of wafer bin map defect patterns for manufacturing intelligence. Int. J. Prod. Res. 2013, 51, 2324–2338. [Google Scholar] [CrossRef]
  94. Tsai, T. Development of a soldering quality classifier system using a hybrid data mining approach. Expert Syst. Appl. 2012, 39, 5727–5738. [Google Scholar] [CrossRef]
  95. Weiss, S.M.; Baseman, R.J.; Tipu, F.; Collins, C.N.; Davies, W.A.; Singh, R.; Hopkins, J.W. Rule-based data mining for yield improvement in semiconductor manufacturing. App. Intell. 2010, 33, 318–329. [Google Scholar] [CrossRef]
  96. Ooi, M.P.; Sim, E.K.J.; Kuang, Y.C.; Demidenko, S.; Kleeman, L.; Chan, C.W.K. Getting more from the semiconductor test: Data mining with defect-cluster extraction. IEEE Trans. Instrum. Meas. 2011, 60, 3300–3317. [Google Scholar] [CrossRef]
  97. Susto, G.A.; Terzi, M.; Beghi, A. Anomaly detection approaches for semiconductor manufacturing. Procedia Manuf. 2017, 11, 2018–2024. [Google Scholar] [CrossRef]
  98. Li, Z.; Baseman, R.J.; Zhu, Y.; Tipu, F.A.; Slonim, N.; Shpigelman, L. A unified framework for outlier Detection in trace data analysis. IEEE Trans. Semicond. Manuf. 2014, 27, 95–103. [Google Scholar] [CrossRef]
  99. Sohn, Y.; Lee, H.; Yang, Y.; Jun, C. A new method for wafer quality monitoring using semiconductor process big data. In Proceedings of the Society of Photo-Optical Instrumentation Engineers, San Jose, CA, USA, 28 March 2017; SPIE: Bellingham, WA, USA, 2017; p. 101450T. [Google Scholar]
  100. Chen, T. A heterogeneous fuzzy collaborative intelligence approach for forecasting the product yield. Appl. Soft Comp. 2017, 57, 210–224. [Google Scholar] [CrossRef]
  101. Butte, S.; Patil, S. Big data and predictive analytics methods for modeling and analysis of semiconductor manufacturing processes. In Proceedings of the IEEE Workshop on Microelectronics and Electron Devices (WMED), Boise, ID, USA, 15 April 2016; pp. 1–5. [Google Scholar]
  102. Lee, H.; Kim, C.O.; Ko, H.H.; Kim, M.Y. Yield prediction through the event sequence analysis of the die attach process. IEEE Trans. Semicond. Manuf. 2015, 28, 563–570. [Google Scholar] [CrossRef]
  103. Krueger, D.C.; Montgomery, D.C. Modeling and analyzing semiconductor yield with generalized linear mixed models. Appl. Stoch. Models Bus. Ind. 2014, 30, 691–707. [Google Scholar] [CrossRef]
  104. Chen, T. Forecasting the yield of a semiconductor product with a collaborative intelligence approach. Appl. Soft Comp. 2013, 13, 1552–1560. [Google Scholar] [CrossRef]
  105. Shukla, S.K.; Tiwari, M.K. GA guided cluster based fuzzy decision tree for reactive ion etching modeling: A data mining approach. IEEE Trans. Semicond. Manuf. 2012, 25, 45–56. [Google Scholar] [CrossRef]
  106. Chen, T. Applying the hybrid fuzzy c-means-back propagation network approach to forecast the effective cost per die of a semiconductor product. Comp. Ind. Eng. 2011, 61, 752–759. [Google Scholar] [CrossRef]
  107. Feng, C.J.; Gao, L.; Li, P.G.; Shao, X.Y. Selection and comparison of supervised predictive data mining models for electronics fabrication data. In Proceedings of the 2010 International Conference on Computing, Control and Industrial Engineering, Wuhan, China, 5–6 June 2010; pp. 3–7. [Google Scholar]
  108. Chen, T.; Lin, Y. A fuzzy-neural system incorporating unequally important expert opinions for semiconductor yield forecasting. Int. J. Uncertain. Fuzz. Knowl. Syst. 2008, 16, 35–58. [Google Scholar] [CrossRef]
  109. Guan, T.; Zhang, Z.B.; Dong, W.; Qiao, C.M.; Gu, X.L. Data-driven fault diagnosis with missing syndromes imputation for functional test through conditional specification. In Proceedings of the 22nd IEEE European Test Symposium (ETS), Limassol, Cyprus, 22–26 May 2017; pp. 1–6. [Google Scholar]
  110. Lee, C.; Chen, B. Mutually-exclusive-and-collectively-exhaustive feature selection scheme. Appl. Soft Comp. 2017. [Google Scholar] [CrossRef]
  111. Chen, Y.; Fan, C.Y.; Chang, K.H. Manufacturing intelligence for reducing false alarm of defect classification by integrating similarity matching approach in CMOS image sensor manufacturing. Comp. Ind. Eng. 2016, 99, 465–473. [Google Scholar] [CrossRef]
  112. Fan, S.S.; Lin, S.C.; Tsai, P.F. Wafer fault detection and key step identification for semiconductor manufacturing using principal component analysis, AdaBoost and decision tree. J. Ind. Prod. Eng. 2016, 33, 151–168. [Google Scholar] [CrossRef]
  113. Liao, C.; Hsieh, T.J.; Huang, Y.S.; Chien, C.F. Similarity searching for defective wafer bin maps in semiconductor manufacturing. IEEE Trans. Autom. Sci. Eng. 2014, 11, 953–960. [Google Scholar] [CrossRef]
  114. Chien, C.; Chang, K.H.; Wang, W.C. An empirical study of design-of-experiment data mining for yield-loss diagnosis for semiconductor manufacturing. J. Intell. Manuf. 2014, 25, 961–972. [Google Scholar] [CrossRef]
  115. Chen, Y.; Lin, T.H.; Chang, K.H.; Chien, C.F. Feature extraction for defect classification and yield enhancement in color filter and micro-lens manufacturing: An empirical study. J. Ind. Prod. Eng. 2013, 30, 510–517. [Google Scholar] [CrossRef]
  116. Hsieh, T.; Liao, C.; Huang, Y.S.; Chien, C.F. A new morphology-based approach for similarity searching on wafer bin maps in semiconductor manufacturing. In Proceedings of the 2012 IEEE 16th International Conference on Computer Supported Cooperative Work in Design, Wuhan, China, 23–25 May 2012; pp. 869–874. [Google Scholar]
  117. Chien, C.; Wang, W.C.; Cheng, J.C. Data mining for yield enhancement in semiconductor manufacturing and an empirical study. Expert Syst. Appl. 2007, 33, 192–198. [Google Scholar] [CrossRef]
  118. Hsu, S.; Chien, C. Hybrid data mining approach for pattern extraction from wafer bin map to improve yield in semiconductor manufacturing. Int. J. Prod. Econ. 2007, 107, 88–103. [Google Scholar] [CrossRef]
  119. Sim, H.; Choi, D.; Kim, C.O. A data mining approach to the causal analysis of product faults in multi-stage PCB manufacturing. Int. J. Precis. Eng. Manuf. 2014, 15, 1563–1573. [Google Scholar] [CrossRef]
  120. Casali, A.; Ernst, C. Discovering correlated parameters in semiconductor manufacturing processes: A data mining approach. IEEE Trans. Semicond. Manuf. 2012, 25, 118–127. [Google Scholar] [CrossRef] [Green Version]
  121. Zhu, Y.; Xiong, J.J. Modern big data analytics for “old-fashioned” semiconductor industry applications. In Proceedings of the 2015 IEEE/ACM International Conference on Computer-Aided Design (ICCAD), Austin, TX, USA, 2–6 November 2015; pp. 776–780. [Google Scholar]
  122. Chen, H.H.; Hsu, R.; Yang, P.Y.; Shyr, J.J. Predicting system-level test and in-field customer failures using data mining. In Proceedings of the 2013 IEEE International Test Conference (ITC), Anaheim, CA, USA, 6–13 September 2013; pp. 1–10. [Google Scholar]
  123. Mashhadi, A.R.; Esmaeilian, B.; Cade, W.; Wiens, K. Mining consumer experiences of repairing electronics: Product design insights and business lessons learned. J. Clean. Prod. 2016, 137, 716–727. [Google Scholar] [CrossRef]
  124. Sabbaghi, M.; Esmaeilian, B.; Mashhadi, A.R.; Behdad, S.; Cade, W. An investigation of used electronics return flows: A data-driven approach to capture and predict consumers storage and utilization behavior. Waste Manag. 2015, 36, 305–315. [Google Scholar] [CrossRef] [PubMed]
  125. Tavakkoli, A.; Rezaeenour, J.; Hadavandi, E. A novel forecasting model based on support vector regression and Bat meta-heuristic (Bat-SVR): Case study in printed circuit board industry. Int. J. Inform. Technol. Des. Mak. 2015, 14, 195–215. [Google Scholar] [CrossRef]
  126. Chang, P.; Liu, C.H.; Fan, C.Y. Data clustering and fuzzy neural network for sales forecasting: A case study in printed circuit board industry. Knowl. Syst. 2009, 22, 344–355. [Google Scholar] [CrossRef]
  127. Chang, P.C.; Liu, C.H.; Lai, R.K. Fuzzy case-based reasoning model for sales forecasting in print circuit board industries. Expert Syst. Appl. 2008, 34, 2049–2058. [Google Scholar] [CrossRef]
  128. Chang, P.; Wang, Y.W.; Liu, C.H. The development of a weighted evolving fuzzy neural network for PCB sales forecasting. Expert Syst. Appl. 2007, 32, 86–96. [Google Scholar] [CrossRef]
  129. Sabbaghi, M.; Cade, W.; Behdad, S.; Bisantz, A. M. The current status of the consumer electronics repair industry in the U.S.: A survey-based study. Resour. Conserv. Recyc. 2017, 116, 137–151. [Google Scholar] [CrossRef]
  130. Chien, C.; Chen, Y.J.; Peng, J.T. Manufacturing intelligence for semiconductor demand forecast based on technology diffusion and product life cycle. Int. J. Prod. Econ. 2010, 128, 496–509. [Google Scholar] [CrossRef]
  131. Top-Free-Data-Mining-Software. Available online: https://www.predictiveanalyticstoday.com/top-free-data-mining-software/ (accessed on 10 November 2017).
Figure 1. The data mining flowchart.
Applsci 08 00582 g001
Figure 2. The confusion matrix and performance indicators for classification [22].
Applsci 08 00582 g002
Figure 3. The distribution of selected articles in different years and different stages.
Applsci 08 00582 g003
Figure 4. DM function applications in different stages.
Applsci 08 00582 g004
Figure 5. Distribution of different knowledge areas.
Applsci 08 00582 g005
Figure 6. Different categories of DMTs for different knowledge areas (DMTs: data mining techniques).
Applsci 08 00582 g006
Figure 7. The frequency of the top 10 applied DMTs.
Applsci 08 00582 g007
Figure 8. The different DMTs application in different knowledge areas.
Applsci 08 00582 g008
Figure 9. The data content for different knowledge areas.
Applsci 08 00582 g009
Figure 10. The framework of DM with Big Data towards IT applications in the electronics industry.
Applsci 08 00582 g010
Table 1. The reviews of data mining and big data application in the smart manufacturing industry.
ReferenceMain Review ContentYear
Choudhary et al. [2]Application of KDD and DM in manufacturing, the kinds of patterns to be mined, and data mining techniques (DMTs)2009
Ngai et al. [3]DM application in customer identification, attraction, retention, and development2009
Gulser et al. [4]DM application for product quality improvement tasks including quality description/predicting/classification and parameter optimization2011
Liao et al. [5]DMTs applications in CRM, product development, and fault pattern analysis2012
Hamidey et al. [6]Support vector machine (SVM) application in quality assessment in manufacturing2015
Donovan et al. [7]Application of Big Data in the area of design, process and planning, quality management, maintenance and diagnosis, scheduling, control, environment, and so forth.2015
Li et al. [8]Concept, characteristics, and potential application of Big Data in PLM2015
Zhong et al. [9]Big Data applications in finance, economics, healthcare, SCM, and the manufacturing sector. Current movements on the Big Data for SCM in service and manufacturing2016
Nagorny et al. [10]Big Data in smart manufacturing systems including related research roadmaps and projects in European, the infrastructures, Big Data analysis process, algorithm and tools, and so forth.2017
Cheng et al. [11]Development of DMTs, major functions of DMTs, applications of DMTs to production management in the Big Data era2017
Table 2. The data mining functions and related techniques.
Type of FunctionDM FunctionsDescriptionRelated DMTs
Descriptive DMSummarizationSummarization of the general characteristics of a data setStatistical measures and plots, online analytical processing, attribute-oriented induction, and so forth.
ClusteringGrouping a set of data objects into multiple clusters so that objects within a cluster have high similarityCentroid-based clustering, connectivity-based clustering, density-based clustering, and distribution-based clustering
Association/Sequential pattern miningMining frequent patterns to discover interesting associations and correlations (in a sequence for sequential pattern mining)Apriori, AprioriAII, sampling, partitioning pattern growth, correlation rules, stream patterns, and so forth.
Predictive DMClassificationA model or classifier is constructed to predict class (categorical) labelsDT, Bayesian, rule-based, SVM, ANN, CBR, k-NN, GA, RST, and Fuzzy Set
PredictionA model performing prediction function to forecast future values of continuous type dataRegression, ANN, SVM/SVR, DT, RST, and Fuzzy set
Outlier detectionThe process of finding data or objects that behave unexpectedlyClassification based, k-NN based, clustering based, and so forth.
Time series analysisMethods for analyzing time series data in order to extract meaningful statistics and other characteristics of the dataRegression, SVM, ANN, RST, and Fuzzy Set
DT: Decision tree; CBR: Case-based reasoning; GA: Genetic algorithm, RST: Rough set theory; SVM/SVR: Support vector machine/regression.
Table 3. The performance indicators for the prediction function [23].
IndicatorsEquationIndicatorsEquation
MAPE M A P E = 1 N i = 1 N | y ^ i y i y i | × 100 R2 R 2 = i = 1 N ( y ^ i y ¯ ) 2 / i = 1 N ( y i y ¯ ) 2
MSE M S E = i = 1 N ( y ^ i y i ) 2 / N ME M E = 1 N i = 1 N | y i y ^ i | y i
MAE M A E = i = 1 N | y ^ i y i | / N VARER V A R E R = 1 n 1 k = 1 n ( | y i y ^ i | y i M E ) 2
RMSE R M S E = i = 1 N ( y ^ i y i ) 2 / N RE R E = E ( y i y ^ i ) 2 E ( y i y ¯ ) 2
RSE R S E = i = 1 N ( y ^ i y i ) 2 / N IA I A = 1 i = 1 N ( y i y ^ i ) 2 / i = 1 N ( | y ^ i y ¯ | + | y i y ¯ | ) 2
RAE R A E = i = 1 N | y ^ i y i | / N --
Note: y i and y ^ i are the observed and predicted value of sample i respectively; y ¯ is the average result of samples. i = 1 N ( y i y ¯ ) 2 is the total sum of squares, while i = 1 N ( y ^ i y ¯ ) 2 is the explained sum of squares. E is the expectation value.
Table 4. The performance indicators for the clustering function [24].
IndicatorsEquationDescription
DBI D B I = 1 n i = 1 n max j i ( σ i + σ j d ( c i , c j ) ) n is the number of clusters, c x is the centroid of cluster x , σ x is the average distance of all elements in cluster x to centroid c x , and d ( c i , c j ) is the distance between centroids c i and c j .
DI D = min 1 i < j n d ( i , j ) min 1 k n d ( k ) d ( i , j ) represents the distance between clusters i and j; d ( k ) measures the intra-cluster distance of cluster k .
Purity P u r i t y ( Ω , ) = 1 N k max j | w k c j | Ω = { w 1 , w 2 , , w k } is the set of clusters, = { c 1 , c 2 , , c J } is the set of classes, I is mutual information, and H is entropy.
NMI N M I ( Ω , ) = I ( Ω , ) | H ( Ω ) , H ( ) | / 2
RI R I = T P + T N T P + F P + F N + T N The definitions of TP, TN, FP, FN, precision, and recall are the same as the specifications given in Figure 2; β is the penalty coefficient.
F measure F β = ( β 2 + 1 ) × Pr e c i s i o n × Re c a l l β 2 × Pr e c i s i o n + Re c a l l
QE Q E = 1 N i = 1 N | | x i r β | | N refers to the number of original data vectors, and r β is the best matching unit of the data vector x i ; u ( x ) gets the value of 1 if the best and the second best matching units of the input vector are non-adjacent, and 0 otherwise.
TE T E = 1 N i = 1 N u ( x i )
Table 5. The performance indicators for the association function.
IndicatorsEquationDescription
Support sup ( X ) = | { t T ; X t } | | T | X is an item set, X Y is an association rule, and T is a set of transactions. Support of X (sup (X)) with respect to T is defined as the proportion of transactions t in the dataset which contains the item set X. c o n f ( X Y ) is the proportion of the transactions that contains X which also contains Y.
Confidence c o n f ( X Y ) = sup ( X Y ) / sup ( X )
Lift l i f t ( X Y ) = sup ( X Y ) sup ( X ) × sup ( Y )
Conviction c o n v ( X Y ) = 1 sup ( Y ) 1 c o n f ( X Y )
Table 6. The data preparation from the reviewed articles.
Data PreparationRecords ObtainmentReferenceApplication
Experimental dataFull factorials[26,29,33,35,36,39,40,41,84,107]Product design improvement and manufacturing process optimization
Fractional factorial[27,114]
Orthogonal experiment[31]
Observational historical dataHistorical records[28,30,32,34,37,38]
[43,44,45,46,48,49,50,51,52,54,56,59,60,61,62,63,64,66,67,68,69,70,71,72,73,74,75,76,77]Production management
Accumulated records[79,81,85,90,94,95]Production process monitoring and control like FDC, R2R, SPC, and so forth.
Online measured, traced or monitoring[80,82,83,84,85,86,87,88,89,90,91,92,93,96,97,98,99,101]
Interactions and transaction records[38,42,123,124,125,126,127,128,129,130]CRM/SCM
Accumulated records[100,103,104,105,106,108,109,110,111,112,113,115,116,117,118,119,120,121,122]Quality management
Simulation data-[47,53,55,58,78,121]Process optimization, such as scheduling and cycle time prediction
Unspecified-[57,65,102]-
Table 7. The preprocessing techniques used in the reviewed literature.
PreprocessFunctionsMethodsReference
Data cleaningFilling in missing valuesm-PRLM[30]
Delete[37,52,81,88,91,96,117,123,124,130]
Manually fill[48]
k-NN[84,87]
Omit/replace[85,130]
Missing syndromes[109]
Smoothing out noiseSVM[54]
Delete[79,82,114,120]
Moving average[90]
King-move neighborhood[93]
Winter’s exponentials[126,127]
Handling outliersBox plot[79,88]
Delete[84,96]
Online PCA[97]
Clustering[122]
Handling redundant dataDetecting and removing[81,96]
Data transformation-Variance scaling[35,63]
Normalization[37,39,46,48,51,55,56,57,58,60,61,62,64,65,66,67,68,69,70,71,72,73,74,75,76,77,78,80,82,88,94,98,102,104,105,108,111,113]
Text mining[42,123]
Fisher Z[44,47]
Box-Cox[84]
Numerical into binary[85]
Binary vector[91,93,117]
Spreadsheet format[95]
Data reductionDimensionality reductionANOVA[27,79]
Multilayer perceptron[35]
Stepwise regression[34,83,89,110,126,127]
GA (GA+SVR)[55,83]
RST[54]
Regression-based[44,45,86]
SNBC[53]
Conditional mutual information[63]
Las Vegas filter[60,78]
By experts[81,82]
Pearson coefficient[79]
Mapper[84]
Cramer’s V correlation coefficients[85,87]
Exclusive key parameter selection[99]
LASSO, Random forest, and PCA[110,112]
K-W test[114]
Eliminating variables[120]
Auxiliary variables derived[124]
Numerosity reductionAggregation[34,87]
Clustering[38,90,101]
Adjust imbalanced classes[54]
Sampling[82]
K-means and SOM clustering[126]
CompressionPCA[64,65,83,92,94]
Multi-dimensional scaling[84]
DiscretizationEqual frequency discretization[63,120]
CHAID[90]
LASSO: Least absolute shrinkage and selection operator; SNBC: Selective naive Bayesian classifier; CHAID: Chi-squared automatic interaction detection.
Table 8. The knowledge areas of DM application in the electronics industry.
Knowledge AreaSub-AreasDescriptionApplied Stage
QI [4]Description of product/process(1) Identifying attributes that affect quality significantly; (2) Comparing the end result of the whole process with the desired specifications, analyzing the root causes of low yield for adjusting the process parameters to ensure future quality [102], and we call it as post hoc (fault) diagnosis here.Design and production stage
Quality classificationFor a given set of input parameters, predicting the class of the quality output.
Quality predictionPredicting what the resulting quality (yield) characteristic will be for a given set of input parameters or process values.
Parameter optimizationBased on the learned features of the cases, yielding high-quality and finding optimal levels of process/product parameters that consistently yield target performance.
DTCE-Predicting the development time and/or cost.Design stage
PMOSchedulingScheduling optimization or dispatch rules selection.Production stage
Production time prediction (PTP)Predicting the production time (cycle time/lead time/due or complete date).
Resource optimizationResource allocation optimization.
AEC/APC [4,11,86]Fault detection and classificationFault detection (FD) is to monitor and analyze the variation in equipment, tool or process data and detect anomalies, and the fault classification is to determine its root cause.Production stage
R2RModifying recipe parameters or the selection of control parameters between runs to improve performance.
Virtual metrology (VM)Prediction of post-process metrology variables using process and wafer state.
Equipment health monitoring (EHM)Monitoring tool parameters to assess the tool health as a function of deviation from normal behavior.
Statistical process controlUsing statistical methods to analyze processes or products to take appropriate actions to achieve a state of statistical control and continuously improve the process capability.
CRM [3]Customer identification, attraction, retention, and developmentAnalyzing and understanding customers’ behaviors and characteristics.Sale, service and, recycling stage
SCM-DM application for the management of the flow of goods and services
Table 9. DM with Big Data application in the design stage.
Function (Frequency)DMTs CategoriesKnowledge Area/TaskProduct/ProcessIndicatorRef.
Prediction (12)SVRKD-orientedQuality prediction Parameter optimizationSPP-[26]
MRO, ANN + GA, Fuzzy logic + RegressionKD-oriented, SA-orientedSPPRMSE[27]
M5’, ANNKD-orientedWaferRMSE, RE[28]
ANN + GAKD-orientedSPPRMSE[29]
m-PRLMKD-orientedWafer etchingMSE[30]
ANN + GAKD-orientedSPPRMSE[31]
ANN + GAKD-orientedSPPMAPE[32]
FNN + GAKD-orientedMicrochip encapsulationME, VARER[33]
MRA, ANN, CBR, MRA + ANN, ANN + CBRKD-oriented, SA-orientedDevelopment time/cost estimationLiquid-crystal displayMAER, RMSE[34]
ANNKD-orientedQuality prediction, Process descriptionSPPIA[35]
ANNKD-orientedQuality prediction Parameter optimizationSPPMSE[36]
ASVR, MLRKD-oriented, SA-orientedDevelopment time/cost estimationElectronic circuitMSE[37]
Classification (1)Apriori, C5.0KD-orientedProduct descriptionDigital camera-[38]
Clustering (3)SOMKD-orientedProcess descriptionHot solder dipQE[39]
K-meansSA-orientedParameter optimizationPCB-[40]
SOMKD-orientedProcess descriptionWave solderingQE, TE[41]
Association (2)AprioriKD-orientedProduct descriptionApple iPadSupport, confidence and lift[42]
Apriori, C5.0KD-orientedDigital camera[38]
MRO: Multi-response optimization; FNN: Fuzzy neural network; MRA: Multiple regression analysis; ASVR: Adaptive SVR; MLR: Multiple linear regression.
Table 10. DM with Big Data application for production management and optimization.
Functions (Frequency)DMTsCategoriesKnowledge Area/TaskIndicatorRef.
Prediction (7)ANNKD-orientedAllocation of resourceMSE, MAPE[43]
RegressionSA-orientedCycle time PredictionMAE, MSE[44]
FNNKD-orientedRMSE, MAE, MAPE, RMSE[45,46]
FNNKD-orientedReschedulingRMSE[47]
GNR, ANNKD-oriented, SA-orientedCycle time PredictionMAPE[48]
ANNKD-orientedAssembly times perditionMSE, MAE, RSE, RAE[49]
Classification (6)FACRs (Apriori + Fuzzy logic)KD-orientedScheduling-[50]
FNN + ANN + AprioriKD-orientedCycle time prediction-[51]
DT, ANNKD-orientedACC[52]
SNBCSA-orientedACC[53]
SVM, RST, DTKD-orientedHuman managementACC[54]
GA + SVMKD-orientedScheduling-[55]
Prediction Clustering (23)FCM + FNNKD-oriented, SA-orientedScheduling-[56]
MAE, MAPE, RMSE[57]
-[58]
SOM + FNNKD-orientedRMSE, MAPE[59]
SOM + ANNKD-orientedDBI [60]
FCM + ANNKD-oriented, SA-orientedRMSE[61]
SOM+ FNNKD-orientedRMSE[62]
FNN + ANN + AprioriKD-orientedCycle time PredictionRMSE, MAE, MAPE[51]
FCM + ANNKD-oriented, SA-orientedMAE, MSE[63]
FCM + FNNMAE, MAPE, RMSE[64,65]
FCM + RBFNN, FNNRMSE, MAE, MAPE[66]
FCM + ANNKD-orientedRMSE[67,68]
SOM + FNNRMSE[69]
FCM + FNNKD-oriented, SA-orientedOutput time predictionRMSE[70]
FNNKD-orientedCycle time predictionRMSE[71]
Due date predictionRMSE[72]
SOM + FNNCycle time predictionRMSE[73]
SOM + ANNKD-orientedOutput time predictionRMSE[74]
K-means + FNNSA-oriented, KD-orientedRMSE[75]
SOM + FNNKD-orientedRMSE[76]
Completion time predictionRMSE[77]
Clustering (1)SOMKD-orientedScheduling-[78]
Association (2)FACRsKD-oriented-[50]
FNN + ANN + AprioriCycle time PredictionSupport, confidence[51]
FACRs: Fuzzy association classification rules; GNR: Gauss-Newton regression; RBFNN: Radial basis function neural network.
Table 11. DM with Big Data application for advanced equipment control/advanced process control.
Functions (Frequency)DMTsCategoriesKnowledge Area/TaskIndicatorRef.
Prediction (5)RegressionSA-orientedR2RR2[79]
PLS + MLRFDC, R2R, VMACC[80]
SVRKD-orientedVMRMSE[81]
DT, ANN, SVRVMMAE, RMSE, R2[82]
SLR, GA+SVMSA-oriented KD-orientedVMMSE[83]
Classification (12)SVMKD-orientedFDCROC[84]
Logistic regressionSA-orientedFDCTPR[85]
A frameworkSA-oriented, KD-orientedFDC, R2R, SPC, EHMACC[86]
Forward stepwise regression, LASSO, Random forestSA-orientedFDCR2[87]
MLRFDCACC[88]
Stepwise regression, CARTSA-oriented, KD-orientedFDCACC[89]
K-means, CHAIDACC[90]
PCA, SOM, CHAIDTPR, TNR[91]
Multi-sensor-based trace segmentation, PCASA-orientedFDCACC[92]
Spatial statistics, ANNKD-oriented, SA-orientedFDC, SPC-[93]
SOM, K-means, DTSPCDBI[94]
CARTKD-orientedFDC-[95]
Clustering (4)K-means, CHAIDSA-oriented KD-orientedFDCACC[90]
PCA, SOM, CHAIDFDC-[91]
SOM, K-means, DTSPCDBI[94]
SDCSPCFAR, FRR[96]
Time series analysis (3)CARTKD-orientedFD-[95]
osPCA, online PCA, ABOD, LB-ABOD, LOFSA-orientedFDPPV, TPR[97]
EBIT, CUSUMSA-orientedFDTP, FN[98]
Outlier detection (3)osPCA, onlinePCA, BOD, LB-ABOD, LOFSA-orientedFD-[97]
EBIT, CUSUMFDTP, FN[98]
PSLAFD-[99]
SLR: Stepwise linear regression; PLS: Partial least squares regression; SDC: Segmentation, detection, and cluster-extraction; osPCA: Online oversampling PCA; ABOD: Angle based outlier detection; LB-ABOD: Lower bound-ABOD; LOF: Local outlier factor; EBIT: Entropy-based information theoretic; CUSUM: Cumulative sum; PSLA: Process sensor log analysis.
Table 12. DM with Big Data application for the quality improvement at the production stage.
Functions (Frequency)DMTsCategoriesKnowledge Area/TaskIndicatorRef.
Prediction (9)FNNKD-orientedYield predictionMAE, RMSE, MAPE[100]
Regression, ANN, K-means clusteringSA-oriented KD-orientedR2[101]
PLS, CARTMAPE[102]
Generalized linear mixed modelsSA-orientedMSE[103]
FNNKD-orientedMAE, RMSE, MAPE[104]
FCM + GA + DTSA-oriented, KD-orientedQuality predictionME[105]
Fuzzy linear regression + BPNCost predictionRMSE, MAE, MAPE[106]
Regression, ANNYield predictionMAE, MAPE, MRSE, MAPE, R2[107]
FNNKD-orientedYield predictionMAE, RMSE, MAPE[108]
Classification (11)SOM, K-means, DTSA-oriented KD-orientedQuality classificationDBI[94]
NB, SVM, ANNdiagnosis Post hoc diagnosisACC[109]
CHAIDSA-orientedTPR TNR, FPR, ACC[110]
SVMKD-orientedTPR, FPR[111]
PCA, SVM, adaptive boosting, DTSA-oriented, KD-orientedFN, FP[112]
SVMKD-orientedTPR, FPR[113]
Statistical modelSA-oriented-[114]
CARTKD-orientedTPR, FPR[115]
SVM-[116]
K-means, DTSA-oriented, KD-oriented-[117]
Spatial statistics + adaptive ANN, DT-[118]
Clustering (6)SOM, K-means, DTSA-oriented, KD-orientedQuality classificationDBI[94]
SDCPost hoc diagnosisFAR, FRR[96]
Regression, ANN, K-means, clusteringYield prediction-[101]
FCM + GA + DTQuality predictionME[105]
K-means, DTPost hoc diagnosis-[117]
Spatial statistics + adaptive ANN, DT-[118]
Association (Sequence Analysis) (3)Association rule treeSA-oriented, KD-orientedYield predictionMAPE[102]
Bayesian network, PLS, AprioriPost hoc diagnosisACC[119]
Decision correlation rulesKD-oriented-[120]
Time series analysis (1)Co-clusteringSA-orientedQuality predictionRMSE[121]
Outlier detection (1)Hierarchical clustering, DTSA-oriented, KD-orientedPost hoc diagnosis-[122]
Table 13. DM and Big Data application in the sale, service and recycling stage.
Functions (Frequency)DMTsCategoriesKnowledge Area/TaskProductIndicatorRef.
Prediction (6)Text mining + RegressionSA-oriented, KD-orientedPurchase decisions predictioniPhone, Mac, iPod, iPad and so forth. and components-[123]
SVMKD-orientedBehavior predictionUsed hard diskMAPE, MAE, MSE[124]
SVR + BatKD-orientedMarketing and sale trends predictionPCBMAPE, RMSE[125]
K-means, SOM, FNNSA-oriented, KD-orientedMAPE, RMSE[126]
Fuzzy CBRKD-orientedMAPE, RMSE[127]
Weighted evolving FNNKD-orientedMAPE, MAE, RMSE[128]
Classification (1)Text mining + RegressionSA-orientedRepair experience extractioniPhone, Mac, iPod, iPad and so forth. and componentsPPV, TPR[123]
Clustering (2)K-meansSA-orientedRepaired products clusteringCamera, laptop, phone, printer, and so forth.-[129]
K-means, SOM, FNNSA-oriented, KD-orientedMarketing and sale trends predictionPCB-[126]
Time series analysis (1)Nonlinear least squareSA-orientedDemand predictionSemiconductorMAPE, R2[130]
Table 14. The software used for accomplishing DM and Big Data application in the electronics industry.
Type of SoftwareName of SoftwareReferenceUsage
Spreadsheet applicationExcel[34,52,104,117]Data preparation and data preprocessing
Statistical software packageMiniTab[107,127]Regression prediction
SAS[38,117,125]SA-oriented methods such as MRA, ANOVA, and PCA
SPSS[34,126]
Statistics[34,117,126]
DM software packageSPSS Clementine[38,52]Preprocessing, prediction, classification, clustering, and association
SAS EM[38]
General purpose softwareMatlab[26,33,35,36,37,45,47,55,70,78,82,104]Prediction, classification, clustering, and optimization
WEKA[28]Prediction
Visual Mining Studio[40]Clustering
RapidMiner[42]Association
R software environment[122]Outlier detection
Special purpose toolsBrainMaker[107]ANN for prediction, classification, clustering, and so forth
NeuralWorks Professional II/Plus[127]
NeuroSolutions[70,72,74,76,77]
Neural Network Toolbox[45,57,58,64,67]
NeuralTools[34]
Netlab Toolbox[49]
NeuralPower[27,31]
Fuzzy Logic Toolbox[45,57,64]Fuzzy logic
LibSVM[84,113,125]SVM
SOM toolbox[39,41,60,78]Clustering
Lingo[45,68,108]Optimization
High-level languageC/C++[94,120]Various purposes such as SOM, fuzzy clustering, FBPN, and so forth
Visual Basic[59,62,70,71,72,73,75,76,77]
Python[84]Outlier detection