Article

Research on Distributed PV Storage Virtual Synchronous Generator System and Its Static Frequency Characteristic Analysis

1
Key Laboratory of Distributed Energy Storage and Micro-Grid of Hebei Province, North China Electric Power University, Baoding 071003, China
2
China Electric Power Research Institute (CEPRI), Beijing 100000, China
*
Author to whom correspondence should be addressed.
Appl. Sci. 2018, 8(4), 532; https://doi.org/10.3390/app8040532
Submission received: 11 February 2018 / Revised: 22 March 2018 / Accepted: 23 March 2018 / Published: 30 March 2018
(This article belongs to the Special Issue Renewable Energy 2018)

Abstract

:
The increasing penetration rate of grid connected renewable energy power generation reduces the primary frequency regulation capability of the system and poses a challenge to the security and stability of the power grid. In this paper, a distributed photovoltaic (PV) storage virtual synchronous generator system is constructed, which realizes the external characteristics of synchronous generator/motor. For this kind of input/output bidirectional devices (e.g., renewable power generation/storage combined systems, pumped storage power stations, battery energy storage systems, and vehicle-to-grid electric vehicles), a synthesis analysis method for system power-frequency considering source-load static frequency characteristics (S-L analysis method) is proposed in order to depict the system’s power balance dynamic adjustment process visually. Simultaneously, an inertia matching method is proposed to solve the problem of inertia matching in the power grid. Through the simulation experiment in MATLAB, the feasibility of the distributed PV storage synchronous virtual machine system is verified as well as the effectiveness of S-L analysis method and inertia matching method.

1. Introduction

In the last few decades, the micro-grid has attracted the interest of many scientists and researchers due to the advantages of improving power supply reliability and power quality through the flexible control of micro-power [1,2]. To solve the energy crisis and environmental problems, more and more renewable energy [3,4,5], electric vehicles [6,7] and energy storage systems [8,9] were connected to the micro-grid through power electronic converters. Those devices can achieve two-way flow of electricity according to the demand of the power grid, which are called input/output bidirectional devices for convenience in this paper. The converter at the input/output bidirectional devices interface operates in the rectification mode by storing the energy at times of surplus. The converter operates in inverter mode and inverts stored electricity into alternating current when power is scarce [10]. Considerable research efforts have been devoted to the input/output bidirectional devices [11,12,13]. Zhong QC proposed the concept of a power electronics-enabled autonomous power system to provide a uniform interface mechanism for smart grid access so that new energy and loads can participate in grid frequency regulation like conventional power supplies [14]. Therefore, the input/output bidirectional devices are required to be able to participate in the regulation of the grid frequency autonomously in both the generator mode and motor mode. Therefore, the traditional static frequency analysis method needs to be improved and expanded.
As a practical input/output bidirectional device, the PV storage system has been intensively investigated due to the improvement of power supply reliability. Concerning the control aspects, von Appen Jan et al. [15] introduced several local voltage control strategies using PV storage systems. Himour Kamal et al. [16] researched the supervision and control of grid connected PV storage systems with the five level diode clamped inverter. In addition, much work so far also has focused on the internal energy management of PV storage [17]. However, inverters as power electronics, do not have the same moment of inertia as synchronous machines. Therefore, PV storage systems can’t provide frequency support for the grid. To solve this problem, Bullich-Massague Eduard et al. [18] presented a method to deal with the main grid code requirements by considering a PV plant with an energy storage device. Moreover, the cooperative control between PV storage and other energy sources has been investigated. Datta Manoj et al. [19] presented a coordinated control method of the distributed PV inverters, energy storage systems, and electric vehicles.
If the device’s frequency regulation mechanism under different modes can be a detailed analysis and a new input/output bidirectional device with bidirectional frequency regulation capability is proposed, the development of input/output bidirectional device will be significantly promoted. Furthermore, it is very important to do that for the construction of the autonomous power system and the stability of grid frequency with a high penetration rate in the future.
In this paper, a synthesis analysis method for system power-frequency considering source-load static frequency characteristics (S-L analysis method) suitable for input/output bidirectional devices is proposed to provide a solution for frequency analysis in new scenarios. A distributed PV storage virtual synchronous generator system that can participate in grid frequency regulation under generator/motor dual mode is established. With this solution, under a steady state, the system can output or store power according to the scheduling results and participate in the frequency regulation process of the power grid actively with the inertia characteristic of the synchronous generator under a transient state. Additionally, the matching method of inertia between power supplies in the power grid is discussed and studied. Finally, the simulation experiment is carried out by using the Synchronous Machine Grid Equivalent Model and verifying the effectiveness of the proposed methods and system.

2. S-L Analysis Method

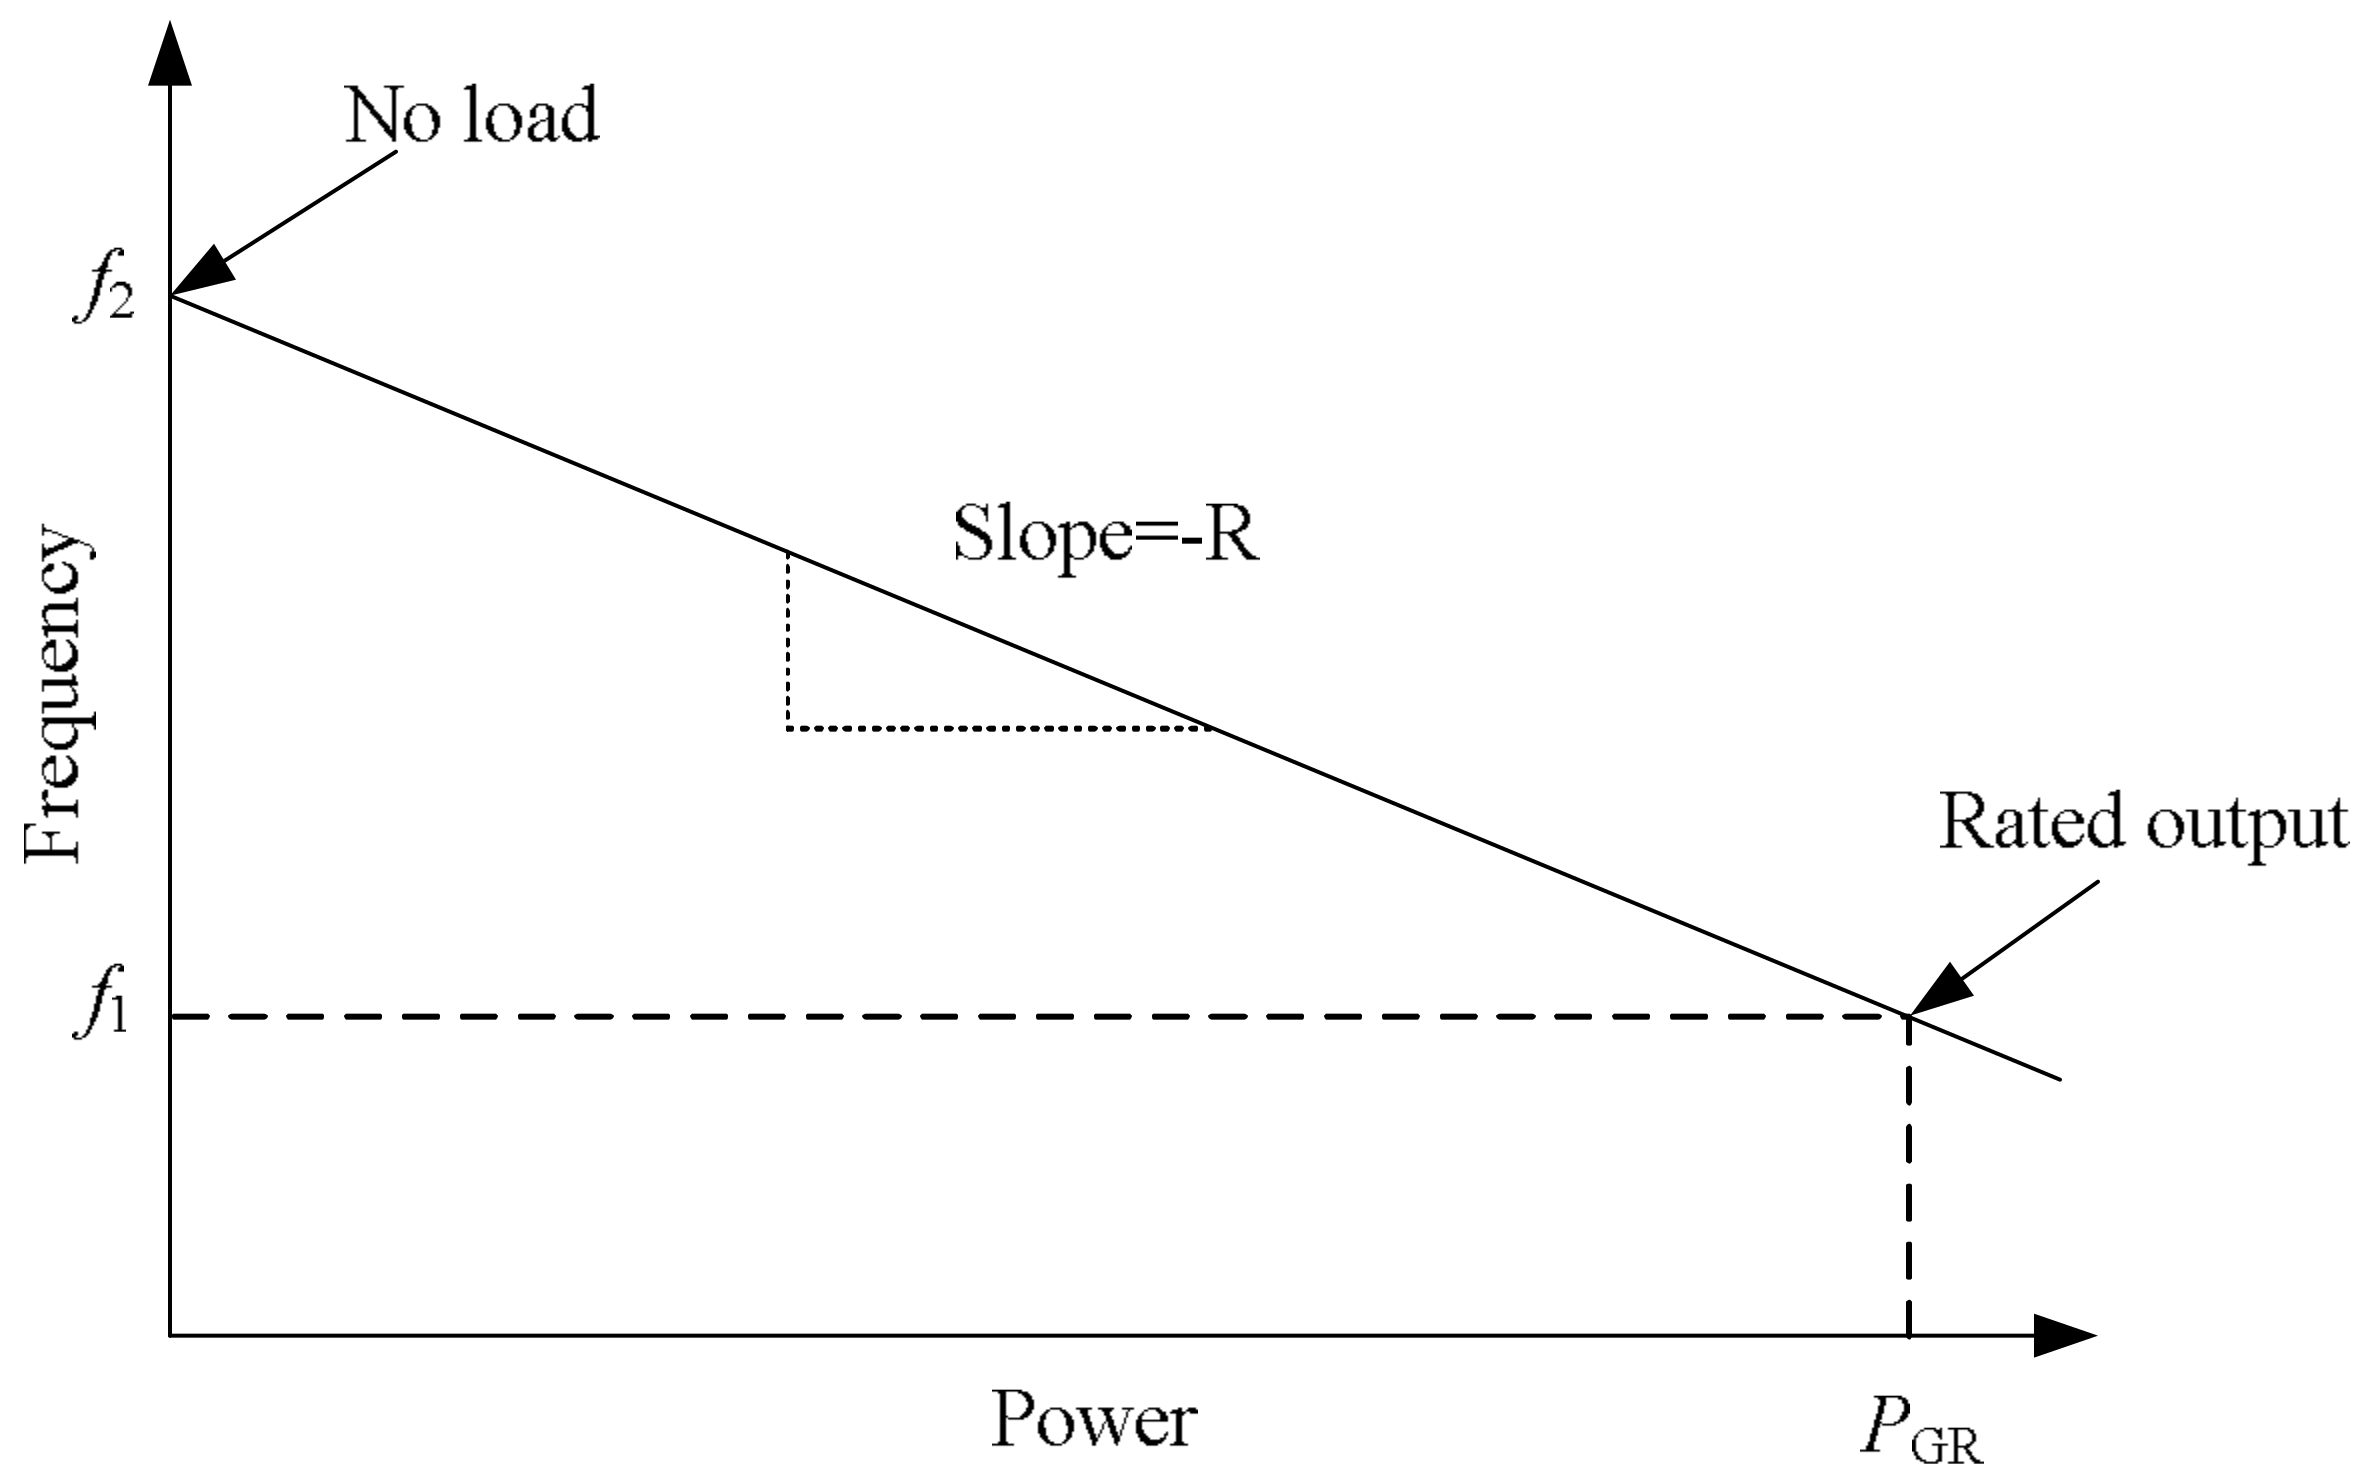
2.1. Overview of Power System Frequency Regulation

When the power system is operating in a steady state, the power of the generator is balanced with the power of the load.
i = 1 m P G i 0 = j = 1 n P L j 0
where m is the number of generators in the system, P G i is the active power from the generator, i ( i = 1,2, , m ), n is the number of motors in the system, and P L j is the active power absorbed by the load j ( i = 1,2, , n ).
Frequency changes occur because system load varies randomly throughout the day so that an exact forecast of real power demand cannot be assured. The imbalance between real power generation and load demand (plus losses) throughout the daily load cycle causes kinetic energy of rotation to be added to or taken from the on-line generating units. Frequency throughout the interconnected system varies as a result. Then, the system will reach a new balance:
i = 1 m P G i 1 = j = 1 n P L j 1
If we subtract Equation (2) from Equation (1), we have the following equation.
i = 1 m Δ P G i = Δ P L 0 j = 1 n Δ P L j 1
where Δ P L 0 is the total load change, Δ P L j 1 is the amount of power change caused by the load j due to its self-regulation, and Δ P G i is the amount of power change caused by the generator i due to its self-regulation. Equation (3) is one of the two basic relations of the frequency regulation process.
Next, the specific frequency regulation process of the generator set was analyzed. Take boiler-turbine-generator combination of a thermal generating unit as an example to help understand the control actions at the power plants. Most steam turbogenerators are equipped with turbine speed governors. The function of the speed governor is to continuously monitor the turbine-generator speed and to control the throttle values, which adjust steam flow into the turbine in response to changes in system frequency. To permit parallel operation of generating units, the frequency-verus-power output governing characteristic of each unit has a droop, which means that a decrease in speed should accompany an increase in load, as depicted by the straight line in Figure 1. The per-unit droop or speed regulation r u of the generating unit is defined as the magnitude of the change in steady-state speed and expressed in per unit of rated speed when the output of the unit is gradually reduced from 1.00 per-unit rated power to 0. Therefore, per-unit regulation is simply the magnitude of the slope of the frequency-versus-power output characteristic when the frequency axis and the power-output axis are each scaled in per unit of their respective rated values.
From Figure 1 it follows that per-unit regulation is given by Equation (4).
r u = Δ f ( % ) Δ P ( % ) = ( f 2 f 1 ) / f R P GR / S R
where, f 2 is the frequency (in Hz) at no load, f 1 is frequency (in Hz) at rated megawatt output P GR , f R is the rated frequency (in Hz) of the unit, and S R is the megawatt base. Multiplying each side of Equation (4) by f R / S R gives Equation (5).
R = r u f R S R = f 2 f 1 P GR   Hz / MW
where R is the magnitude of the slope of the power-frequency characteristic (in Hz/MW). Suppose that the unit is supplying output power P G 0 at frequency f 0 when the load is increased to P G = P G 0 + Δ P G , which is shown in Figure 2. As the speed of the unit decreases, the speed governor allows more steam from the boiler through to the turbine to arrest the decline in speed. Equilibrium between input and output power occurs at the new frequency f = f 0 + Δ f as shown. According to the slope of the power-frequency characteristic given by Equation (5), the frequency change (in Hz) is shown in the equation below.
Δ f = Δ P G R = Δ P G ( r u f R S R )
when m generating units are operating in parallel on the system, their power-frequency characteristic determine how load changes are apportioned among them in the steady state. In this case, there is
Δ P G 1 R G 1 = = Δ P G i R G i = = Δ P G m R G m = Δ f
where R G i is the magnitude of the slope of the power-frequency characteristic of generating unit i . Additionally, Equation (7) is the other basic relation of frequency regulation process.
Equation (3) characterizes the “participants” of the frequency regulation process. Equation (7) characterizes the “degree of participation” of “participants.” The two basic relationships represented by Equations (3) and (7) are the essence of the frequency regulation process.
The isolated unit of Figure 1 would continue to operate at the reduced frequency f except for the supplementary control action of the speed changer. The regulation is characteristic to the new position shown by the dashed line of Figure 2. Effectively, the speed changer supplements the action of the governor by changing the speed setting to allow more prime-mover energy to increase the kinetic energy of the generating unit so that it can again operate at the desired frequency f 0 while providing the new output P G [20].
From the above, the frequency regulation according to the natural regulation characteristic line is generally called primary frequency regulation. The frequency regulation by supplementary control is generally called secondary frequency regulation.

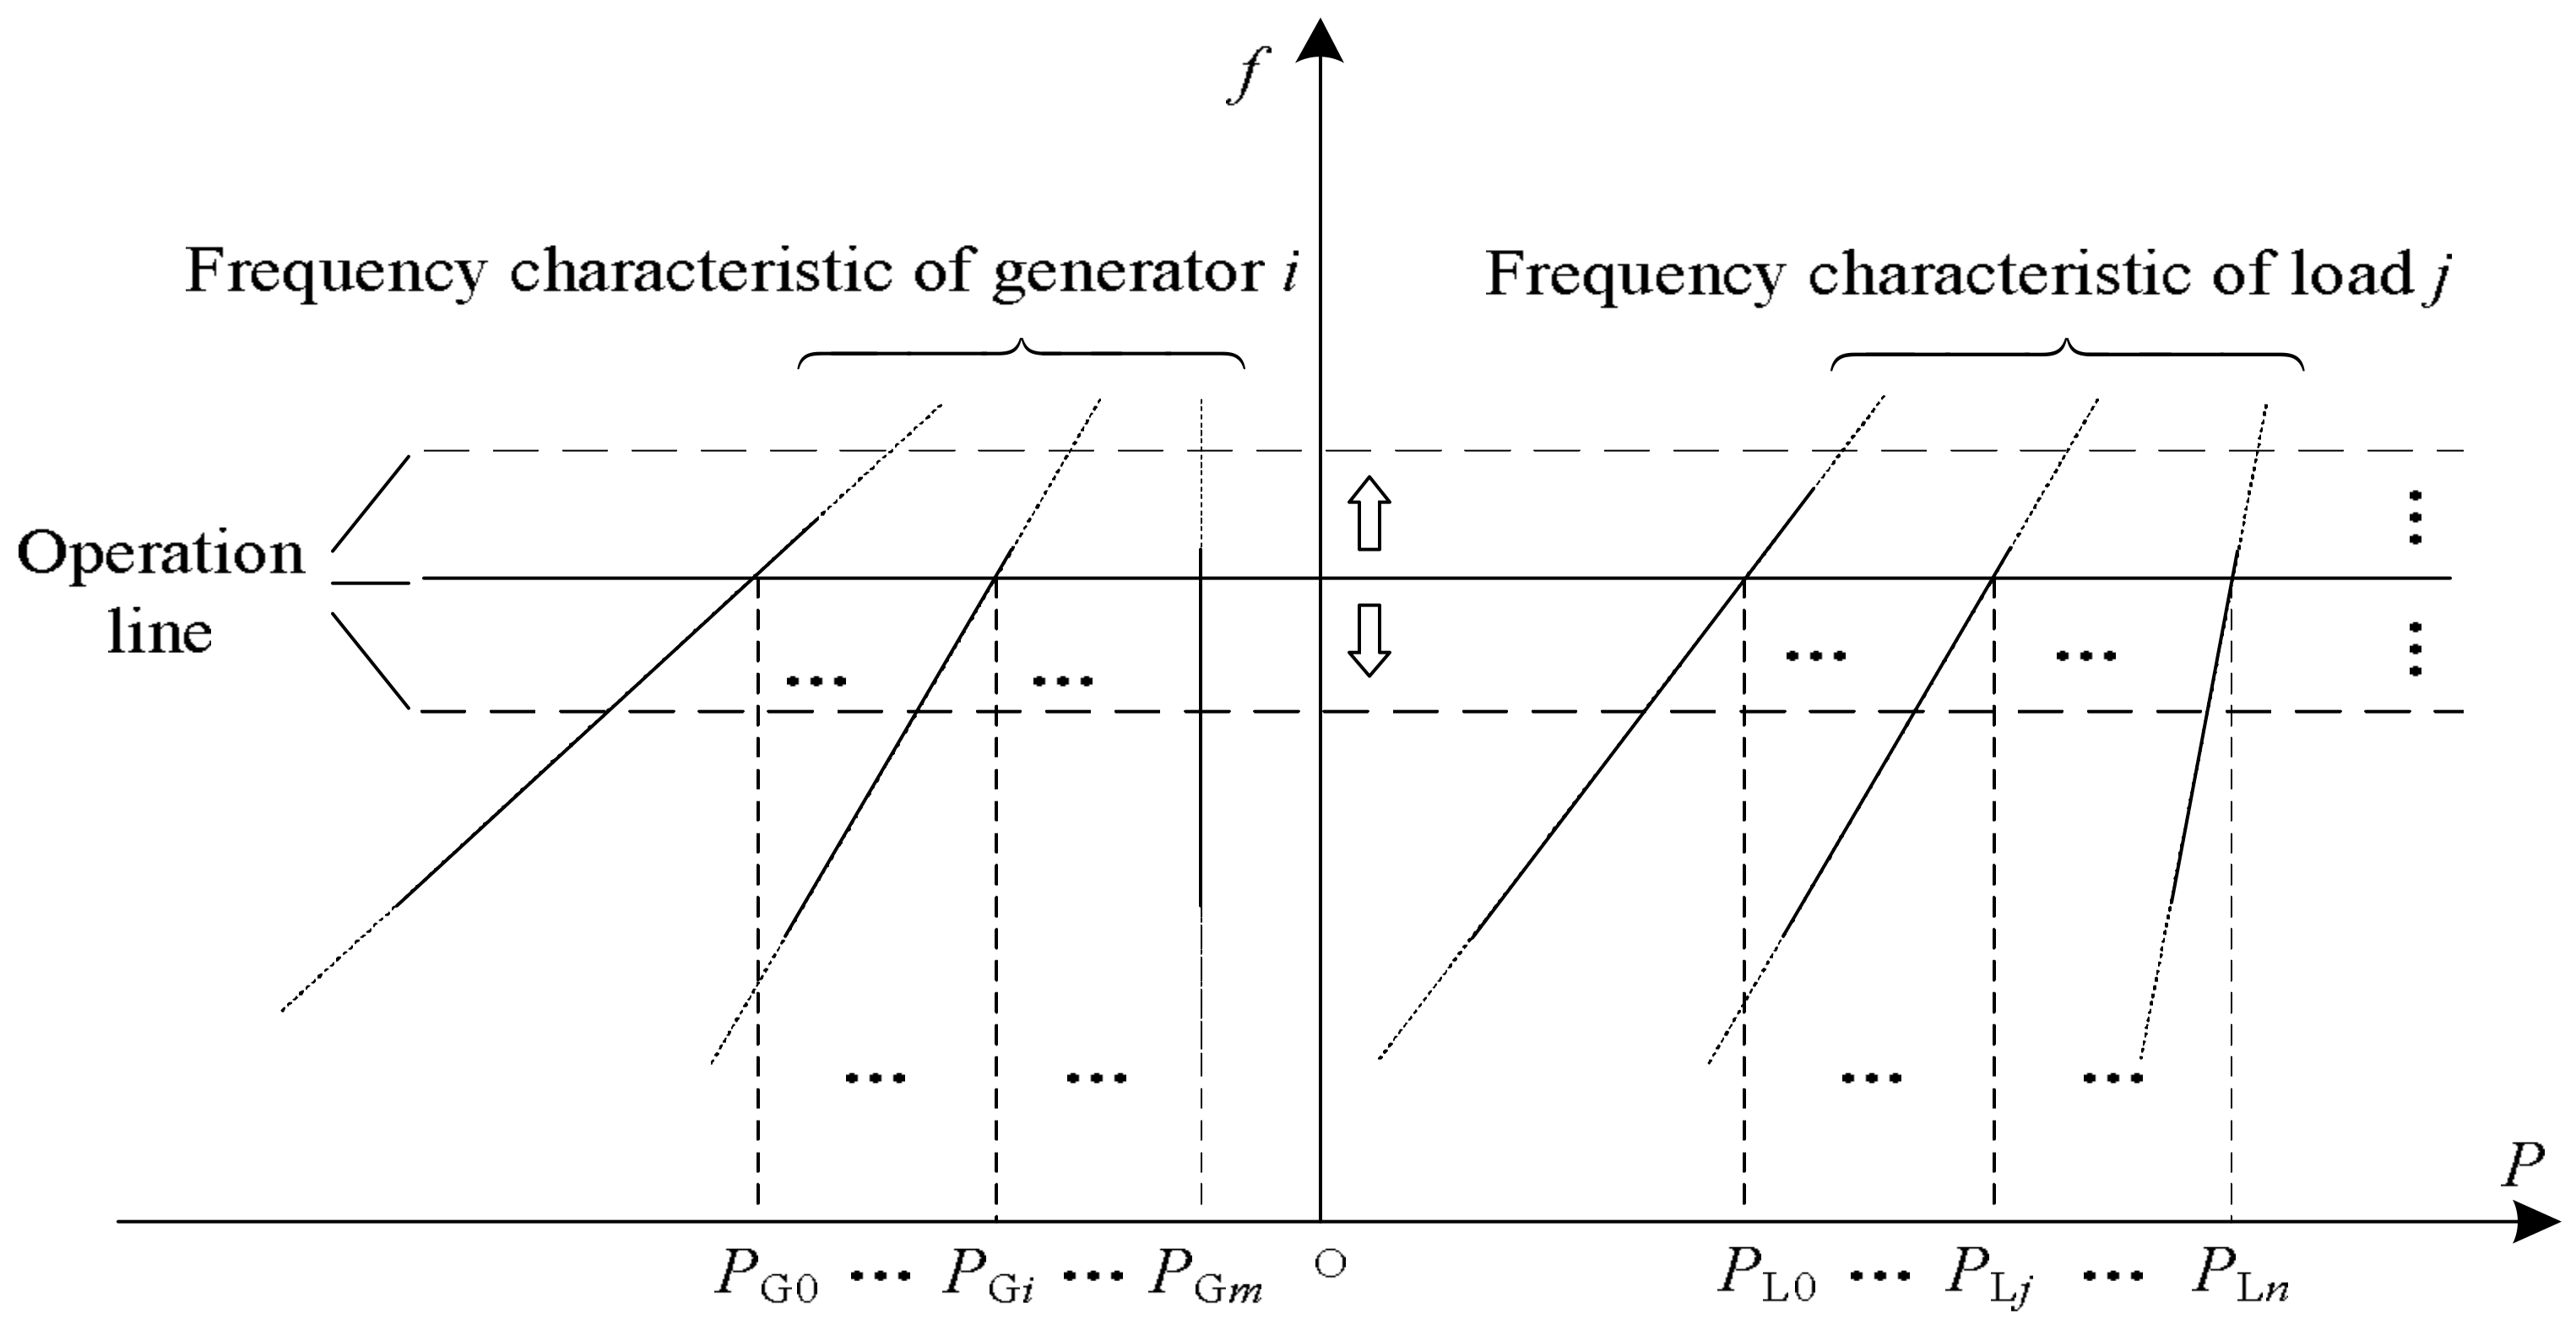
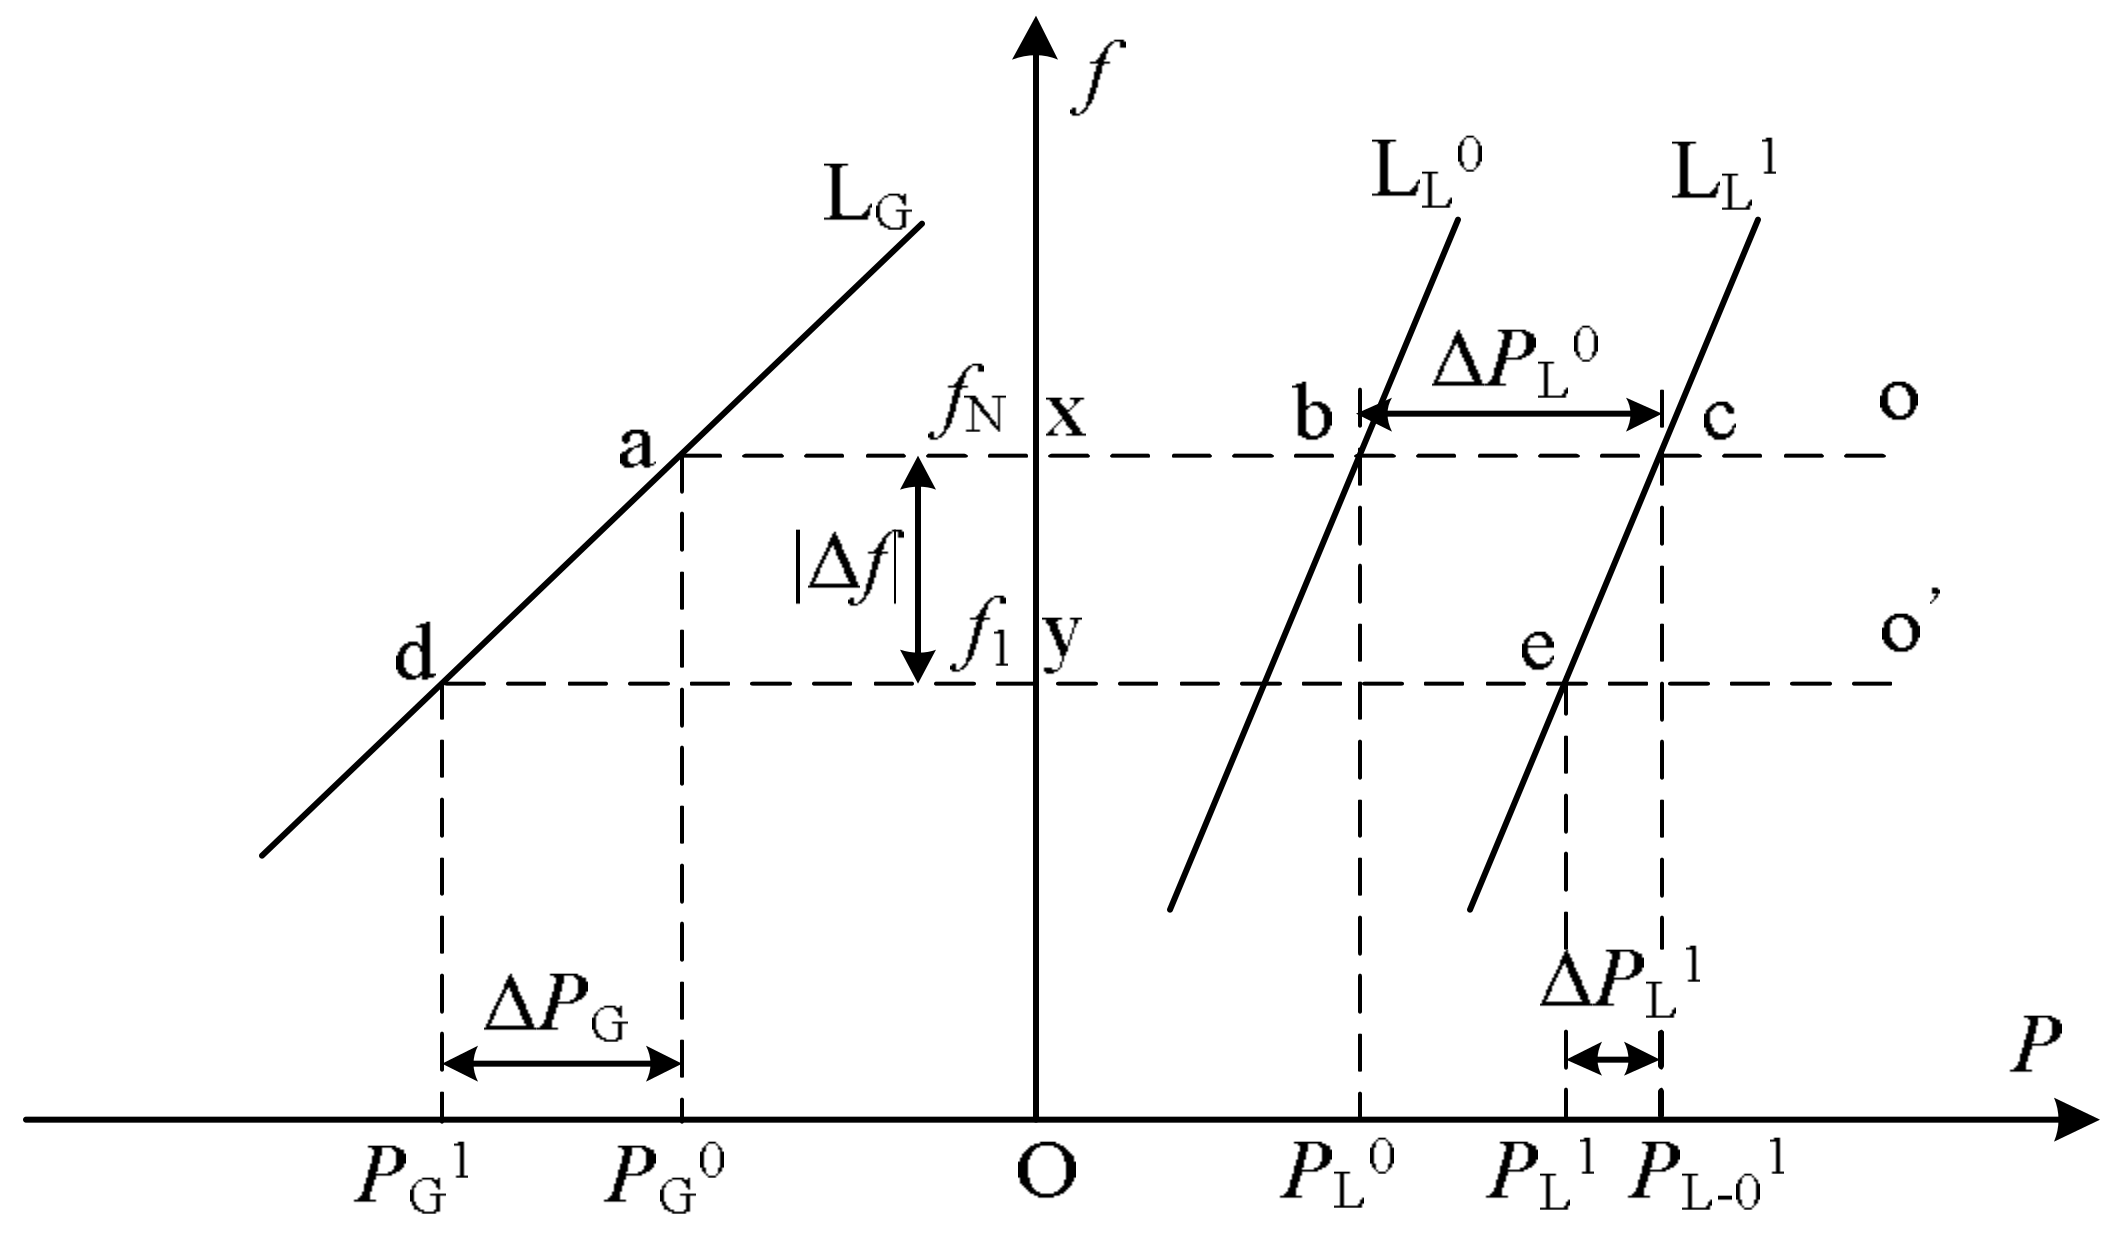
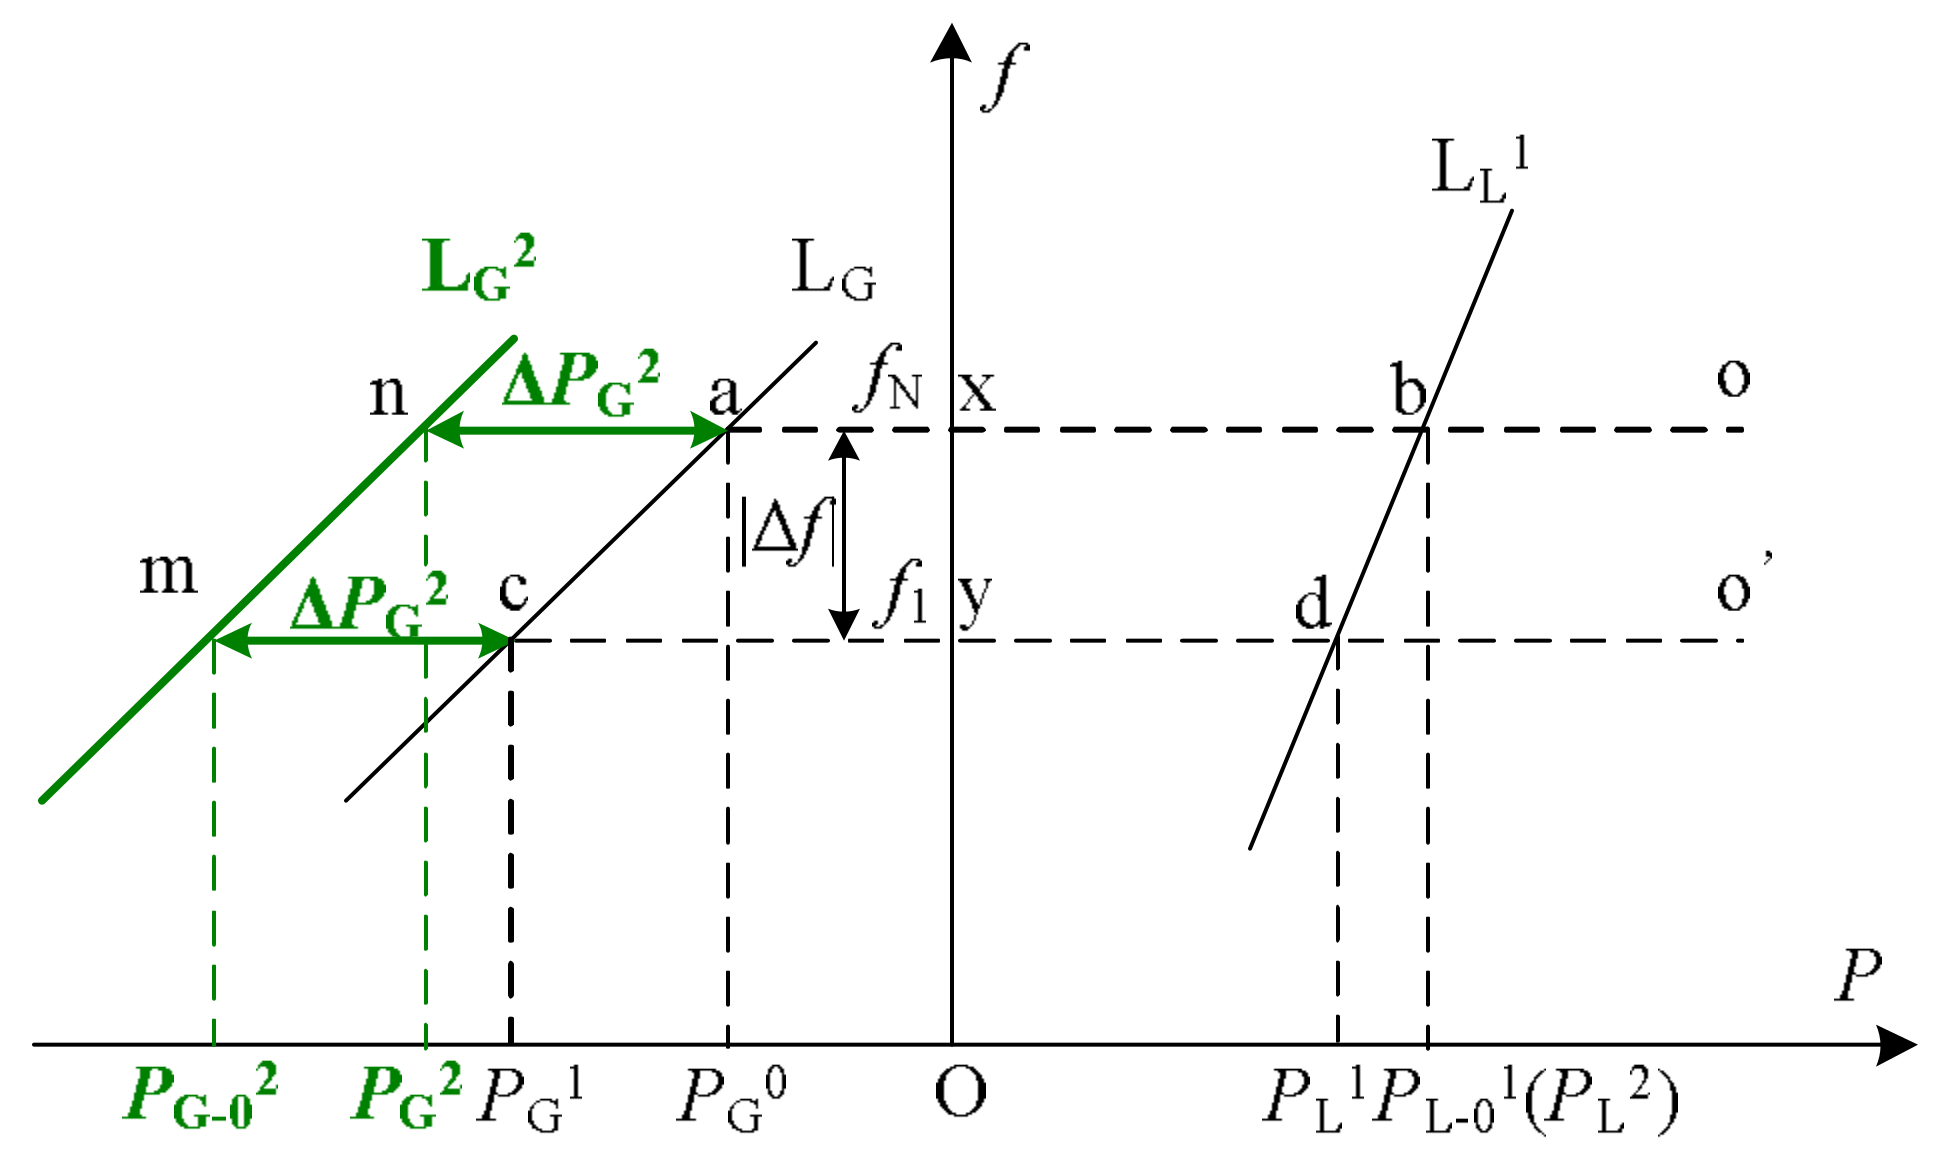
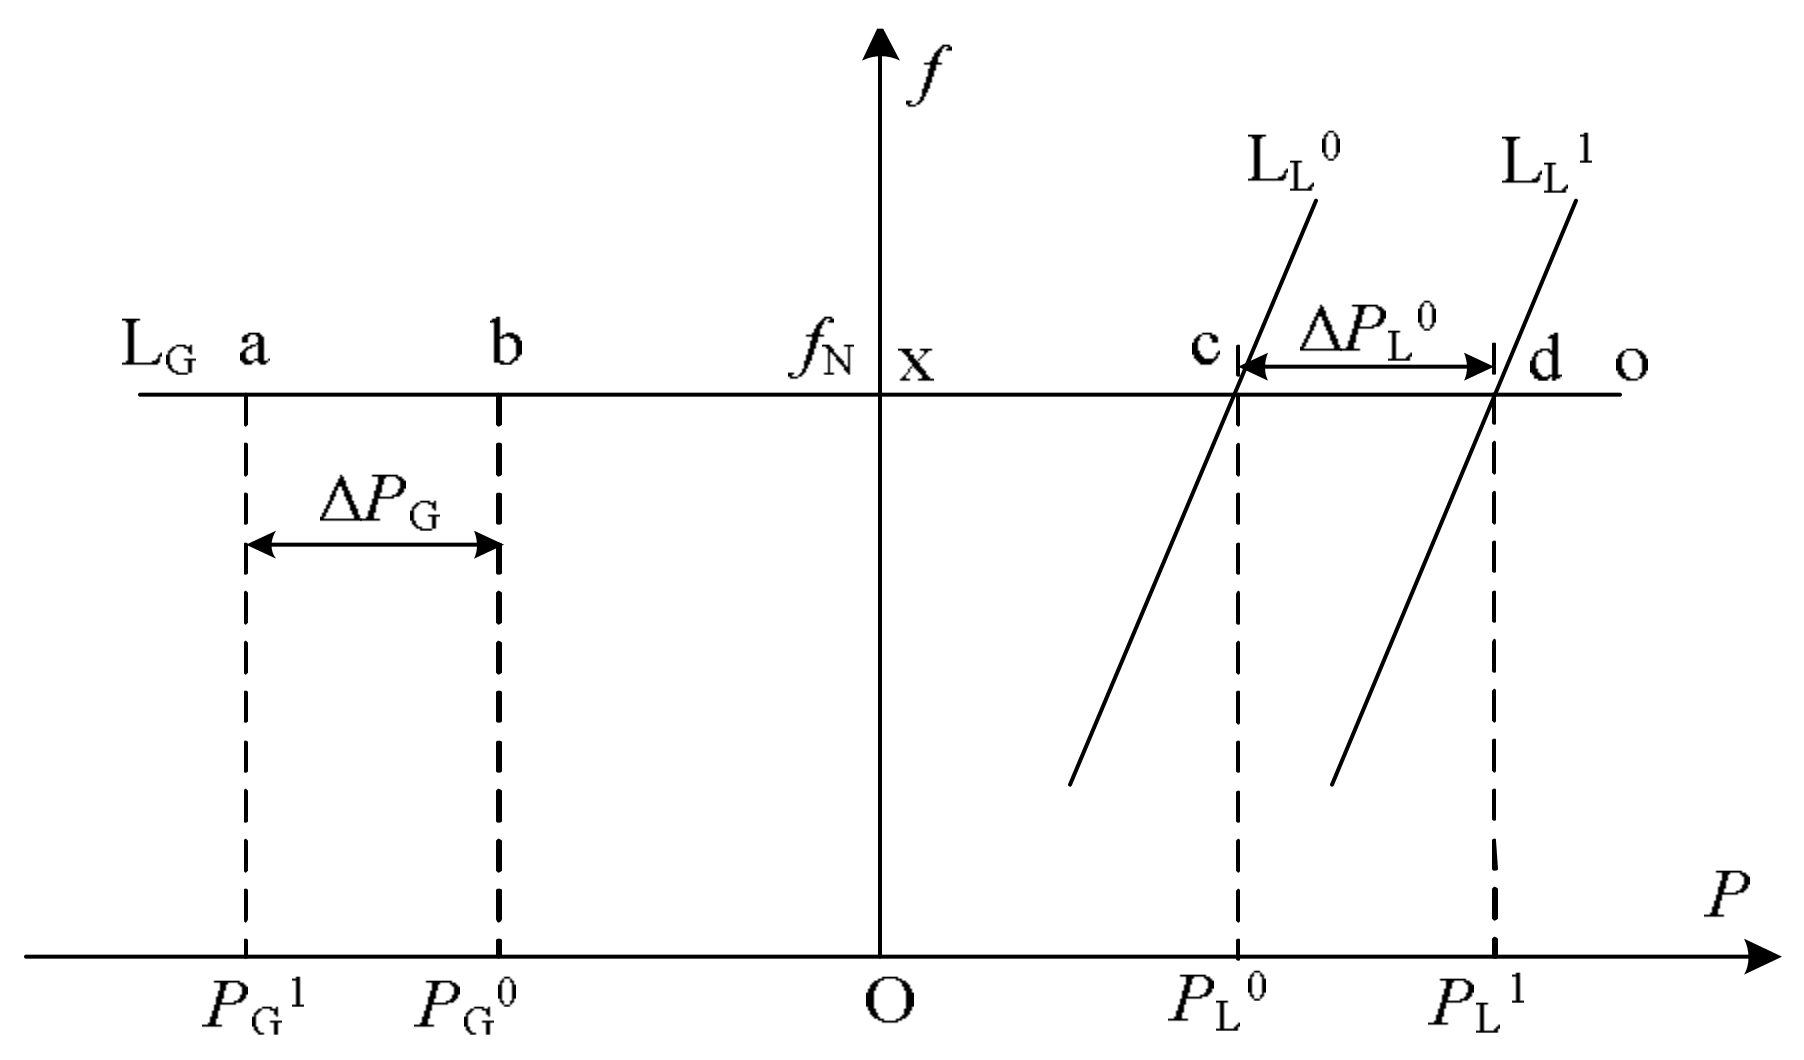
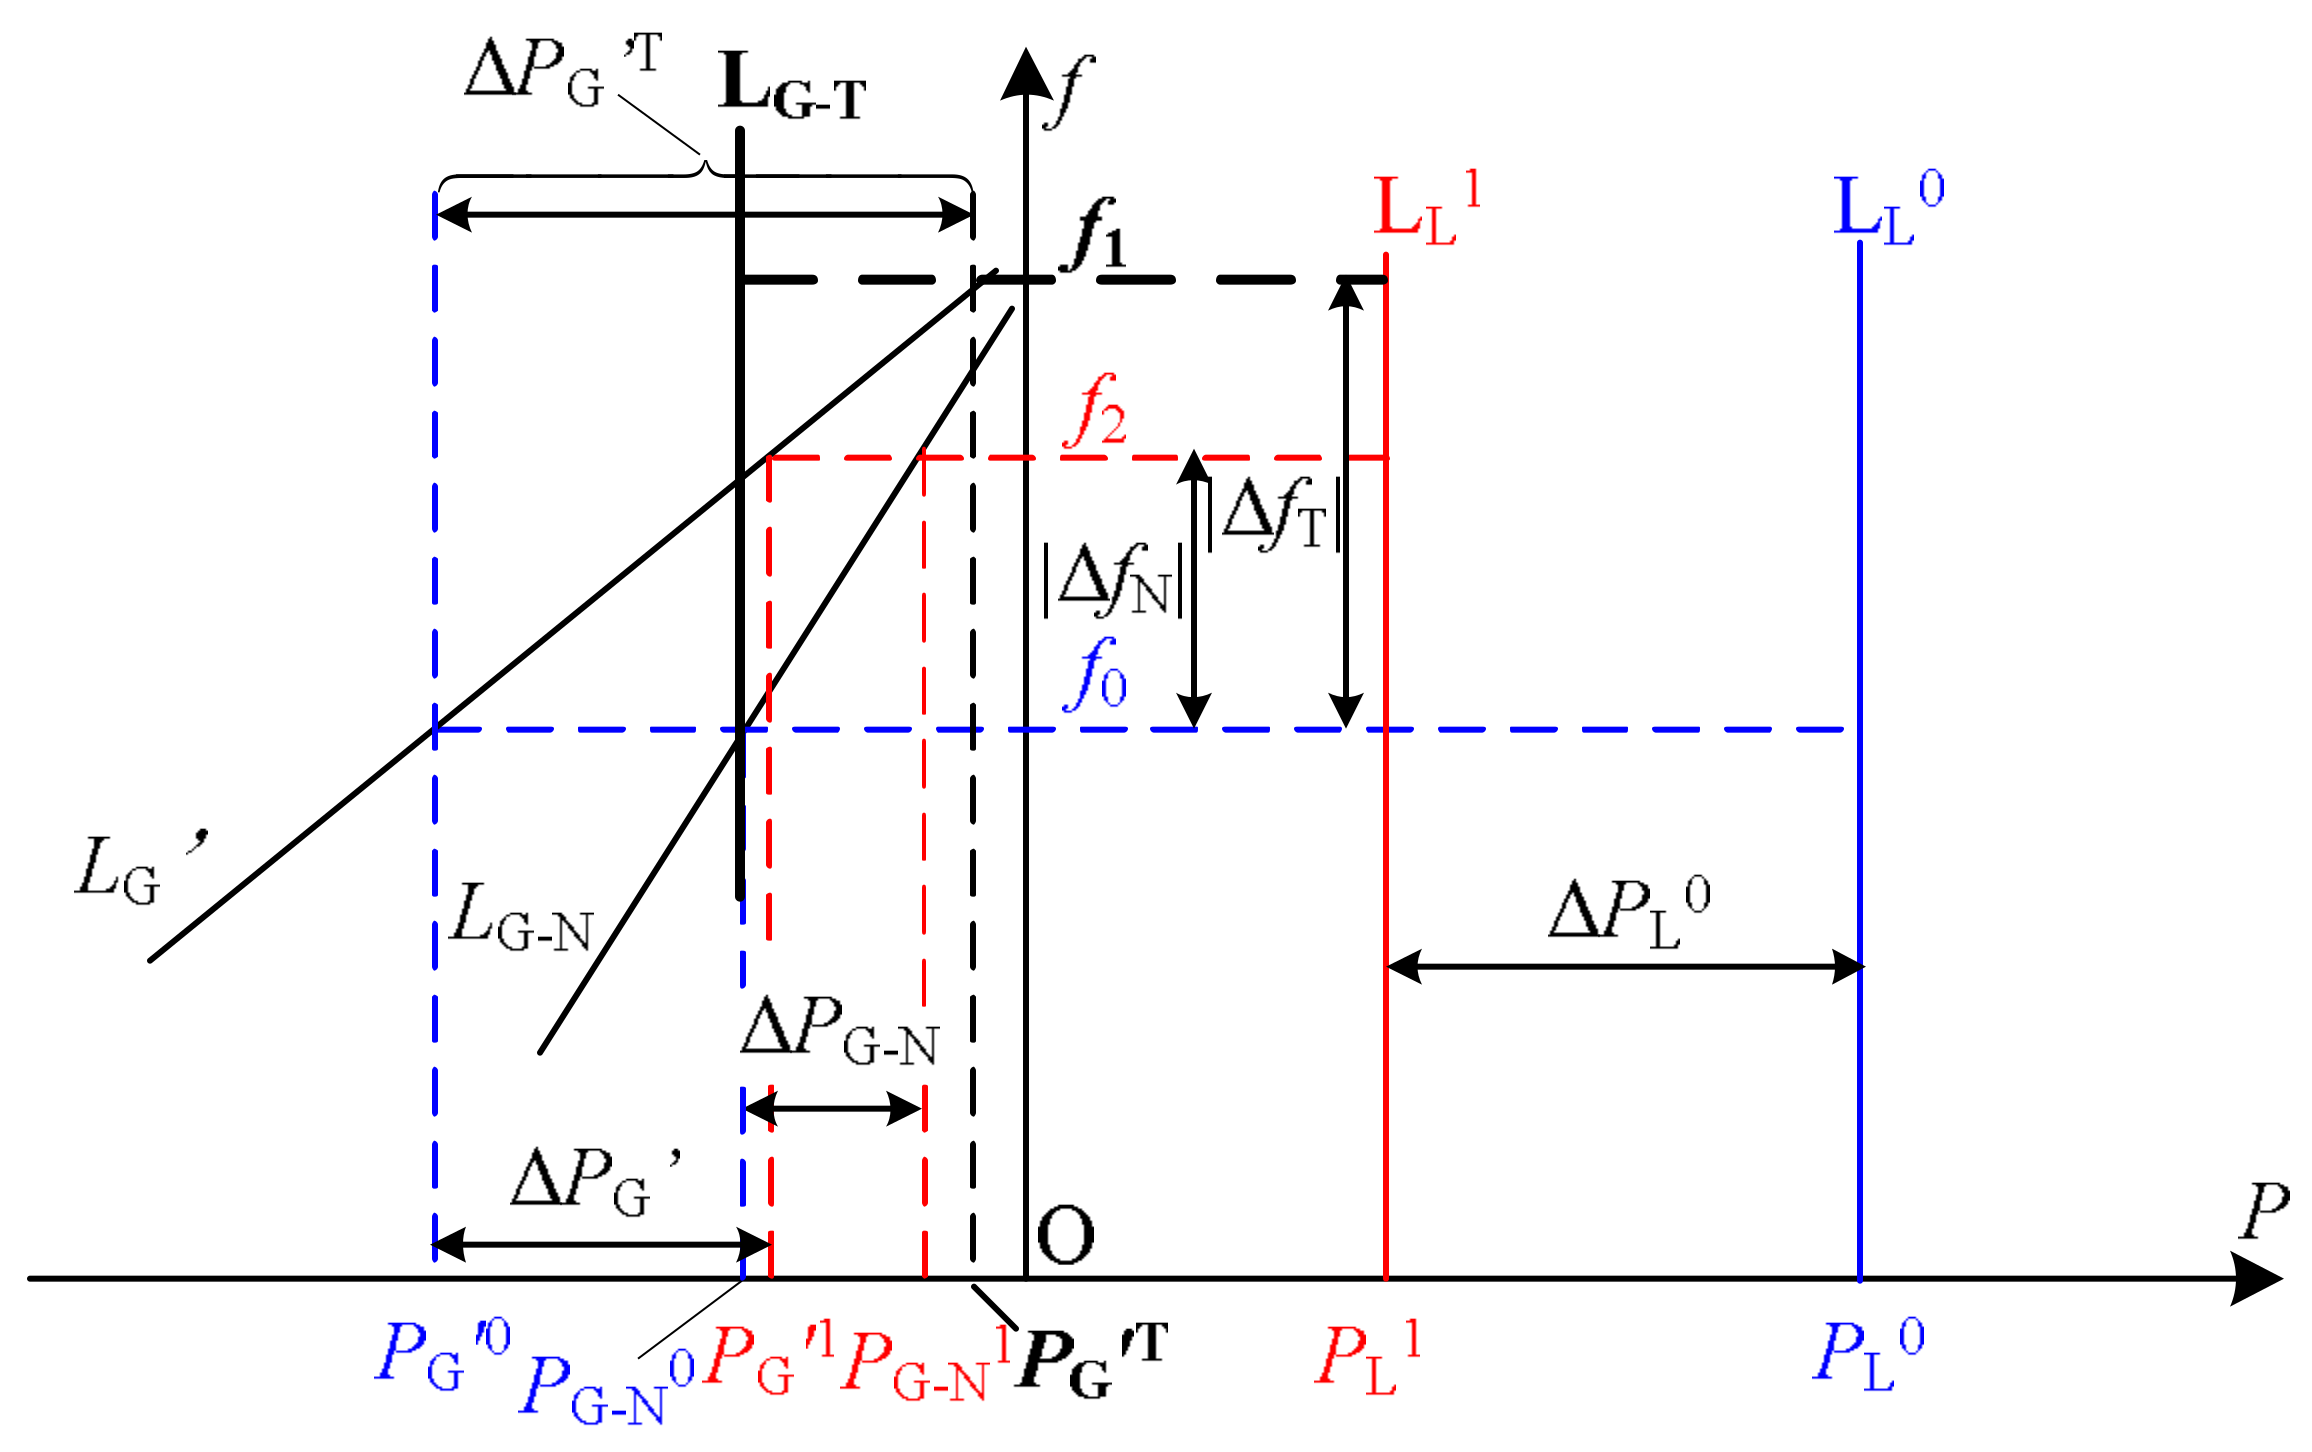
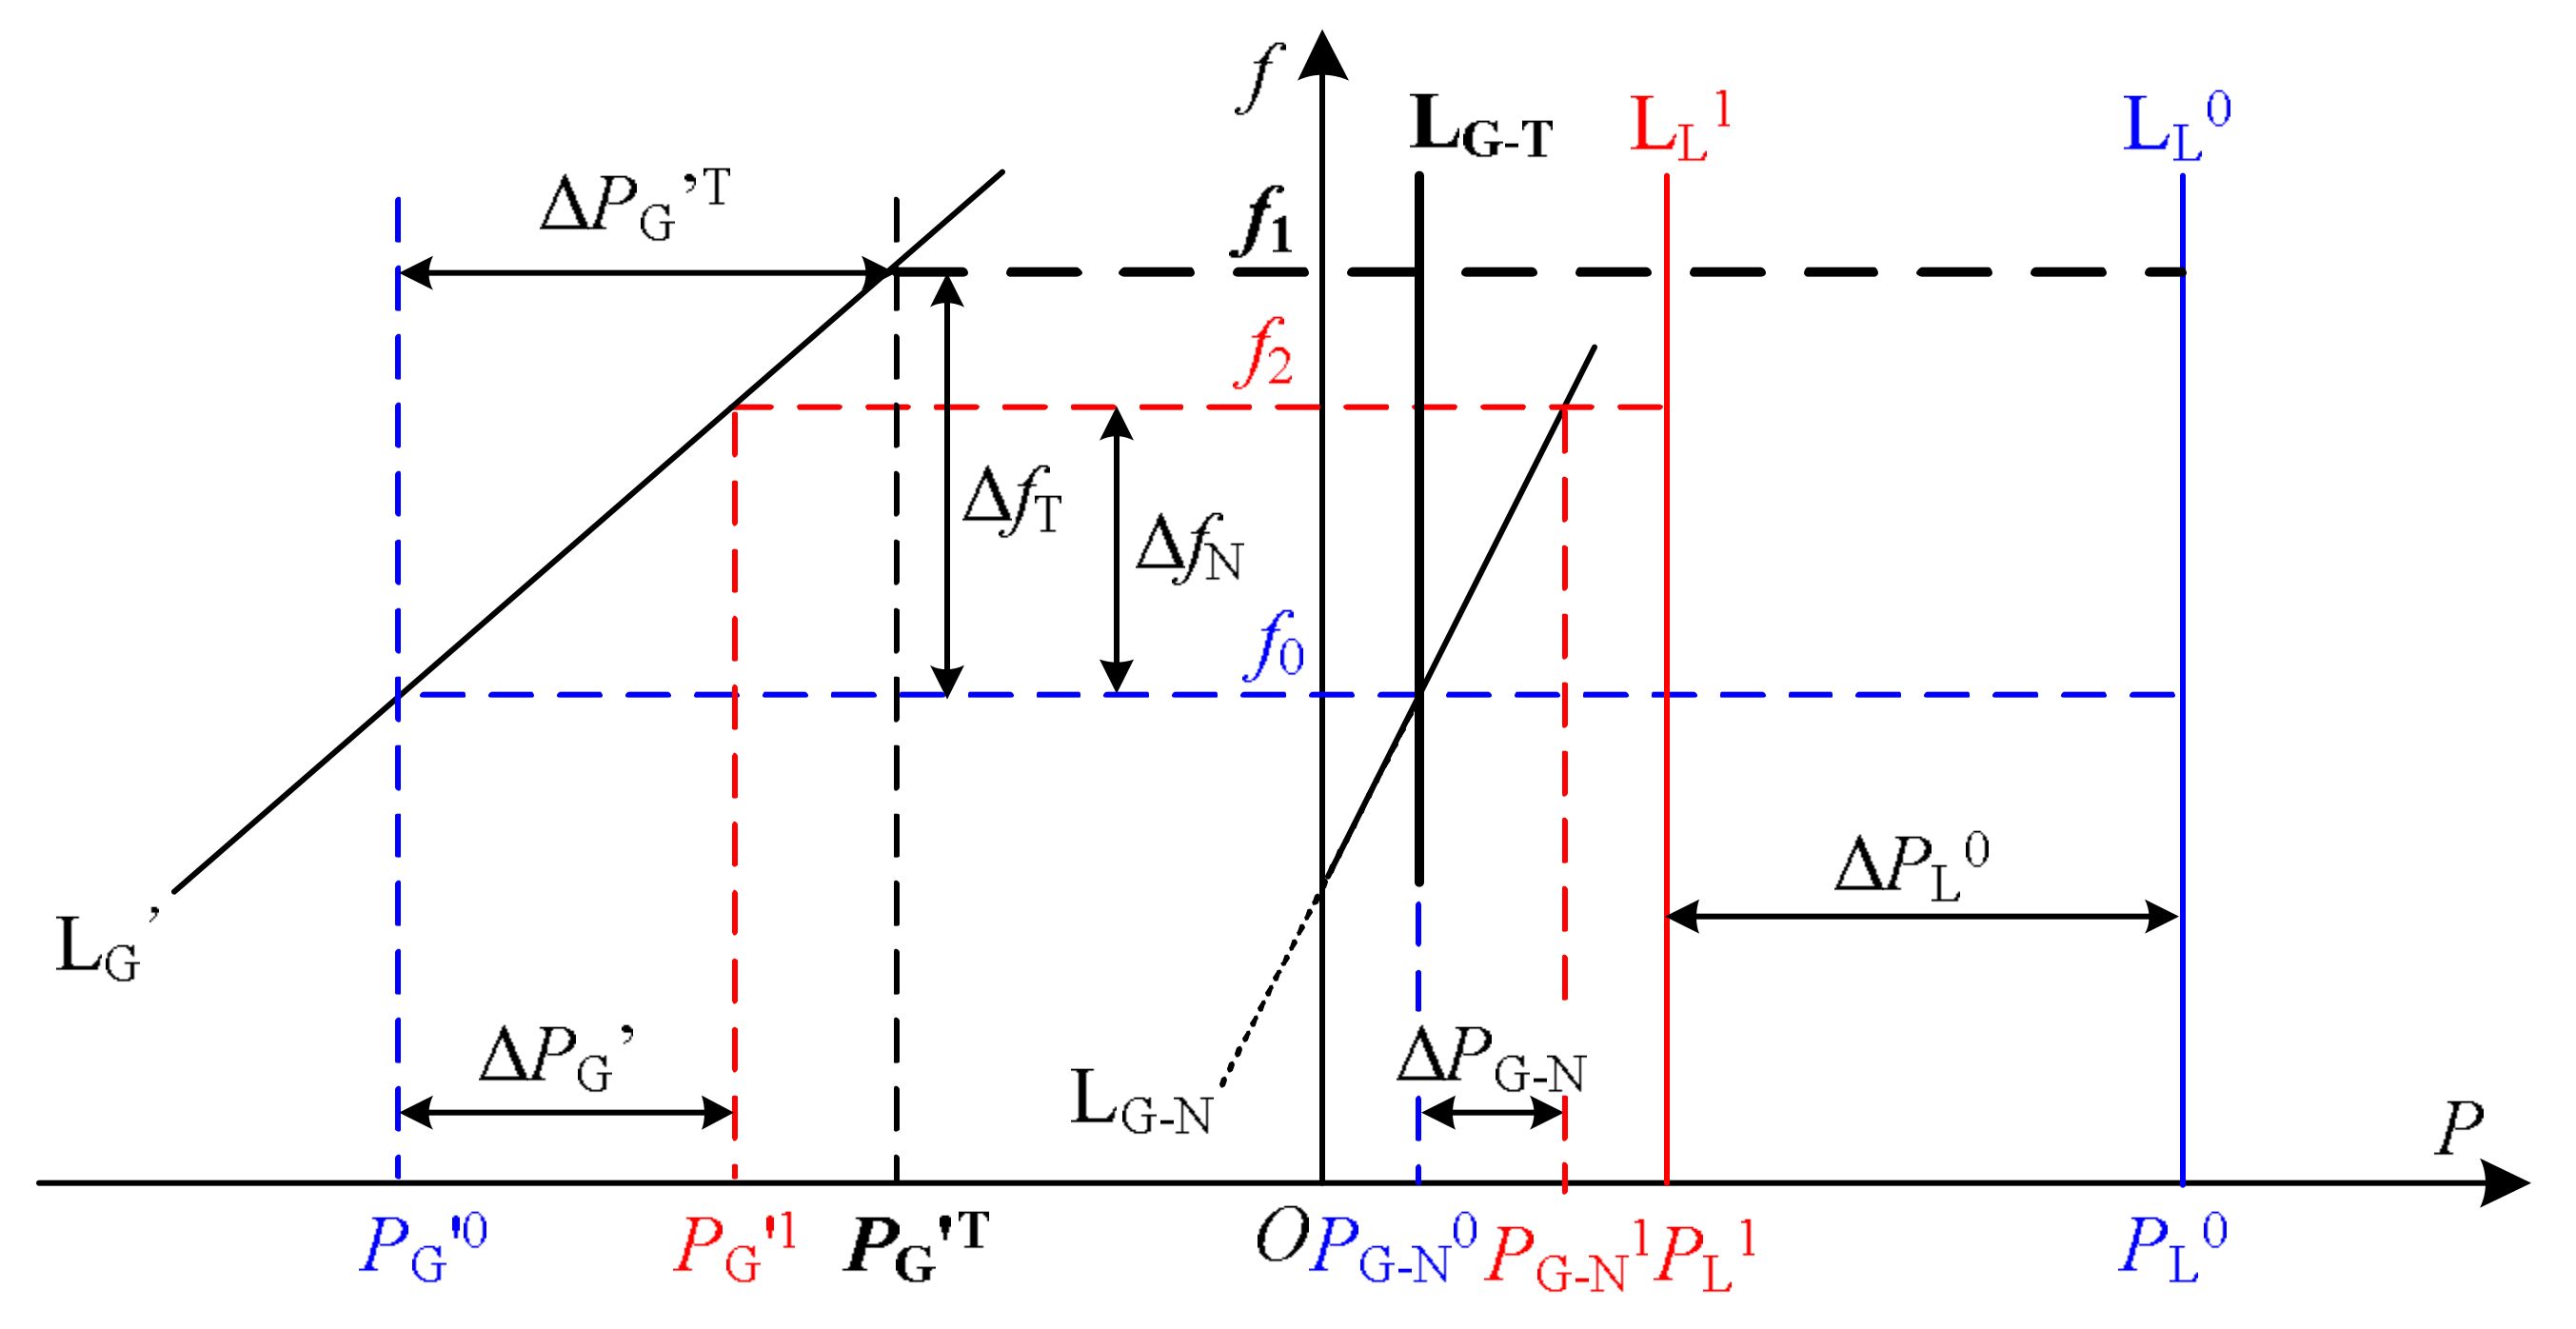
2.2. Introduction of S-L Analysis Method

Input/output bidirectional devices can become both power supply and load in the power system. They can also become participants of frequency regulation through automatic speed-regulating devices and demand side response. Therefore, the above frequency analysis should be extended. Generators not only refer to conventional power sources, but they also include input/output bidirectional devices operating in generator mode. Loads not only refer to traditional loads but also include input/output bidirectional devices operating in motor mode.
The traditional frequency analysis method does not show the frequency regulation characteristic of the load, which is not able to visually display the power balance relations shown in Equations (1) and (2) in the power system. As a result, the frequency regulation process and mechanism of the input/output bidirectional devices in different modes (generator mode/motor mode) cannot be exhaustively analyzed. Aiming at such shortcomings, in this section, the S-L analysis method is presented. First, the application of this method is introduced under the conventional single-power system. Afterward, how this method can be applied to complex multi-power systems including input/output bidirectional devices is explained.
In order to visualize the frequency characteristics of the load, the frequency characteristic in the first quadrant was extended to both the first quadrant and the second quadrant and a uniform power reference direction was established. As shown in Figure 3, the horizontal axis is the active power axis and the vertical axis is the frequency axis. Taking into account the cognitive habits, the motor practice is used to regulate the positive direction, which means the power absorbed by the motor is positive rather than the power generated by the generator. Regardless of power supply or load, the direction of power absorption from the grid is positive and the direction of power delivery to the grid is negative. In this way, it is possible to clearly distinguish between the power supply and the load in a unified power reference direction and give them a clear physical meaning. In order to visually represent the balance of the power system, the operation line was then defined. Therefore, the intersection of the operation line and frequency axis is the system frequency. The abscissa of the intersection of operation line and each power’s frequency characteristic line is the power generated by that power supply and the abscissa of intersection of operation line and each load’s frequency characteristic line is the electricity consumption by that load. If the sum of the abscissas of the intersections of the operation line and each power frequency characteristic line is equal to that of the operation line and each load frequency characteristic line, Equation (1) is satisfied, which achieves power balance. At this moment, the frequency corresponding to the running line is the steady state frequency. This method considered the source-load static frequency characteristics, which is hence abbreviated as the S-L analysis method.

2.3. S-L Analysis Method of Single-Supply System

2.3.1. Conventional Single-Supply System

(1) Primary Frequency Regulation
Using the basic ideas above, an S-L analysis method for a general single-supply system was obtained (see Figure 4).
The proposed S-L analysis method is an evolution of the one introduced in Reference [20]. As we can see from Figure 4, the load absorbed power and its frequency characteristic lies in the first quadrant, which means the corresponding power value is positive. Conversely, the power source output power has a frequency characteristic in the second quadrant. Straight lines L G and L L 0 are the frequency characteristics of the power source and the total load in the initial state, respectively. The intersections of the straight line o with the vertical axis, L G and L L 0 are the points x , a and b respectively, which satisfy ax = bx , P G 0 = P L 0 . Therefore, in the initial state, the system’s operation line is a straight line o . The coordinate at point x is f N and the system is run at nominal frequency. After the load is increased, the frequency characteristic of the load would move to the right and become the straight line L L 1 in Figure 4. Instantaneously, the load increases from P L 0 to P L 0 1 while the power delivered by the generator remains the same. This results in insufficient power and a decrease in frequency. As the figure shows, in the process of decreasing frequency, the generator generates additional power and the load absorbs less power. Under the frequency regulation of the power supply and the load, when the operation line is reduced to the straight line o , there is dy = ey , which reaches a new power balance of P G 1 = P L 1 and the frequency drops to f 1 at that time.
In the following, the rationality of S-L analysis method is deduced from a mathematical relation. In Figure 4, the initial power balance corresponding to the operation line o is obtained as the equation below.
P G 0 = P L 0
From the final power balance corresponding to the operation line o , there is:
P G 1 = P L 1
Considering the transitional process from operation line o to operation line o for the output power, there is
P G 0 + Δ P G = P G 1
The load, first sudden increases, then reduces for self-regulation.
P L 0 + Δ P L 0 Δ P L 1 = P L 1
Using Equations (8)–(11), we can deduce Equation (12) below.
Δ P G = Δ P L 0 Δ P L 1
Equation (13) is easily obtained from the mathematical relationship in Figure 4.
Δ P G R G = Δ P L 1 R L = | Δ f |
where, R G , R L are the magnitude of the slope of the power-frequency characteristic of power supply and load. It can be seen that Equation (12) is consistent with Equation (3) and Equation (13) is consistent with Equation (7). Therefore, the S-L analysis method meets the two basic relations of frequency regulation process, which is not contrary to the law of power-frequency proven to be feasible.
(2) Secondary Frequency Regulation
If the system frequency does not satisfy the requirements after frequency regulation, there is a need for secondary frequency regulation. For convenience, take the realization of the frequency zero error adjustment as an example to illustrate the process (see Figure 5). For ease of reading, the information of primary frequency regulation was omitted and the second frequency information was shown in green.
After primary frequency regulation, the frequency is f 1 , with cy = dy , that is P G 1 = P L 1 . On the basis of primary frequency regulation, the role of the secondary frequency regulation is to make the input/output bidirectional device shift its frequency characteristic line to the left, which leads to additional power Δ P G 2 being generated. This results in P G 1 + Δ P G 2 > P L 1 ( P G 0 2 > P L 1 ). At this point, power generation is greater than the power load need, which means the generator unit would store excess energy in the shaft and the system frequency would gradually increase. Essentially, the operation line o in the figure would move up. As the frequency rises, the generator outputs less power. At the same time, the load absorbs more power both of which together contribute to the next power balance. Finally, when the operation line returns to o , there is nx = bx , P G 2 = P L 2 ( P L 0 1 ), and new power balance is reached. At this point, the system frequency is back to f N , which achieves the regulation with zero error.

2.3.2. Special Single-Supply System

Below we discuss a special single-supply system, which is different from the traditional single-supply system analyzed above (see Figure 6).
The frequency of an infinite power grid is constant at a nominal frequency and any power can be emitted or absorbed according to the load. Therefore, the operating lines are unchanged no matter how the load changed. The power balance of the initial state and the power balance of the final state correspond to bx = cx , ax = dx , respectively. The two basic relations of this situation are Δ P L 1 = 0 in Equation (11) and each term is zero in Equation (13).

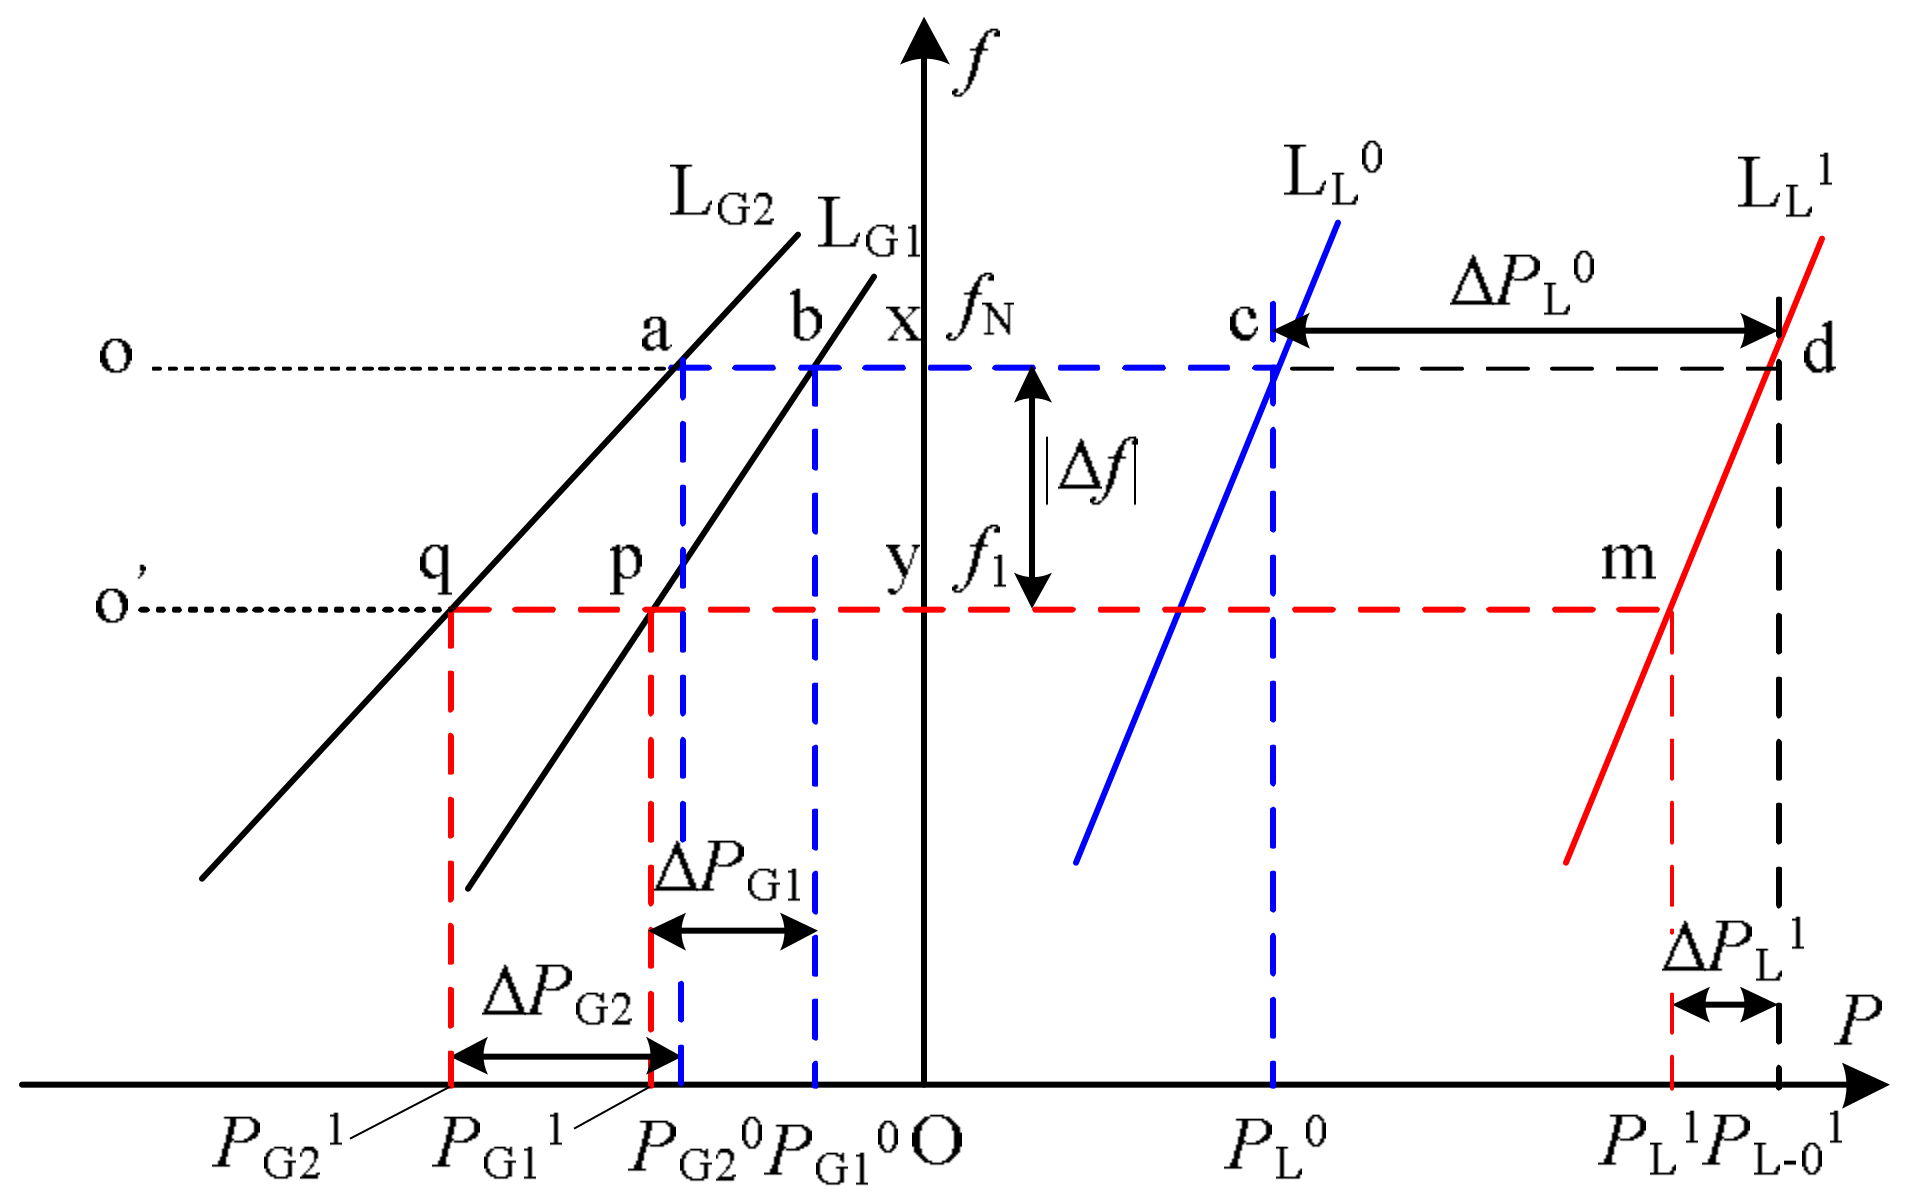
2.4. S-L Analysis Method of Multi-Power System

This section describes the application of S-L analysis in multi-power systems. It is noteworthy that the multi-power system includes not only the normal generator set but also the input/output bidirectional devices and the actual power grid. In this subsection, analysis methods for different components of the multi-power system are introduced respectively.

2.4.1. Generator Set

For generator sets, the analysis is similar to the S-L analysis of the single-supply system shown in Figure 4. The difference is that there are multiple power frequency characteristics in the left side of the frequency axis due to multiple power supply. Taking two generator sets with different frequency characteristics as an example, which is shown in Figure 7, lines L G 1 and L G 2 are the frequency characteristics of generator set 1 and generator set 2, respectively. The blue information indicates the initial steady state and the red information indicates the steady state after frequency regulation.
In Figure 7, the initial power balance corresponding to the operation line o can be expressed as Equation (14).
P G 1 0 + P G 2 0 = P L 0
From the final power balance corresponding to the operation line o , Equation (15) is obtained.
P G 1 1 + P G 2 1 = P L 1
Taking into consideration the transitional process of two generator sets from operation line o to operation line o , for power, we obtain the equation below.
{ P G 1 0 + Δ P G 1 = P G 1 1 P G 2 0 + Δ P G 2 = P G 2 1
For the load, the frequency characteristic is the same as that of single-power supply.
P L 0 + Δ P L 0 Δ P L 1 = P L 1
With Equations (14)–(17), we deduce Equation (18).
Δ P G 1 + Δ P G 2 = Δ P L 0 Δ P L 1
From the mathematical relationship in Figure 7, we deduce the equation below.
Δ P G 1 R G 1 = Δ P G 2 R G 2 = Δ P L 1 R L = | Δ f |
It can be seen that Equation (18) satisfies the basic relationship 1 shown in Equation (3). Equation (19) satisfies the basic relationship 2 shown in Equation (7). What should be noted is that when the load suddenly decreases, the system’s frequency regulation process is the inverse of the above process while the analysis above is still applicable.

2.4.2. Input/Output Bidirectional Devices

When the input/output bidirectional device is operating in generator mode, the frequency characteristic locates in the left of the frequency axis. When operating in motor mode, the frequency characteristic is in the right of the frequency axis. When the mode is switched, the frequency characteristics need to be moved left and right with unchanged slope due to its unchanged per-unit regulation characteristic generally. The rest of the analysis is consistent with that of Figure 7, which means it is still satisfying the two basic relations of Equations (3) and (7).

2.4.3. The Actual Power Grid

The infinite grid is an idealized simplified model. The frequency of actual grid would vary slightly with the output changes especially in the distributed microgrid. Therefore, the actual grid model is particularly necessary. The frequency characteristic line of the actual grid is a line with a very small slope between that of the infinite power grid and the general power supply. The relationship between them is shown in Figure 8. Straight line L G , L G , L G , L L are the frequency characteristics of infinite grid, actual grid, general power supply, and load, respectively.

3. Distributed PV Storage Virtual Synchronous Generator System

3.1. The Power-Frequency Characteristics of Converter at the Interface of Input/Output Bidirectional Devices

The control of input/output bidirectional devices is mainly realized through the converter at its interface. The common control methods are power (PQ) control, voltage-frequency (Vf) control, and droop control. The control strategy to adopt depends on the type of prime motor and the operation mode of the microgrid.
PQ control makes distributed micro-source output a constant scheduling power, which is composed of power outer loop and inner current loop. It is widely used in grid connected inverters and energy storage inverters. The converter under PQ control acts as a PQ bus in the power system. PQ buses account for most of the buses in the power grid system. Common storage devices and electric vehicles are PQ buses, generally.
Vf control can output constant voltage and frequency composed of the voltage outer loop and the current inner loop, which is widely used in island operation under the master-slave mode micro-grid. During the micro-grid islanding operation, the main control unit using PQ control provides voltage and frequency support for the slave unit as a slack bus. Generation/energy storage systems (PV storage and wind storage) can use Vf control because of its superior response speed and schedulability.
Droop control is a distributed power control method that follows the synchronous generator operating characteristics, which is commonly used in the peer control structure of the micro-grid parallel system divided into droop control and anti-droop control. The distributed power supply can make adjustment of frequency with error through droop control.

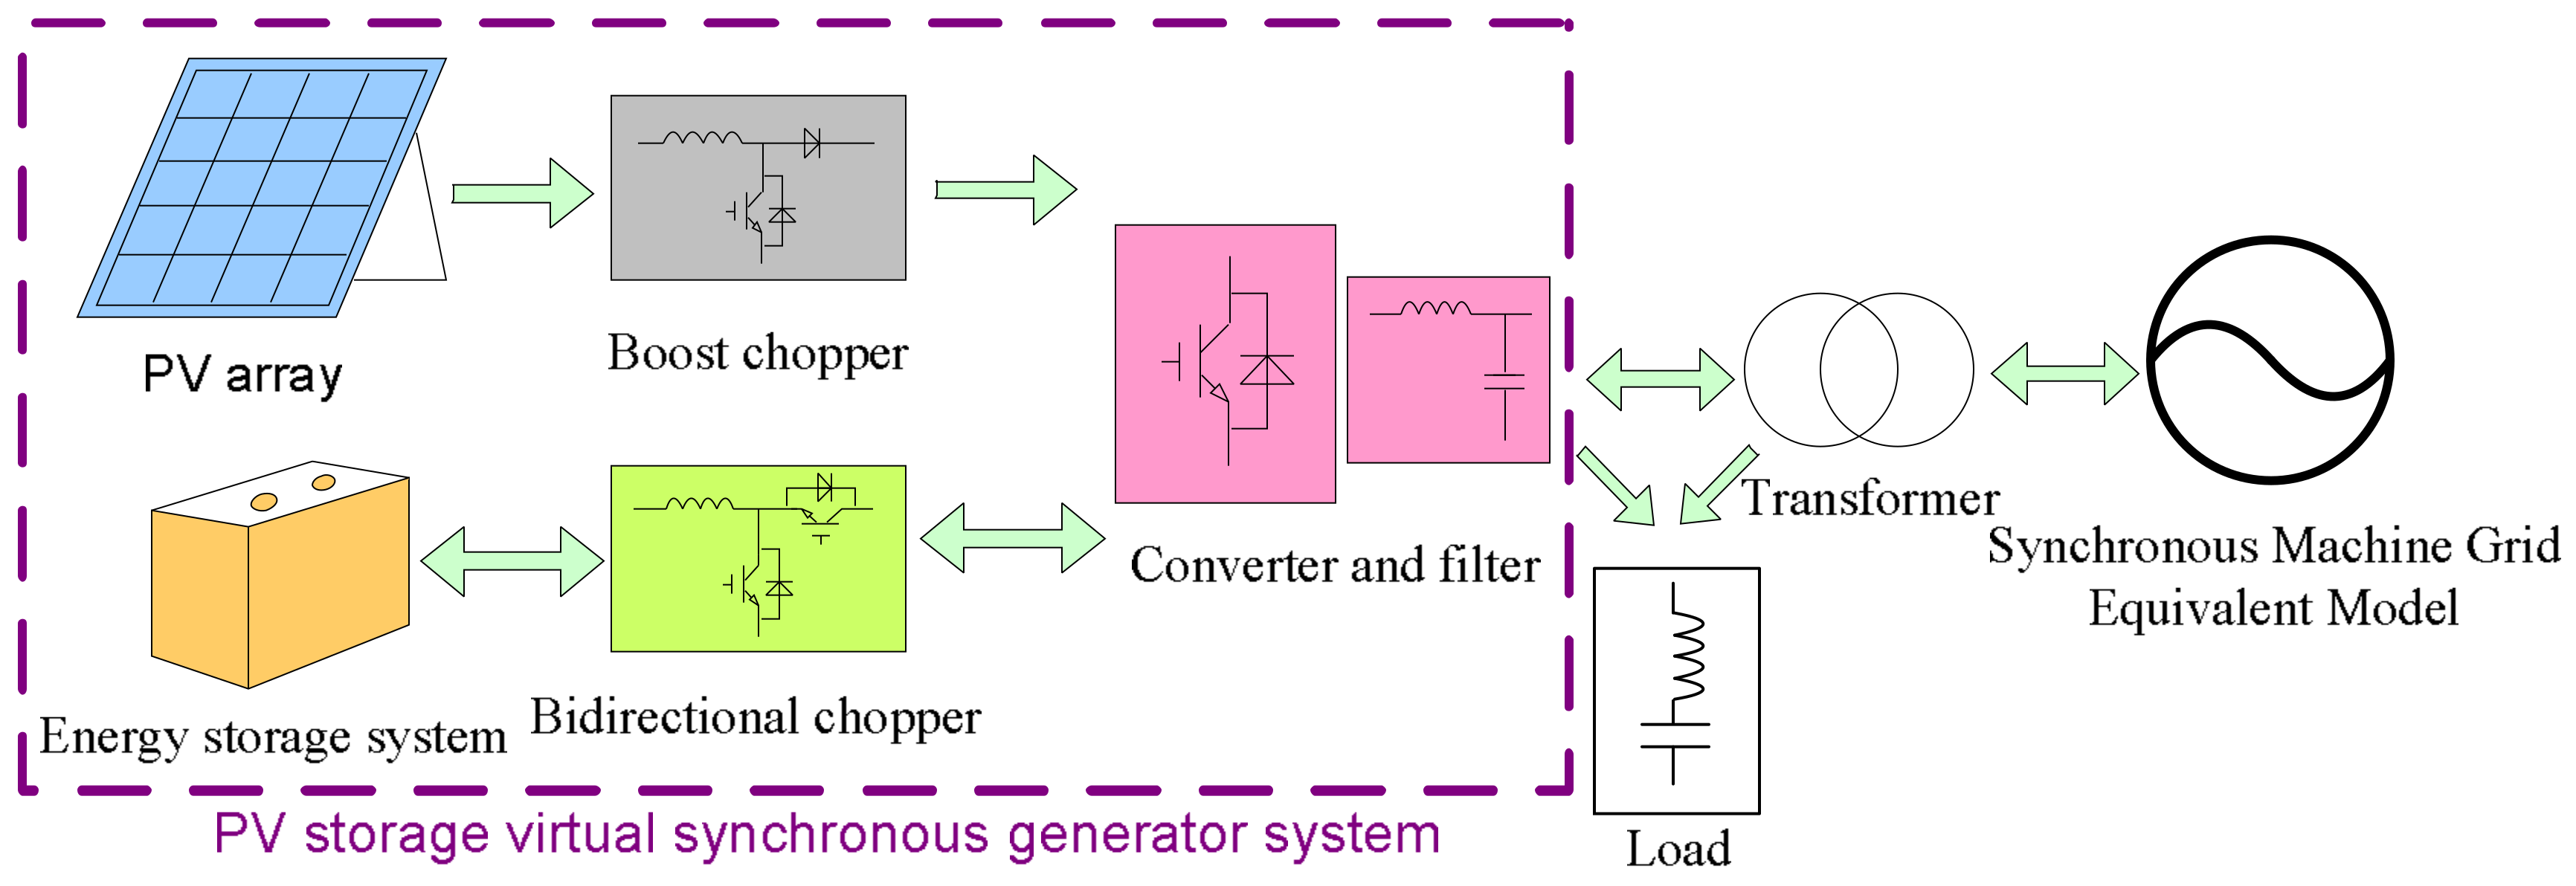
3.2. Structure of System

The object of this paper is the PV-storage system. There are two common topologies including the common DC (direct current) bus type and the common AC bus type. In the PV storage system with common AC bus, the distributed photovoltaic power supply and the energy storage unit are connected to the alternating current bus through the bidirectional converter respectively. The alternating current bus is connected to the power grid through the point of common coupling (PCC). In this scheme, the capacity of each power conversion device is relatively small, which is beneficial for improving the reliability while the control is more difficult. In a common DC bus-type PV storage system, renewable distributed and energy storage systems are connected in parallel to the DC bus via power electronics and then connected to the grid through a bidirectional converter. The PV storage system set up by this scheme facilitates system expansion and reduces the number of converters used, which saves costs. In particular, once a fault occurs in the system, the distributed units and energy storage units can be individually removed without affecting the overall operation of the power system. This paper adopted the common DC bus topology of PV storage system.
In this paper, the PV storage system was constructed as shown in Figure 9. The system consists of a PV array, an energy storage system, a boost chopper, a bidirectional chopper, a converter, and its filter. Among them, the boost chopper is used for achieving voltage boost of the PV array while achieving maximum power point tracking (MPPT) in order to ensure the maximum use of photovoltaic energy. Since photovoltaic power generation is affected by external factors such as light intensity and temperature randomly, when the power generated by the converter is unbalanced with the required power, the energy storage system ought to achieve a power balance through the two-way DC-DC circuit so as to ensure the stability and reliability of PV storage system’s output power. In addition, the DC-AC converter can achieve energy bidirectional flow when heavy load as a inverter and a light load as a rectifier. The bidirectional DC-DC chopper and the DC-AC converter are key devices for the entire PV storage system and were modeled separately below.

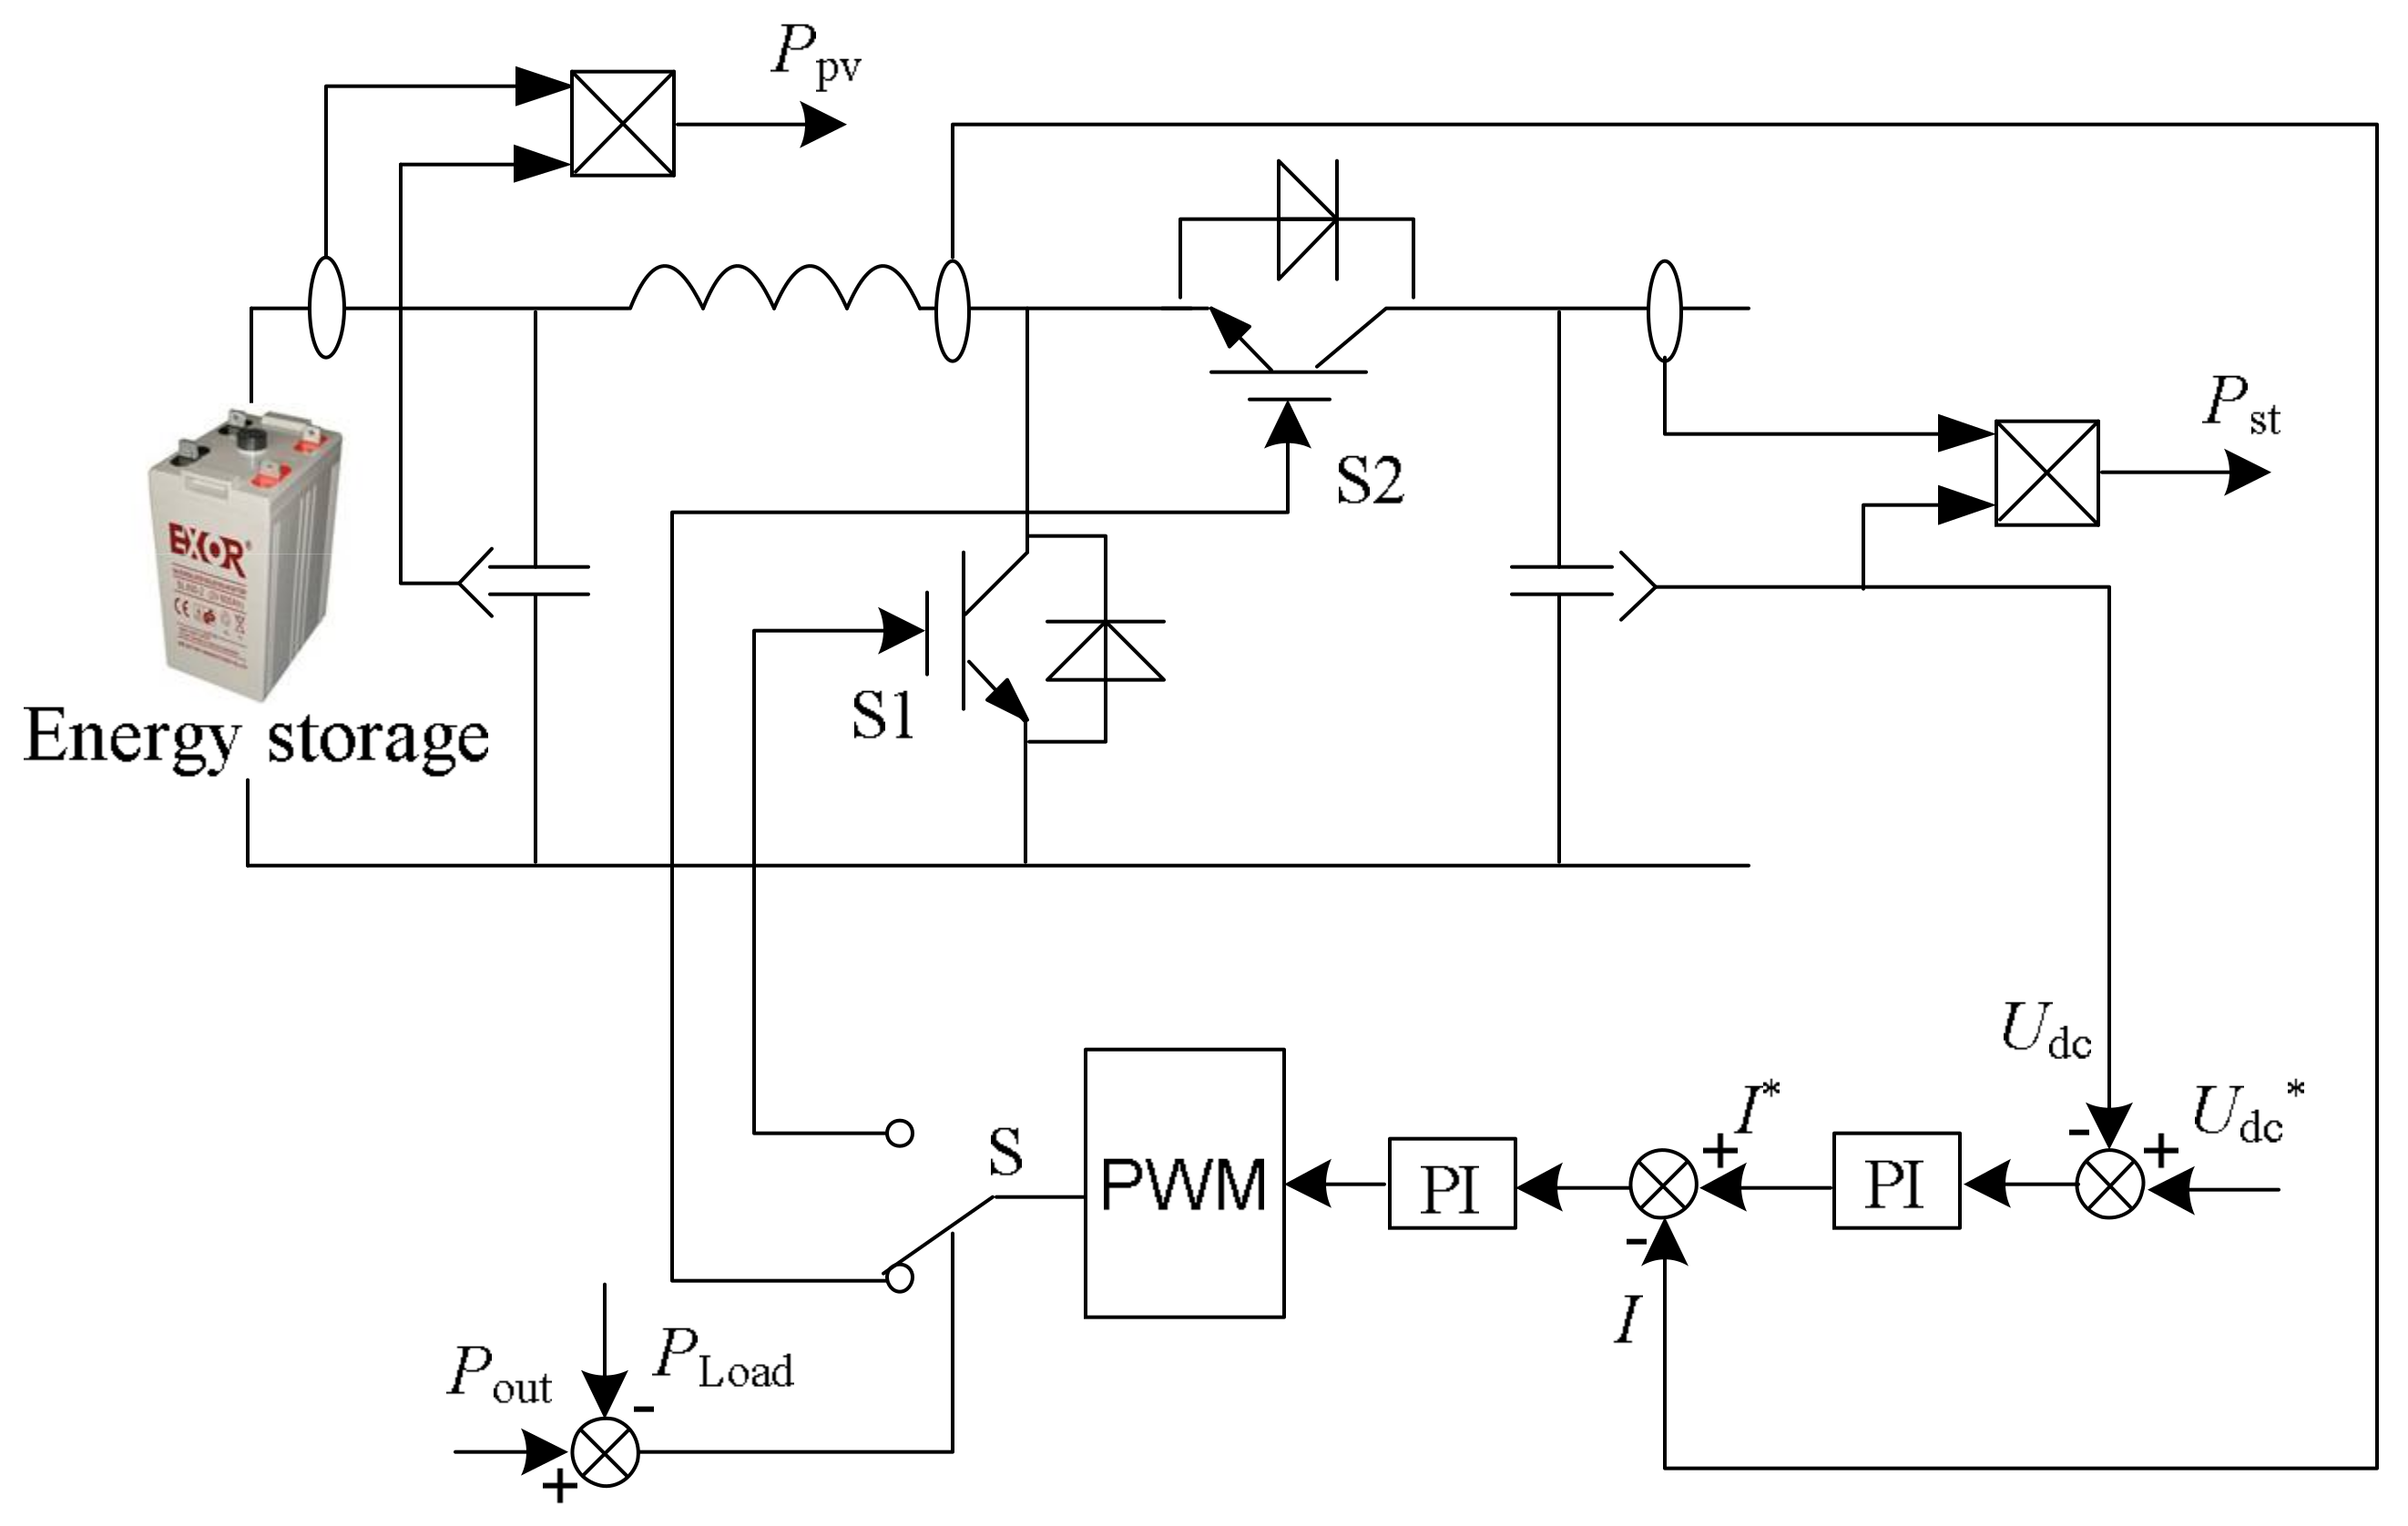
3.3. Bidirectional DC-DC (Chopper)

The structure of the bidirectional DC-DC circuit can be divided into a non-isolated bidirectional DC-DC circuit and an isolated bidirectional DC-DC circuit. In this paper, the widely used non-isolated bidirectional DC-DC circuit topology was selected. Non-isolated bidirectional DC-DC circuits include bidirectional Buck/Boost circuits, bidirectional half-bridge circuits, bidirectional cuk circuits, and bidirectional sepk circuits. Among them, the bidirectional half-bridge topology is simple, low cost, and high efficiency. Therefore, this paper chose the bidirectional half-bridge circuit as the topology of bidirectional DC-DC. The structure and control of bidirectional DC-DC half-bridge topology were presented in Figure 10.
Figure 10. Structure and control of bidirectional DC-DC.
Applsci 08 00532 g010
where, P PV is the power delivered by the PV array via MPPT, P out is the power output from the PV storage system, and P st is the power emitted by the energy storage system, and U dc is the DC bus voltage, which tracks the DC bus voltage reference U dc through the DC voltage outer loop. P PV , P out and P st satisfy the relationship shown in Equation (20) without considering energy loss.
P out = P PV + P st
When the system is stable, there was a power balance between power supply and demand, which is shown in Equation (21).
P out = P Load
where P Load is the load demand power. A self-stable bidirectional DC-DC control scheme was designed to help to achieve a new power balance of the PV storage system through the control of energy storage when changes of the PV power output and load lead to an imbalance between power supply and demand (see Figure 11).
When the power provided by the PV storage is less than the load required power, the switch signal S enables S1 and disables S2. Bidirectional DC-DC operates in boost mode, which increases the power P st emitted by the energy storage system. When the power provided by the PV storage is more than the load required power, the switch signal S enables S1 and disables S2. Bidirectional DC-DC operates in buck mode, which decreases P st . Finally, a new power balance of P out = P PV + P st is achieved. The above process is continuously circulated in the system and the power is adjusted in real time so that the PV storage system can play a role of peak shaving and valley filling under the premise of stable operation to meet the load requirements.

3.4. Bidirectional PV Storage Converter
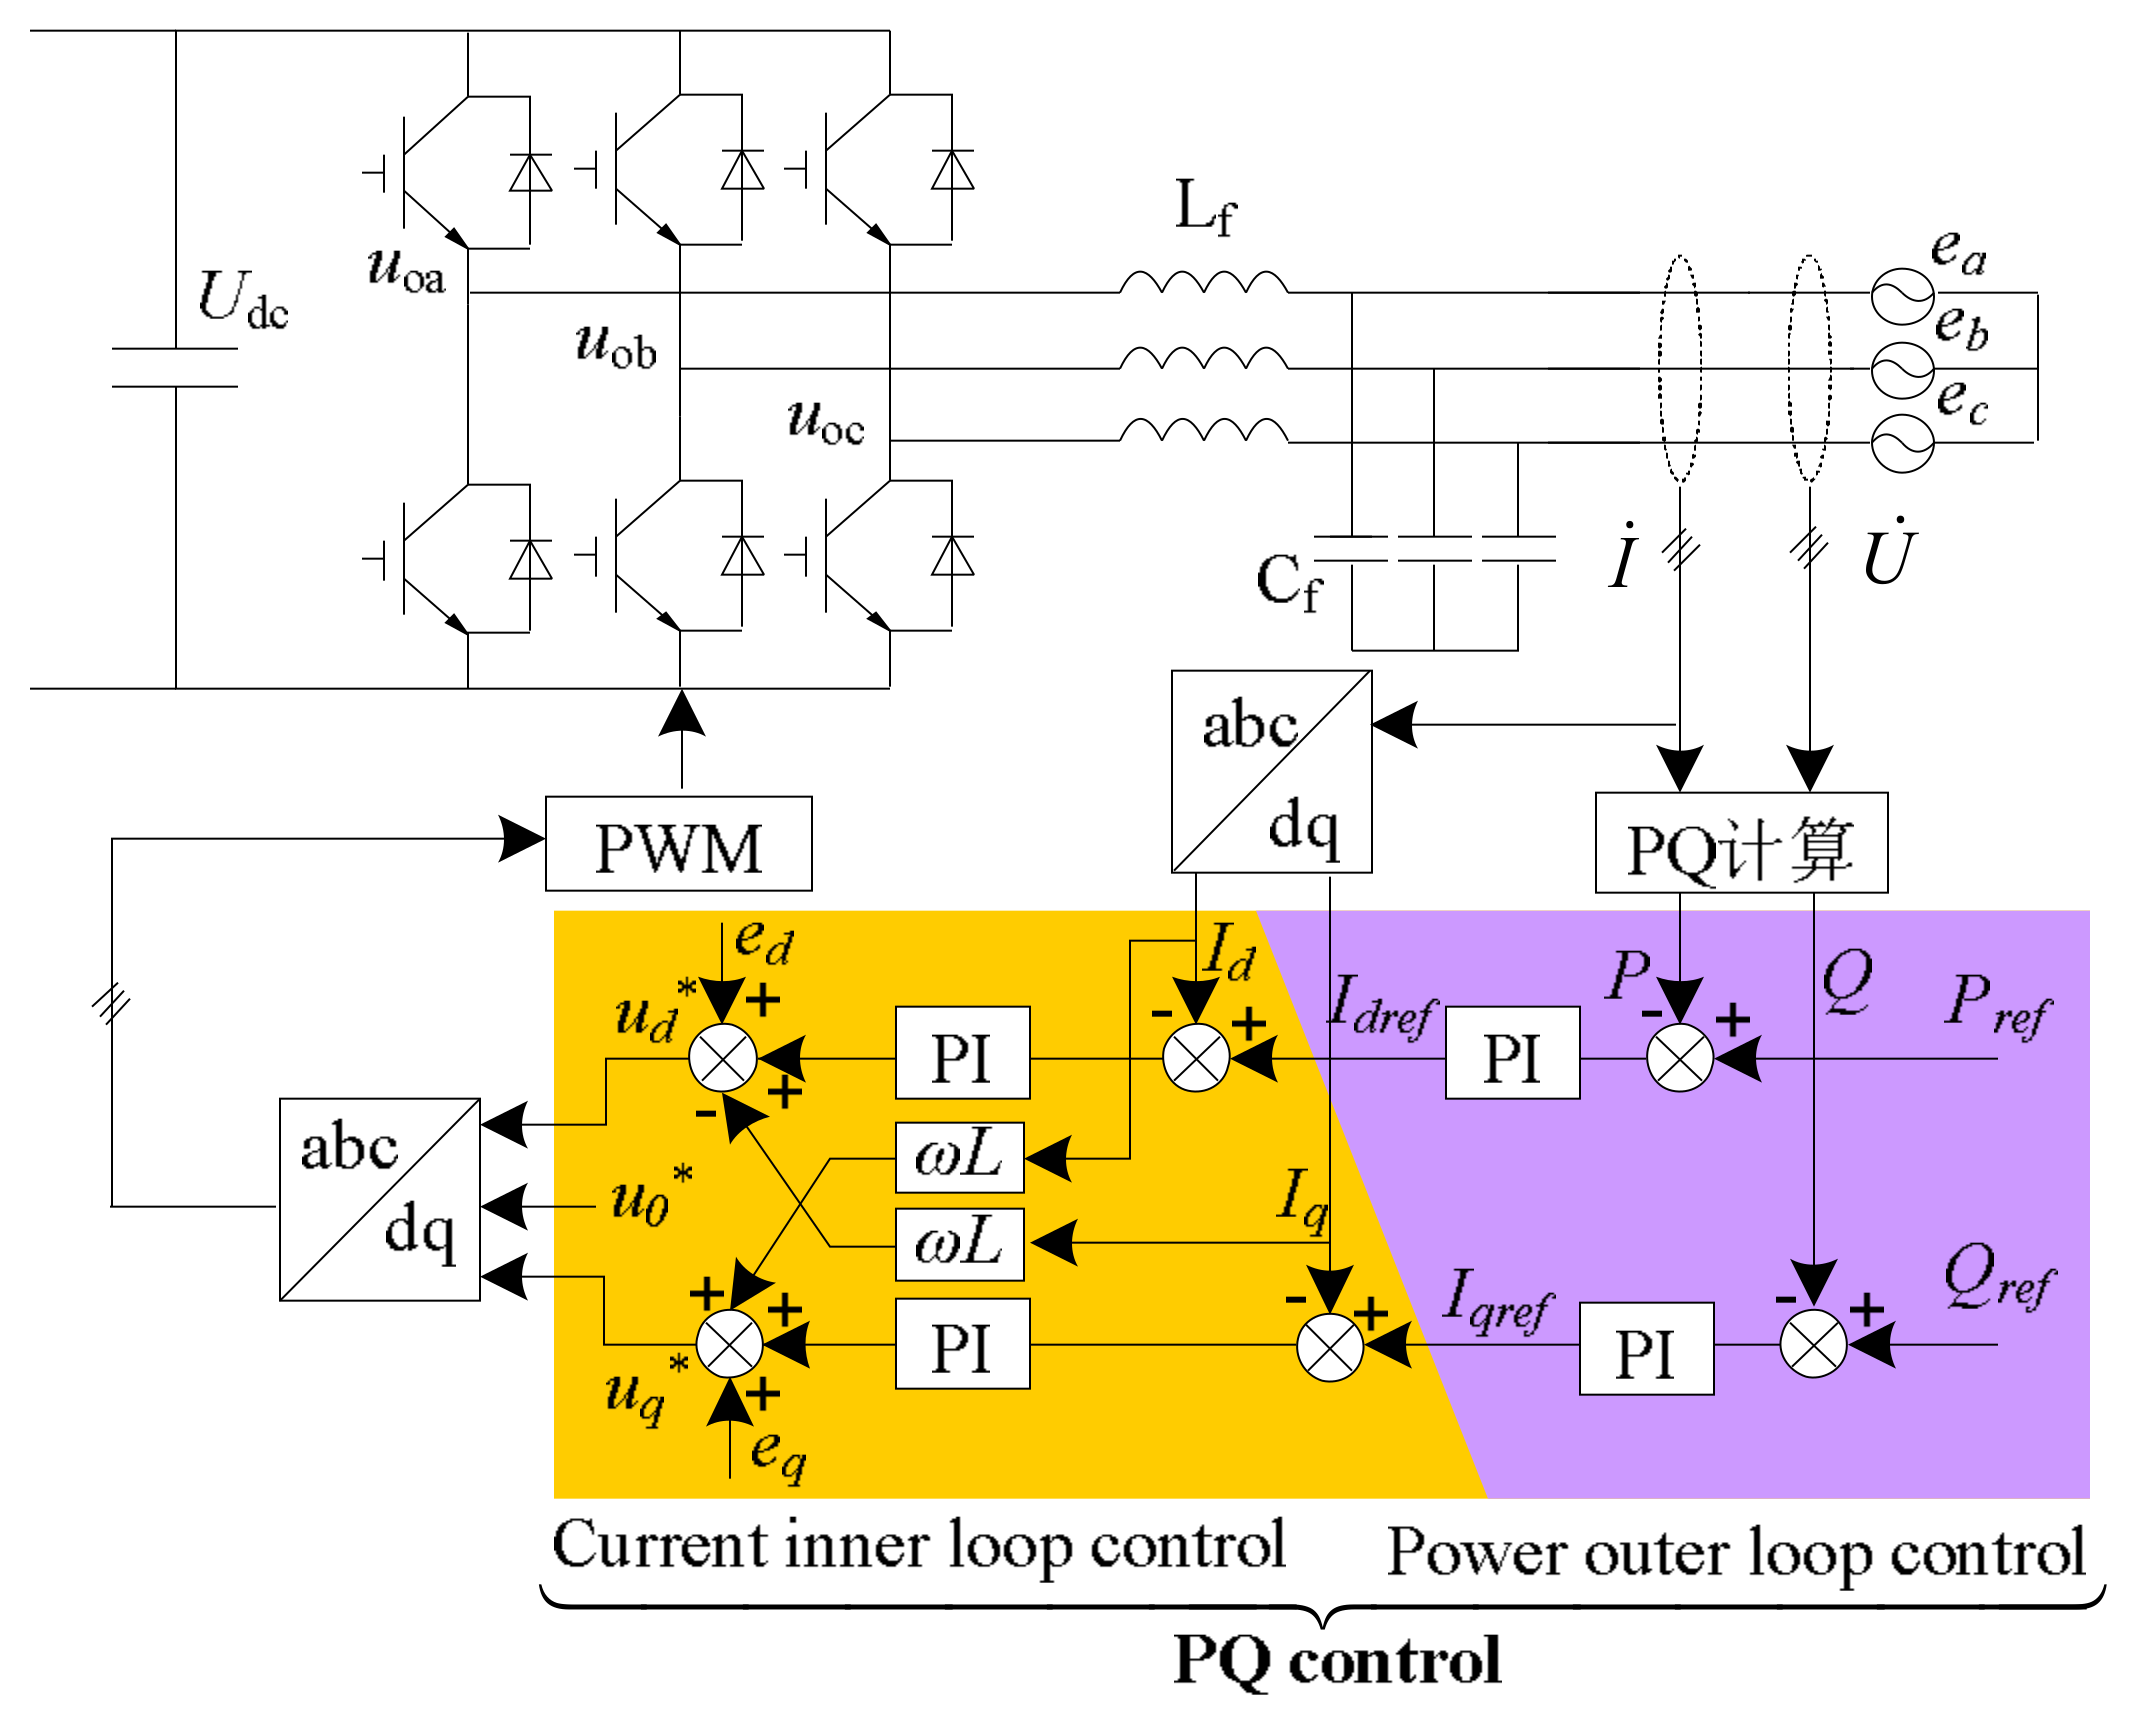
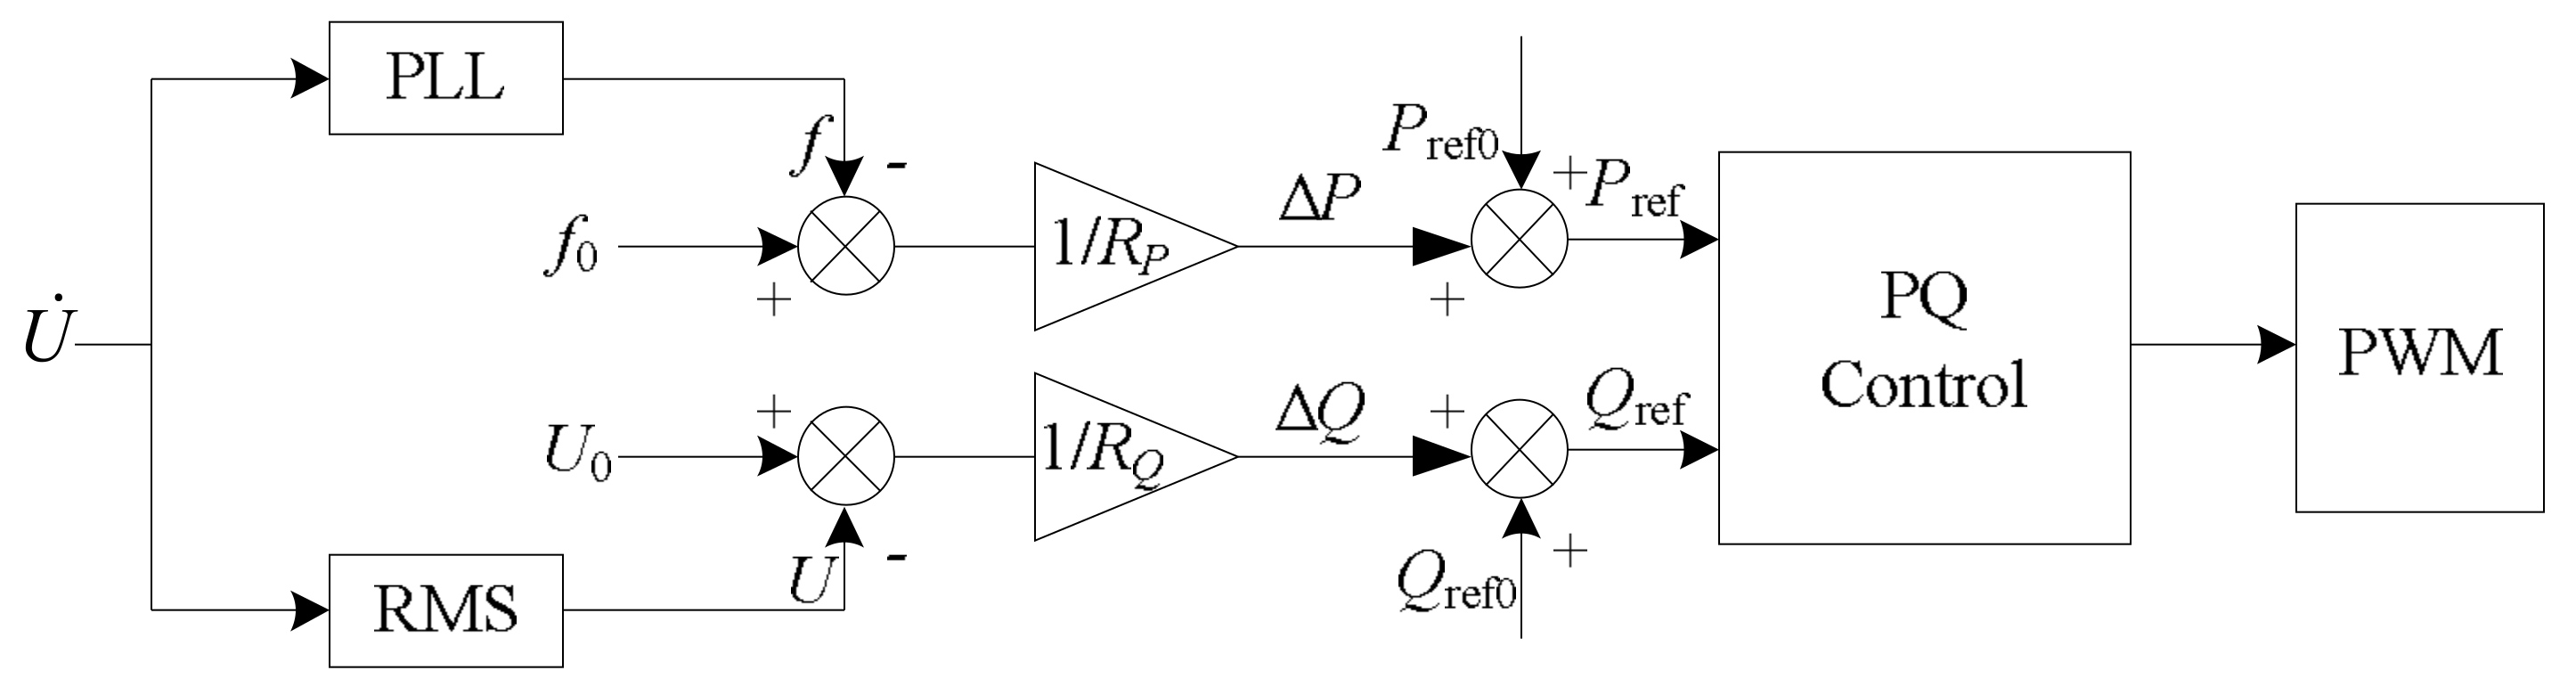
3.4.1. PQ Control

PV storage systems are often connected to the micro-grid with a master-slave control mechanism, which generates power or stores power according to the maximum power point tracking or power grid dispatching. The traditional PV storage system operates as a PQ source whose control strategy was shown in Figure 12 [21].
However, the drawbacks of the above control methods gradually appear in the background that the penetration rate of grid connected renewable energy is increasing day by day. First, the above control method can’t provide inertia and damping for the system and has poor compatibility with the synchronous generator. In addition, it can only output power according to upper power command value without the ability to regulate the frequency. Therefore, the traditional control method has hardly been unable to meet the new requirements of grid companies for new energy grid connected generator units, which poses potential challenges to the safe and stable operation of power system.

3.4.2. Improved PQ Control
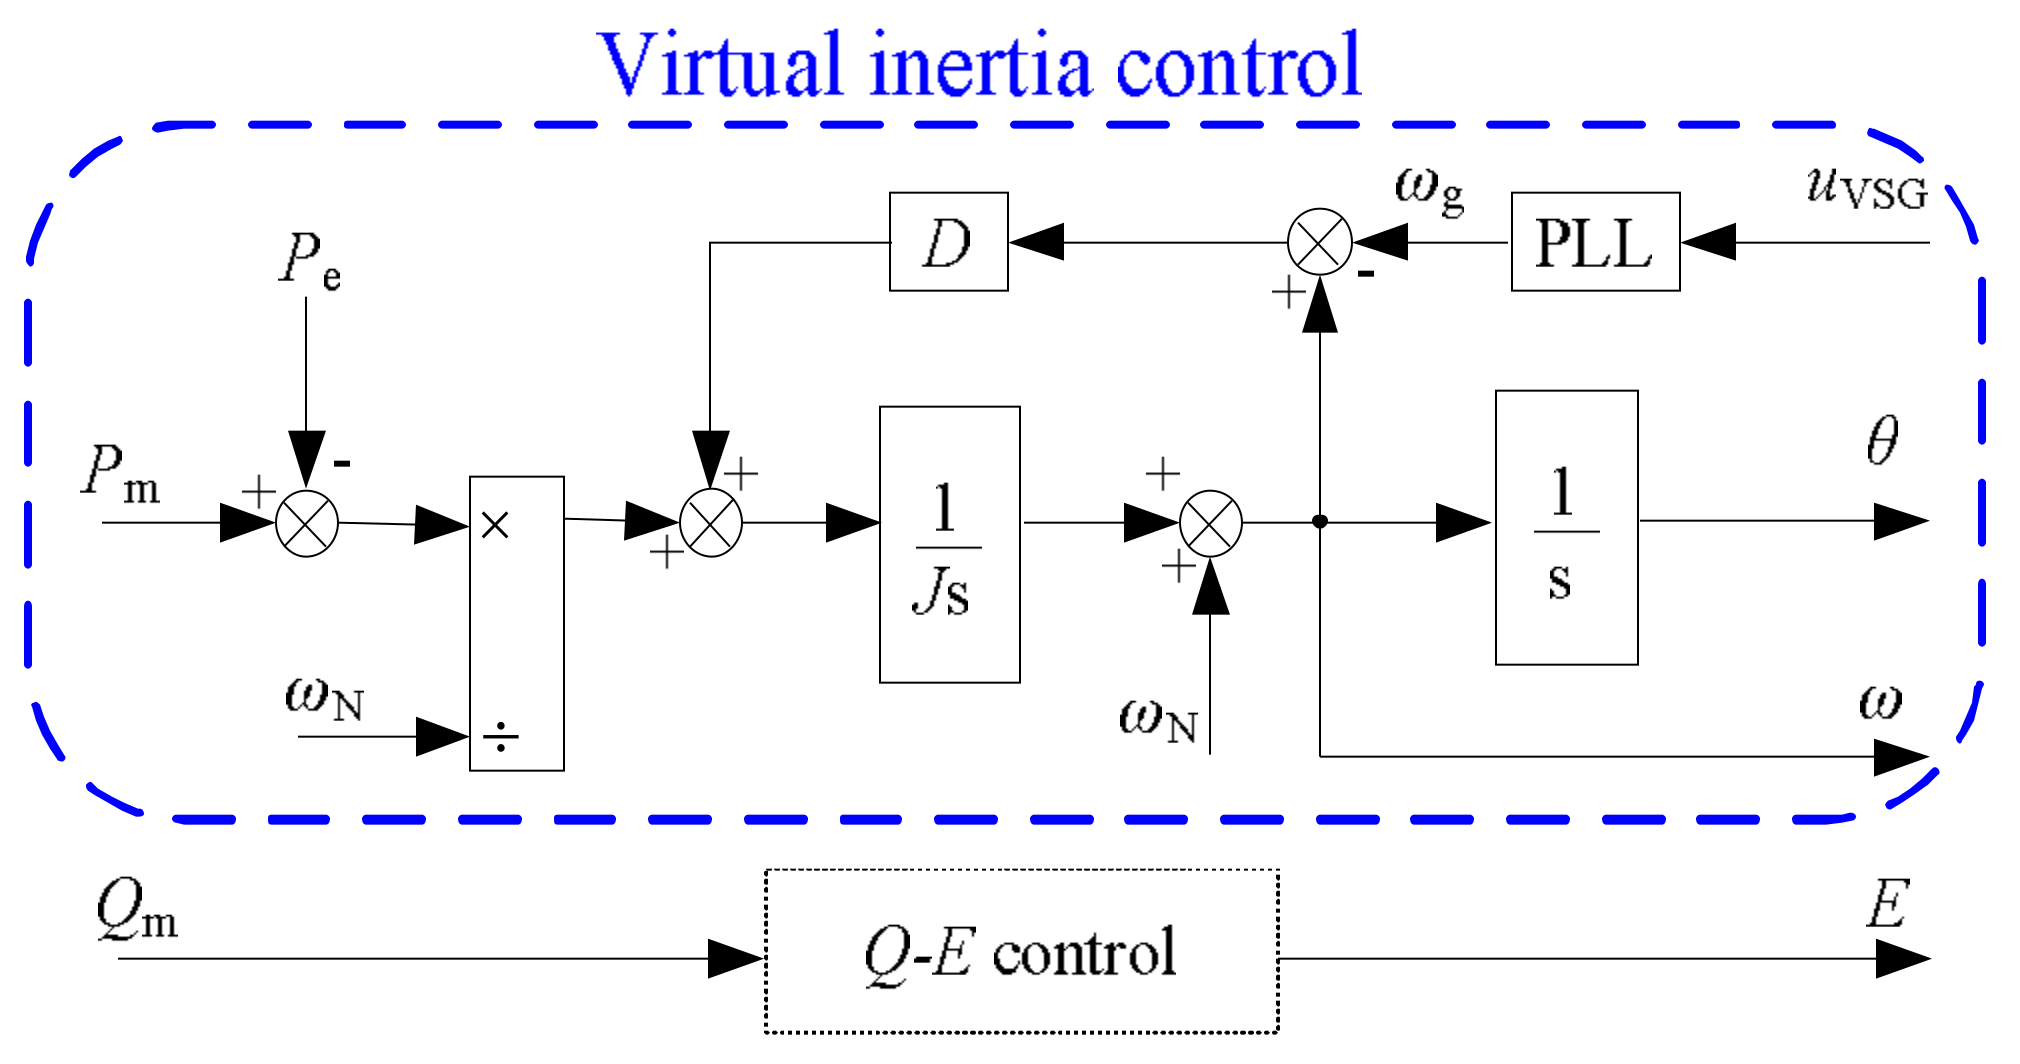
In this subsection, an improved PQ control strategy with active regulation characteristics is proposed. The control block diagram is shown in Figure 13.
Figure 13. Improved PQ control strategy.
Applsci 08 00532 g013
where, f0, U0 are the reference frequency and voltage, respectively. f and U are the frequency and voltage at steady state operation, respectively. R P , R Q are the inverter active and reactive droop coefficient, respectively. Actually, they are the magnitude of the slope of the power-frequency characteristic and voltage-droop characteristic of power supply. The power reference of the control strategy consists of the initial reference value and the correction. The expressions are shown in Equations (22)–(25).
P ref = P ref 0 + Δ P
Q ref = Q ref 0 + Δ Q
Δ P = 1 R P ( f 0 f )
Δ Q = 1 R Q ( U 0 U )
In the steady state, the inverter outputs active power and reactive power, according to the power reference values. The frequency and voltage satisfy f = f0, U = U0 so the correction amount ΔP and Δ Q is zero, which results in P ref = P ref 0 , Q ref = Q ref 0 and means the inverter can output constant power as a PQ source. In transient process, the inverter can take the initiative to participate in frequency regulation process. When the load is increased, the frequency of the power grid is reduced, f < f0, ΔP is positive, and Pref increases. The inverter increases the power according to the increased new reference value to supply the load for the purpose of reducing the decline process of frequency. On the contrary, when the load drops, the grid frequency rise, f > f0, Δ P is negative, and Pref decreases. The inverter reduces the power output, according to the reduced power reference value to slow down the rise of frequency. In this way, when the frequency is fluctuating, the PV storage system can participate in the frequency regulation process, which is consistent with the requirements of the autonomous power system [14].

3.4.3. VSG

The virtual synchronous generator (VSG) control adds the rotor motion equation of the synchronous generator to the control of the inverter so that the new energy inverter has a similar inertia characteristic of the synchronous machine. The VSG control block diagram was shown in Figure 14.
Figure 14. Control block diagram of VSG.
Applsci 08 00532 g014
where, Pm is the input active power of VSG, which simulates the mechanical power in synchronous generator, Pe is the active power output by the VSG, ωN is the rated angular frequency (ωN = 2πfN), uVSG is the grid voltage, ωg is the angular frequency of uVSG, ω is the virtual angular frequency, and θ is the reference value of voltage phase angle. VSG rotor equation of motion can be expressed by the equation below.
J d ω d t = P m P e ω N D Δ ω
where Δ ω is the difference between ω and ωg, J is the virtual inertia, and D is the damping coefficient [22].
In general, for a given synchronous generator, its moment of inertia and damping factor are almost constant. However, for the VSG, the moment of inertia and damping factor are only the control parameters, which can be adjusted in real time according to the needs and makes the VSG have effective dynamic characteristics.

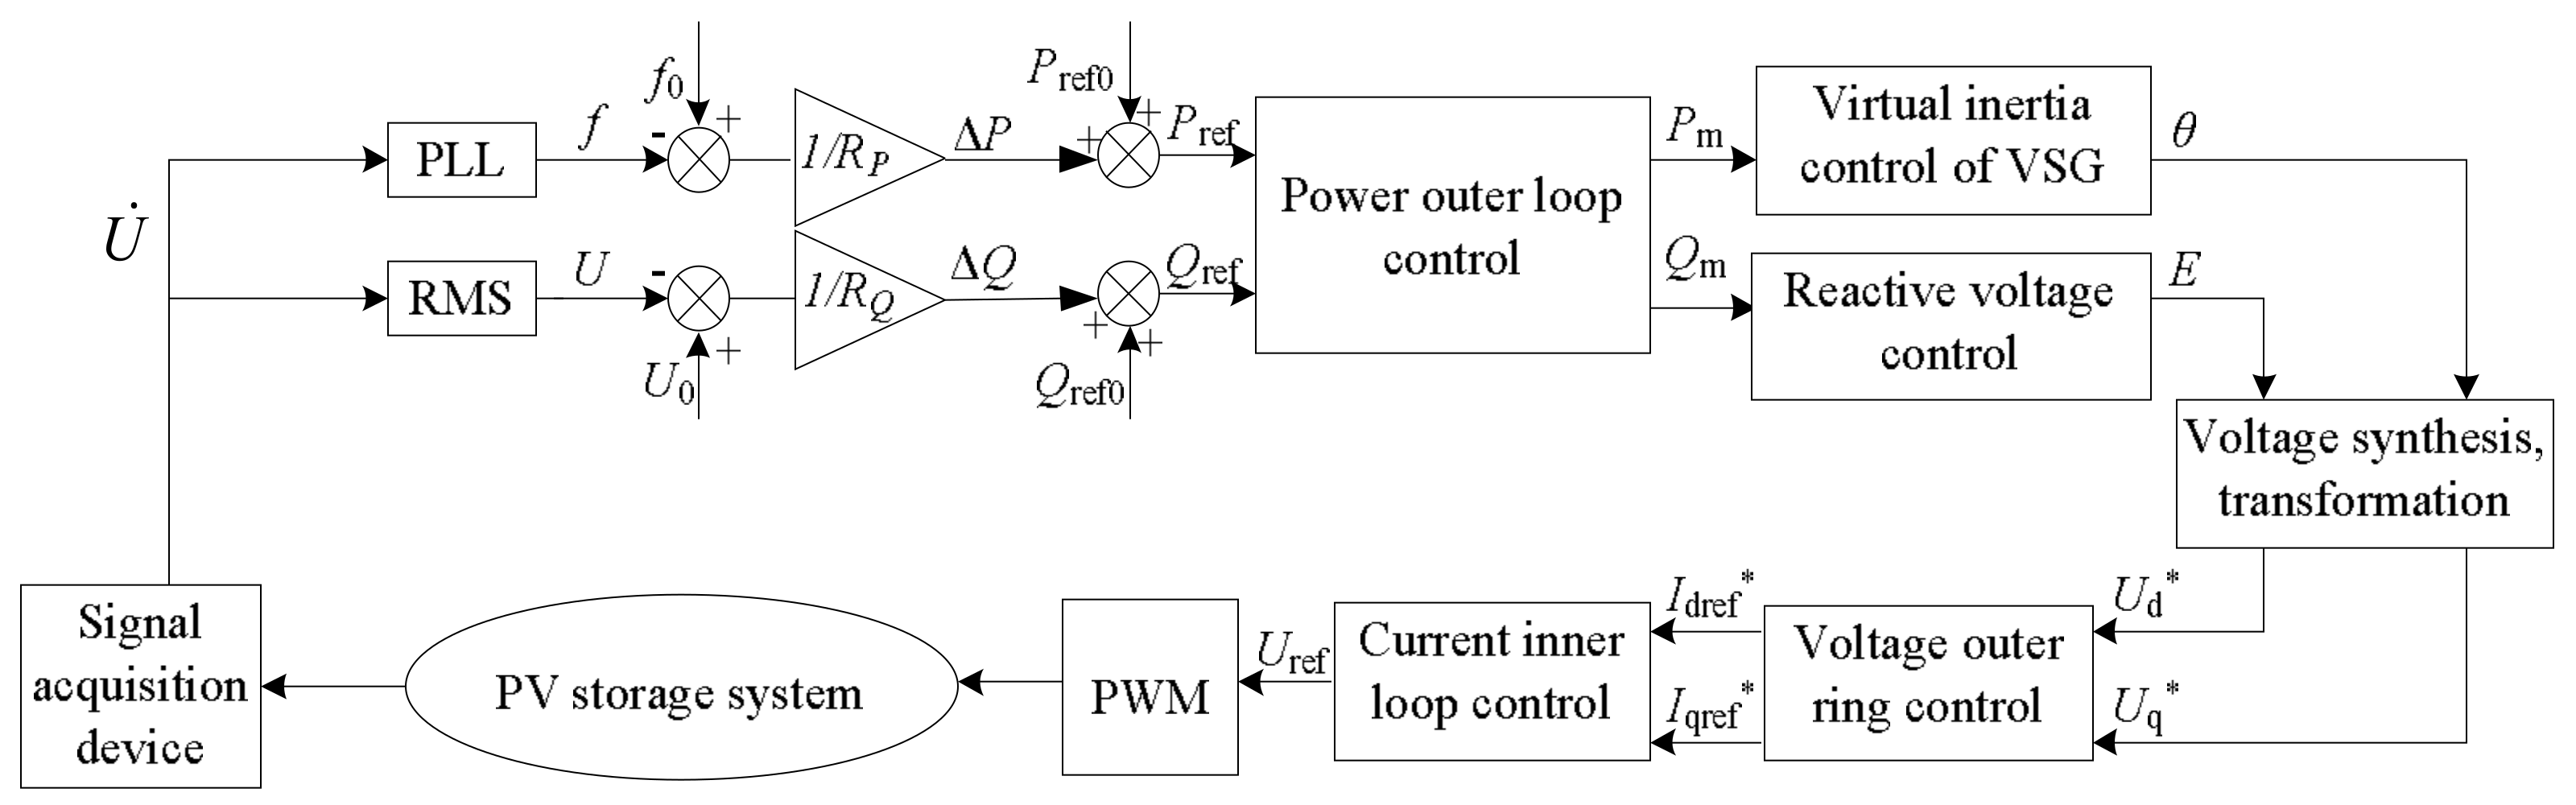
3.4.4. Complete Control Scheme

Improved PQ control strategy enables the inverter with active frequency regulation capability. However, inverters lack the moment of inertia, which are less friendly to the power system. In order to make the output of the PV storage system reflect the nature of the synchronous generator under the premise of frequency regulation capability, a new control of PV storage converter was constructed by combining the virtual synchronous generator technology with the improved PQ control described above (see Figure 15).
When the power grid is stable, the PV system acts as a constant power source according to the command value. When the frequency fluctuates, it actively participates in the frequency regulation of the power grid to maintain system stability with a similar inertia characteristic of the synchronous machine for which the friendship of the PV storage system to the grid is greatly improved.
The grid frequency f and voltage U can be obtained by using the phase-locked loop and calculating. Then the two can generate the power correction amount Δ P , Δ Q by the droop part. Δ P , Δ Q are added to the original power reference value (dispatching value) to get the final power reference value P ref , Q ref . Afterwards, they enter the power outer loop control shown in Figure 12 and the outputs of the power outer loop control are taken as the input power of VSG P m , Q m . After the VSG control shown in Figure 14, the reference voltage vector amplitude E and phase angle θ are produced. Then the reference value of d, q axis voltage U d , U q can be obtained by voltage synthesis and coordinate transformation. Then control signals enter the voltage and current double closed loop controlling method. The result of the voltage outer loop are identified as given values for the current inner loop I dref , I qref . The current inner loop is compensated by the feed forward and decoupled to obtain the voltage reference values U dref , U qref . After the coordinate transformation and PWM modulation, the inverter switching signal is generated and the system completes the closed loop.

4. Problems in the Process of Microgrid Formation

4.1. Synchronous Machine Grid Equivalent Model

When the equivalent impedance of the circuit components outside the power system is much larger than the internal resistance of the power supply, the voltage of the power supply bus is hardly affected regardless of the change of the load. In past related studies on the PV storage system connected into the power grid, the ideal grid model was widely used to simulate the characteristics of the power grid. In this case, the grid was considered a power supply with constant frequency, constant voltage, and unlimited capacity, which facilitated the analysis. However, the real infinite power supply does not exist. Although its capacity is large and its ability to withstand the power fluctuations is strong, the frequency and voltage of the actual micro-grid would change when the distributed power supply fluctuates or the load switches. To simulate the characteristics of the actual grid more accurately, the Synchronous Machine Grid Equivalent Model is designed and shown in Figure 16.
The Synchronous Machine Grid Equivalent Model simulates a grid with a limited capacity which composes an equivalent generator section and an equivalent motor section in parallel. Its grid interface can achieve the two-way energy flow through which power can be sent to the outside from the model or absorbed by the model. The measuring devices collect the voltage U ˙ abc and the current I ˙ abc on each parallel branch. After that, the instantaneous reactive power Q is calculated and the voltage is phase locked to obtain the grid frequency f . Then the two are sent to the governor and excitation regulator to simulate the grid frequency and voltage regulation processes. The governor outputs the mechanical power known as the reference of electrical machinery. The excitation regulator outputs the reference value of excitation voltage. Then the excitation system tracks V fref , which generates excitation voltage V f to be the input to the electrical machinery.
In this model, the equivalent generator section is the equivalent simulation of all the power supplies in the actual grid whose capacity is equal to the sum of the capacities of all the power supplies. The equivalent motor section is the equivalent simulation of all the electricity loads in the actual grid whose capacity is equal to the sum of the capacities of all the loads. The rated capacity of the equivalent generator is positive and the corresponding reference values P 01 , Q 01 are also positive. The rated capacity of the equivalent motor is negative and P 02 , Q 02 are also negative, correspondingly. The model mimics speed regulation and the excitation regulation process of the real power grid with frequency and voltage regulation characteristics. Compared with the widely used ideal grid model with infinite capacity, it can reflect the nature and characteristics of the real power grid accurately.

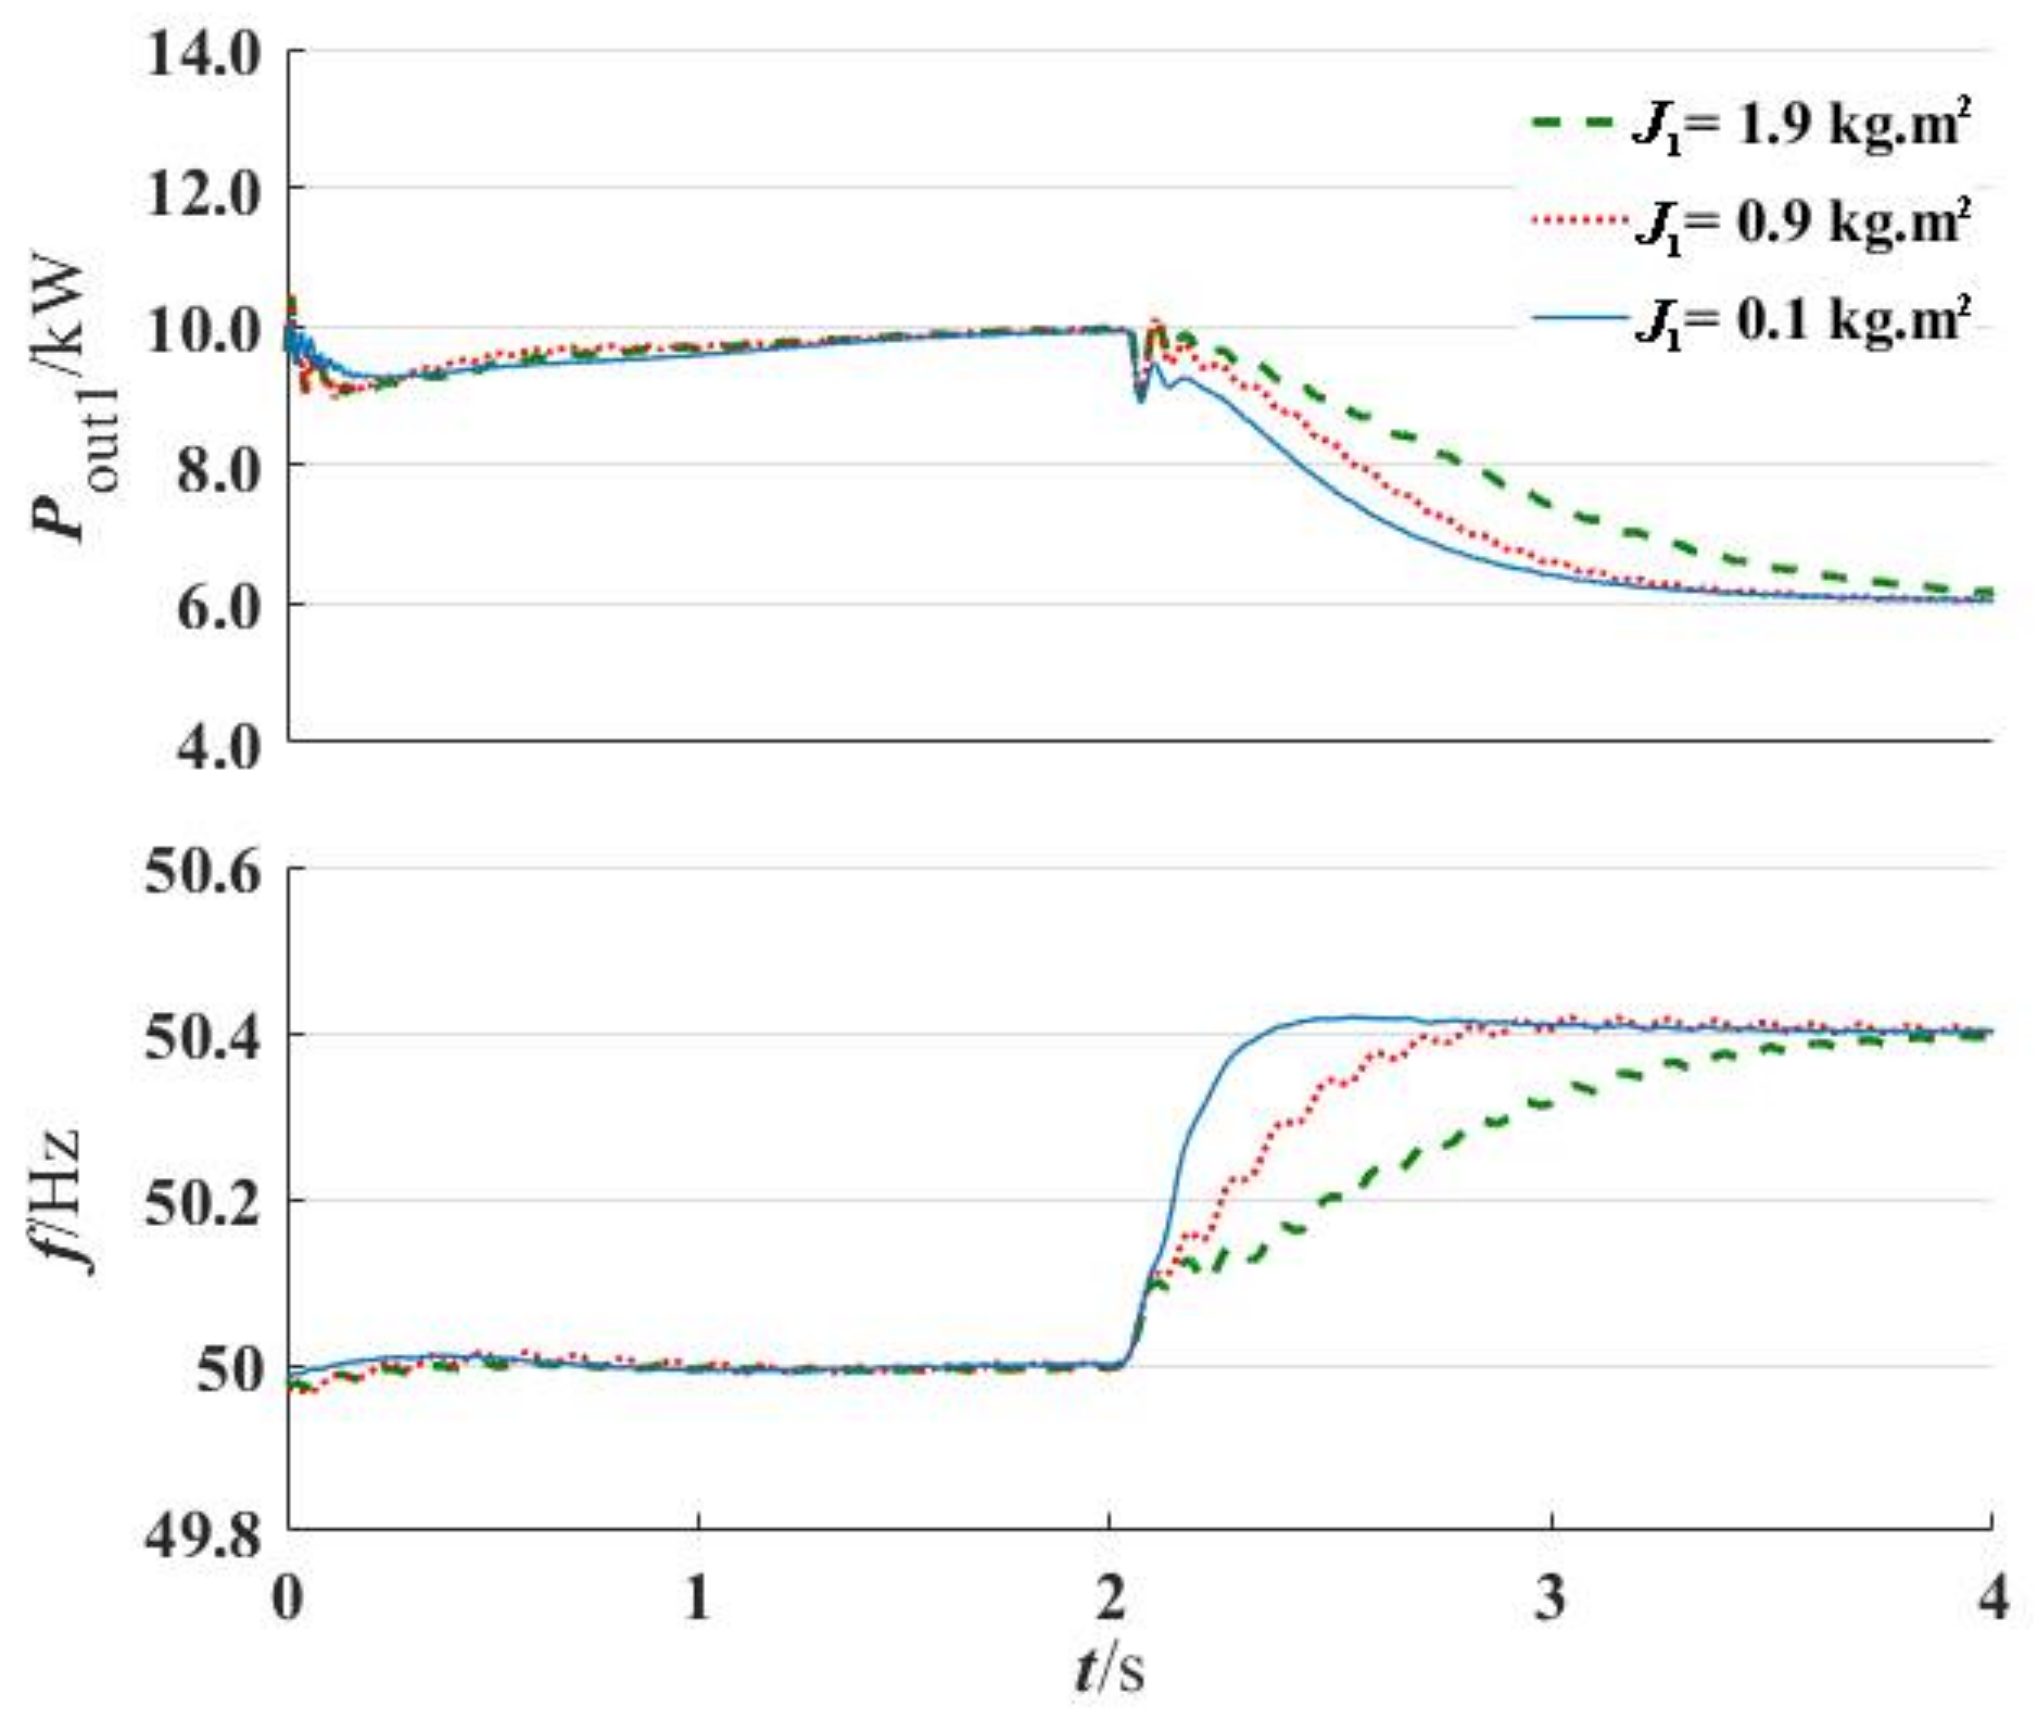
4.2. Matching Method of Inertia

In the multi-energy complementary microgrid, distributed power supplies without inertia and synchronous generators with inertia provide power to the microgrid at the same time. When the load suddenly changes, the distributed power supply without inertia will grab power. Therefore, distributed power overload, resulting in protective action, which causes the distributed power to fall off from the distributed power supply system. Furthermore, larger power shortage and larger system frequency fluctuations in the microgrid may occur, which poses a great challenge to the frequency regulation.
VSG technology has been introduced in order to solve the problem of no moment of inertia of distributed power supply. However, even if inertia is added to the inverter power control strategy, a variety of instability are caused by inertia matching problems in the parallel operation. There is a problem of inertia matching between the inertia of the distributed PV Storage virtual synchronous generator system and the inertia of the synchronous machine grid equivalent model. If there is a difference in the frequency or the power transition time of power generation unit, the synchronism and consistency of operation will be affected. At the same time, it will cause the fast responding power generation unit to rush out the power when the load suddenly increases, which will lead to the sudden decline of the frequency. Therefore, the regulation of frequency would be improved by a reasonable inertia matching method.
The synchronous machine rotor equation of motion can be written as seen below.
2 H d ω d t = P m P e D ( ω ω g )
where H is virtual inertia time constant in second (s). For a given generator, H is usually normalized to the rated value of the generator. The relation between the virtual inertia time constant to moment of inertia is expressed as Equation (28) [23].
H = ω m 2 2 S B J
where ω m is the angular velocity of the shaft and S B is the three-phase rated capacity of the system. The frequency of the point of common coupling is the same as the frequency of the inverter ( ω g = ω ) since the grid in this paper is not an infinite grid with constant frequency. Therefore, the equation of rotor motion becomes the equation below.
2 H d ω d t = P m P e
Differential is the linear part of the difference and the difference of the independent variable is the differential. Therefore, we can get d ω = Δ ω , d t = Δ t , which leads to Equation (30).
Δ ω = P m P e 2 H Δ t
In addition, according to the relationship between angular velocity and frequency, the equation below is deduced.
Δω = 2πΔf
From Equations (30) and (31), we get the equation below.
Δ f = P m P e 4 π Δ t H
For the situation where multiple power sources involved in frequency regulation, the power i satisfies the following equations.
Δ f i = P m i P e i 4 π H i Δ t i
P e i = P e 0 i + Δ P e i
r u i = Δ f i ( % ) Δ P e i ( % )
where P e 0 i is the electromagnetic power of the system, i in the initial power balance, Δ P e i is the electromagnetic power increment in the frequency regulation process, and r u i is the per-unit regulation of the power source i . The following equation can be obtained from Equations (33)–(35).
Δ f i = P m i P e 0 i + Δ f i / r u i 4 π H i Δ t i
In steady state, we gather the equation below.
P m i P e 0 i = 0
Taking Equation (37) into Equation (36), Equation (38) can be obtained.
Δ t i = 4 π r u i H i
Equation (38) indicates that if we want to make the transition time Δt of each power equal, the virtual inertia time constant H should be inversely proportional to the per-unit regulation coefficient r u . The moment of inertia J is proportional to H and the slope R of the power-frequency characteristic curve (active droop coefficient) is proportional to r u . Therefore, if transition time Δt of several power supply is required to be equal, it is necessary for the respective J to be inversely proportional to R .

5. Verification

In this section, the correctness of the S-L analysis method and distributed PV storage virtual synchronous generator system are verified. First, a microgrid model including PV storage virtual synchronous generator system is established in MATLAB. Then compared with the traditional PV storage system, the performance of the PV storage virtual synchronous generator system is verified as well as the feasibility of proposed S-L analysis method.

5.1. Simulation Conditions and Parameters

The parameters are determined based on the small signal analysis [24,25] and the inertia matching method (in Section 4.2). The final system parameters are shown in Table 1.
Then the microgrid model shown in Figure 17 is established in MATLAB/Simulink according to Table 1.
The photovoltaic cell type is First Solar FS-380. MPPT is achieved by the perturbation and observation method [26]. The battery used in the energy storage unit is a Nickel-Metal Hydride battery. The bidirectional half-bridge topology in Section 3.3 is adopted for the topology of the bidirectional chopper. The converter is of IGBT/Diode type with the control scheme in Section 3.4. The microgrid is modeled by Synchronous Machine Grid Equivalent Model proposed in Section 4.1.
Generator mode conditions have an initial load of 60 kW and dispatching a value of 10 kW (PV storage virtual synchronous generator system output active power 10 kW in generator mode). Then the load suddenly drops to 40 kW at the 2nd second.
Motor mode conditions of an initial load is 60 kW, dispatching value −10 kW (PV storage virtual synchronous generator system absorbs active power 10 kW in motor mode). Then the load suddenly drops to 40 kW at the 2nd second similarly.

5.2. Verification Process

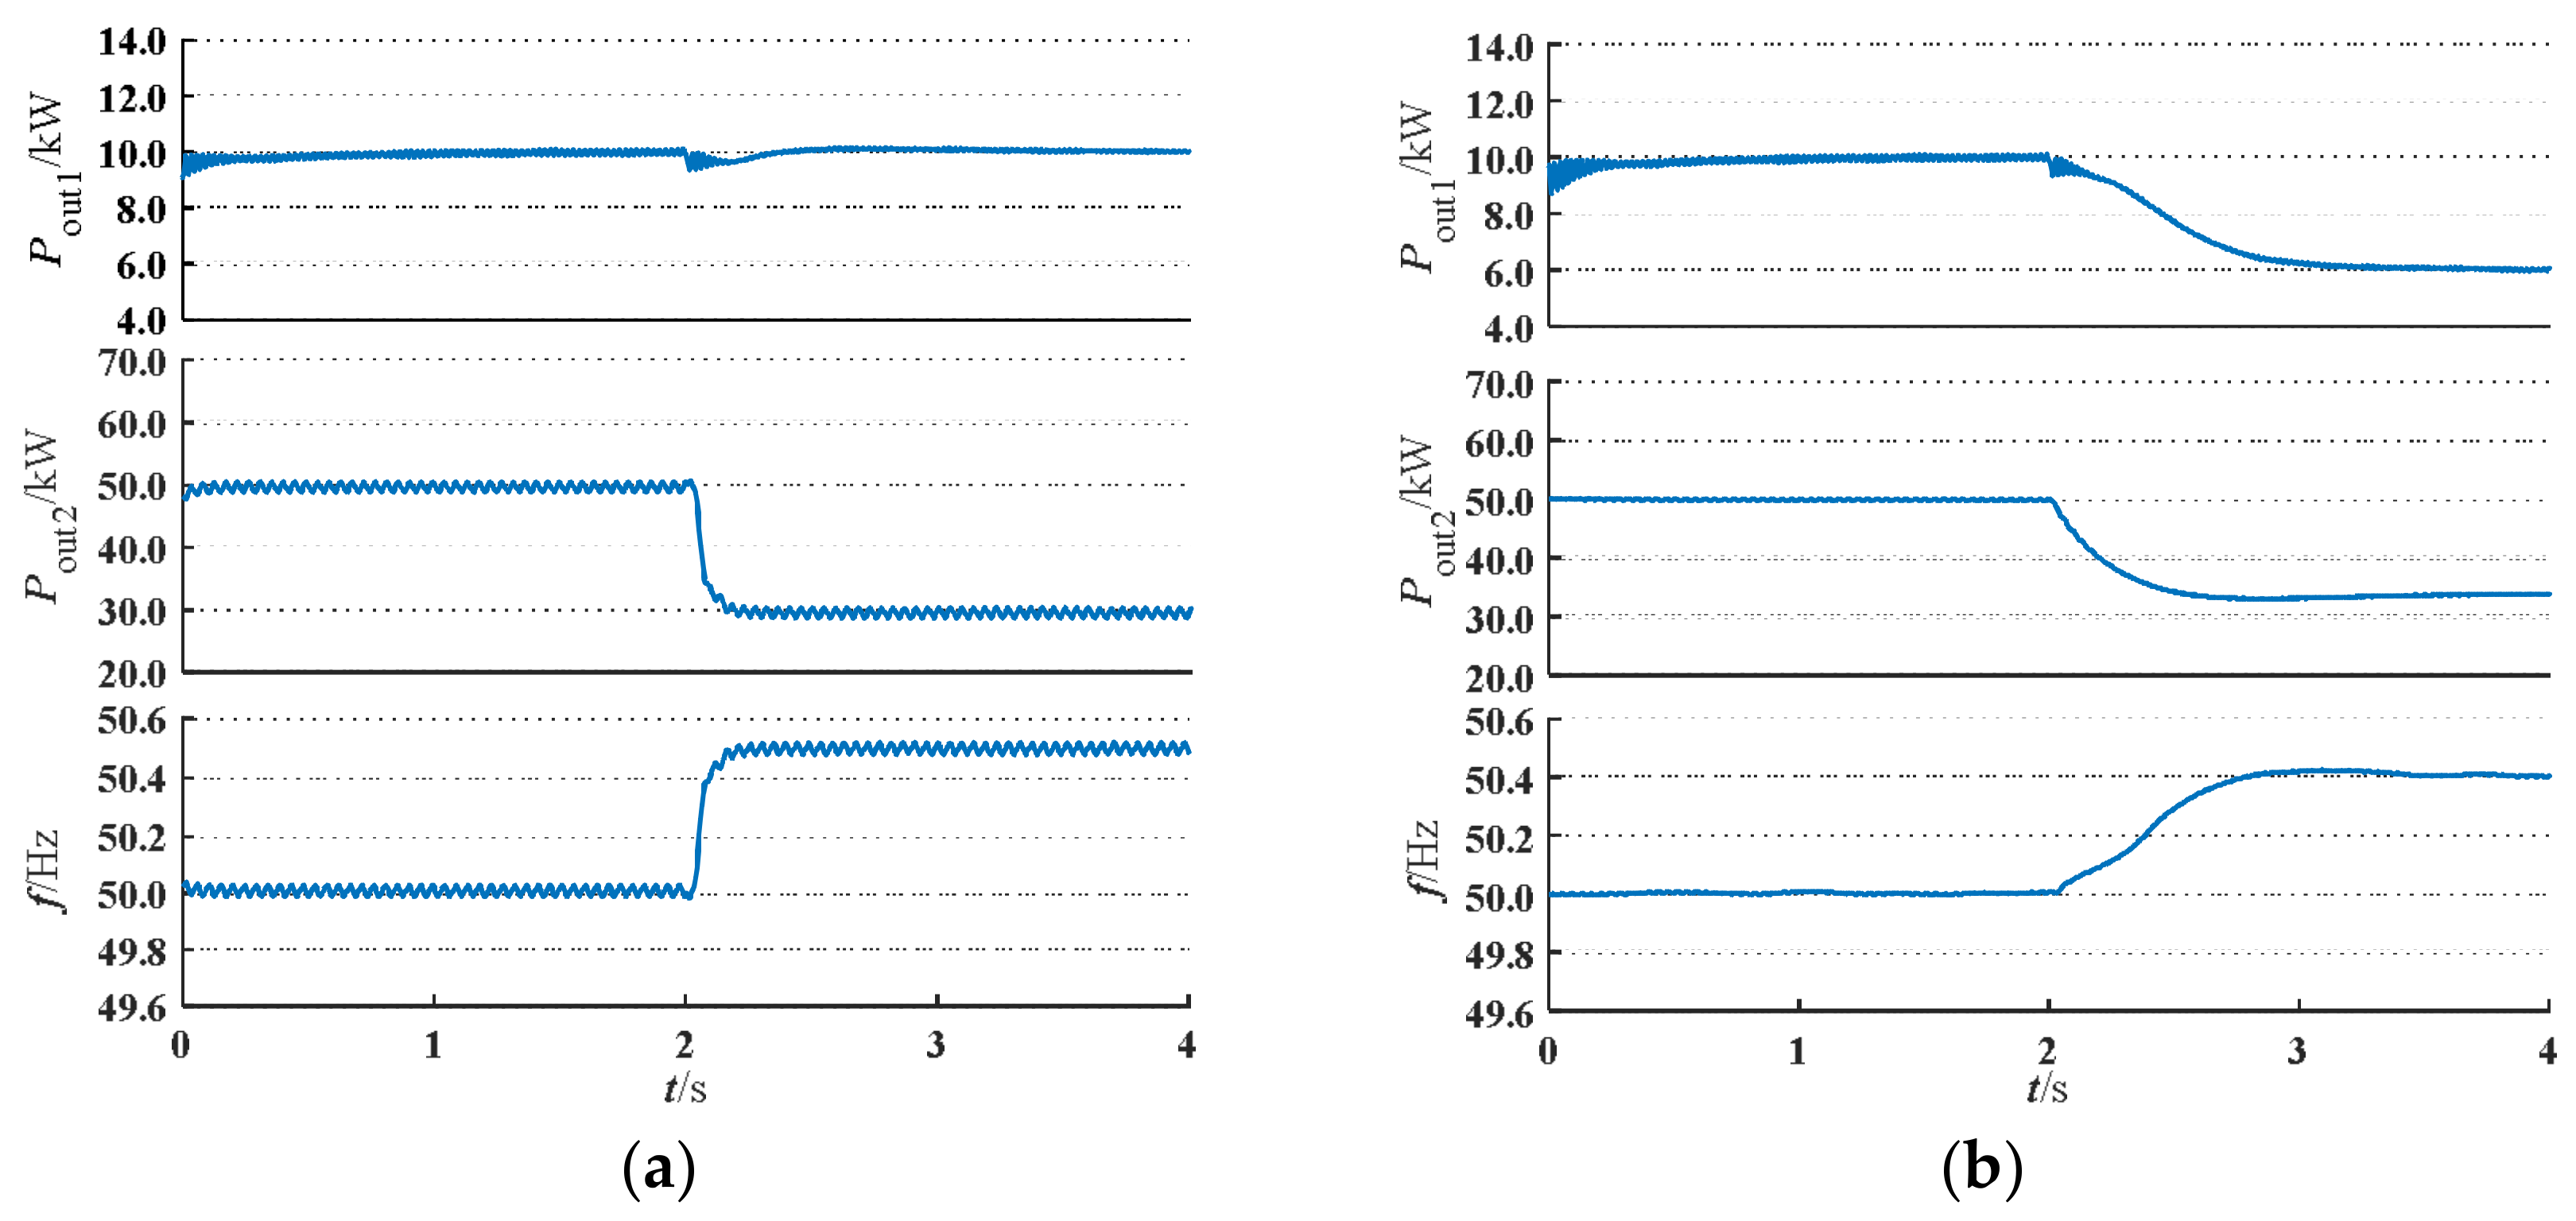
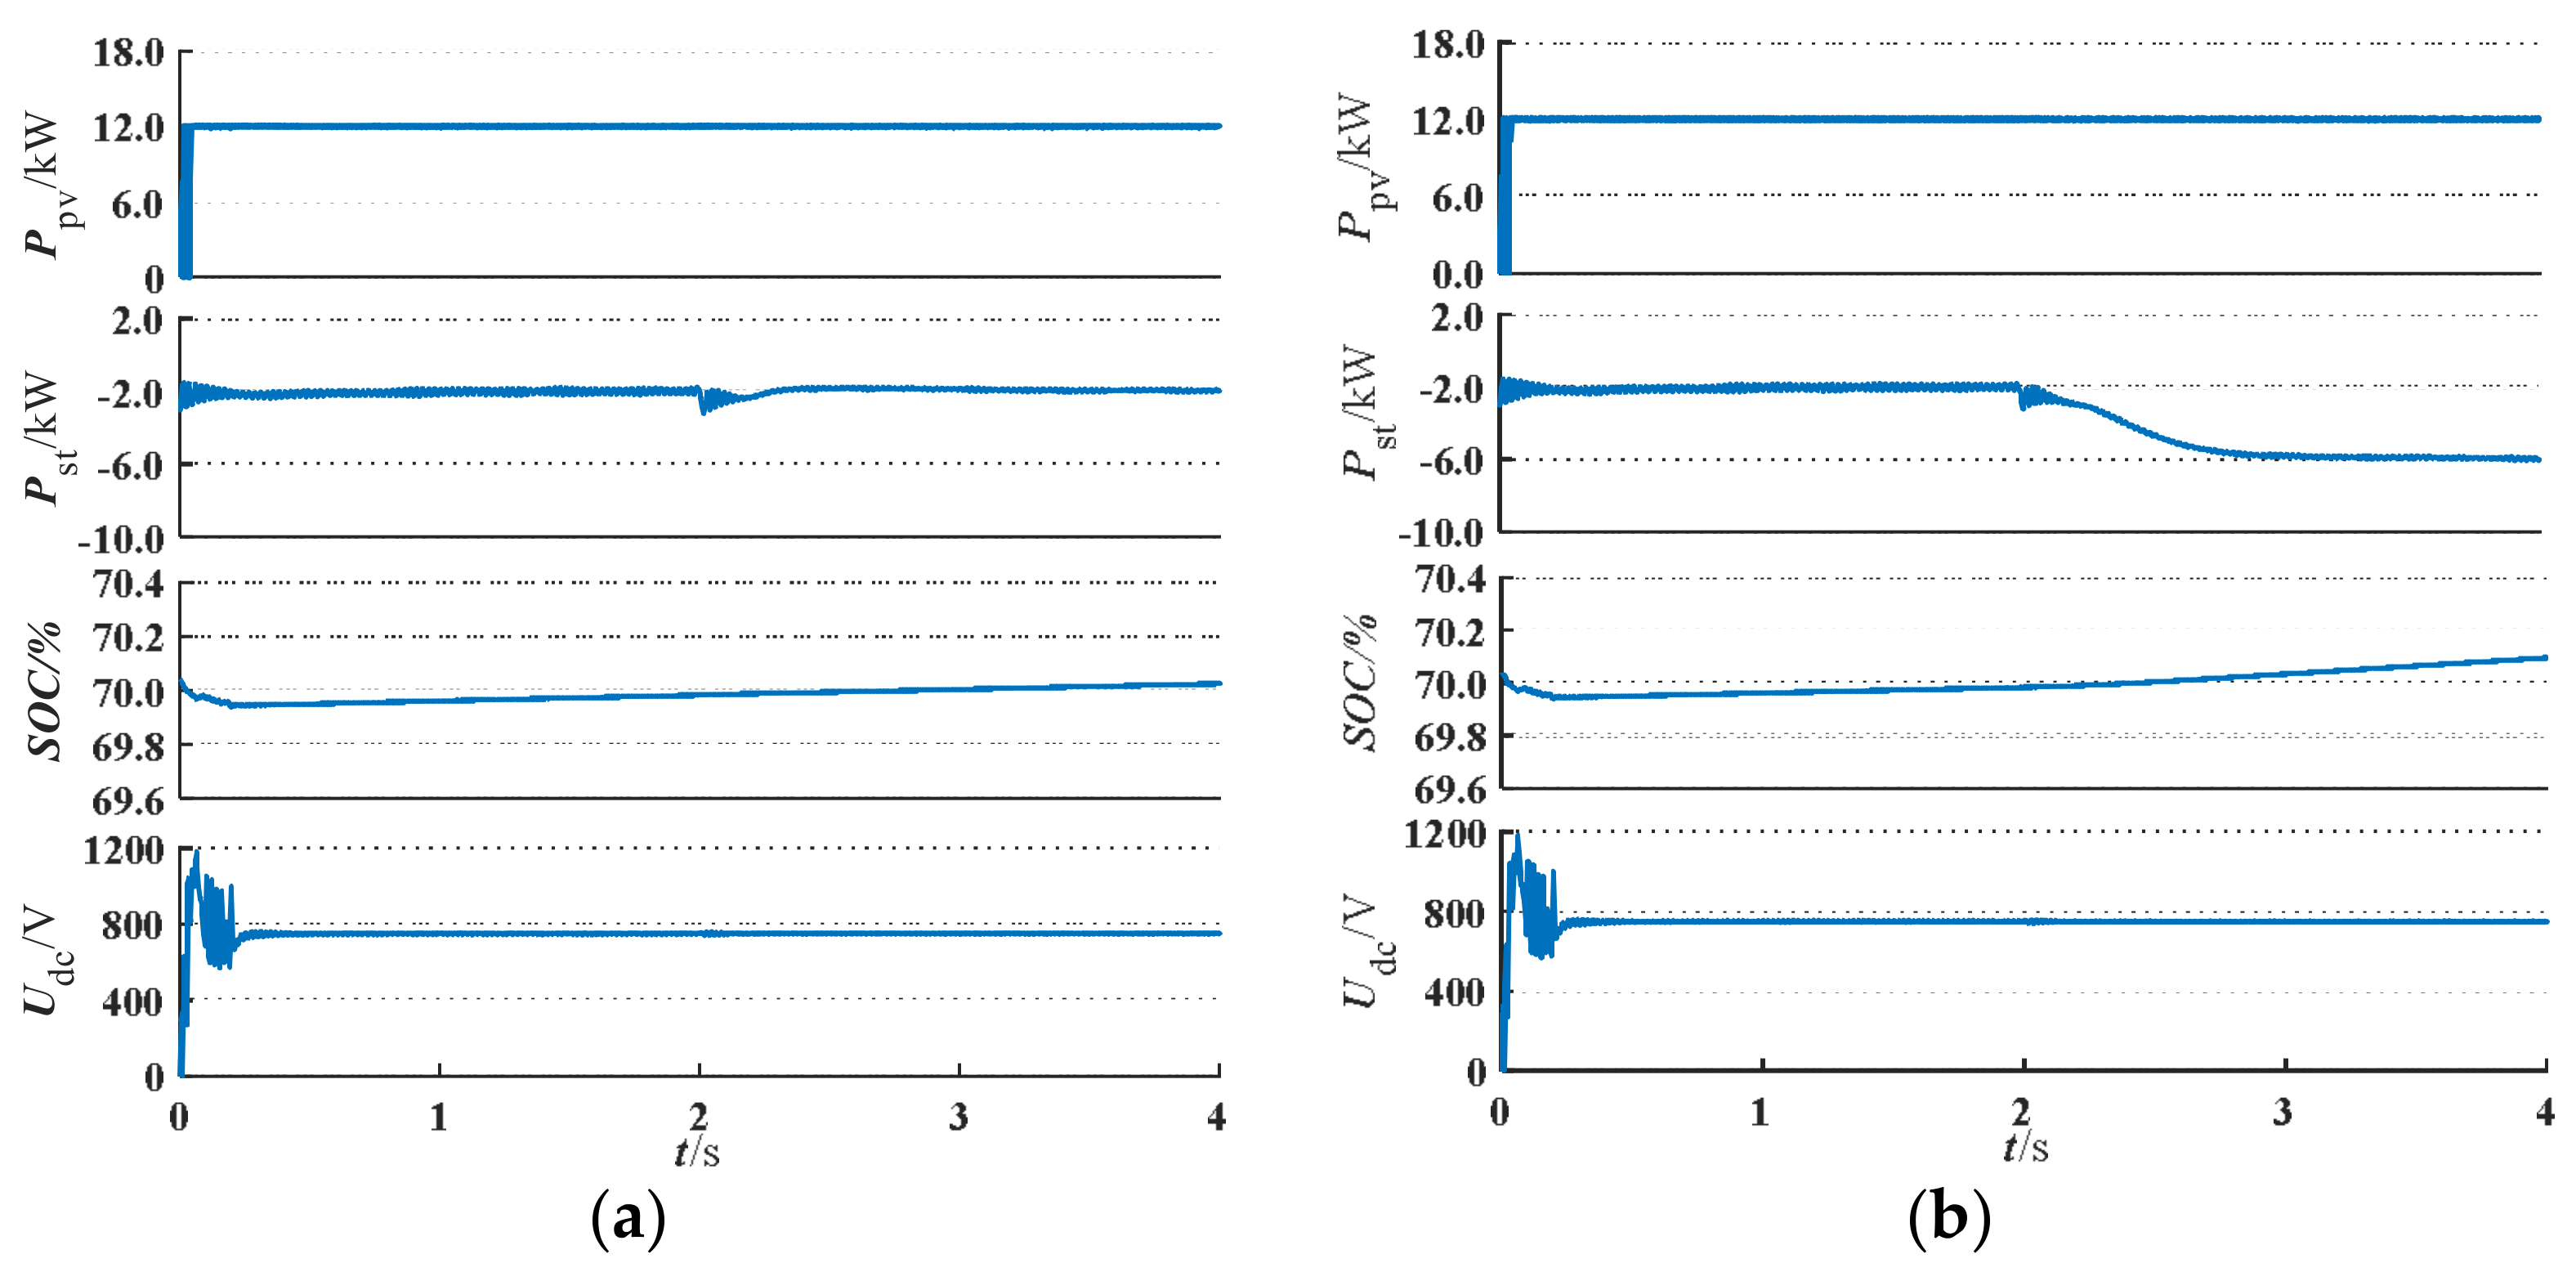
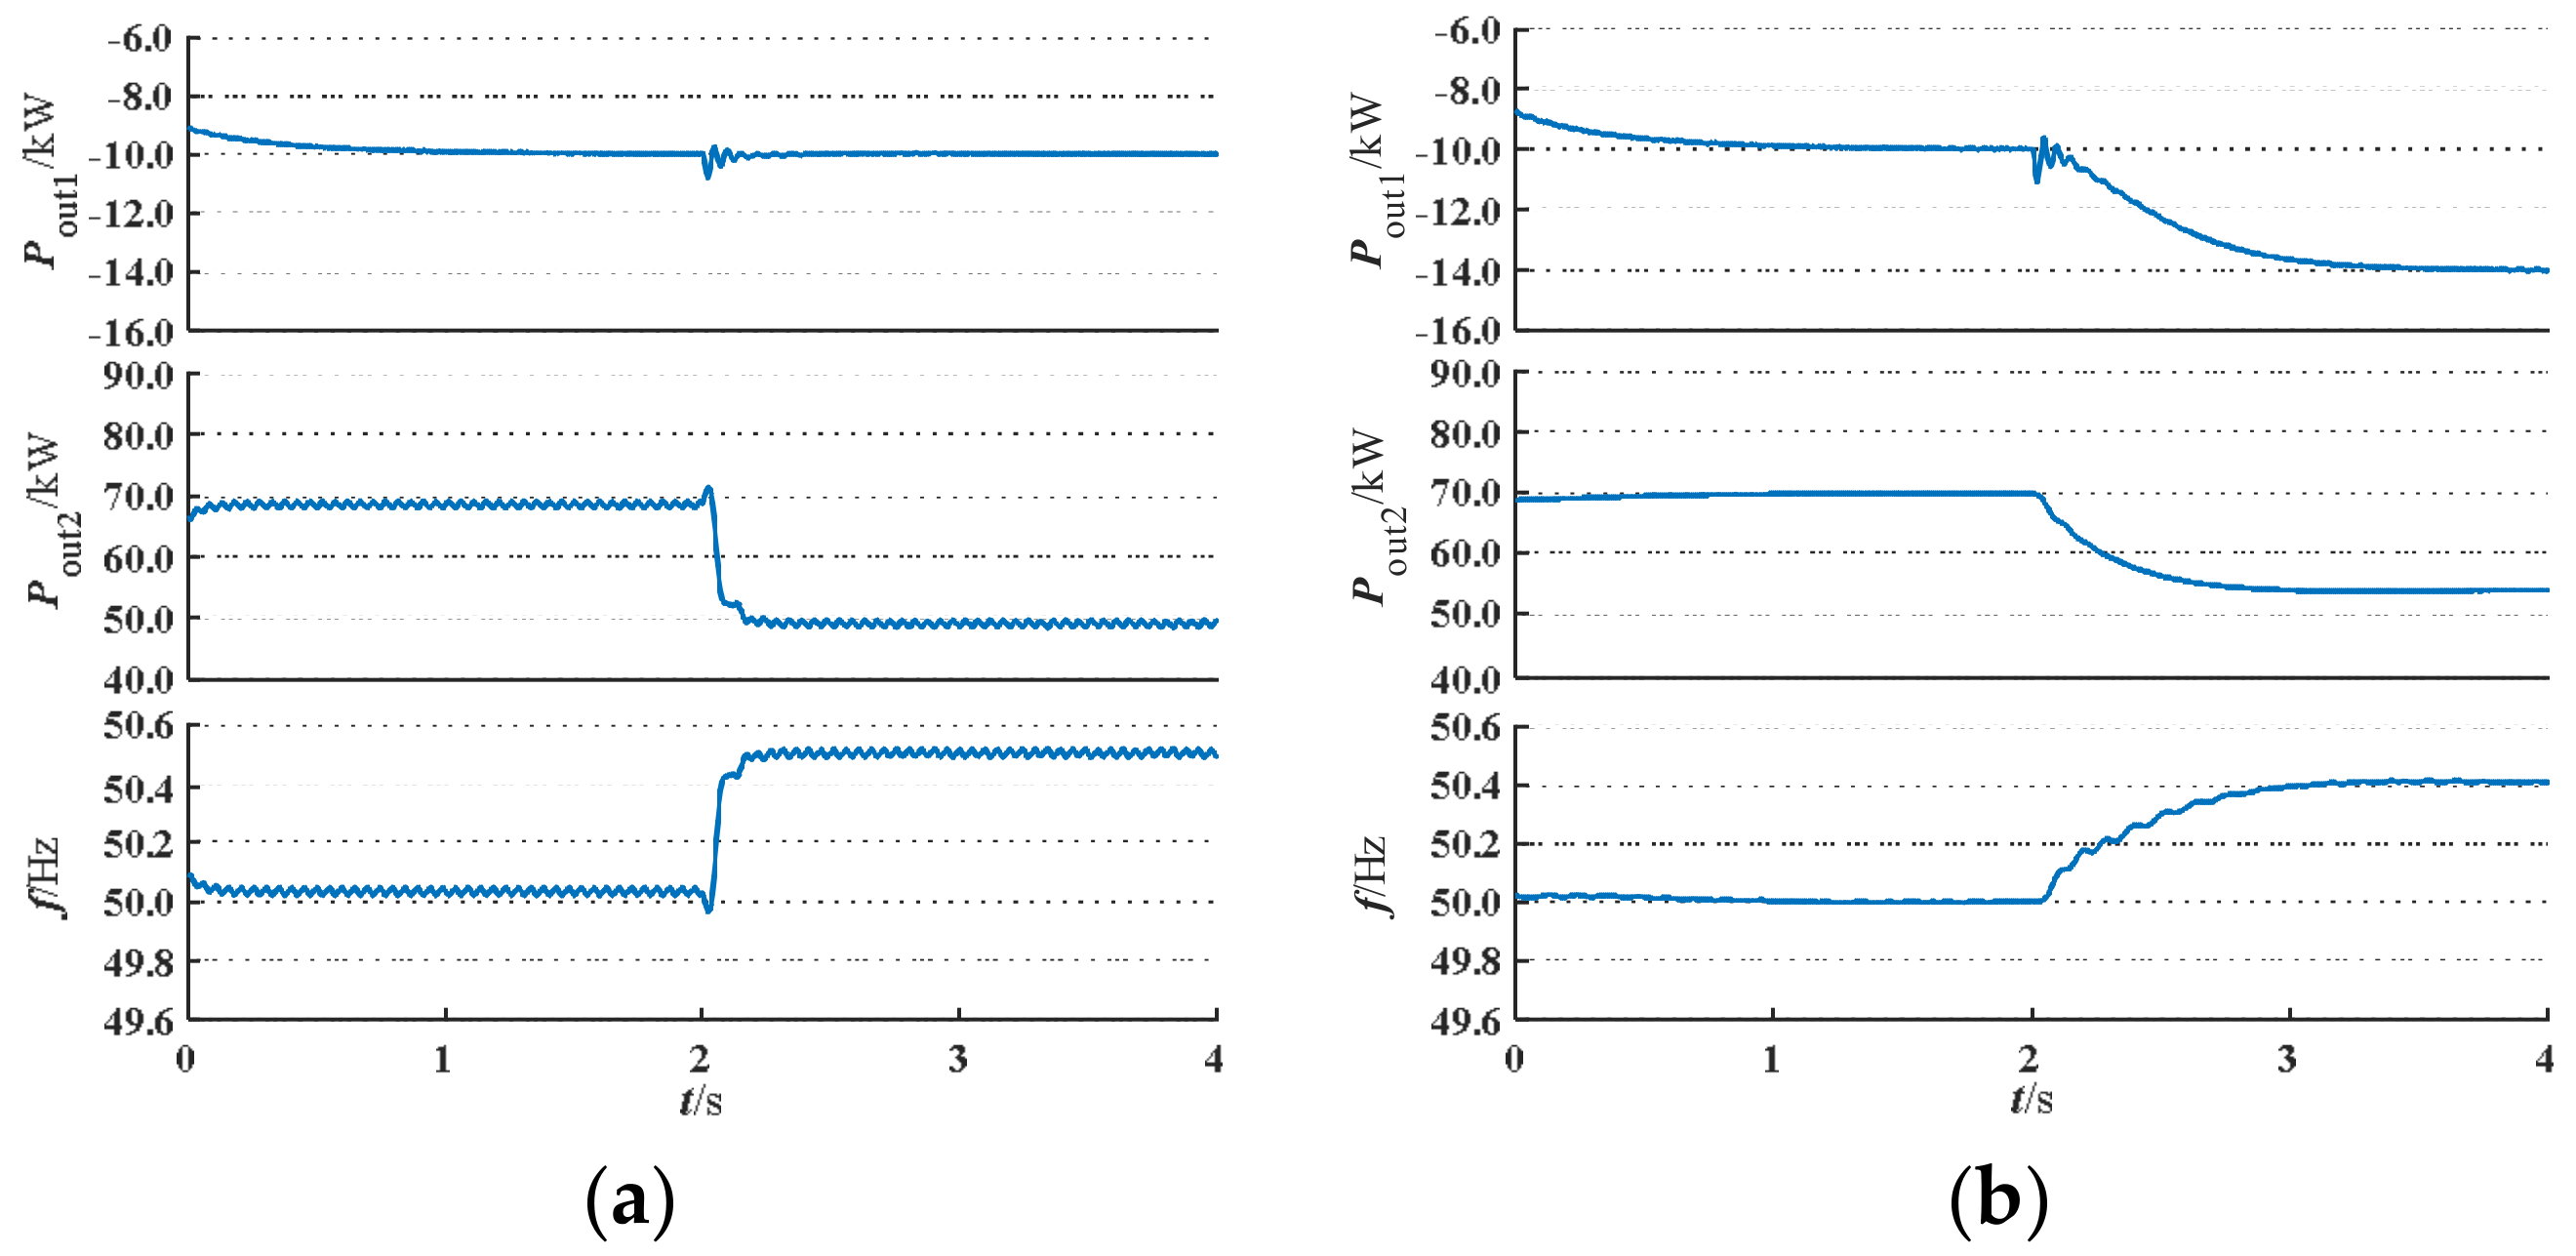
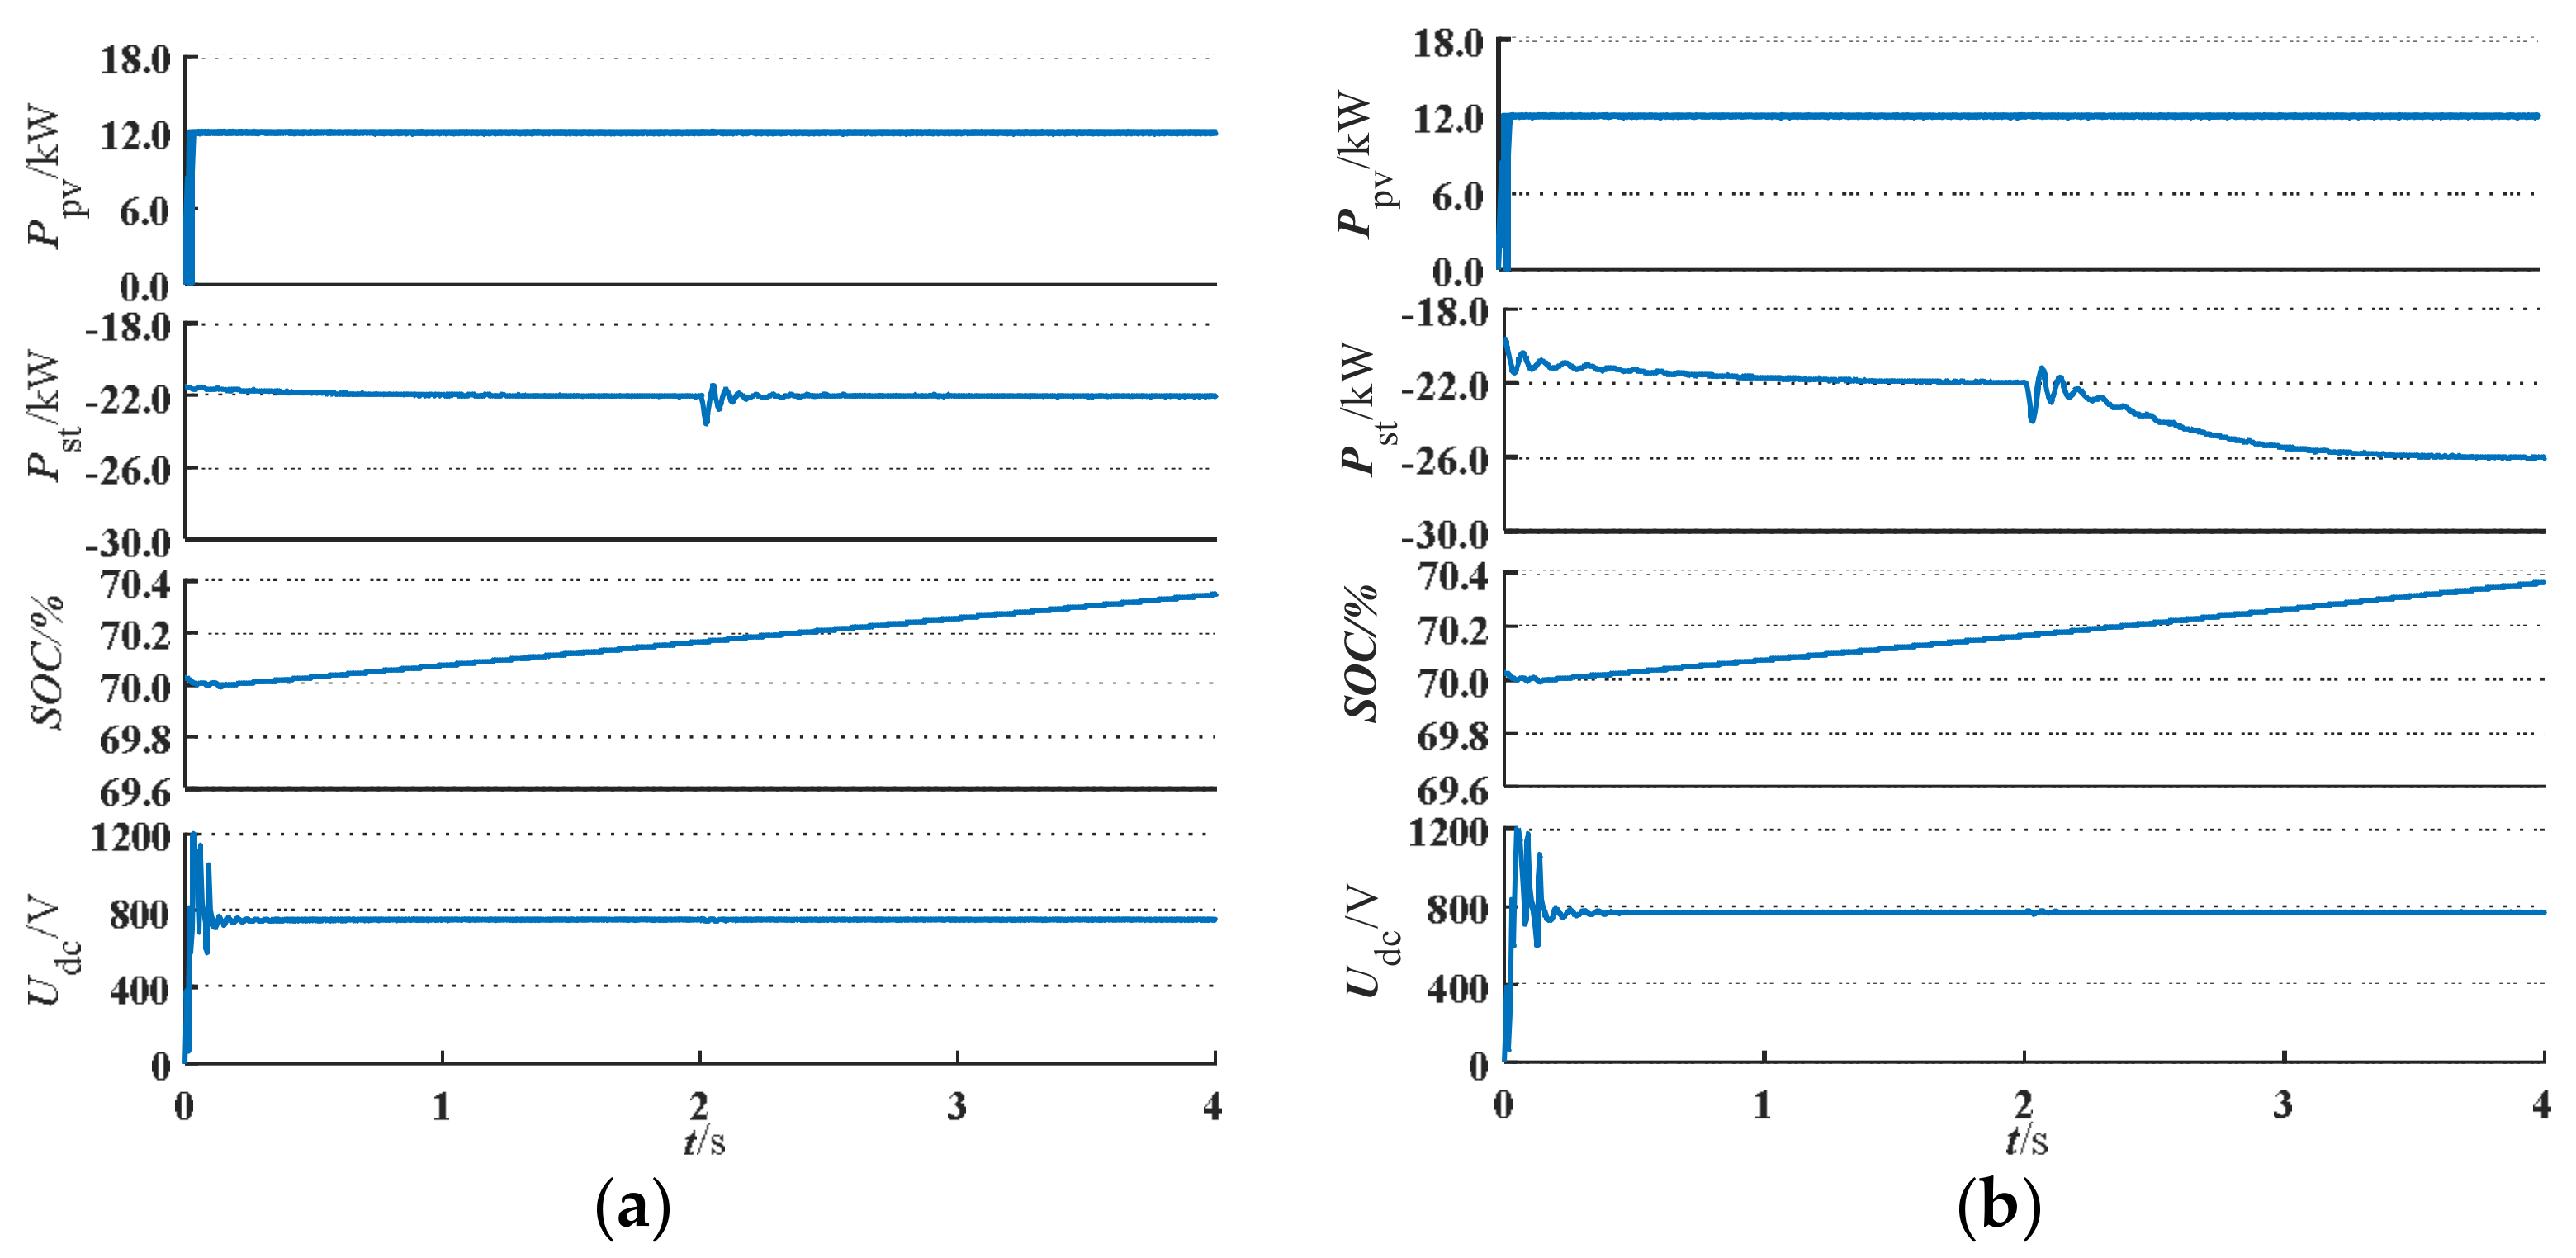
5.2.1. Verification of PV Storage Virtual Synchronous Generator System

For the PV storage virtual synchronous generator system, its active frequency regulation capability as well as inertia characteristic need to be verified, which are verified respectively in the following subsections.
(1) Verification of Frequency Regulation with Initiatives
① Generator Mode
Figure 18 and Figure 19 present the system characteristics from the external and internal perspectives, respectively. Figure 18 shows the external frequency regulation characteristic of the proposed PV storage virtual synchronous generator system and the conventional PV storage system in a generator mode. Figure 19 displays the internal situation of the proposed PV storage virtual synchronous generator system and the traditional PV storage system in a generator mode.
In the initial state, traditional PV storage and microgrid share the active power of 10 kW and 50 kW, respectively, to meet the needs of 60 kW load. As can be seen from Figure 18a, traditional PV storage does not participate in the frequency regulation. After the load is reduced at the 2nd second, the power imbalance of 20 kW is entirely assumed by the microgrid. As a result, the power sent by the microgrid P out 2 drops from 50 kW to 30 kW, which results in a 0.5 Hz increase in frequency. The situation with the PV storage virtual synchronous generator system is different, which can be seen from Figure 18b. When the load decreases, the PV storage virtual synchronous generator system can participate in the frequency regulation together with the microgrid, according to the droop coefficient. Due to the ratio of the active power droop coefficient between the PV storage virtual synchronous generator system and the microgrid is 4:1, the PV storage virtual synchronous generator system and the microgrid share the power imbalance of 20 Kw, according to the ratio of 1:4. The power delivered by the PV storage virtual synchronous generator system is reduced from 10 kW to 6 kW and P out 2 is reduced from 50 kW to 34 kW, which resulted in a 0.4 Hz increase in frequency. Above results indicate that the PV storage virtual synchronous generator system can participate in the frequency regulation actively in the generator mode, which is beneficial to improving the frequency stability of the system and reflecting the advantages of the PV storage virtual synchronous generator system compared to the traditional PV storage system.
What can be found out in Figure 19 directly is that the two systems can realize the maximum power point tracking and stability of DC bus voltage. Figure 19a shows that the power emitted by the energy storage system is always −2 kW no matter how the load changes when the traditional PV storage system is adopted. In addition, the state of charge SOC slowly rise with a constant rate of change. The above phenomenon means that the energy storage unit in the PV storage system absorbes 2 kW active power to ensure that the PV storage system always tracks the power dispatching value and outputs 10 kW active power. It can be seen from Figure 19b that the power delivered by the energy storage system and the state of charge SOC varies when PV storage virtual is synchronous to a generator system is adopted. After the 2nd second, a system power imbalance occurs due to the 20 kW load reduction. PV storage virtual synchronous generator system regulates frequency through the energy storage system. At the 2nd second, the power emitted by the energy storage unit P s t starts to decrease from −2 kW and after about one second, it becomes −6 kW. Meanwhile the rate of increase of SOC starts to become faster at the 2nd second. In other words, the energy storage system in the PV storage virtual synchronous generator system participates in the frequency regulation with initiatives by absorbing an extra 4 kW active power.
② Motor Mode
Figure 20 indicates the external frequency regulation characteristic of the proposed PV storage virtual synchronous generator system and the conventional PV storage system in motor mode. Figure 21 illustrates the internal situation of the proposed PV storage virtual synchronous generator system and the traditional PV storage system in the motor mode.
In the initial state, the microgrid assumes 70 kW of active power to meet a 60 kW power demand because the PV storage virtual synchronous generator system absorbs 10 kW active power. Figure 20a shows that the traditional PV storage still does not participate in the frequency regulation as a generator mode. After the load is reduced at the 2nd second, the power emitted by the microgrid drops from 70 kW to 50 kW and the frequency rise by 0.5 Hz. As can be seen from Figure 20b, when the PV storage virtual synchronous generator system is adopted, the output power of it P out 1 reduces from −10 kW to −14 kW and P out 2 reduces from 70 kW to 54 kW. The new PV storage can help microgrid to share the frequency regulation pressure with a final frequency of 50.4 Hz and 0.1 Hz lower than the result of traditional PV system. From the above results, it can be seen that the PV storage virtual synchronous generator system can still participate in the frequency regulation actively and improve the frequency stability, which shows the superiority of the new PV storage virtual synchronous generator system compared with the conventional one.
As shown in Figure 21, both kinds of systems can ensure the maximum power output of PV array and maintain the stability of DC bus voltage. Figure 21a indicates that the power output by the energy storage system is always −22 kW. Moreover, the SOC of the energy storage system rises rapidly and the rate of change remains unchanged. The above results illustrates that the energy storage unit in the PV storage system absorbs 22 kW active power, which ensures that the PV storage system can absorb 10 kW power. It can be seen from Figure 21b that when the proposed new PV storage system is adopted, after the 2nd second, the power output by the energy storage unit P s t decreases from −22 kW to −26 kW. Additionally, the rate of increase of SOC begins to be slightly faster at the 2nd second. It is clear that PV storage virtual synchronous machine system can participate in the frequency regulation process together with microgrid in the motor mode.
(2) Verification of the Inertia Characteristic
As can be seen from Figure 18a, the frequency of the traditional PV storage system changes rapidly with little inertia, which is not conducive to the stable operation of the power grid. The new PV storage system in Figure 18b has a smoother transient process due to the introduction of VSG technology. The comparison between Figure 18a,b shows that the transient process of the PV storage virtual synchronous generator system is relatively smooth, which can support the stability of the system frequency maximally. It should be pointed out that the same conclusion can also be drawn from the comparison between Figure 20a,b.
Afterward, the generator mode is taken as an example to observe the influence of different inertia on the system frequency. Select the three typical values of moment of inertia in the stable interval of small signal analysis and implement the inertia matching. The values of other parameters are the same as values in Table 1.
As can be seen from Figure 22, before the abrupt change of load, the PV storage system output 10 kW at a frequency of 50 Hz. After the load is abruptly changed, the delivered power decreases from 10 kW to 6 kW and the frequency increases from 50 Hz to 50.4 Hz. When J 1 = 0.1   kg m 2 , the transient process is the shortest/ When J 1 = 1.9   kg · m 2 , the transient process is the longest. When J 1 = 0.9   kg m 2 , the transient process is between 0.1   kg m 2 and 1.9   kg m 2 . The larger the moment of inertia, the longer the transient process and vice versa, which is consistent with the inertia of the synchronous generator.
Therefore, the VSG technology in the new control strategy can introduce the inertia characteristic of the synchronous generator into the control of the new energy inverter so that the output power and the frequency of the power grid are more gentle and stable. In addition, by setting the moment of inertia, the optimal control of the response process can be flexibly implemented as needed.

5.2.2. Verification of S-L Analysis Method

In this section, the frequency characteristics of the above operating conditions (in Section 6.1) is analyzed with an S-L analysis method. The feasibility of the S-L analysis method can be verified by comparing the analysis results with the actual operation results. There are three reasons for choosing the above operating conditions, which are detailed below.
  • The above operating conditions contain an input/output bidirectional devices (PV storage system) and involve bidirectional frequency regulation, which is possible to verify whether S-L analysis method is suitable for input/output bidirectional devices.
  • The above operating conditions not only include the PV storage virtual synchronous machine system, but also include the traditional PV storage system, which is possible for verifying whether the S-L analysis method is applicable to different control strategies and devices.
  • There are two power supplies involved in frequency regulation jointly in above operating conditions through which the S-L analysis method is available to a multi-power supply.
(1) Generator Mode
The S-L analysis of the multi-power system including the PV system (in generator mode) is shown in Figure 23. L L 0 is the initial frequency characteristic of total load and L L 1 is the frequency characteristic of the total load after sudden change. L G N , L G T , L G are the frequency characteristics of the PV storage virtual synchronous generator system, the traditional PV storage system and the microgrid, respectively. The input/output bidirectional device (PV storage system) is operating in the generator mode and its frequency characteristic are located in the second quadrant, which would send power to the load together with the actual grid (Synchronous Machine Grid Equivalent Model). The blue elements are related to the initial power balance before the load is reduced. The red elements are related to the final power balance after the load is reduced. The bold black elements are related to the traditional PV storage system. For ease of reading, the slope of the Synchronous Machine Grid Equivalent Model was slightly increased.
① S-L Analysis of Traditional PV Storage System
Traditional PV storage system output constant power P G N 0 without the ability to regulate the frequency. Therefore, after the sudden load decrease, all the power unbalanced amounts are assumed by the microgrid. The microgrid needs to absorb more power to achieve the power balance, which causes the system frequency to increase more. In Figure 23, the power balance P G N 0 + P G T = P L 1 is reached when the operating line is thick dashed line f = f 1 .
Learning from Equations (18) and (19), with Δ P G T = 0 , Δ P L 1 = 0 , the frequency regulation equation of the traditional PV system is obtained below.
{ Δ P G T = 20000 0.000025 Δ P G T = | Δ f T |
From Equation (39), we can get Δ P G T = 20 kW, | Δ f T | = 0.5 Hz, which indicates a good agreement between the above results of S-L analysis and the simulation results in Figure 18a.
② S-L Analysis of New PV Storage System
Under the combined effect of the new PV storage system and microgrid, the system frequency increases from f 0 to f 2 whose specific analysis process is similar to Subsection 3.3.1. Equations (14)–(17) are referenced for obtaining Equations (40) and (41), which is gained from the geometric relationship in Figure 23.
Δ P G N + Δ P G = Δ P L 0
Δ P G N R G N = Δ P G R G = | Δ f N |
It can be seen that Equations (40) and (41) are special cases of Δ P L 1 = 0 in Equations (18) and (19).
Taking the system parameters into Equations (40) and (41), the equation below is determined.
{ Δ P G N + Δ P G = 20000 0.0001 Δ P G N = 0.000025 Δ P G = | Δ f N |
By solving the above equation set, we can obtain Δ P G N = 4 kW, Δ P G = 16 kW, | Δ f N | = 0.4 Hz. From Figure 18b, it is clear that the results of S-L analysis are in good consistency with the simulation results.
(2) Motor Mode
The S-L analysis of the multi-power system including the PV system (in motor mode) is displayed in Figure 24 where the marking method is the same as Figure 23. It should be pointed out that the input/output bidirectional device (PV storage system) is operating in the motor mode. Its frequency characteristic is in the first quadrant, which absorbs power from the the actual grid (Synchronous Machine Grid Equivalent Model) together with the load.
① S-L Analysis of Traditional PV Storage System
After the sudden drop in load, the frequency rises. In Figure 24, the power balance P G T = P L 1 + P G N 0 is reached when the operation line is thick dashed line f = f 1 . Using the S-L analysis method in the same way as generator mode, Δ P G T = 20 kW, Δ f T = 0.5 Hz are obtained. It can be found that the results of S-L analysis coincide with the simulation results in Figure 20a.
② S-L Analysis of New PV Storage System
From the initial power balance from Figure 24 corresponding to the operation line f = f 0 , the equation below can be obtained.
P G 0 = P L 0 + P G N 0
After the frequency regulation is finished, the frequency goes up and the operation line becomes f = f 2 , corresponding to the final balance state where we obtain the equation below.
P G 1 = P L 1 + P G N 1
Concerning the transient process, for the new PV storage system, it performs frequency regulation by absorbing more active power as a motor after the load decreases.
P G N 0 + Δ P G N = P G N 1
The actual power grid participates in the frequency regulation through less generated power.
P G 0 Δ P G = P G 1
Load does not have its own regulating effect.
P L 0 Δ P L 0 = P L 1
The same basic relationship 1 as the Equation (40) can be obtained from Equations (43)–(47). From the geometric relationship in Figure 24, the same basic relationship 2 as in Equation (41) can be easily obtained. It can be seen that the device operating in the motor mode has the same frequency regulation capability and effect as that in the generator mode theoretically. Bring the parameters into above obtained two basic relationship expressions and solve them, we get Δ P G N = 4 kW, Δ P G = 16 kW, Δ f N = 0.4 Hz, which are consistent with the simulation results in Figure 20b.

6. Conclusions

  • The proposed S-L analysis method improved the traditional static frequency characteristic of the analysis method and it can qualitatively and quantitatively analyze the frequency regulation process (including primary frequency regulation and secondary frequency regulation) of input/output bidirectional devices and complex multi-power supply systems under different control strategy regardless of the operation mode (generator mode or motor mode).
  • A distributed PV storage virtual synchronous generator system was established through the design and control of bidirectional DC-DC (chopper) and bidirectional converter. This kind of system can operate in a stable way in generator/motor dual mode with the bidirectional frequency regulation capability and the inertia characteristic of the synchronous generator, which satisfies the requests of State Grid Corporation of China (SGCC) and the autonomous power system.
  • In order to mimic the actual microgrid characteristics accurately, a Synchronous Machine Grid Equivalent Model was designed. Additionally, for the purpose of realizing the compatibility between devices with inertia such as synchronous generators and virtual synchronous generators, an inertia matching method was proposed, which contributed to the stable operation of microgrid.
  • The feasibility and correctness of the proposed PV storage virtual synchronous generator system, the S-L analysis method and the inertia matching method were verified through simulation experiments.

Acknowledgments

This paper was supported by National Key R&D Program of China (2016YFB0900400); Natural Science Fundings of Hebei Province (E201502046); State Grid Corporation of Science and Technology Project (PD71-17-008), Liaoning Power Grid Corporation’s 2018 Science and Technology Project “Research on the Reactive Power and Voltage Optimization Strategy and Evaluation Index Considering Source and Load Fluctuation Characteristics”.

Author Contributions

Xiangwu Yan proposed the research direction and the idea of S-L analysis method. Xueyuan Zhang completed the S-L analysis method. Xiangwu Yan proposed and designed the Synchronous Machine Grid Equivalent Model. Xueyuan Zhang and Bo Zhang established the mathematical model of PV storage virtual synchronous generator system. Bo Zhang studied the matching method of inertia. Xueyuan Zhang, Yanjun Ma and Ming Wu performed the verification. Xiangwu Yan, Xueyuan Zhang and Bo Zhang analyzed the result together. Xueyuan Zhang wrote the paper.

Conflicts of Interest

The authors declare no conflict of interest.

References

  1. Mahmoud, M.S.; Hussain, S.A.; Abido, M.A. Modeling and control of microgrid: An overview. J. Frankl. Inst. 2014, 351, 2822–2859. [Google Scholar] [CrossRef]
  2. Rana, M.M.; Li, L. An overview of distributed microgrid state estimation and control for smart grids. Sensors 2015, 15, 4302–4325. [Google Scholar] [CrossRef] [PubMed]
  3. Bacha, S.; Picault, D.; Burger, B.; Etxeberria-Otadui, I.; Martins, J. Photovoltaics in Microgrids: An Overview of Grid Integration and Energy Management Aspects. IEEE Ind. Electron. Mag. 2015, 9, 33–46. [Google Scholar] [CrossRef]
  4. Shahabi, M.; Haghifam, M.R.; Mohamadian, M.; Nabavi-Niaki, S.A. Microgrid Dynamic Performance Improvement Using a Doubly Fed Induction Wind Generator. IEEE Trans. Energy Convers. 2009, 24, 137–145. [Google Scholar] [CrossRef]
  5. Bae, S.; Kwasinski, A. Dynamic Modeling and Operation Strategy for a Microgrid with Wind and Photovoltaic Resources. IEEE Trans. Smart Grid 2012, 3, 1867–1876. [Google Scholar] [CrossRef]
  6. Van Roy, J.; Leemput, N.; Geth, F.; Buscher, J.; Salenbien, R.; Driesen, J. Electric vehicle charging in an office building microgrid with distributed energy resources. IEEE Trans. Sustain. Energy 2014, 5, 1389–1396. [Google Scholar] [CrossRef]
  7. Beer, S.; Gomez, T.; Dallinger, D.; Momber, I.; Marnay, C.; Stadler, C. An economic analysis of used electric vehicle batteries integrated into commercial building microgrids. IEEE Trans. Smart Grid 2012, 3, 517–525. [Google Scholar] [CrossRef]
  8. Tan, X.; Li, Q.; Wang, H. Advances and trends of energy storage technology in Microgrid. Int. J. Electr. Power Energy Syst. 2013, 44, 179–191. [Google Scholar] [CrossRef]
  9. Levron, Y.; Guerrero, J.M.; Beck, Y. Optimal Power Flow in Microgrids with Energy Storage. IEEE Trans. Power Syst. 2013, 28, 3226–3234. [Google Scholar] [CrossRef]
  10. Srivastava, A.; Kumar, A.; Schulz, N. Impact of Distributed Generations with Energy Storage Devices on the Electric Grid. IEEE Syst. J. 2012, 6, 110–117. [Google Scholar] [CrossRef]
  11. Oudalov, A.; Chartouni, D.; Ohler, C. Optimizing a battery energy storage system for primary frequency control. IEEE Trans. Power Syst. 2007, 22, 1259–1266. [Google Scholar] [CrossRef]
  12. Serban, I.; Marinescu, C. Control strategy of three-phase battery energy storage systems for frequency support in microgrids and with uninterrupted supply of local loads. IEEE Trans. Power Electron. 2014, 29, 5010–5020. [Google Scholar] [CrossRef]
  13. Xu, Y.; Zhang, W.; Hug, G.; Kar, S.; Li, Z. Cooperative control of distributed energy storage systems in a microgrid. IEEE Trans. Smart Grid 2015, 6, 238–248. [Google Scholar] [CrossRef]
  14. Zhong, Q.-C. Power electronics-enabled autonomous power systems: Architecture and technical routes. IEEE Trans. Ind. Electron. 2017, 64, 5907–5918. [Google Scholar] [CrossRef]
  15. Von Appen, J.; Stetz, T.; Braun, M.; Schmiegel, A. Local Voltage Control Strategies for PV Storage Systems in Distribution Grids. IEEE Trans. Smart Grid 2014, 5, 1002–1009. [Google Scholar] [CrossRef]
  16. Himour, K.; Ghedamsi, K.; Berkouk, E.M. Supervision and control of grid connected PV-Storage systems with the five level diode clamped inverter. Energy Convers. Manag. 2014, 77, 98–107. [Google Scholar] [CrossRef]
  17. Choudar, A.; Boukhetala, D.; Barkat, S.; Brucker, J.M. A local energy management of a hybrid PV-storage based distributed generation for microgrids. Energy Convers. Manag. 2015, 90, 21–33. [Google Scholar] [CrossRef]
  18. Bullich-Massagué, E.; Aragüés-Peñalba, M.; Sumper, A.; Boix-Aragones, O. Active power control in a hybrid PV-storage power plant for frequency support. Sol. Energy 2016, 14. [Google Scholar] [CrossRef]
  19. Datta, M.; Senjyu, T. Fuzzy control of distributed PV inverters/energy storage systems/electric vehicles for frequency regulation in a large power system. IEEE Trans. Smart Grid 2013, 4, 479–488. [Google Scholar] [CrossRef]
  20. Grainger, J.J.; Stevenson, W.D.J. Power System Analysis; Stephen, E.H., Ed.; McGraw-Hill: Hightstown, NJ, USA, 1994; pp. 562–572. ISBN 0-07-113338-0. [Google Scholar]
  21. Ozbay, H.; Oncu, S.; Kesler, M. SMC-DPC based active and reactive power control of grid-tied three phase inverter for PV systems. Int. J. Hydrog. Energy 2017, 42, 17713–17722. [Google Scholar] [CrossRef]
  22. Zhong, Q.C.; Weiss, G. Synchronverters: Inverters That Mimic Synchronous Generators. IEEE Trans. Ind. Electron. 2011, 58, 1259–1267. [Google Scholar] [CrossRef]
  23. Anderson, M.; Fouad, A.A. Power System Control and Stability; Publishing House of Electronics Industry: Beijing, China; pp. 7–13. ISBN 978-7-121-16748-5.
  24. Wu, H.; Ruan, X.; Yang, D.; Chen, X.; Zhao, W.; Lv, Z.; Zhong, Q.C. Small-signal modeling and parameters design for virtual synchronous generators. IEEE Trans. Ind. Electron. 2016, 63, 4292–4303. [Google Scholar] [CrossRef]
  25. D’Arco, S.; Suul, J.A.; Fosso, O.B. Small-signal modeling and parametric sensitivity of a virtual synchronous machine in islanded operation. Int. J. Electr. Power Energy Syst. 2015, 72, 3–15. [Google Scholar] [CrossRef] [Green Version]
  26. Moradi, M.H.; Reisi, A.R. A hybrid maximum power point tracking method for photovoltaic systems. Sol. Energy 2011, 85, 2965–2976. [Google Scholar] [CrossRef]
Figure 1. Per-unit regulation characteristic of a generating unit.
Applsci 08 00532 g001
Figure 2. The supplementary control for load increase Δ P G .
Applsci 08 00532 g002
Figure 3. Diagram of S-L analysis method.
Applsci 08 00532 g003
Figure 4. S-L analysis method of single-supply system.
Applsci 08 00532 g004
Figure 5. Schematic of secondary frequency regulation with S-L analysis method.
Applsci 08 00532 g005
Figure 6. S-L analysis method of infinite power grid single-supply system.
Applsci 08 00532 g006
Figure 7. S-L analysis method of double generators.
Applsci 08 00532 g007
Figure 8. Frequency characteristics comparison of different power.
Applsci 08 00532 g008
Figure 9. Structure of PV storage system.
Applsci 08 00532 g009
Figure 11. The control flow chart of bidirectional DC-DC.
Applsci 08 00532 g011
Figure 12. Control Strategy of Traditional PV Storage System.
Applsci 08 00532 g012
Figure 15. Complete control structure of bidirectional PV storage converter.
Applsci 08 00532 g015
Figure 16. Synchronous Machine Grid Equivalence Model.
Applsci 08 00532 g016
Figure 17. Simulation model structure diagram.
Applsci 08 00532 g017
Figure 18. (a) Frequency regulation results of traditional PV storage system in generator mode; (b) Frequency regulation results of PV storage virtual synchronous generator system in the generator mode.
Applsci 08 00532 g018
Figure 19. (a) Internal state quantities of traditional PV storage in the generator mode; (b) Internal state quantities of PV storage virtual synchronous generator system in the generator mode.
Applsci 08 00532 g019
Figure 20. (a) Frequency regulation results of traditional PV storage system in the motor mode; (b) Frequency regulation results of PV storage virtual synchronous generator system in the motor mode.
Applsci 08 00532 g020
Figure 21. (a) Internal state quantities of traditional PV storage in the motor mode; (b) Internal state quantities of PV storage virtual synchronous generator system in the motor mode.
Applsci 08 00532 g021
Figure 22. The influence of different inertia on the system frequency.
Applsci 08 00532 g022
Figure 23. S-L analysis of a multi-power system including input/output bidirectional devices in the generator mode.
Applsci 08 00532 g023
Figure 24. S-L analysis of multi-power system including input/output bidirectional devices in the motor mode.
Applsci 08 00532 g024
Table 1. Table of simulation parameters.
ParametersValues
Parameters of systemThe maximum output power of the PV array, Pmax10 kW
The rated capacity of the PV storage virtual synchronous generator system, S1N20 kVA
The rated capacity of microgrid, S2N80 kVA
The initial state of charge of the energy storage, SOC70%
The reference value of DC voltage, Udc*750 V
The rated phase voltage of power system, Ur-ph220 V
The sampling frequency of power system, fS10 kHz
The rated frequency of power system, fN50 Hz
Filter parametersThe series inductance of the filter, LS1.00 mH
The parallel capacitance of the filter, CS500 μF
The series resistance of the filter, RS0.01 Ω
Line parametersLine inductance, Lr1.00 mH
Line capacitance, Cr0.01 μF
Control parametersThe active droop coefficient of the PV storage system, R P 1 0.0001
The reactive droop coefficient of the PV storage system, R P 2 0.000025
The proportionality factor of PQ control power outer loop, PP-PQ6
The integration factor of PQ control power outer loop, IP-PQ15
The proportionality factor of PQ control current inner loop, PI-PQ3
The integration factor of PQ control current inner loop, II-PQ0
The proportionality factor of power outer loop in voltage and current double closed-loop control, PU-UI4
The integration factor of power outer loop in voltage and current double closed-loop control, IU-UI17
The proportionality factor of current inner loop in voltage and current double closed-loop control, PI-UI5
The integration factor of current inner loop in voltage and current double closed-loop control, II-UI1
The virtual Inertia of the PV storage virtual synchronous generator system, J10.9 kg m2
The virtual Inertia of the Synchronous Machine Grid Equivalent Model, J23.6 kg m2

