Raman Imaging for the Detection of Adulterants in Paprika Powder: A Comparison of Data Analysis Methods


Abstract
1. Introduction
2. Materials and Methods
2.1. Sample Preparation
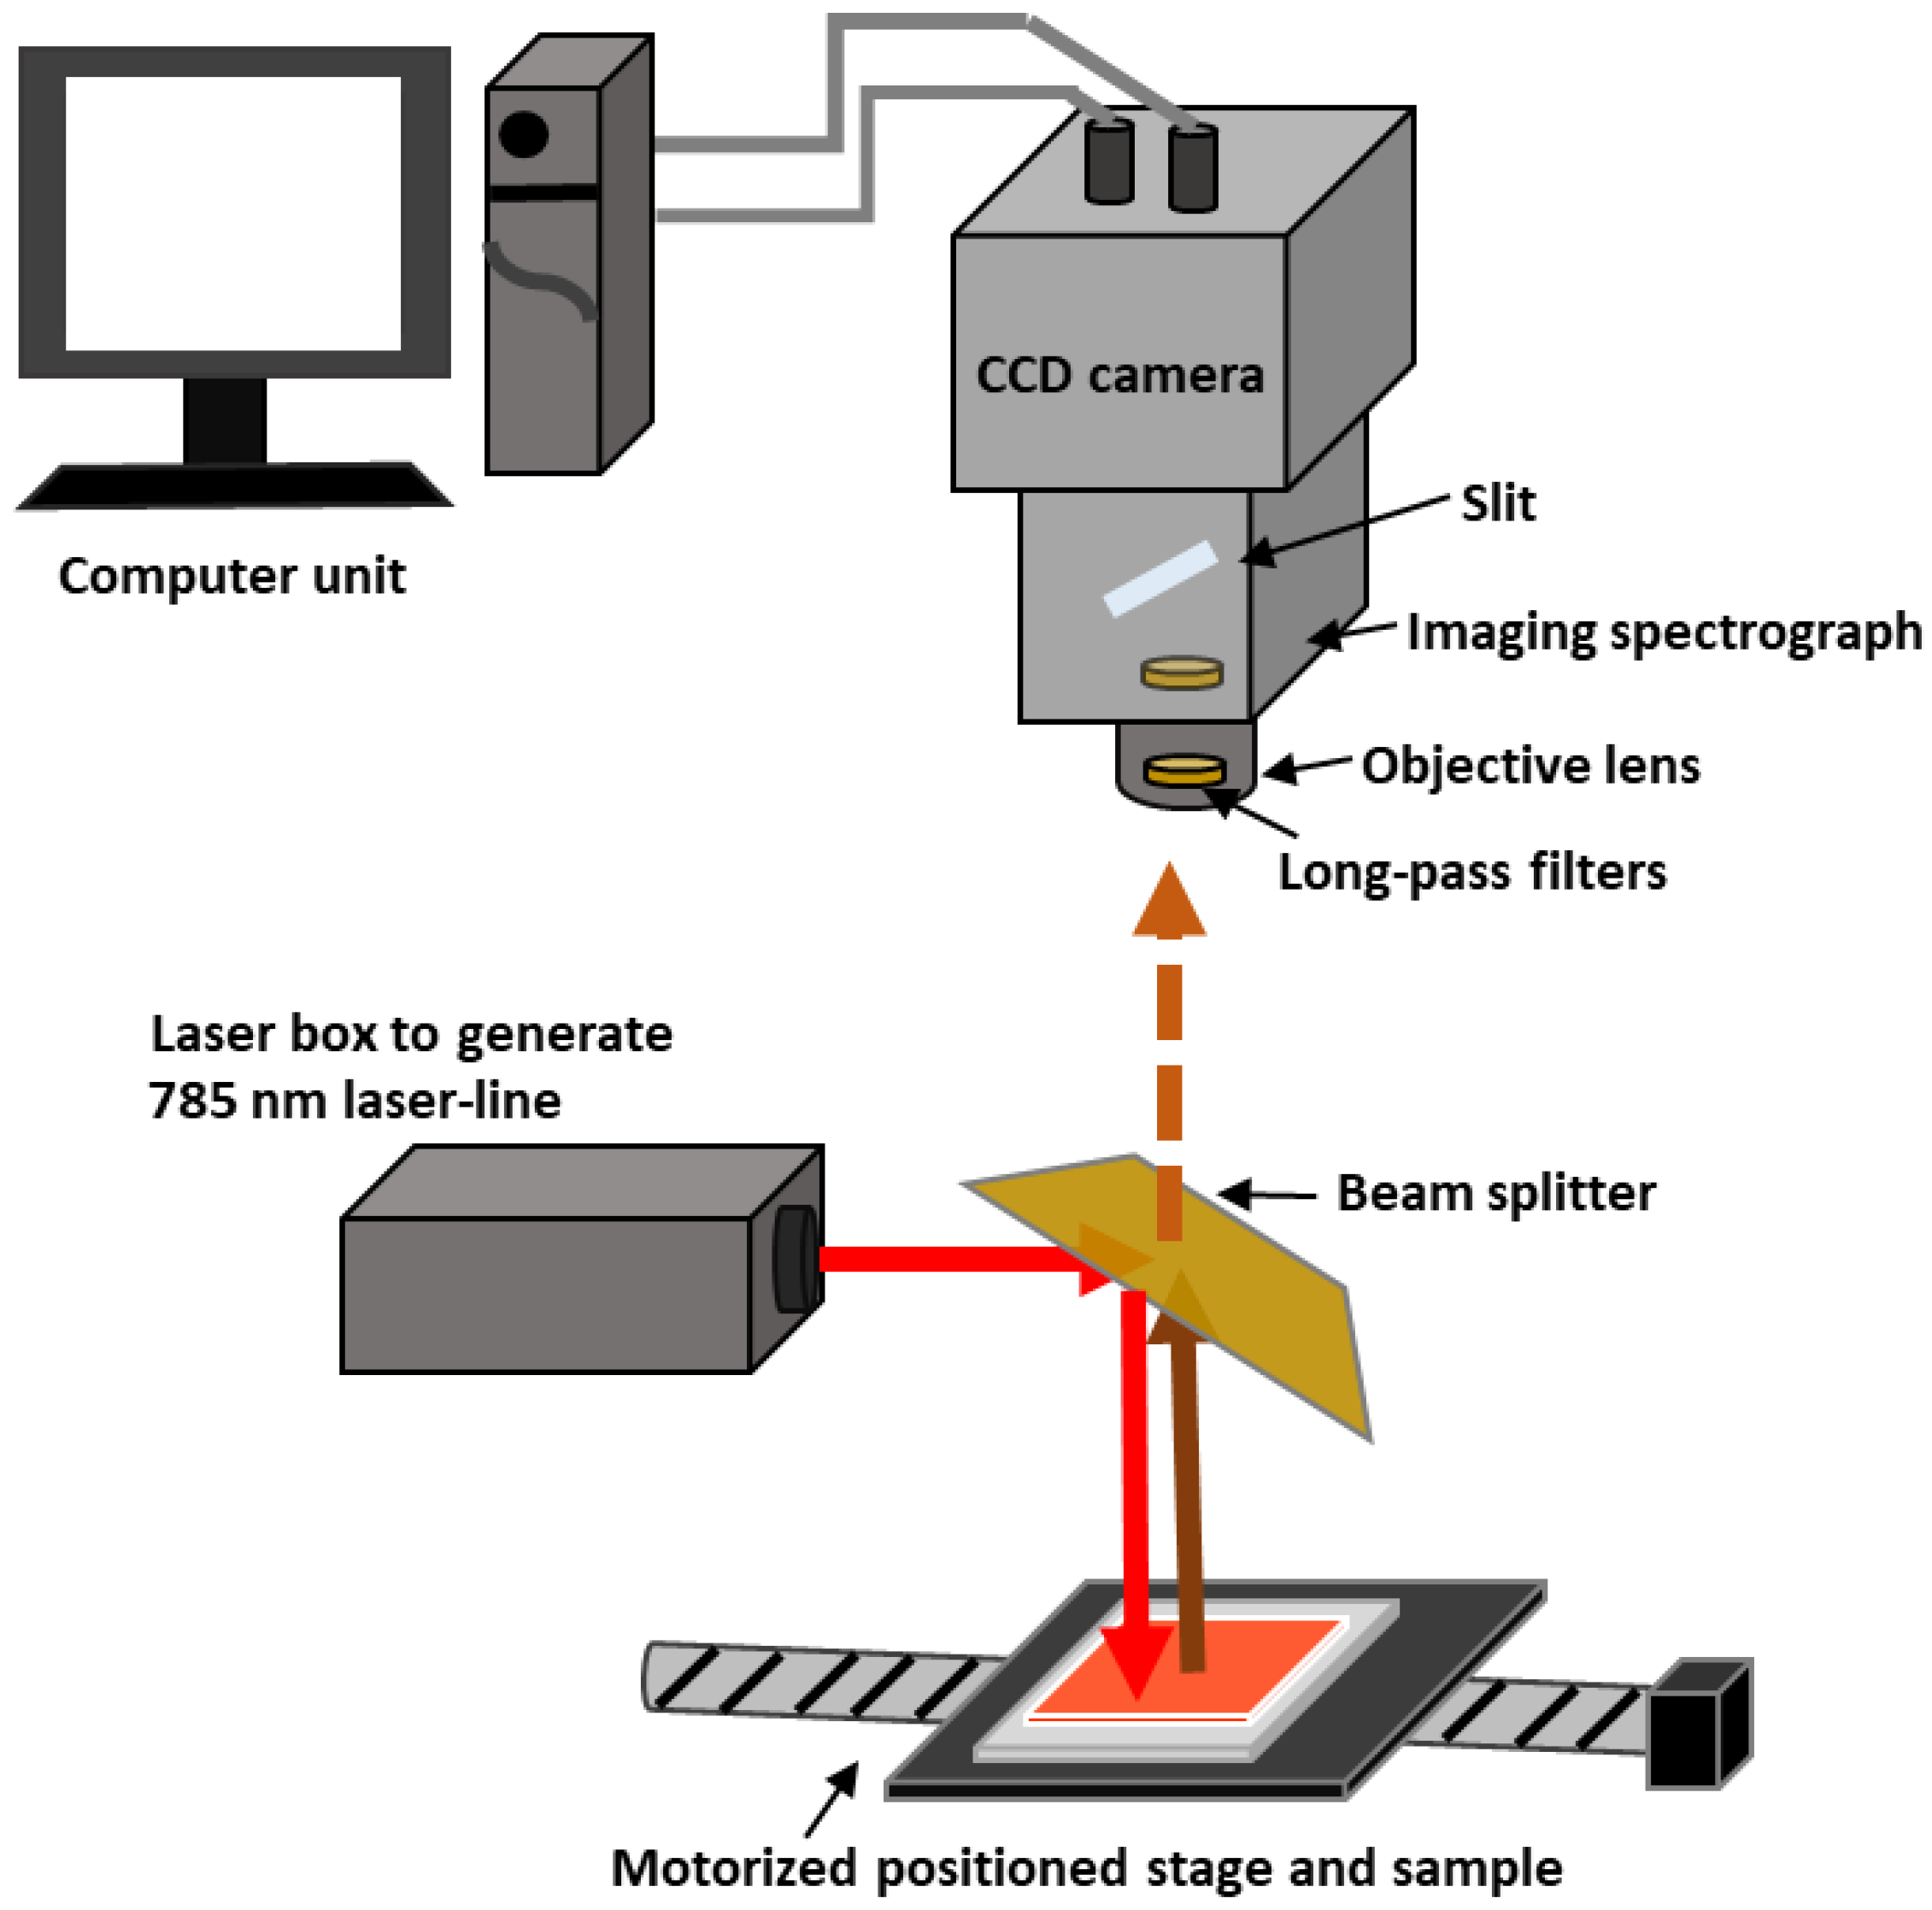
2.2. Instrumentation and Data Collection
2.3. Data Analysis
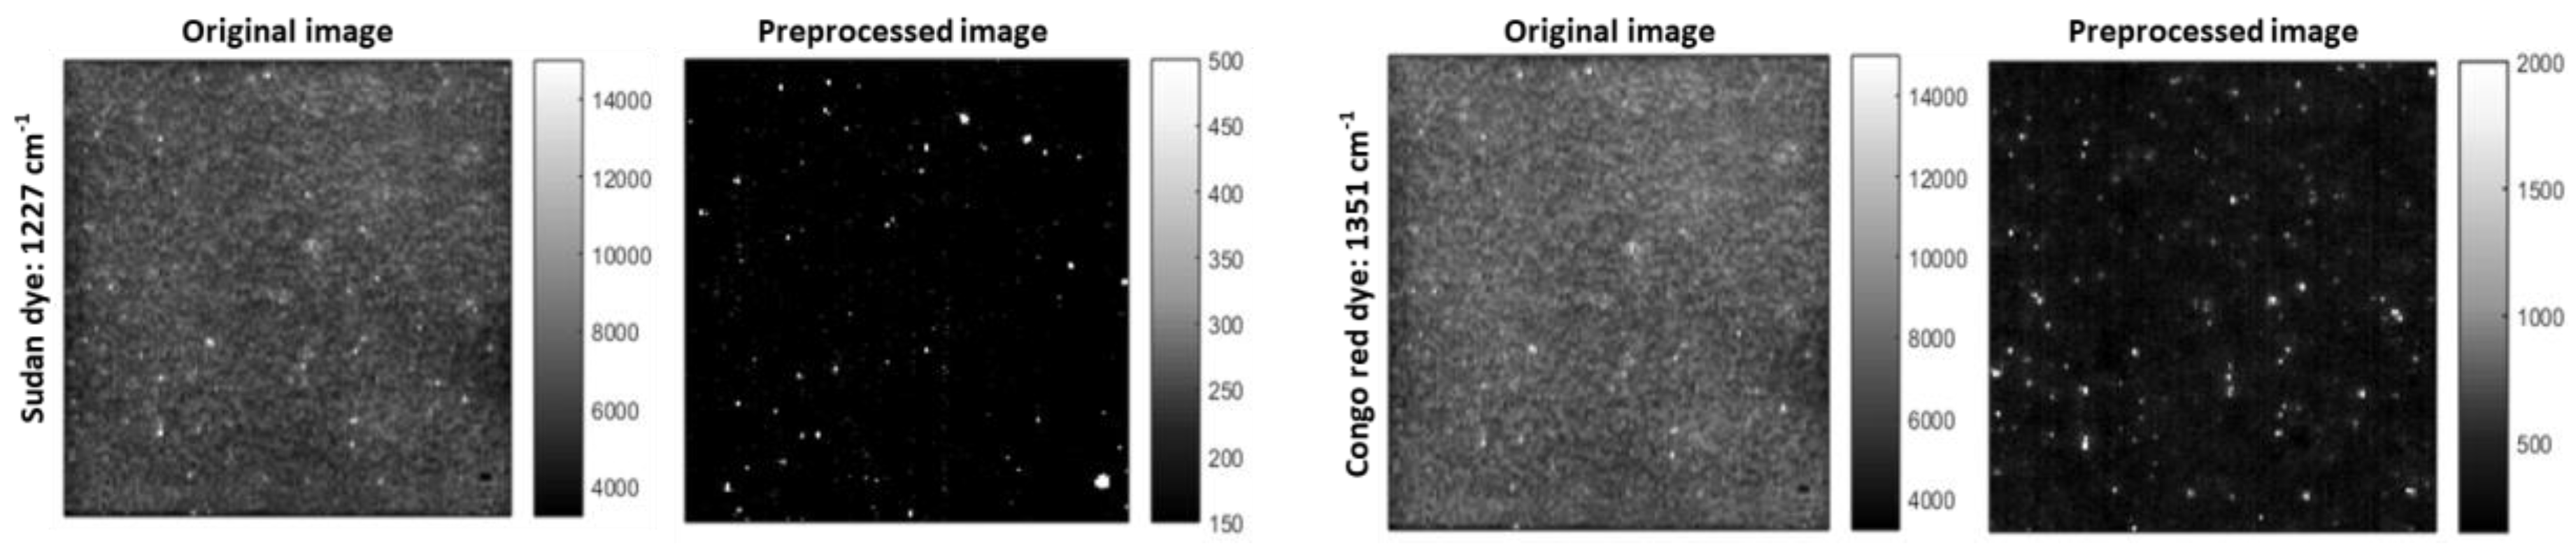
2.3.1. Preprocessing
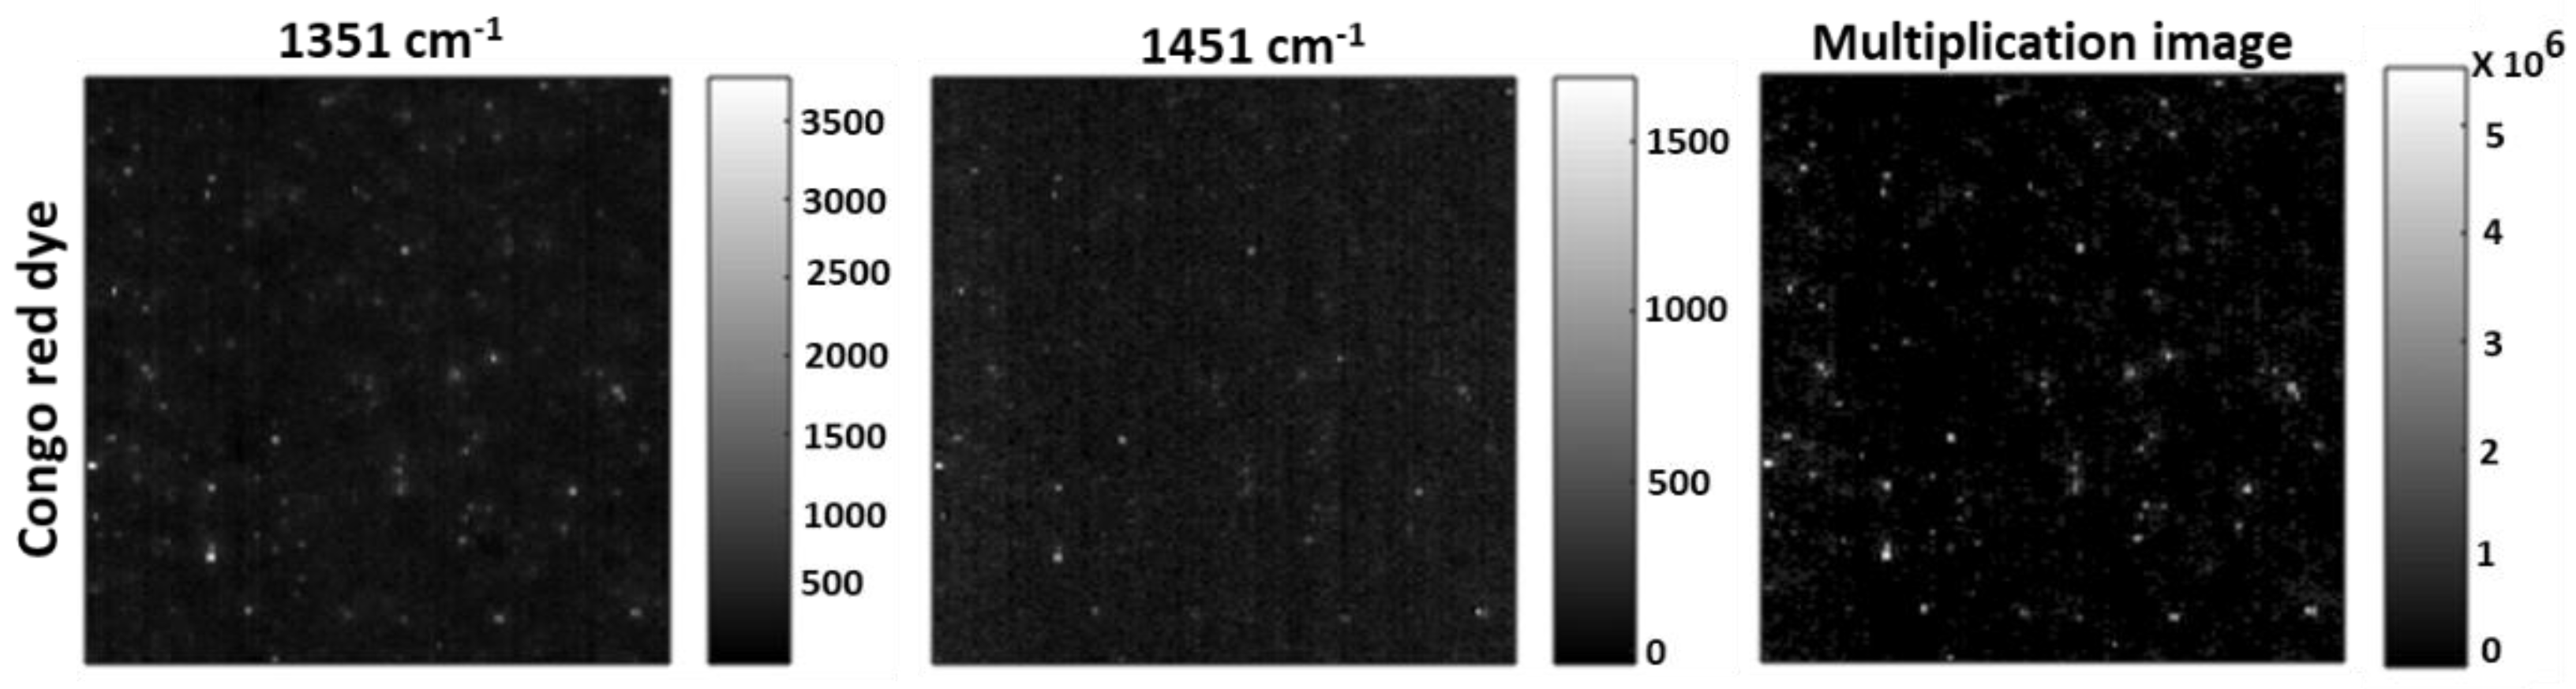
2.3.2. Univariate and Bivariate Analyses
2.3.3. Multivariate Analysis
3. Results and Discussion
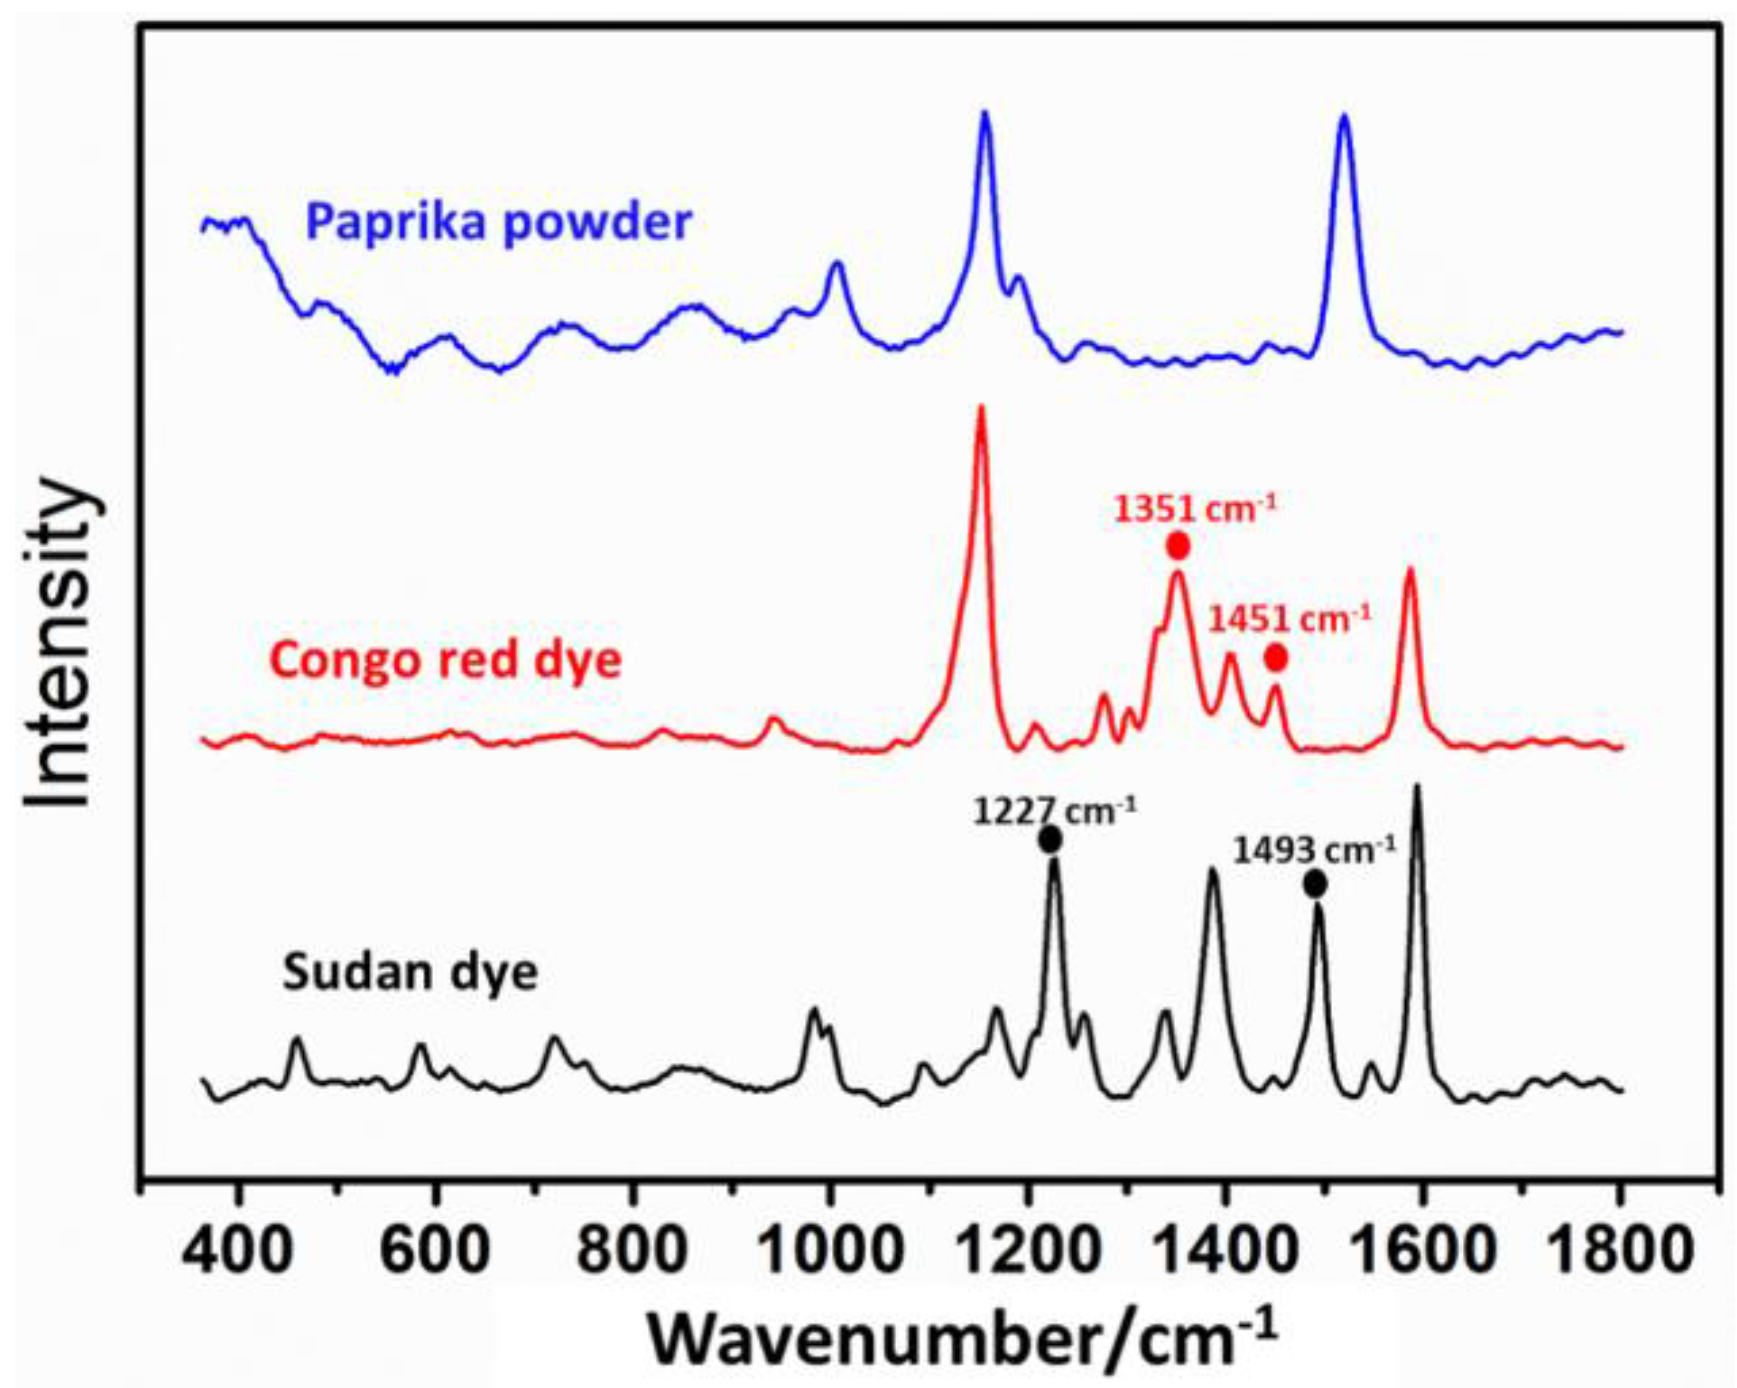
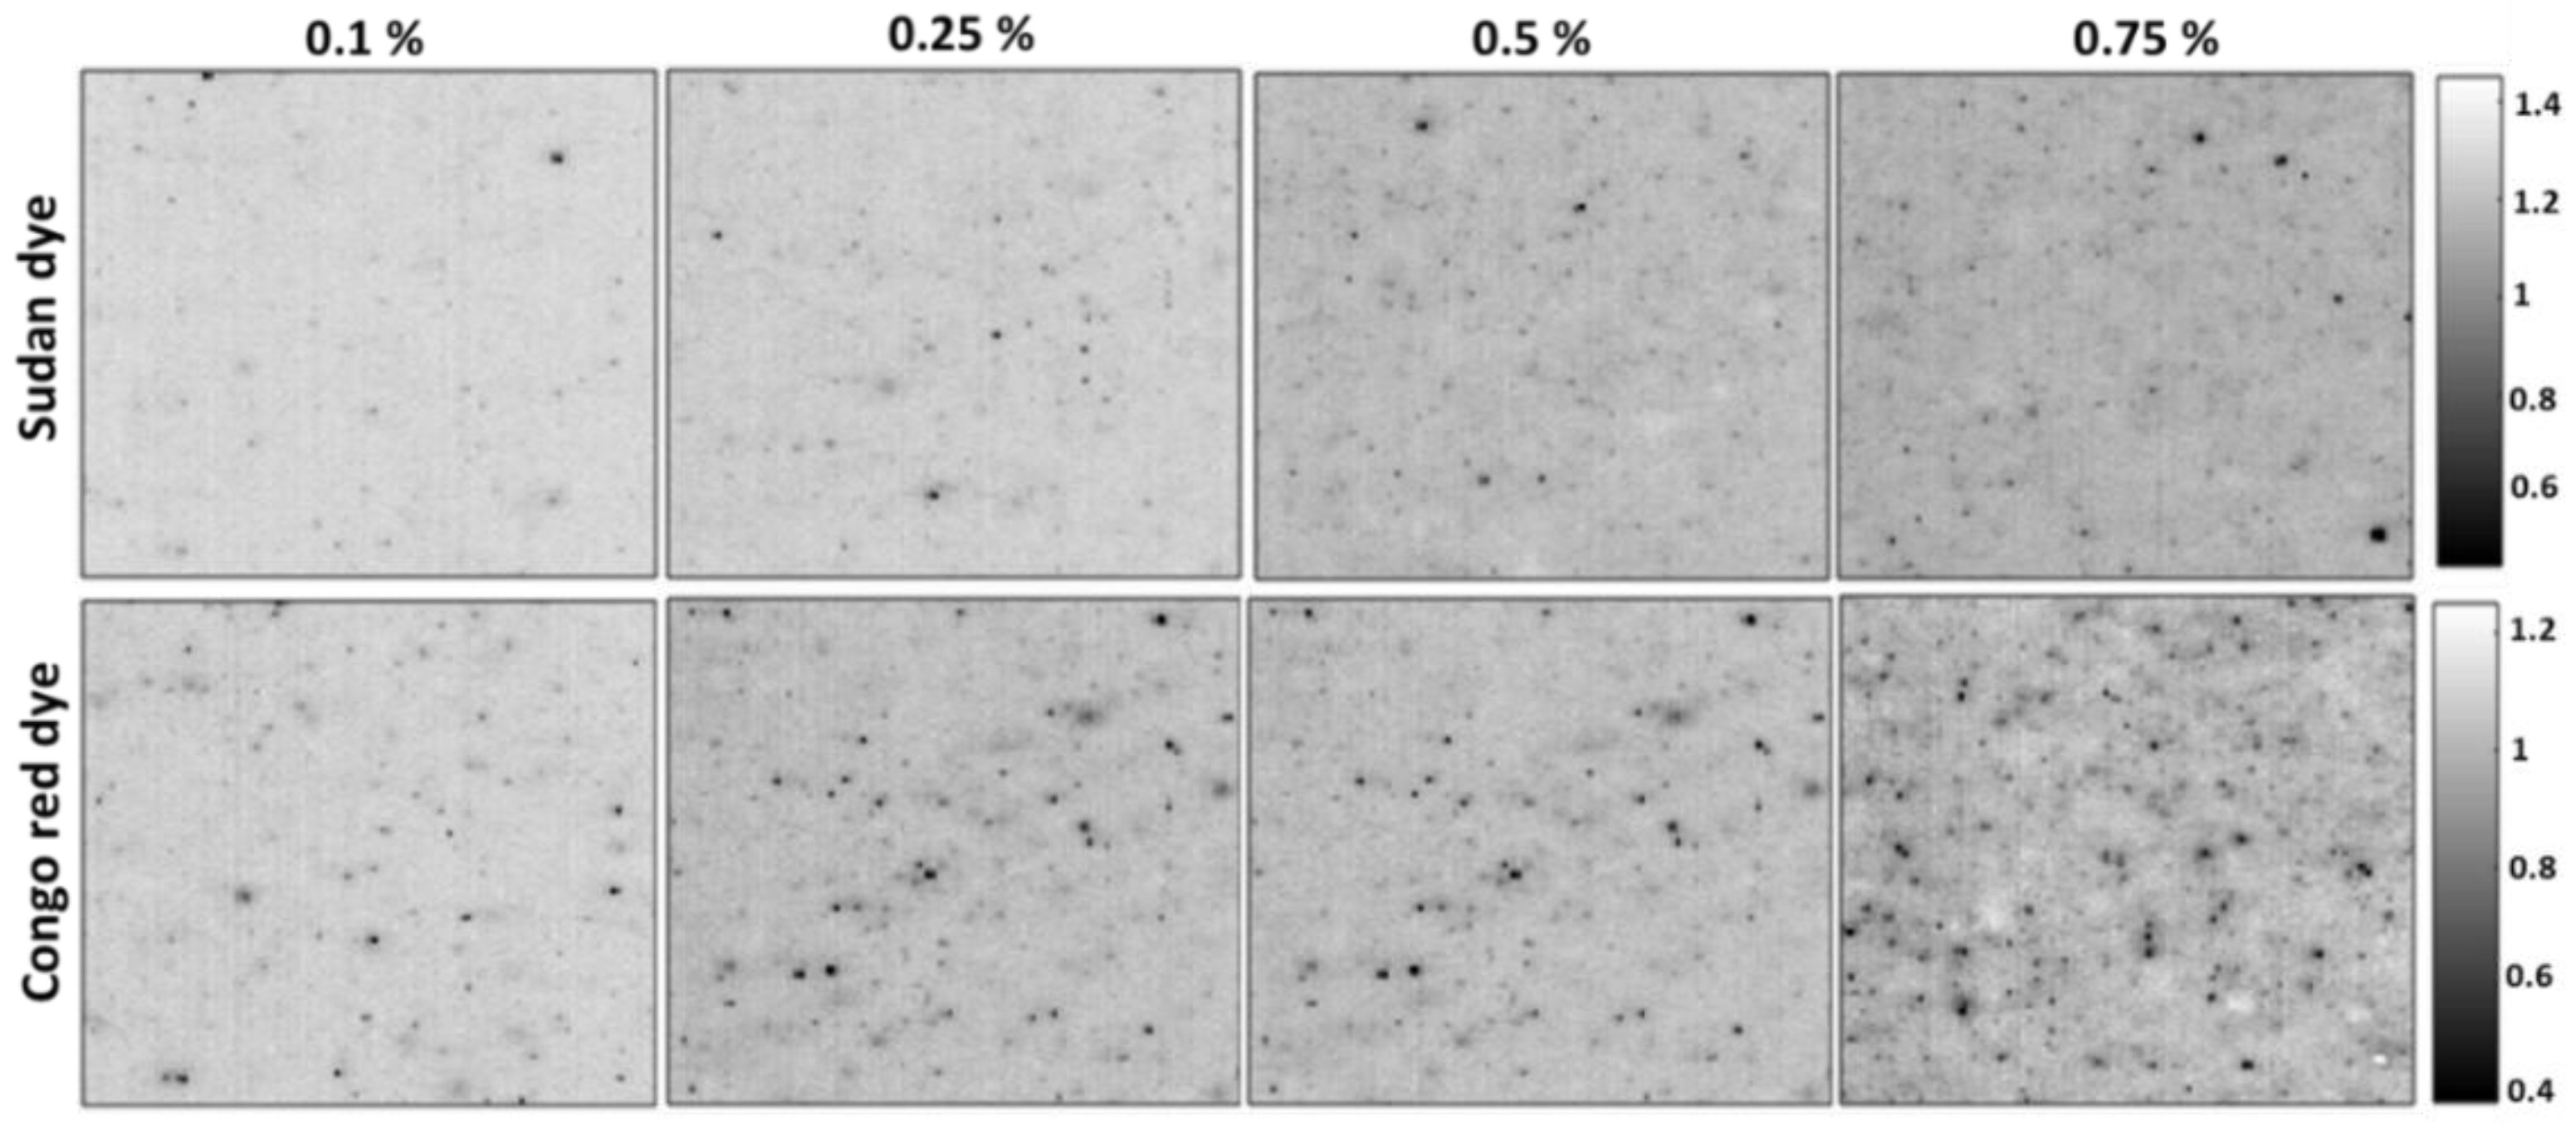
3.1. Raman Spectra and Image Processing
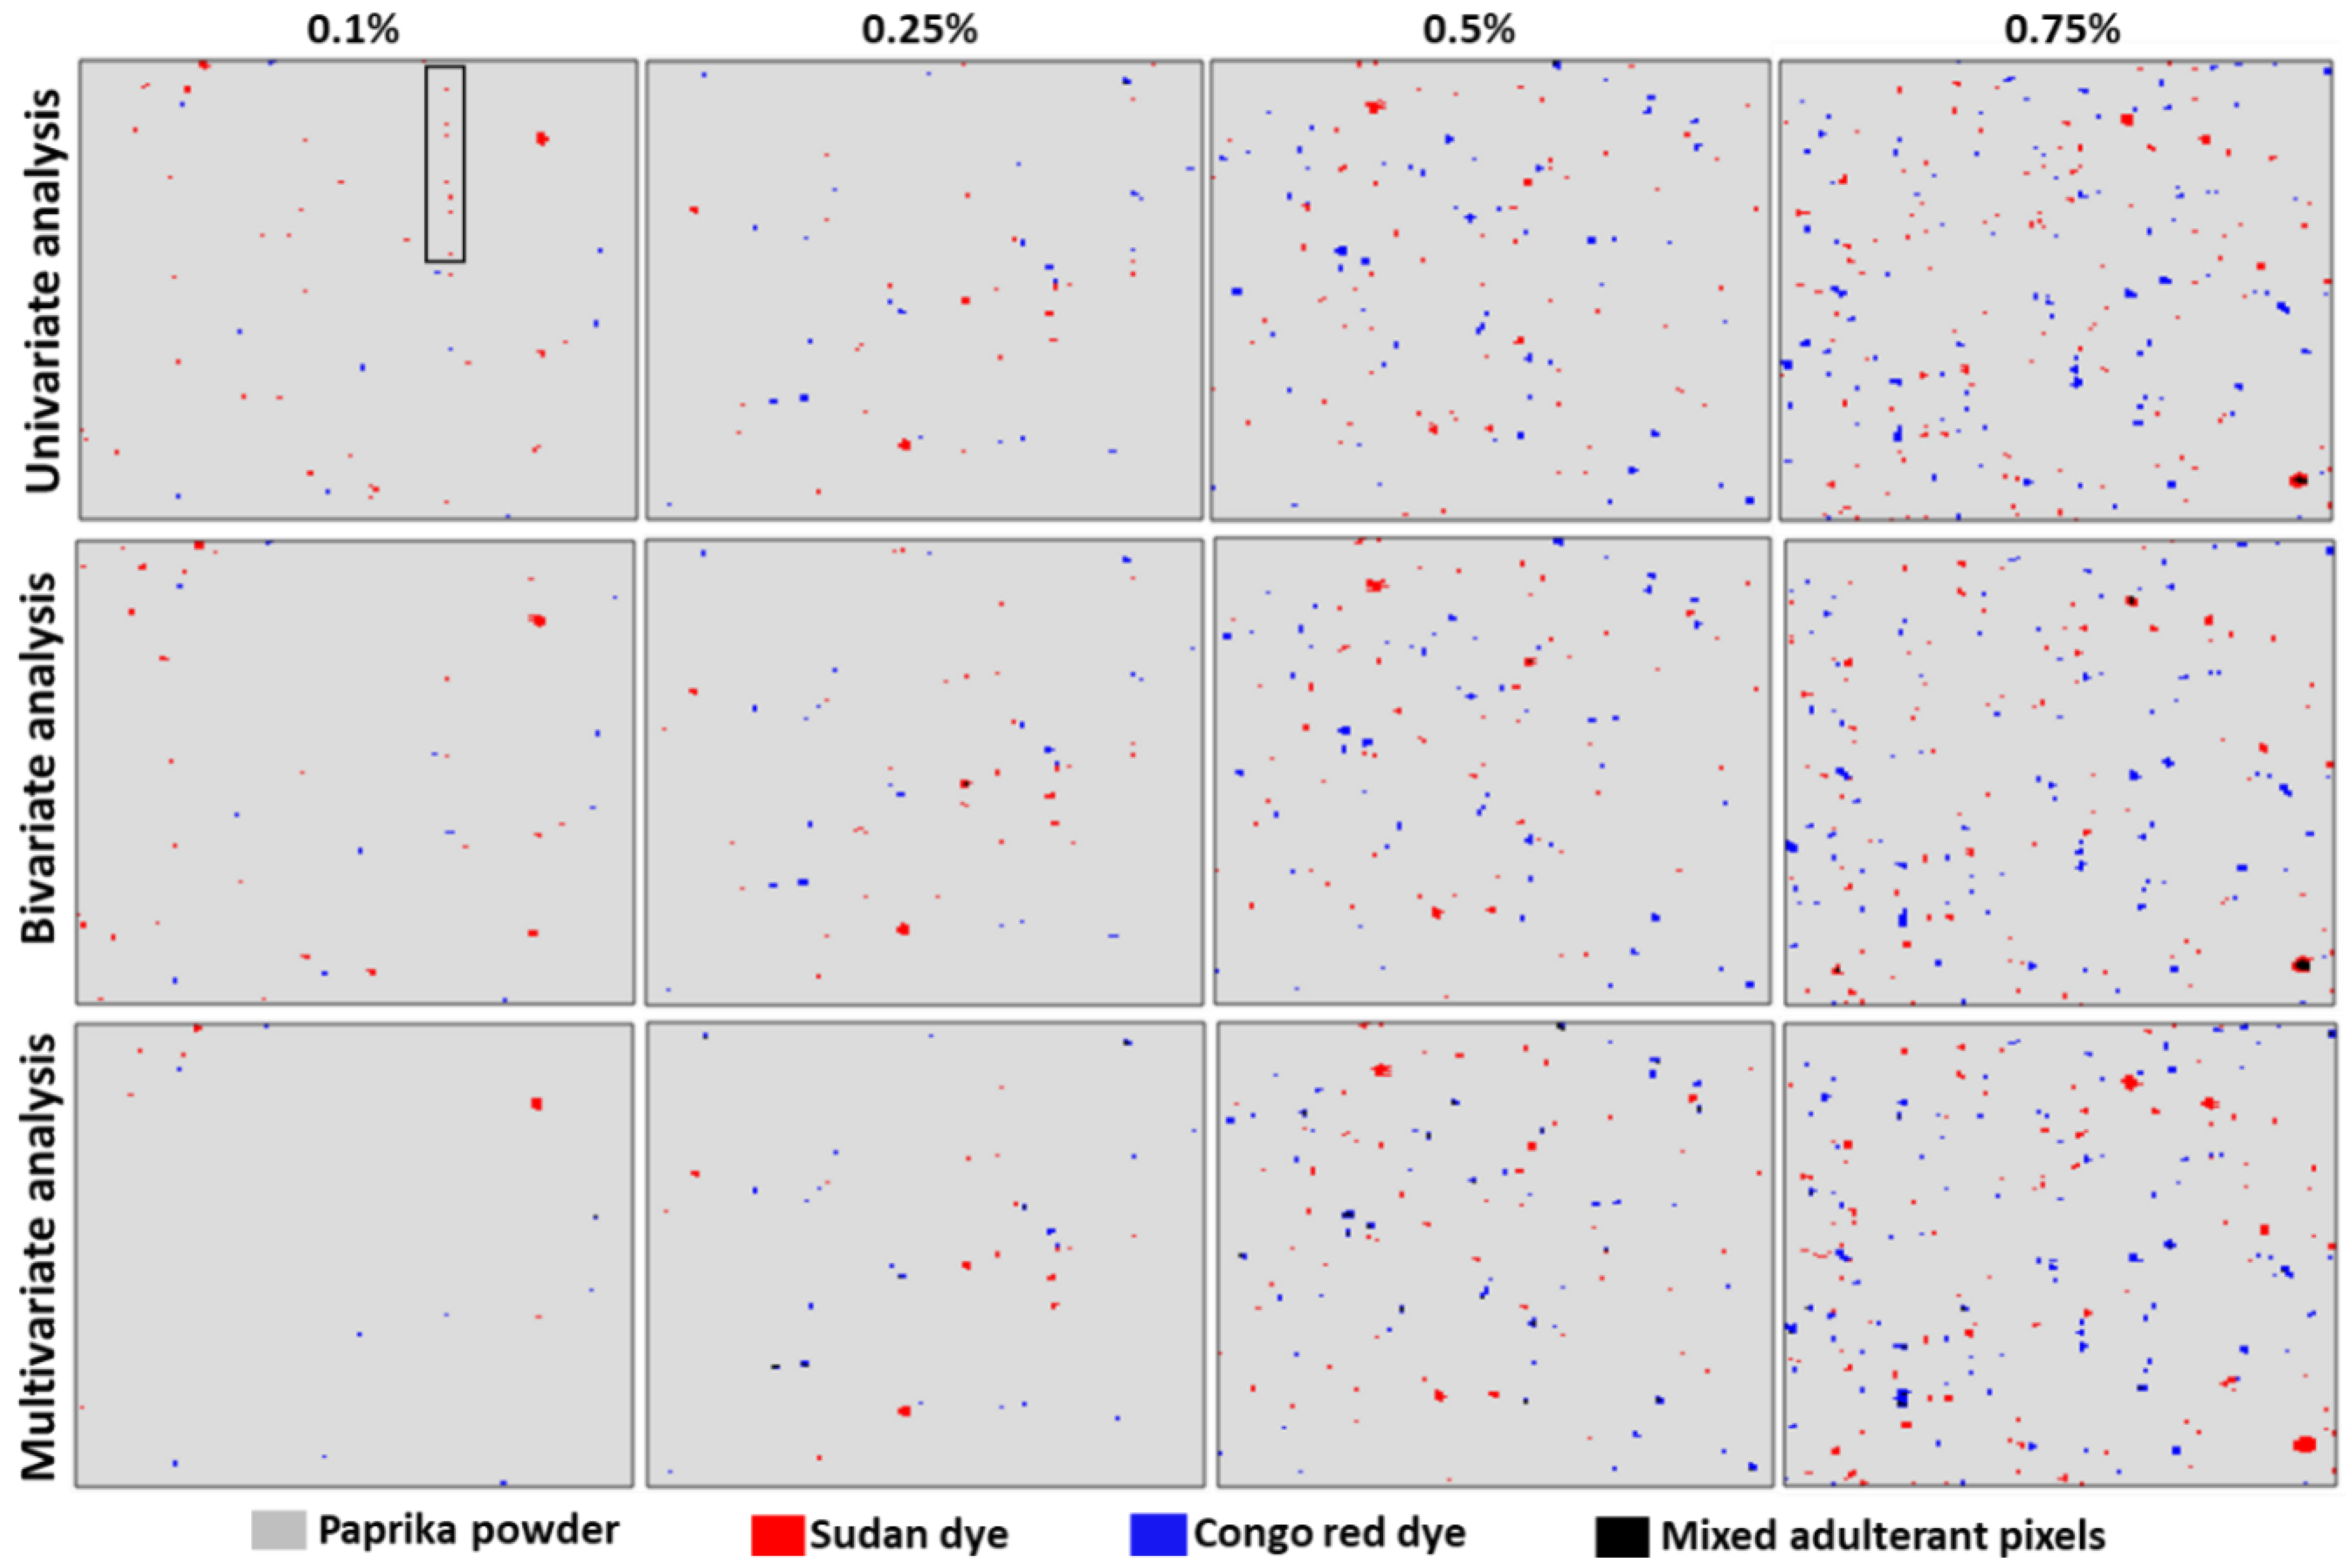
3.2. Univariate and Bivariate Analyses
3.3. Multivariate Analysis
3.4. Quantitative Analysis
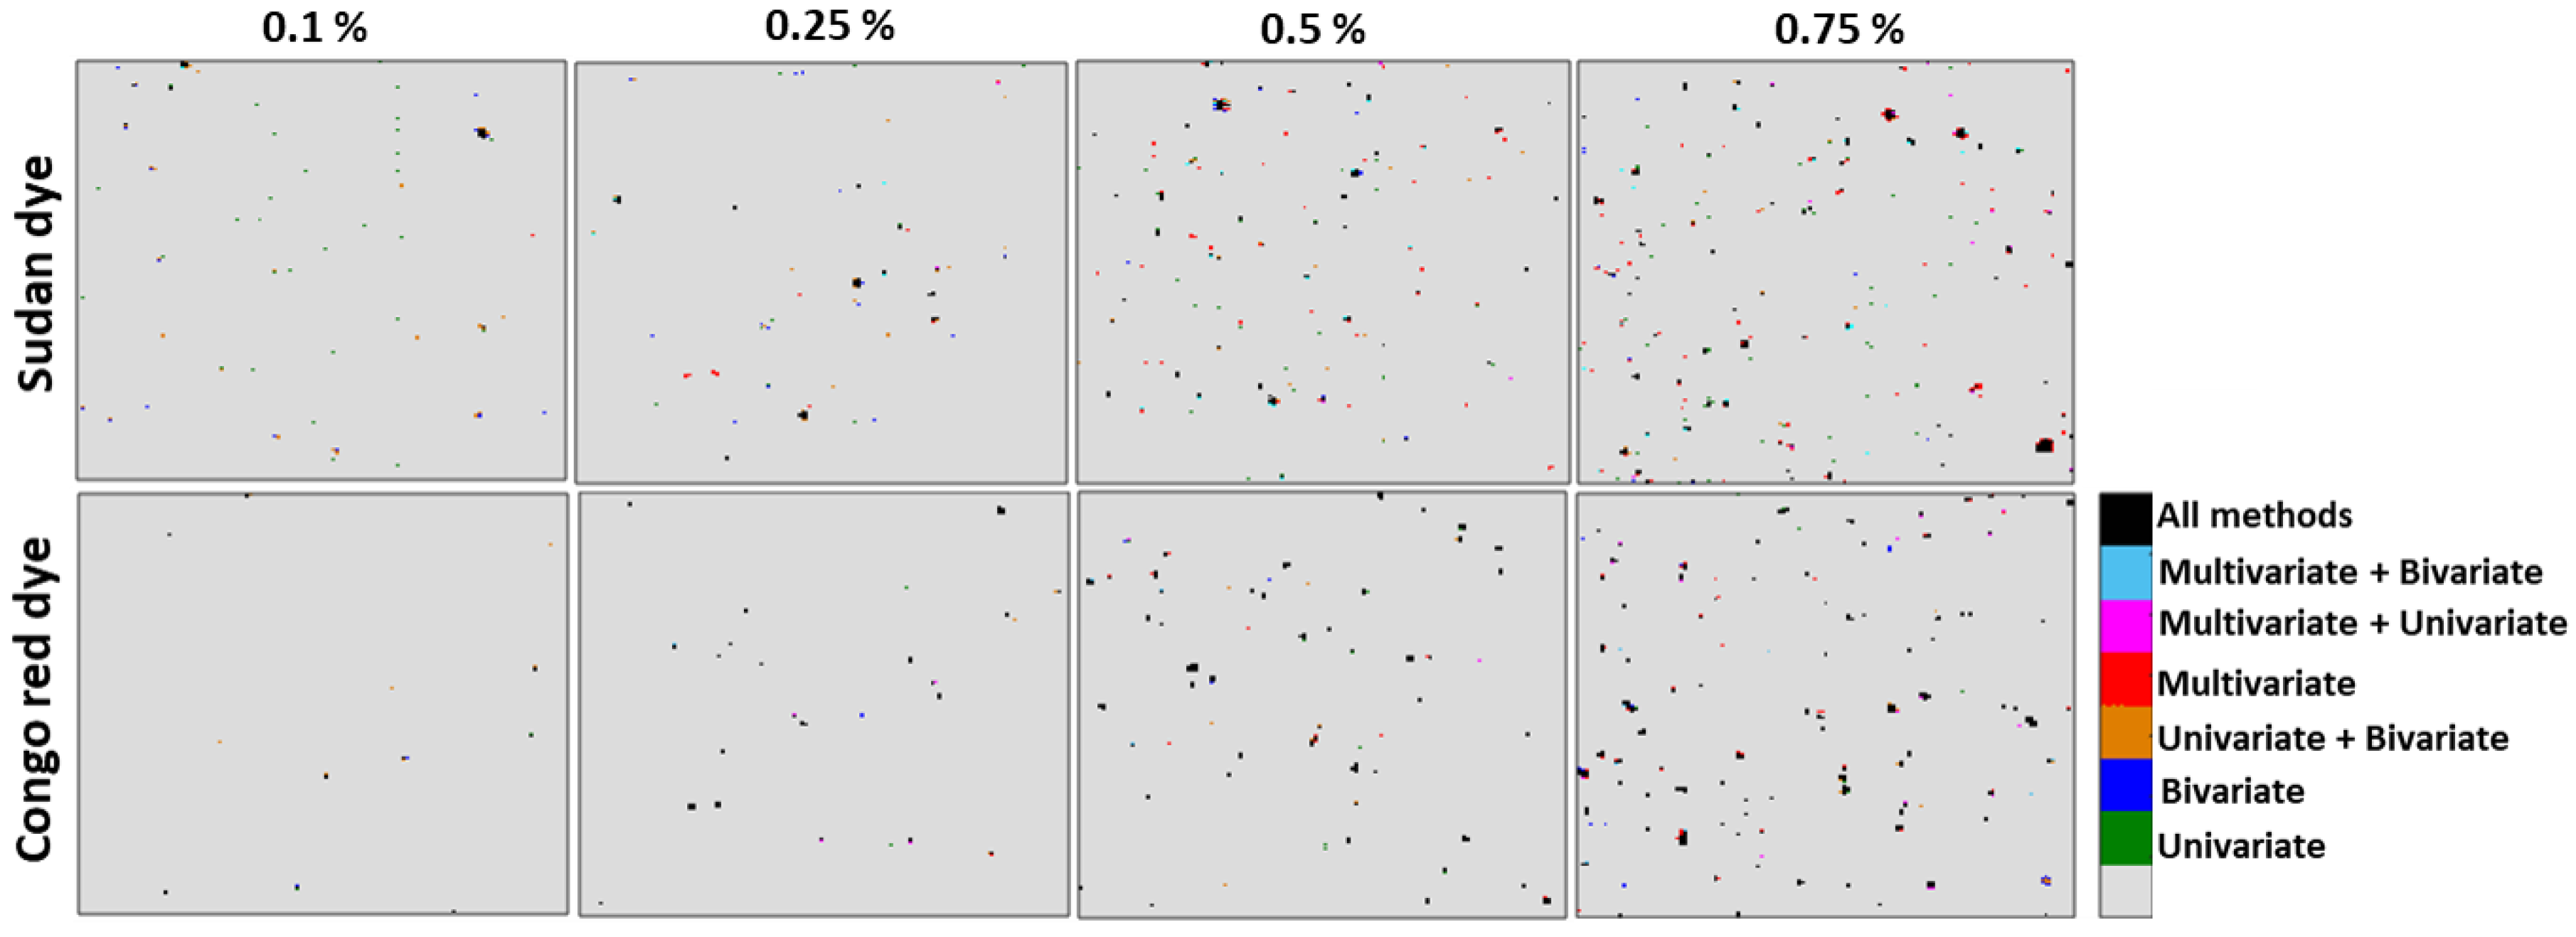
3.5. Comparision of Analysis Methods
4. Conclusions
Acknowledgments
Author Contributions
Conflicts of Interest
References
- Lohumi, S.; Kim, M.S.; Qin, J.; Cho, B.K. Raman imaging from microscopy to macroscopy: Quality and safety control of biological materials. Trends Anal. Chem. 2017, 93, 183–198. [Google Scholar] [CrossRef]
- Vajna, B.; Farkas, A.; Pataki, H.; Zsigmond, Z.; Igricz, T.; Marosi, G. Testing the performance of pure spectrum resolution from Raman hyperspectral images of differently manufactured pharmaceutical tablets. Anal. Chem. Acta 2012, 712, 45–55. [Google Scholar] [CrossRef] [PubMed]
- Matlas, D.D.; McCann, R.; Wang, P.; Pinal, R.; Romanach, R.; Amotz, D.B. Pharmaceutical application of fast Raman hyperspectral imaging with comprehensive detection strategy. J. Pharm. Innov. 2014, 9, 1–4. [Google Scholar]
- Qin, J.; Kim, M.S.; Cho, B.K. Raman chemical imaging technology for food and agricultural application. J. Biosyst. Eng. 2017, 42, 170–189. [Google Scholar]
- Qin, J.; Chao, K.; Cho, B.K.; Peng, Y.; Kim, M.S. High-throughput Raman chemical imaging for rapid evaluation of food safety and quality. ASABE 2010, 57, 1783–1792. [Google Scholar]
- Mo, C.; Lim, J.; Kwan, S.W.; Lim, D.K.; Kim, M.S.; Kim, G.; Kang, J.; Kwon, K.D.; Cho, B.K. Hyperspectral imaging and partial least square discriminant analysis for geographical origin discrimination of white rice. J. Biosyst. Eng. 2017, 42, 293–300. [Google Scholar]
- Sasic, S.; Clark, D.A.; Mitchell, J.C.; Snowden, M.J. A comparison of Raman chemical images produced by univariate and multivariate data processing—A simulation with an example from pharmaceutical practice. Analyst 2004, 129, 1001–1007. [Google Scholar] [CrossRef]
- Larmour, I.A.; Faulds, K.; Graham, D. Rapid Raman mapping for chocolate analysis. Anal. Methods 2010, 9, 1230–1232. [Google Scholar] [CrossRef]
- Dhakal, S.; Chao, K.; Qin, J.; Kim, M.S.; Chan, D. Raman spectral imaging for quantitative contamination evaluation in skim milk powder. J. Food Meas. Charact. 2016, 10, 374–386. [Google Scholar] [CrossRef]
- Qin, J.; Chao, K.; Kim, M.S.; Cho, B.K. Line-scan macro-scale Raman chemical imaging for authentication of powdered food and ingredients. Food Bioprocess Technol. 2016, 9, 113–123. [Google Scholar] [CrossRef]
- Wang, X.; Huang, W.; Zhao, C.; Wang, Q.; Liu, C.; Yang, G. Quantitative analysis of BPO in wheat flour via Raman hyperspectral imaging technology. Eur. Food Res. Technol. 2017, 243, 2265–2273. [Google Scholar] [CrossRef]
- Lohumi, S.; Kamdpal, L.M.; Seo, Y.W.; Cho, B.K. Net analyte signal based quantitative detection of fusel oil in Korean alcoholic beverage using FT-NIR spectroscopy. J. Biosyst. Eng. 2016, 41, 208–220. [Google Scholar] [CrossRef]
- Bocklitz, T.W.; Guo, S.; Ryabchyknov, O.; Volger, N.; Popp, J. Raman based molecular imaging and analytics: A magnetic bullet for biomedical application!? Anal. Chem. 2016, 10, 374–386. [Google Scholar] [CrossRef] [PubMed]
- Qin, J.; Chao, K.; Kim, M.S. Simultaneous detection of multiple adulterants in dry milk using macro-scale Raman chemical imaging. Food Chem. 2013, 138, 998–1007. [Google Scholar] [CrossRef] [PubMed]
- Dhakal, S.; Qin, J.; Chao, K.; Kim, M.S.; Peng, Y.; Chan, D. Identification and evaluation of composition in food powder using point scan Raman spectral imaging. Appl. Sci. 2016, 7, 1. [Google Scholar] [CrossRef]
- Alebrahim, M.A.; Krafft, C.; Popp, J. Raman imaging to study structural and chemical features of dentin enamel junction. IOP Conf. Ser. Adv. Mater. 2015. [Google Scholar] [CrossRef]
- Saleem, N.; Umar, Z.N.; Khan, S.I. Survey on the use of synthetic food colors in food samples procured from different educational institutes of Karachi city. J. Trop. Life Sci. 2013, 3, 1–7. [Google Scholar] [CrossRef]
- Lohumi, S.; Joshi, R.; Kandpal, L.M.; Lee, H.; Kim, M.S.; Cho, H.; Mo, C.; Seo, Y.W.; Rahman, A.; Cho, B.K. Quantitative analysis of Sudan dye adulterants in paprika powder using FTIR spectroscopy. Food Addit. Contam. Part A 2017. [Google Scholar] [CrossRef] [PubMed]
- Zhang, Z.; Chen, S.; Liang, Y. Baseline correction using adaptive iteratively reweighted penalized least squares. Analyst 2010, 135, 1138–1146. [Google Scholar] [CrossRef] [PubMed]
- Krude, F.A.; Lefkoff, A.B.; Boardman, J.W.; Heidebrecht, K.B.; Shapito, A.T.; Barloon, P.J.; Goetz, A.F.H. The spectral image processing system (SIPS)—Interactive visualization and analysis of imaging spectrometer data. Remote Sens. Environ. 1993, 44, 145–163. [Google Scholar]
- Lohumi, S.; Lee, S.; Lee, H.; Kim, M.S.; Lee, W.H.; Cho, B.K. Application of hyperspectral imaging for characterization of intramuscular fat distribution in beef samples. Infrared Phys. Technol. 2016, 74, 1–10. [Google Scholar] [CrossRef]
- Chen, C.; Fei, P.; Qinghua, C.; Dahai, X. Raman spectra of Sudan red dyes and the fluorescence background removal. In Proceedings of the 2010 4th International Conference on Bioinformatics and Biomedical Engineering (iCBBE), Chengdu, China, 1–20 June 2010; pp. 1–4. [Google Scholar]
- Sajid, J.; Elhaddaoui, A.; Turrell, S. Investigation of the binding of Congo red to amyloid in Alzheimer’s diseased tissue. J. Mol. Struct. 1997, 408, 181–184. [Google Scholar] [CrossRef]
- Iconomidou, V.A.; Chryssikos, G.D.; Gionis, V.; Hoenger, A.; Hamodrakas, S.J. FT-Raman spectroscopy as diagnostic tool of Congo red binding to amyloids. Biopolymers 2003, 72, 185–192. [Google Scholar] [CrossRef] [PubMed]


| Univariate Analysis | Bivariate Analysis | Multivariate Analysis | |||||
|---|---|---|---|---|---|---|---|
| Sample | Added value (%) | Detected Sudan dye (%) | Detected Congo red (%) | Detected Sudan dye (%) | Detected Congo red (%) | Detected Sudan dye (%) | Detected Congo red (%) |
| Mixture 1 | 0.1 | 0.183 | 0.071 | 0.168 | 0.069 | 0.062 | 0.054 |
| Mixture 2 | 0.25 | 0.26 | 0.217 | 0.279 | 0.21 | 0.225 | 0.212 |
| Mixture 3 | 0.5 | 0.487 | 0.52 | 0.485 | 0.504 | 0.58 | 0.502 |
| Mixture 4 | 0.75 | 0.889 | 1.06 | 0.789 | 1.04 | 1.11 | 1.15 |
© 2018 by the authors. Licensee MDPI, Basel, Switzerland. This article is an open access article distributed under the terms and conditions of the Creative Commons Attribution (CC BY) license (http://creativecommons.org/licenses/by/4.0/).
Share and Cite
Lohumi, S.; Lee, H.; Kim, M.S.; Qin, J.; Cho, B.-K. Raman Imaging for the Detection of Adulterants in Paprika Powder: A Comparison of Data Analysis Methods. Appl. Sci. 2018, 8, 485. https://doi.org/10.3390/app8040485
Lohumi S, Lee H, Kim MS, Qin J, Cho B-K. Raman Imaging for the Detection of Adulterants in Paprika Powder: A Comparison of Data Analysis Methods. Applied Sciences. 2018; 8(4):485. https://doi.org/10.3390/app8040485
Chicago/Turabian StyleLohumi, Santosh, Hoonsoo Lee, Moon Sung Kim, Jianwei Qin, and Byoung-Kwan Cho. 2018. "Raman Imaging for the Detection of Adulterants in Paprika Powder: A Comparison of Data Analysis Methods" Applied Sciences 8, no. 4: 485. https://doi.org/10.3390/app8040485
APA StyleLohumi, S., Lee, H., Kim, M. S., Qin, J., & Cho, B.-K. (2018). Raman Imaging for the Detection of Adulterants in Paprika Powder: A Comparison of Data Analysis Methods. Applied Sciences, 8(4), 485. https://doi.org/10.3390/app8040485