Article

Non-Invasive Assessment of Hepatic Fibrosis by Elastic Measurement of Liver Using Magnetic Resonance Tagging Images

1
School of Computer and Electronic Information, Guangxi University, Nanning 530004, Guangxi, China
2
Department of Electrical, Electronic and Computer Engineering, Gifu University, Gifu 501-1193, Japan
3
Guangxi Key Laboratory of Multimedia Communications and Network Technology, Nanning 530004, Guangxi, China
*
Author to whom correspondence should be addressed.
Appl. Sci. 2018, 8(3), 437; https://doi.org/10.3390/app8030437
Submission received: 11 February 2018 / Revised: 4 March 2018 / Accepted: 7 March 2018 / Published: 14 March 2018
(This article belongs to the Special Issue Ultrasound Elastography)

Abstract

:
To date, the measurement of the stiffness of liver requires a special vibrational tool that limits its application in many hospitals. In this study, we developed a novel method for automatically assessing the elasticity of the liver without any use of contrast agents or mechanical devices. By calculating the non-rigid deformation of the liver from magnetic resonance (MR) tagging images, the stiffness was quantified as the displacement of grids on the liver image during a forced exhalation cycle. Our methods include two major processes: (1) quantification of the non-rigid deformation as the bending energy (BE) based on the thin-plate spline method in the spatial domain and (2) calculation of the difference in the power spectrum from the tagging images, by using fast Fourier transform in the frequency domain. By considering 34 cases (17 normal and 17 abnormal liver cases), a remarkable difference between the two groups was found by both methods. The elasticity of the liver was finally analyzed by combining the bending energy and power spectral features obtained through MR tagging images. The result showed that only one abnormal case was misclassified in our dataset, which implied our method for non-invasive assessment of liver fibrosis has the potential to reduce the traditional liver biopsy.

1. Introduction

Chronic liver disease is a worldwide health problem and increases the risk of hepatic complications such as hepatocellular carcinoma (HCC) and liver failure [1]. Cirrhosis of the liver is a late stage of progressive liver disease defined as structural distortion of the entire liver by fibrosis and parenchymal nodules. The assessment of cirrhosis and chronic hepatitis highly depends on the degree of hepatic fibrosis, which is regarded as an important predictive indicator of cirrhosis [2]. As HCC is one of the most common malignancies in patients affected by these diseases [3], early detection and accurate staging of cirrhosis is an important issue in practical radiology. Generally, fibrosis is interpreted on Computed Tomography (CT) or magnetic resonance imaging (MRI) images by referring to changes in hepatic morphology, texture pattern, and the degree of liver stiffness. Although there is no effective treatment for decompensate or advanced cirrhosis, appropriate treatment such as interferon therapy is sometimes beneficial for early cirrhosis associated with viral hepatitis because fibrosis is potentially a reversible process in the early stages.
Liver biopsy, which is an effective way of measuring changes in fibrosis staging, is regarded as the gold standard for assessing, by referring to the micrograph of a liver core needle biopsy, the severity of liver disease and monitoring treatment. However, it is an invasive procedure, and significant bleeding occurs in 1–2 out of 100 patients, and it is possible to cause pain in 30–40% of cases, pneumothorax (3‰), or even death (2/10,000) [4,5]. The accuracy may also be questioned because of side effects, punctured sampling, and interobserver variability in the determination of semiquantitative fibrosis scores [6,7,8]. In order to decrease the need of painful biopsies, non-invasive tests using MR and ultrasound modalities have been widely used with the development of high-speed imaging devices. Recently, radiological assessments of hepatic fibrosis by magnetic resonance elastography (MRE) [8,9,10], gadolinium- or superparamagnetic iron-oxide-enhanced MR imaging [11,12], diffusion-weighted MR imaging [13], and real-time ultrasonographic elastography [14] have been reported. Wang et al. [15] proposed a real-time elastography for diffuse histological lesions, showing a new and promising quantitative technology for assessing liver fibrosis in patients with chronic hepatitis B using a solography-based non-invasive method. Although such new imaging technologies have greatly impacted the traditional diagnostic methods, the interpretation of the numerous diseases from different types of medical images is a tough work, especially for the inexperienced residents or general radiologists. In the last decade, different types of computer-aided detection/diagnosis (CAD) systems have been developed to ease the workload of radiologists. Some CAD systems for quantitative assessment of liver fibrosis have been shown their promising results by analyzing morphology changes [16,17] and the texture pattern of fibrosis [18] on CT/MR images. Recently, the degree of stiffness has also been analyzed through MR elastography. Muthupillai et al. [8] first proposed the method of MRE by direct visualization of propagating acoustic strain waves, and Rouvière et al. [9] then proved its usefulness. However, both ultrasonographic elastography and the above-mentioned MRE methods require special equipment, which limits their application in many hospitals.
The fibrogenic change in stiffness of the liver from soft to hard indicates a change in the liver status from normal to chronic hepatitis, to cirrhosis, and even to liver cancer. However, obtaining the physical properties of the liver, such as tissue stiffness, is not possible with traditional MR imaging technology. We preliminarily reported a novel method to measure the liver elasticity using an MR device to measure hepatic deformation and attempted to quantify the stiffness of the liver with cine-tagging MR imaging at 3T and bending energy (BE) analysis for the evaluation of hepatic fibrosis [19]. In comparison with MRE or the ultrasound elastography method, our proposed method measures the stiffness of the liver by tracking the dynamic changes in the configuration of the grid pattern and analyzing the deformation of the liver only with the MR image, without using any additional physical vibration devices. Some studies have analyzed the movement of organs or tissue of the human body (such as the heart), and measurement of the stiffness of the internal organs using an MR tagging image [20,21,22,23,24], but there are no reports on the liver. Although our preliminary results showed a significant difference between normal and abnormal groups, there were some overlaps of stiffness in the normal and intermediate fibrosis stages, and the number of cases in the experiment was small. Furthermore, manual input of landmarks (LMs) for calculating the BE value on each grid was rather time-consuming. In this study, a power-spectrum-based method is proposed to improve the efficiency in distinguishing normal liver tissue from abnormal liver tissue quantitatively. A combination of processing in the frequency domain with that in the spatial domain is also discussed.

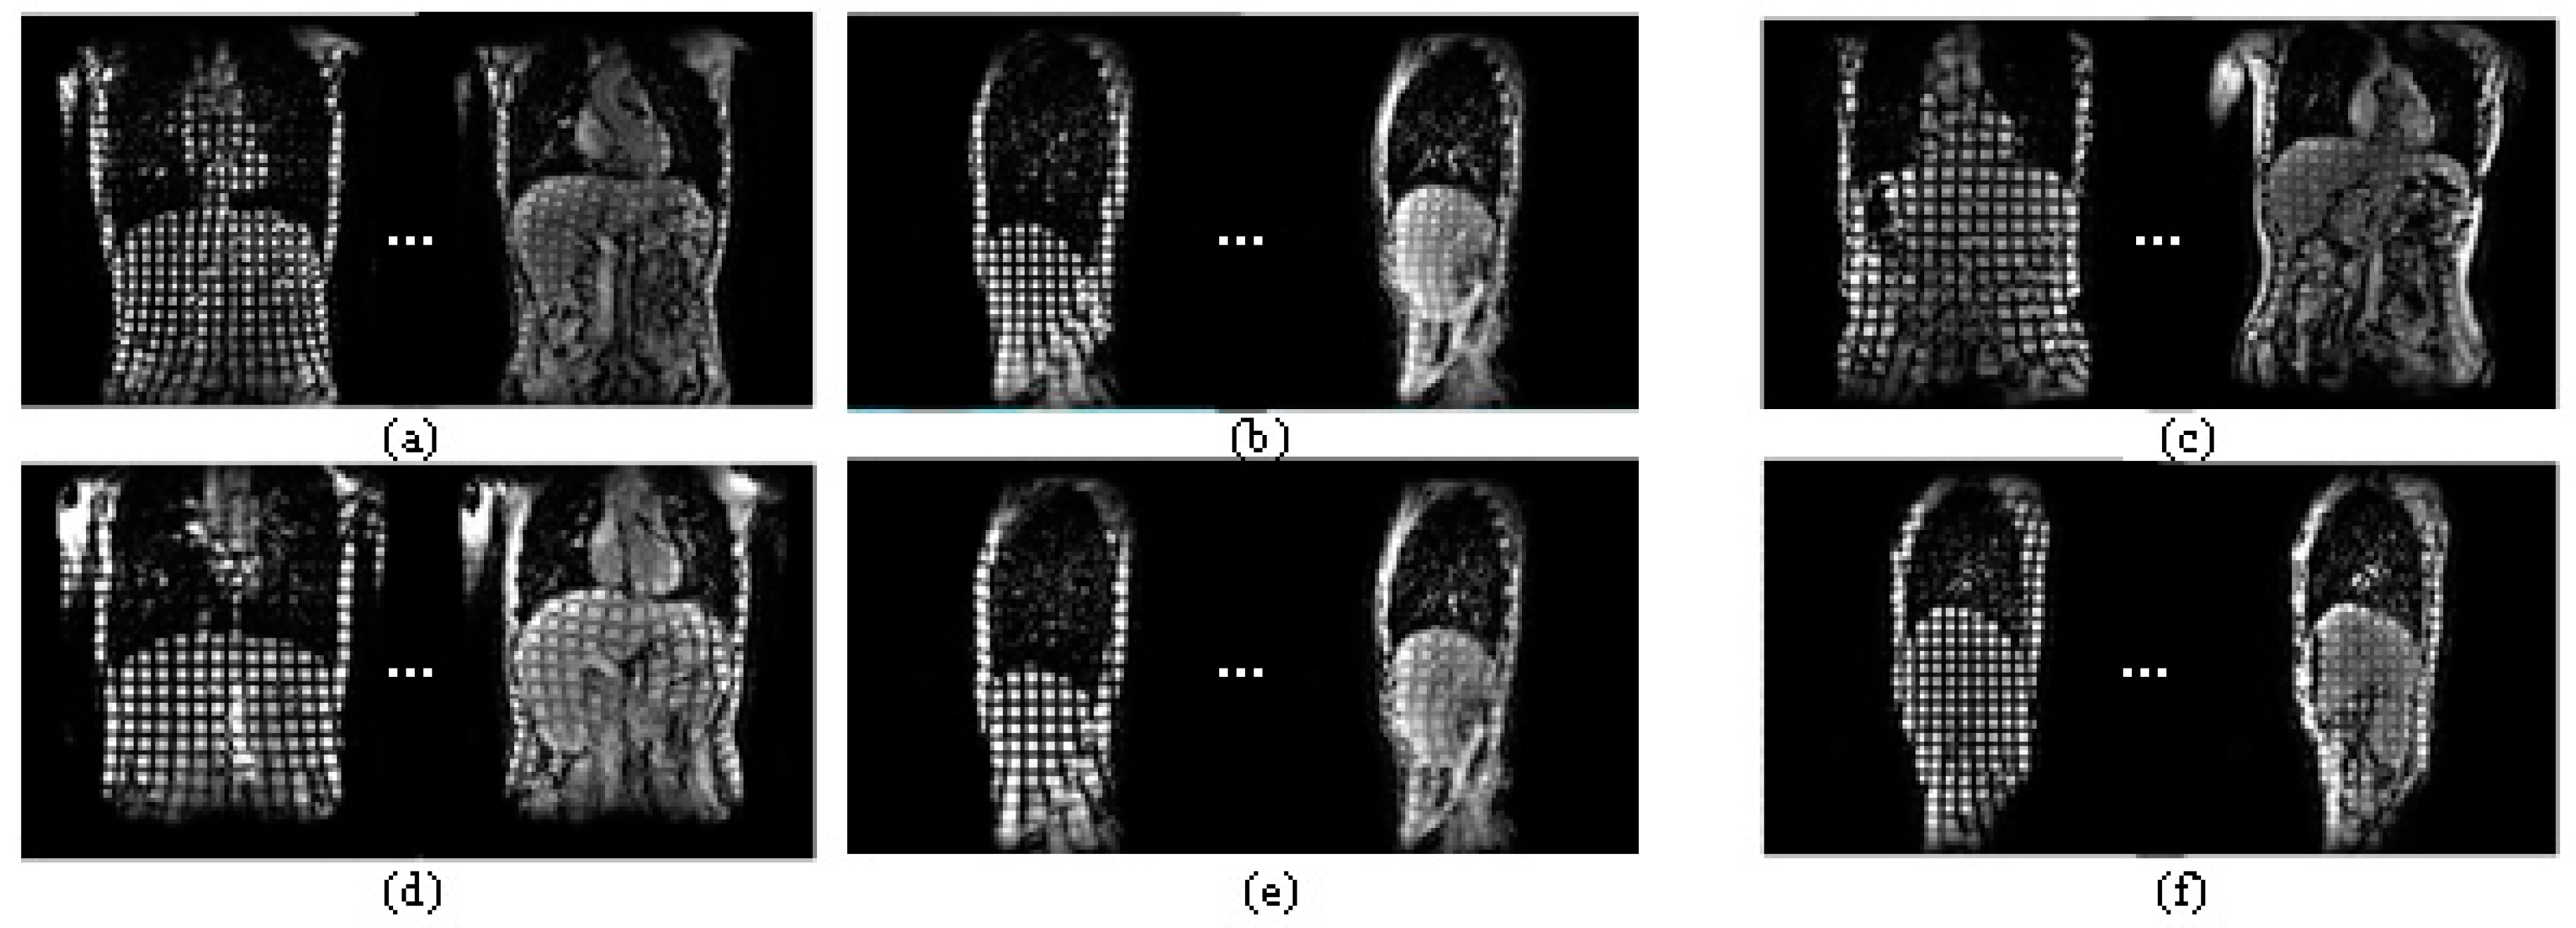
2. Experimental Materials

All MR images were scanned by a 3-T superconducting system (Intera Achieva Quasar Dual; Philips Medical Systems, Eindhoven, The Netherlands) with a six-channel torso array coil. A modified spatial modulation of magnetization (SPAMM) sequence with a train of non-selective radiofrequency (RF) pulses was employed [19], after which the single-section cine MR imaging with a two-dimensional (2D) single-shot turbo field-echo sequence (repetition time(TR)/echo time(TE), 2.2/1.0 ms; flip angle, 10°; field of view, 45 × 36 cm2; number of echo trains, 35; interpolated imaging matrix, 256 × 256; parallel imaging factor, 2; slice thickness, 10 mm; scan frequency, nine images per second) was conducted as shown in Figure 1. Cine-tagging grids with 12, 16, 20 and 24 mm stripe spacings were scanned separately in the sagittal and coronal imaging planes. We set the sagittal grids in the right hepatic lobe, so the sagittal plane did not include the heart or the porta hepatis, and the cross-sectional area of the liver was as large as possible; typically, the sagittal plane was set at the top of the right hemidiaphragm. On the other hand, we set the coronal grids in the liver, so the coronal plane included the right and left hepatic lobes as broadly as possible—typically at a ventral one-third of the entire anteroposterior dimension of the liver. MRI obtained by the cine-tagging method using the above parameters is defined as “MR tagging images” in this paper. MR tagging images used in this study were a set of sequenced images consisting of nine frames scanned per breathing cycle. It is obvious that tag grids appear clearest in the first frame (Frame 1) because it is generated at the time of inhalation, and the tag becomes gradually faded with progression to the last frame (Frame 9).
Thirty-four cases acquired from Gifu University Hospital in Japan were used in our experiment. This study was approved by the institutional review board at Gifu University, and informed consent was obtained from all patients. Out of the 34 cases, 17 were normal liver cases, and the other 17 were abnormal liver cases (6 chronic hepatitis cases and 11 liver cirrhosis cases).

3. Methods

The changing configuration of the grid pattern during forced exhalation reflects the local motion, rotation, deformation, or distortion of the liver parenchyma. The rigid transformation of tags only indicates the location of changes in the liver, not including any feature for warping measurement, which is correlated to the stiffness of the liver. Our methods for quantifying non-rigid deformation include two major processes: (1) calculation of the BE based on the thin-plate spline (TPS) method [25] in the spatial domain and (2) calculation of the difference in the power spectral values of the tags obtained by fast Fourier transform (FFT) in the frequency domain.

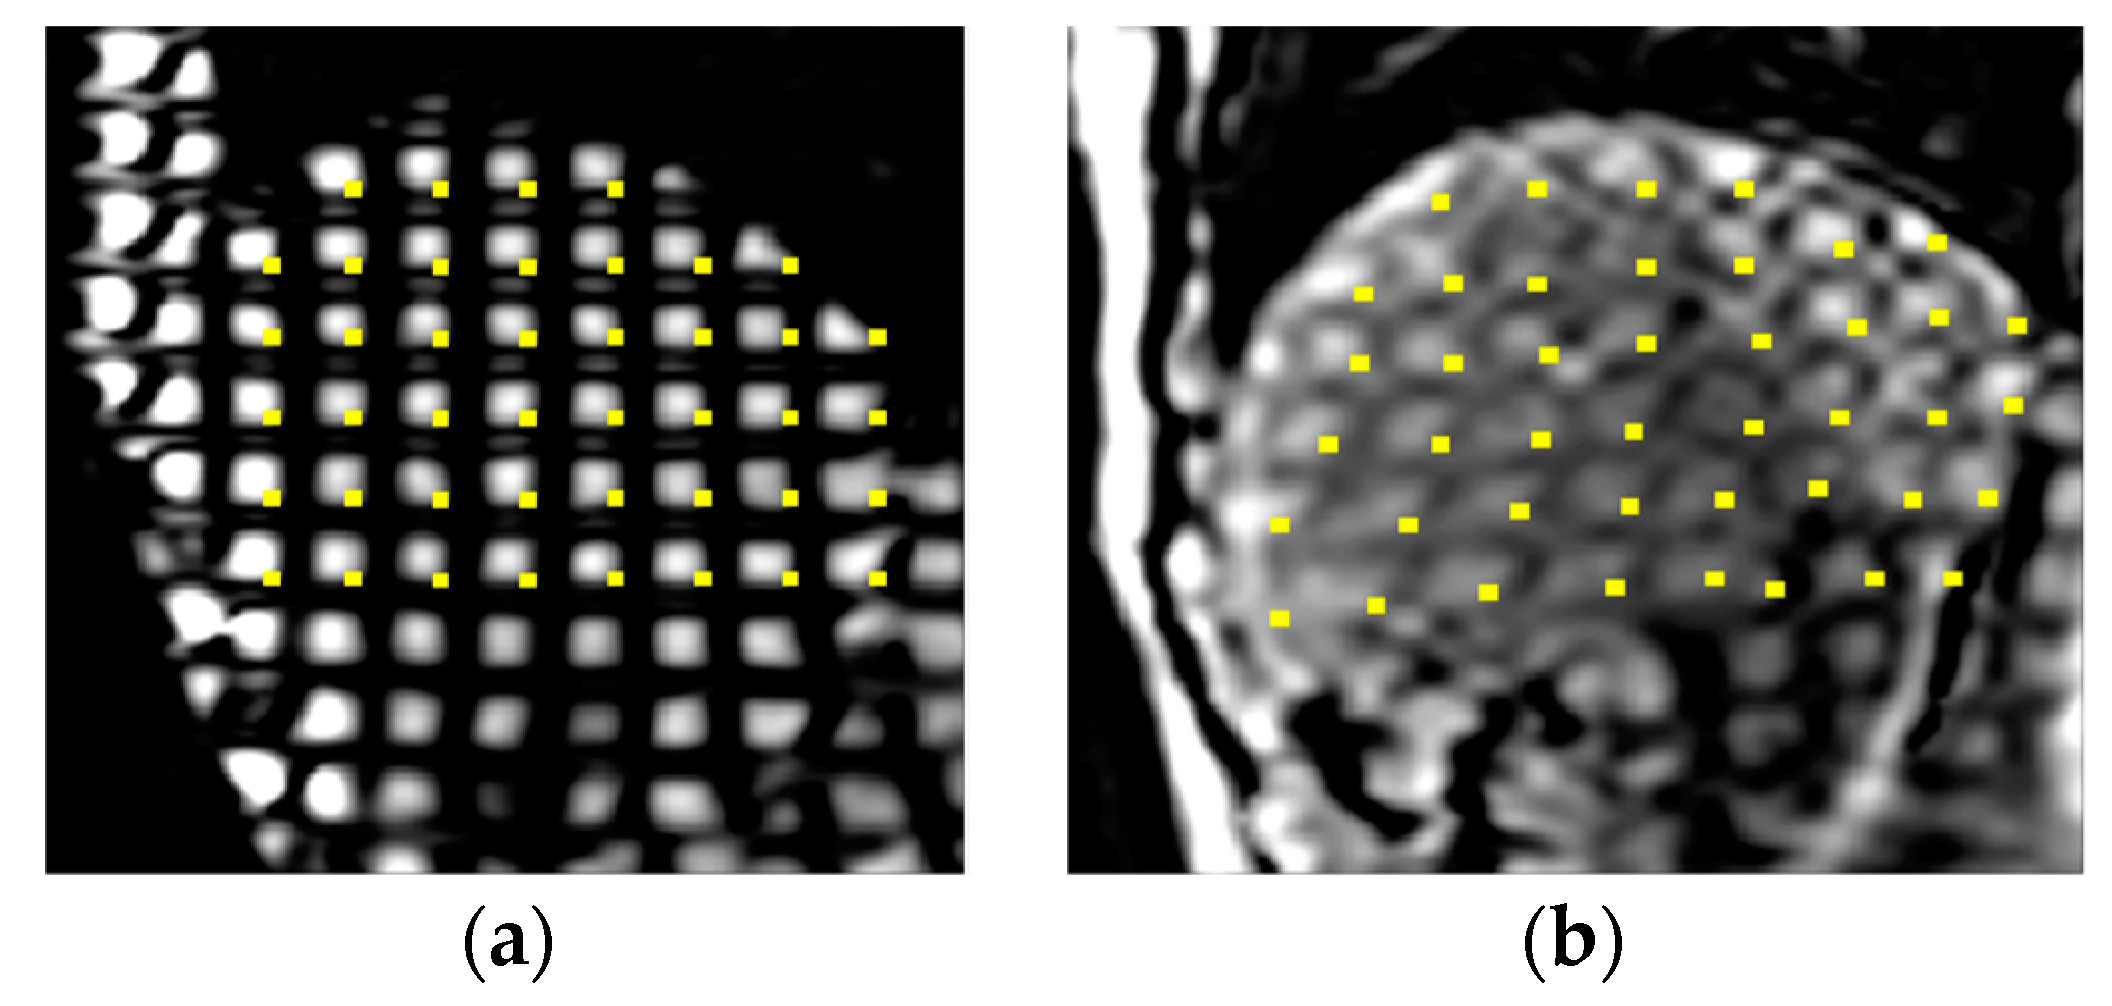
3.1. Calculation of Bending Energy Based on Thin-Plate Spline (TPS) Method in the Spatial Domain

The LMs indicated as yellow points in Figure 2 were placed by an experienced radiologist (W. H.) with three years of experience in MR imaging diagnosis of abdomens. Although this manual operation may be replaced by automatic methods, such as Hough transformation used in our preliminary research [26], we planned to use these gold standards in an ideal condition to accurately evaluate the performance of our methods. Figure 2 shows the coordinates of intersecting points of grids determined on (a) the first frame (before warping) and the corresponding points on (b) the last frame (after warping). The reason for setting an LM at the time of inhalation versus the time of expiration is that the difference in the strength of deformation between the normal liver and the abnormal liver conspicuously varies when the BE value is calculated when the volume of deformation of the liver is the largest. These coordinate values are processed to quantify the degree of distortion or deformation of the liver parenchyma.
We first applied a TPS-based method referring to a physical analogy involving the bending of a thin sheet of metal, which has been well recognized and used extensively in engineering, to calculate BE values within the liver region. The TPS-based method is widely used for image transformation [25], which requires the setting of the LMs on the image before transformation and the corresponding LM transformation image.
In this study, we first set a point ( x i , y i ) as an LM on the left of the intersection point of the tag at the first frame (Figure 2a) on the MR tagging image I ( x , y ) . Then, its corresponding LM is tracked as ( x i , y i ) at the ninth frame (Figure 2b). Here, 1 i n , n is the number of LMs; I ( x , y ) is an image after transformation with the TPS-based method by the mapping function f ( x , y ) = [ f x ( x , y ) , f y ( x , y ) ] , which maps each point ( x i , y i ) to its homolog ( x i , y i ) . To calculate the bending energy I f , the TPS fits the mapping function f(x, y) between corresponding point-sets by minimizing the following energy function:
E = R 2 ( ( 2 f x 2 ) 2 + 2 ( 2 f x y ) 2 + ( 2 f y 2 ) 2 ) d x d y .
There are many solutions for the function E(x, y), and the I f value is selected as the minimal value among these solutions, which satisfies the condition of dE = 0. The mapping function
f ( x , y ) = a 1 + a x x + a y y + i = 1 n w i U ( | ( x , y ) ( x i , y i ) | ) ,
minimizes the energy function in Equation (3), where U(r) can be defined as U ( r ) = | r | , r = | ( x , y ) ( x i , y i ) | is the distance between ( x i , y i ) and ( x i , y i ) , and a and w are the coefficients between I ( x , y ) and I ( x , y ) , calculated as follows:
[ w a ] = [ V 0 ] [ K P P T 0 ] 1 .
P, V, and K are minor determinants of L, where
P = [ 1 x 1 y 1 1 x 2 y 2 ... ... ... 1 x n y n ] , V = [ x 1 x 2 ... x n y 1 y 2 ... y n ] , K = [ 0 U ( r 12 ) ... U ( r 1 n ) U ( r 21 ) 0 ... U ( r 2 n ) ... ... ... ... U ( r n 1 ) U ( r n 2 ) ... 0 ]
and
L = [ K P P T O ] .
Based on the selected LMs on two images, the BE value of I f is finally calculated by
I f = V ( L n 1 K L n 1 ) V T .
Therefore, the bending energy calculated by Equation (6) is regarded as the value of the non-rigid deformation of the liver. Although the TPS method is a very traditional deformation method, the use of the BE value as a classification feature is rare.

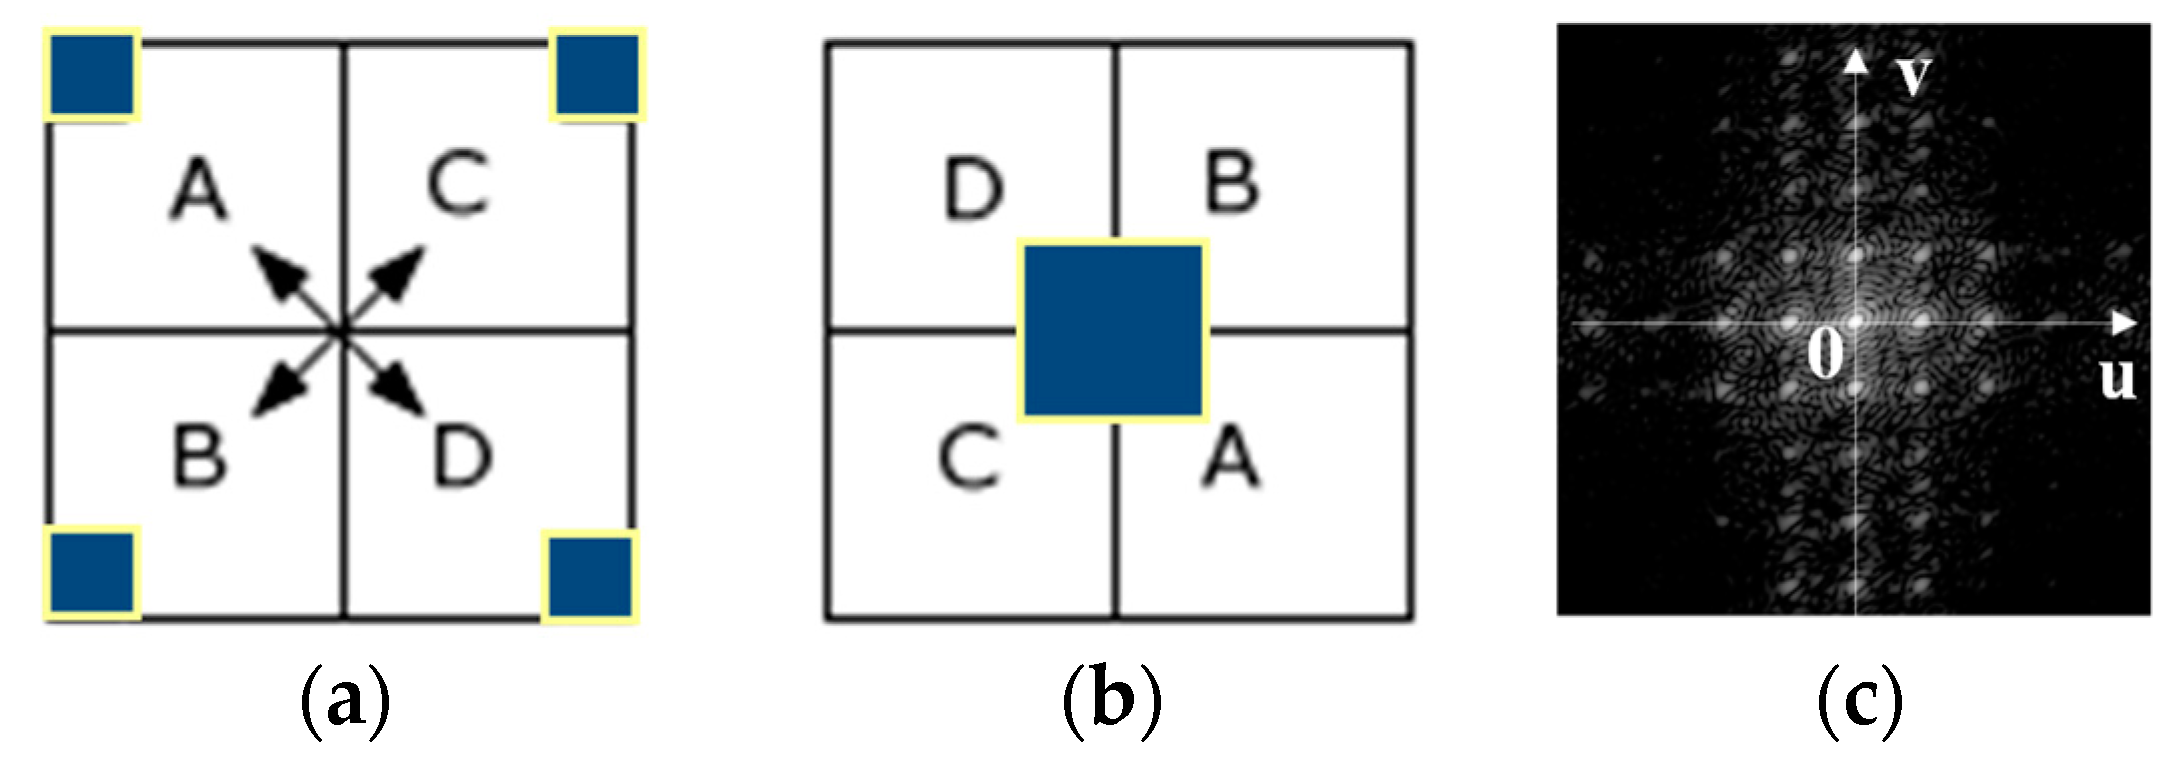
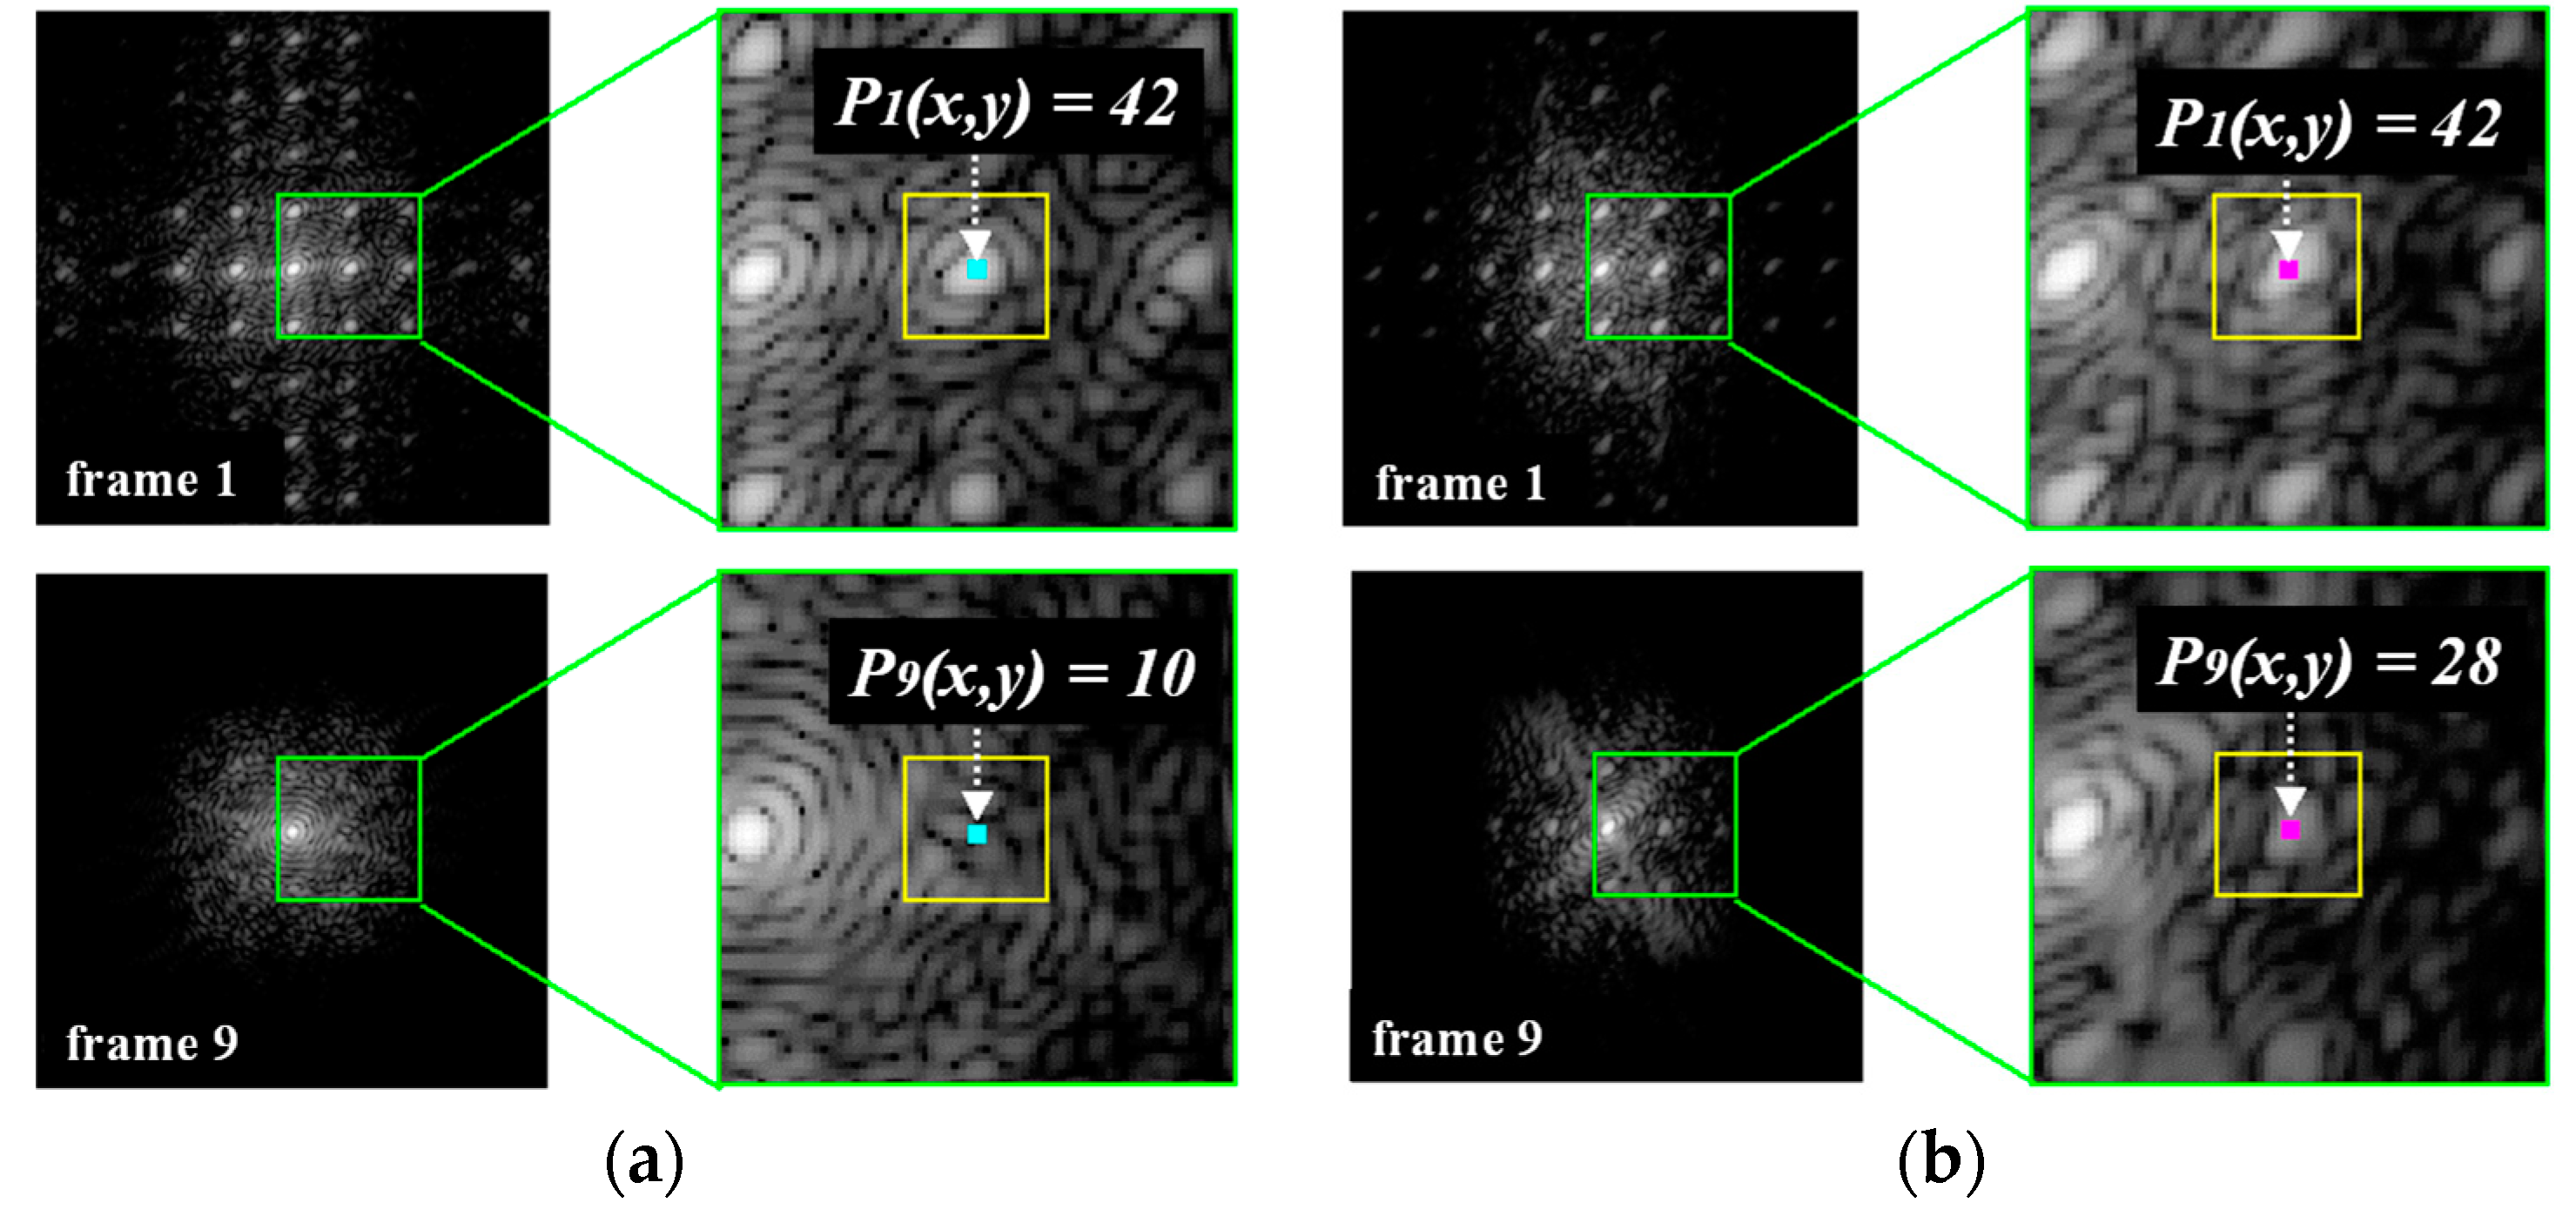
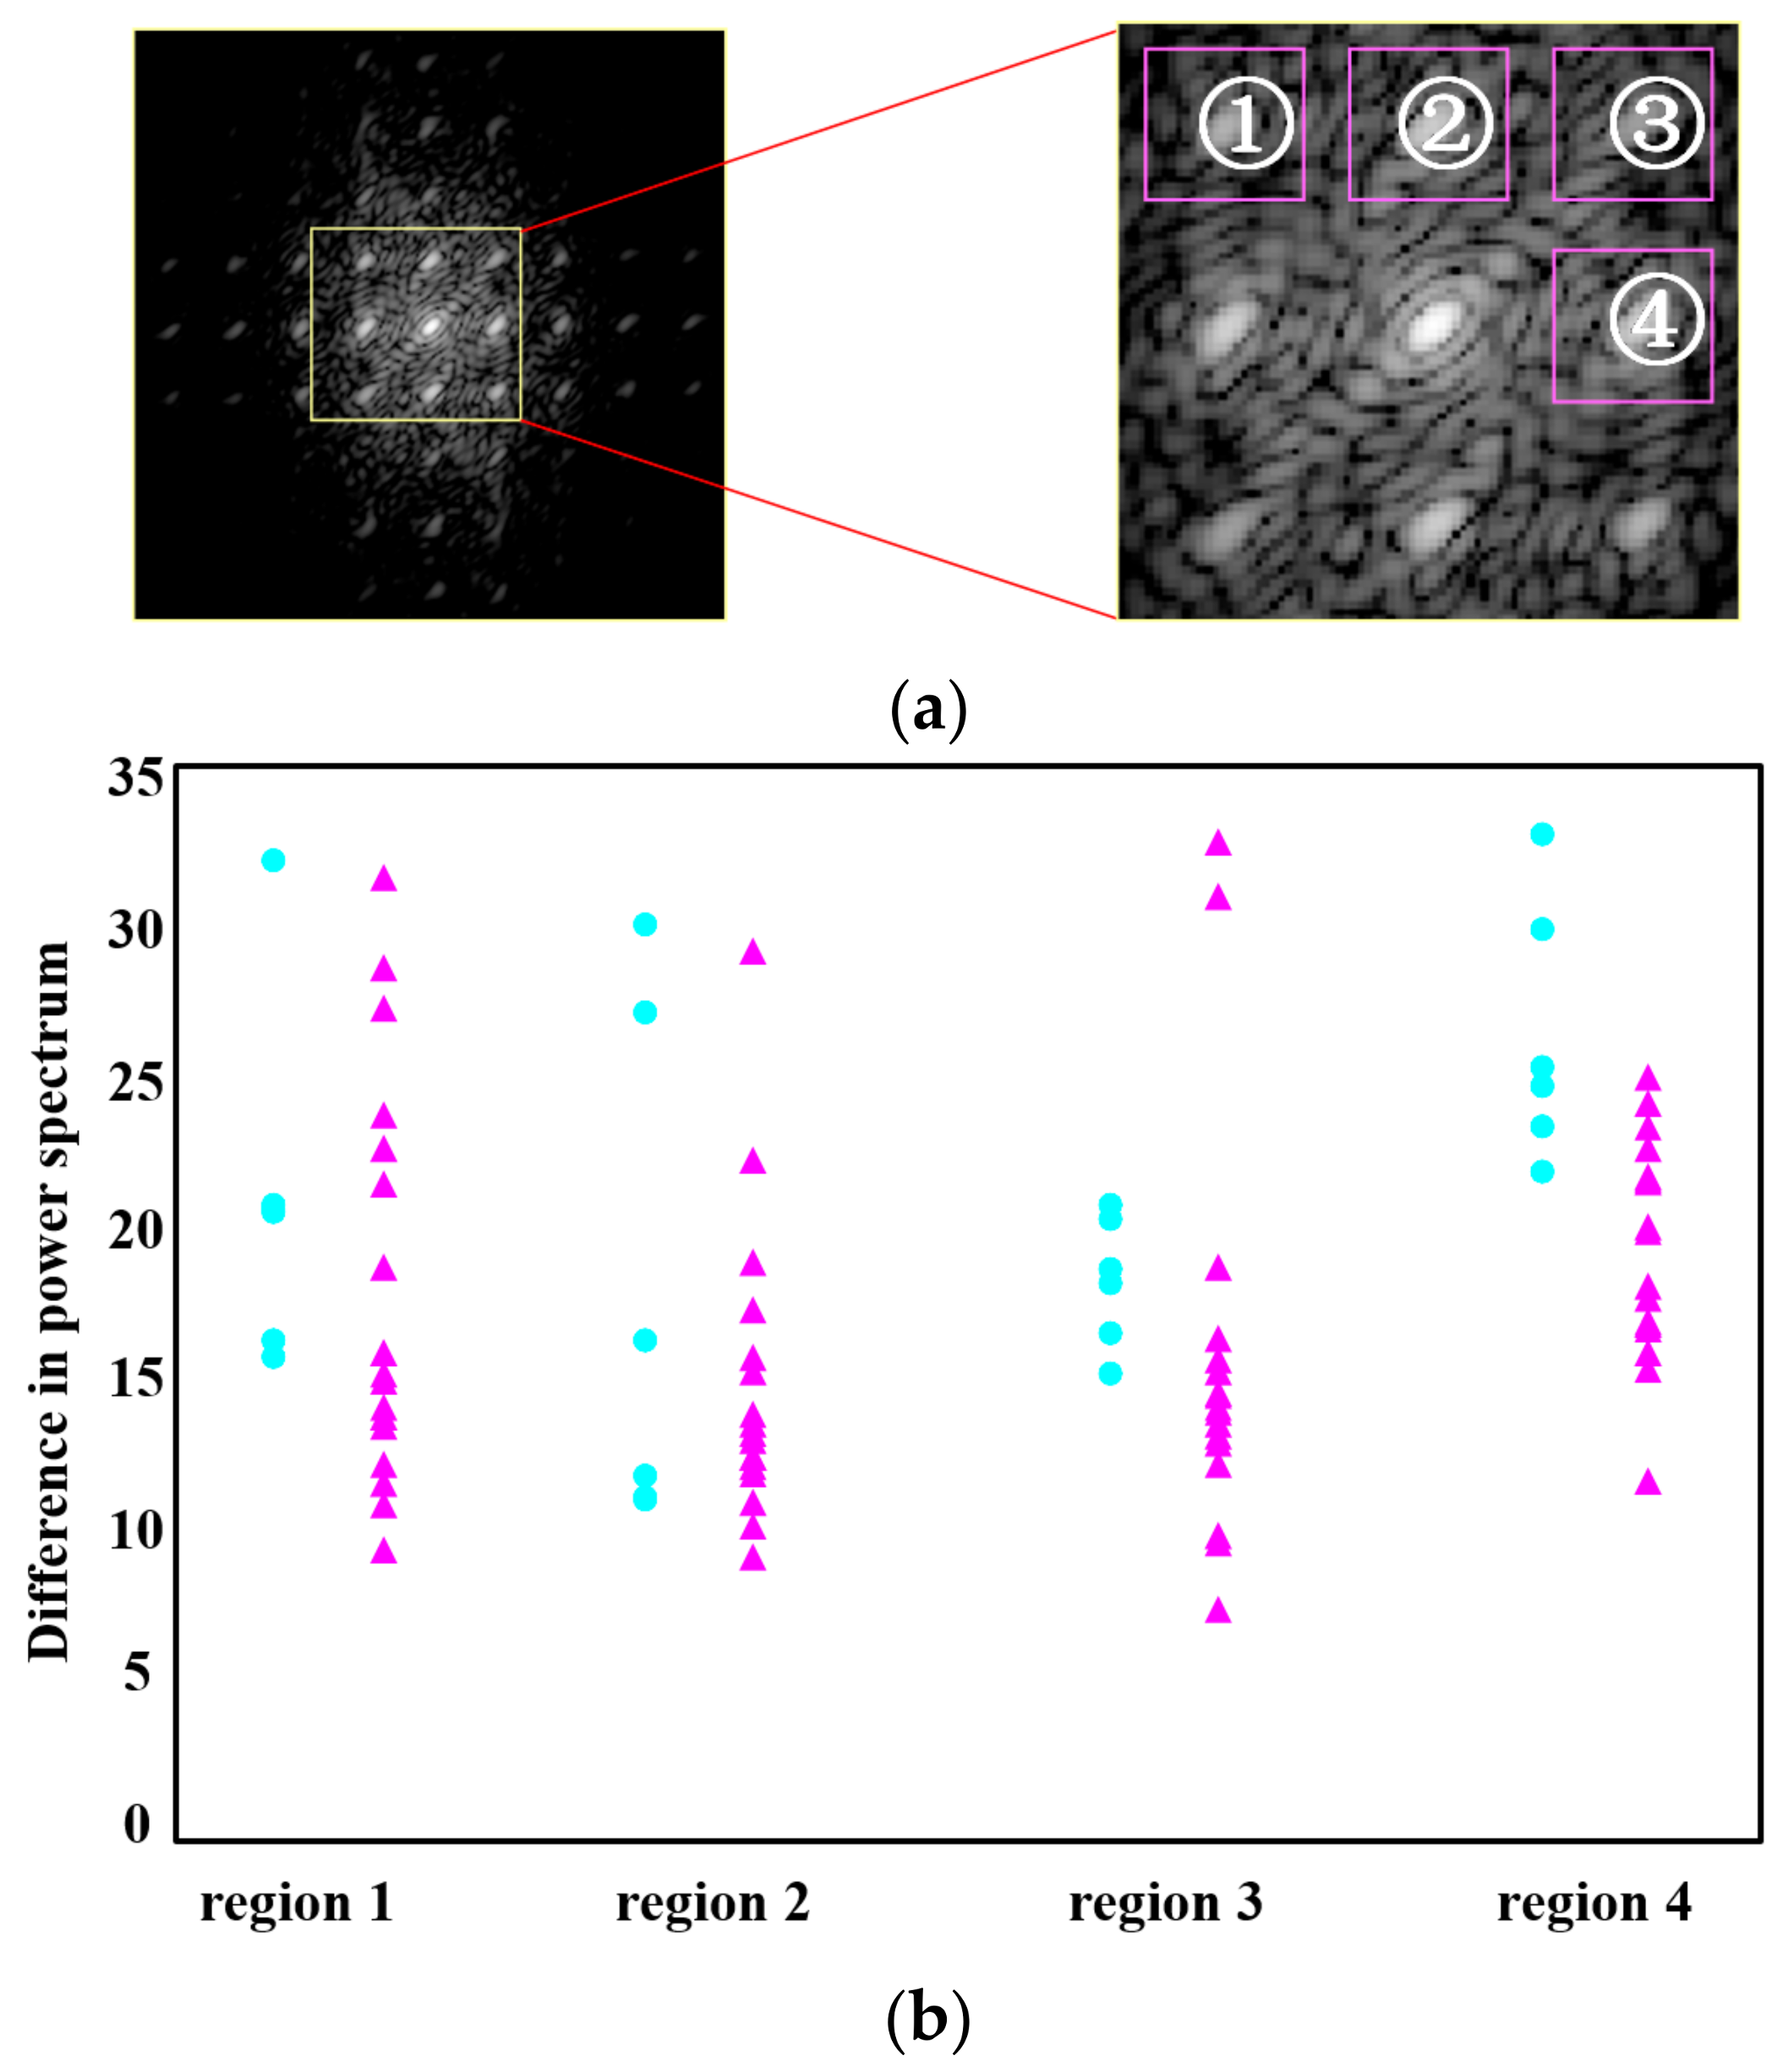
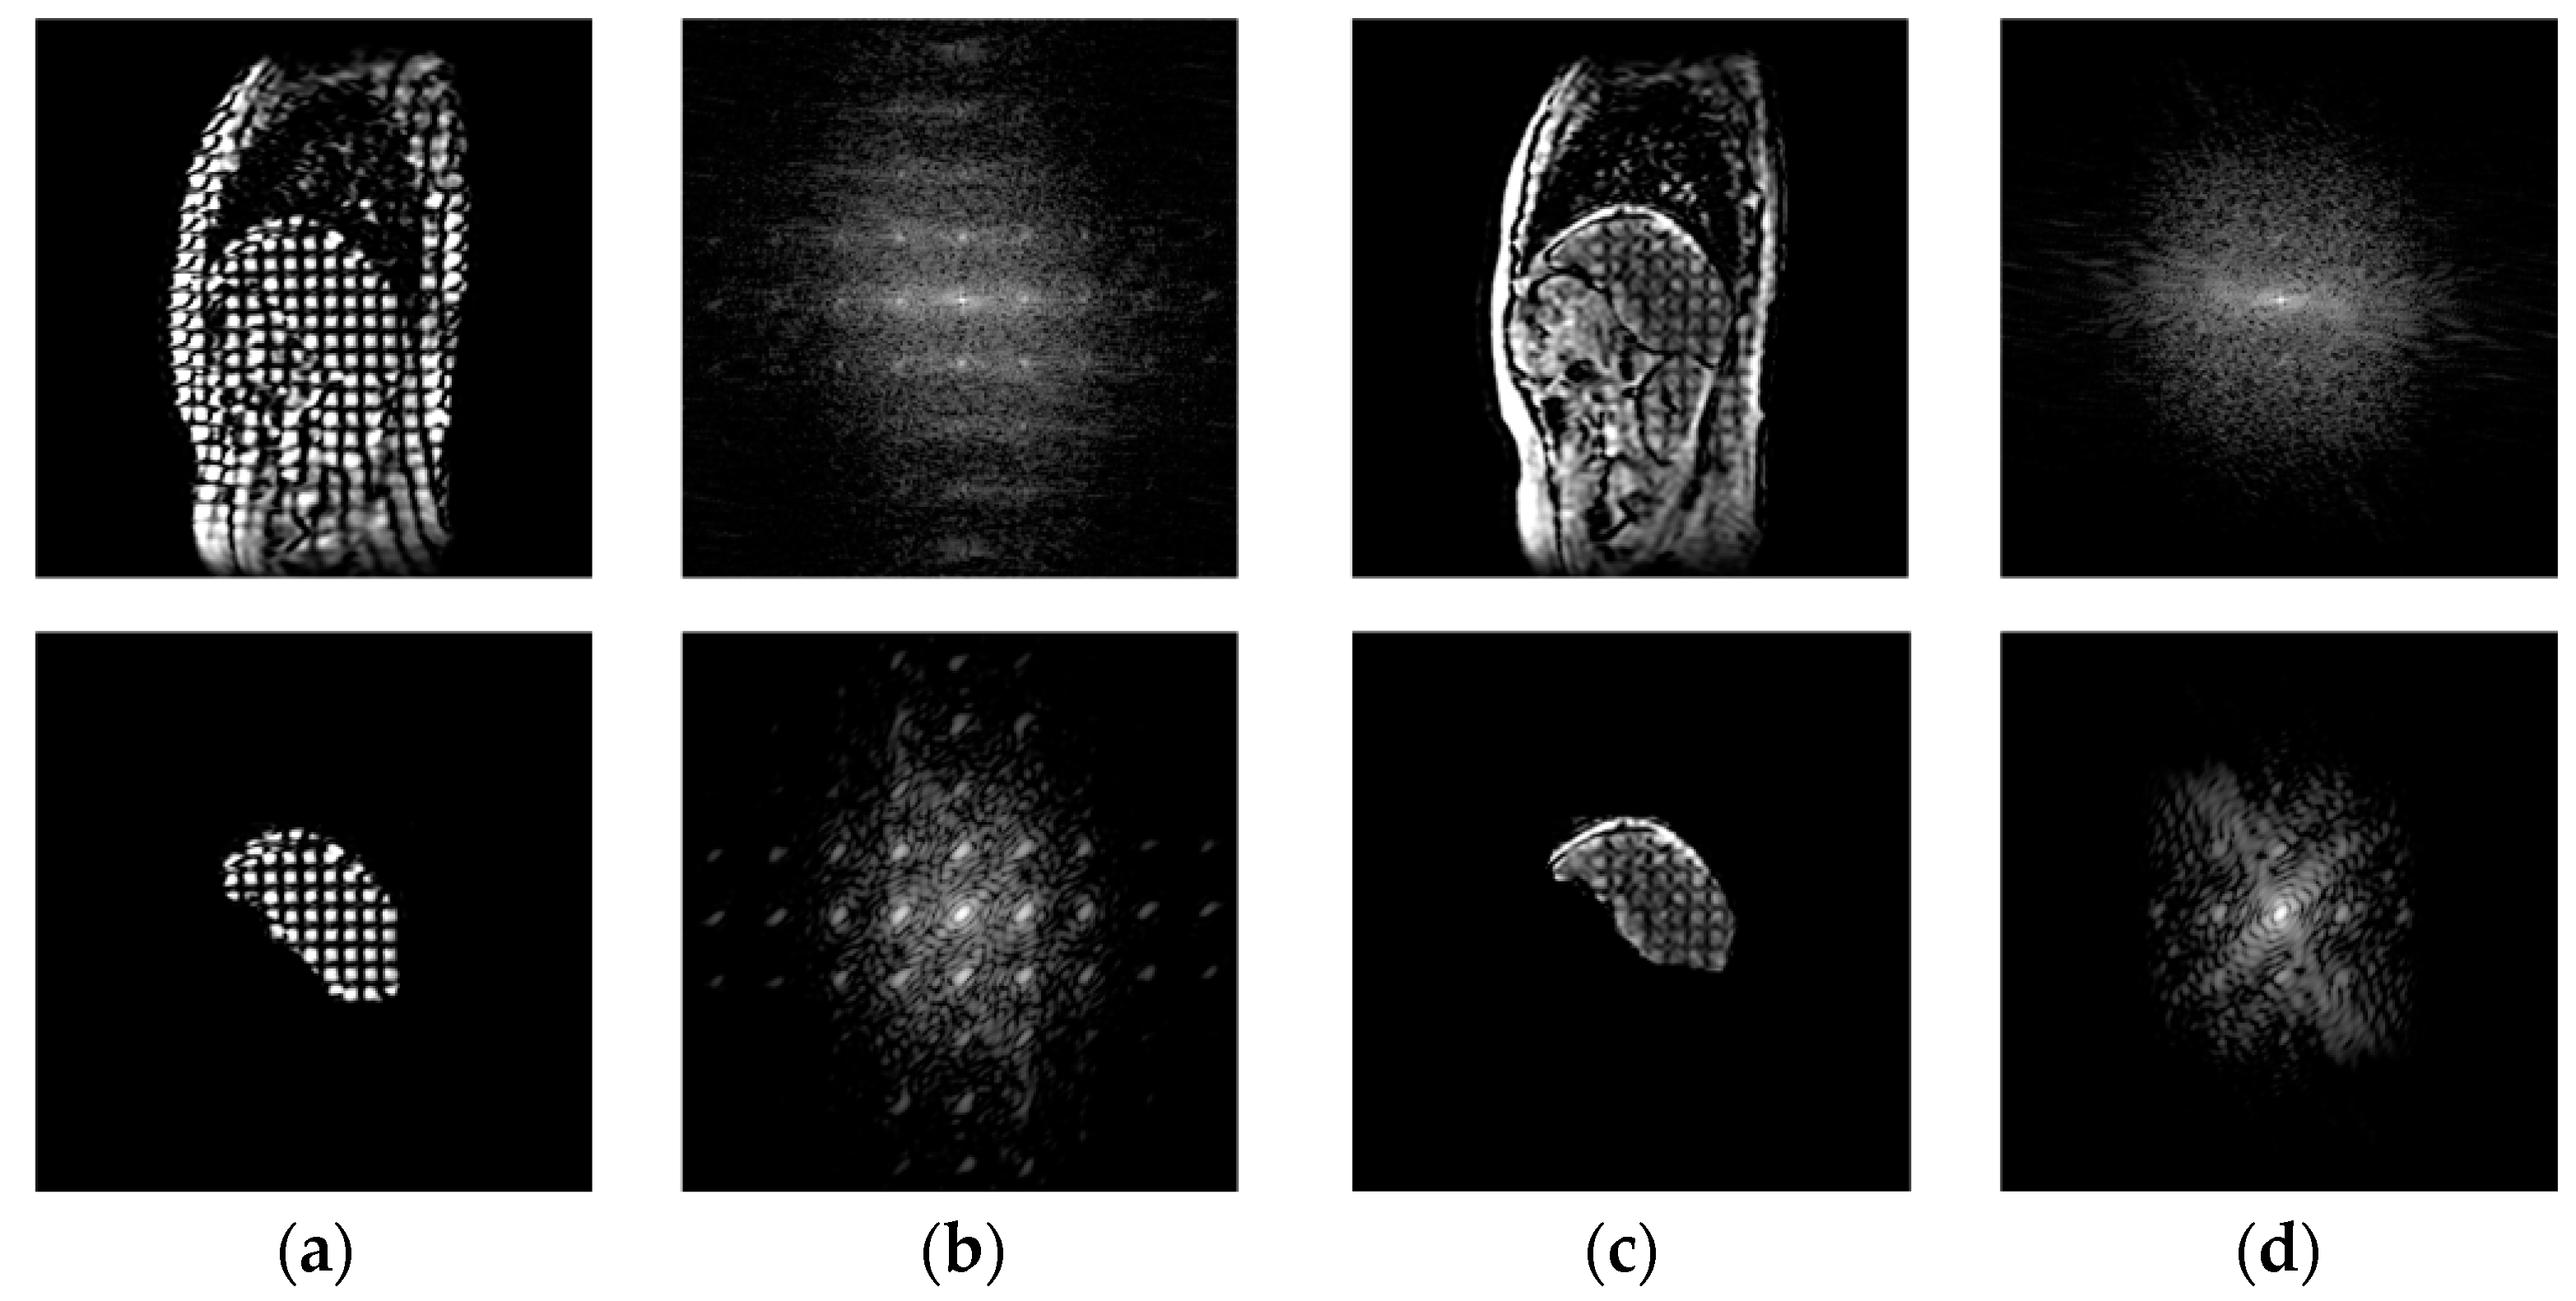
3.2. Calculation of the Difference in the Power Spectral Values of the Tags by FFT in the Frequency Domain

Manually placing the LMs is time-consuming and impractical for clinical use. To overcome this disadvantage, our method for measuring non-rigid deformation is modified to the frequency domain processing using a 2D FFT method. Because the main patterns in the MR tagging image are grids that periodically appear at a certain principal frequency f0 (or wavelength) corresponding to the distance between the intervals of the grids; any changes in the interval of the grids will make its frequency shift from f0 to f0 + Δf. A larger change in the shape of the grids results in a wider distribution of the range of Δf, which represents different frequency components. Such a deformation, very similar to the optic phenomenon, appears to be lost in focus at a frequency point of f0 on its 2D power spectrum image. This implies another way of quantifying the non-rigid deformation by applying the 2D FFT method to an MR tagging image and then comparing the difference in the power spectral values in a candidate region around f0.
FFT is an efficient algorithm for computing the discrete Fourier transform (DFT); the calculation of the DFT on a limited dataset that greatly decreases the computing iterations and time is optimized. 2D DFT on a 256 × 256 MR tagging image can be written as
F ( u , v ) = x = 0 255 y = 0 255 F ( x , y ) e j 2 π ( x u / 256 + y v / 256 )
where F ( x , y ) is the gray value at point (x, y) on an MR tagging image in the spatial domain, and F ( u , v ) is the complex value at (u, v) corresponding to the transverse and longitudinal frequency components of F ( x , y ) in the frequency domain derived from FFT, where x , y , u , v ( 0 , 1 , 2 , 3 256 1 ) . j is the imaginary unit. The matrix of the power spectrum is calculated as
P W S F ( u , v ) = | F ( u , v ) | 2 = F r 2 ( u , v ) + F i 2 ( u , v )
where P W S F ( u , v ) is the power spectrum of F ( u , v ) , and F r ( u , v ) and F i ( u , v ) are the real and imaginary parts of F ( u , v ) , respectively. The low-frequency components (small gray-filled squares) distribute in the four corners of matrix F ( u , v ) , and the highest frequencies are located in the middle of the matrix as shown in Figure 3a. To visualize the power spectrum into a gray-scale image for further processing, we re-arrange the four quadrants from the power spectrum matrix P W S F ( u , v ) into P W S I ( u , v ) as shown in Figure 3b. Because of the symmetries of the spectrum, the entire set of quadrant positions can be diagonally replaced following the direction of the arrows indicated in Figure 3a after replacing the highest frequencies at the corners of the matrix. Because the main energy is concentrated in the low-frequency range, which could interfere with the main frequency component of f0, logarithm transformation is applied to P W S I ( u , v ) , and we obtain a new matrix P ( x , y ) , known as the power spectral image (PSI), which is expressed as
P ( x , y ) = log P W S I ( u , v ) .
Figure 3c indicates the structure of tags on the PSI with a typical grid pattern for the normal liver or abnormal liver on the first frame of the MR tagging image before transformation. In Figure 4, the points on the u axis are the principal frequency of the tag (Region 4) and its high harmonic components in the transverse direction, whereas points on the v axis are the principal frequency of the tag (Region 2) and its high harmonic components in the longitudinal direction. We should note that the intersectional tags in the diagonal directions also appear periodically; therefore, other points (Region 1 and Region 3) are conspicuously plotted on the PSI as well, which makes the power spectral value of the tag appear equidistantly in the frequency domain. Their corresponding power spectra are plotted using all cases (normal or abnormal) to determine the most sensitive frequency component among Regions 1–4.
To avoid the unwanted components of the power spectrum in the PSI that pertain to other organs or tissues, the liver region (bottom of Figure 5a,b) is manually segmented from the original MR tagging images (top of Figure 5a,b) beforehand. Note that the PSI has better quality with segmented liver images (bottom of Figure 5c,d) than with the original images (top of Figure 5c,d).
With the deformation of the liver, the displacement of the tag differs between the normal and abnormal livers in the spatial domain, which will also result in differences in the power spectrum in the frequency domain. It is obvious that the movement of the tags from Frame 1 to Frame 9 in the longitudinal direction (Region 4 in Figure 4) is greater than that in the transverse direction; thus, the principal frequency f0 in the transverse direction (the right square in Figure 6a,b) is selected as a region of interest (ROI) for calculating the magnitude of the power spectrum. A larger deformation of the liver results in a larger difference in the power spectrum of the two ROIs. Therefore, the difference in the power spectral (DPS) values of the tag region between the first frame and the ninth frame of the MR tagging image in the 2D frequency domain is high on the normal liver (Figure 6a) and low on the abnormal liver (Figure 6b).
In a 5 × 5 ROI, the power spectral value in the coordinate ( x , y ) , which has the maximum power spectral value p 1 ( x , y ) , is located in the first frame of the MR tagging image, whereas the power spectral value at the same coordinate of ( x , y ) is p 9 ( x , y ) in the ninth frame of the MR tagging image. The DPS value between p 1 ( x , y ) and p 9 ( x , y ) is determined by p 1 9 ( x , y ) = p 1 ( x , y ) p 9 ( x , y ) .

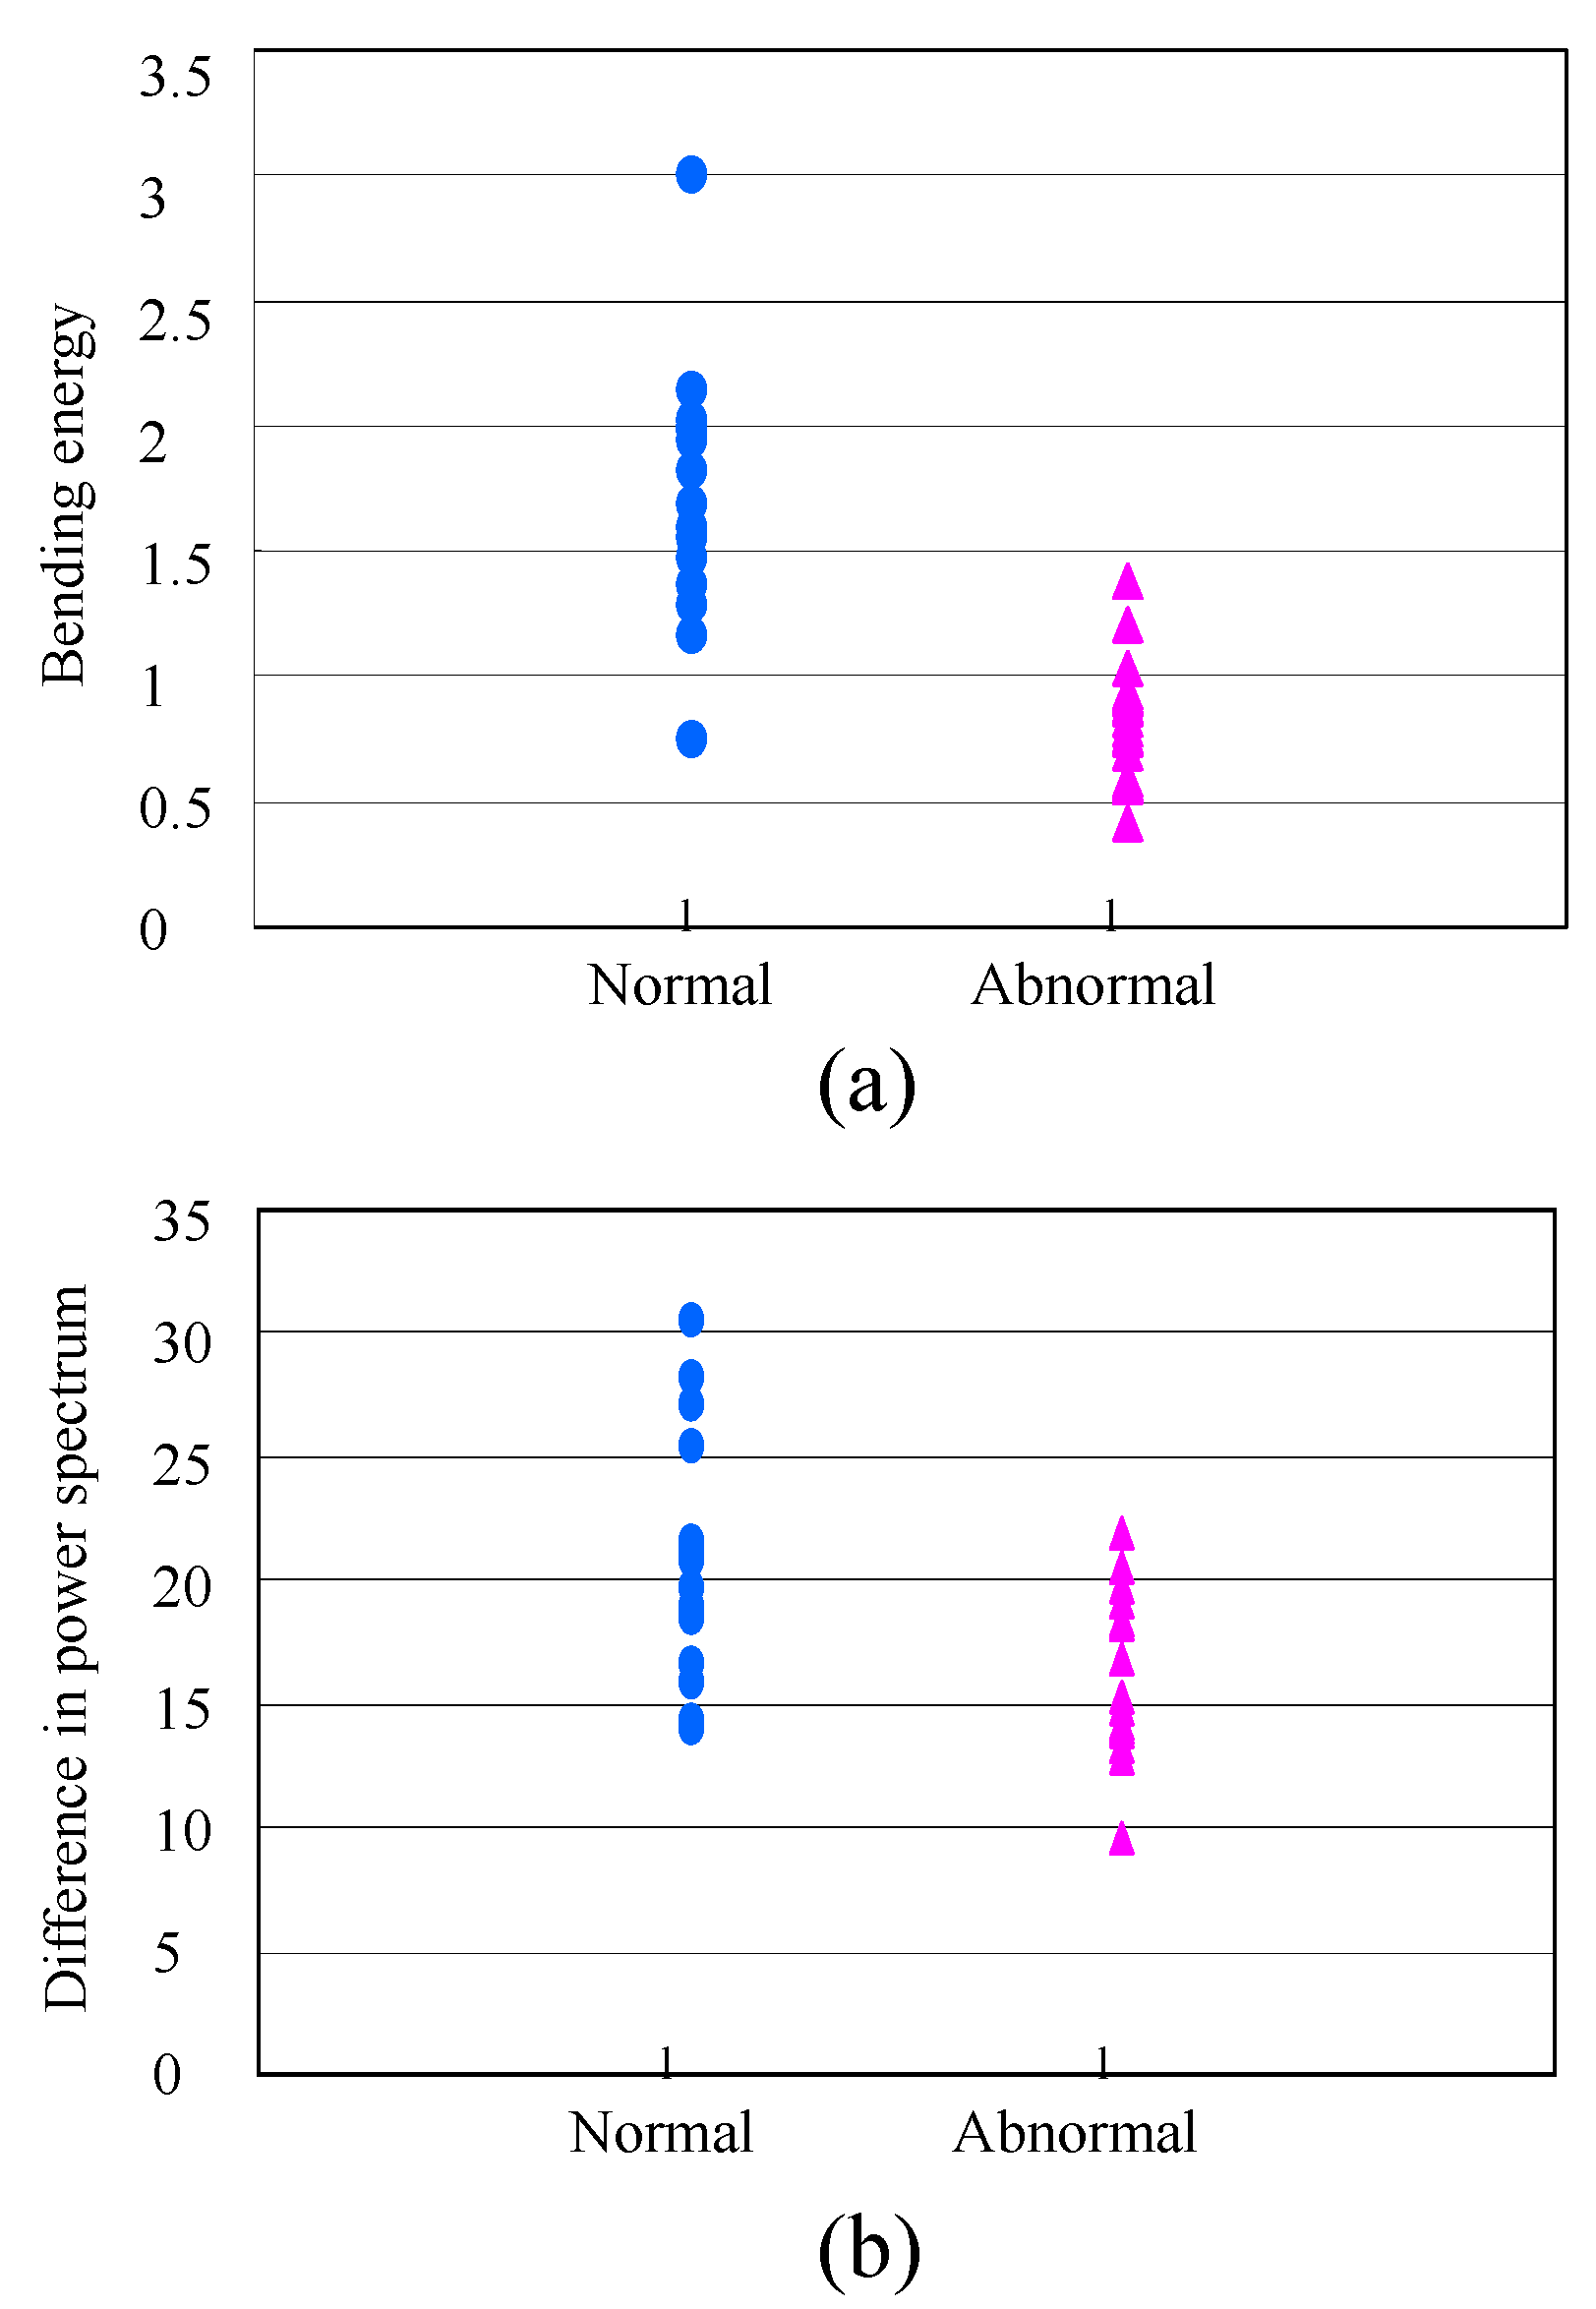
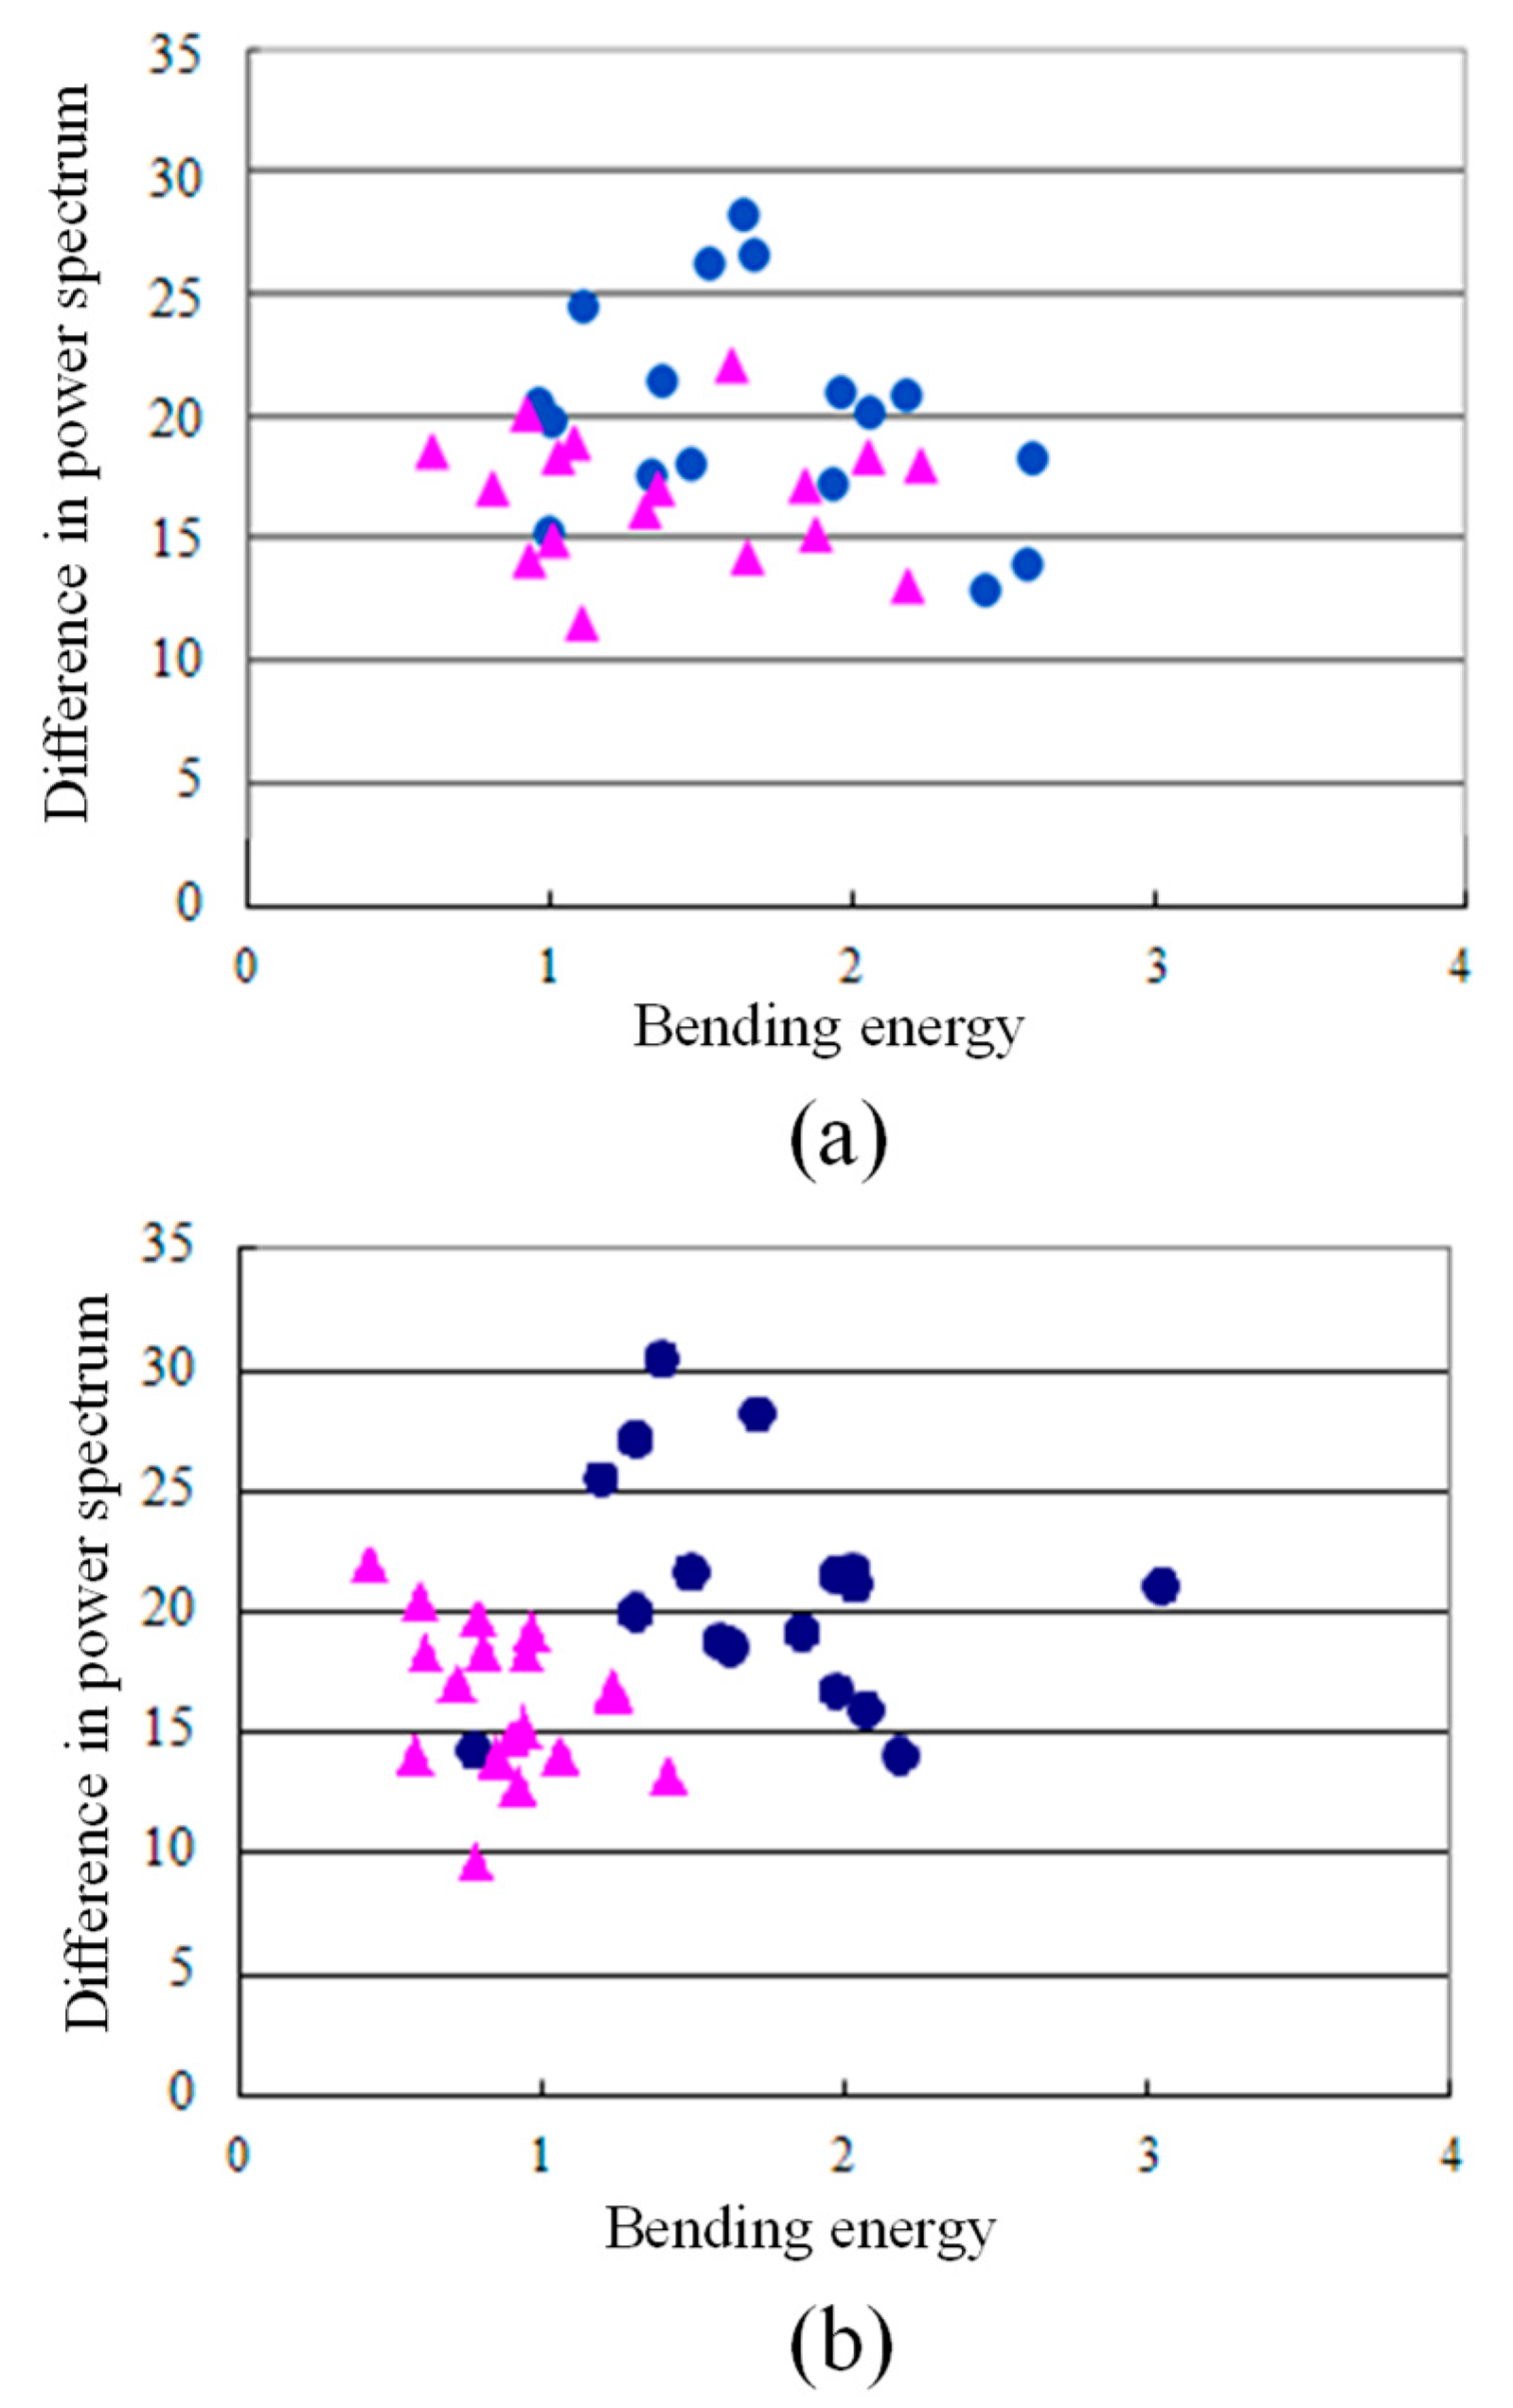
3.3. Classification Method

The self-organizing map (SOM) [27] is an excellent tool in the exploratory phase of data mining. Compared with the other traditional neural network algorithms, the SOM has the advantage of tolerating very low accuracy in the representation of its signals and synaptic weights. It projects an input space on prototypes of a low-dimensional regular grid that can be effectively used to visualize and explore properties of the data. In our study, the input vectors are the BE and DPS values, and similar units can be clustered into normal and abnormal liver groups, with parameters set as follows: size = 34; mat: [2, 2]; sigma = 0.2; maxiterator = 2000.

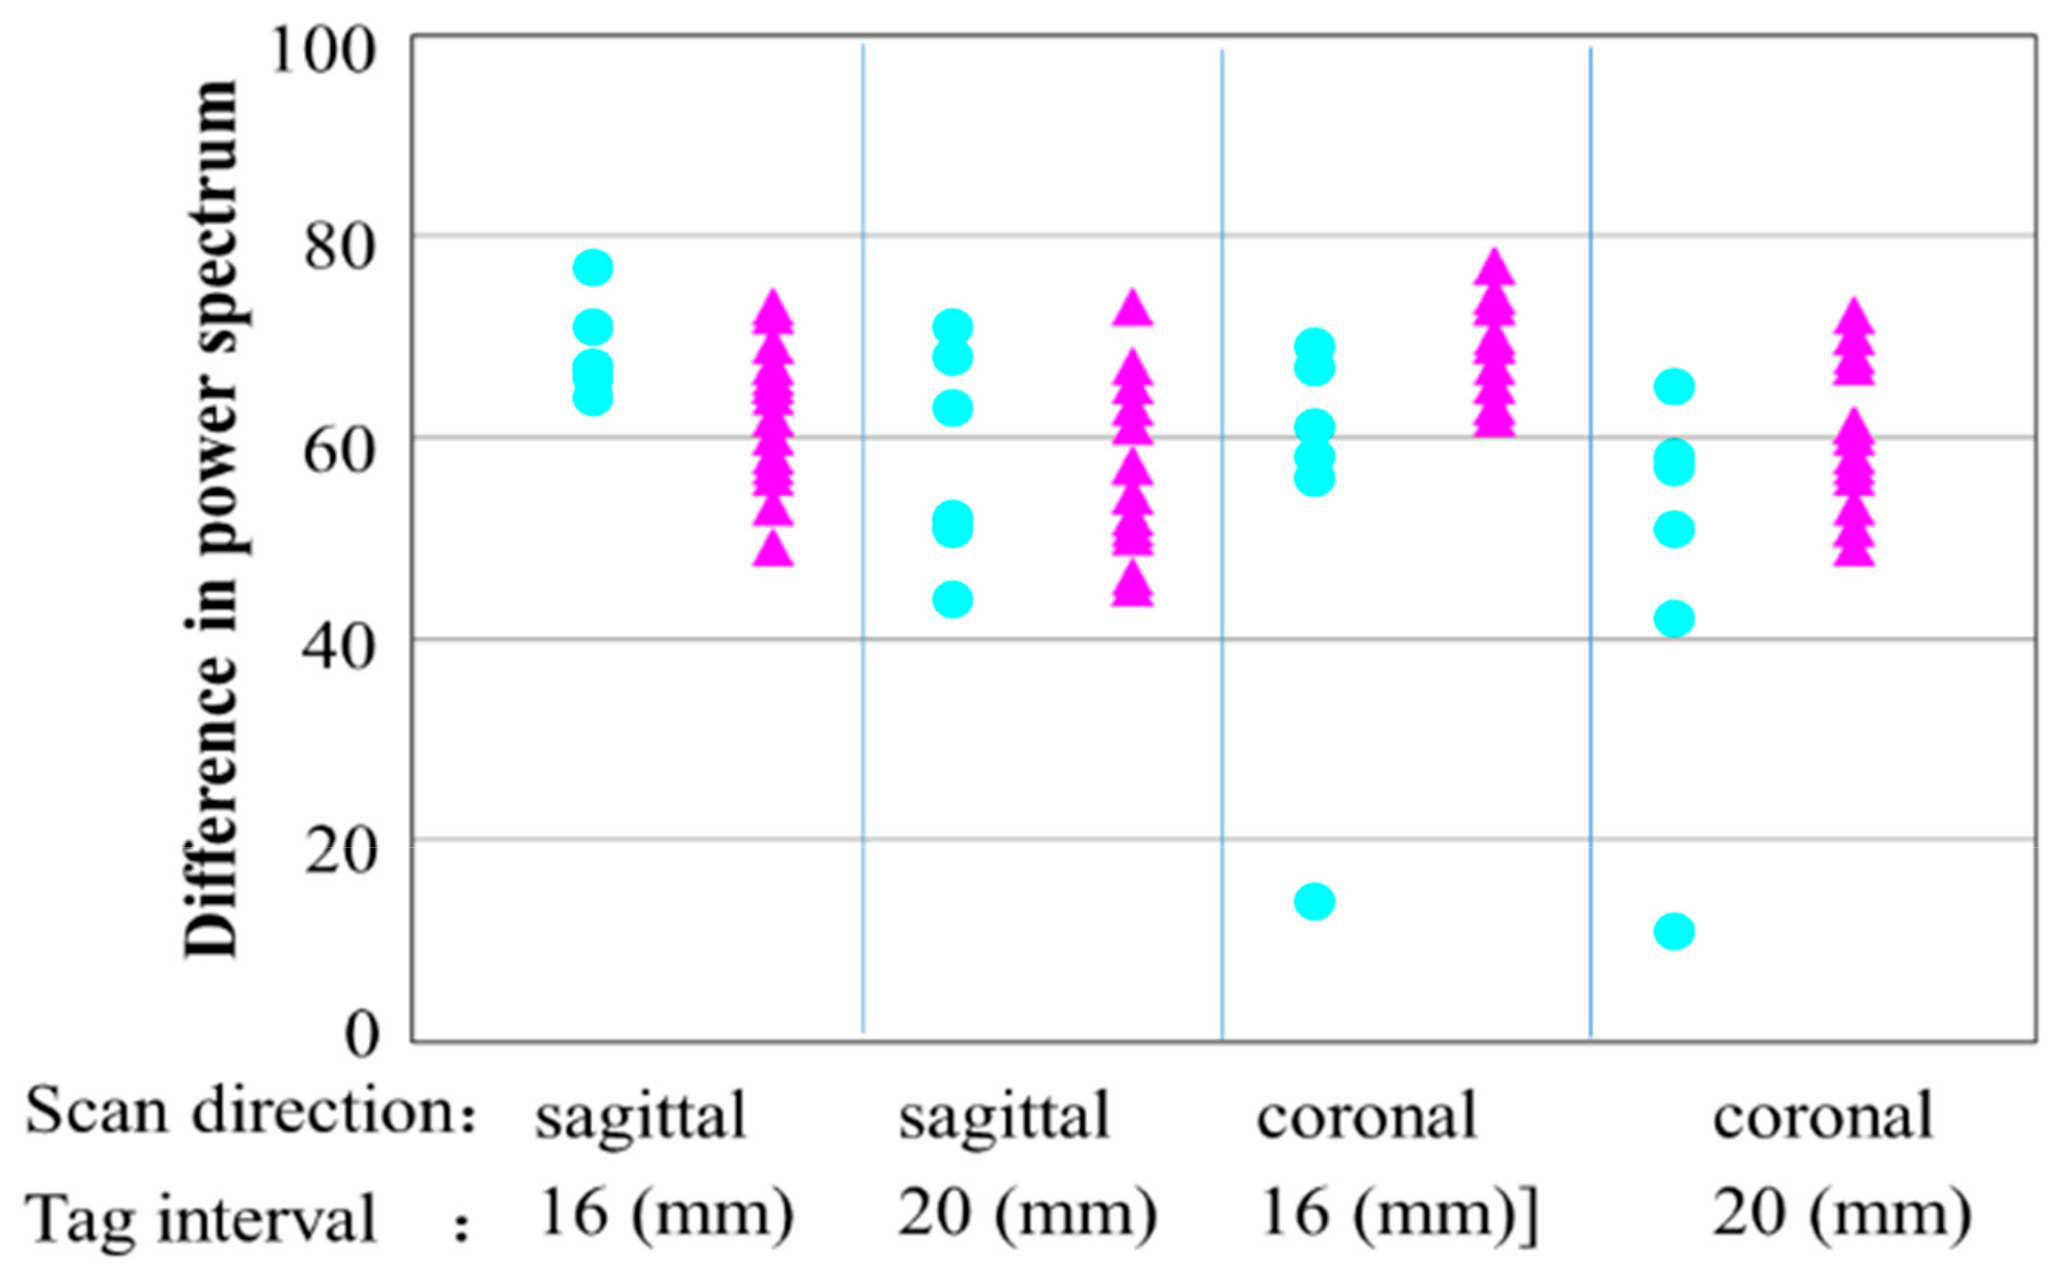
4. Results and Discussion

Figure 1a shows cine-tagging images using a 16 mm sagittal grid in a 56-year-old male patient with fibrosis scores equal to F0. The first image (Frame 1) obtained at the maximum inspiratory phase shows the grid without distortion. The last image (Frame 9) obtained at the maximum expiratory phase shows the grid with evident distortion. The coordinate values of a given grid intersection on the first image (x, y) and those of the corresponding grid intersection on the last image (xi, yi) were determined by a radiologist. The BE value calculated using these images was 2.52, and its corresponding DPS value was p 1 9 ( x , y ) = 42 10 = 32 , as shown in Figure 6a. Figure 1f shows a 72-year-old male patient with fibrosis scores equal to F4. The grid in the first image has no distortion, whereas the last image obtained at the maximum expiratory phase shows that the grid shifted slightly upward, but there is no distortion with the grid. The BE value calculated using these images was as low as 0.57, and its corresponding DPS value was p 1 9 ( x , y ) = 42 28 = 14 , as shown in Figure 6b. It is evident that the value of the non-rigid deformation is high if the value of BE/DPS is high. On the other hand, the deformation is low if the value of BE/DPS is low.
The reason for setting an LM at the time of inhalation versus the time of expiration is that the difference in the strength of deformation between the normal liver and the abnormal liver conspicuously varies when the BE/DPS value is calculated when the volume of deformation of the liver is the largest.
The shifts of both BE/DPS values are generally invariant to evaluate the degree of distortion or deformation of a non-rigid object. Rigid movement of the liver by breathing as an affine transform is ignored in the assessment, and only the non-rigid transformation caused by the liver itself is calculated. Although DPS is not rotationally invariant, the rotated element is very small in our datasets because the breathing of patients only makes the liver move up and down. Such properties would make it possible to use BE/DPS values to evaluate the quantitative stiffness of the liver.
We assessed that a 12 mm spacing was too small to clearly identify crossing points in the BE/DPS analysis and a 24 mm spacing was too large to have a sufficient number of coordinate samples, especially in small cirrhotic livers. Thus, we chose 16 and 20 mm stripe spacing and sagittal and coronal planes, resulting in four different types of cine-tagging images: 16 mm sagittal, 20 mm sagittal, 16 mm coronal, and 20 mm coronal grids (Figure 1a–d). Comparing the four different types of grids, our preliminary study concluded that the 16 mm sagittal grid with BE features showed the best performance in the diagnosis [19]. For the DPS feature, the performance on these four types of images is shown in Figure 7. The average DPS values in normal and abnormal livers listed in Table 1 indicate that the 16 mm sagittal DPS method also has the best performance, which is identical to the results obtained from the BE method.
The performances based on the bending energy and power spectrum methods shown in Figure 8 are different. Neither of the methods are able to distinguish the abnormal liver from the normal liver. However, the distinction between the normal liver and the abnormal liver becomes much clearer by combining the two methods, as shown in Figure 9. There are many overlap cases in Figure 9a between automatically placing the LMs based on Hough transformation [26] and the automatic DPS value calculation from the original image. Figure 9b is the result of manually placing LMs as the gold standard versus DPS from the segmented liver image. The classification results of Figure 9b obtained by the SOM method in Table 2 demonstrate that 33 cases are successfully classified. One case of the normal liver is falsely classified as abnormal. The follow-up study demonstrates that this false classification may be caused by the subtle breathing action of the healthy patient, which makes the deformation of the liver insufficient.
In contrast to the 10+ min required to manually place corresponding landmarks on MR-tagging image pairs, segmentation of the liver region shown in Figure 5 only takes 1–2 min, since the demand for accuracy is not very high, which implies that FFT is faster than time domain processing, as there is no difference in the calculation of BE and DPS values.
There are some limitations to our study, and these should be improved upon in future work. First, for the bending energy method, the results change based on the number of LMs used for calculation. Therefore, it is necessary to calculate the bending energy with the same number of the LMs in all cases. Second, this study is based on 2D processing, but liver deformation occurs in three dimensions. Using 3D BE/DPS values may greatly improve the precision of the assessment. Third, this study was conducted as preliminary technical development research, and considerable time and effort were expended to manually define the coordinates and record the values. We have now started to develop an automated algorithm to calculate BE values with cine-tagging MR images, as well as the automatic segmentation of the liver region for calculating the DPS value. Although the results are not yet satisfying, this MR elastography might be more practically incorporated into an MR imaging protocol if the output of the BE/DPS values are fully automated by implementing more intelligent algorithms. Finally, for the abnormal cases, there is no statistical difference between the BE/DPS values with F1/F2 and F3/F4, which is regarded as an important boundary for staging the fibrosis into curable or carcinoma control groups in clinical management. This may be due to either methodological errors in guiding the patients to breath without standard criteria or a low number of experimental datasets. We believe that, with more cases and with a more accurate and efficient liver extraction method, the deformation of tags would have a higher correlation coefficient with the abnormal group. It is possible not only to discriminate fibrotic and cirrhotic livers but also to differentiate individual fibrosis stages by using BE/DPS values or combining them with other effective features [28].

5. Conclusions

This article describes a novel method for measuring the value of non-rigid deformation of the liver in an MR tagging image. In this study, the elasticity of the liver was analyzed by the bending energy and power spectrum on MR tagging images. BE was calculated using a TPS-based method in the spatial domain, and DPS was calculated to quantify the change of tag frequency using the FFT method in the frequency domain. Finally, the abnormal liver was distinguished from the normal liver by using two techniques.
Although the BE and DPS values were not able to distinguish the moderate or advanced hepatic fibrosis from healthy liver or slight hepatic fibrosis successfully, a highly accurate assessment was possible by combining the two methods with the LMs as the gold standard. It is expected that this procedure will be fully automatic with improved accuracy of LM extraction.
This study demonstrated that our proposed method for non-invasively assessing liver fibrosis may be an alternative to traditional liver biopsy without the need for contrast agents or mechanical devices.

Acknowledgments

The authors are grateful to Haruo Watanabe, Masayuki Kanematsu, and members at Fujita lab in Gifu University, for their early efforts and discussions on this research. This work was supported in part by two research support from the National Natural Science Foundation of China (Nos. 81460274 and 81760324), and by JSPS Grant-in-Aid for Scientific Research on Innovative Areas (grant number 26108005), and in part by a research foundation project of the Health and Family planning Commission of Guangxi (No. Z2016762).

Author Contributions

Xiangrong Zhou conceived and designed the experiments; Xuejun Zhang performed the experiments and wrote the paper; Takeshi Hara analyzed the data; Hiroshi Fujita contributed experimental materials.

Conflicts of Interest

The authors declare no conflict of interest.

References

  1. El-Serag, H.B.; Mason, A.C. Rising incidence of hepatocellular carcinoma in the United States. N. Engl. J. Med. 1999, 340, 745–750. [Google Scholar] [CrossRef] [PubMed]
  2. Yatsuhashi, H.; Yano, M. Natural history of chronic hepatitis C. J. Gastroenterol. Hepatol. 2000, 15, 111–116. [Google Scholar] [CrossRef]
  3. Wynn, T.A. Cellular and molecular mechanisms of fibrosis. J. Pathol. 2008, 214, 199–210. [Google Scholar] [CrossRef] [PubMed]
  4. Saadeh, S.; Cammell, G.; Carey, W.D.; Younossi, Z.; Barnes, D.; Easley, K. The role of liver biopsy in chronic hepatitis C. Hepatology 2001, 33, 196–200. [Google Scholar] [CrossRef] [PubMed]
  5. Poynard, T.; Ratziu, V.; Bedossa, P. Appropriateness of liver biopsy. Can. J. Gastroenterol. 2000, 14, 543–548. [Google Scholar] [CrossRef] [PubMed]
  6. Bravo, A.A.; Sheth, S.G.; Chopra, S. Liver biopsy. N. Engl. J. Med. 2001, 344, 495–500. [Google Scholar] [CrossRef] [PubMed]
  7. Regev, A.; Berho, M.; Jeffers, L.J.; Milikowski, C.; Molina, E.G.; Pyrsopoulos, N.T.; Feng, Z.Z.; Reddy, K.R.; Schiff, E.R. Sampling error and intraobserver variation in liver biopsy in patients with chronic HCV infection. Am. J. Gastroenterol. 2002, 97, 2614–2618. [Google Scholar] [CrossRef] [PubMed]
  8. Muthupillai, R.; Lomas, D.J.; Rossman, P.J.; Greenleaf, J.F.; Manduca, A.; Ehman, R.L. Magnetic resonance elastography by direct visualization of propagating acoustic strain waves. Science 1995, 269, 1854–1857. [Google Scholar] [CrossRef] [PubMed]
  9. Rouviere, O.; Yin, M.; Dresner, M.A.; Rossman, P.J.; Burgart, L.J.; Fidler, J.L.; Ehman, R.L. MR elastography of the liver: Preliminary results. Radiology 2006, 240, 440–448. [Google Scholar] [CrossRef] [PubMed]
  10. Huwart, L.; Sempoux, C.; Salameh, N.; Jamart, J.; Annet, L.; Sinkus, R.; Peeters, F.; ter Beek, L.C.; Horsmans, Y.; van Beers, B.E. Liver fibrosis: Noninvasive assessment with MR elastography versus aspartate aminotransferase-to-platelet ratio index. Radiology 2007, 245, 458–466. [Google Scholar] [CrossRef] [PubMed]
  11. Lucidarme, O.; Baleston, F.; Cadi, M.; Bellin, M.F.; Charlotte, F.; Ratziu, V.; Grenier, P.A. Non-invasive detection of liver fibrosis: Is superparamagnetic iron oxide particle-enhanced MR imaging a contributive technique? Eur. Radiol. 2002, 13, 467–474. [Google Scholar] [CrossRef] [PubMed]
  12. Aguirre, D.A.; Behling, C.A.; Alpert, E.; Hassanein, T.I.; Sirlin, C.B. Liver fibrosis: Noninvasive diagnosis with double contrast material-enhanced MR imaging. Radiology 2006, 239, 425–437. [Google Scholar] [CrossRef] [PubMed]
  13. Taouli, B.; Tolia, A.J.; Losada, M.; Babb, J.S.; Chan, E.S.; Bannan, M.A.; Tobias, H. Diffusion-weighted MRI for quantification of liver fibrosis: Preliminary experience. Am. J. Roentgenol. 2007, 189, 799–806. [Google Scholar] [CrossRef] [PubMed]
  14. Friedrich-Rust, M.; Ong, M.F.; Herrmann, E.; Dries, V.; Samaras, P.; Zeuzem, S.; Sarrazin, C. Real-time elastography for noninvasive assessment of liver fibrosis in chronic viral hepatitis. Am. J. Roentgenol. 2007, 188, 758–764. [Google Scholar] [CrossRef] [PubMed]
  15. Wang, J.; Guo, L.; Shi, X.Y.; Pan, W.Q.; Bai, Y.F.; Ai, H. Real-time elastography with a novel quantitative technology for assessment of liver fibrosis in chronic hepatitis B. Eur. J. Radiol. 2012, 81, 31–36. [Google Scholar] [CrossRef] [PubMed]
  16. Zhang, X.J.; Li, W.G.; Fujita, H.; Kanematsu, M.; Hara, T.; Zhou, X.R.; Kondo, H.; Hoshi, H. Automatic segmentation of hepatic tissue and 3D volume analysis of cirrhosis in multi-detector row CT scans and MR imaging. IEICE Trans. Inf. Syst. 2004, 87, 2138–2147. [Google Scholar]
  17. Goshima, S.; Kanematsu, M.; Kobayashi, T.; Furukawa, T.; Zhang, X.; Fujita, H.; Watanabe, H.; Kondo, H.; Moriyama, N.; Bae, K.T. Staging hepatic fibrosis: Computer-aided analysis of hepatic contours on gadolinium ethoxybenzyl diethylenetriaminepentaacetic acid-enhanced hepatocyte-phase magnetic resonance imaging. Hepatology 2012, 55, 328–329. [Google Scholar] [CrossRef] [PubMed]
  18. Li, W.D.; Zeng, Y.F.; Zhang, X.J.; Huang, Y.; Long, L.L.; Fujita, H. Staging the hepatic fibrosis on CT images: Optimizing the slice thickness and texture features. In Proceedings of the IEEE 2011 International Symposium on Bioelectronics and Bioinformatics, Suzhou, China, 3–5 November 2011; pp. 267–270. [Google Scholar]
  19. Watanabe, H.; Kanematsu, M.; Kitagawa, T.; Suzuki, Y.; Kondo, H.; Goshima, S.; Kajita, K.; Bae, K.T.; Hirose, Y.; Miotani, S.; et al. MR elastography of the liver at 3 T with cine-tagging and bending energy analysis: Preliminary results. Eur. Radiol. 2010, 20, 2381–2389. [Google Scholar] [CrossRef] [PubMed]
  20. Ohyama, W.; Wakabayashi, T.; Kimura, F.; Tsuruoka, S.; Sekioka, K. Automatic extraction of SPAMM grids in left ventricular myocardium from MR tagging images. In Proceedings of the 2009 International Workshop on Regional Innovation Studies: Biomedical Engineering, Mie, Japan, 8 October 2009; pp. 25–29. [Google Scholar]
  21. Zerhouni, E.A.; Parish, D.M.; Rogers, W.J.; Yang, A.; Shapiro, E.P. Human heart: Tagging with MR imaging—A method for noninvasive assessment of myocardialmotion. Radiology 1988, 169, 59–63. [Google Scholar] [CrossRef] [PubMed]
  22. Inaba, T.; Kinosada, Y.; Kawasaki, S.; Obata, H.; Tokuda, M. Analysis of left ventricular wall motion using a magnetic resonance tagging technique: Measurement of circumferential elongation of ventricular Wall in Patients with DCM. Trans. Jpn. Soc. Med. Biol. Eng. 2003, 41, 136–139. (In Japanese) [Google Scholar]
  23. Watanabe, H.; Kanematsu, M.; Kondo, H.; Goshima, S.; Kitagawa, T.; Fujita, H. MR elastography of the liver with cine-tagging and physical bending energy analysis using 3T MRI: Phantom study and preliminary clinical application. In Proceedings of the 94th Scientific Assembly and Annual Meeting of the Radiological Society of North America, Chicago, IL, USA, 30 November–5 December 2008; p. 828. [Google Scholar]
  24. Axel, L.; Dougherty, L. MR imaging of motion with spatial modulation of magnetization. Radiology 1989, 171, 841–845. [Google Scholar] [CrossRef] [PubMed]
  25. Bookstein, F.L. Principal warps: Thin-plate splines and the decomposition of deformations. IEEE Trans. Pattern Anal. Mach. Intell. 1989, 11, 567–585. [Google Scholar]
  26. Miotani, S.; Zhou, X.G.; Kitagawa, T.; Hara, T.; Fujita, H.; Yokoyama, R.; Watanae, H.; Kanematsu, M.; Hoshi, H. Initial Examination of Automatic Calculation Method of Non-Rigid Deformity of the Liver in MR Tagging Images; IEICE Technical Report; IEICE: Minato-ku, Tokyo, 2009; Volume 109, pp. 213–218. (In Japanese) [Google Scholar]
  27. Hosseini, H.S.; Safabakhsh, R. TASOM: A New Time Adaptive Self-Organizing Map. IEEE Trans. Syst. Man Cybern. 2003, 33, 271–282. [Google Scholar] [CrossRef] [PubMed]
  28. Zhang, X.J.; Goshima, S.; Zhou, X.G.; Hara, T.; Kanematsu, M.; Fujita, H.; Furukawa, T. Quantitative staging the hepatic Fibrosis: Computer-aided diagnosis by shape, texture, volume, and elasticity analysis. In Proceedings of the Radiological Society of North America 2011 Scientific Assembly and Annual Meeting, Chicago, IL, USA, 26 November–2 December 2011. [Google Scholar]
Figure 1. magnetic resonance (MR) tagging images of a healthy liver (F0) at the maximal inspiratory (frame1, left) phase and the maximal expiratory (Frame 9, right) phase, using 16 mm coronal (a); 16 mm sagittal (b); 20 mm coronal (c); and 20 mm sagittal (d) grids. For comparison; (e,f) are the images of a cirrhotic liver (F4) using 20 mm coronal and 16 mm sagittal grids, respectively. Note that the grid is deformed over 1 s of forced exhalation, and the deformation of the healthy liver is greater than that of the cirrhotic liver, which reflects the firmness of the parenchyma.
Applsci 08 00437 g001
Figure 2. Landmarks (LMs) marked in yellow point were manually set by a radiologist. First, the LMs on the intersection points of grids were marked on the first frame, Frame 1 (a), of the MR tagging image before deformation. The corresponding LMs were then tracked and placed on the image after non-rigid transformation in the last frame, Frame 9 (b).
Applsci 08 00437 g002
Figure 3. Discrete Fourier transform (DFT) of a 2D MR tagging image with its (a) original power spectrum; (b) frequency range replaced by a power spectrum; (c) power spectral image (PSI) after logarithm transformation.
Applsci 08 00437 g003
Figure 4. Four principal frequencies in four directions are marked as Regions 1–4 (a), and their corresponding power spectra are plotted using all the cases to determine the most sensitive frequency component (b) for differentiating normal cases () from abnormal cases ().
Applsci 08 00437 g004
Figure 5. Segmentation of the liver region from an original MR tagging image in Frame 1 (a) and the corresponding PSIs (b); (c,d) spatial and frequency images derived from Frame 9. Note that the PSIs have better contrast in the segmented liver images (bottom) than in the original images (top).
Applsci 08 00437 g005
Figure 6. Difference in the power spectral (DPS) value within a 5 × 5 ROI between the first frame and the ninth frame of the MR tagging image in the 2D frequency domain is relatively large on the normal liver (a) and small on the abnormal, cirrhotic liver (b).
Applsci 08 00437 g006
Figure 7. Comparing the DPS values between normal () and abnormal cases () in four different types of grids with different scan directions and tag intervals by t test, the significance level has the maximum p value in 16 mm sagittal grid with p = 0.05, which is identical to the results from the BE method.
Applsci 08 00437 g007
Figure 8. Results of calculated bending energy (a) and the differences in power spectra (b) for normal () and abnormal cases ().
Applsci 08 00437 g008
Figure 9. Classification of normal cases () from abnormal cases () with two features: bending energy vs. difference in power spectrum by (a) automatic placement of landmarks vs. DPS from original image and (b) manually placing landmarks vs. DPS from the segmented liver image.
Applsci 08 00437 g009
Table 1. Average values of the difference in the power spectrum (DPS) 1.
Average DPS ValuesNormal LiverAbnormal LiverDifference between Two Groups
Type of MR Tagging Images
16 (mm), sagittal68.762.85.9
20 (mm), sagittal58.255.42.8
16 (mm), coronal54.269.25.0
20 (mm), coronal47.360.73.4
1 MR, magnetic resonance.
Table 2. The classification results for Figure 9b by SOMs (self-organizing maps) with the gold standard.
Gold StandardNormal LiverAbnormal Liver
SOM
Normal liver160
Abnormal liver117

