Article

Measurement of Strain and Strain Rate during the Impact of Tennis Ball Cores

1
Sports Technology Institute, Loughborough University, Loughborough LE11 3TU, UK
2
School of Materials Science & Engineering, Nanyang Technological University, Singapore 637551, Singapore
3
Institute for Sports Research, Nanyang Technological University, Singapore 637551, Singapore
*
Author to whom correspondence should be addressed.
Appl. Sci. 2018, 8(3), 371; https://doi.org/10.3390/app8030371
Submission received: 28 January 2018 / Revised: 1 March 2018 / Accepted: 1 March 2018 / Published: 4 March 2018
(This article belongs to the Special Issue Sports Materials)

Abstract

:
The aim of this investigation was to establish the strains and strain rates experienced by tennis ball cores during impact to inform material characterisation testing and finite element modelling. Three-dimensional surface strains and strain rates were measured using two high-speed video cameras and corresponding digital image correlation software (GOM Correlate Professional). The results suggest that material characterisation testing to a maximum strain of 0.4 and a maximum rate of 500 s−1 in tension and to a maximum strain of −0.4 and a maximum rate of −800 s−1 in compression would encapsulate the demands placed on the material during impact and, in turn, define the range of properties required to encapsulate the behavior of the material during impact, enabling testing to be application-specific and strain-rate-dependent properties to be established and incorporated in finite element models.

1. Introduction

Previous research assessing ball tracking data from professional tennis matches has established typical inbound impact conditions that the ball experiences, particularly when impacting court surfaces [1,2]. Knowledge of the impact conditions enables replication of typical impact conditions in the laboratory. Previous efforts to understand the behaviour of the ball core in isolation has focused, almost exclusively, on normal impacts with a rigid surface as a means of validating finite element (FE) simulations [3,4,5,6,7]. These simulations require characterisation of the mechanical behaviour of the rubber compound to predict the behaviour of the modelled ball core. Characterisation of ball core materials has so far been limited to quasi-static tensile, compressive, and stress relaxation testing. The issue with current test methods are the speeds and consequent achievable strain rates for testing. Typically, tensile tests have been conducted with a crosshead speed in the range of 50–999 mm∙min−1 [5]. Elastomeric materials are known to exhibit strain-rate-dependent behaviour, whereby stiffness increases as strain rate increases, particularly at high strain rates [8,9,10]. When defining material behaviour for FE simulations, it is desirable to match the properties of the material when it is subjected to the strains and strain rates observed during use, especially if significant increases in stiffness are observed as strain rate increases.
Previous modelling techniques have utilised an iterative process, comparing artificial stiffening of stress–strain data and alterations to damping factors with high-speed video footage and force trace data of impacts to establish a material model providing a realistic representation of the ball during impact [3,5]. In part, the use of artificial stiffening is a result of the limitations of available material testing equipment. Only through simulation have maximum strains and strain rates during impact been estimated. Cordingley [3] estimated maximum strains in the region of 0.5 with maximum strain rates in the region of 300 s−1. Allen [6] recorded maximum strains in the region of 0.3 for an impact against a rigid surface at 30 m∙s−1.
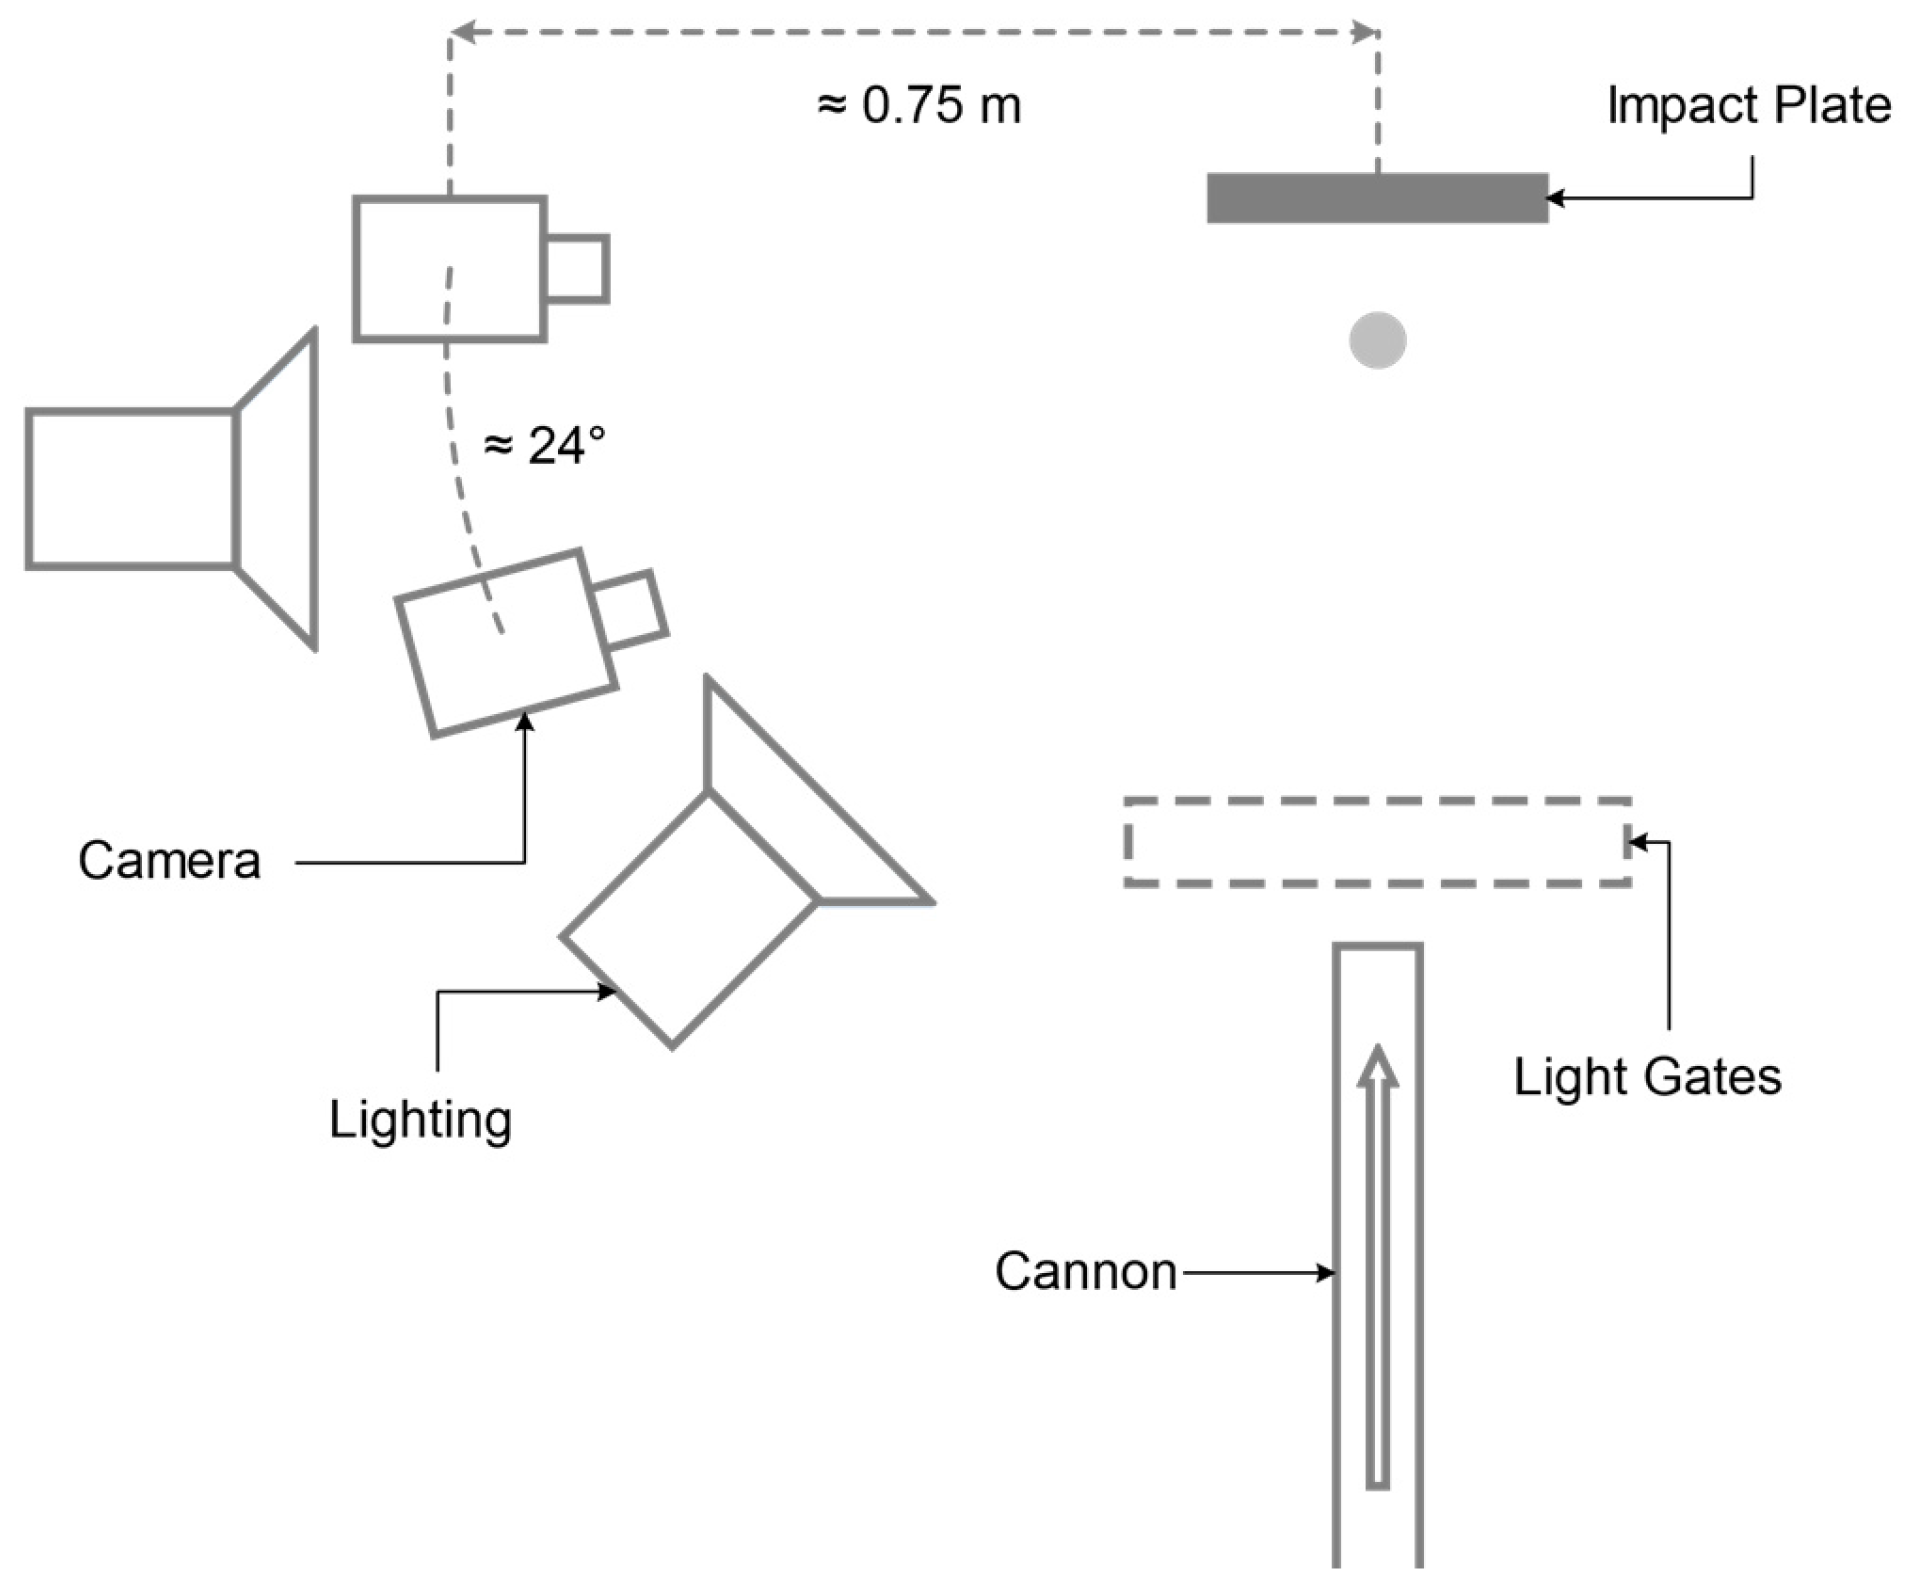
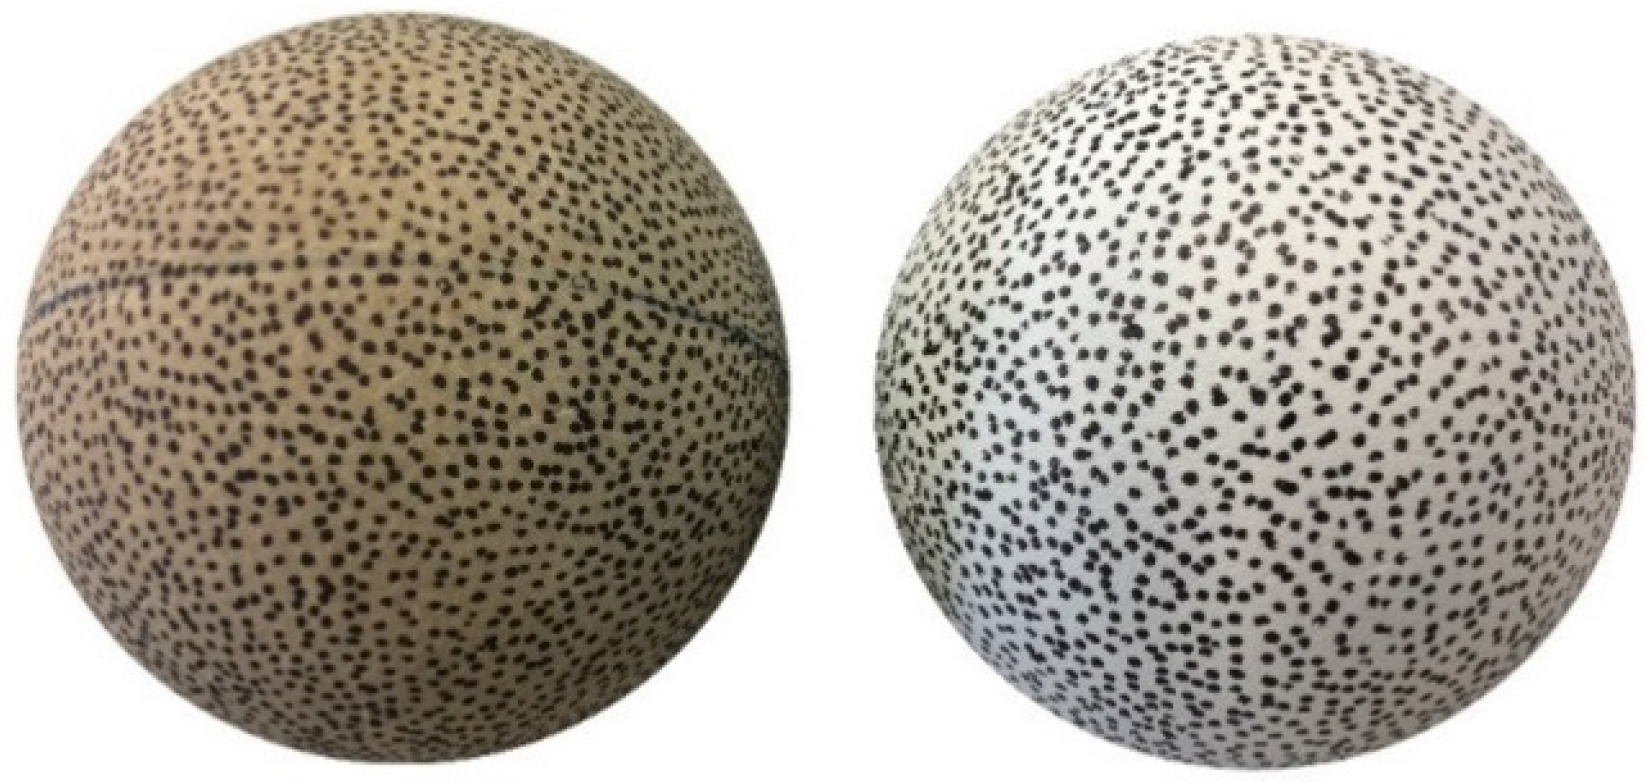
Traditional strain measurement devices such as strain gauges and extensometers do not lend themselves to high velocity ball impacts due to the associated connected electronics and possible alterations in deformation caused by the sensor being in contact with the surface. Optical strain measurement techniques utilising digital image correlation (DIC), such as GOM Correlate Professional (GOM GmbH, Braunschweig, Germany), provides a means of three-dimensional surface strain measurement utilising multiple cameras. GOM Correlate identifies stochastic image information, referred to as facets, by evaluating the grey values present within the facet. Optimal facets have a distinct and equally distributed pattern, with maximum possible contrast in grey values within the facet [11]. DIC could be employed to measure the strains and strain rates present during ball impacts and used to inform material characterisation testing, in turn enabling FE modelling to utilise, rather than techniques involving the artificial stiffening of quasi-static behaviour, material modelling techniques based on experimental data. Although not used to measure strain, GOM has been successfully implemented in a sporting context to measure golf ball and clubhead velocity [12].
The aim of this investigation was to establish the strains and strain rates experienced by tennis ball cores during impact, whereby the impact conditions are representative of professional play, in turn establishing the effectiveness of non-contact DIC for strain measurement during high-velocity, high-deformation sports ball impacts. A further aim was to define the range of strains and strain rates that material characterisation tests should incorporate to understand the material behaviour during use.

2. Materials and Methods

2.1. Equipment Set-Up

Ball cores were fired at a steel impact plate (15 mm thick) using a pneumatic cannon. The impact plate was positioned accordingly to achieve the desired impact angles, measured using a digital protractor. Two Photron Fastcam SA1.1 (Photron, San Diego, CA, USA) high-speed cameras were positioned approximately 0.75 m from the impact plate. The cameras were fixed to a beam, fitted to a tripod, and directed towards the centre of the impact plate, such that the angle between the cameras was approximately 24°. Light gates were positioned at the end of the barrel and connected to a counter, used to monitor ball speed and trigger video recording (Figure 1).

2.2. GOM

Both high-speed video cameras were fitted with 85 mm fixed focal length lenses (Zeiss planar T 1.4/85 mm ZF 2). The cameras operated as a pair to track the ball core during impact. The cameras were set-up for a capture volume around the impact plate of 275 × 275 × 275 mm. The high-speed video cameras were synchronised and set to trigger as the ball passed through the light gates upon leaving the barrel of the cannon. Images were recorded at a frequency of 12,000 Hz, and the resolution was adjusted depending on impact angle to maximise pixel coverage of the ball (Table 1). Shutter speed ranged from 1/71,000 to 1/74,000 to prevent image blur while allowing sufficient light exposure. The aperture of the lenses was set at f/5.6, as recommended by GOM, and additional lighting, in the form of two flicker free ARRISUN 1200 W lights were utilised to resolve the problem of reduced light exposure.
The volume of interest was calibrated in accordance with GOM instructions by capturing a series of images at full resolution (1024 × 1024 pixels) of a calibration object in multiple positions and orientations within the capture volume. The calibration object used was a GOM calibration panel, 200 mm × 160 mm in size. Calibration images were imported into GOM software (GOM Correlate Professional 2017, Braunschweig, Germany) and processed automatically given the specific details of the image sensor and calibration object used. A calibration file was produced and results given as to the quality of the calibration. As the cameras were repositioned to record at each impact angle, a separate calibration was performed for each, the results of which are given in Table 2. All calibrations were deemed successful as the quoted calibration deviation was less than 0.05 pixels, the maximum specified by GOM.

2.3. Details of Ball Core Preparation

Pressurised Wilson U.S. Open and pressureless Wilson Championship ball cores were used in the investigation. Twenty of each ball type were used, five balls per impact angle. Each ball was subjected to one impact per test speed, resulting in five impacts per core all at one given impact angle.
A stochastic pattern was applied to the cores using a black permanent marker to enable the GOM software to detect a surface and measure variables of interest (Figure 2). Due to the colour of the rubber compound of the pressureless ball cores, it was necessary to spray paint the cores matte white prior to applying the pattern. The contrast between the white paint and black permanent marker, comprising the pattern, was large enough for the GOM software to detect. The load-extension profiles for painted and non-painted samples highlighted the application of paint did not affect the stiffness of the rubber (Figure 3). The tests were conducted on a uniaxial test frame (Instron ElectroPuls E3000, Instron, High Wycombe, UK), which limited the test to quasi-static test speeds as high strain rate testing equipment was not available. Five repeats of each sample were tested (ISO 37 Type 1 sample size) at a speed of 400 mm∙min−1.
Prior to testing, each ball core was subject to pre-conditioning as defined by the ITF ball approval process [13]. Each core was acclimatised at 20 °C and 60% humidity for 24 h prior to testing using a climate chamber (Alpha 190H, Design Environmental Ltd., Ebbw Vale, U.K.). The ball cores were then subjected to 9 pre-compressions by 2.54 cm sequentially through 3 perpendicular axes using an Instron ElectroPuls E3000 dynamic test system to remove set in the rubber.

2.4. Data Collection

In total 200 impacts were recorded, 100 each for each type of ball core. Four impact angles and five ball speeds were selected (Table 3), predominantly based on the findings of [1,2], to best replicate the impact conditions experienced during professional play. A maximum of five impacts per ball ensured minimal degradation in ball performance and, predominantly, ensured optimal pattern quality for the GOM software to process, as this could be inhibited by marks and smudges to the stochastic pattern. The nature of the pneumatic cannon meant the randomisation of ball speed to minimise order effects was not feasible. As a result, each ball was tested from the fastest test speed to the slowest. This was deemed the most suitable compromise as it ensured the stochastic pattern was in the best condition under the most testing conditions (least impact frames and largest deformation) for the GOM software to process. Image capture was triggered as the ball passed through the light gates. The high-speed videos were cropped to exclude frames where the ball was not present and saved in individual folders for each camera as 8-bit TIFF images.

2.5. Data Processing

Images were imported into GOM Correlate Professional 2017 where a surface component was created. Maximal surface coverage was achieved with a facet size in the region of 15 pixels and point difference in the region of 10 pixels, whereby a facet is a square section of the image and the point difference is the distance, in pixels, between the centre points of adjacent facets. The surface parameters were coherent with GOM recommendations whereby the point distance should be approximately two thirds the facet size. An image approximately five frames prior to impact was selected as the reference frame, against which all other strain calculations were compared. It was therefore assumed the ball core was under no strain at this point in time. Assuming zero strain was deemed valid due to the non-contact nature of the pneumatic cannon, subjecting the ball to minimal deformation on firing. Furthermore, on visual inspection and through use of GOM, no significant change in ball shape or surface strain was apparent prior to impact. Major and minor nominal strain, major and minor nominal strain rate and velocity were calculated in GOM and exported as CSV files. The frame of first and last contact with the impact plate were noted and used to define the frames of interest when analysing strain and strain rate.
Each CSV file contained the three-dimensional coordinates of each surface point alongside the strain, strain rate and velocity values for an individual frame. The number of surface points exported per file varied depending on how much of the surface defined in the reference frame was visible in that particular frame. Results were further processed in Matlab R2015b (Mathworks, Natick, MA, USA) to assess the frequency distribution of strain and strain rate during impact.
Major and minor strains were calculated by GOM using the principal axis transformation of the strain tensor. The principal axis transformation provided eigenvalues and eigenvectors for the new orthonormal basis of the strain tensor. The larger eigenvalue defined the major strain and the smaller eigenvalue defines the minor strain, with the direction of the strains defined by the corresponding eigenvectors (Figure 4). Major and minor strain rate were defined as the change in corresponding strain divided by the change in time.
To determine the maximum absolute strain for each element of the surface, the major and minor strains of the element were compared to determine the greatest absolute strain value. The value of greatest magnitude was selected for strain and the corresponding strain rate value was also selected based on the magnitude of the major and minor strain. The mean and standard deviation of strain and strain rate were calculated across all elements for all frames during impact, across all repeats. The frequency distribution of strain and strain rate was also assessed. The mean velocity of all elements of the surface prior to impact was used to define the pre-impact ball velocity.

3. Results

To determine the ideal test conditions for material characterisation tests it was necessary to understand the strains and strain rates present under the most extreme impact conditions, to endeavour to capture the material behaviour within that range. Consequently, a select number of the impact conditions tested have been analysed in detail in this paper. The following subset of test conditions described in Table 3 were selected for analysis: 18° at 22.1 m∙s−1; 40° at 52.5 m∙s−1; 90° at 30.5 m∙s−1, 90° at 52.5 m∙s−1.
The largest mean strain during impact occurred for impacts at 40° and 52.5 m∙s−1, warranting further analysis. Similarly, the largest mean strain rate during impact occurred for impacts at 90° and 52.5 m∙s−1. Impacts tested at 90° with either of the two fastest impact speeds (43.1 m∙s−1, 52.5 m∙s
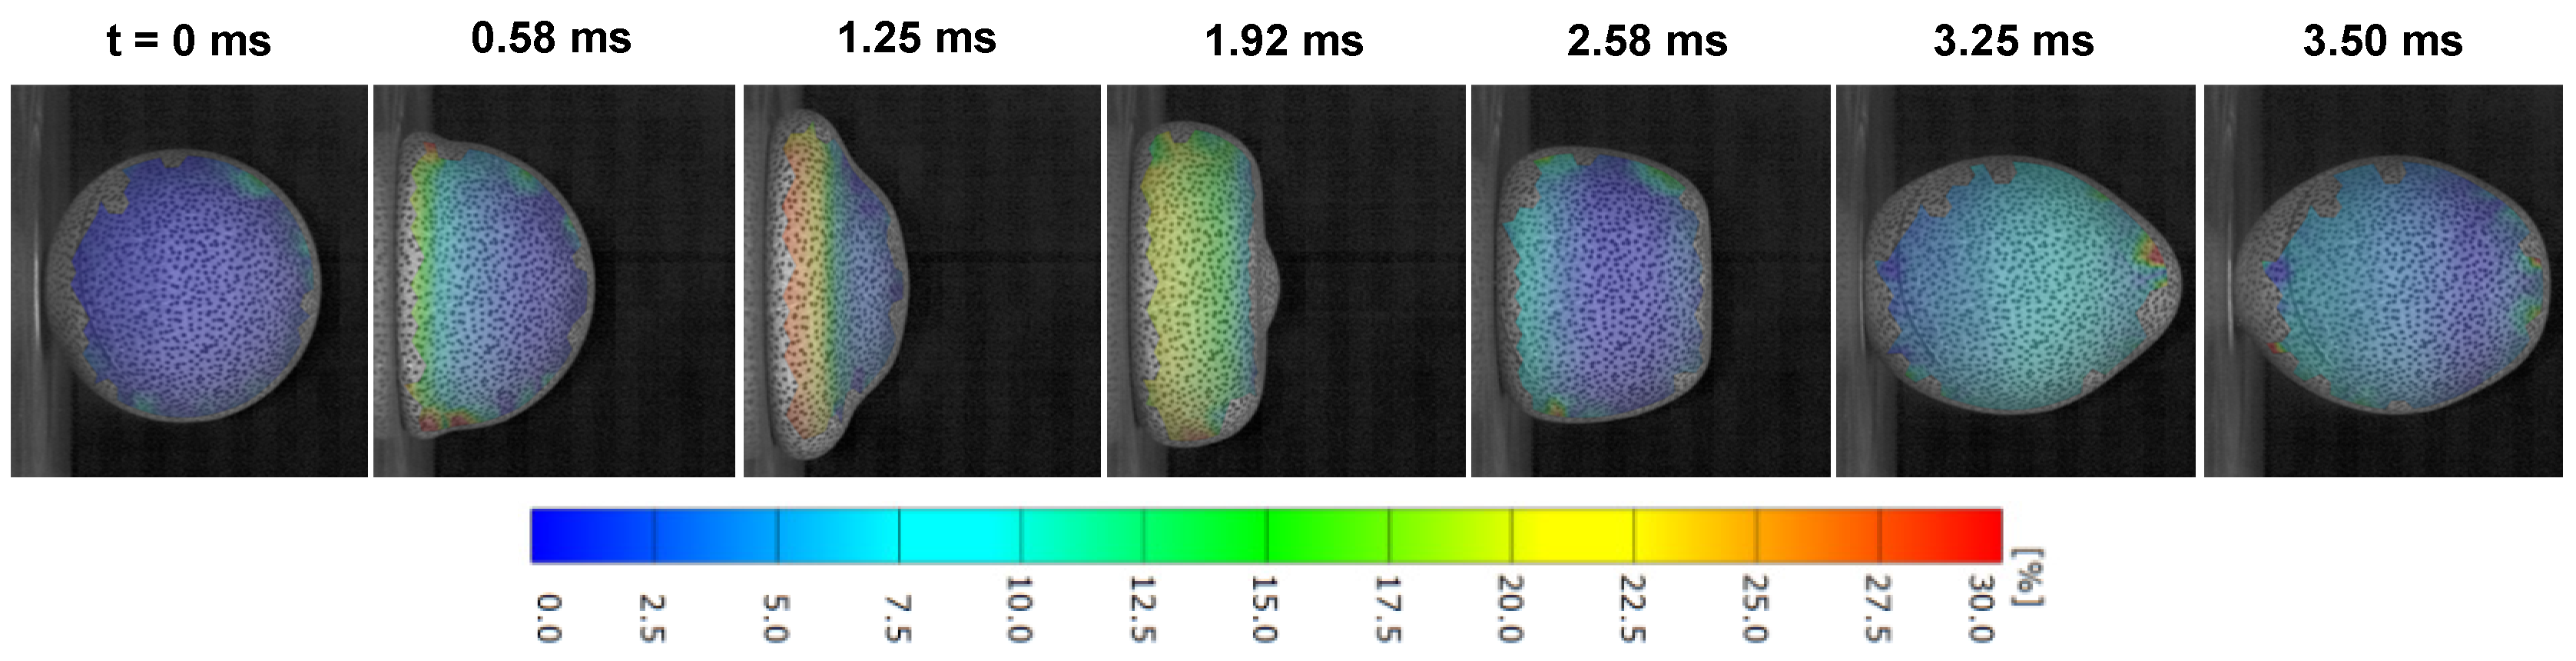
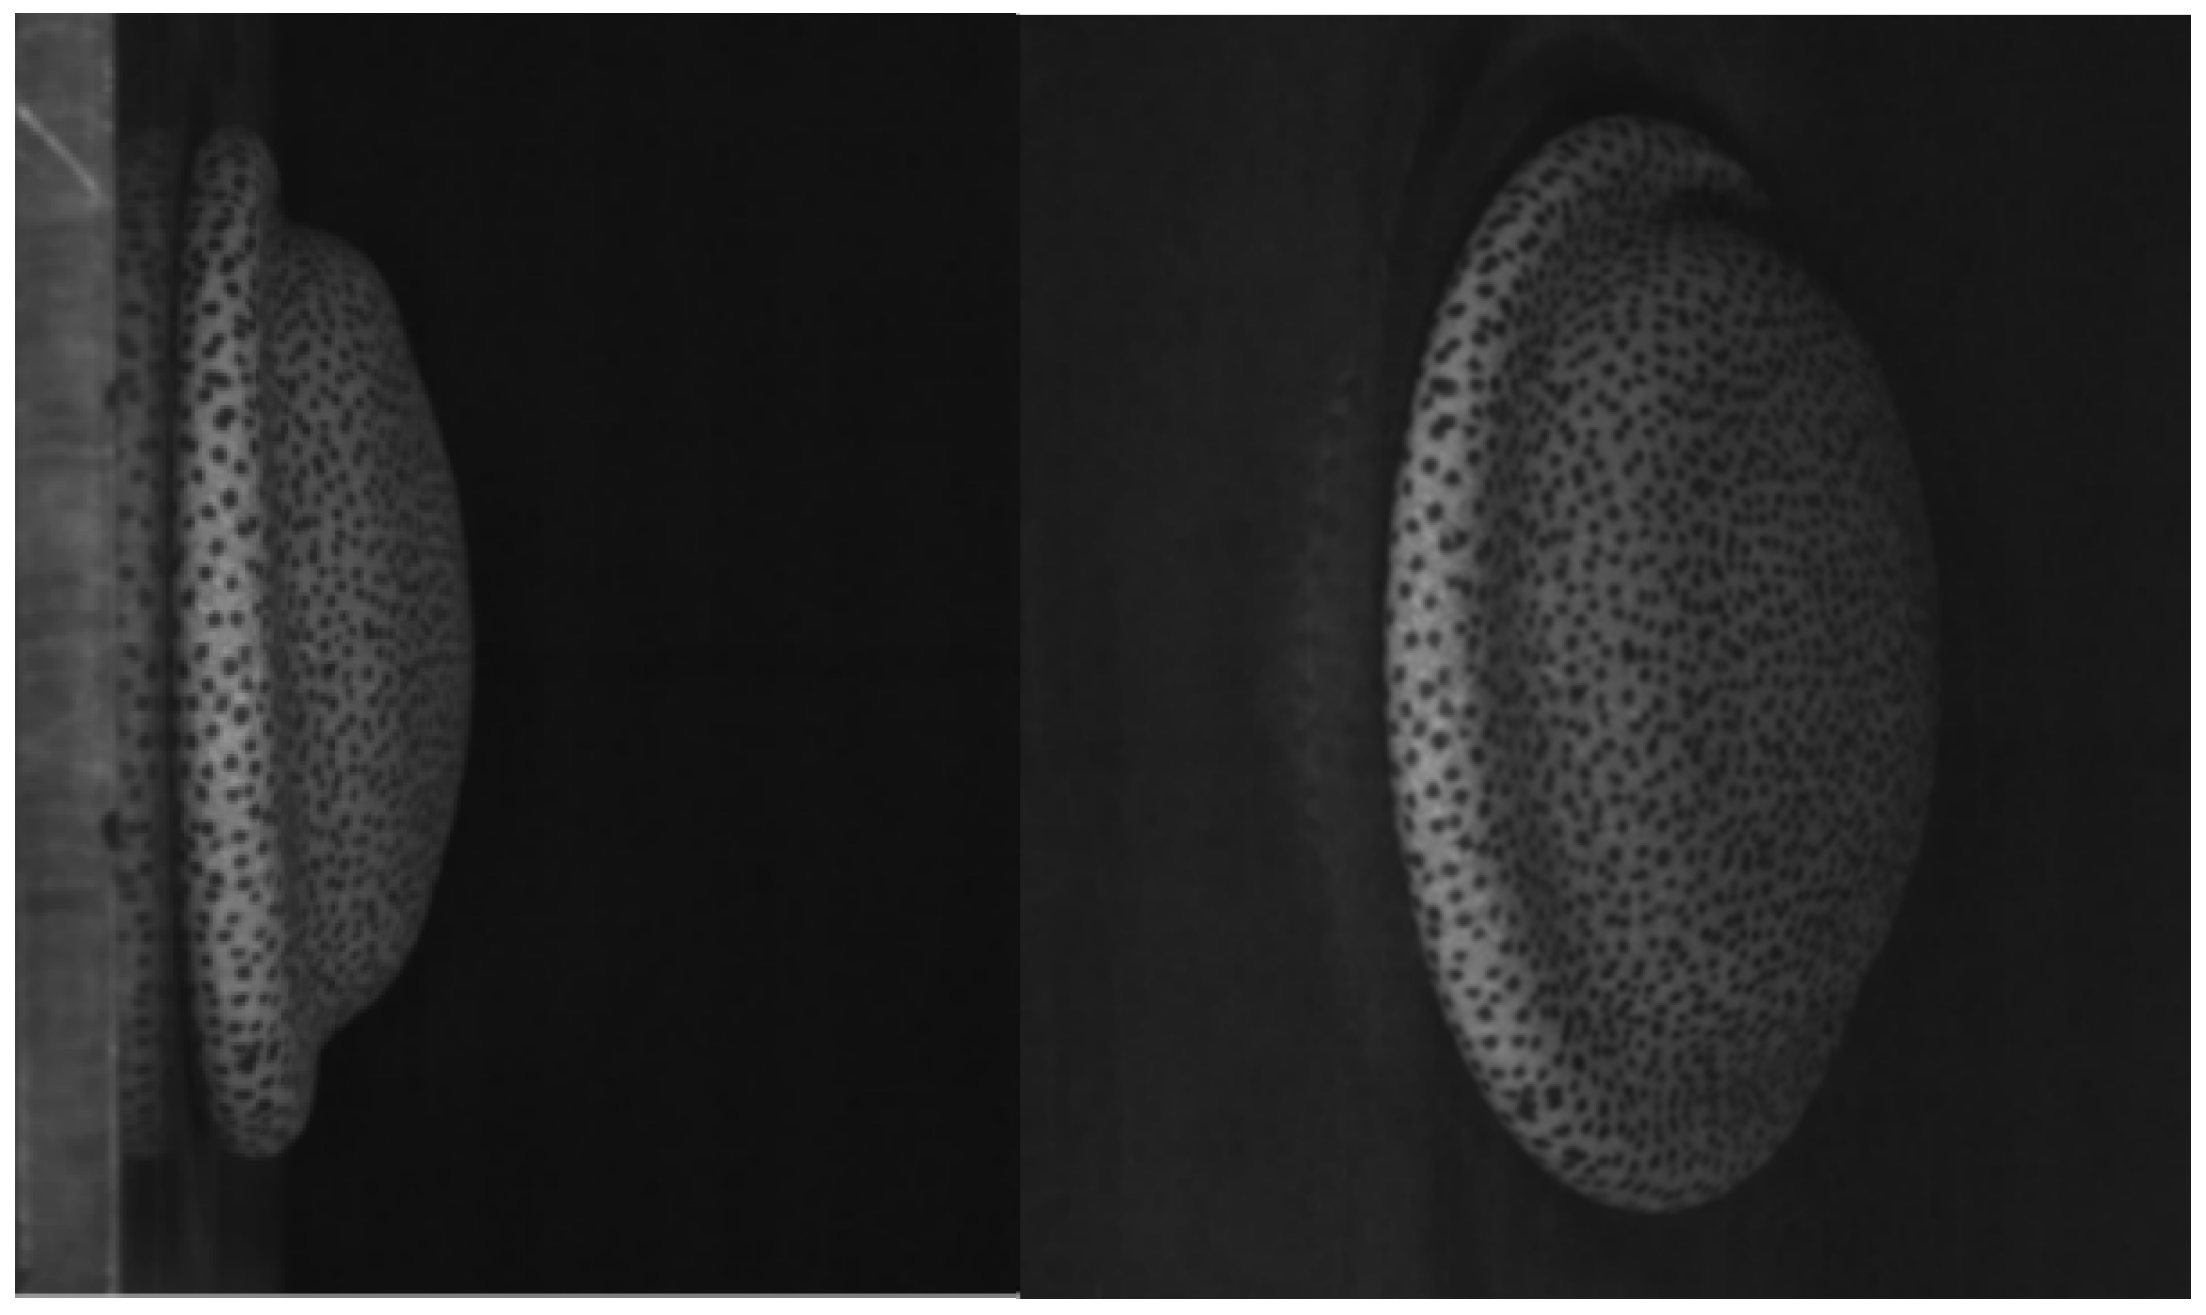
−1) were found to lose surface tracking during impact, resulting in one or more frames where GOM was unable to compute a surface. Unlike impacts at 30.5 m∙s−1 where the surface was tracked throughout impact duration (Figure 5). Loss of surface tracking occurred for both pressurised and pressureless ball cores due to the extreme levels of deformation, as shown in Figure 6. The 90° and 30.5 m∙s−1 impact condition was selected to include impacts at 90° whereby the surface of the ball was tracked throughout impact as opposed to partially tracked. The impact condition representing the mean surface impact angle and ball speed found during professional play [1] was included to provide a benchmark against a more typical impact scenario.

3.1. Impact Ball Speed

Ball speed prior to impact was dependent on the air pressure setting within the pneumatic cannon system, rather than setting ball speed directly. The pressure within the system drifts resulting in alteration of the air pressure prior to each impact, consequently, the actual ball speed on impact varied. Mean ball speed for each speed and angle impact combination are given in Table 4. The maximum difference in mean ball speed to desired ball speed was −4.6 m∙s−1 with a mean difference of −0.6 ± 1.4 m∙s−1 when considering all impact conditions.

3.2. Impact Strain

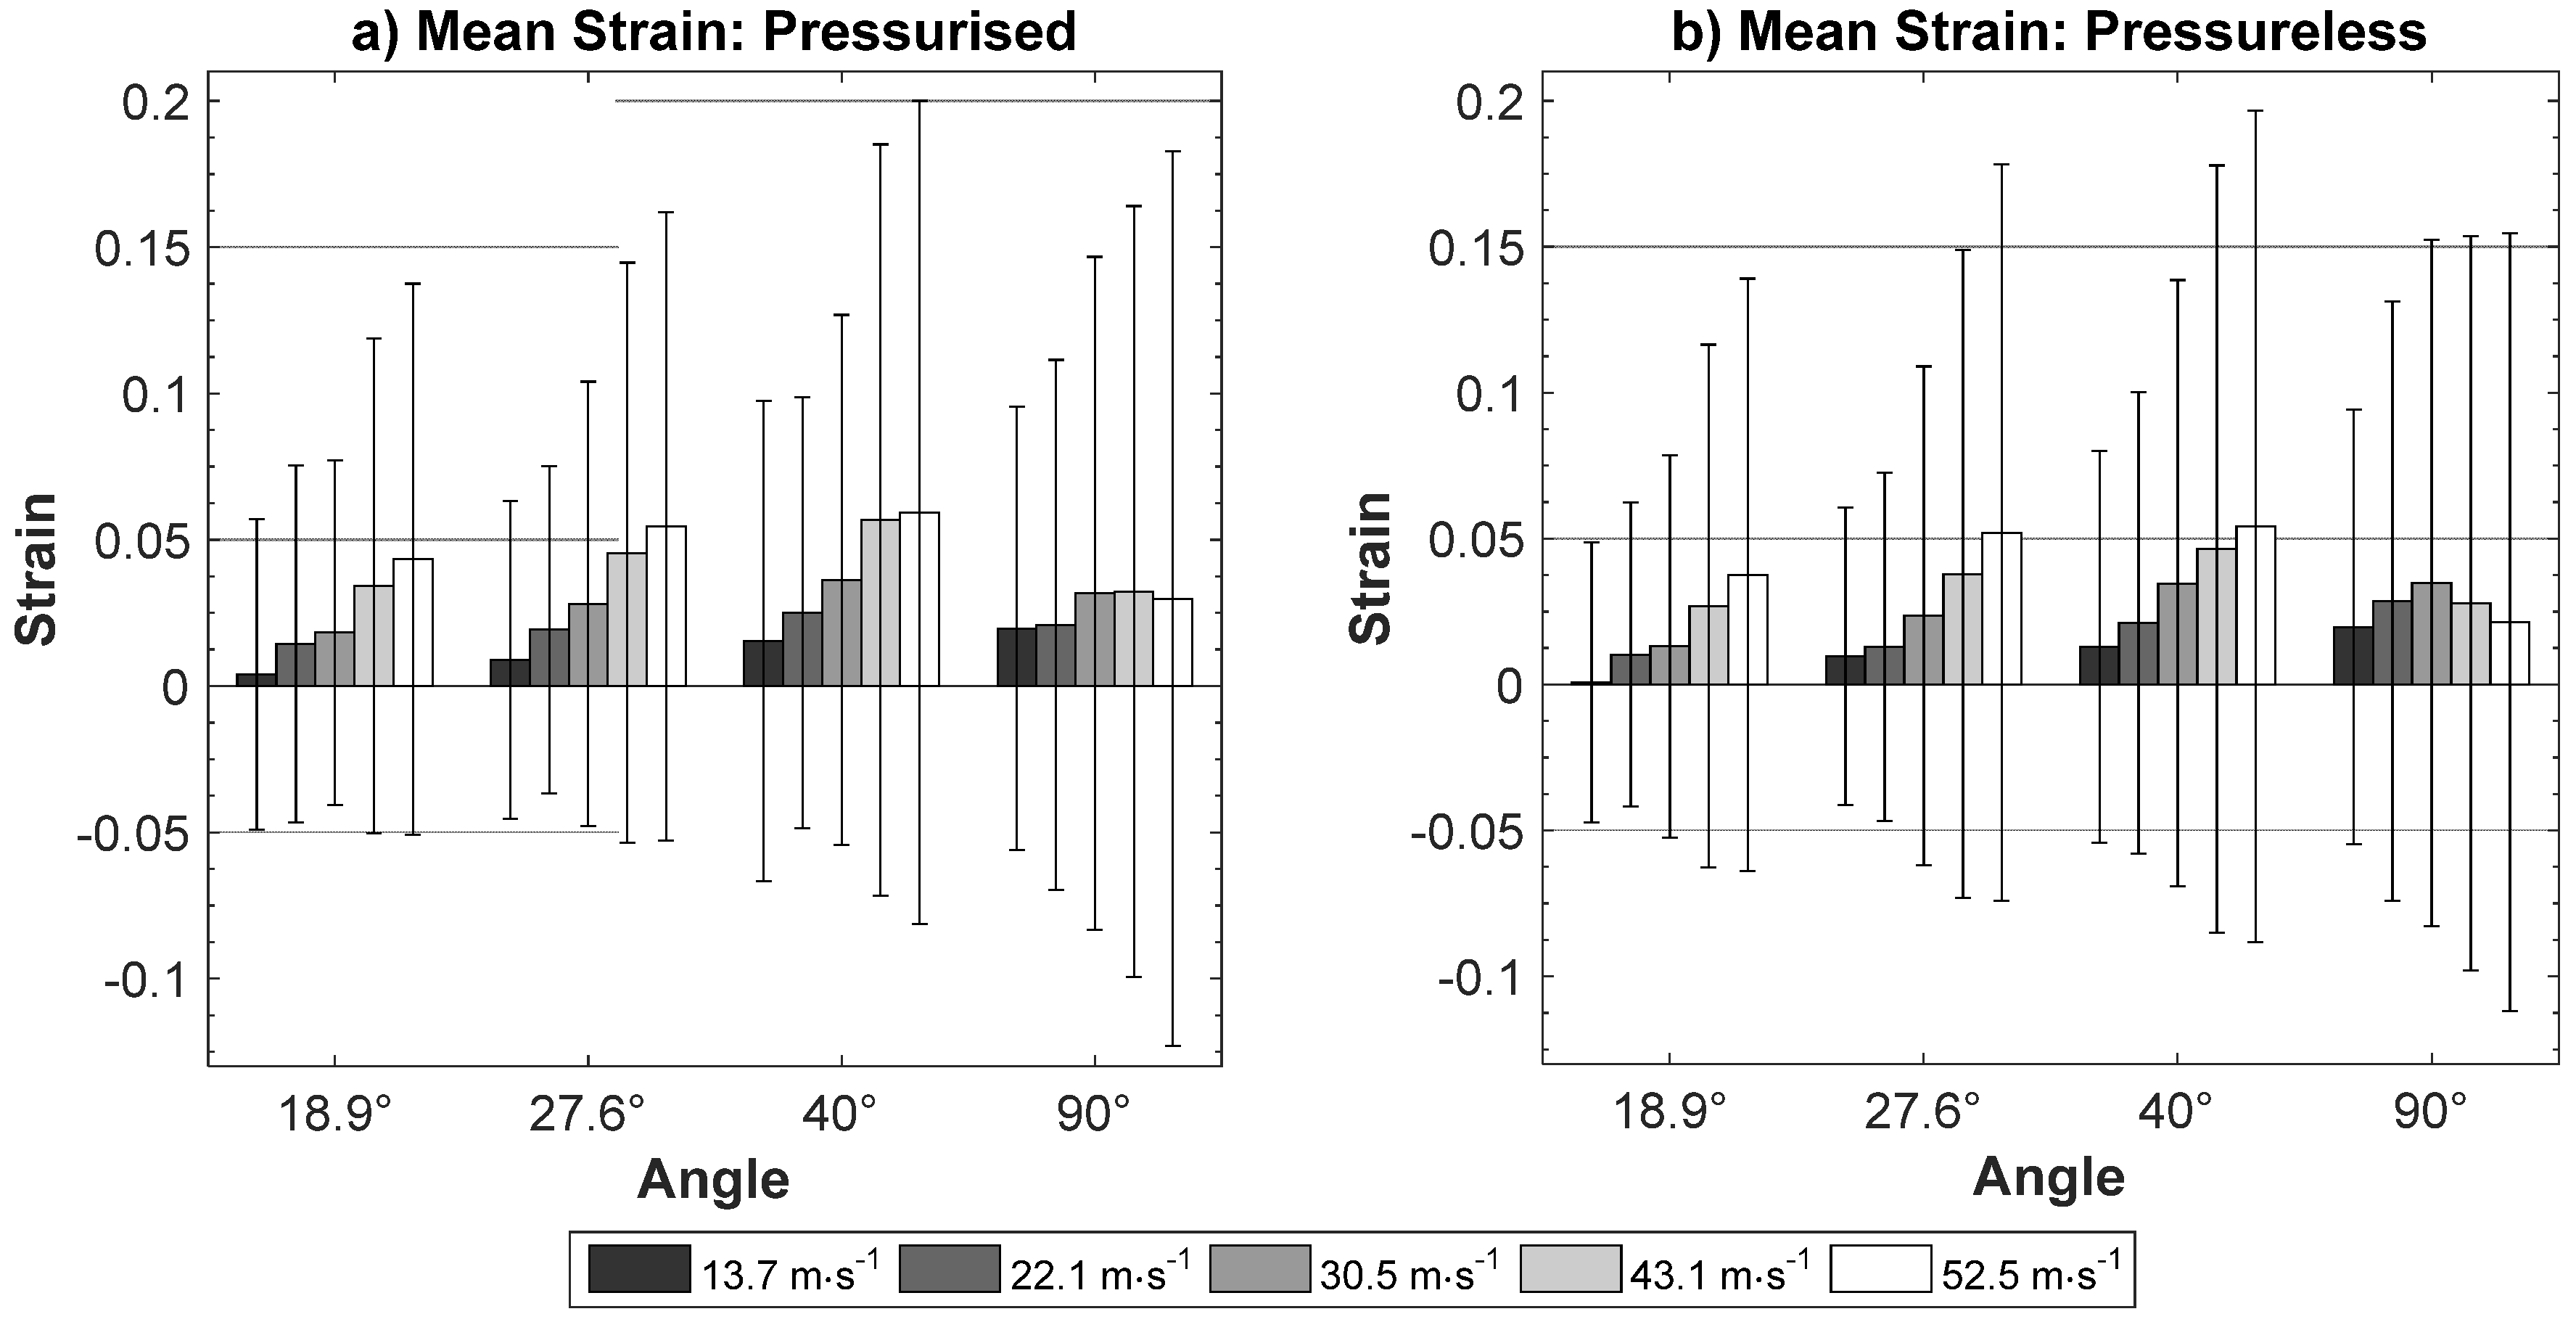
Figure 7 highlights that mean strain during impact increased with both impact angle and, to a greater degree, impact velocity. The exception being the mean strain for impacts at 90° with an impact velocity of 43.1 m∙s−1 or greater which showed either no increase or a reduction in mean strain, a likely consequence of loss of surface computation at the largest deformations (e.g., Figure 6). The maximum mean strain occurred for impacts at 40° and 52.5 m∙s−1 for both pressurised (0.06 strain) and pressureless ball cores (0.054 strain). Similarly, the minimum mean strain value occurred for impacts at 18.9° with in impact velocity of 13.7 m∙s−1.
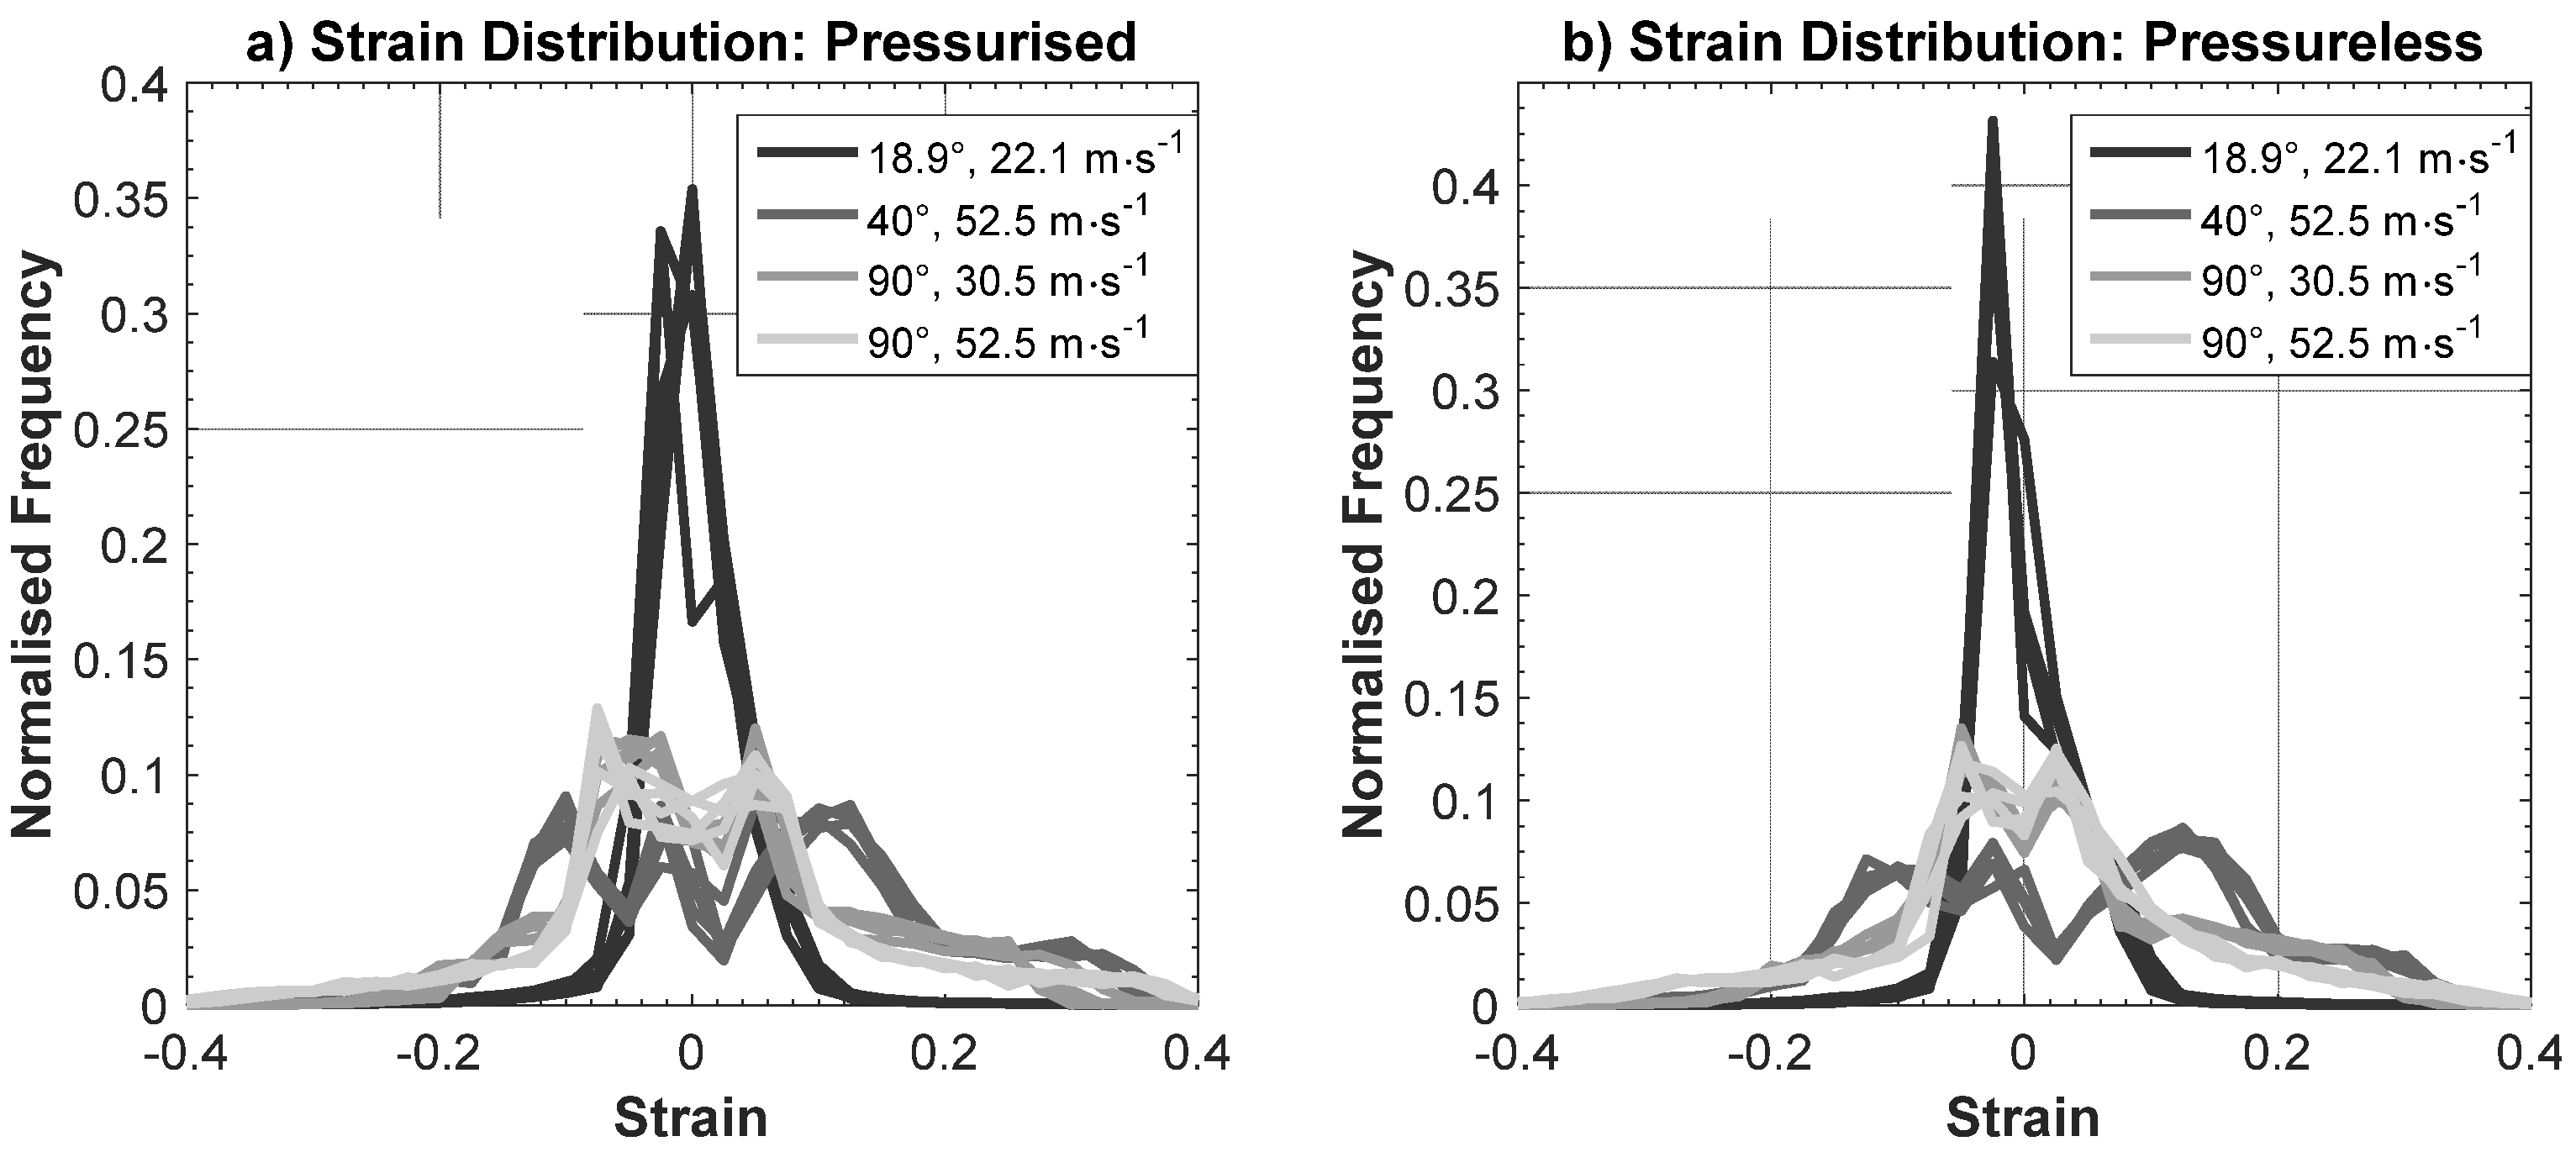
Over 95% of strain measured was distributed between −0.1 and 0.1 strain for impacts at 18.9° with an impact velocity of 22.1 m∙s−1 (Table 5). The remaining impact conditions at higher impact angles and faster impact speeds were more widely distributed (Figure 8). Table 5 also highlights a higher percentage of tensile (positive) strain is present than compressive (negative) strain, and was present to a greater degree at larger strains. For example, 8.4% of strain on average was distributed between 0.2 and 0.3 strain, compared to 2.1% for strains between −0.3 and −0.2, a trend present across all conditions except impacts at 18.9° and 22.1 m∙s−1.

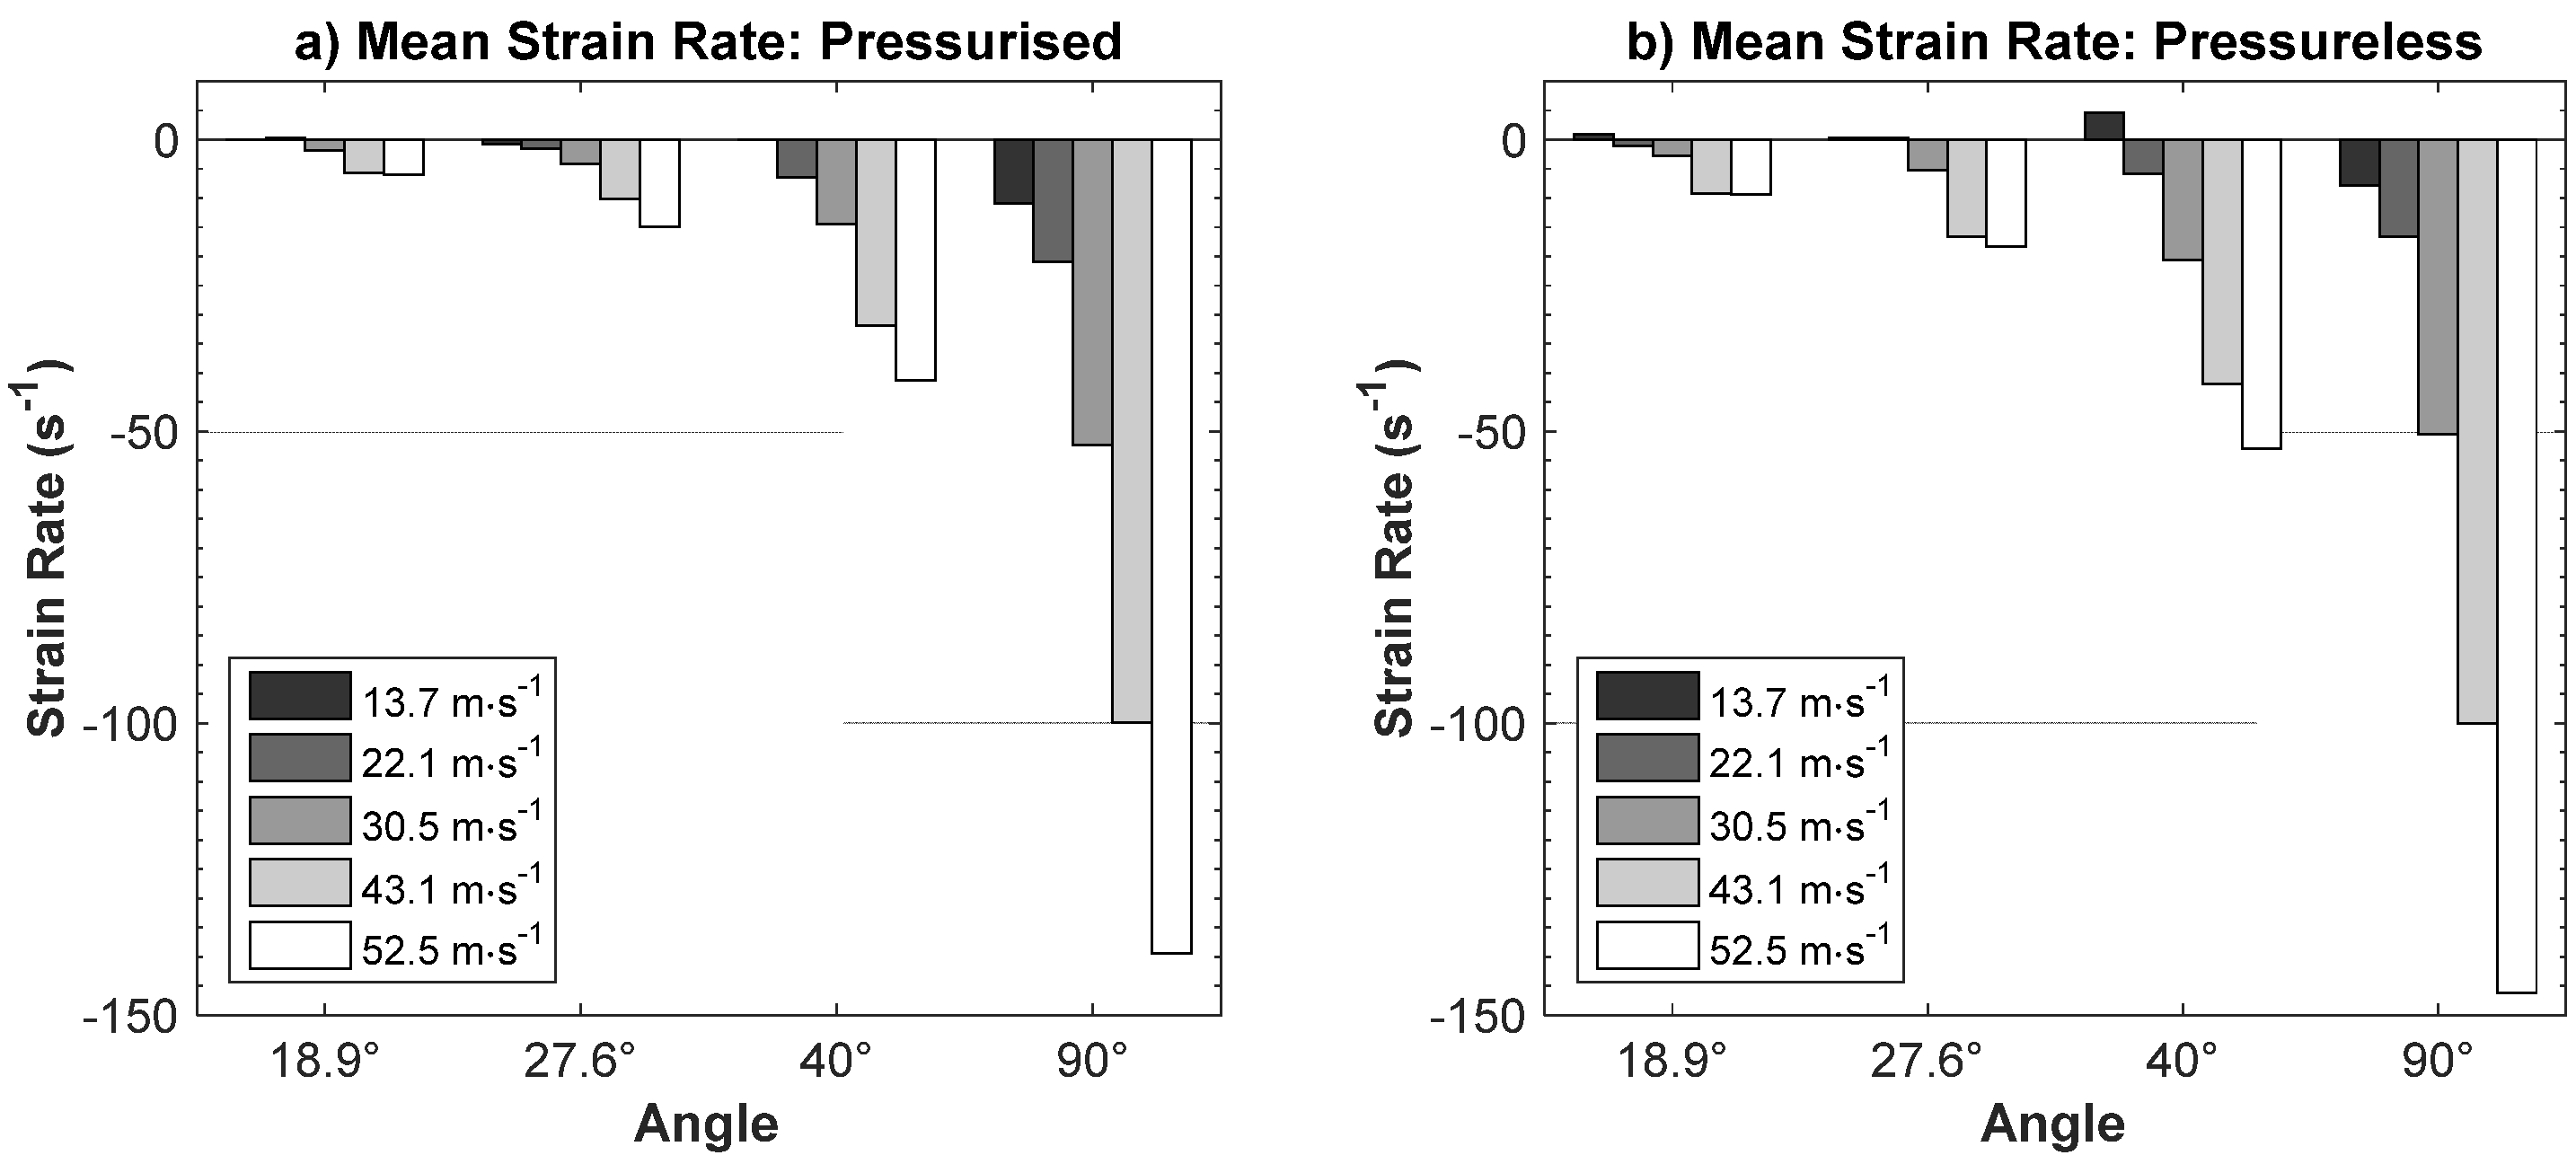
3.3. Impact Strain Rate

In general, mean strain rate during impact increased in magnitude (in the negative direction) as impact speed at a given angle increased (Figure 9). Likewise, for a given impact speed the mean strain rate during impact increased in magnitude as the impact angle tended towards normal. Consequently, the mean strain rate of greatest magnitude occurred for impacts at 90° and 52.5 m∙s−1 for both pressurised (−139 s−1) and pressureless ball cores (−146 s−1). The impact case representing the mean surface impact conditions (18.9°, 22.1 m∙s
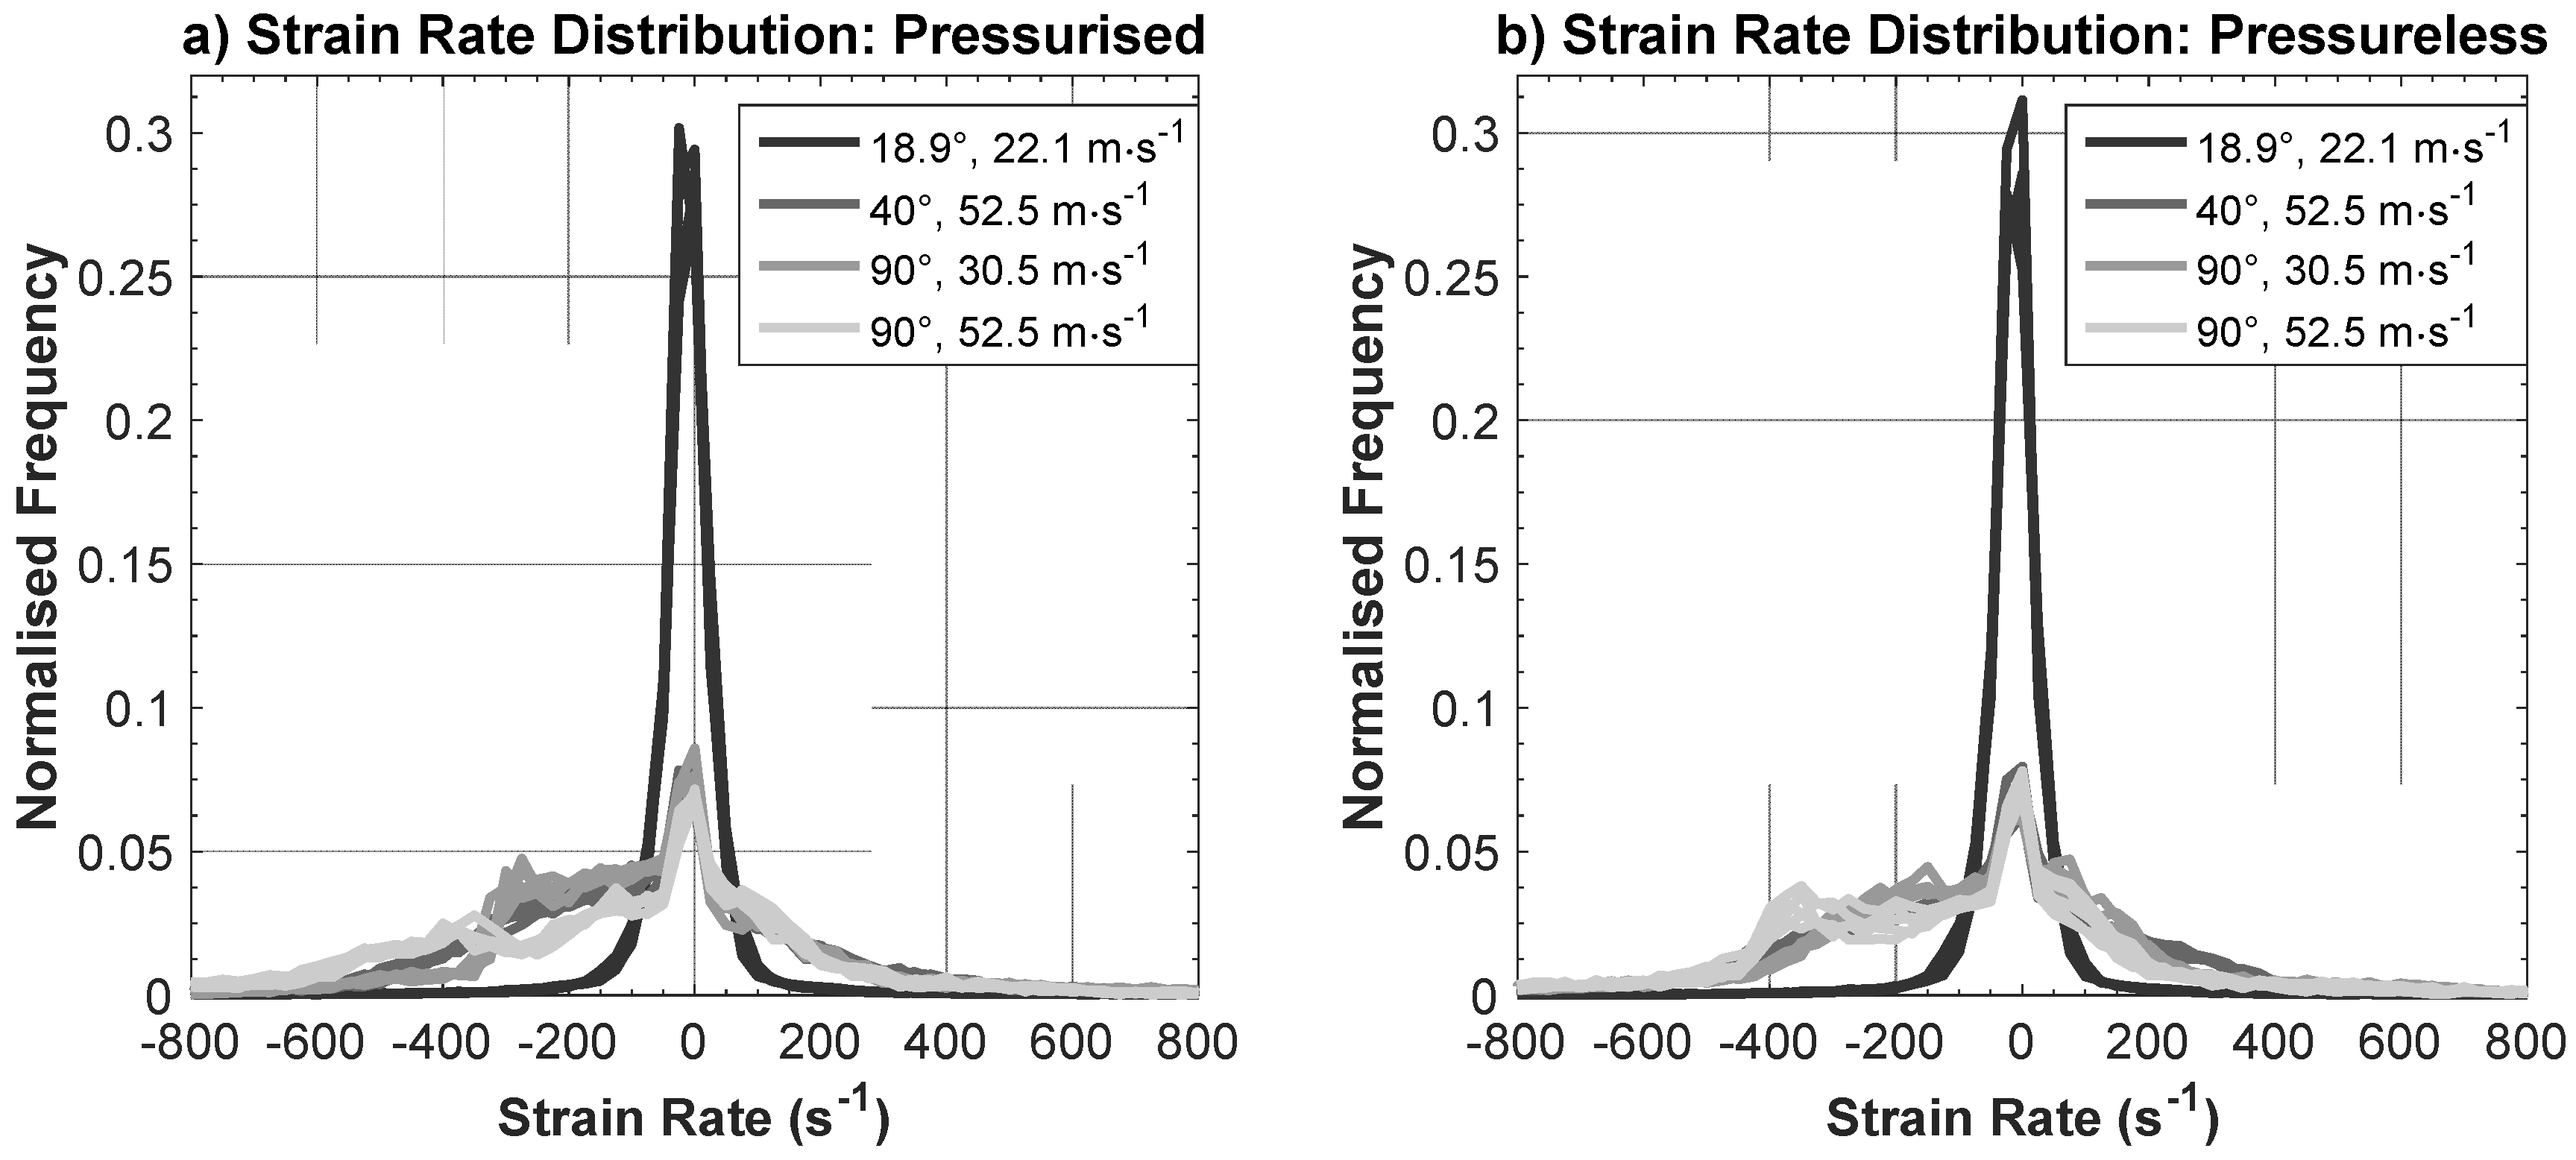
−1) was distributed evenly either side of zero. All other impact conditions were shifted in the negative direction, with negative strain rates accounting for around 60% of the distribution (Figure 10). No impact condition was found to have greater than 1% of the distribution whereby the strain rate was greater in absolute magnitude than 800 s−1 (Table 6).

4. Discussion

The results of this investigation highlight that both compressive and tensile strains were experienced during impact with a rigid plate. Regarding maximum strain values, tensile strains above 0.4 were uncommon, with frequency distributions highlighting that no frequency bin above a 0.4 strain contained more than 1% of the distribution. Consequently, material characterisation of ball core rubber in tension should test at a 0.4 strain to encapsulate the range seen during impact.
Experimental impacts of the pressurised ball core at 40° and 90° with an impact ball speed of 52.5 m·s−1 had approximately 5% of strain distributed between 0.3 and 0.4, further evidence that 0.4 strain is the minimum desirable tensile strain for testing tennis ball rubber. These findings are slightly lower than the findings of Cordingley [3], who suggested that strains in the region of 0.5 can be observed during impact, which is more in keeping with the results of Allen [6].
Assessing the observed tensile strain rate measured by GOM highlighted that all impact conditions other than the mean surface impact condition (18°, 22.1 m∙s−1) had around 1% of the distribution between 500 and 600 s−1, no frequency bin above 300 s−1 accounted for more than 3.5%. Cordingley [3,4] reported maximum strain rates during ball core impacts of approximately 300 s−1. The results presented in this investigation indicated that tensile strain rates in the region of 600 s−1 were apparent, but to a limited degree (<1%). The ability to characterise the material at this rate would be optimal, but capturing material behaviour with a strain rate up to and including rates in the region of 500 s−1 would capture the vast majority of tensile strain rates experienced during impact.
Maximum observed compressive strains from GOM analysis suggested that strains up to −0.4 were present for impacts at 90° and 52.5 m∙s−1, accounting for around 1% of the distribution. Negligible amounts of strain (<0.2%) were measured for compressive strains greater in magnitude than −0.4. The results suggest that material characterisation in compression would encapsulate the vast majority (>95%) of observed compressive strain during impact if tested to strains of −0.4, whilst testing to strains of −0.3 may be sufficient depending on the severity of the impact conditions.
Only impacts at 90° and 52.5 m·s−1 had more than 1% of the distribution greater in magnitude than −800 s−1. The remaining impact conditions highlighted a maximum compressive strain rate closer to −700 s−1. Frequency bins between −400 and −800 s−1 for the 90°, 52.5 m·s−1 impact condition account for more than double the percentage of the other impact conditions. Missing frames or obstructed surface coverage likely resulted in an overrepresentation of results between −400 and −800 s−1. These results appear to be consistent with results in the literature. Allen [6] highlighted a maximum strain for simulation at 30 m·s−1 of 0.3, consistent with GOM results for 90° and 30.5 m·s−1, whereby all frequency bins above a 0.3 strain contained less than 1% of the distribution.
GOM distributions for the mean surface impact test case (18°, 22.1 m∙s−1) appear to follow a normal distribution, but the remaining cases do not. For strain, these distributions have multiple peaks rather than one distinct peak around zero, whilst the strain rate distributions are skewed in the negative direction, with negative strain rates accounting for around 60% of the distribution.
The strain rates presented in this investigation are in the 100–1000 s−1 order of magnitude, at which strain-rate-dependent behaviour has been observed in vulcanised rubbers [8,9,10]. To test at rates in this order of magnitude, a bespoken test rig (similar to that used by Hoo Fatt & Bekar [9]) or more complex testing equipment, such as a split Hopkinson pressure bar, is required. Characterisation at strain rates between 100–1000 s−1 would confirm if this rate-dependent behaviour is present in ball core rubber under the conditions experienced during use. Should significant rate dependence be observed, the incorporation of more complex material models (compared to hyperelastic models) incorporating this behaviour can be utilised in finite element models of ball impacts. Furthermore, should minimal strain rate dependence be observed, the process of artificial stiffening of hyperelastic material models to represent ball core rubber, as utilised previously [3,4,5], should no longer be employed. Additionally, different material compounds can be compared at representative strain and strain rates when assessing potential new compounds for use as ball core rubber.
GOM is limited by the surface coverage, which is dependent on camera positions and relative placement. Clearly with one camera pair, it is not possible to obtain full surface coverage, particularly as the underside of the ball is obscured by the impact plate. Furthermore, it is only possible to measure parts of the object that are visible, so strains through the thickness of the material and on the inside surface of the cavity cannot be measured.
Increased ball coverage could be achieved using additional cameras. A calibration of each camera ‘pair’ would be required in addition to the calibration of a global reference frame, to which all surface analysis could be transposed and combined to achieve more complete coverage. The time required to capture and process the data would greatly increase, however, and access to multiple high-speed cameras with each pair of cameras requiring matching lenses would be required.

5. Conclusions

DIC has been shown to be a useful tool in determining the strains and strains rates present during the impact of tennis ball cores against a rigid surface; however, at the upper limits (52.5 m∙s−1, 90°), deformations can become too large to maintain surface coverage.
The results suggest that material characterisation testing to a maximum strain of 0.4 and a maximum rate of 500 s−1 in tension and a maximum strain of −0.4 and a maximum rate of −800 s−1 in compression would encapsulate the demands placed on the material during impact.
Knowledge of the strains and strain rates present during impact allows for material characterisation under these conditions. In turn, material modelling techniques capable of capturing the strain-rate-dependent behaviour can be employed. Furthermore, the surface strain analysis can be utilised as a means of validating FE simulations of the ball core.

Acknowledgments

The authors would like to thank Wilson Sporting Goods for supplying the ball cores used in this study.

Author Contributions

Ben Lane, Paul Sherratt, Xiao Hu and Andy Harland were involved in conceiving and designing the experiments. Ben Lane performed the experiments. Ben Lane and Paul Sherratt analysed the data and wrote the paper.

Conflicts of Interest

The authors declare no conflict of interest.

References

  1. Lane, B.; Sherratt, P.; Hu, X.; Harland, A. Characterisation of ball degradation events in professional tennis. Sports Eng. 2017, 20, 185–197. [Google Scholar] [CrossRef]
  2. Lane, B.; Sherratt, P.; Xiao, H.; Harland, A. Characterisation of ball impact conditions in professional tennis: Matches played on hard court. Proc. Inst. Mech. Eng. Part P J. Sports Eng. Technol. 2015, 230, 236–245. [Google Scholar] [CrossRef] [Green Version]
  3. Cordingley, L. Advanced Modelling of Surface Impacts from Hollow Sports Balls; Loughborough University: Loughborough, UK, 2002. [Google Scholar]
  4. Cordingley, L.P.; Mitchell, S.R.; Jones, R. Measurement and modelling of hollow rubber spheres: Surface-normal impacts. Plast. Rubber Compos. 2004, 33, 99–106. [Google Scholar] [CrossRef]
  5. Sissler, L. Advanced Modelling and Design of a Tennis Ball; Loughborough University: Loughborough, UK, 2012. [Google Scholar]
  6. Allen, T.B. Finite Element Model of a Tennis Ball Impact with a Racket; Sheffield Hallam University: Sheffield, UK, 2009. [Google Scholar]
  7. Goodwill, S.R.; Kirk, R.; Haake, S.J. Experimental and finite element analysis of a tennis ball impact on a rigid surface. Sports Eng. 2005, 8, 145–158. [Google Scholar] [CrossRef]
  8. Bergström, J.S.; Boyce, M.C. Large strain time-dependent behavior of filled elastomers. Mech. Mater. 2000, 32, 627–644. [Google Scholar] [CrossRef]
  9. Fatt, M.S.; Bekar, I. High-speed testing and material modeling of unfilled styrene butadiene vulcanizates at impact rates. J. Mater. Sci. 2004, 39, 6885–6899. [Google Scholar] [CrossRef]
  10. Roland, C.M. Mechanical behavior of rubber at high strain rates. Rubber Chem. Technol. 2006, 79, 429–459. [Google Scholar] [CrossRef]
  11. GOM. Digital Image Correlation and Strain Computation Basics; GOM: Braunschweig, Germany, 2016. [Google Scholar]
  12. Leach, R.J.; Forrester, S.E.; Mears, A.C.; Roberts, J.R. How valid and accurate are measurements of golf impact parameters obtained using commercially available radar and stereoscopic optical launch monitors? Measurement 2017, 112, 125–136. [Google Scholar] [CrossRef]
  13. International Tennis Federation (ITF). ITF Approved Tennis Balls, Classified Surfaces & Recognised Courts; ITF: London, UK, 2017. [Google Scholar]
Figure 1. Plan view of lab set-up.
Applsci 08 00371 g001
Figure 2. Ball preparation. Left: pressurised ball core; Right: pressureless ball core.
Applsci 08 00371 g002
Figure 3. Effect of paint on the load-extension response pressureless ball core rubber (mean of five repeats displayed for painted and non-painted tensile samples).
Applsci 08 00371 g003
Figure 4. Major and minor strain definition, calculated using the eigenvectors (e1, e2) on deformation of the facet.
Applsci 08 00371 g004
Figure 5. Surface coverage and major stain (%) during impact (30.5 m∙s−1, 90°). t = time in milliseconds.
Applsci 08 00371 g005
Figure 6. Example impact frames with loss of surface tracking for impacts at 52.5 m∙s−1 and 90°.
Applsci 08 00371 g006
Figure 7. Mean strain during impact for pressurised (a) and pressureless (b) ball cores.
Applsci 08 00371 g007
Figure 8. Strain distribution during impact for pressurised (a) and pressureless (b) ball cores.
Applsci 08 00371 g008
Figure 9. Mean strain rate during impact for pressurised (a) and pressureless (b) ball cores.
Applsci 08 00371 g009
Figure 10. Strain rate distribution during impact for pressurised (a) and pressureless (b) ball cores.
Applsci 08 00371 g010
Table 1. Camera settings for each impact angle.
Impact AngleShutter SpeedImage Resolution
18.9°1/74,0001024 × 496
27.6°1/74,0001024 × 496
40°1/71,000960 × 528
90°1/74,0001024 × 496
Table 2. GOM calibration results.
Impact AngleCalibration DeviationMeasuring Volume
18.9°0.020 pixels275 × 275 × 275 mm
27.6°0.020 pixels275 × 275 × 275 mm
40°0.019 pixels275 × 280 × 280 mm
90°0.019 pixels280 × 280 × 280 mm
Table 3. Impact condition selection.
Impact Angle (°)Reasoning
18.9Mean surface impact angle
27.6Mean surface impact angle plus one standard deviation
40Intermediate case between surface impact angles results and normal impacts
90Simplified impact case, comparable to previous FE simulations
Ball Speed (m∙s−1)-
13.7Mean pre-surface impact ball speed minus one standard deviation
22.1Mean pre-surface impact ball speed
30.5Mean pre-surface impact ball speed plus one standard deviation
43.1Mean second serve ball speed (Men’s)
52.5Mean 1st serve ball speed (Men’s)
Table 4. Mean pre-impact ball speed ± one standard deviation (SD) for impact conditions of interest.
Angle (°)Desired Ball Speed (m∙s−1)PressurisedPressureless
Mean ± SDMean ± SD
18.922.122.9 ± 1.123.1 ± 1.2
4052.554.8 ± 0.453.0 ± 0.6
9030.530.4 ± 0.732.1 ± 1.2
9052.552.1 ± 0.651.5 ± 1.7
Table 5. Percentage distribution of strain during impact.
Strain DistributionPressurised Core: Impact Angle & SpeedPressureless Core: Impact Angle & Speed
Bin Edges-Strain18.9°, 22.1 m∙s−140°, 52.5 m∙s−190°, 30.5 m∙s−190°, 52.5 m∙s−118.9°, 22.1 m∙s−140°, 52.5 m∙s−190°, 30.5 m∙s−190°, 52.5 m∙s−1
−0.4−0.30.120.190.181.470.070.270.151.21
−0.3−0.20.311.350.843.350.191.701.074.43
−0.2−0.11.1411.458.296.390.8312.928.926.98
−0.1034.5925.1135.9732.1349.0824.6932.3830.24
00.161.1121.1930.7234.7747.3518.3532.0435.34
0.10.22.0225.3513.9811.102.0627.8014.5512.92
0.20.30.349.588.945.790.2010.239.976.09
0.30.40.105.270.844.040.093.660.722.47
0.40.50.040.260.080.420.030.160.080.12
Table 6. Percentage distribution of strain rate during impact.
Strain Rate DistributionPressurisedPressureless
Bin Edges18°, 22.1 m∙s−140°, 52.5 m∙s−190°, 30.5 m∙s−190°, 52.5 m∙s−118°, 22.1 m∙s−140°, 52.5 m∙s−190°, 30.5 m∙s−190°, 52.5 m∙s−1
−800−7000.100.640.501.440.080.871.031.35
−700−6000.131.110.932.070.111.331.421.46
−600−5000.191.551.654.520.152.191.892.10
−500−4000.253.522.556.430.234.362.664.08
−400−3000.397.544.508.320.367.396.0611.09
−300−2000.7911.6314.807.000.709.8411.7710.09
−200−1002.4613.9015.9411.202.3911.6714.4610.79
−100044.0118.3420.4615.3145.3317.3817.3115.96
010047.1917.3317.1117.8346.7618.0219.0918.15
1002002.008.628.879.272.009.3610.387.91
2003000.755.014.393.840.676.324.293.08
3004000.382.942.101.820.333.432.141.71
4005000.241.751.661.390.201.311.701.26
5006000.191.011.300.970.120.871.431.01
6007000.120.740.830.520.070.621.130.64

