Article

Stochastic Analysis of the Gas Flow at the Gas Diffusion Layer/Channel Interface of a High-Temperature Polymer Electrolyte Fuel Cell

1
Forschungszentrum Jülich GmbH, Institute of Energy and Climate Research, IEK-3: Electrochemical Process Engineering, D-52425 Jülich, Germany
2
Modeling in Electrochemical Process Engineering, RWTH Aachen University, D-52056 Aachen, Germany
3
Jülich Aachen Research Alliance—High Performance Computing (JARA-HPC), D-52425 Jülich, Germany
*
Author to whom correspondence should be addressed.
Appl. Sci. 2018, 8(12), 2536; https://doi.org/10.3390/app8122536
Submission received: 16 November 2018 / Revised: 5 December 2018 / Accepted: 5 December 2018 / Published: 7 December 2018
(This article belongs to the Special Issue High Temperature Polymer Electrolyte Fuel Cells)

Abstract

:

Featured Application

Featured applications are channel or cell simulations that can consider information about the distribution of steam coming out of the GDL.

Abstract

Gas diffusion layers (GDLs) play a significant role in the efficient operation of high-temperature polymer electrolyte fuel cells. They connect the electrodes to the gas channels of the bipolar plate by porous material with a meso-scale geometric structure. The electrodes must be sufficiently supplied by gases from the channels to operate fuel cells efficiently. Furthermore, reaction products must be transported in the other direction. The gas transport is simulated in the through-plane direction of the GDL, and its microstructure created by a stochastic model is equivalent to the structure of real GDL material. Continuum approaches in cell-scale simulations have model parameters for porous regions that can be taken from effective properties calculated from the meso-scale simulation results, as one feature of multi-scale simulations. Another significant issue in multi-scale simulations is the interface between two regions. The focus is on the gas flow at the interface between GDL and the gas channel, which is analyzed using statistical methods. Quantitative relationships between functionality and microstructure can be detected. With this approach, virtual GDL materials can possibly be designed with improved transport properties. The evaluation of the surface flow with stochastic methods offers substantiated benefits that are suitable for connecting the meso-scale to larger spatial scales.
PACS:
88.30.gg; 88.30.J-; 88.30.pd

Graphical Abstract

1. Introduction

In all types of polymer electrolyte fuel cells (PEFC), also called proton exchange membrane (PEM) fuel cells, the gas diffusion layers (GDLs) are components with high relevance for efficient operation of fuel cells. Two major requirements can be identified. One is the electric contact to be provided between the bipolar plates and the catalyst layer (CL). This determines the choice of the material. The second requirement is to facilitate efficient mass transport. For this purpose, an appropriate microstructure is required. To meet the requirements, carbon fibers are typically used for the fabrication of different types of GDLs, e.g., paper, woven, or non-woven textiles. The lattice Boltzmann method (LBM) is widely used for the simulation of mass transport in GDLs. Weber et al. [1] reviewed the many aspects of the modeling activities of PEM fuel cells.
One topic that was identified as a critical issue to be investigated was the area between domains of different spatial scales; the interface between the GDL and channels is one of them. Andersson et al. [2] investigated multiphase modeling of PEFCs on the cell level. In their review, they highlighted the relevance of the GDL/channel interface. Various methods are available to obtain the microstructure of the GDL, e.g., X-ray synchrotron, focused ion beam (FIB)/SEM and stochastic reconstruction [3]. The gas transport in a GDL was simulated by Froning et al. [4,5,6] and van Doormaal and Pharoah [7] by means of LBM. Uncompressed GDLs, as well as compressed GDLs were studied. In more detail, Froning et al. [4,5] simulated gas transport in paper-type GDL with its microstructure based on the stochastic geometry model of Thiedmann et al. [8]. The gas flow at the GDL exit was analyzed from a statistical viewpoint [5]. Furthermore, the macroscopic properties of permeability and tortuosity were analyzed statistically from the viewpoint of compression and the variation of the microstructure [4]. Froning et al. [4] used the Kozeny–Carman equation to verify the calculated effective permeability and tortuosity. The Kozeny–Carman equation is widely used by researches investigating gas flow in porous structures, e.g., by Mangal et al. [9] in their experimental studies. Salomov et al. [10] used the LBM for their transport simulations in woven GDLs of high-temperature PEFCs (HT-PEFCs). The catalyst layer (CL) was reconstructed mimicking the clusterization of carbon particles statistically. Nabovati et al. [11] reconstructed Toray GDL and investigated the addition of PTFE to the microstructure with varying total amount and spatial distribution. They studied the influence of the PTFE on surface area and volume and calculated the permeability from single-phase flow simulations using the LBM. Based on microstructures reconstructed from X-ray tomographic microscopy (XTM) scans, Ros e ´ n et al. [12] in turn simulated liquid transport, and they obtained effective properties of the GDL. Eller et al. [13] completed the knowledge of the microstructure of a GDL with the distribution of binders. Simaafrookhteh et al. [14] obtained the characteristics of the porous structure of paper-type GDL from transport simulations in geometries, which were reconstructed according to the distribution of the orientation of the fibers.
Experimental investigations by several research groups complement the simulations mentioned above. The gas permeability of a GDL was measured by Tamayol et al. [15]. They considered different levels of compression. Other properties of GDLs—diffusion, thermal, and electrical conductivity—were measured by Zamel and Li [16]. The in-plane diffusivity of several types of GDL was measured by Rashapov and Gostick [17]. Chen et al. [18], meanwhile, investigated the impact of compression on commercial GDLs. Taira and Liu [19] used two adjacent channels of a flow field as an application-oriented experimental setup. In order to obtain the in-plane permeability of the GDL, they analyzed the cross-flow under the ribs. The permeability of the GDL was measured by Reshetenko et al. [20], and its impact on the fuel cell efficiency was analyzed.
The focus in the studies mentioned above was on GDLs, in particular their material properties and the mass flow in the microstructure. The simulation of entire fuel cells and stacks spans more than such small components. The consideration of all components covers multiple scales. Continuum-based approaches are often used in cell and stack modeling [21,22,23]. Such methods use effective volumetric properties of porous materials, e.g., the permeability. Surface characteristics can be found in experimental work; for instance, the roughness of the GDL surface was analyzed by Yuan et al. [24]. Interfaces between the regions of different properties have been investigated by several researchers. Breitwieser et al. [25] presented a review of the membrane/catalyst layer interface. The interface between the electrode and GDL was also addressed by Froning et al. [26].
The relevance of the interface between the GDL and channels is reflected by experimental and modeling work. In the measurements of Kaneko et al. [27], effective properties of the GDLs were investigated, as well as the mass flow at the GDL/channel interface. Many investigations of this interface focus on the liquid water transport in low-temperature PEFCs. Yoon et al. [28] observed in their experiments the behavior of droplets on a GDL surface. They studied the removal of liquid water droplets in a channel from the surface of different types of GDL. Wang et al. [29], meanwhile, identified the GDL surface near the channel as a topic of high interest for the simulation of gas flow on the channels of the flow field of a fuel cell. Niu et al. [30] simulated two-phase flow in fuel cell channels, assuming a static contact angle at the GDL surface. Kim et al. [31], in turn, simulated the hydrodynamics of water droplets in the gas channels. They investigated droplets leaving the GDL surface at two distinct positions. Koz and Kandlikar [32] simulated the inhibition of oxygen transport in flow channels in the presence of liquid water. They worked with regular patterns at the GDL interface where the water was entering the channel. The position of liquid water transported from the GDL into the gas channel can be inherently transferred by coupling the simulation domains of both spatial scales, as was done by Chen et al. [33]. They found that such tight coupled simulations can require enormous computational resources.
Two adjacent regions of a fuel cell are sometimes simulated on different spatial scales. From a macroscopic view, the interface is a 2D element. The role of the GDL/channel interface in this scenario is illustrated in Figure 1. The GDL/channel interface was investigated by Yu et al. [34], who analyzed irregular contact angles of water droplets at the GDL surface and their pattern when they passed the GDL/channel interface at several positions. The relevance of the interface for multi-scale simulations was shown by Qin et al. [35,36] and Aghihi et al. [37], who used pore network modeling (PNM) to bridge the scales (still on water transport in low temperature PEFCs). Niu et al. [38] coupled the LBM in the porous GDL structure with OpenFOAM simulations in the air channel.
The relevance of the characterization of the interface for multi-scale simulations still holds for other types of fuel cells, e.g., HT-PEFCs. Yang et al. [39] analyzed the gas flow in a channel over a regular porous structure for different Reynolds numbers. The interface was included in the comprehensive analytical studies of Kulikovsky [40]. The studies of Chevalier et al. [41] showed that the Peclet number at the GDL/channel interface is relevant for the current density profile along the channel. They focused their studies on oxygen transport in the GDL and channel, as well as on charge transport in the membrane.
In this manuscript, through-plane transport in GDLs is simulated with the LBM. The stochastic geometry model of Thiedmann et al. [8] is used to create 25 representations of the microstructure; Froning et al. [4,5] sed the same geometries. The statistical variation of the microstructure was completed with various compression levels. For this manuscript, virtual microstructures were selected from the studies mentioned above, both uncompressed and compressed. The focus of the new investigations is the analysis of the two-dimensional region between the GDL and gas channels; this is called the GDL/channel interface. Areas are classified according to the total amount of gas leaving the GDL with the highest velocity. The location of areas at the GDL surface where the most gas is flowing is the resulting 2D information on the GDL surface. The knowledge can possibly assist the development of new methods in the field of channel/cell-level simulations.

2. Methods

The LBM was applied in transport simulations of stochastic microstructures, with both methods being the same as was presented earlier [4,5,26].

2.1. Geometric Data

Thiedmann et al. [8] developed a stochastic geometry model that describes layers of paper-type GDL—in particular, Toray 090—as intersecting lines, with every layer being independent of the others. Three-dimensional realizations of a series of such layers were validated against the real 3D structure of the GDL using synchrotron data from the Helmholtz Center in Berlin [42]. Binder was covered on random polygons built by the fibers in a layer. It was shown that an 18- µ m thickness of this binder coating is reasonable for transport simulations in this kind of geometry [4].
Three realizations of the geometry model are shown in Figure 2. Because of its stochastic nature, the microstructure shows large differences at local positions. Statistical differences between adjacent fiber layers are illustrated by the black-colored top layer at the GDL exit and the gray-colored layer below. The different looking images in Figure 2a–c show local differences between the realizations, all of which represent the same material. The images of size 512 × 512 represent a section of 768 µm × 768 µm with a resolution of 1.5 µm per pixel. In this way, five images form a layer of fibers with a thickness of 7.5 µm each, while 130 images representing 26 fiber layers of a GDL.
Compressed GDL structures were generated by merging images of adjacent fiber layers. Froning et al. [4] presented the merging algorithm in detail and how compression levels in steps of 10% can be accomplished. It was also shown that the algorithm led to sufficient accuracy of flow calculations for compression levels of up to 30%.

2.2. Lattice Boltzmann Method

The through-plane transport of water vapor is simulated with the LBM. The method statistically describes ensembles of many molecules according to the principles of gas kinetics [43]. On a regular lattice—in this work, the D3Q19 scheme is used—in this three-dimensional scheme at each grid location 19 neighbors are connected, i.e., functions f i ( x , p , t ) , i = 0 , , 18 , are defined, specifying the probability that a molecule can be found at the place x and time t that moves to a neighboring node in the lattice with momentum p [44]. With the Bhatnagar-Gross-Krook (BGK) scheme [45], the equilibrium state can be numerically calculated by using Equation (1):
f i ( n + 1 ) = f i ( n ) + ω ( f i e q f i ( n ) )
Here, f e q is the Maxwellian distribution, f ( n ) and f ( n + 1 ) are the fields of the f i . The superscripts ( n ) and ( n + 1 ) specify the time t and the next time step t + Δ t .
This variant is feasible for single-phase, single-component transport simulations to be applied on the given kind of microstructures [4,5]. From the resulting velocity field, the volume-based characteristics of permeability κ = q · μ / P and tortuosity τ = v / v x were calculated [46,47,48].

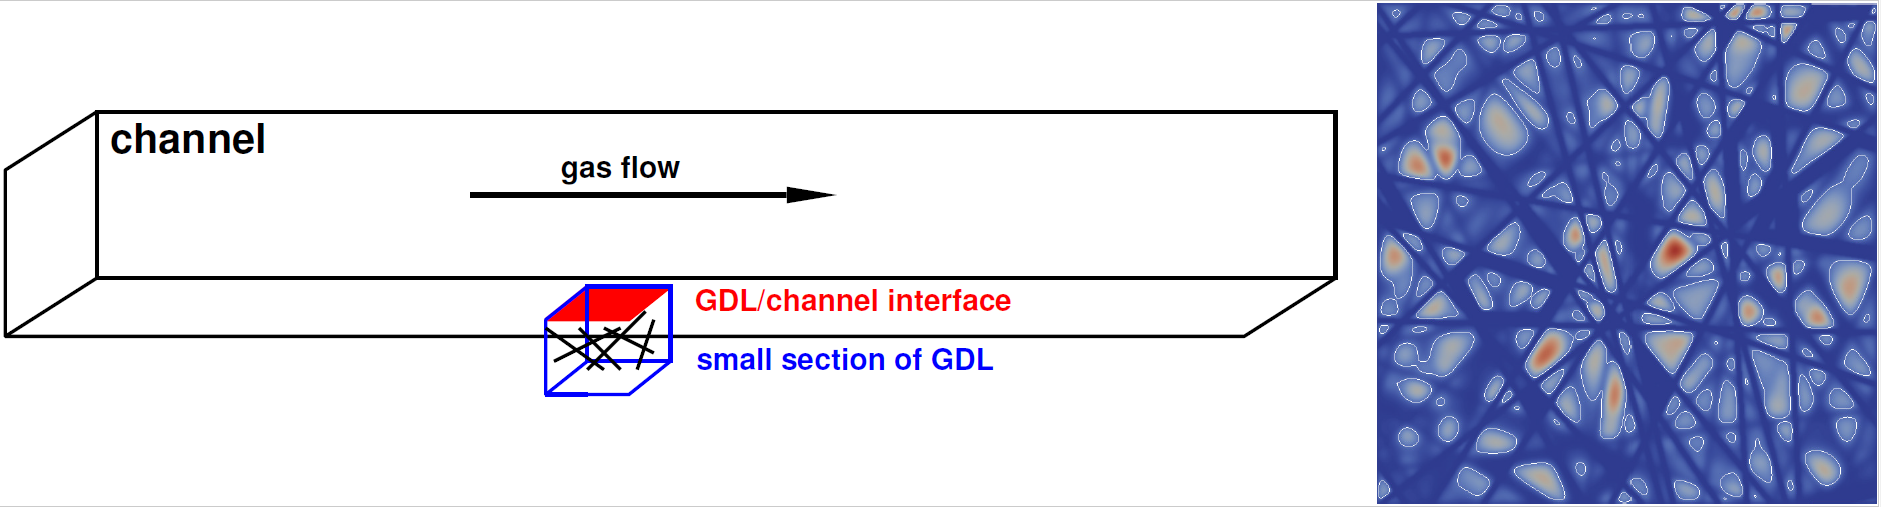
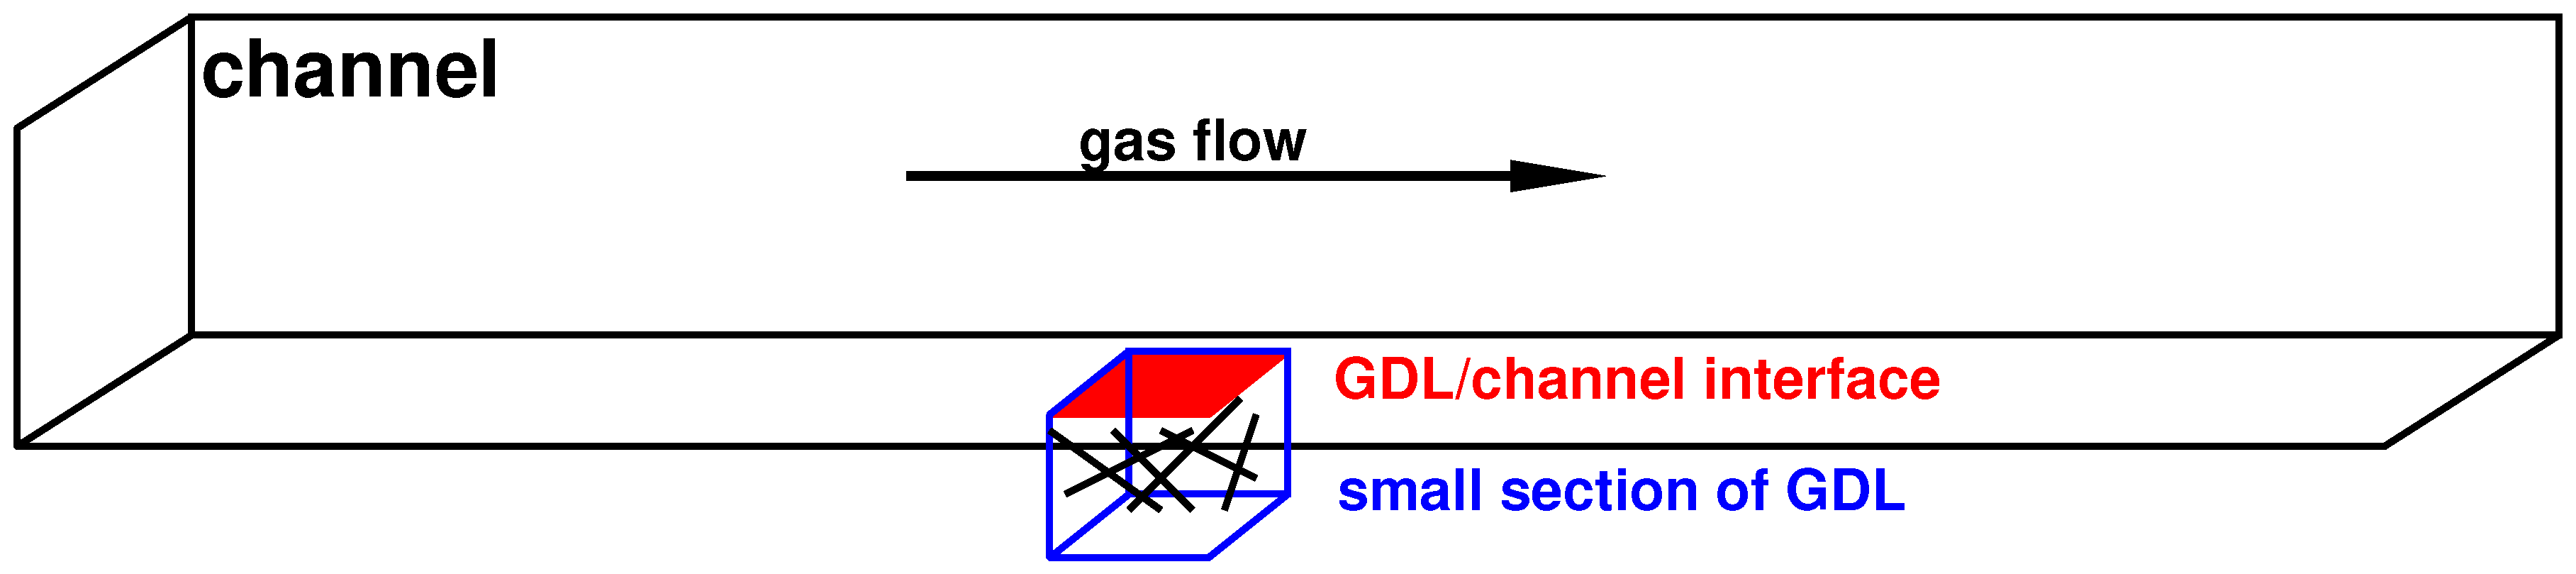
2.3. Simulation Frame

The transport simulations were applied in the small section shown below the channel in Figure 1. The gas is transported from the bottom to the top, towards the air channel. For the purpose of characterization of the GDL material, the gas flow in the channel of an operating fuel cell is not considered, avoiding the composition of different effects that could influence the results.
The microstructure of the GDL is specified by a series of binary images, as shown in Figure 2. In this way, 130 images of size 512 × 512 define a 512 × 512 × 130 lattice. With a resolution of 1 . 5 µ m, this defines a section of 768 µm × 768 µm of a GDL with a 195 µm thickness, consisting of 26 fiber layers, in accordance with the stochastic geometry model of Thiedmann et al. [8]. A series of images specifies an irregular porous structure. A bounce back condition is applied at the fiber surface, representing no-slip conditions. The definition of relevant boundary conditions is enabled by free space added upstream and downstream, as was already used in previous studies [4,5]. At the inlet, a Dirichlet boundary condition is specified, implemented as a fixed velocity that corresponds to a total mass flow of steam produced by an average current density of 1 A/cm 2 . At the outlet, a Neumann boundary condition, also known as constant pressure, is specified. At the side walls, a slip condition was applied. The goal is the detection of the relationships between well-known volumetric properties like permeability or tortuosity and the characteristics of the surface flow. Single-phase, single-component flow is simulated to obtain characteristics related to the pure GDL material without being affected by physical effects from outside the GDL. In Table 1, the values are completed with the amount of hydrogen and oxygen needed for the electrochemical conversion of 1 A/cm 2 as a reminder of Faraday’s law.
Compared to earlier work [4,5,26], the binary images representing the microstructure are used in reverse order. For the calculation of average volumetric values and statistical evaluation, this is unnecessary, and the only reason is to avoid local inconsistencies with the evaluation of the other interface (GDL/electrode) presented by Froning et al. [26].
Geometries with 30% compression were created by merging adjacent fiber layers as mentioned in Section 2.1 and described in more detail by Froning et al. [4]. In this case, 92 images represent a GDL of 138 µ m in thickness.

2.4. Analysis of the Interface

Similar to as discussed by Froning et al. [26] for the analysis of the GDL/electrode interface, the areas where most of the steam leaves the GDL shall be identified. For this purpose, the x component of the velocity at the GDL exit, which is the top layer of the microstructure, is evaluated. For incompressible flow, the velocity is related to the mass flow. Mass-related quantiles are defined at the GDL exit, which is the GDL/channel interface according to the transport simulation of steam through the GDL. Based on the total mass flow:
M t o t a l = c · A u x d A
where A is the area of the GDL beneath the flow field (related to the cell-scale) and u x is the through-plane velocity. The remaining constant c is not needed in the subsequent evaluation, because only relative values are used for the definition of q [ 0 , 1 ] and the total mass fraction M q :
M q = q · M t o t a l
The mass-related quantile z is implicitly defined by the following:
u q ( z ) = u x for u x z 0 for u x < z
Finally, the root of the function U ( q , z ) is the quantile z needed in Equation (4):
U ( q , z ) = A u q ( z ) d A M q
In the final step, contour levels u q ( z ) were used to visualize the mass-related quantiles of the through-plane velocity at the GDL surface using paraview [49]. While the contour levels u q ( z ) are useful for visualization, their integral functions U ( q , z ) can quantify the area.

3. Results

Through-plane transport was simulated in 25 realizations created by the geometry model, oriented in reverse order to distinguish the GDL/channel surface from the GDL/electrode surface presented by Froning et al. [26]. The operating conditions, according to Section 2.3, are summarized in Table 1. The conditions led to a Reynolds number of 2 . 4 × 10 4 . This in turn led to velocity vectors at the GDL exit that were almost parallel to the through-plane direction. The free space downstream of the GDL mentioned in Section 2.3 was required to arrange the velocity vectors properly behind the porous structure.
The variation of the volumetric characteristics—permeability κ and tortuosity τ —is shown in Figure 3a. A comprehensive study of these was presented by Froning et al. [4,5]. The quantile levels z were implicitly defined by u q ( z ) , as introduced by Equation (4). They define the total quantile areas:
s tot ( q ) = x | u q ( z ) > 0
that can be summarized to the values illustrated in Figure 3b. Like the volumetric characteristics, they showed statistical variation, because the simulation results were based on statistical microstructures. In addition to the total quantile area defined by Equation (6), the size of the largest of these regions is shown in Figure 3c. For this purpose, the function U ( q , z ) from Equation (5) needs to be applied on the largest area identified by the contour levels u q ( z ) from Equation (4), which was done via the visualization tool paraview and an external R [50] script.
In contrast to the display of the key properties in Figure 3, the detail of the two realizations, Nos. 5 and 15, is depicted in Figure 4. With the decrease of the quantile level q, the areas resulting from the contour lines became smaller, while the number of areas decreased, as well. The contour levels addressed in Section 2.4 look completely different in detail, which depicts the large variation of the areas summarized in Figure 3c.

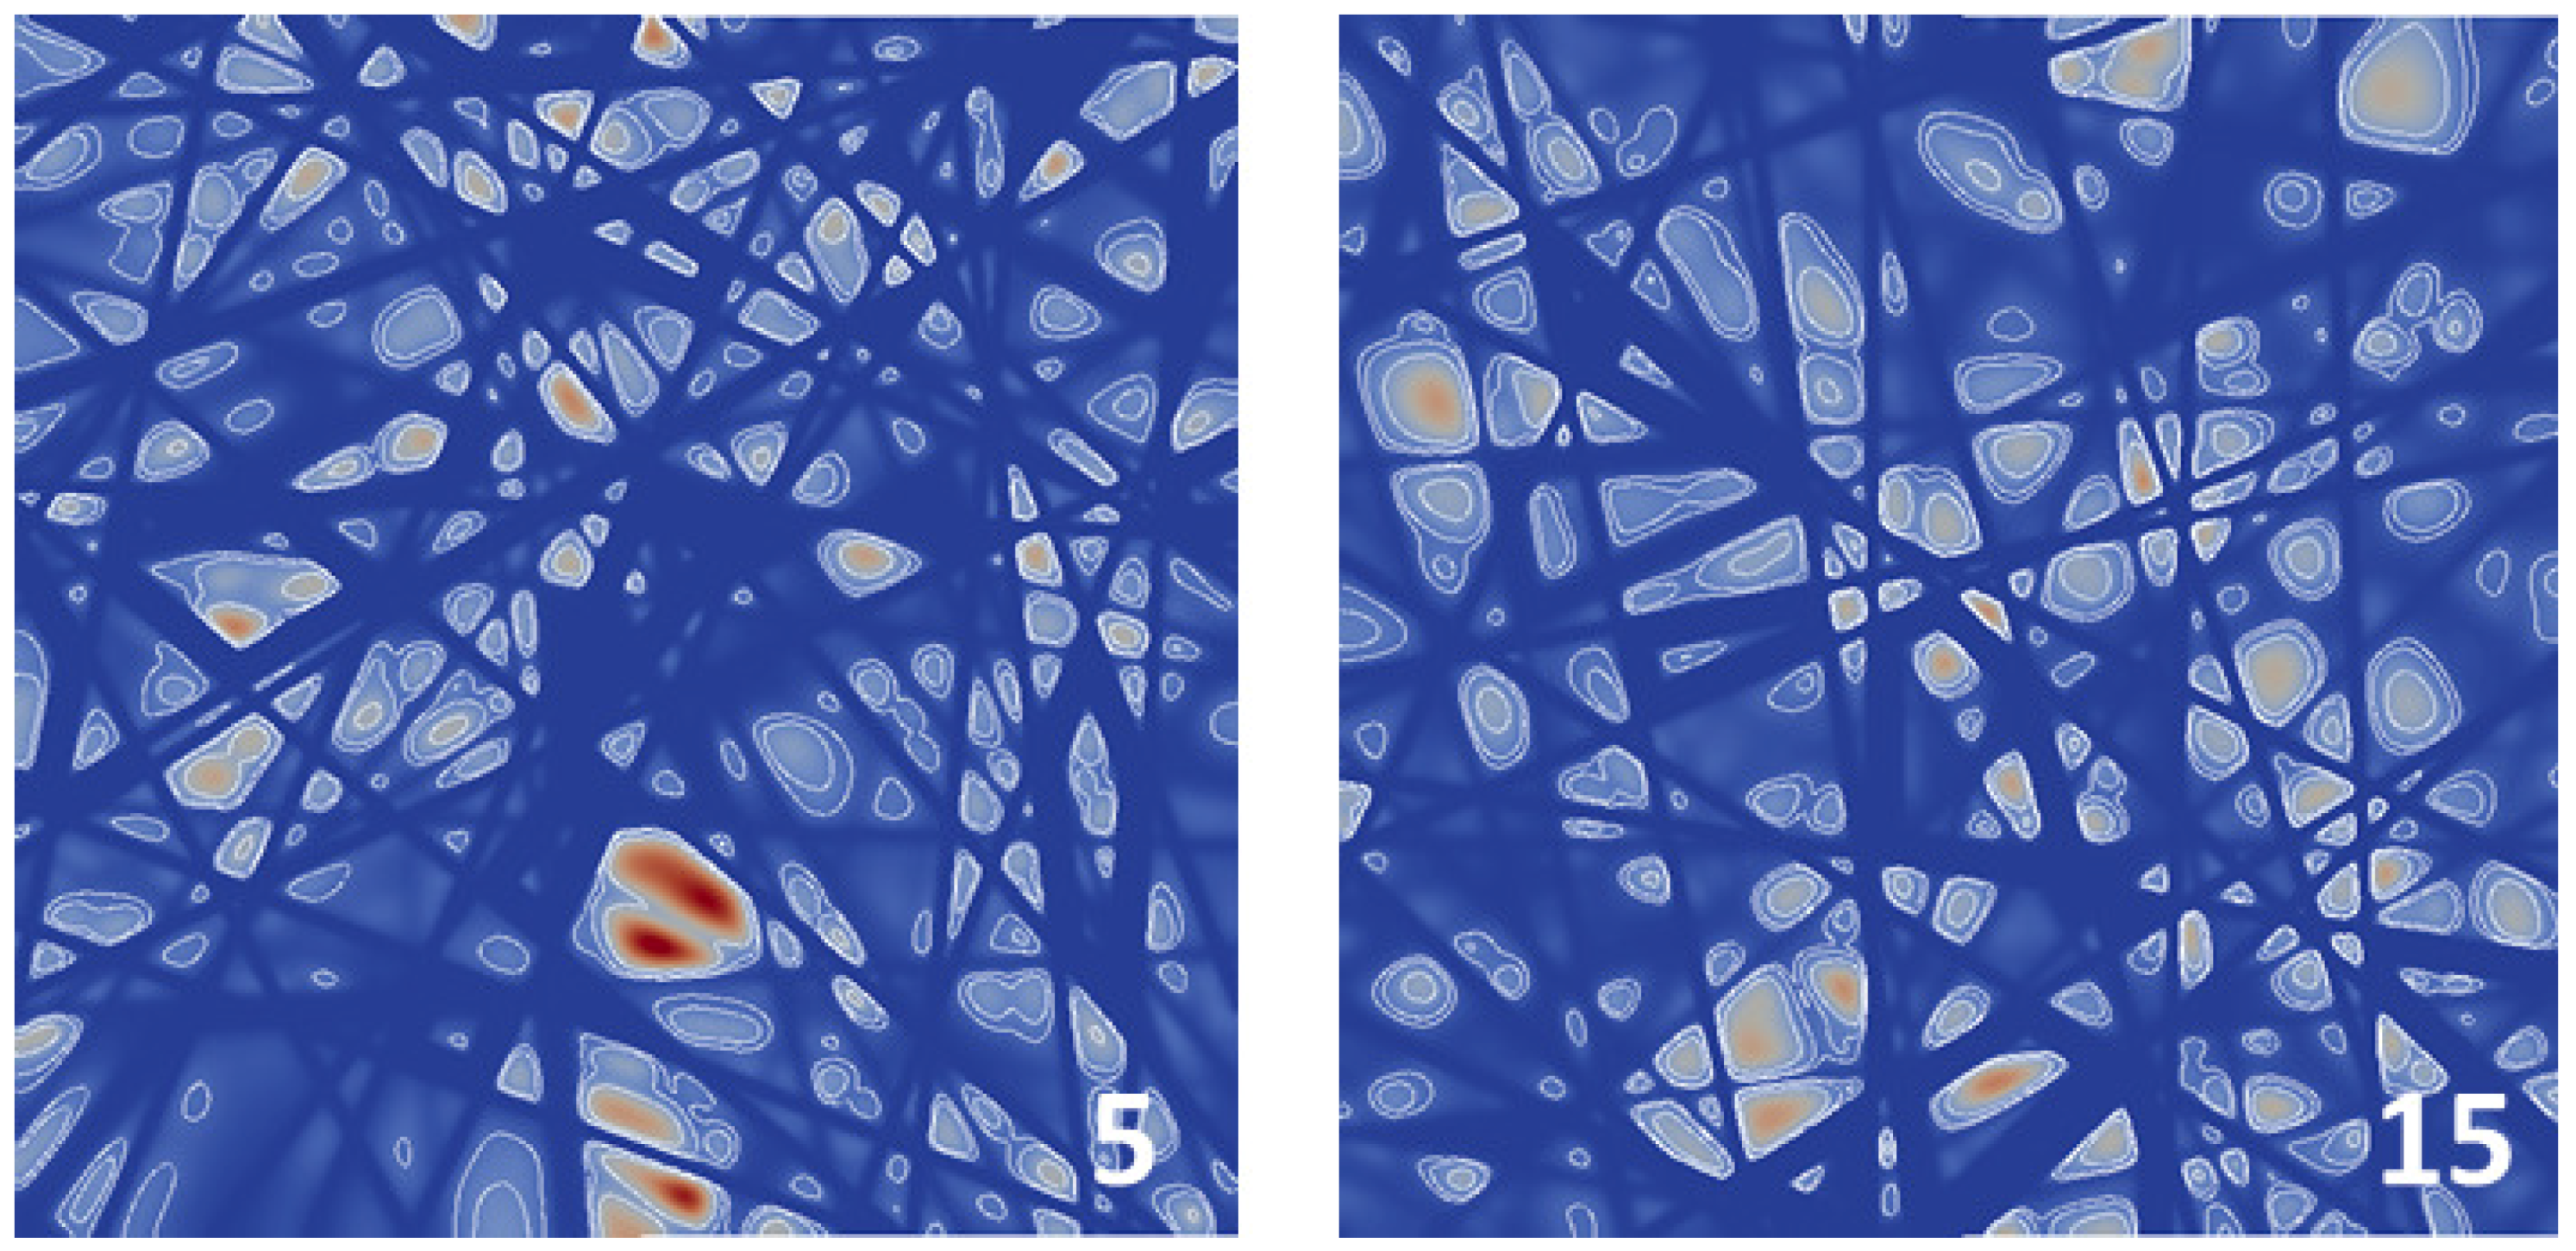
3.1. Analysis of the GDL Surface

The GDL/channel interface is at the location where the through-plane flow leaves the GDL. This interface was analyzed by evaluating the mass-related quantiles defined by Equation (4). For two realizations, the 70%, 50%, and 20% quantiles are shown in Figure 4. With lower quantile levels, the sizes of the areas illustrated by the contour lines in the post-processing step decreased, and some characteristic situations could be identified. Areas that are concentric for the three quantile levels with similar shapes are marked with labels, e.g., “a” in Figure 4. In a similar manner, the areas can still be concentric, but with a modified shape of the inner area (for q = 20%), labeled with “b”. Another situation is marked with “c”. The inner area was split into two, identifying two small pores in the GDL that were hidden, when higher quantile levels were shown. Positions where only one or two areas were nested—labeled as “d”—showed pores, where less gas left the GDL. Furthermore, positions where “b” and “c” are combined are labeled accordingly.
The gas within the mass-related quantiles was flowing through a certain fraction of the total quantile area of the GDL, which is shown in Figure 3b. The sizes of the largest area show large variation in Figure 3c.
Through-plane transport was simulated in microstructures as specified in Section 2.1 and Section 2.3. They were applied to 25 realizations of the geometry model. Table 2 summarizes the detailed results of the analysis of the mass-related quantiles obtained from the velocity field. The total quantile area s tot is presented for q = 70%, 50%, and 20% and, also, the number of areas (number of regions, #reg.) belonging to the quantiles and the average s and maximum size s max of the areas. The maximum size is also presented in Figure 3c. The largest area can be of interest for fuel cell and stack modeling when the location of the pores emphasized in the GDL surface is required. The large spread of the values in Figure 3c is in line with the variation coefficient of s max in Table 2.

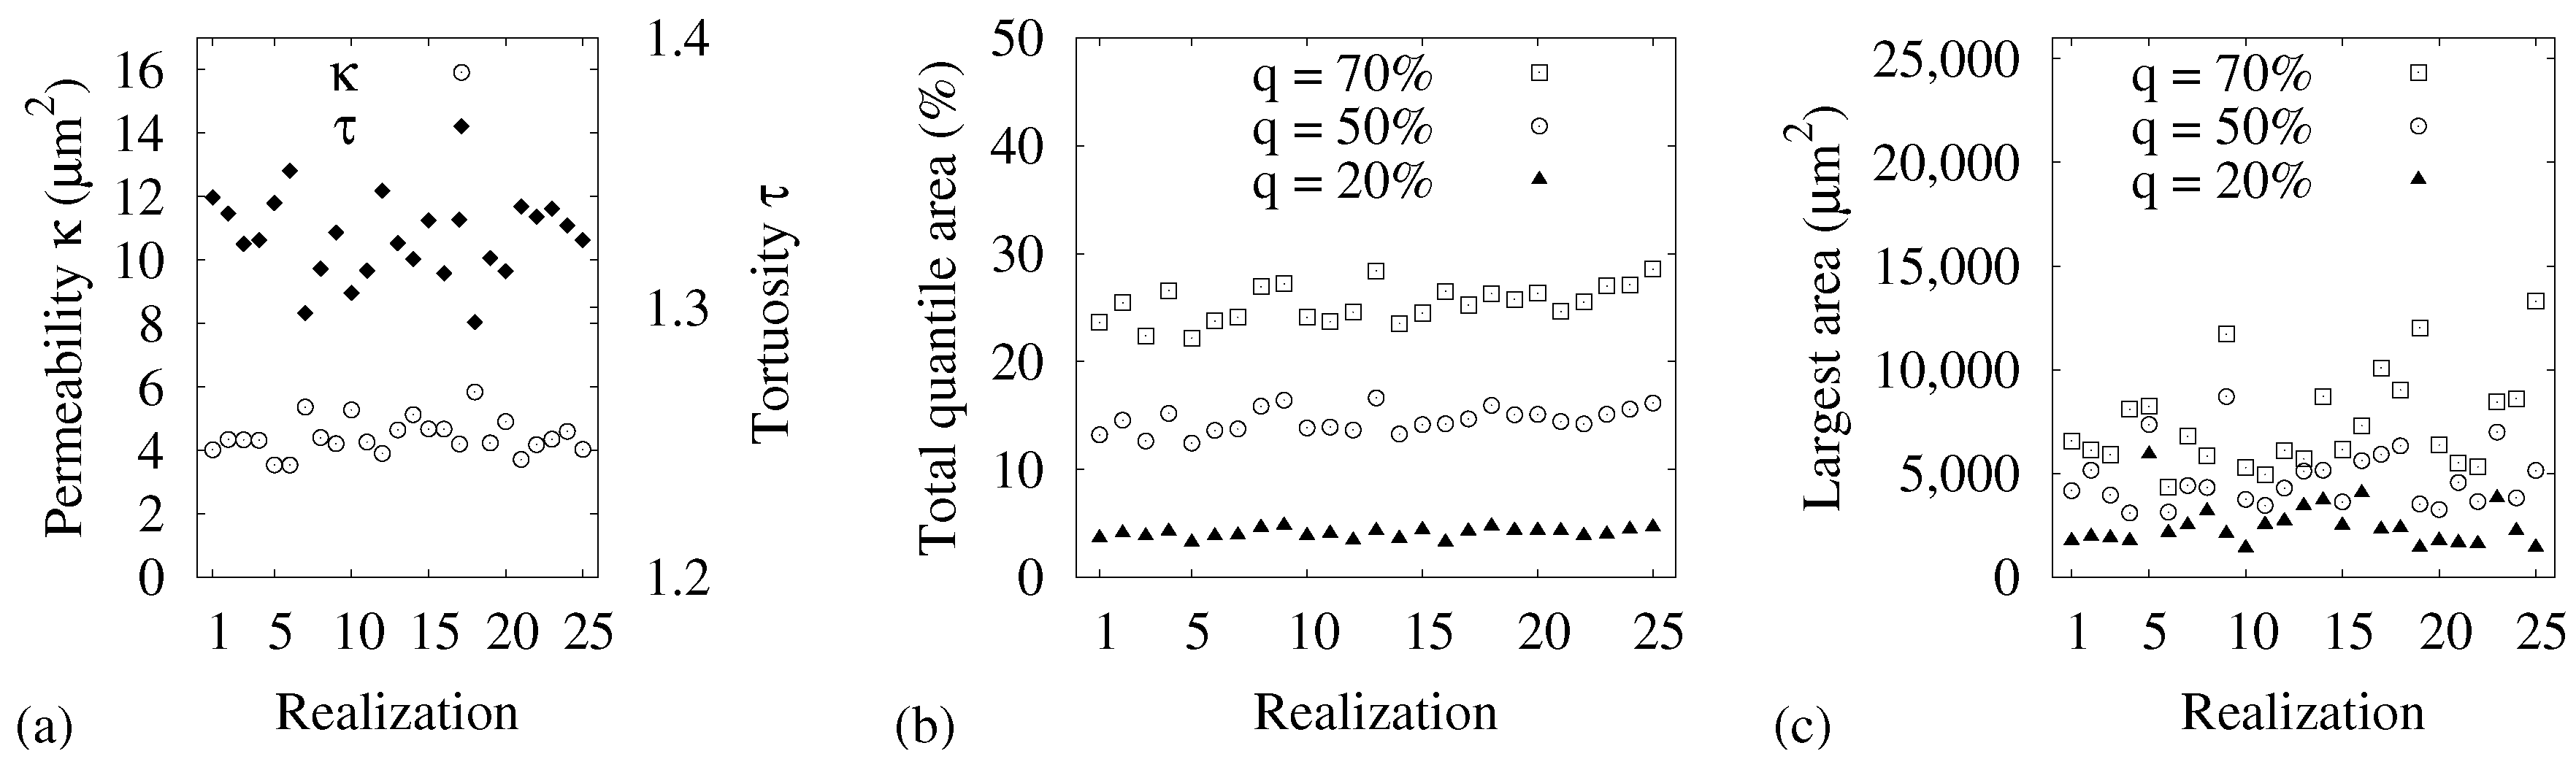
3.2. Statistical Evaluation

The transport simulations provided velocity fields that enabled the calculation of volume-based properties— κ and τ —and surface properties, as discussed in Section 3.1. All of these showed statistical variations and were different in their ranges of values. For the volume-based properties of porous material, many approaches have been developed that describe the relationships between several properties of the material. The Kozeny–Carman relation is only one of them [47]. It is desired to have also a simple approach to calculate the surface properties from volume-based characteristics. As a first step, the statistical correlation between the results can be calculated. Hedderich and Sachs [51] provided not only the fundamentals of various statistical tests, but also criteria for the proper choice of the right test for the desired evaluation. Kendall’s correlation test [51] allows for correlation coefficients to be calculated under the conditions mentioned above. Table 3 shows the coefficients r ( a , b ) , a , b { s tot ( q ) , κ , τ } , r [ 1 , 1 ] that were obtained using the R software [50,52].
The total quantile areas s tot ( q ) for q { 70 % , 50 % , 20 % } were chosen as candidates for the correlation test with the volumetric properties: permeability κ and tortuosity τ . Correlation coefficients can indicate a positive ( r > 0 ) or negative ( r < 0 ) relationship. Every value other than an extreme one { 10 , 1 } can only be used for comparisons. For this reason, the absolute value | r ( κ , τ ) | was chosen as an indicator of whether a correlation coefficient indicates a possible physical relation. It was already shown by Froning et al. [4] that κ and τ are non-linear with respect to the Kozeny–Carman relation:
κ · τ ε V p S p 2
with only the geometric properties of the microstructure on the right side: the porosity ε , total volume V p , and inner surface S p . In Table 3, the correlation between κ and τ is r ( κ , τ ) = 0 . 593 . The absolute value of every correlation coefficient between the surface-related properties s tot and κ or τ was much lower than this value. This indicates that there was no statistical correlation between surface-based and volume-based properties, although all of them were calculated from the same velocity field. Therefore, it is still necessary to perform transport simulations on the 3D structure to obtain the 2D properties presented in Section 3.1. The same conclusion was found in the analysis of the other interface (GDL/electrode) by Froning et al. [26].

3.3. Impact of the Compression

The through-plane transport was simulated under 30% compression. Figure 5 shows the velocity extracted at the GDL/channel interface with contour levels according to the mass-related quantiles z.
The velocity is colored in the same range as is used in Figure 4. Although the transport properties—permeability and tortuosity—changed under compression according to the Kozeny–Carman equation, the distribution of the relative total quantile areas at the interface did not change. The permeability and tortuosity are shown in Figure 6a. Compared to the uncompressed properties in Figure 3a, the tortuosity increased and the permeability decreased under compression, which is consistent with earlier studies [4]. Related to the quantiles of the total mass flow, Figure 6b,c shows the relative total quantile areas of the gas flow and the largest of these.
The overall picture of the diagrams in Figure 4 looks very similar to that in Figure 6, but with reduced absolute values. It is noticeable that also the permeability and tortuosity in Figure 6 changed their absolute values compared to the numbers in Figure 3, which was already discussed by Froning et al. [4,5]. Detailed surface characteristics of the compressed GDL are shown in Table 4. The GDL was compressed here by 30%.
The size of the total area s tot was smaller under compression, i.e., the average value was reduced from 167,000 µ m 2 (Table 2) to 150,000 µ m 2 for the 70% quantile level. The percentage of s tot related to the total surface of 590,000 µ m 2 is shown in Table 5. The upper limit of the total quantile area was roughly the porosity of the GDL, which was 78% in the representations of the geometric model [4,8]. In particular, s tot was limited by the local porosity of the upper fiber layer, which may vary slightly from the average. A similar trend can be observed on the other average values in the tables. The reduced porosity of a compressed porous structure leads (on average) to a higher absolute velocity under the condition of a fixed total amount of gas to be transported through the GDL. The higher velocity is caused by smaller pore sizes. The correlation between the surface characteristics of the compressed and uncompressed material is presented in Table 6. Because the range of the values changed under compression, Kendall’s test was again chosen as the test method. The entries in the table are the correlation coefficients of the given property, i.e., s tot for the 70% quantile in the first line, first column, obtained from simulation results on uncompressed and compressed microstructures. As before, the value of 0.593—the correlation between κ and τ from Table 3—was taken as a lower limit for judging two characteristics as being related to each other or not. On the basis of this value, the total quantile area s tot was evaluated as being correlated under compression for all quantile levels, as well as the average sizes s for the quantile levels of 70% and 50%. The average size s was uncorrelated for the 20% quantile level, and the largest area s max was not correlated in any case.
The transfer of the detailed information from transport simulations in the GDL to larger scales of cell and stack simulations requires additional investigations of the channel and flow field modeling. Simulation domains of GDLs were typically much smaller than any flow field of real fuel cells, which is illustrated in Figure 1. Furthermore, the GDL/channel interface connected a region of deterministic geometry with an irregular microstructure. As a consequence, many simulations on stochastic equivalent representations of the microstructure are required to consider the results from GDL transport simulations in the operating or boundary conditions of the cell-level models. Transport simulations on the microstructure can be evaluated statistically to characterize material or surface properties.

4. Discussion

The use of the volumetric effective properties of porous materials is the state of the art [53]. This is reflected by simulations that use continuum-based approaches for porous regions. These methods are used, e.g., in fuel cell simulations based on commercial CFD software [21,22,54]. Other investigations, not only fuel cell related, used open source CFD software [55,56,57].
Domain sizes for the pore-scale simulations of GDLs are often in the mm range [4,5,6], while cell and stack simulations require domain sizes of many cm, the size of real fuel cell stacks [21]. The tight coupling of both scales is therefore impossible because of computational resources. The GDL/channel interface was already addressed by PEFC modeling reviews focusing on microfluidics [58] and cell-scale modeling [2]. Some kinds of simulation tasks use boundary conditions at the GDL/channel interface. Weber et al. [1] identified the GDL/channel interface as being of high significance when they discussed two-phase phenomena in PEFCs. The path of further evaluation of the GDL/channel interface depends on its use for upscaling the results to cell-/stack-level simulations. In PNM approaches, the GDL can be represented by regularly-located pores and their characterization by randomly-distributed radii and flow behavior at the interface [35,37]. This increases the relevance of the knowledge about the sizes and positions of such pores. Cai et al. [59] studied meander-type flow field channels by placing inlet regions on the GDL/channel interface of their PEFC model. Further investigations in the analysis of the exit surface from transport simulations in GDL can improve such cell-level simulations. The combination of this kind of transport simulations leads to multi-scale approaches in fuel cell modeling.
The approach of analyzing surfaces can potentially also be applied to different simulation techniques. Modeling approaches based on PNM have the potential to cover multiple scales [36,37], and the interfaces between domains of different spatial scales are of high interest for such investigations. In the field of multi-scale simulations, the presented methods can be a vehicle for combining the simulation domains, especially when domains of different spatial scales are connected.

5. Conclusions

The through-plane transport of water vapor was simulated by means of the lattice Boltzmann method in 25 realizations of a stochastic geometry model representing Toray 090 GDL of an HT-PEFC. The results at the GDL/channel interface were statistically analyzed. For this purpose, mass-related quantiles were specified. Based on the total mass flow the 70%, 50%, and 20% quantiles were evaluated for uncompressed and compressed GDL material. The surface-related results were not correlated with the volume characteristics of the GDL. This was shown by Kendall’s correlation test, which was applied to the quantiles of the surface flow and the permeability and tortuosity of the gas flow through the GDL (all data obtained from the same transport simulations). The surface-related analysis of 3D transport simulations in microstructures can possibly support multi-scale investigations in fuel cell modeling.

Author Contributions

Conceptualization, D.F.; Formal analysis, D.F.; Methodology, D.F. and U.R.; Investigation and software, D.F. and J.Y.; Validation, D.F. and U.R.; Writing, D.F.; Supervision, W.L.

Funding

This research was partly funded by the Chinese Scholarship Council (CSC) Grant Number 201408080011.

Acknowledgments

The transport simulations were run on the hardware of the Jülich Supercomputing Centre under Grant JIEK30.

Conflicts of Interest

The authors declare no conflict of interest.

References

  1. Weber, A.Z.; Borup, R.L.; Darling, R.M.; Das, P.K.; Dursch, T.J.; Gu, W.; Harvey, D.; Kusoglu, A.; Litster, S.; Mench, M.M.; et al. A Critical Review of Modeling Transport Phenomena in Polymer-Electrolyte Fuel Cells. J. Electrochem. Soc. 2014, 161, F1254–F1299. [Google Scholar] [CrossRef] [Green Version]
  2. Andersson, M.; Beale, S.B.; Espinoza, M.; Wu, Z.; Lehnert, W. A review of cell-scale multiphase flow modeling, including water management, in polymer electrolyte fuel cells. Appl. Energy 2016, 180, 757–778. [Google Scholar] [CrossRef]
  3. Molaeimanesh, G.; Googarchin, H.S.; Moqaddam, A.Q. Lattice Boltzmann simulation of proton exchange membrane fuel cells—A review on opportunities and challenges. Int. J. Hydrogen Energy 2016, 41, 22221–22245. [Google Scholar] [CrossRef]
  4. Froning, D.; Brinkmann, J.; Reimer, U.; Schmidt, V.; Lehnert, W.; Stolten, D. 3D analysis, modeling and simulation of transport processes in compressed fibrous microstructures, using the Lattice Boltzmann method. Electrochim. Acta 2013, 110, 325–334. [Google Scholar] [CrossRef] [Green Version]
  5. Froning, D.; Gaiselmann, G.; Reimer, U.; Brinkmann, J.; Schmidt, V.; Lehnert, W. Stochastic Aspects of Mass Transport in Gas Diffusion Layers. Transp. Porous Media 2014, 103, 469–495. [Google Scholar] [CrossRef]
  6. Froning, D.; Yu, J.; Gaiselmann, G.; Reimer, U.; Manke, I.; Schmidt, V.; Lehnert, W. Impact of compression on gas transport in non-woven gas diffusion layers of high temperature polymer electrolyte fuel cells. J. Power Sources 2016, 318, 26–34. [Google Scholar] [CrossRef]
  7. van Doormaal, M.A.; Pharoah, J.G. Determination of permeability in fibrous porous media using the lattice Boltzmann method with application to PEM fuel cells. Int. J. Numer. Meth. Fluids 2009, 59, 75–89. [Google Scholar] [CrossRef]
  8. Thiedmann, R.; Fleischer, F.; Hartnig, C.; Lehnert, W.; Schmidt, V. Stochastic 3D Modeling of the GDL Structure in PEMFCs Based on Thin Section Detection. J. Electrochem. Soc. 2008, 155, B391–B399. [Google Scholar] [CrossRef]
  9. Mangal, P.; Pant, L.M.; Carrigy, N.; Dumontier, M.; Zingan, V.; Mitra, S.; Secanell, M. Experimental study of mass transport in PEMFCs: Through plane permeability and molecular diffusivity in GDLs. Electrochim. Acta 2015, 167, 160–171. [Google Scholar] [CrossRef]
  10. Salomov, U.R.; Chiavazzo, E.; Asinari, P. Pore-scale modeling of fluid flow through gas diffusion and catalyst layers for high temperature proton exchange membrane (HT-PEM) fuel cells. Comput. Math. Appl. 2014, 67, 393–411. [Google Scholar] [CrossRef] [Green Version]
  11. Nabovati, A.; Hinebaugh, J.; Bazylak, A.; Amon, C.H. Effect of porosity heterogeneity on the permeability and tortuosity of gas diffusion layers in polymer electrolyte membrane fuel cells. J. Power Sources 2014, 248, 83–90. [Google Scholar] [CrossRef]
  12. Rosén, T.; Eller, J.; Kang, J.; Prasianakis, N.I.; Mantzaras, J.; Büchi, F.N. Saturation Dependent Effective Transport Properties of PEFC Gas Diffusion Layers. J. Electrochem. Soc. 2012, 159, F536–F544. [Google Scholar] [CrossRef]
  13. Eller, J.; Lamibrac, A.; Marone, F.; Büchi, F.N. Influence of Binder Porosity on GDL Gas Phase Transport. ECS Meet. Abstr. 2016, 230, 2747. [Google Scholar]
  14. Simaafrookhteh, S.; Shakeri, M.; Baniassadi, M.; Sahraei, A.A. Microstructure Reconstruction and Characterization of the Porous GDLs for PEMFC Based on Fibers Orientation Distribution. Fuel Cells 2018, 18, 160–172. [Google Scholar] [CrossRef]
  15. Tamayol, A.; McGregor, F.; Bahrami, M. Single phase through-plane permeability of carbon paper gas diffusion layers. J. Power Sources 2012, 204, 94–99. [Google Scholar] [CrossRef]
  16. Zamel, N.; Li, X. Effective transport properties for polymer electrolyte membrane fuel cells—With a focus on the gas diffusion layer. Prog. Energy Combust. Sci. 2013, 39, 111–146. [Google Scholar] [CrossRef]
  17. Rashapov, R.R.; Gostick, J.T. In-Plane Effective Diffusivity in PEMFC Gas Diffusion Layers. Transp. Porous Media 2016, 115, 411–433. [Google Scholar] [CrossRef]
  18. Chen, Y.; Jiang, C.; Cho, C. An Investigation of the Compressive Behavior of Polymer Electrode Membrane Fuel Cell’s Gas Diffusion Layers under Different Temperatures. Polymers 2018, 10, 971. [Google Scholar] [CrossRef]
  19. Taira, H.; Liu, H. In-situ measurements of GDL effective permeability and under-land cross-flow in a PEM fuel cell. Int. J. Hydrogen Energy 2012, 37, 13725–13730. [Google Scholar] [CrossRef]
  20. Reshetenko, T.V.; St-Piere, J.; Rocheleau, R. Effects of local gas diffusion layer gas permeability variations on spatial proton exchange membrane fuel cells performance. J. Power Sources 2013, 241, 597–607. [Google Scholar] [CrossRef]
  21. Kvesić, M.; Reimer, U.; Froning, D.; Lüke, L.; Lehnert, W.; Stolten, D. 3D modeling of a 200 cm2 HT-PEFC short stack. Int. J. Hydrogen Energy 2012, 37, 2430–2439. [Google Scholar] [CrossRef]
  22. Sousa, T.; Mamlouk, M.; Scott, K.; Rangel, C.M. Three Dimensional Model of a High Temperature PEMFC. Study of the Flow Field Effect on Performance. Fuel Cells 2012, 12, 566–576. [Google Scholar] [CrossRef] [Green Version]
  23. Chippar, P.; Ju, H. Numeric modeling and investigation of gas crossover effects in high temperature proton exchange membrane (PEM) fuel cells. Int. J. Hydrogen Energy 2013, 38, 7704–7714. [Google Scholar] [CrossRef]
  24. Yuan, X.Z.; Li, H.; Gu, E.; Qian, W.; Girard, F.; Wang, Q.; Biggs, T.; Jaeggle, M. Measurements of GDL Properties for Quality Control in Fuel Cell Mass Production Line. World Electr. Veh. J. 2016, 8, 422. [Google Scholar] [CrossRef]
  25. Breitwieser, M.; Klingele, M.; Vierrath, S.; Zengerle, R.; Thiele, S. Tailoring the Membrane-Electrode Interface in PEM Fuel Cells: A Review and Perspective on Novel Engineering Approaches. Adv. Energy Mater. 2018, 8, 1701257. [Google Scholar] [CrossRef]
  26. Froning, D.; Yu, J.; Reimer, U.; Lehnert, W. Stochastic Analysis of the Gas Flow at the Gas Diffusion Layer/Electrode Interface of a High-Temperature Polymer Electrolyte Fuel Cell. Transp. Porous Media 2018, 123, 403–420. [Google Scholar] [CrossRef]
  27. Kaneko, H.; Ohta, K.; Shimuzu, M.; Araki, T. Measurements of Anisotropy of the Effective Diffusivity through PEFC GDL and Mass Transfer Resistance at GDL and Channel Interface. Trans. Jpn. Soc. Mech. Eng. Ser. B 2013, 79, 71–81. [Google Scholar] [CrossRef]
  28. Yoon, Y.; Jo, Y.; Kim, H.S. Experimental investigation of liquid water droplet removal in a simulated polymer electrolyte membrane fuel cell gas channel with gas diffusion layer characteristics. J. Mech. Sci. Technol. 2014, 28, 5221–5230. [Google Scholar] [CrossRef]
  29. Wang, Y.; Cho, S.; Thiedmann, R.; Schmidt, V.; Lehnert, W.; Feng, X. Stochastic modeling and direct simulation of the diffusion media for polymer electrolyte fuel cells. Int. J. Heat Mass Transf. 2010, 53, 1128–1138. [Google Scholar] [CrossRef]
  30. Niu, Z.; Jiao, K.; Zhang, F.; Du, Q.; Yin, Y. Direct numerical simulation of two-phase turbulent flow in fuel cell flow channel. Int. J. Hydrogen Energy 2016, 41, 3147–3152. [Google Scholar] [CrossRef]
  31. Kim, H.Y.; Jeon, S.; Song, M.; Kim, K. Numerical simulations of water droplet dynamics in hydrogen fuel cell gas channel. J. Power Sources 2014, 246, 679–695. [Google Scholar] [CrossRef]
  32. Koz, M.; Kandlikar, S.G. Oxygen transport resistance at gas diffusion layer—Air channel interface with film flow of water in a proton exchange membrane fuel cell. J. Power Sources 2016, 302, 331–342. [Google Scholar] [CrossRef]
  33. Chen, L.; Feng, Y.L.; Song, C.X.; Chen, L.; He, Y.L.; Tao, W.Q. Multi-scale modeling of proton exchange membrane fuel cell by coupling finite volume method and lattice Boltzmann method. Int. J. Heat Mass Transf. 2013, 63, 268–283. [Google Scholar] [CrossRef]
  34. Yu, J.; Froning, D.; Reimer, U.; Lehnert, W. Apparent contact angles of liquid water droplet breaking through a gas diffusion layer of polymer electrolyte membrane fuel cell. Int. J. Hydrogen Energy 2018, 43, 6318–6330. [Google Scholar] [CrossRef]
  35. Qin, C. Water Transport in the Gas Diffusion Layer of a Polymer Electrolyte Fuel Cell: Dynamic Pore-Network Modeling. J. Electrochem. Soc. 2015, 162, F1036–F1046. [Google Scholar] [CrossRef] [Green Version]
  36. Qin, C.Z.; Hassanizadeh, S.M.; van Oosterhout, L.M. Pore-Network Modeling of Water and Vapor Transport in the Micro Porous Layer and Gas Diffusion Layer of a Polymer Electrolyte Fuel Cell. Computation 2016, 4, 21. [Google Scholar] [CrossRef]
  37. Aghighi, M.; Hoeh, M.A.; Lehnert, W.; Merle, G.; Gostick, J. Simulation of a Full Fuel Cell Membrane Electrode Assembly Using Pore Network Modeling. J. Electrochem. Soc. 2016, 163, F384–F392. [Google Scholar] [CrossRef] [Green Version]
  38. Niu, Z.; Bao, Z.; Wu, J.; Wang, Y.; Jiao, K. Two-phase flow in the mixed-wettability gas diffusion layer of proton exchange membrane fuel cells. Appl. Energy 2018, 232, 443–450. [Google Scholar] [CrossRef]
  39. Yang, G.; Weigand, B.; Terzis, A.; Weishaupt, K.; Helmig, R. Numerical Simulation of Turbulent Flow and Heat Transfer in a Three-Dimensional Channel Coupled with Flow Through Porous Structures. Transp. Porous Media 2018, 122, 145–167. [Google Scholar] [CrossRef]
  40. Kulikovsky, A.A. Analytical Modelling of Fuel Cells; Elsevier: Amsterdam, The Netherlands, 2010. [Google Scholar]
  41. Chevalier, S.; Josset, C.; Auvity, B. Analytical solutions and dimensional analysis of pseudo 2D current density distribution model in PEM fuel cells. Renew. Energy 2018, 125, 738–746. [Google Scholar] [CrossRef]
  42. Thiedmann, R.; Hartnig, C.; Manke, I.; Schmidt, V.; Lehnert, W. Local Structural Characteristics of Pore Space in GDLs of PEM Fuel Cells Based on Geometric 3D Graphs. J. Electrochem. Soc. 2009, 156, B1339–B1347. [Google Scholar] [CrossRef]
  43. Succi, S. The Lattice Boltzmann Equation; Oxford University Press: Oxford, UK, 2001. [Google Scholar]
  44. Wolf-Gladrow, D. Lattice-Gas Cellular Automata and Lattice Boltzmann Models; Springer: Berlin, Germany, 2000. [Google Scholar]
  45. Bhatnagar, P.L.; Gross, E.P.; Krook, M. A Model for Collision Processes in Gases. I. Small Amplitude Processes in Charged and Neutral One-Component Systems. Phys. Rev. 1954, 94, 511–525. [Google Scholar] [CrossRef]
  46. Hänel, D. Molekulare Gasdynamik; Springer: Berlin/Heidelberg, Germany, 2004. [Google Scholar]
  47. Tomadakis, M.M.; Robertson, T.J. Viscous Permeability of Random Fiber Structures: Comparison of Electrical and Diffusional Estimates with Experimental and Analytical Results. J. Compos. Mater. 2005, 39, 163–188. [Google Scholar] [CrossRef]
  48. Koponen, A.; Kataja, M.; Timonen, J. Tortuous flow in porous media. Phys. Rev. E 1996, 54, 406–410. [Google Scholar] [CrossRef]
  49. Kitware, Inc. Paraview—Open Source Scientific Visualization; Kitware, Inc.: Clifton Park, NY, USA, 2009. [Google Scholar]
  50. R Core Team. R: A Language and Environment for Statistical Computing; R Foundation for Statistical Computing: Vienna, Austria, 2013. [Google Scholar]
  51. Hedderich, J.; Sachs, L. Angewandte Statistik, 14th ed.; Springer: Heidelberg/Berlin, Germany; Dordrecht, The Netherlands; London, UK; New York, NY, USA, 2012. [Google Scholar]
  52. Adler, J. R in a Nutshell, 2nd ed.; O’Reilly: Sebastopol, CA, USA, 2012. [Google Scholar]
  53. Pharoah, J.G.; Karan, K.; Sun, W. On effective transport coefficients in PEM fuel cell electrodes: Anisotropy of the porous transport layers. J. Power Sources 2006, 161, 214–224. [Google Scholar] [CrossRef]
  54. Kvesić, M.; Reimer, U.; Froning, D.; Lüke, L.; Lehnert, W.; Stolten, D. 3D modeling of an HT-PEFC stack using reformate gas. Int. J. Hydrogen Energy 2012, 37, 12438–12450. [Google Scholar] [CrossRef]
  55. Cao, Q.; Beale, S.B.; Reimer, U.; Froning, D.; Lehnert, W. The Importance of Diffusion Mechanisms in High Temperature Polymer Electrolyte Fuel Cells. ECS Trans. 2015, 69, 1089–1103. [Google Scholar] [CrossRef]
  56. Horgue, P.; Soulaine, C.; Franc, J.; Guibert, R.; Debenest, G. An open-source toolbox for multiphase flow in porous media. Comput. Phys. Commun. 2015, 187, 217–226. [Google Scholar] [CrossRef] [Green Version]
  57. Kazmouz, S.J.; Giusti, A.; Mastorakos, E. Numerical simulation of shale gas flow in three-dimensional fractured porous media. J. Unconv. Oil Gas Resour. 2016, 16, 90–112. [Google Scholar] [CrossRef]
  58. Wörner, M. Numerical modeling of multiphase flows in microfluidics and micro process engineering: A review of methods and applications. Microfluid. Nanofluid. 2012, 12, 841–886. [Google Scholar] [CrossRef]
  59. Cai, Y.; Chen, T.; Yang, T.; Xiao, J. Mechanism of water transport in serpentine cathode channels of proton exchange membrane fuel cells. J. Power Sources 2012, 209, 90–104. [Google Scholar] [CrossRef]
Figure 1. Gas diffusion layer (GDL)/channel interface as a connecting area between multiple scales.
Applsci 08 02536 g001
Figure 2. Fiber layers at the GDL exit (black) and below (gray); Realization Nos. 3 (a), 13 (b), and 23 (c).
Applsci 08 02536 g002
Figure 3. Characteristics of the uncompressed GDL. Slip condition at walls: (a) permeability and tortuosity; (b) relative total quantile areas of the gas flow; total area where u q ( z ) > 0 . (c) The largest area from (b).
Applsci 08 02536 g003
Figure 4. Velocity at the GDL/channel interface for realization Nos. 5 and 15. Mass-related quantiles for q = 70%, 50%, and 20%. Labels “a”–“d” are described in Section 3.1.
Applsci 08 02536 g004
Figure 5. Velocity at the GDL/channel interface for realization Nos. 5 and 15. Mass-related quantiles for q = 70%, 50%, and 20%.
Applsci 08 02536 g005
Figure 6. Impact of compression, 30% compressed, slip condition at walls: (a) permeability and tortuosity; (b) relative total quantile areas of the gas flow; total area where u q ( z ) > 0 . (c) The largest area from (b).
Applsci 08 02536 g006
Table 1. Operating conditions. H 2 O is created as a vapor. The input to the LB algorithm are the species “H 2 O”, its temperature (for density and viscosity), and the velocity.
ConditionValue
Average current density1 A/cm 2
Volumetric flow rate H 2
(normal conditions)7 mL/min
Volumetric flow rate O 2
(normal conditions)3.5 mL/min
Operating temperature160 C
Superficial velocity H 2 O1.8 × 10 3 m/s
Table 2. Analysis of the GDL/channel interface, uncompressed. s tot in 1000 µ m 2 . s , s max in µ m 2 . Total surface: 590,000 µ m 2 .
No.1234567891011121314
q/%
70 s tot 160166154175150161161177171151159167187155
#reg.190156158178181194133144130150161164150123
s 84310679779818288301214123013171007987101912441260
s max 7592796513,32990708640919112,587725616,32380755699834310,1548744
50 s tot 93998910686949510410390949811490
#reg.1441251121321441499111911311912913211384
s 648793791800596629103987391475572974310081077
s max 4329543256237292788937266496513710,81645704358548855248147
20 s t e x t r m t o t 2630273123262831312729283325
#reg.5541526051524258485864574727
s 476726520518444502655534650464450494701931
s max 27883292201223026453235838843807517124552927292743113980
No.1516171819202122232425aver.var.
q /% 1–25coef.
70 s tot 165178164166170173154174182178187167 6 . 4 × 10 2
#reg.155150172147160135163140156150148155 1 . 1 × 10 1
s 1064118995611271065128194812411167118412811092 1 . 4 × 10 1
s max 10,17711,14411,54010,19313,8409086678077969041896914,2279831 2 . 6 × 10 1
50 s tot 96102981021041049010110610611199 7 . 3 × 10 2
#reg.10611613111813198111116112124117115 1 . 8 × 10 1
s 9038807498628011059807871945854948843 1 . 5 · 10 1
s max 877158057862761211,1925749536248697904434711,7566642 3 . 4 × 10 1
20 s tot 282329323333282729313329 1 . 0 × 10 1
#reg.483751536359434644616551 1 . 8 × 10 1
s 580629583594520557648588667508513578 1 . 9 × 10 1
s max 258846374147441224842412388827025310250437673501 3 . 2 × 10 1
Table 3. Correlation coefficients, uncompressed GDL. q in %.
s tot ( 50 ) s tot ( 20 ) κ τ
s tot ( 70 ) 0.8330.480.113−0.053
s tot ( 50 ) 0.5930.12−0.087
s tot ( 20 ) −0.127−0.133
κ −0.593
Table 4. Analysis of the GDL/channel interface, 30% compression. s tot in 1000 µ m 2 . s , s max in µ m 2 . Total surface: 590,000 µ m 2 .
No.1234567891011121314
q/%
70 s tot 139150132157131140142159160142140145167139
#reg.234203184212219229159173179190188208182150
s 595748717740597612894919897748744697920925
s max 6568612459068089823743526788584311,72352884943610957158712
50 s tot 7886748673808194978282809878
#reg.177145137153149185121143144152158151150103
s 440592544585492434670654672537520533654760
s max 41745159396230967362313944214322870837553458429551125159
20 s tot 2124222519222327282324202521
#reg.6264626444634968765868565237
s 345375362391432355467399372390351359487572
s max 17511951189017535920214425043182209714062538271134433708
No.1516171819202122232425aver.var.
q /% 1–25coef.
70 s tot 144156149155152155145150159160168150 6 . 8 × 10 2
#reg.178192204174192165200166176194195190 1 . 1 × 10 1
s 811814729891791941727906905824864798 1 . 3 × 10 1
s max 6156729910,089902912,0206370552253128442860913,3097462 3 . 1 × 10 1
50 s tot 848487948989858489929586 7 . 9 × 10 2
#reg.134141162146143124146136136157159146 1 . 1 × 10 1
s 623595534644621718583616655585599594 1 . 3 × 10 1
s max 363256215922633235283265456336456995382551464744 3 . 0 × 10 1
20 s tot 261925282626252323262724 1 . 1 × 10 1
#reg.604762667161656344686860 1 . 6 × 10 1
s 431408406423360419390360532382400406 1 . 4 × 10 1
s max 249540552293237424221766166116133814223214422486 4 . 2 × 10 1
Table 5. Total quantile areas s tot related to the total surface of 590,000  µ m 2 , uncompressed and compressed (30%) GDL.
s tot s tot
Quantile Level qUncompressedCompressed (30%)
70%28.3%23.6%
50%16.8%13.2%
20%4.9%3.6%
Table 6. Correlation coefficients (Kendall’s method) between the surface characteristics of compressed (30%) and uncompressed GDL.
Quantile Level q s tot s s max
70%0.780.750.43
50%0.700.810.34
20%0.650.420.46

