Author Contributions
conceptualization, M.B.; methodology, M.B. and O.D.; formal analysis, O.D.; investigation, O.D.; resources, O.D.; data curation, M.B. and O.D.; writing—original draft preparation, O.D.; writing—review and editing, M.B.; visualization, O.D.; supervision, M.B.
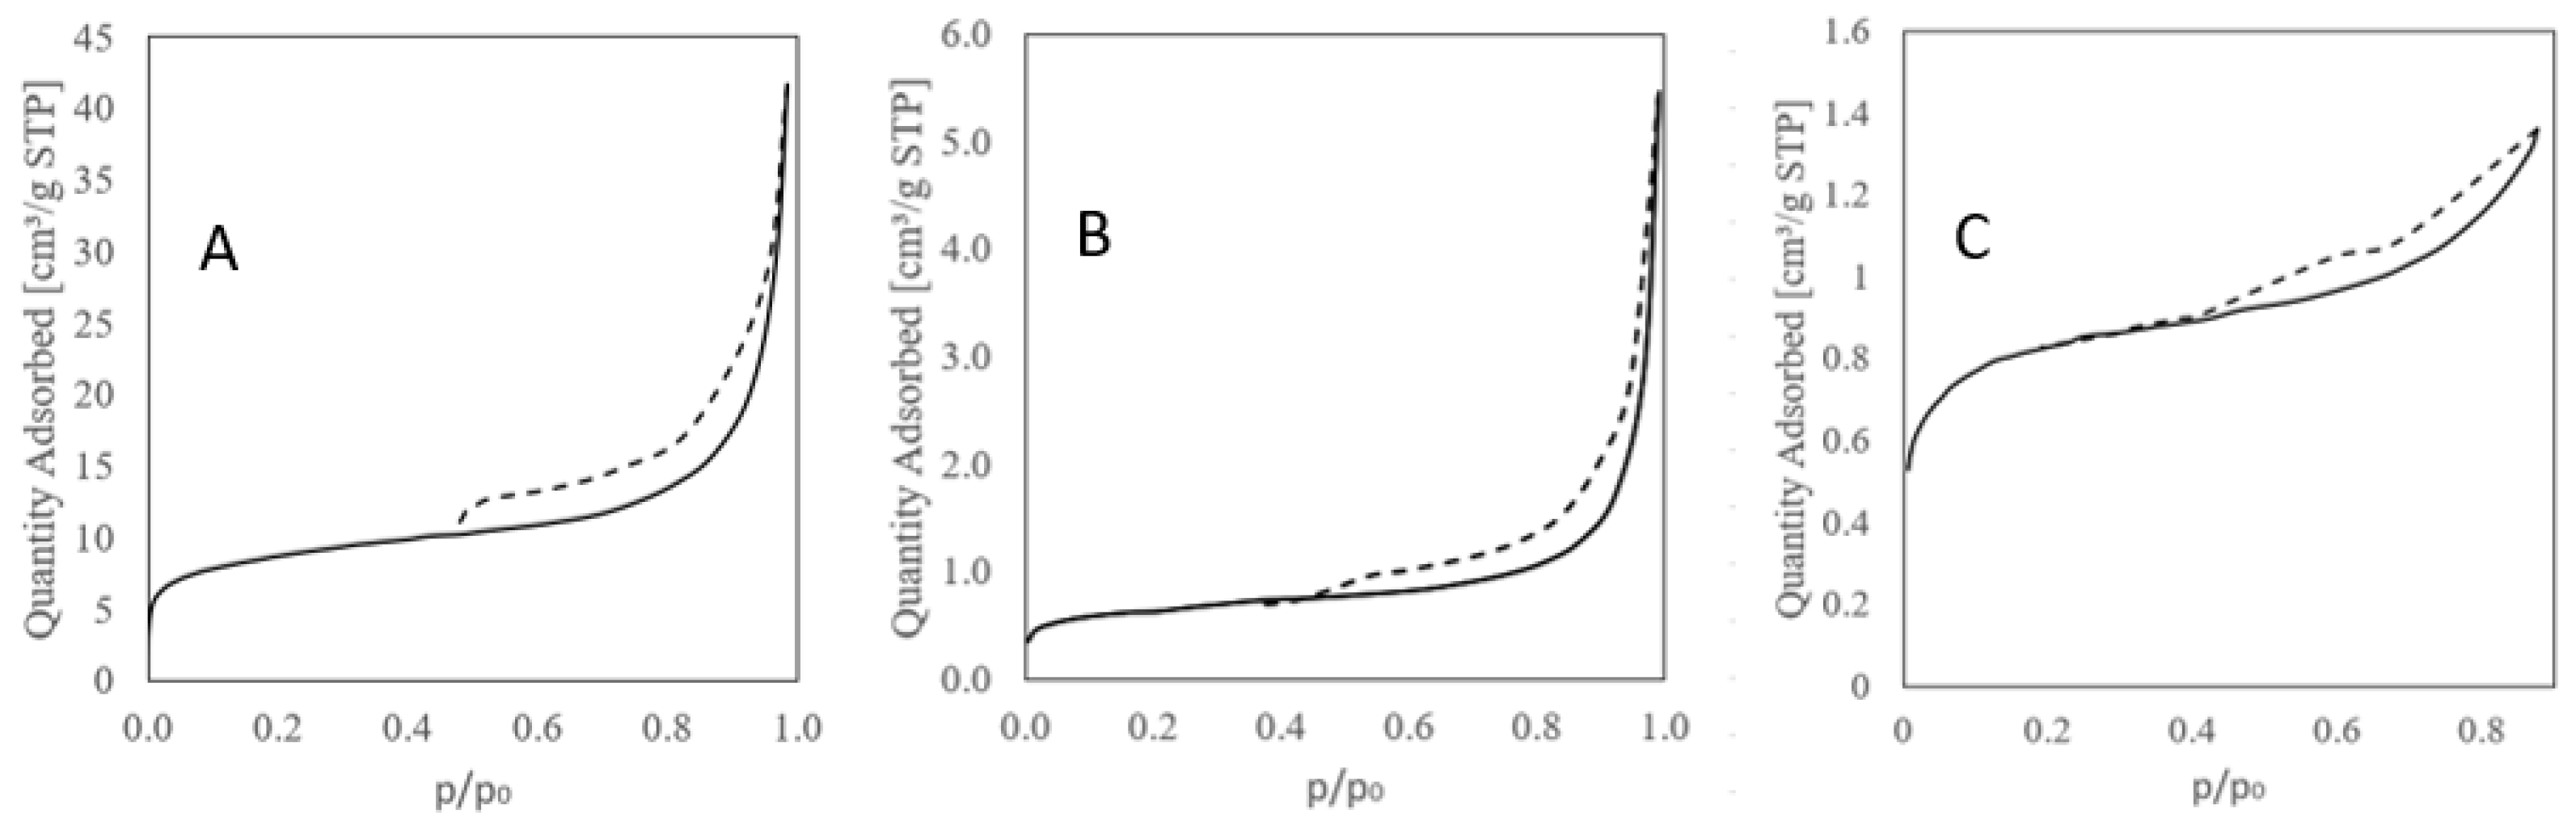
Figure 1.
Sorption isotherms: (A) Raw vermiculite, (B) basic–activated vermiculite, (C) acid–activated vermiculite, (solid line–adsorption, dashed line–desorption).
Figure 1.
Sorption isotherms: (A) Raw vermiculite, (B) basic–activated vermiculite, (C) acid–activated vermiculite, (solid line–adsorption, dashed line–desorption).
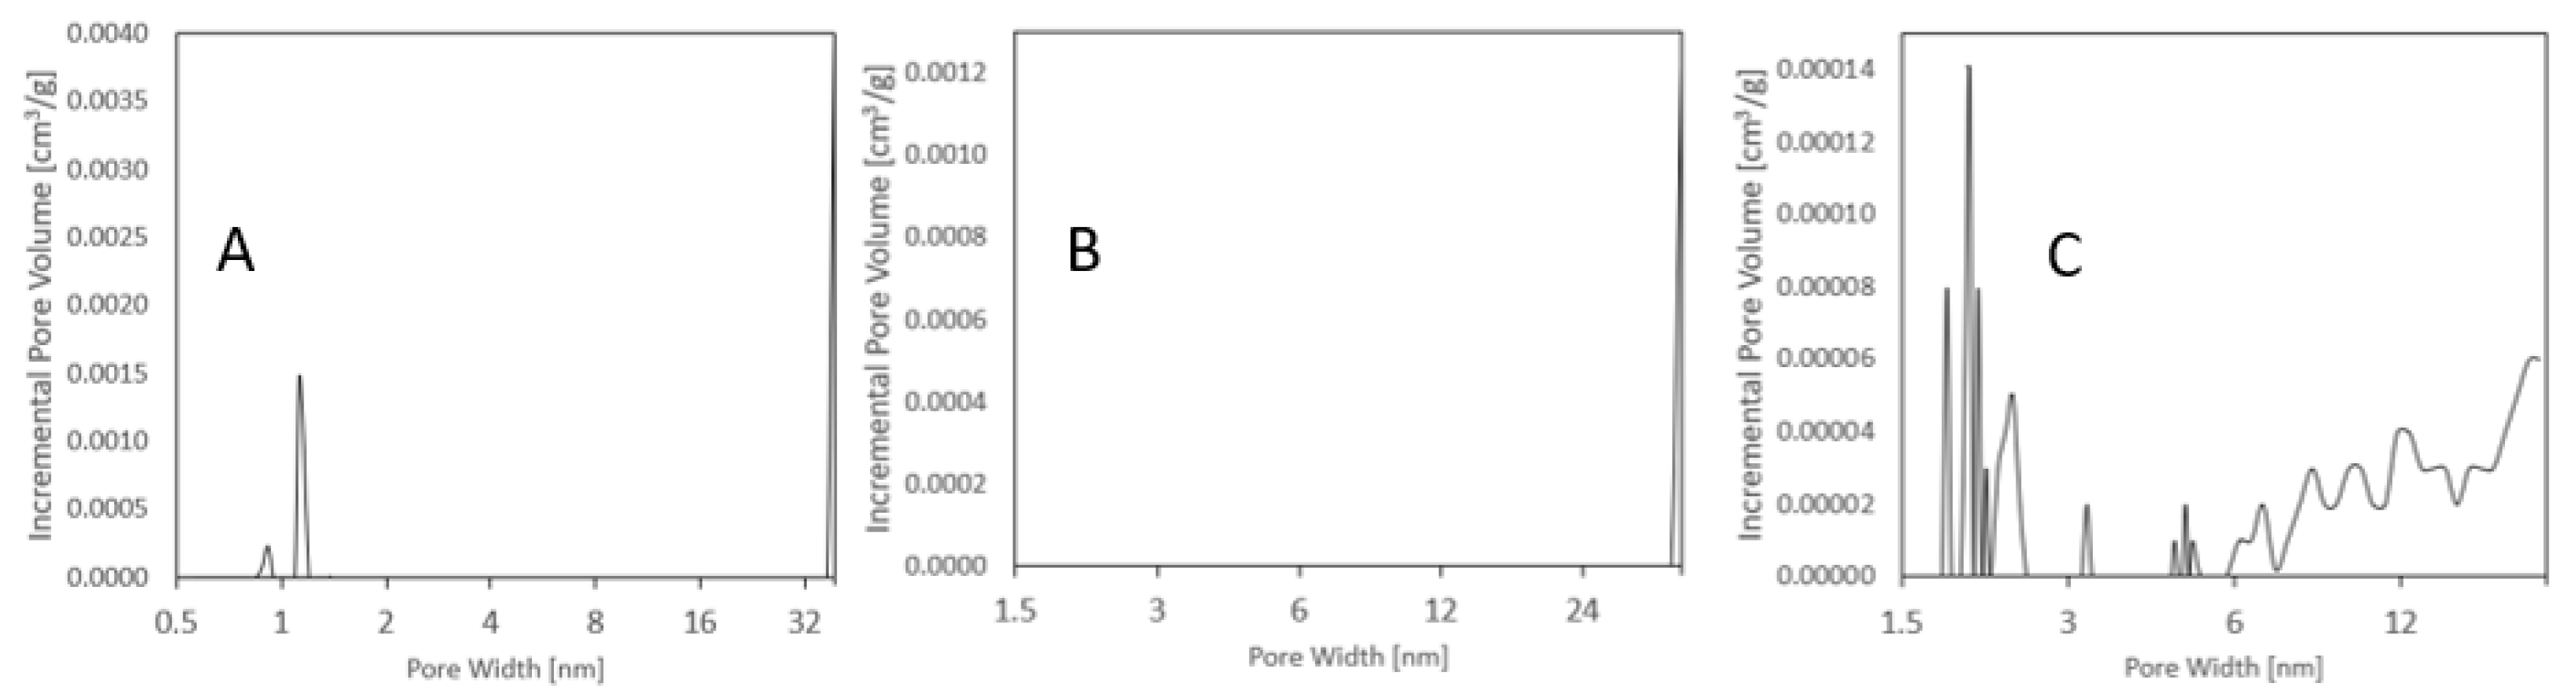
Figure 2.
Distribution of pore volume relative to pore width: (A) Raw vermiculite, (B) basic–activated vermiculite, (C) acid–activated vermiculite.
Figure 2.
Distribution of pore volume relative to pore width: (A) Raw vermiculite, (B) basic–activated vermiculite, (C) acid–activated vermiculite.
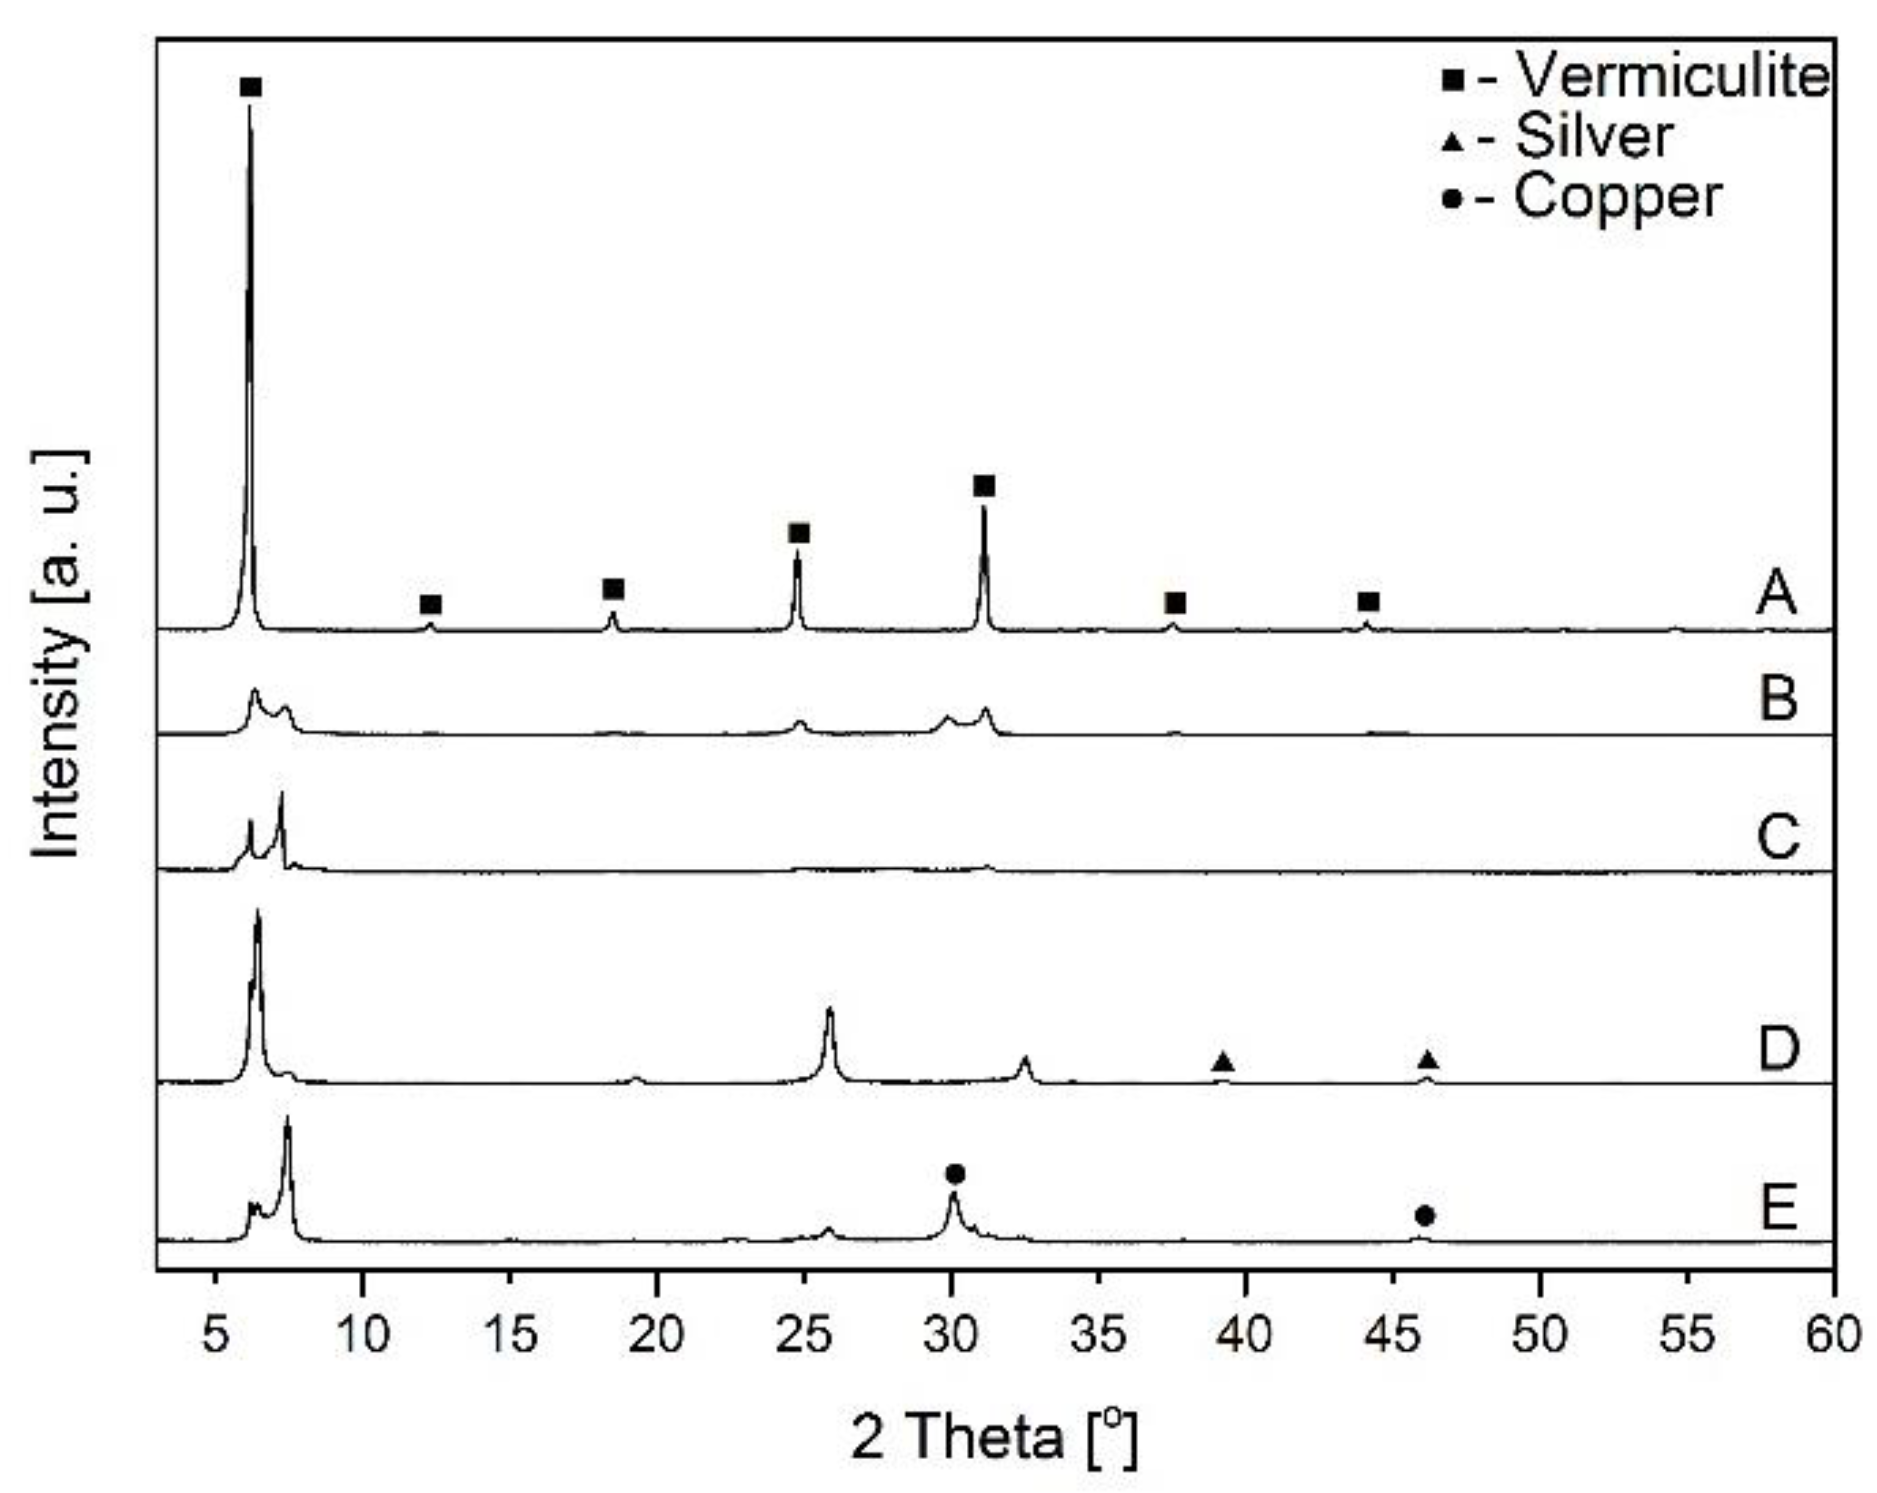
Figure 3.
X–ray diffraction of vermiculite before and after Ag+ or Cu2+ adsorption: A–raw vermiculite, B–NaOH–activated vermiculite, C–citric acid-activated vermiculite, D–vermiculite after the adsorption of silver ions, E–vermiculite after the adsorption of copper ions.
Figure 3.
X–ray diffraction of vermiculite before and after Ag+ or Cu2+ adsorption: A–raw vermiculite, B–NaOH–activated vermiculite, C–citric acid-activated vermiculite, D–vermiculite after the adsorption of silver ions, E–vermiculite after the adsorption of copper ions.
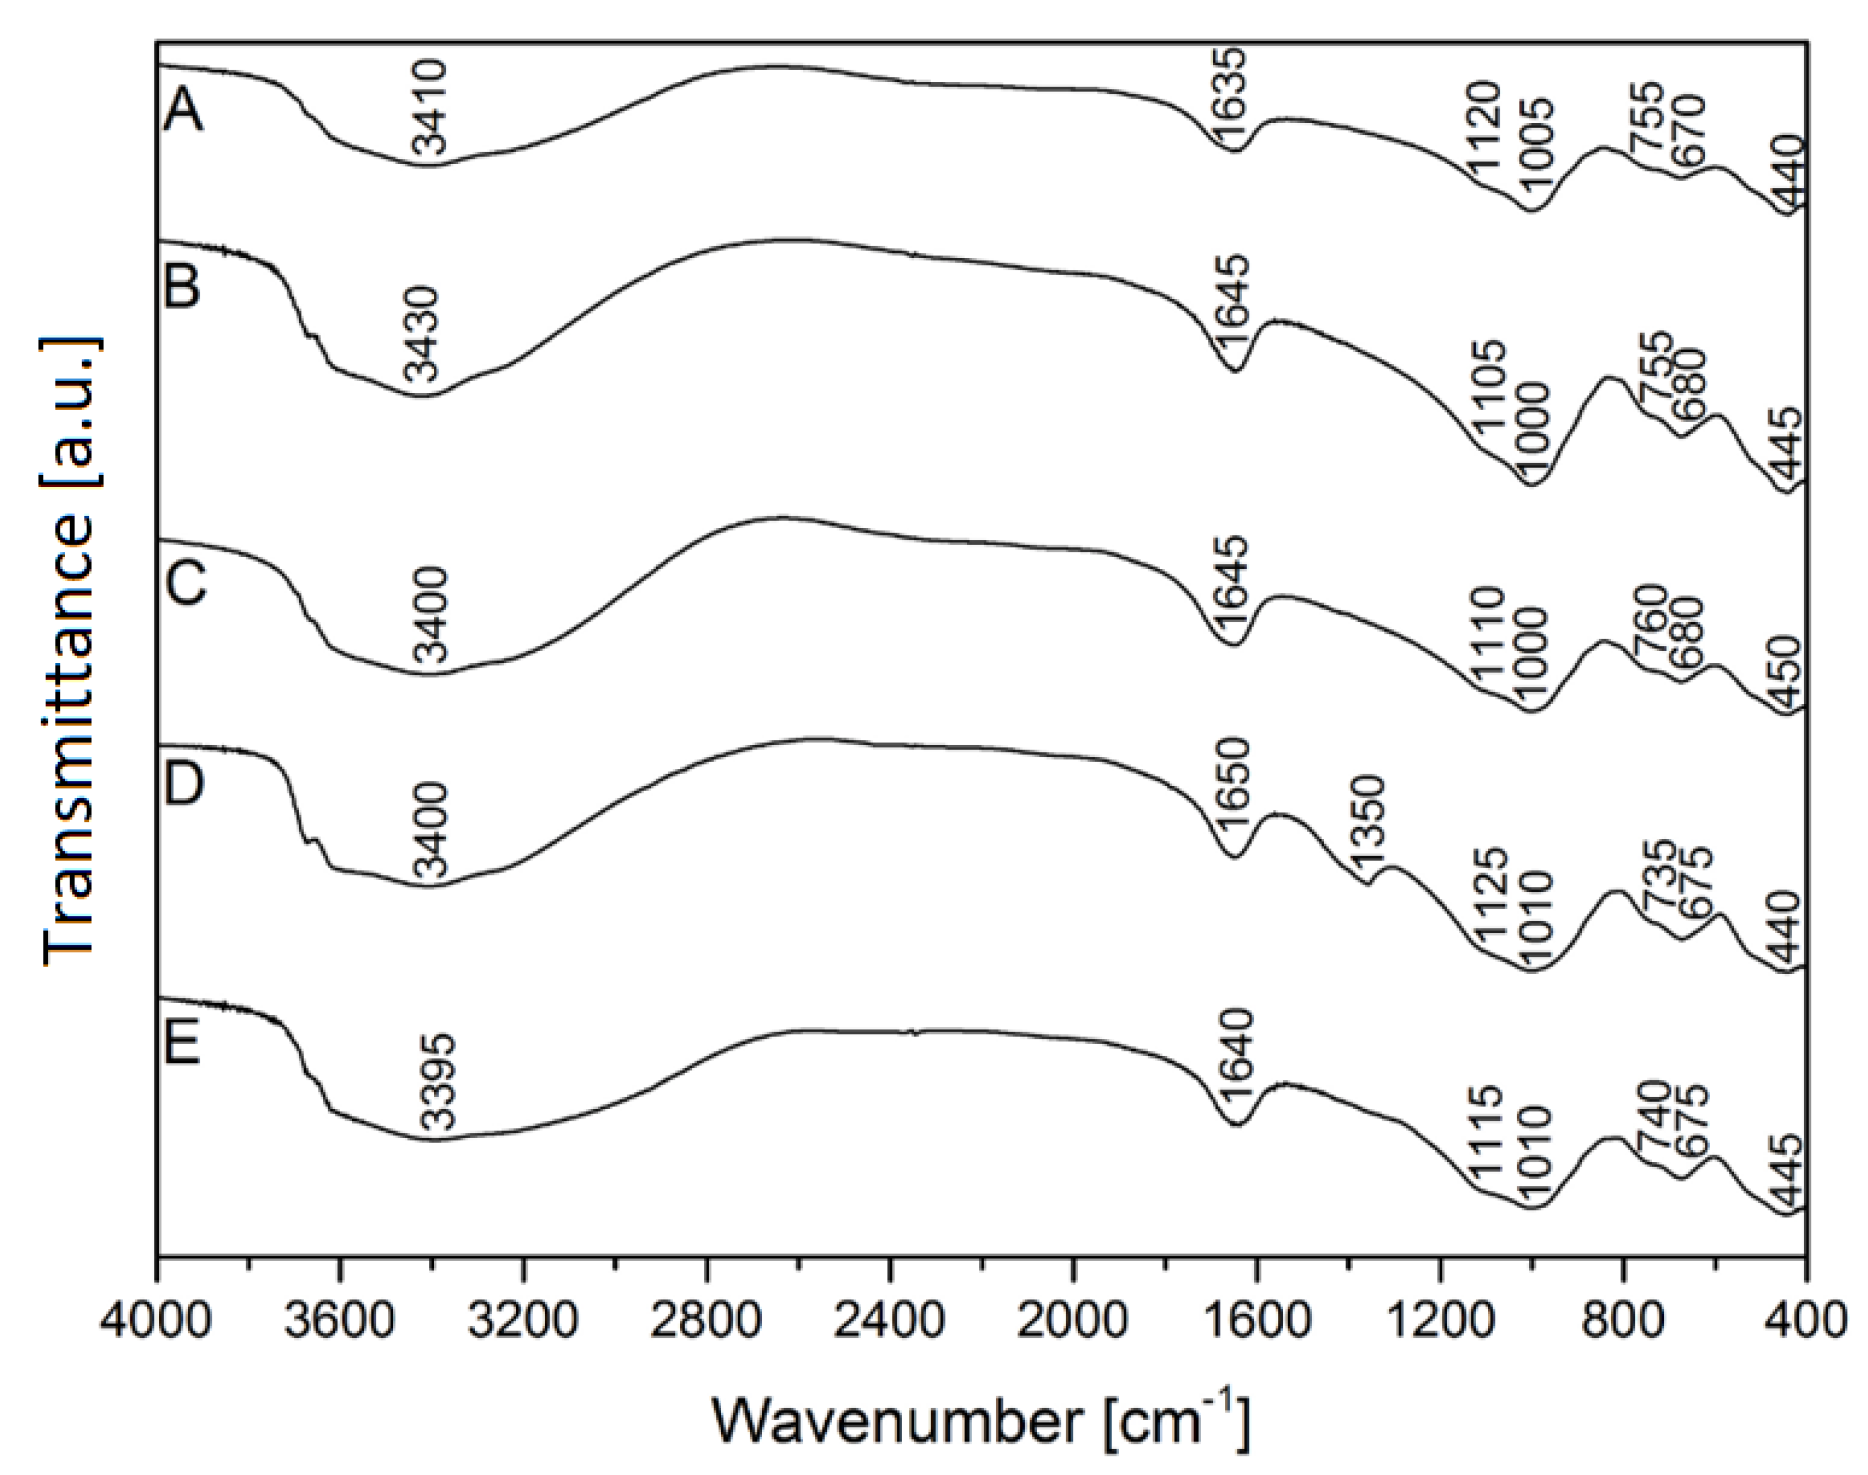
Figure 4.
FTIR analysis of vermiculite: A–raw vermiculite, B–NaOH-activated vermiculite, C–citric acid-activated vermiculite, D–vermiculite after the adsorption of silver ions, E–vermiculite after the adsorption of copper ions.
Figure 4.
FTIR analysis of vermiculite: A–raw vermiculite, B–NaOH-activated vermiculite, C–citric acid-activated vermiculite, D–vermiculite after the adsorption of silver ions, E–vermiculite after the adsorption of copper ions.
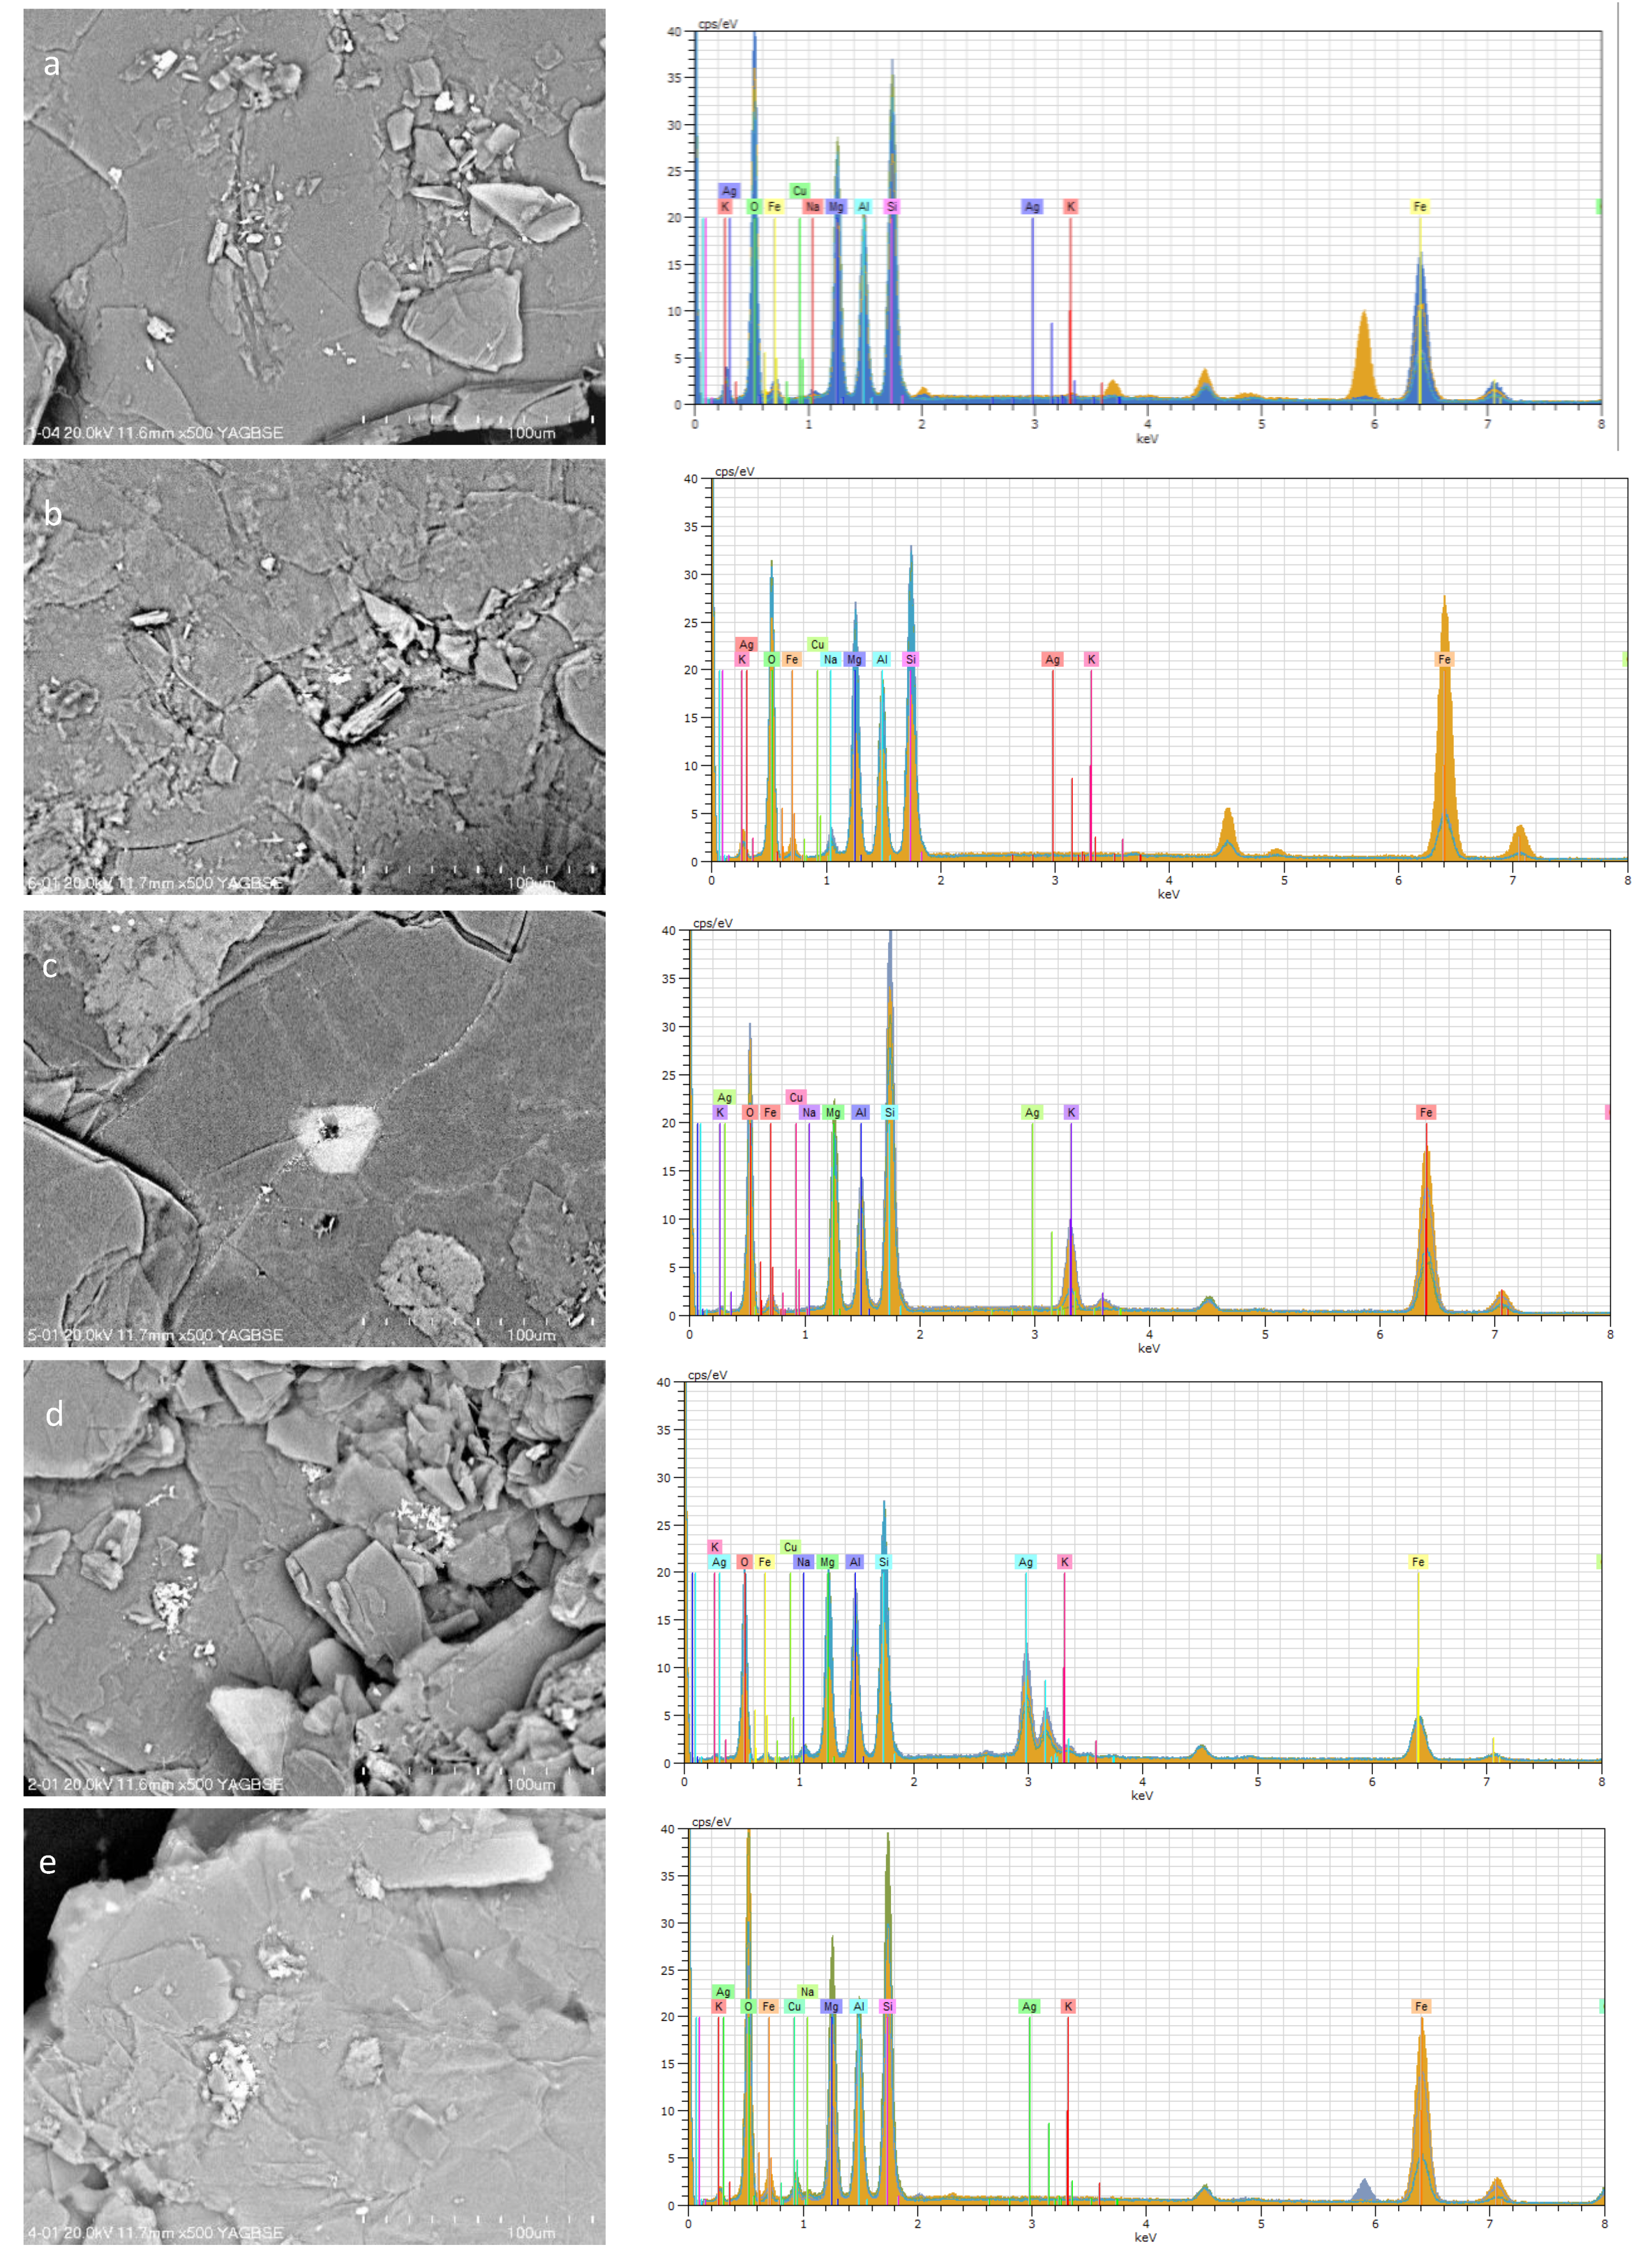
Figure 5.
SEM images and EDS patterns of vermiculite: (a) Raw vermiculite, (b) NaOH–activated vermiculite, (c) citric acid–activated vermiculite, (d) after the adsorption of , (e) after the adsorption of .
Figure 5.
SEM images and EDS patterns of vermiculite: (a) Raw vermiculite, (b) NaOH–activated vermiculite, (c) citric acid–activated vermiculite, (d) after the adsorption of , (e) after the adsorption of .
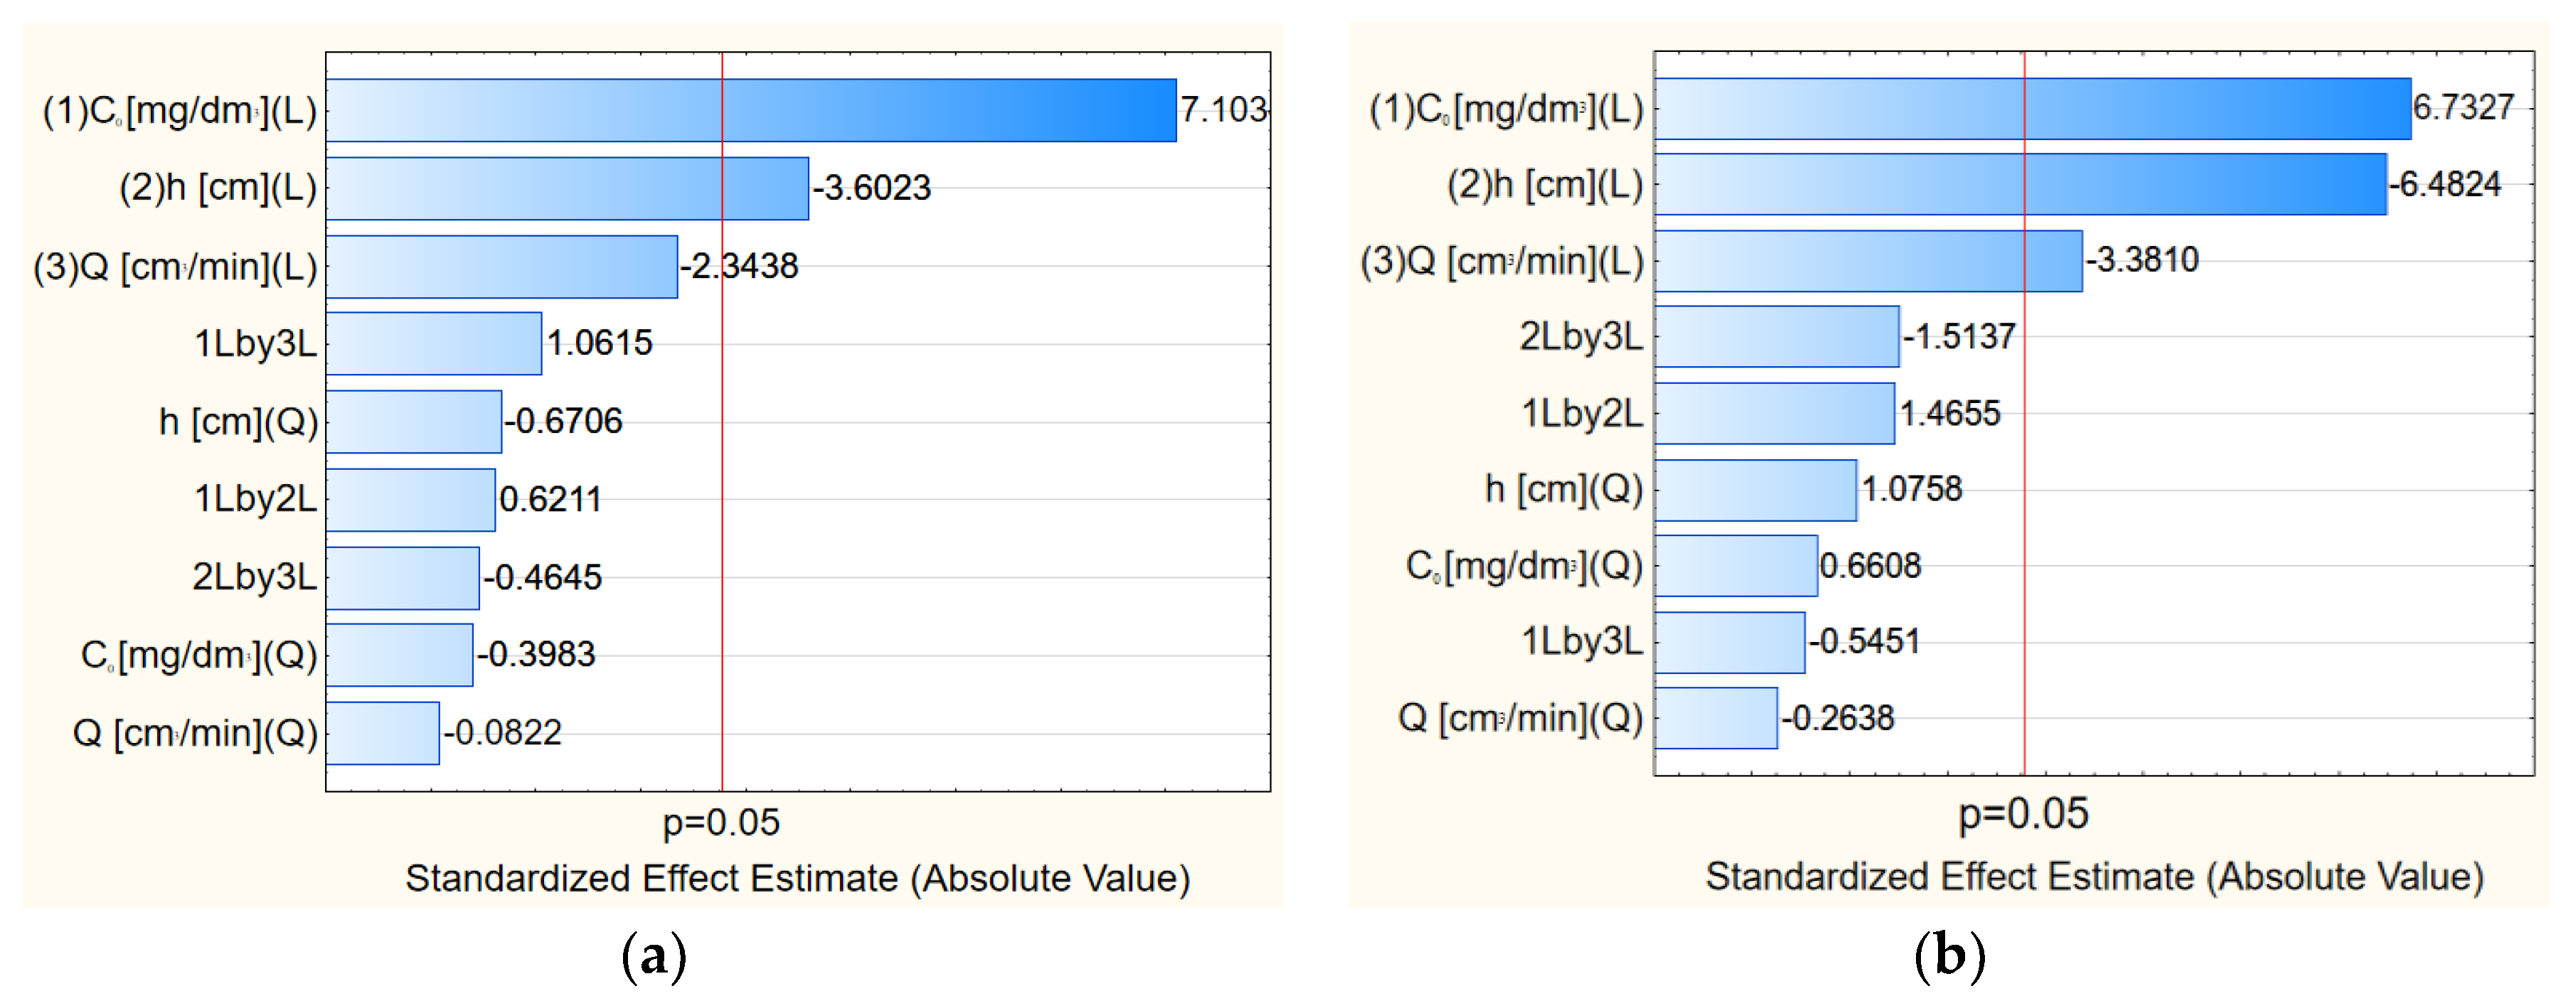
Figure 6.
Pareto chart of standardized experimental effects for vermiculite: (a) For silver ions and (b) for copper ions.
Figure 6.
Pareto chart of standardized experimental effects for vermiculite: (a) For silver ions and (b) for copper ions.
Figure 7.
Profiles for predicted values and desirability for the removal of: (a) silver ions, (b) copper ions
Figure 7.
Profiles for predicted values and desirability for the removal of: (a) silver ions, (b) copper ions
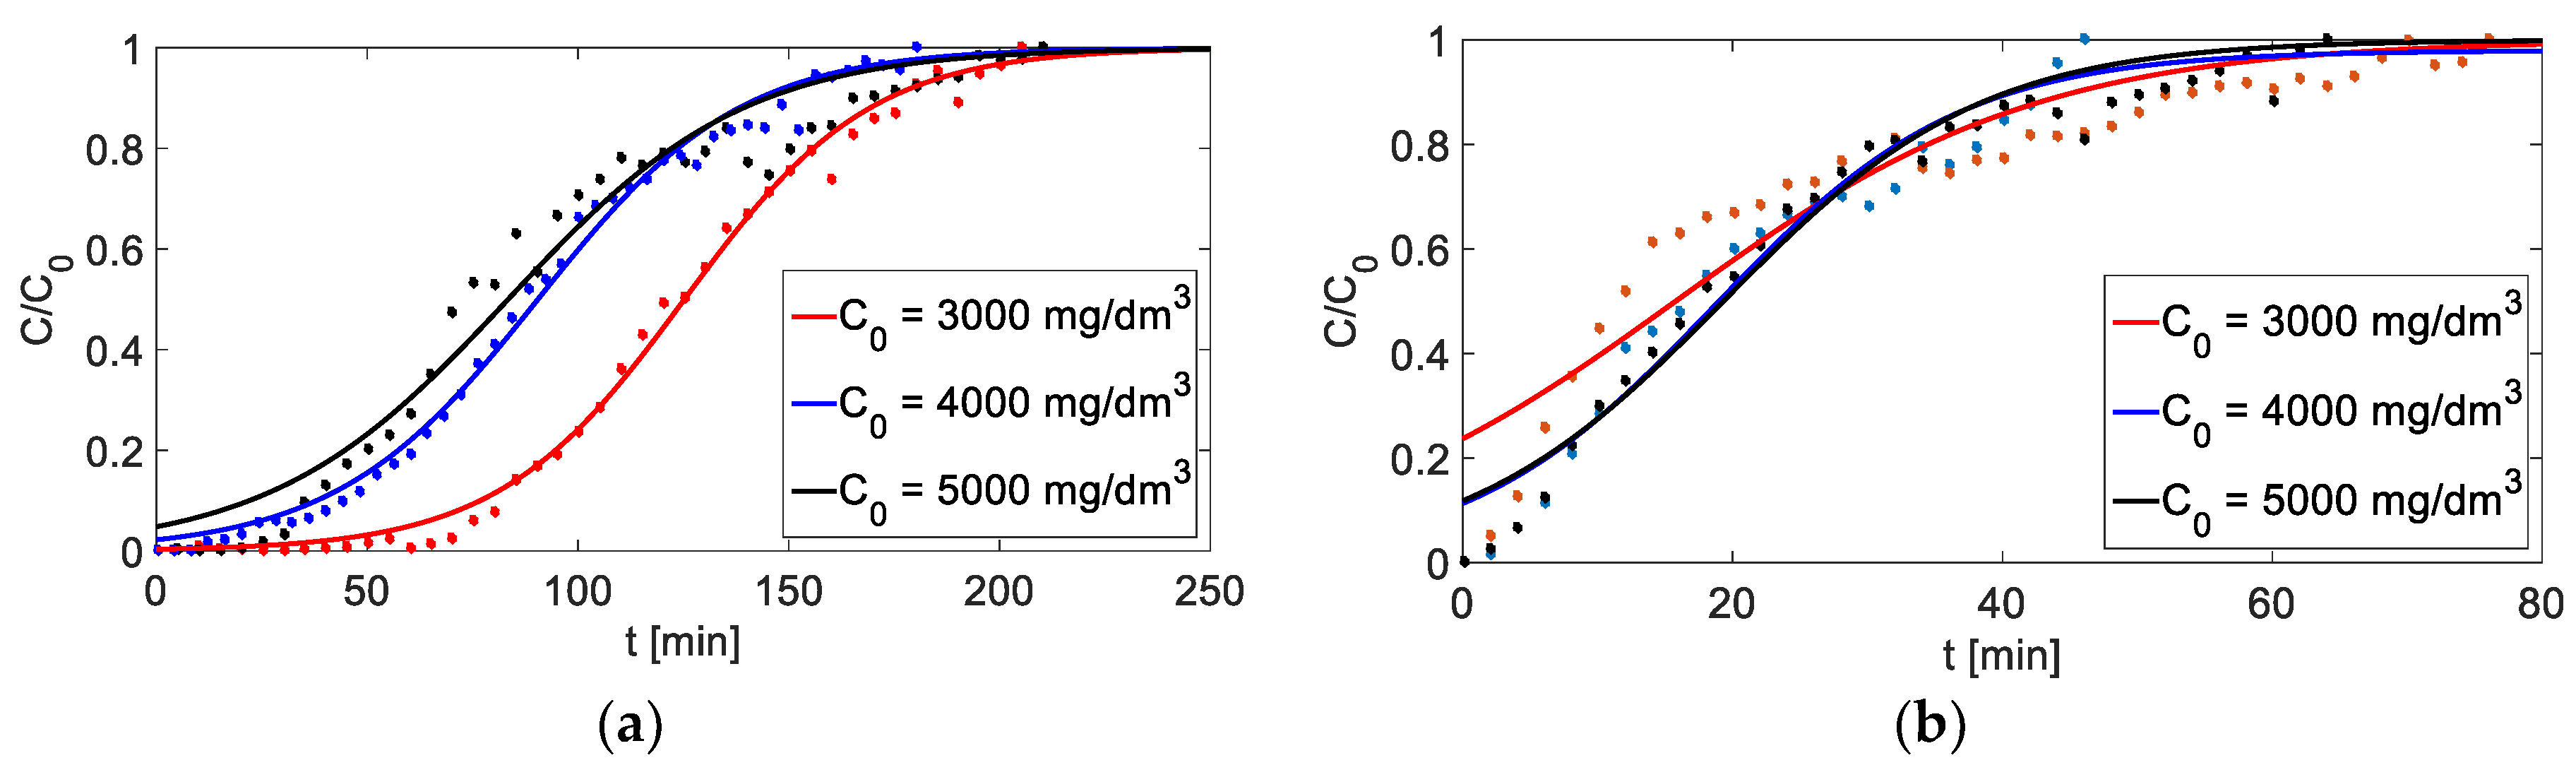
Figure 8.
Breakthrough curves for different initial concentrations of metal cations: (a) adsorption (h= 6 cm, Q = 3 cm3/min), (b) adsorption (h = 6 cm, Q = 4.5 cm3/min).
Figure 8.
Breakthrough curves for different initial concentrations of metal cations: (a) adsorption (h= 6 cm, Q = 3 cm3/min), (b) adsorption (h = 6 cm, Q = 4.5 cm3/min).
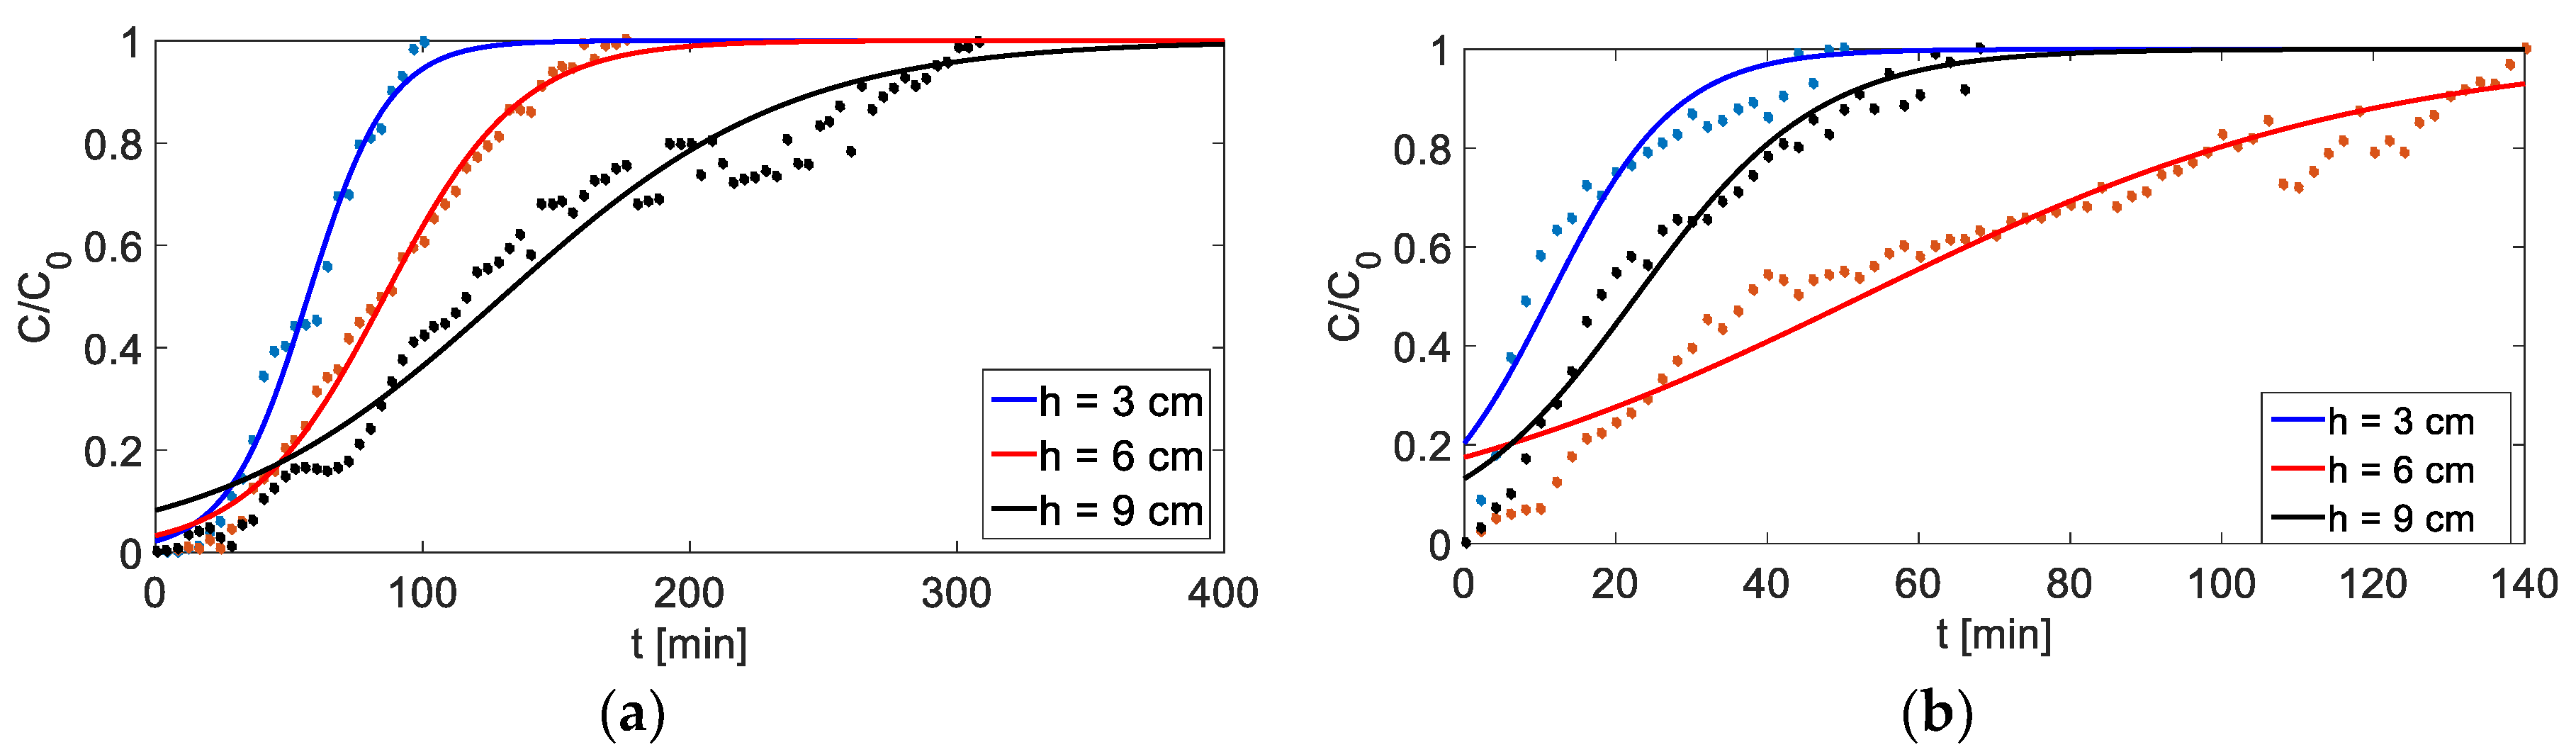
Figure 9.
Breakthrough curves for different bed heights: (a) adsorption (C0 = 4000 mg/dm3, Q = 3 cm3/min), (b) adsorption (C0 = 4000 mg/dm3, Q = 4.5 cm3/min).
Figure 9.
Breakthrough curves for different bed heights: (a) adsorption (C0 = 4000 mg/dm3, Q = 3 cm3/min), (b) adsorption (C0 = 4000 mg/dm3, Q = 4.5 cm3/min).
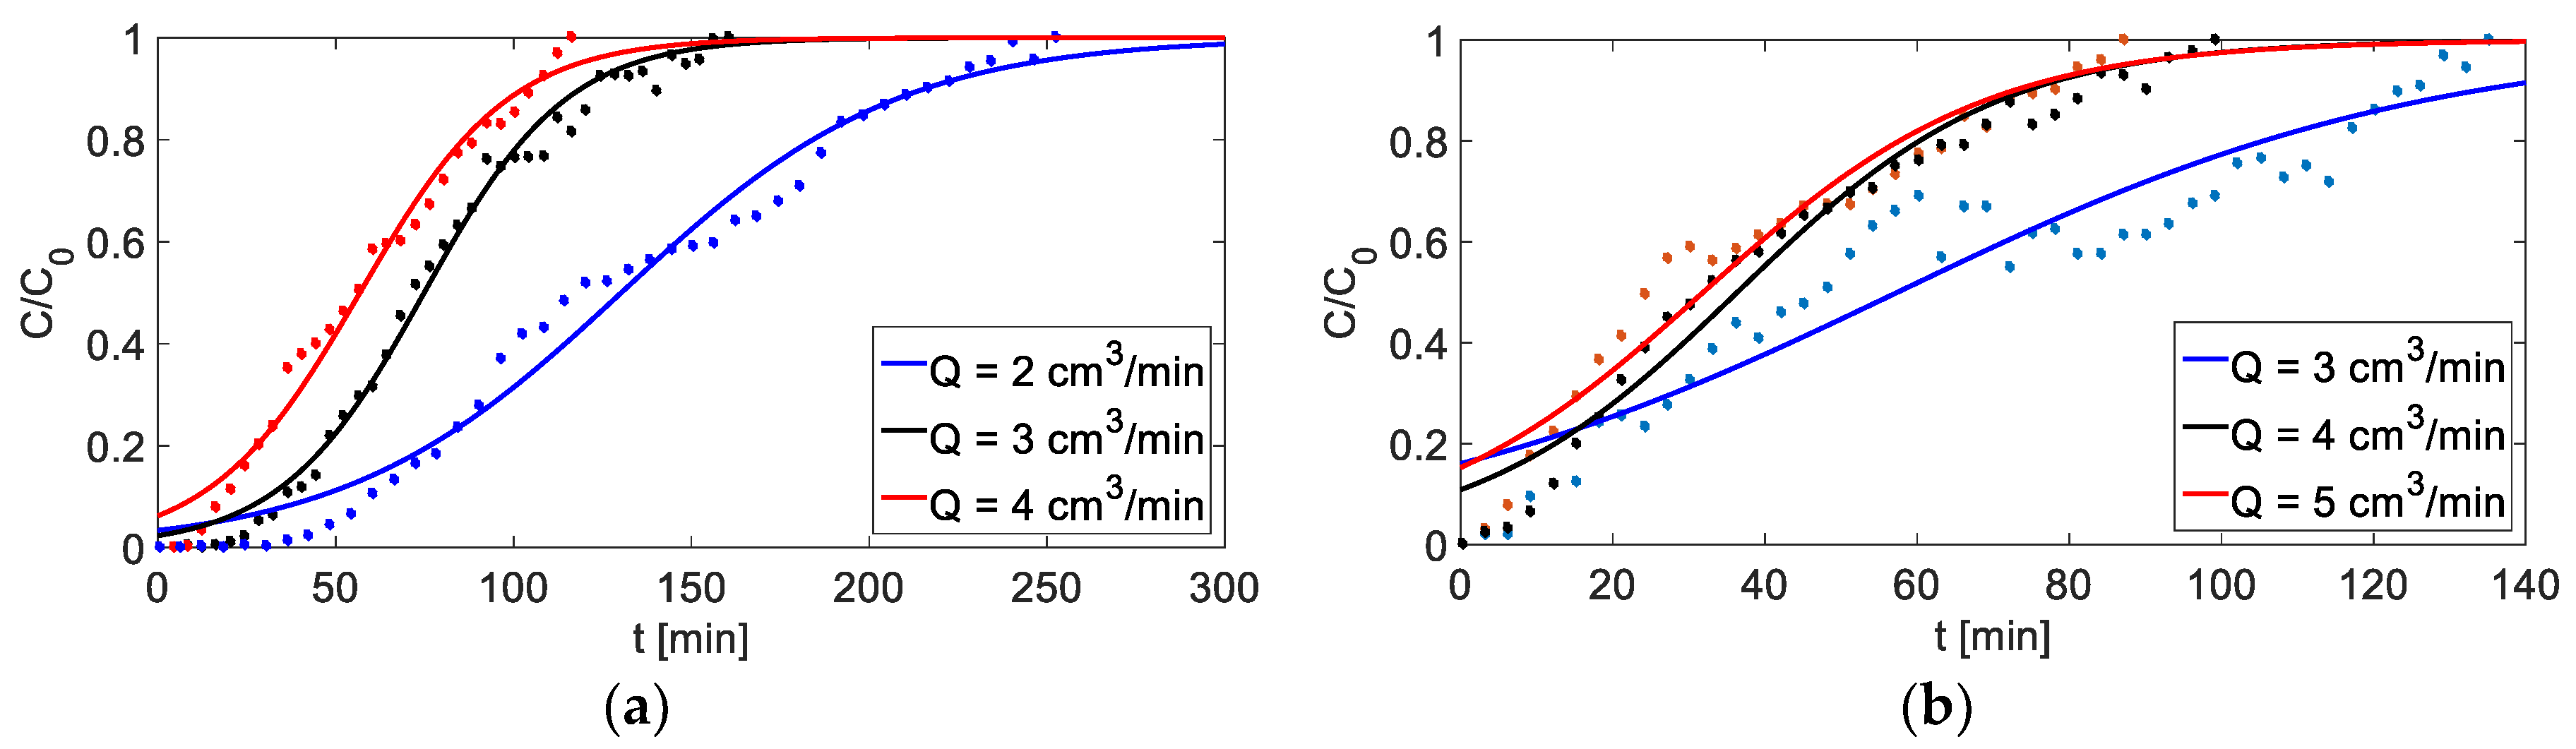
Figure 10.
Breakthrough curves for different flow rates of feed solution (C0 = 4000 mg/dm3, h = 6 cm): (a) adsorption, (b) adsorption.
Figure 10.
Breakthrough curves for different flow rates of feed solution (C0 = 4000 mg/dm3, h = 6 cm): (a) adsorption, (b) adsorption.
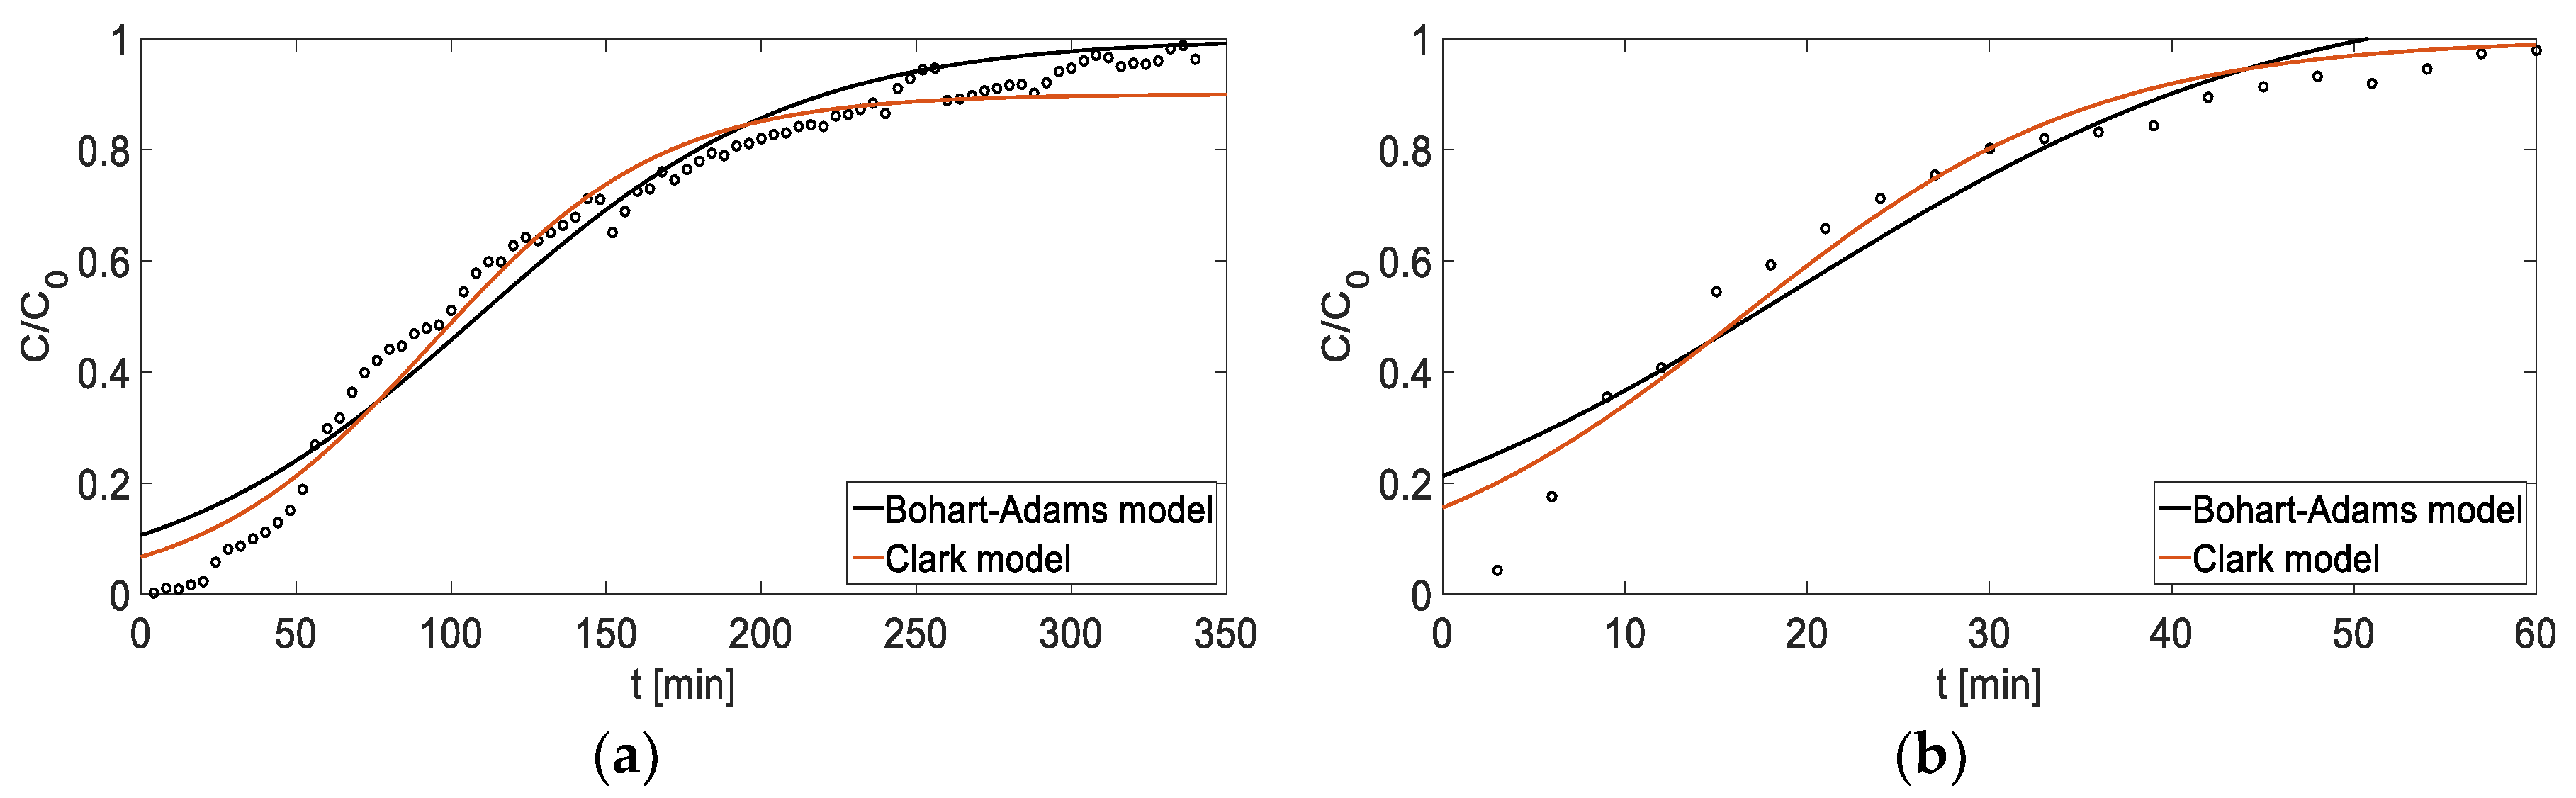
Figure 11.
Fit of breakthrough curves with mathematical models: (a) adsorption , (b) adsorption h.
Figure 11.
Fit of breakthrough curves with mathematical models: (a) adsorption , (b) adsorption h.
Table 1.
Experimental range and levels of independent process variables.
Table 1.
Experimental range and levels of independent process variables.
| | Variable Name | Unit | Variable Symbol | Range |
|---|
| (−1) | (+1) |
|---|
| Height of adsorbent bed | (cm) | | 3 | 9 |
| | Initial metal ion concentration | (mg dm−1) | | 3000 | 5000 |
| | Flow rate | (cm3 min−1) | | 2 | 4 |
| Height of adsorbent bed | (cm) | | 3 | 9 |
| | Initial metal ion concentration | (mg dm−1) | | 3000 | 5000 |
| | Flow rate | (cm3 min−1) | | 3 | 6 |
Table 2.
Models for fixed-bed column description.
Table 2.
Models for fixed-bed column description.
| Model | Nonlinear Form | Linear Form | Plot |
|---|
| Bohart-Adams | | | |
| Thomas | | | |
| Yoon-Nelson | | | |
| Clark | | | |
Table 3.
Parameters of microstructural raw and activated vermiculite.
Table 3.
Parameters of microstructural raw and activated vermiculite.
| Variable | Raw Vermiculite | Base–Activated Vermiculite | Acid–Activated Vermiculite |
|---|
| Specific surface area (m2/g) | | | |
| Average pore diameter (nm) | 0.558 | 1.487 | 1.737 |
| Mesopore diameter (nm) | 38.73 | 38.73 | 21.433 |
| (g/cm3) | | | |
| (g/cm3) | | | |
| (g/cm3) | | | |
| Relative density (%) | | | |
| Total porosity (%) | | | |
| Open porosity (%) | | | |
Table 4.
FTIR characteristic peaks of vermiculite before and after Ag+/Cu2+ adsorption.
Table 4.
FTIR characteristic peaks of vermiculite before and after Ag+/Cu2+ adsorption.
| Vermiculite FTIR Peaks [cm−1] | Assignment | References |
|---|
| 440–450 | Si–O–Si bending vibration | [30] |
| 670–80 | Si–O–Si asymmetric stretching | [31] |
| 730–760 | Al–O coordination | [32] |
| 1000–1010 | Si–O asymmetric stretching | [33] |
| 1100–1125 | Si–O–Si asymmetric stretching | [30] |
| 1350 | N=O stretching | [32] |
| 1630–1650 | O–H bending mode | [34] |
| 3350–3450 | O–H stretching | [35] |
Table 5.
Comparison of sorption capacities of vermiculite for several sorbents.
Table 5.
Comparison of sorption capacities of vermiculite for several sorbents.
| Sorbent | | | | | | | Ref. |
|---|
| Raw vermiculite | 20.61 | 46.9 | 34.9 | 25.33 | 23.40 | 64.10 | [15,38] |
| Alkaline treated vermiculite | 51.1 | 71,2 | – | – | – | – | [18,29] |
| Chitosan-modified vermiculite | – | – | 72.2 | – | – | – | [16] |
| Vermiculite (adsorption in multi-component systems) | – | 2.7–12.2 | – | 8.1–14.2 | – | 20–68 | [39] |
Table 6.
Column data parameters obtained at different inlet metal ion concentrations, bed heights and flow rates.
Table 6.
Column data parameters obtained at different inlet metal ion concentrations, bed heights and flow rates.
| Run | | |
|---|
| C0 | h (cm) | | qeq (mg/g) | Y (%) | C0 | h (cm) | | qeq (mg/g) | Y (%) |
|---|
| 1 | 3000 | 3 | 2 | 29.70 | 52.66 | 3000 | 3 | 3 | 41.45 | 59.56 |
| 2 | 3000 | 3 | 4 | 23.96 | 44.38 | 3000 | 3 | 6 | 28.39 | 65.62 |
| 3 | 3000 | 9 | 2 | 8.89 | 17.41 | 3000 | 9 | 3 | 19.70 | 58.62 |
| 4 | 3000 | 9 | 4 | 19.06 | 44.95 | 3000 | 9 | 6 | 19.80 | 49.50 |
| 5 | 5000 | 3 | 2 | 68.89 | 60.43 | 5000 | 3 | 3 | 59.10 | 68.76 |
| 6 | 5000 | 3 | 4 | 61.96 | 59.37 | 5000 | 3 | 6 | 26.02 | 40.66 |
| 7 | 5000 | 9 | 2 | 29.20 | 53.11 | 5000 | 9 | 3 | 48.85 | 56.08 |
| 8 | 5000 | 9 | 4 | 19.42 | 45.29 | 5000 | 9 | 6 | 38.20 | 58.47 |
| 9 | 3000 | 6 | 3 | 17.46 | 37.86 | 3000 | 6 | 4.5 | 14.58 | 52.81 |
| 10 | 5000 | 6 | 3 | 40.93 | 58.71 | 5000 | 6 | 4.5 | 43.05 | 67.16 |
| 11 | 4000 | 3 | 3 | 30.55 | 48.96 | 4000 | 3 | 4.5 | 55.21 | 66.00 |
| 12 | 4000 | 9 | 3 | 29.24 | 46.87 | 4000 | 9 | 4.5 | 46.90 | 62.81 |
| 13 | 4000 | 6 | 2 | 11.87 | 23.56 | 4000 | 6 | 3 | 33.58 | 46.64 |
| 14 | 4000 | 6 | 4 | 22.75 | 49.03 | 4000 | 6 | 6 | 27.02 | 58.23 |
| 15 | 4000 | 6 | 3 | 23.17 | 59.30 | 4000 | 6 | 4.5 | 33.10 | 60.85 |
| 16 | 4000 | 6 | 3 | 21.50 | 52.09 | 4000 | 6 | 4.5 | 31.98 | 60.57 |
| 17 | 4000 | 6 | 3 | 18.23 | 41.07 | 4000 | 6 | 4.5 | 36.66 | 67.40 |
| 18 | 4000 | 6 | 3 | 20.94 | 45.94 | 4000 | 6 | 4.5 | 35.52 | 63.42 |
| 19 | 4000 | 6 | 3 | 25.27 | 46.80 | 4000 | 6 | 4.5 | 29.85 | 56.52 |
Table 7.
The Bohart–Adams, Thomas, Yoon–Nelson and Clark model parameters using nonlinear regression analysis.
Table 7.
The Bohart–Adams, Thomas, Yoon–Nelson and Clark model parameters using nonlinear regression analysis.
| Isotherm | Parameters | Adsorbed Metal Ions |
|---|
| |
|---|
| Bohart–Adams | | | |
| | |
| | |
| F | 649.8 | 277.2 |
| Clark | | | |
| r (min−1) | | |
| 0.9943 | |
| F | 531.1 | 121.7 |


