Article

Feasibility Study of Real-Time Monitoring of Pin Connection Wear Using Acoustic Emission

1
State Key Laboratory of Coastal and Offshore Engineering, Dalian University of Technology, Dalian 116024, Liaoning, China
2
CCCC Second Highway Consultants Co. Ltd, Wuhan 430000, Hubei, China
3
Smart Materials and Structures Laboratory, Department of Mechanical Engineering, University of Houston, Houston, TX 77204, USA
*
Authors to whom correspondence should be addressed.
Appl. Sci. 2018, 8(10), 1775; https://doi.org/10.3390/app8101775
Submission received: 7 July 2018 / Revised: 15 September 2018 / Accepted: 25 September 2018 / Published: 30 September 2018
(This article belongs to the Special Issue Structural Damage Detection and Health Monitoring)

Abstract

:
Pin connections are one of the most important connecting forms and they have been widely used in engineering fields. In its service, pin connections are subject to wear, and it will be beneficial if the health condition of pin connections can be monitored in real time. In this paper, an acoustic emission (AE)-based method was developed to monitor wear degree of low rotational speed pin connections in real time in a nondestructive way. Most pin connections are operated at low rotational speed. To facilitate the research, an experimental apparatus to accelerate the wear test of low rotational speed pin connections was designed and fabricated. The piezoceramic AE sensor was mounted on the test apparatus in a nondestructive way, and it was capable of real-time monitoring. Accelerated wear tests of low rotational speed pin connections were conducted. To verify the results of the AE technique, a VHX-600E digital (from Keyence, Osaka, Japan) microscope was applied to observe the micrographs of the tested pins. The experimental results show that AE activity existed throughout the entire wear process, and it was the most prominent in the serious wear phase. The wear degree of the pin connections can be reflected qualitatively by the signal strength and the accumulative signal strength of the AE signals. In addition, two different wear forms can be distinguished by comparing the signal strength values of all specimens. Micrographs of all specimens confirm these results, and determine that the two wear forms include adhesive wear and abrasive wear. Furthermore, AE results demonstrated that adhesive wear is the main mode of wear for the low rotational speed pin connections, and the signal strength of the adhesive wear is around 190 times larger than that of abrasive wear. This feasibility study demonstrated that the developed acoustic emission technique can be utilized in the wear monitoring of pin connections in real time in a nondestructive way.

1. Introduction

Pin connections, as one of the most common forms for rotational connections, have many advantages, such as low cost and ease of assembly. Compared with other connection forms, pin connections allow for relative rotation of the structural component to different degrees [1]. This paper studied pin connections with working conditions at low rotational speed, and these low rotational speed pin connections have been widely used in suspension bridges and wind turbines among others. As a matter of fact, most pin connections involve low rotational speeds, since, for a high rotational speed, often more sophisticated bearings will be used to reduce the friction. However, continuous operation without proper lubrication may cause serious wear on the surface of the pins, and this may result in the eventual failure if not detected in time. The traditional method of detecting abnormal wear involves human inspection, whose outcome mainly depends on the experience of the inspector, who judges the health condition of the pin connections by listening to the sound of the pin connections in motion. Human inspection can only be conducted within a time interval, and the results are qualitative and may be polluted by human error. Therefore, an effective nondestructive method for monitoring the health of pin connections in real time is necessary. With the recent advances in structural health monitoring (SHM) [2,3,4,5,6,7,8] and nondestructive evaluation (NDE) [9,10], many monitoring and evaluation methods, such as modal characteristics-based methods [11,12,13], active sensing [14,15,16,17,18,19,20], electromechanical impedance [21,22,23,24,25], ultrasonic guided wave [26], active thermography [26,27,28] and vibrothermography [29,30], among others, are available. Among them, acoustic emission technique [31,32,33,34,35,36,37] is an effective nondestructive technique that can characterize the wear process [38,39], and it has been widely used in civil engineering [40,41,42,43], mechanical engineering [44,45,46,47,48,49,50], and mine engineering [51,52], among other fields [53,54,55,56,57,58,59].
Acoustic emission (AE) is the transient elastic wave caused by the rapid release of energy of materials, due to the process of the deformation or fracture of the materials under stress [60,61,62]. As this phenomenon occurs inside materials, the AE technique can reflect the interior damage information of materials [44,63], and it has found a wide range of applications. Compared with other non-destructive testing approaches, using a highly sensitive piezoceramic probe, the AE technique is more sensitive to material damage, and it is suitable for continuous health monitoring in real time [17]. For example, researchers have extensively applied AE techniques to monitor concrete structures [43,64,65,66,67,68]. Aldahdooh et al. [41] and Prem et al. [69] demonstrated that AE technique was an effective technique to monitor the damage process of reinforced concrete. EI Batanouny et al. [70] revealed that AE technology was more sensitive than the evaluation criteria in ACI 437, and found that damage quantification charts were based on the failure procedure of pre-stressed concrete beams. Hay et al. [71] applied an acoustic emission technique to monitor the connection parts of a bridge. In recent years, there is an emphasis on the monitoring of various structures in real time, and many innovative algorithms [72,73,74,75,76,77,78,79], sensors [14,80,81], and systems [82,83,84,85,86] have been developed for such a purpose. An AE sensor is normally small, and it can be easily attached to the host structure for real-time monitoring in a nondestructive way [81,87,88,89,90].
Researchers have applied acoustic emission techniques to detect wear [91,92,93,94,95,96]. Bhuiyan et al. [97] used an acoustic emission technique to investigate the frequency of tool wear, and found that the frequency of tool wear is distributed between 67 kHz and 471 kHz. Korchuganov et al. [98] studied the relationship between AE signals and wear modes when a steel sample slid on the surface of a diabase stone. Wear forms include abrasive wear [99], adhesive wear [100], erosive wear [101], fatigue wear [102], and corrosive wear [103]. Among the five wear forms, abrasive wear and adhesive wear are the main forms of wear that may occur in the pin connections. Abrasive wear is the most common form of wear. When a hard and rough surface or hard particles slide on a soft surface, plastic deformation and fracture will occur on the soft surface and cause abrasive wear. Adhesive wear occurs in surfaces with both dry friction and lubricated friction. When a relative slide occurs between two solid surfaces, shear is exerted on the asperities that are distributed on the surface. Then particles are detached from one side and transferred either permanently or temporarily to the surface of other side. Many researches had paid attention to abrasive wear and adhesive wear. For example, Hase et al. [99,100,104] investigated the quantitative relationships between AE signals and the state of wear in adhesive wear and abrasive wear, and proposed that the frequency peaks of adhesive wear and abrasive wear were around 1.1 MHz, and from 0.25 to 1.1 MHz, respectively. Hisakado et al. [105] found that the mean friction coefficient increased with the mean AE event counting under the various lubricated conditions.
Extensive efforts have been dedicated to studying the monitoring of connection components [106,107,108,109,110,111]. However, there are few studies that focus on the wear process of pin connections. The purpose of this study is to explore the feasibility of monitoring the wear degree of pin connections in real time by using the AE technique. To facilitate the research, an experimental apparatus to accelerate the wear test of pin connections was designed and fabricated. Accelerated wear tests of a pin connection were conducted. To verify the results of AE technique, a digital microscope was employed to observe the micrographs of the tested pins. The signal strengths of the AE signals were first used to analyze the wear degree of the pin connections. Two different wear forms can be distinguished by comparing the signal strength from four specimens. To verify the results based on AE analysis, surface micrographs of the pins are analyzed. The results showed that the AE signal strength is a good indicator to judge the wear degree of low rotational speed pin connections, and that it can be used to monitor the wear process of pin connections. Experiments also reveal that the main wear forms of low rotational speed pin connections in this research include abrasive wear and the adhesive wear. Furthermore, AE results demonstrated that the adhesive wear is the main wear form of pin connections, and the signal strength of the adhesive wear is around 190 times larger than that of abrasive wear.

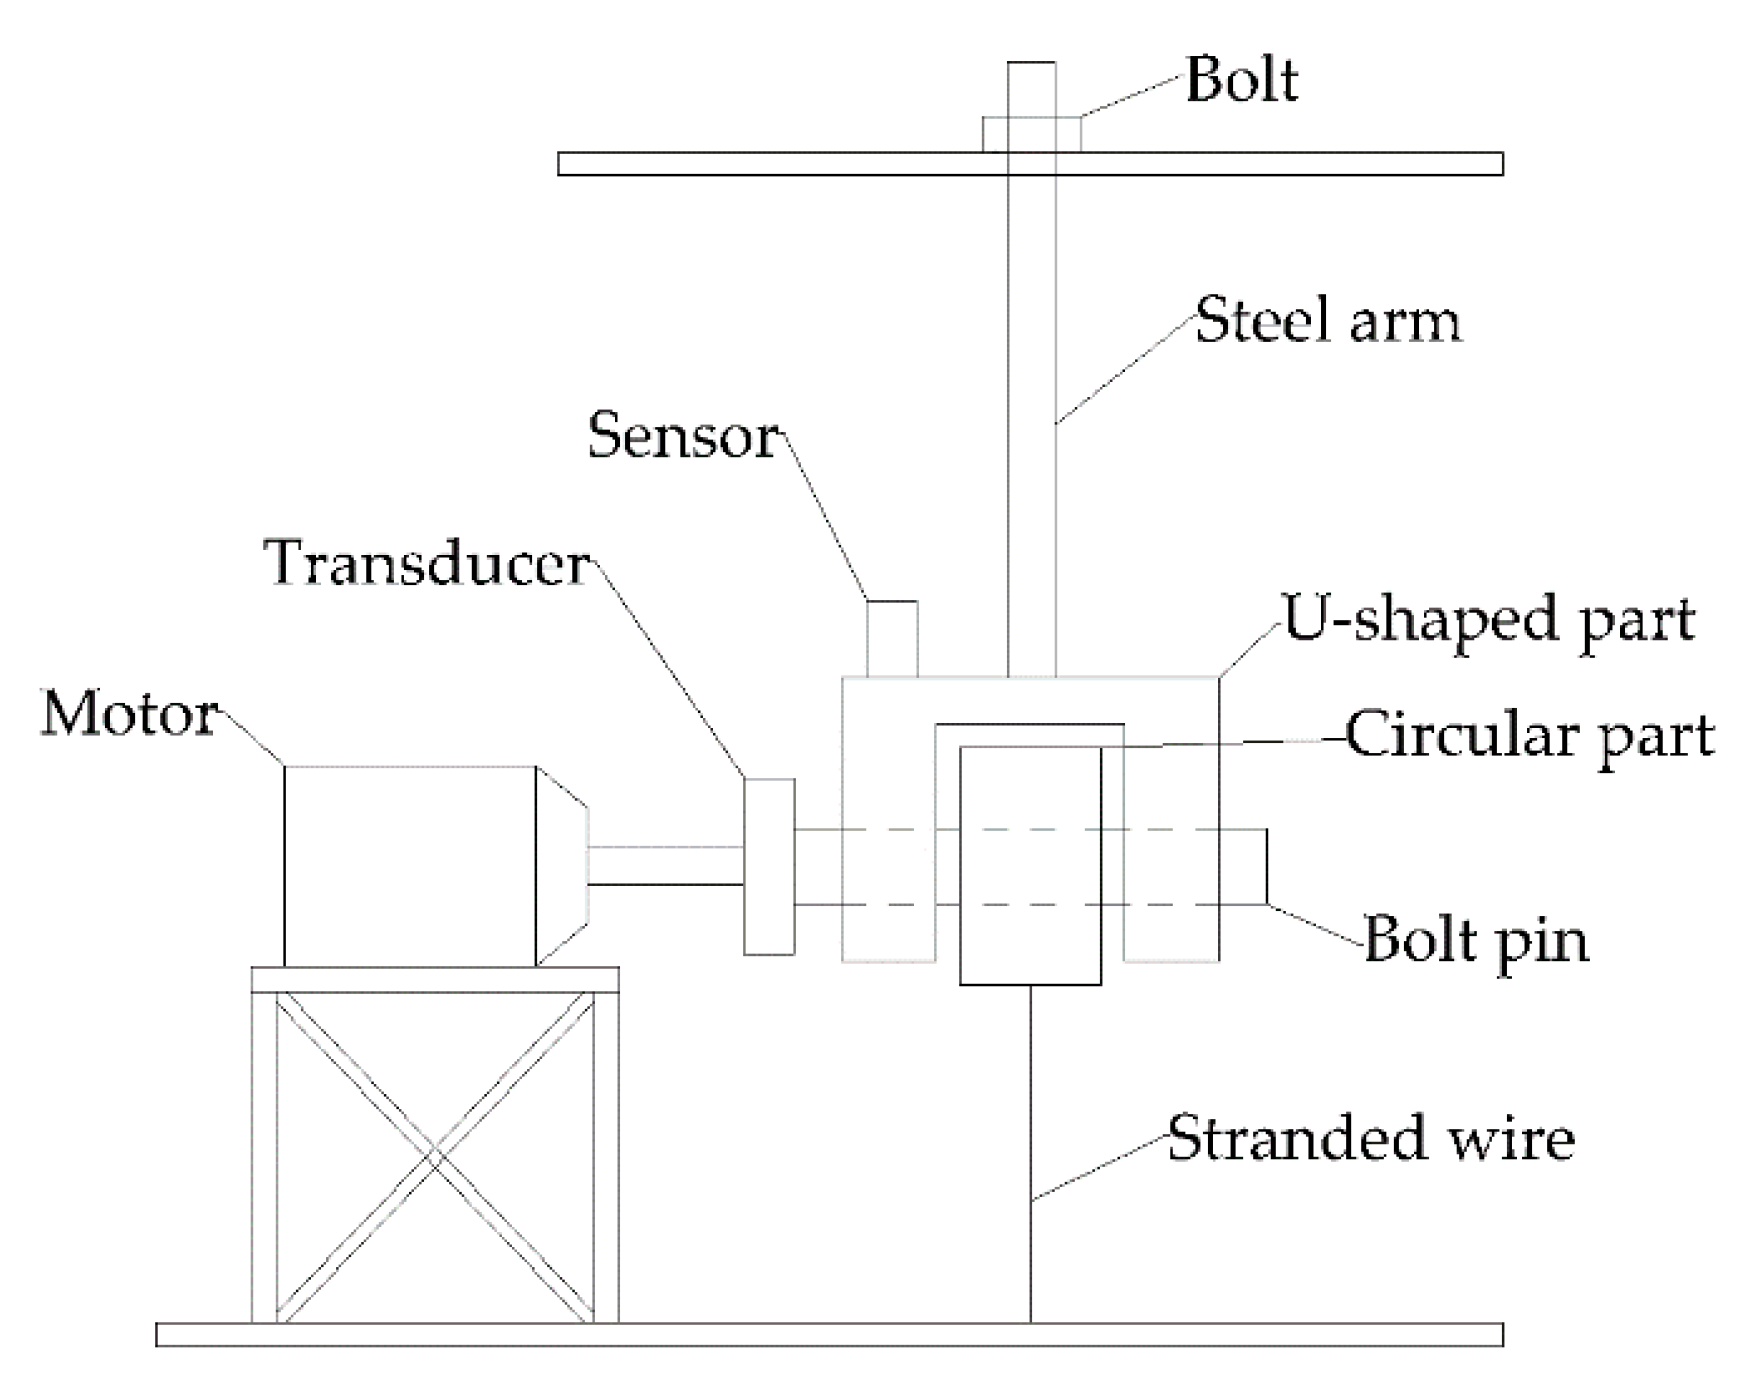
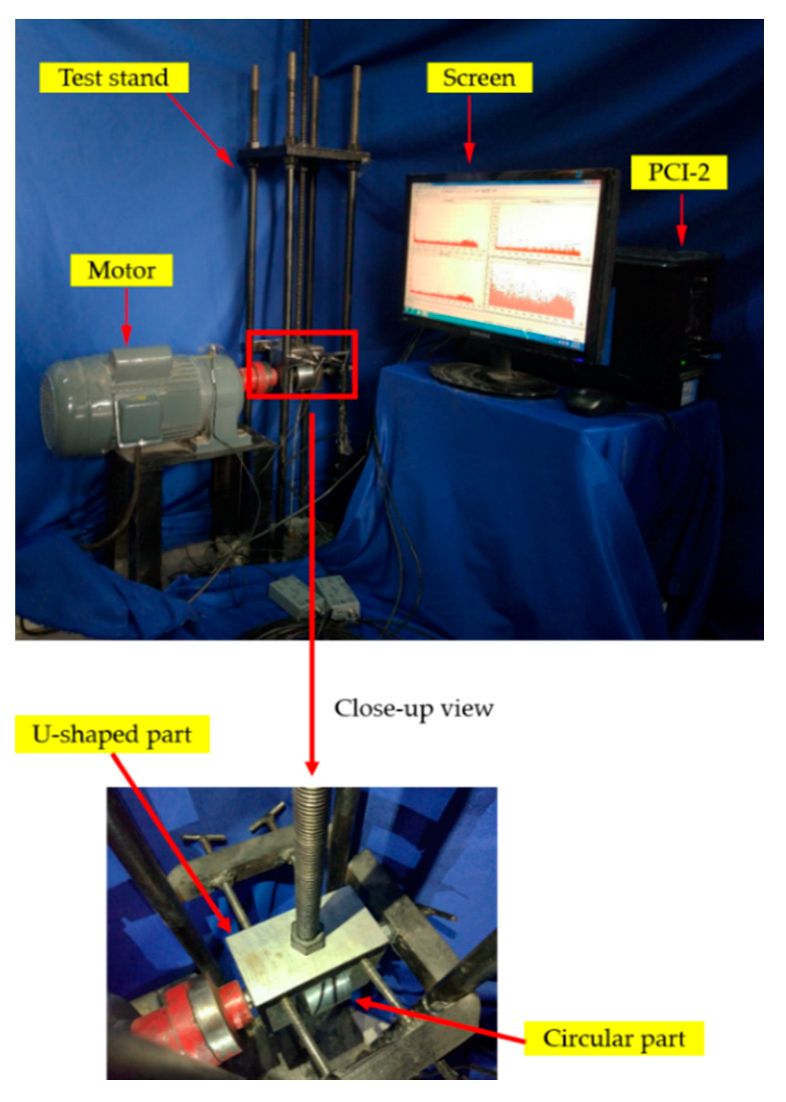
2. Experimental Setup

2.1. The Specimen

To assess the performance of AE technique in monitoring the wear process of low rotational speed pin connections, four specimens of pins were fabricated. Its dimensions are shown in Figure 1. The material of the specimens was high speed steel (HSS), which is widely used to manufacture pins, bolts, and other machine parts. Considering that HSS is a common material to manufacture pins, this paper chooses HSS as the material of the pins. The chemical compositions of the specimens are summarized in Table 1. In addition, since the experiment was to study the wear process of low rotational speed pin connections, the force applied on the specimens was low, and it could not cause shear failure. The name of lubricant used in the experiment was #3 lithium base grease, which is made of lithium hydroxy fatty acid, medium viscosity mineral lubricating oil, antioxidants, and others. Since the mechanical stability, antioxidation, and antirust stability of #3 lithium base grease are excellent, it has been widely applied in water pumps, blowing machines, motors, and others. Before a test, the #3 lithium base grease would be evenly applied on the exterior surface of pins, and on the inner face of the U-shaped parts and the circular parts.

2.2. AE Test Equipment and Procedure

Wear testing of low rotational speed pin connections were performed by using the experimental setup, as shown in Figure 2 and Figure 3. The test stand included the pin, the U-shaped part, and the circular part, as shown in Figure 2. Their material was (HSS). The chemical compositions are summarized in Table 1. The U-shaped part and the circular part were connected by the pin. Obviously, the wear occurred on two different areas: The first area was the contact surface between the pin and the U-shaped part, and the second area was the contact surface between the pin and the circular part. Furthermore, there were five bolts around the test stand (as shown in Figure 3); four of them were used to fix the U-shaped part to prevent it from shaking violently, and another bolt was applied to avoid the pin sliding along the hole. The pin was driven by the motor, whose rotational speed was 30 rpm. This rotational speed was set to accelerate the experiment. There were four sets of pin-connected components, and each pin-connected component included a pin, a circular part, and a U-shaped part. Before a new test, the used pin-connected component was replaced by a new set of pin-connected components. When a serious wear occurred in the contact surface between the pin and the connected components, the rotation of the pin might be jammed, and the stranded wire might be pulled off. To avoid such a situation, experiments were stopped after serious wear occurred. If no serious wear occurred, the experiment duration was controlled to around 10 h.
A PCI-2 8-channel system (from Physical Acoustic Corporation, Princeton, NJ, USA) was used to collect the AE signals. AE signals generated by the wear processes between the pin and the contact parts were detected by the piezoceramic AE sensor mounted on the upper surface of the U-shaped part. The piezoceramic AE sensor used in the experiment was R6a, whose frequency is from 35 kHz to 100 kHz, and whose resonance frequency is 55 kHz. The AE sensor was attached to the host structure in a nondestructive way, and it is capable of real time monitoring. The couplant was Vaseline, which can improve the coupling quality, and the pencil lead breaks method was used to check the coupling condition of the sensor. The results of pencil lead breaks showed that the amplitudes in four specimens were both 99 dB, which means high coupling quality. The acoustic emission waves caused by wear spread in the pin and the U-shaped part were collected by the sensor. When acoustic emission waves passed the contact surfaces between the pin and the U-shaped part, the phenomena of reflection, refraction, and attenuation occurred, which caused a portion of energy loss between the incident acoustic emission waves and the transmitted acoustic emission waves. Since the materials of the pin-connected components were same, the attenuation ratio was constant during the wear process. Moreover, during the wear process, the contact surfaces between the pin and the connected parts were squeezed tightly; therefore, the attenuation of the AE signals was low. When severe wear caused high energy incident acoustic emission waves, the energy of the transmitted acoustic emission waves also became larger. Therefore, the AE signals collected by the sensor reflected the wear degree of the pin.
Meanwhile, mode 2/4/6 pre-amplifiers (Figure 4) were chosen to amplify the AE signals collected by the R6a sensor, and its gain was set to 40 dB. To shield the signals from low-amplitude background noise, a threshold was set. Usually, the threshold was 45 dB, which meant that only these AE signals whose amplitude was over 45 dB could be collected by the PCI-2 system. A diagram to illustrate the instrument connection is shown in Figure 4.

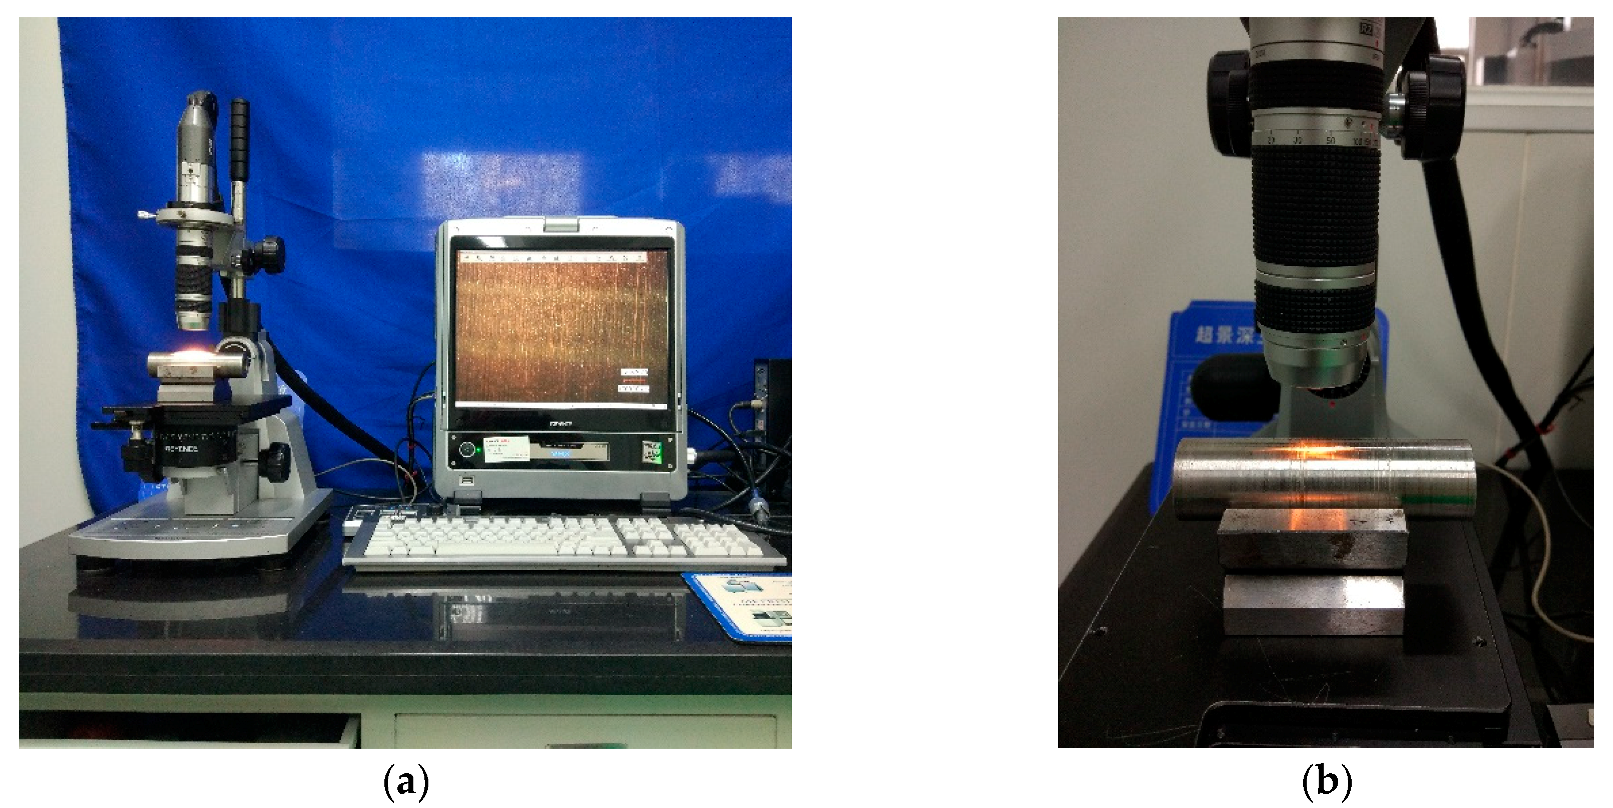
2.3. Inspecting the Pin Surface by Digital Microscopy

A VHX-600E digital (from Keyence, Osaka, Japan) microscope (as shown in Figure 5a) was used to observe the worn surface of the pins, and to create the 3D models of the worn surfaces. The scope had a varying-focus lens from 20× to 200×, and the observation range was from 19.05 to 1.14 (mm). When the specimen stage moved 15 mm, the repeat position precision was ±0.5 µm. A V-shaped support was used to support the pin (as shown in Figure 5b).

3. Results and Analyses

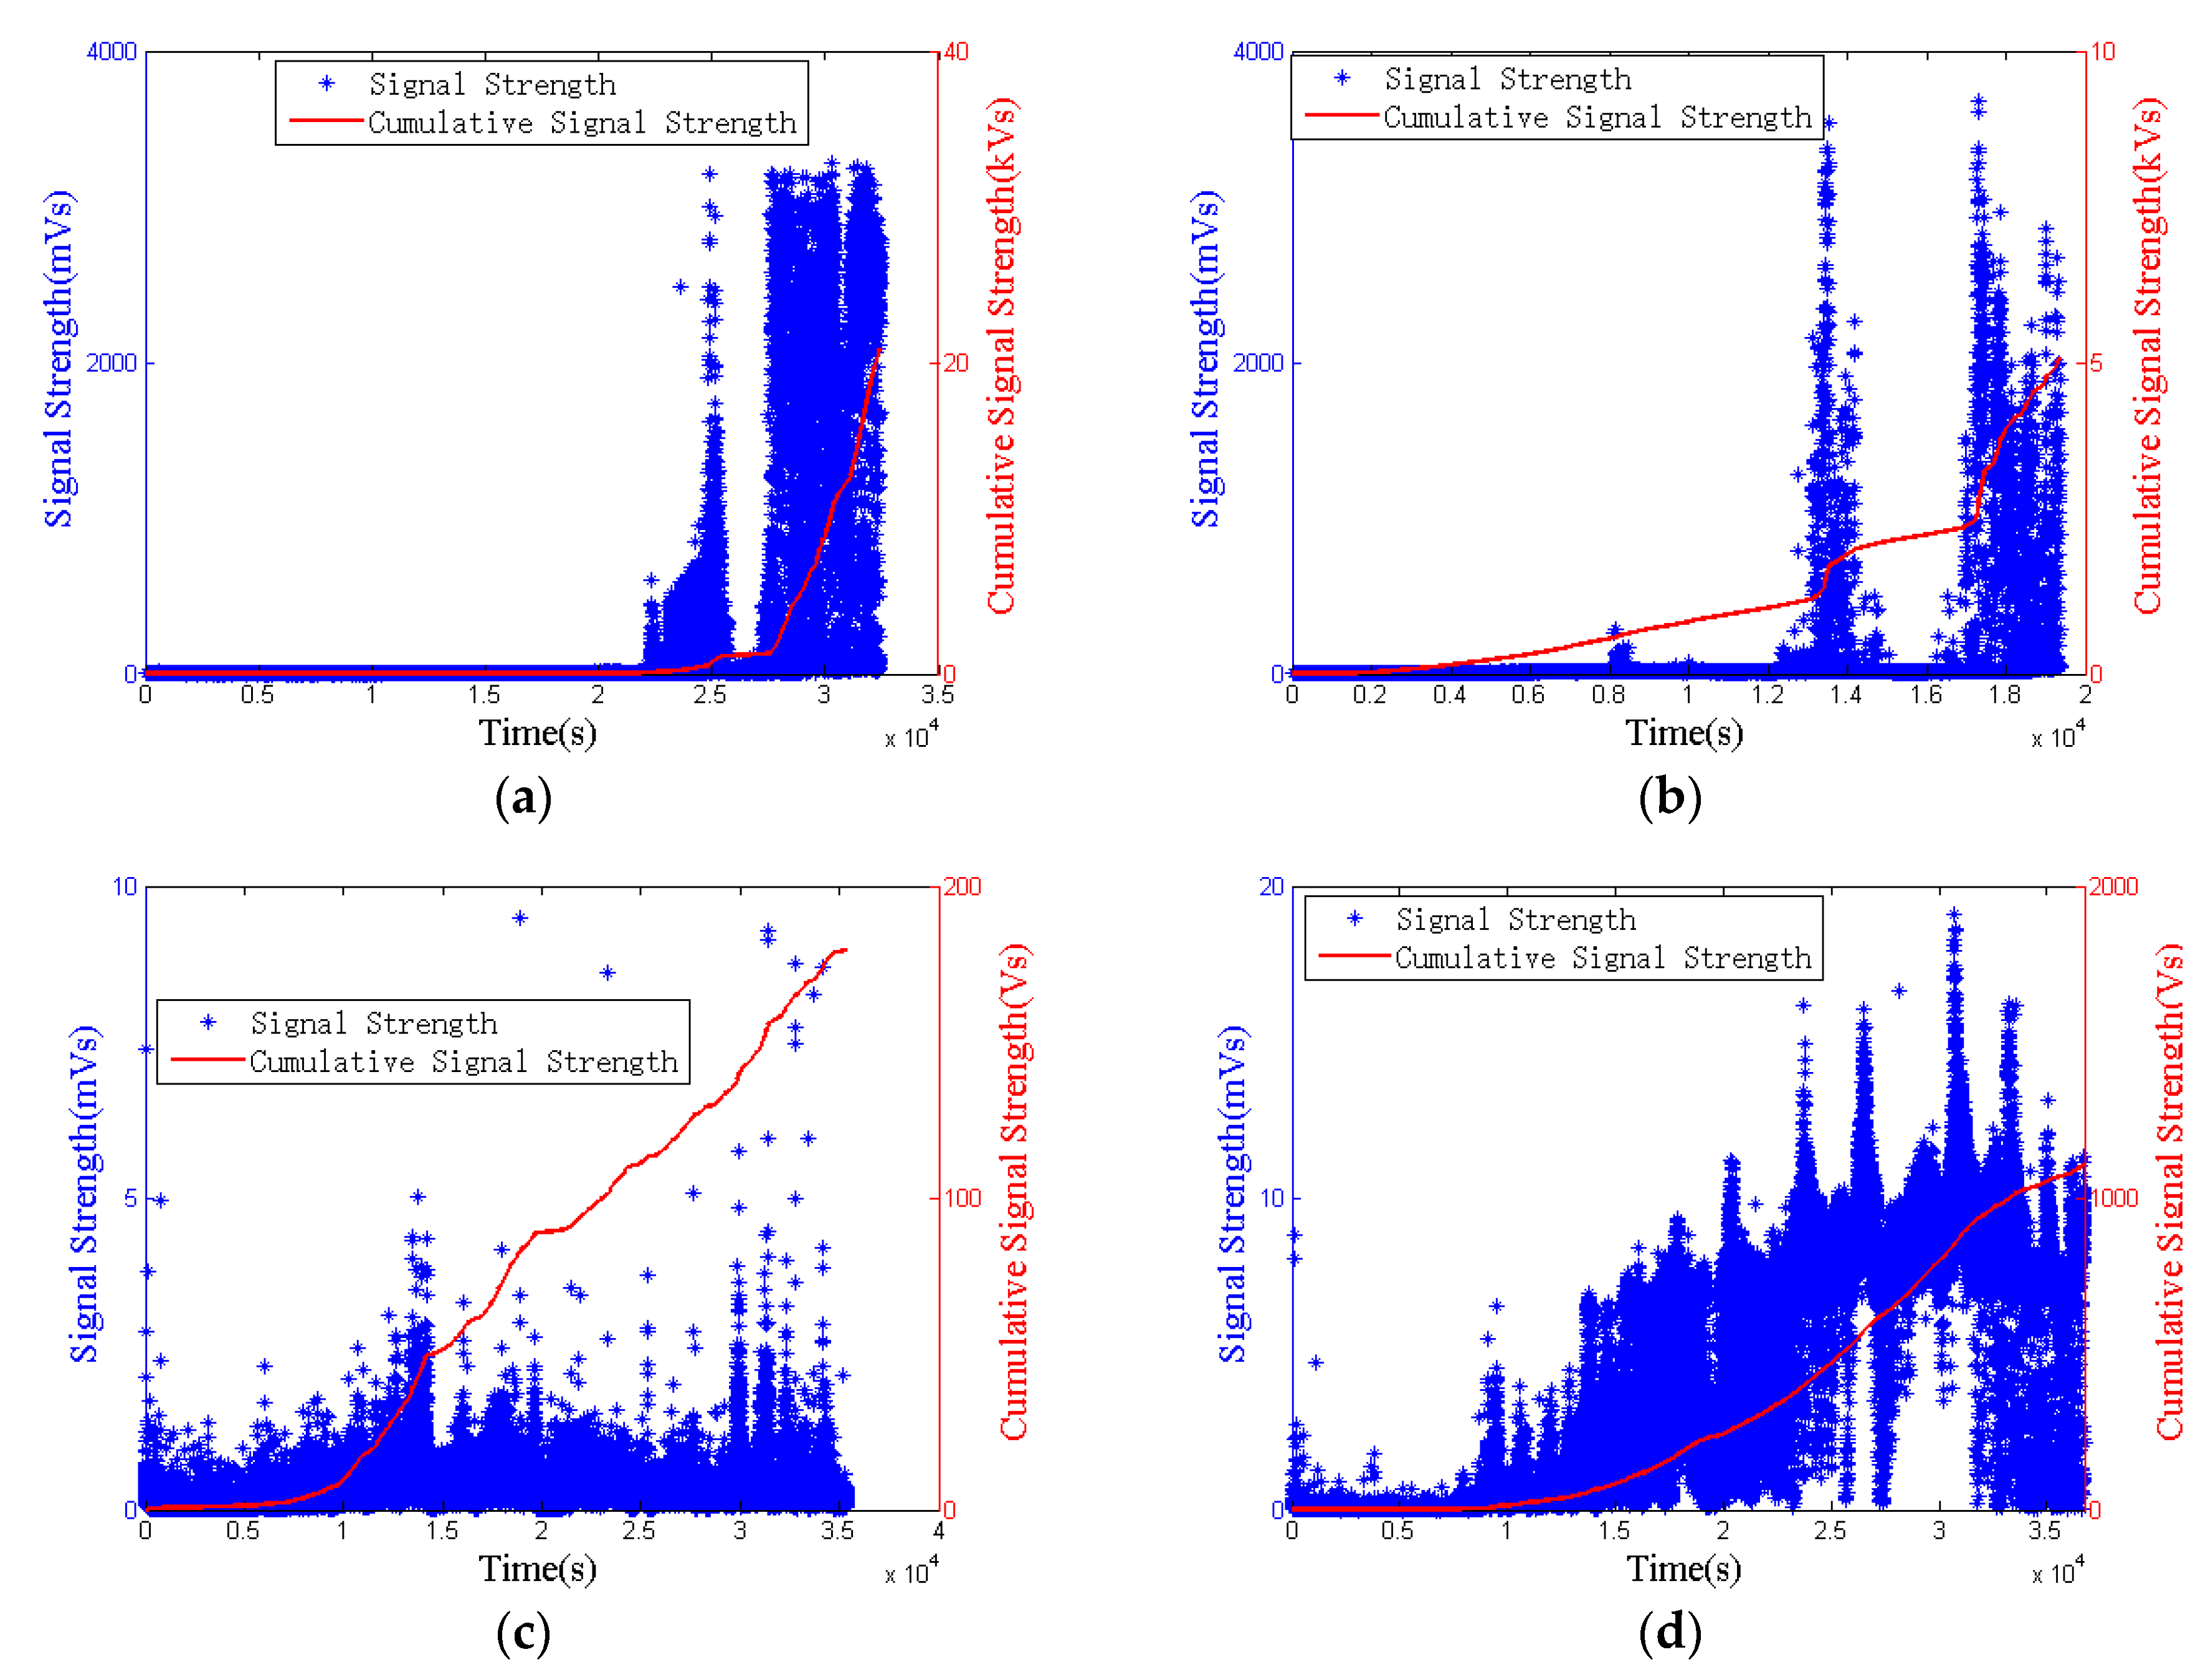
3.1. Results from AE and Analyses

In the AE technique, energy [112,113], ringing counts, and amplitude [114] are commonly used to study damage characteristics of materials. However, the measuring ranges of energy and amplitude are related to the gain of pre-amplifier. In this experiment, the gain of the 2/4/6 pre-amplifier was set to 40 dB, which rendered the upper limit value of energy and amplitude to be 65535 aj and 100 dB respectively, and these could not meet the requirements of the experiment by analyzing the previous experiments results. Another AE parameter—the signal strength [115], which is mathematically defined as the integral of the rectified voltage signal over the duration of the AE waveform packet, was not only more sensitive but also had larger measuring ranges. Its measuring range was from 3.05 pVs to 13.01 mVs, and the results of the experiment showed that the maximum signal strength was 3.674 × 10 9 pVs. Therefore, the measuring ranges of the signal strength met the requirements of the experiment, and it was used as an evaluation value.
Figure 6a–d shows the signal strength and the accumulative signal strength of the four specimens, respectively. In these figures, since the number of data from the low rotational speed pin connection wear was over 1,000,000, each blue dot represents the maximum signal strength in a period of 1 s. The red line represents the accumulative signal strength.
At the beginning of the experiments (the OA phase), the four specimens showed a similar behavior. The values of the signal strength and the rise rate of the accumulative signal strength were relative low (Figure 6). This is because that lubricant was sufficient and distributed evenly between pins and the connection components, which reduced direct contact between them. However, some small fluctuations occurred in this phase, and the reason will be explained in the discussion section. With the reduction of lubricant during the test period, the contact area between pins and connection components increased gradually, and slight wear occurred in the AB phase. In this phase, the value of the signal strength showed slight increase, and it reached the maximum in the third and the fourth specimens ( 9.475 mVs and 19.08 mVs respectively, as shown in Figure 6c,d). The rise rate of the accumulative signal strength was higher than that in the previous stage, which was observed in four specimens, as shown in Figure 6a–d. In the BC phase and the DE phase (as shown in Figure 6a,b), the value of the signal strength increased dramatically and reached maximum in the first and the second specimens ( 3.28 × 10 3 mVs and 3.674 × 10 3 mVs, respectively). Meanwhile, the rise rate of the accumulative signal strength also increased dramatically. Obviously, serious wear occurred between pins and connection components in this phase. Moreover, between the BC phase and the DE phase, the AE signals fell to the level of OA phase, as shown in Figure 6a,b, which means the running-in period of some contact areas ended; however, other contact areas might still be in the running-in period.
Among the four specimens, the first and the second specimens both experienced slight wear and then serious wear; however, the third and the fourth specimens only had slight wear based on the analysis of Figure 6. Meanwhile, the accumulative signal strength tendency in the third and the fourth specimens was similar to the initial stage tendency in the first and the second specimens. Therefore, it can be inferred that the third and the fourth specimens would also experience serious wear if extending the experiment time. Different surface roughness and uneven lubricant distribution on surface of pins may cause this phenomenon. Furthermore, different wear degrees may mean that there exist different wear forms in the wear process of low rotational speed pin connections, and this prediction was verified by micrographs of the surfaces of the pins.

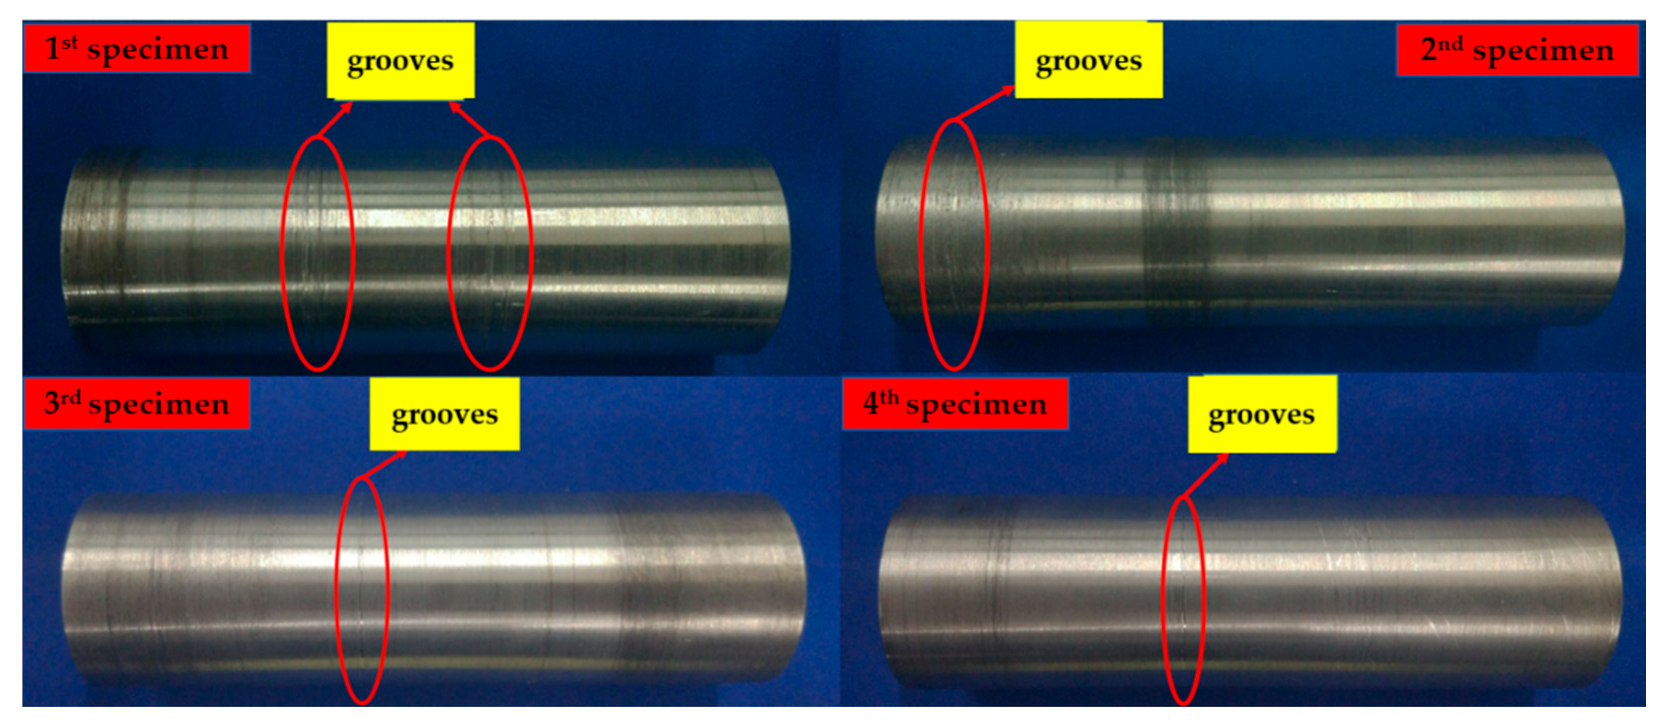
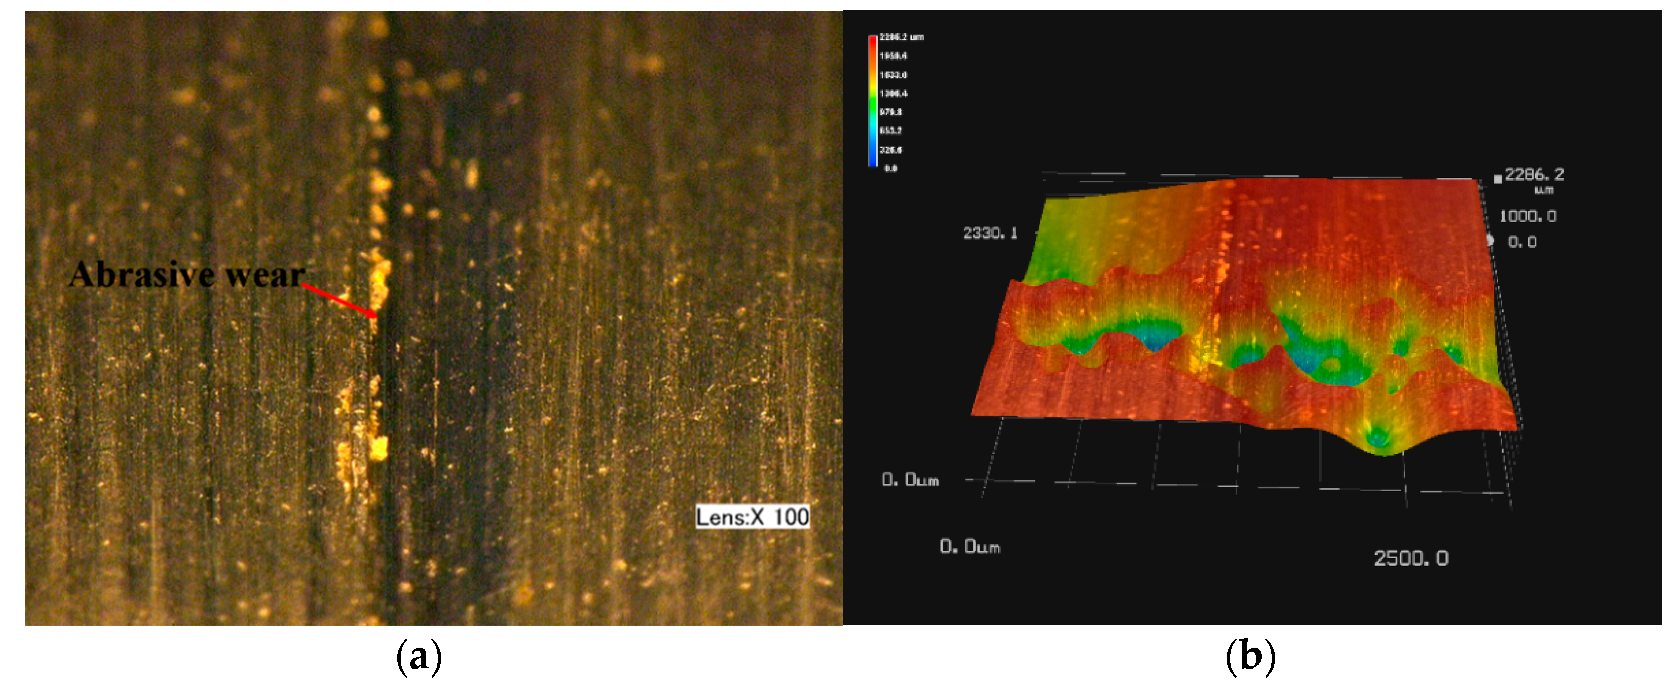
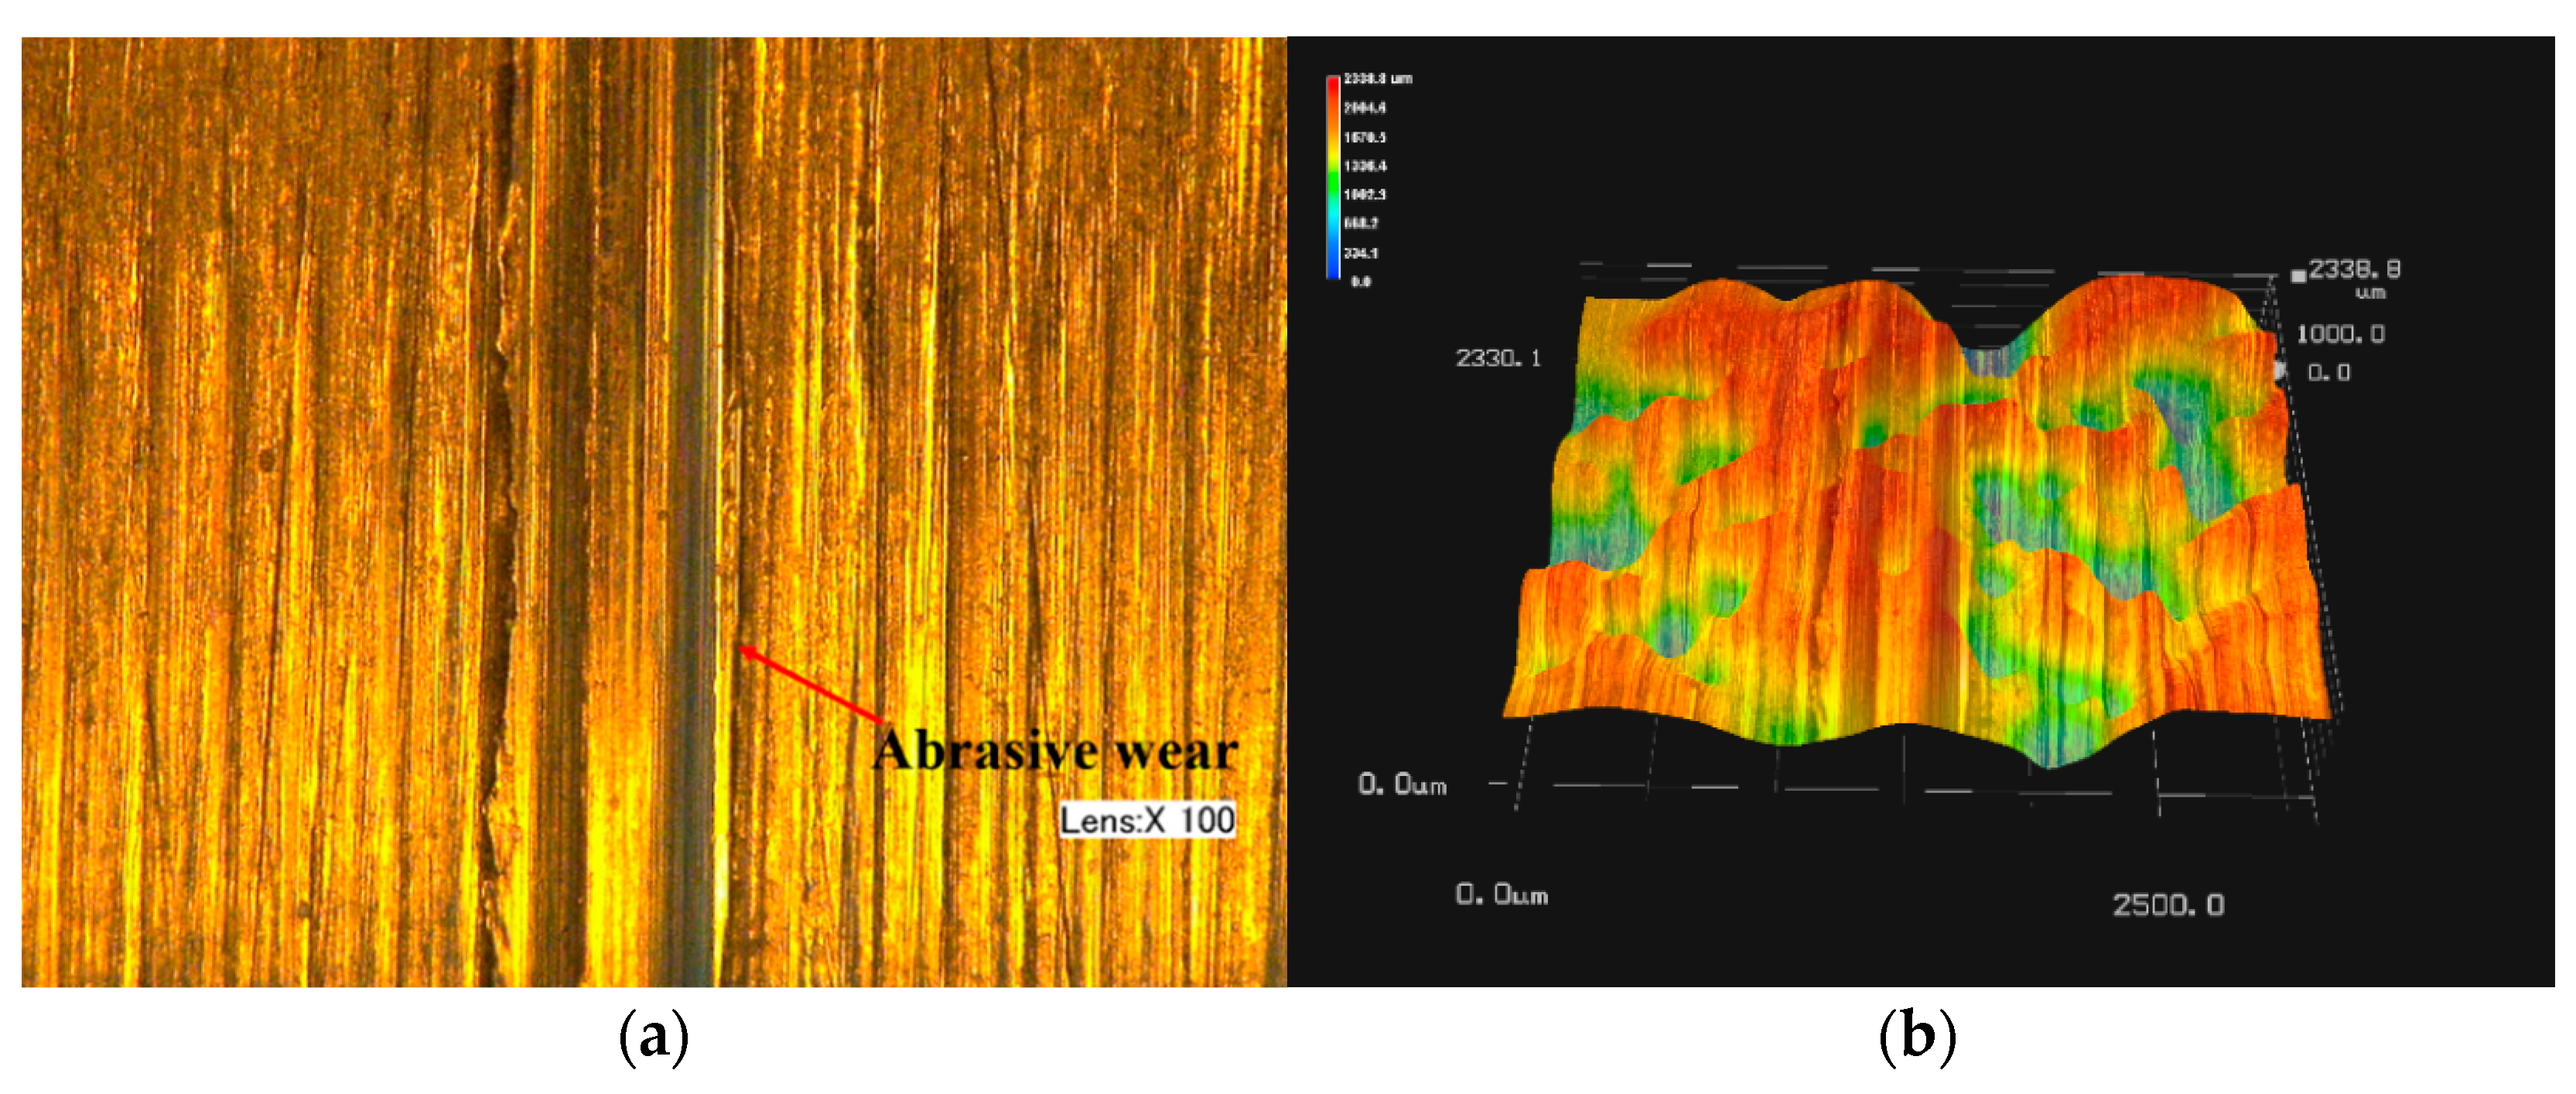
3.2. Analyses Based on Surface Micrographs

As shown in Figure 7, the surfaces of the four worn specimens had grooves that were visible to the naked eye. Detailed information is summarized in Table 2. There were similar distributions of grooves on the middle of the first, third and fourth specimens surface (Figure 7). However, the number of grooves was different. The first, the third, and the fourth specimens, respectively, had 12, three, and four obvious grooves. Considering the size and location of the U-shaped part and the circular part, it was found that wear occurred in the contact area between the circular part and the pin. In contrast, three obvious grooves were distributed on the end of the second specimen surface (Figure 7), which means that wear occurred in the contact area between the U-shaped part and the pin. Rough surface and uneven lubricant distribution may cause the phenomenon.
Figure 8, Figure 9, Figure 10 and Figure 11 are micrographs showing the wear track of the pin specimens. The different wear forms, including abrasive wear and adhesive wear, can be identified from these micrographs, which verify the prior prediction of different wear forms at the end of Section 3.1. There were some obvious grooves in the third and the fourth specimens (Figure 10 and Figure 11), and these grooves were along the rotation direction of pins, and they distributed on the surface of the pins. Obviously, the characteristics of these wear were similar to that of abrasive wear that has been described in the introduction; therefore the type of damage was abrasive wear, and the average depths of wear in the third and fourth specimens were 2060.7 µm and 2235.3 µm, respectively. On the other hand, the surface of the first and the second specimens (Figure 8 and Figure 9) were rough, and the trails of the transfer particles adhering to the surface could be seen, and different depth pits distributed here. The reason for this was that during the process of rotation, the surfaces of pins were repeatedly squeezed, and some debris would be peeled off from the surface. Meanwhile, grooves could also be found on the surfaces of the first and second specimens. That meant that the damage of the first and the second specimens were associated with not only abrasive wear but also with adhesive wear. Moreover, the average depths of wear in the first and second specimens were 2190.375 µm and 2137.925 µm, respectively. Comparing the average depths of wear in all four specimens, it was found that the average depth of wear was similar in this experiment.

4. Discussion

Influenced by various kinds of factors, such as loads, rotational speed, and lubrication condition, the wear process of low rotational speed pin connections is long and complicated. However, the wear forms of pin connections can be distinguished by an acoustic emission technique in this experiment. Comparing the results of the AE signals and the results of the micrographs, it can be found when only abrasive wear occurs on the surface of pins (such as on the third and the forth specimens), the signal strength value is low (their values are 9.475 mVs and 19.08 mVs respectively). By contrast, when adhesive wear occurs on the surface of pins (such as the first and the second specimens), the signal strength value is much larger than in abrasive wear (in the first and second specimens, their signal strength value is 3.28 × 10 3 mVs and 3.674 × 3 mVs respectively, which is around 190 times larger than that in the third and fourth specimens). This means the value of the signal strength of adhesive wear is much larger than abrasive wear, which is in agreement with the results of [102]. Therefore, adhesive wear is the main mode of wear in low rotational speed pin connections, and it can seriously affect the health condition of low rotational speed pin connections. Furthermore, analyzing the occurring time of abrasive wear and adhesive wear in this experiment, it is obvious that abrasive wear occurs in the early stage of the first and the second specimens, and in the whole process of the third and the fourth specimens, this can be demonstrated by the clear grooves on the surface of the four specimens in the micrographs, and the signal strength value, and the adhesive wear that occurs in the later period of the first and the second specimen. This means that abrasive wear may occur before adhesive wear in this experiment, and the reason for this should be further studied.
On the other hand, the value of the signal strength slightly increased before the appearance of adhesive wear. This is because at the beginning of experiment, particles of abrasive wear originate from the lubricant [116], and they are small in size, causing only slight wear. With the reduction of lubricant, the minute bumps on the surface of the specimens or the hard particles detached from the surface of specimens become the main reason for abrasive wear, which causes more serious wear. In conclusion, it can be seen that the signal strength is sensitive to the wear degree of the pin connections, and it can identify the adhesive wear and abrasive wear by comparing their signal strength value; hence, the signal strength is suitable for monitoring the wear degree of the pin connections.
Furthermore, the rotational speed may be different in actual engineering, which may cause different characteristics in AE signals and wear modes. However, when a severe wear occurs, the released energy will increase dramatically, which causes the strength of AE signals to increase dramatically. Therefore, the signal strength of the AE signals can still be used to detect the wear degree of different rotational speed pin connections. In addition, whether wear modes are influenced by the loading level and rotational speed shall be studied in the future.

5. Conclusions

The lack of literature in the monitoring of the wear of pin connections motivated this research work. In this paper, a new approach to monitor the wear process of pin connections using the AE technique was proposed. An apparatus to conduct accelerated low rotational speed pin connections wear test was designed and fabricated. The AE sensor was mounted on the test apparatus in a nondestructive way and was capable of real time monitoring. In addition, to verify the results of AE technique, a digital microscope was employed to observe the micrographs of the tested pins. The experimental results show that AE activity existed throughout the entire wear process, and it was the most prominent in the serious wear phase. The wear degree of the low rotational speed pin connections can be reflected qualitatively by the signal strength and the accumulative signal strength of the AE signals. Experiments also reveal that the main wear forms of the low rotational speed pin connections in this research include the abrasive wear and the adhesive wear. Detailed research found that different AE signal strengths from four specimens meant different wear forms, and the micrographs of the four specimens confirmed this result, and adhesive wear and abrasive wear both occurred on the surface of pins. Further analyses of the AE signals demonstrated that the adhesive wear was the main mode of wear of the low rotational speed pin connection. The signal strength of the adhesive wear was around 190 times larger than that of abrasive wear, although the wear depths of them are similar. In summary, the research demonstrates that the developed AE method, though simple to use, is an effective nondestructive method to monitor the wear degree of low rotational speed pin connections in real time. Further research will focus on the relationship between the roughness of the wear surface, and the AE signals. Moreover, for applying the results of this paper to actual engineering, the effect of different rotational speed and different types of steel on AE results also will be studied.

Author Contributions

Y.P., G.S., and L.H. conceived the original ideal; Y.P., C.L., and L.H. proposed the conceptual experimental design; J.W. and C.L. performed the detailed design; J.W. conducted the experiments and performed the data analyses under the guidance of G.S., C.L., and L.H.; J.W., C.L., and L.H. wrote the paper; G.S., C.L., and Y.P. proofread the paper.

Funding

This research was funded by the Major State Basic Development Program of China (973 Program, grant number 2015CB057704).

Acknowledgments

The authors thank the Collaborative Innovation Center of Major Machine Manufacturing in Liaoning for the support given during the development of this work.

Conflicts of Interest

The authors declare no conflict of interest.

References

  1. Liang, Y.; Li, D.; Kong, Q.; Song, G. Load monitoring of the pin-connected structure using time reversal technique and piezoceramic transducers-a feasibility study. IEEE Sens. J. 2016, 16, 7958–7966. [Google Scholar] [CrossRef]
  2. Yang, Y.; Divsholi, B.S.; Soh, C.K. A reusable pzt transducer for monitoring initial hydration and structural health of concrete. Sensors 2010, 10, 5193–5208. [Google Scholar] [CrossRef] [PubMed]
  3. Lynch, J.P.; Loh, K.J. A summary review of wireless sensors and sensor networks for structural health monitoring. Shock Vibr. Dig. 2006, 38, 91–128. [Google Scholar] [CrossRef]
  4. Song, G.; Wang, C.; Wang, B. Structural health monitoring (SHM) of civil structures. Appl. Sci. (Basel) 2017, 7, 1–502. [Google Scholar] [CrossRef]
  5. Andres Perez-Ramirez, C.; Yosimar Jaen-Cuellar, A.; Valtierra-Rodriguez, M.; Dominguez-Gonzalez, A.; Alfredo Osornio-Rios, R.; de Jesus Romero-Troncoso, R.; Pablo Amezquita-Sanchez, J. A two-step strategy for system identification of civil structures for structural health monitoring using wavelet transform and genetic algorithms. Appl. Sci. (Basel) 2017, 7, 111. [Google Scholar] [CrossRef]
  6. Na, W.S.; Baek, J. Impedance-based non-destructive testing method combined with unmanned aerial vehicle for structural health monitoring of civil infrastructures. Appl. Sci. (Basel) 2017, 7, 15. [Google Scholar] [CrossRef]
  7. Hu, D.; Guo, Y.; Chen, X.; Zhang, C. Cable force health monitoring of tongwamen bridge based on fiber bragg grating. Appl. Sci. (Basel) 2017, 7, 384. [Google Scholar] [CrossRef]
  8. Huo, L.; Wang, F.; Li, H.; Song, G. A fractal contact theory based model for bolted connection looseness monitoring using piezoceramic transducers. Smart Mater. Struct. 2017, 26, 104010. [Google Scholar] [CrossRef]
  9. Li, W.; Ho, S.C.M.; Patil, D.; Song, G. Acoustic emission monitoring and finite element analysis of debonding in fiber-reinforced polymer rebar reinforced concrete. Struct. Health Monit. 2017, 16, 674–681. [Google Scholar] [CrossRef]
  10. Li, W.; Xu, C.; Ho, S.C.M.; Wang, B.; Song, G. Monitoring concrete deterioration due to reinforcement corrosion by integrating acoustic emission and FBG strain measurements. Sensors (Basel) 2017, 17, 657. [Google Scholar] [CrossRef] [PubMed]
  11. Yang, X.Y.; Ishimaru, Y.; Iida, I.; Urakami, H. Application of modal analysis by transfer function to nondestructive testing of wood I: Determination of localized defects in wood by the shape of the flexural vibration wave. J. Wood Sci. 2001, 47, 304–310. [Google Scholar] [CrossRef]
  12. Yang, X.Y.; Amano, T.; Ishimaru, Y.; Iida, I. Application of modal analysis by transfer function to nondestructive testing of wood ii: Modulus of elasticity evaluation of sections of differing quality in a wooden beam by the curvature of the flexural vibration wave. J. Wood Sci. 2003, 49, 140–144. [Google Scholar] [CrossRef]
  13. Xu, J.; Hao, J.; Li, H.; Luo, M.; Guo, W.; Li, W. Experimental damage identification of a model reticulated shell. Appl. Sci. (Basel) 2017, 7, 362. [Google Scholar] [CrossRef]
  14. Yin, H.; Wang, T.; Yang, D.; Liu, S.; Shao, J.; Li, Y. A smart washer for bolt looseness monitoring based on piezoelectric active sensing method. Appl. Sci. (Basel) 2016, 6, 320. [Google Scholar] [CrossRef]
  15. Shao, J.; Wang, T.; Yin, H.; Yang, D.; Li, Y. Bolt looseness detection based on piezoelectric impedance frequency shift. Appl. Sci. (Basel) 2016, 6, 298. [Google Scholar] [CrossRef]
  16. Kong, Q.; Robert, R.H.; Silva, P.; Mo, Y.L. Cyclic crack monitoring of a reinforced concrete column under simulated pseudo-dynamic loading using piezoceramic-based smart aggregates. Appl. Sci. (Basel) 2016, 6, 341. [Google Scholar] [CrossRef]
  17. Jiang, T.; Kong, Q.; Patil, D.; Luo, Z.; Huo, L.; Song, G. Detection of debonding between fiber reinforced polymer bar and concrete structure using piezoceramic transducers and wavelet packet analysis. IEEE Sens. J. 2017, 17, 1992–1998. [Google Scholar] [CrossRef]
  18. Zhang, L.; Wang, C.; Song, G. Health status monitoring of cuplock scaffold joint connection based on wavelet packet analysis. Shock Vibr. 2015, 2015, 695845. [Google Scholar] [CrossRef]
  19. Jiang, T.; Kong, Q.; Wang, W.; Huo, L.; Song, G. Monitoring of grouting compactness in a post-tensioning tendon duct using piezoceramic transducers. Sensors 2016, 16, 1343. [Google Scholar] [CrossRef] [PubMed]
  20. Wang, F.; Huo, L.; Song, G. A piezoelectric active sensing method for quantitative monitoring of bolt loosening using energy dissipation caused by tangential damping based on the fractal contact theory. Smart Mater. Struct. 2017, 27, 015023. [Google Scholar] [CrossRef] [Green Version]
  21. Hu, X.; Zhu, H.; Wang, D. A study of concrete slab damage detection based on the electromechanical impedance method. Sensors 2014, 14, 19897–19909. [Google Scholar] [CrossRef] [PubMed]
  22. Annamdas, V.G.M.; Annamdas, K.K.K. Impedance based sensor technology to monitor stiffness of biological structures. In Advanced Environmental, Chemical, and Biological Sensing Technologies VII; VoDinh, T., Lieberman, R.A., Gauglitz, G., Eds.; SPIE: Bellingham, WA, USA, 2010; Volume 7673. [Google Scholar]
  23. Annamdas, K.K.K.; Annamdas, V.G.M. Piezo impedance sensors to monitor degradation of biological structure. In Advanced Environmental, Chemical, and Biological Sensing Technologies VII; VoDinh, T., Lieberman, R.A., Gauglitz, G., Eds.; SPIE: Bellingham, WA, USA, 2010; Volume 7673. [Google Scholar]
  24. Wang, D.; Wang, Q.; Wang, H.; Zhu, H. Experimental study on damage detection in timber specimens based on an electromechanical impedance technique and rmsd-based mahalanobis distance. Sensors (Basel) 2016, 16, 1765. [Google Scholar] [CrossRef] [PubMed]
  25. Wang, F.; Ho, S.C.M.; Huo, L.; Song, G. A Novel Fractal Contact-Electromechanical Impedance Model for Quantitative Monitoring of Bolted Joint Looseness. IEEE Access 2018, 6, 40212–40220. [Google Scholar] [CrossRef]
  26. Venugopal, V.P.; Wang, G. Modeling and analysis of lamb wave propagation in a beam under lead zirconate titanate actuation and sensing. J. Intell. Mater. Syst. Struct. 2015, 26, 1679–1698. [Google Scholar] [CrossRef]
  27. Zhao, X.; Li, W.; Song, G.; Zhu, Z.; Du, J. Scour monitoring system for subsea pipeline based on active thermometry: Numerical and experimental studies. Sensors 2013, 13, 1490–1509. [Google Scholar] [CrossRef] [PubMed]
  28. Zhao, X.; Li, W.; Zhou, L.; Song, G.-B.; Ba, Q.; Ou, J. Active thermometry based ds18b20 temperature sensor network for offshore pipeline scour monitoring using k-means clustering algorithm. Int. J. Distrib. Sens. Netw. 2013, 2013, 852090. [Google Scholar] [CrossRef]
  29. Xu, C.; Xie, J.; Zhang, W.; Kong, Q.; Chen, G.; Song, G. Experimental investigation on the detection of multiple surface cracks using vibrothermography with a low-power piezoceramic actuator. Sensors 2017, 17, 2705. [Google Scholar] [CrossRef] [PubMed]
  30. Parvasi, S.M.; Xu, C.; Kong, Q.; Song, G. Detection of multiple thin surface cracks using vibrothermography with low-power piezoceramic-based ultrasonic actuator-a numerical study with experimental verification. Smart Mater. Struct. 2016, 25, 055042. [Google Scholar] [CrossRef]
  31. Tang, J.; Soua, S.; Mares, C.; Gan, T.-H. A pattern recognition approach to acoustic emission data originating from fatigue of wind turbine blades. Sensors 2017, 17, 2507. [Google Scholar] [CrossRef] [PubMed]
  32. Tra, V.; Kim, J.; Khan, S.A.; Kim, J.-M. Bearing fault diagnosis under variable speed using convolutional neural networks and the stochastic diagonal levenberg-marquardt algorithm. Sensors (Basel) 2017, 17, 2834. [Google Scholar] [CrossRef] [PubMed]
  33. Nsugbe, E.; Ruiz-Carcel, C.; Starr, A.; Jennions, I. Estimation of fine and oversize particle ratio in a heterogeneous compound with acoustic emissions. Sensors (Basel) 2018, 18, 851. [Google Scholar] [CrossRef] [PubMed]
  34. De Agustina, B.; Maria Marin, M.; Teti, R.; Maria Rubio, E. Surface roughness evaluation based on acoustic emission signals in robot assisted polishing. Sensors 2014, 14, 21514–21522. [Google Scholar] [CrossRef] [PubMed]
  35. Chen, B.; Wang, Y.; Yan, Z. Use of acoustic emission and pattern recognition for crack detection of a large carbide anvil. Sensors (Basel) 2018, 18, 386. [Google Scholar] [CrossRef] [PubMed]
  36. Zelenyak, A.-M.; Hamstad, M.A.; Sause, M.G.R. Modeling of acoustic emission signal propagation in waveguides. Sensors 2015, 15, 11805–11822. [Google Scholar] [CrossRef] [PubMed]
  37. Sauerbrunn, C.M.; Kahirdeh, A.; Yun, H.; Modarres, M. Damage assessment using information entropy of individual acoustic emission waveforms during cyclic fatigue loading. Appl. Sci. (Basel) 2017, 7, 562. [Google Scholar] [CrossRef]
  38. Cho, C.W.; Lee, Y.Z. Wear-life evaluation of CRN-coated steels using acoustic emission signals. Surf. Coat. Technol. 2000, 127, 59–65. [Google Scholar] [CrossRef]
  39. Maya-Johnson, S.; Felipe Santa, J.; Toro, A. Dry and lubricated wear of rail steel under rolling contact fatigue—Wear mechanisms and crack growth. Wear 2017, 380–381, 240–250. [Google Scholar] [CrossRef]
  40. Ohtsu, M. The history and development of acoustic emission in concrete engineering. Mag. Concr. Res. 1996, 48, 321–330. [Google Scholar] [CrossRef]
  41. Aldahdooh, M.A.A.; Bunnori, N.M.; Johari, M.A.M. Damage evaluation of reinforced concrete beams with varying thickness using the acoustic emission technique. Constr. Build. Mater. 2013, 44, 812–821. [Google Scholar] [CrossRef]
  42. Invernizzi, S.; Lacidogna, G.; Carpinteri, A. Numerical models for the assessment of historical masonry structures and materials, monitored by acoustic emission. Appl. Sci. (Basel) 2016, 6, 102. [Google Scholar] [CrossRef]
  43. Sagasta, F.; Benavent-Climent, A.; Roldan, A.; Gallego, A. Correlation of plastic strain energy and acoustic emission energy in reinforced concrete structures. Appl. Sci. (Basel) 2016, 6, 84. [Google Scholar] [CrossRef]
  44. Shiroishi, J.; Li, Y.; Liang, S.; Kurfess, T.; Danyluk, S. Bearing condition diagnostics via vibration and acoustic emission measurements. Mech. Syst. Sig. Process. 1997, 11, 693–705. [Google Scholar] [CrossRef]
  45. Choudhury, A.; Tandon, N. Application of acoustic emission technique for the detection of defects in rolling element bearings. Tribol. Int. 2000, 33, 39–45. [Google Scholar] [CrossRef]
  46. Jun, S.; Wood, R.J.K.; Wang, L.; Care, I.; Powrie, H.E.G. Wear monitoring of bearing steel using electrostatic and acoustic emission techniques. Wear 2005, 259, 1482–1489. [Google Scholar]
  47. Gao, L.; Zai, F.; Su, S.; Wang, H.; Chen, P.; Liu, L. Study and application of acoustic emission testing in fault diagnosis of low-speed heavy-duty gears. Sensors 2011, 11, 599–611. [Google Scholar] [CrossRef] [PubMed]
  48. Qu, Y.; He, D.; Yoon, J.; Van Hecke, B.; Bechhoefer, E.; Zhu, J. Gearbox tooth cut fault diagnostics using acoustic emission and vibration sensors—A comparative study. Sensors 2014, 14, 1372–1393. [Google Scholar] [CrossRef] [PubMed]
  49. Svecko, R.; Kusic, D.; Kek, T.; Sarjas, A.; Hancic, A.; Grum, J. Acoustic emission detection of macro-cracks on engraving tool steel inserts during the injection molding cycle using pzt sensors. Sensors 2013, 13, 6365–6379. [Google Scholar] [CrossRef] [PubMed]
  50. Zou, S.; Yan, F.; Yang, G.; Sun, W. The identification of the deformation stage of a metal specimen based on acoustic emission data analysis. Sensors 2017, 17, 789. [Google Scholar] [CrossRef] [PubMed]
  51. Su, F.-Q.; Itakura, K.-I.; Deguchi, G.; Ohga, K. Monitoring of coal fracturing in underground coal gasification by acoustic emission techniques. Appl. Energy 2017, 189, 142–156. [Google Scholar] [CrossRef]
  52. Ge, M.; Mrugala, M.; Iannacchione, A.T. Microseismic monitoring at a limestone mine. Geotech. Geol. Eng. 2009, 27, 325–339. [Google Scholar] [CrossRef]
  53. Aggelis, D.G.; Strantza, M.; Louis, O.; Boulpaep, F.; Polyzos, D.; van Hemelrijck, D. Fracture of human femur tissue monitored by acoustic emission sensors. Sensors 2015, 15, 5803–5819. [Google Scholar] [CrossRef] [PubMed]
  54. Shepherd, S.V. Adapting acoustic monitoring technology to detect bulk solids flow. Sensors 2001, 18, 56–64. [Google Scholar]
  55. Yang, Z.; Jin, L.; Yan, Y.; Mei, Y. Filament breakage monitoring in fused deposition modeling using acoustic emission technique. Sensors (Basel) 2018, 18, 749. [Google Scholar] [CrossRef] [PubMed]
  56. Yao, Y.; Ju, X.; Lu, J.; Men, B. Acoustic emission and echo signal compensation techniques applied to an ultrasonic logging-while-drilling caliper. Sensors 2017, 17, 1351. [Google Scholar]
  57. Zhang, T.; Pang, F.; Liu, H.; Cheng, J.; Lv, L.; Zhang, X.; Chen, N.; Wang, T. A fiber-optic sensor for acoustic emission detection in a high voltage cable system. Sensors 2016, 16, 2026. [Google Scholar] [CrossRef] [PubMed]
  58. Absi Alfaro, S.C.; Cayo, E.H. Sensoring fusion data from the optic and acoustic emissions of electric arcs in the gmaw-s process for welding quality assessment. Sensors 2012, 12, 6953–6966. [Google Scholar] [CrossRef] [PubMed] [Green Version]
  59. Martini, A.; Troncossi, M.; Rivola, A. Leak detection in water-filled small-diameter polyethylene pipes by means of acoustic emission measurements. Appl. Sci. (Basel) 2017, 7, 2. [Google Scholar] [CrossRef]
  60. Liu, P.F.; Chu, J.K.; Liu, Y.L.; Zheng, J.Y. A study on the failure mechanisms of carbon fiber/epoxy composite laminates using acoustic emission. Mater. Des. 2012, 37, 228–235. [Google Scholar] [CrossRef]
  61. De Santis, S.; Tomor, A.K. Laboratory and field studies on the use of acoustic emission for masonry bridges. NDT E Int. 2013, 55, 64–74. [Google Scholar] [CrossRef]
  62. Geng, J.; Sun, Q.; Zhang, Y.; Cao, L.; Zhang, W. Studying the dynamic damage failure of concrete based on acoustic emission. Constr. Build. Mater. 2017, 149, 9–16. [Google Scholar] [CrossRef]
  63. Aggelis, D.G. Classification of cracking mode in concrete by acoustic emission parameters. Mech. Res. Commun. 2011, 38, 153–157. [Google Scholar] [CrossRef]
  64. Hearn, S.W.; Shield, C.K. Acoustic emission monitoring as a nondestructive testing technique in reinforced concrete. ACI Mater. J. 1997, 94, 510–519. [Google Scholar]
  65. Ouyang, C.S.; Landis, E.; Shah, S.P. Damage assessment in concrete using quantitative acoustic-emission. J. Eng. Mech. 1991, 117, 2681–2698. [Google Scholar] [CrossRef]
  66. Zaki, A.; Chai, H.K.; Aggelis, D.G.; Alver, N. Non-destructive evaluation for corrosion monitoring in concrete: A review and capability of acoustic emission technique. Sensors 2015, 15, 19069–19101. [Google Scholar] [CrossRef] [PubMed]
  67. Li, D.; Cao, H. Monitoring of temperature fatigue failure mechanism for polyvinyl alcohol fiber concrete using acoustic emission sensors. Sensors 2012, 12, 9502–9513. [Google Scholar] [CrossRef] [PubMed]
  68. Li, D.; Ou, J.; Lan, C.; Li, H. Monitoring and failure analysis of corroded bridge cables under fatigue loading using acoustic emission sensors. Sensors 2012, 12, 3901–3915. [Google Scholar] [CrossRef] [PubMed]
  69. Prem, P.R.; Murthy, A.R. Acoustic emission monitoring of reinforced concrete beams subjected to four-point-bending. Appl. Acoust. 2017, 117, 28–38. [Google Scholar] [CrossRef]
  70. ElBatanouny, M.K.; Ziehl, P.H.; Larosche, A.; Mangual, J.; Matta, F.; Nanni, A. Acoustic emission monitoring for assessment of prestressed concrete beams. Constr. Build. Mater. 2014, 58, 46–53. [Google Scholar] [CrossRef]
  71. Hay, D.R.; Cavaco, J.A.; Mustafa, V. Monitoring the civil infrastructure with acoustic emission: Bridge case studies. J. Acoust. Emission 2009, 27, 1–10. [Google Scholar]
  72. Huang, W.; Zhang, W.; Li, F. Acoustic emission source location using a distributed feedback fiber laser rosette. Sensors 2013, 13, 14041–14054. [Google Scholar] [CrossRef] [PubMed]
  73. Cui, X.; Yan, Y.; Guo, M.; Han, X.; Hu, Y. Localization of CO2 leakage from a circular hole on a flat-surface structure using a circular acoustic emission sensor array. Sensors 2016, 16, 1951. [Google Scholar] [CrossRef] [PubMed]
  74. Van Dijck, G.; Van Hulle, M.M. Information theory filters for wavelet packet coefficient selection with application to corrosion type identification from acoustic emission signals. Sensors 2011, 11, 5695–5715. [Google Scholar] [CrossRef] [PubMed]
  75. Yan, G.; Zhou, L. An optimal image-based method for identification of acoustic emission (ae) sources in plate-like structures using a lead zirconium titanate (pzt) sensor array. Sensors 2018, 18, 631. [Google Scholar] [CrossRef] [PubMed]
  76. Zhang, J.; Huang, Y.; Zheng, Y. A feasibility study on timber damage detection using piezoceramic-transducer-enabled active sensing. Sensors (Basel) 2018, 18, 1563. [Google Scholar] [CrossRef] [PubMed]
  77. Fan, S.; Zhao, S.; Qi, B.; Kong, Q. Damage evaluation of concrete column under impact load using a piezoelectric-based emi technique. Sensors (Basel) 2018, 18, 1591. [Google Scholar] [CrossRef] [PubMed]
  78. Gomez, M.J.; Corral, E.; Castejon, C.; Garcia-Prada, J.C. Effective crack detection in railway axles using vibration signals and wpt energy. Sensors (Basel) 2018, 18, 1603. [Google Scholar] [CrossRef] [PubMed]
  79. Lu, W.; Teng, J.; Li, C.; Cui, Y. Reconstruction to sensor measurements based on a correlation model of monitoring data. Appl. Sci. (Basel) 2017, 7, 243. [Google Scholar] [CrossRef]
  80. Jeon, H.; Lim, G.; Cho, S.J. IEEE Development of stretchable strain sensor using elastic fibrous membrane coated with conducting polymer. In Proceedings of the 2015 IEEE Sensors, Busan, Korea, 1–4 November 2015; pp. 999–1000. [Google Scholar]
  81. Du, G.; Li, Z.; Song, G. A pvdf-based sensor for internal stress monitoring of a concrete-filled steel tubular (CFST) column subject to impact loads. Sensors 2018, 18, 1682. [Google Scholar] [CrossRef] [PubMed]
  82. Ferdinand, M. Building an acoustic emission data analysis program. Sensors 1999, 16, 66. [Google Scholar]
  83. Strantza, M.; Aggelis, D.G.; de Baere, D.; Guillaume, P.; van Hemelrijck, D. Evaluation of shm system produced by additive manufacturing via acoustic emission and other ndt methods. Sensors 2015, 15, 26709–26725. [Google Scholar] [CrossRef] [PubMed]
  84. Heo, G.; Son, B.; Kim, C.; Jeon, S.; Jeon, J. Development of a wireless unified-maintenance system for the structural health monitoring of civil structures. Sensors 2018, 18, 1485. [Google Scholar] [CrossRef] [PubMed]
  85. Yang, D.; Guo, J.; Liu, C.; Liu, Q.; Zheng, R. A direct bicarbonate detection method based on a near-concentric cavity-enhanced raman spectroscopy system. Sensors 2017, 17, 2784. [Google Scholar] [CrossRef] [PubMed]
  86. Zhou, X.; Ji, X.; Wang, B.; Cheng, Y.; Ma, Z.; Choi, F.; Helmuth, B.; Xu, W. Pido: Predictive delay optimization for intertidal wireless sensor networks. Sensors 2018, 18, 1464. [Google Scholar] [CrossRef] [PubMed]
  87. De Marziani, C.; Urena, J.; Hernandez, A.; Mazo, M.; Garcia, J.J.; Jimenez, A.; Perez Rubio, M.d.C.; Alvarez, F.; Manuel Villadangos, J. Acoustic sensor network for relative positioning of nodes. Sensors 2009, 9, 8490–8507. [Google Scholar] [CrossRef] [PubMed]
  88. Fengming, Y.; Okabe, Y. Fiber-optic sensor-based remote acoustic emission measurement in a 1000 degc environment. Sensors 2017, 17, 2908. [Google Scholar] [CrossRef] [PubMed]
  89. Schmitt, M.; Olfert, S.; Rautenberg, J.; Lindner, G.; Henning, B.; Reindl, L.M. Multi reflection of lamb wave emission in an acoustic waveguide sensor. Sensors 2013, 13, 2777–2785. [Google Scholar] [CrossRef] [PubMed]
  90. Wei, P.; Han, X.; Xia, D.; Liu, T.; Lang, H. Novel fiber-optic ring acoustic emission sensor. Sensors 2018, 18, 215. [Google Scholar]
  91. Andrade Maia, L.H.; Abrao, A.M.; Vasconcelos, W.L.; Sales, W.F.; Machado, A.R. A new approach for detection of wear mechanisms and determination of tool life in turning using acoustic emission. Tribol. Int. 2015, 92, 519–532. [Google Scholar] [CrossRef]
  92. Mei, Y.; Yu, Z.; Yang, Z. Experimental investigation of correlation between attrition wear and features of acoustic emission signals in single-grit grinding. Int. J. Adv. Manuf. Technol. 2017, 93, 2275–2287. [Google Scholar]
  93. Kalogiannakis, G.; Quintelier, J.; De Baets, P.; Degrieck, J.; Van Hernelrijck, D. Identification of wear mechanisms of glass/polyester composites by means of acoustic emission. Wear 2008, 264, 235–244. [Google Scholar] [CrossRef]
  94. Hase, A.; Wada, M.; Mishina, H. Scanning electron microscope observation study for identification of wear mechanism using acoustic emission technique. Tribol. Int. 2014, 72, 51–57. [Google Scholar] [CrossRef]
  95. Karim, Z.; Nuawi, M.Z.; Ghani, J.A.; Ghazali, M.J.; Abdullah, S.; Mansor, N.I.I. Sliding wear evaluation of aluminum alloy (7075-T6) on hardened steel (AISI4340) via non-contact technique by I-kaz (tm) multi-level analysis. Wear 2015, 334, 99–104. [Google Scholar] [CrossRef]
  96. Rastegaev, I.A.; Merson, D.L.; Danyuk, A.V.; Afanasyev, M.A.; Vinogradov, A. Using acoustic emission signal categorization for reconstruction of wear development timeline in tribosystems: Case studies and application examples. Wear 2018, 410, 83–92. [Google Scholar] [CrossRef]
  97. Bhuiyan, M.S.H.; Choudhury, I.A.; Dahari, M.; Nukman, Y.; Dawal, S.Z. Application of acoustic emission sensor to investigate the frequency of tool wear and plastic deformation in tool condition monitoring. Measurement 2016, 92, 208–217. [Google Scholar] [CrossRef]
  98. Korchuganov, M.A.; Filippov, A.V.; Tarasov, S.Y.; Podgornyh, O.A.; Shamarin, N.N.; Filippova, E.O. An experimental modeling and acoustic emission monitoring of abrasive wear in a steel/diabase pair. In Advanced Materials with Hierarchical Structure for New Technologies and Reliable Structures, AIP Conference Proceedings 1783; Panin, V.E., Psakhie, S.G., Fomin, V.M., Eds.; AIP: Tomsk, Russia, September 2016. [Google Scholar]
  99. Hase, A.; Wada, M.; Mishina, H. Correlation of abrasive wear phenomenon and ae signals. J. Jpn. Soc. Tribol. 2006, 51, 752–759. [Google Scholar]
  100. Hase, A.; Wada, M.; Hirota, H. Correlation of material transfer phenomenon and AE signals in adhesive wear. J. Jpn. Soc. Tribol. 2005, 50, 808–815. [Google Scholar]
  101. Ji, X.; Ji, C.; Cheng, J.; Shan, Y.; Tian, S. Erosive wear resistance evaluation with the hardness after strain-hardening and its application for a high-entropy alloy. Wear 2018, 398, 178–182. [Google Scholar] [CrossRef]
  102. Shabalinskaya, L.A.; Golovanov, V.V.; Bubnova, E.S.; Melnikov, A.O.; Grigorev, A.V.; Prodanov, E.S. Tribodiagnostics of aviation reduction gears according to the stages of the surface fatigue wear for its units. J. Frict. Wear 2017, 38, 297–301. [Google Scholar] [CrossRef]
  103. Nouri, M.; Li, D.Y. Maximizing the benefit of aluminizing to az31 alloy by surface nanocrystallization for elevated resistance to wear and corrosive wear. Tribol. Int. 2017, 111, 211–219. [Google Scholar] [CrossRef]
  104. Hase, A.; Mishina, H.; Wada, M. Correlation between features of acoustic emission signals and mechanical wear mechanisms. Wear 2012, 292, 144–150. [Google Scholar] [CrossRef]
  105. Hisakado, T.; Warashina, T. Relationship between friction and wear properties and acoustic emission characteristics: Iron pin on hardened bearing steel disk. Wear 1998, 216, 1–7. [Google Scholar] [CrossRef]
  106. Wang, T.; Liu, S.; Shao, J.; Li, Y. Health monitoring of bolted joints using the time reversal method and piezoelectric transducers. Smart Mater. Struct. 2016, 25, 025001. [Google Scholar]
  107. Wang, T.; Song, G.; Wang, Z.; Li, Y. Proof-of-concept study of monitoring bolt connection status using a piezoelectric based active sensing method. Smart Mater. Struct. 2013, 22, 087001. [Google Scholar] [CrossRef]
  108. Wang, H.S.; Hung, C.L.; Chang, F.K. Bearing failure of bolted composite joints. Part I: Experimental characterization. J. Compos. Mater. 1996, 30, 1284–1313. [Google Scholar] [CrossRef]
  109. Hung, C.L.; Chang, F.K. Bearing failure of bolted composite joints. Part II: Model and verification. J. Compos. Mater. 1996, 30, 1359–1400. [Google Scholar] [CrossRef]
  110. Liang, Y.; Li, D.; Parvasi, S.M.; Song, G. Load monitoring of pin-connected structures using piezoelectric impedance measurement. Smart Mater. Struct. 2016, 25, 105011. [Google Scholar] [CrossRef]
  111. Huo, L.; Chen, D.; Kong, Q.; Li, H.; Song, G. Smart washer—A piezoceramic-based transducer to monitor looseness of bolted connection. Smart Mater. Struct. 2017, 26, 025033. [Google Scholar] [CrossRef]
  112. Colombo, S.; Forde, M.C.; Main, I.G.; Halliday, J.; Shigeishi, M. AE energy analysis on concrete bridge beams. Mater. Struct. 2005, 38, 851–856. [Google Scholar] [CrossRef]
  113. Sagasta, F.; Zitto, M.E.; Piotrkowski, R.; Benavent-Climent, A.; Suarez, E.; Gallego, A. Acoustic emission energy b-value for local damage evaluation in reinforced concrete structures subjected to seismic loadings. Mech. Syst. Sig. Process. 2018, 102, 262–277. [Google Scholar] [CrossRef]
  114. Ostby, E.; Thaulow, C.; Akselsen, O.M. Quantitative relation between acoustic emission signal amplitude and arrested cleavage microcrack size. Int. J. Fract. 2012, 177, 73–80. [Google Scholar] [CrossRef]
  115. Ridge, A.R.; Ziehl, P.H. Evaluation of strengthened reinforced concrete beams: Cyclic load test and acoustic emission methods. Aci Struct. J. 2006, 103, 832–841. [Google Scholar]
  116. Sasada, T.; Oike, M.; Emori, N. The effect of abrasive grain-size on the transition between abrasive and adhesive wear. Wear 1984, 97, 291–302. [Google Scholar] [CrossRef]
Figure 1. Dimension of pin (mm): (a) Side view; (b) front view.
Applsci 08 01775 g001
Figure 2. Schematic of the experimental setup.
Applsci 08 01775 g002
Figure 3. Photos of the experimental apparatus.
Applsci 08 01775 g003
Figure 4. A diagram to illustrate the instrument connection for acoustic emission.
Applsci 08 01775 g004
Figure 5. VHX-600E digital microscope: (a) Close up of the VHX-600E digital microscope; (b) The V-shape support.
Applsci 08 01775 g005
Figure 6. The signal strength and the accumulative signal strength: (a) The first specimen; (b) the second specimen; (c) the third specimen; (d) the fourth specimen.
Applsci 08 01775 g006
Figure 7. Worn surfaces of specimens.
Applsci 08 01775 g007
Figure 8. Micrographs of the first specimen: (a) 2D micrographs; (b) 3D micrographs.
Applsci 08 01775 g008
Figure 9. Micrographs of the second specimen: (a) 2D micrographs; (b) 3D micrographs.
Applsci 08 01775 g009
Figure 10. Micrographs of the third specimen: (a) 2D micrographs; (b) 3D micrographs.
Applsci 08 01775 g010
Figure 11. Micrographs of the fourth specimen: (a) 2D micrographs; (b) 3D micrographs.
Applsci 08 01775 g011
Table 1. The content of trace elements in specimens.
ElementsCMnPSSiCrNi
Proportion≤0.07≤2.00≤0.035≤0.030≤1.0017.00~19.008.00~11.00
Table 2. Grooves on the surface of pins.
Specimens No.Grooves Location (Distance from the End Connected to Motor) (mm)Numbers of Obvious GroovesAverage Depth of Wear (µm)
140.1–47.7 and 65.7–72.2122190.375
211.132137.9
340.35 and 66.6–70.1542060.7
441.632235.3

