Article

A Low Cost Wireless Acoustic Sensor for Ambient Assisted Living Systems

1
Telematic Engineering Department, University of Las Palmas de Gran Canaria, Campus Universitario de Tafira, 35017 Las Palmas de Gran Canaria, Spain
2
Institute for Technological Development and Innovation in Communications, University of Las Palmas de Gran Canaria, Campus Universitario de Tafira, 35017 Las Palmas de Gran Canaria, Spain
3
Signal and Communications Department, University of Las Palmas de Gran Canaria, Campus Universitario de Tafira, 35017 Las Palmas de Gran Canaria, Spain
*
Author to whom correspondence should be addressed.
These authors contributed equally to this work.
Appl. Sci. 2017, 7(9), 877; https://doi.org/10.3390/app7090877
Submission received: 31 July 2017 / Revised: 24 August 2017 / Accepted: 25 August 2017 / Published: 27 August 2017
(This article belongs to the Special Issue Sound and Music Computing)

Abstract

:
Ambient Assisted Living (AAL) has become an attractive research topic due to growing interest in remote monitoring of older people. Development in sensor technologies and advances in wireless communications allows to remotely offer smart assistance and monitor those people at their own home, increasing their quality of life. In this context, Wireless Acoustic Sensor Networks (WASN) provide a suitable way for implementing AAL systems which can be used to infer hazardous situations via environmental sounds identification. Nevertheless, satisfying sensor solutions have not been found with the considerations of both low cost and high performance. In this paper, we report the design and implementation of a wireless acoustic sensor to be located at the edge of a WASN for recording and processing environmental sounds which can be applied to AAL systems for personal healthcare because it has the following significant advantages: low cost, small size, audio sampling and computation capabilities for audio processing. The proposed wireless acoustic sensor is able to record audio samples at least to 10 kHz sampling frequency and 12-bit resolution. Also, it is capable of doing audio signal processing without compromising the sample rate and the energy consumption by using a new microcontroller released at the last quarter of 2016. The proposed low cost wireless acoustic sensor has been verified using four randomness tests for doing statistical analysis and a classification system of the recorded sounds based on audio fingerprints.

1. Introduction

As one of the fastest growing technologies in the emerging Internet of Things (IoT) environment, low power wireless sensor networks are expected to realize IoT applications and to provide connectivity for remote smart objects. The basic concept of IoT is that various smart objects can be automatically linked into a network for interacting with humans through perception and networking technologies [1]. Smart objects in the IoT have the ability to send information through the Internet to provide the interaction among multiple things and people. IoT is opening tremendous opportunities for novel applications that promise to improve the quality of people life.
The development of IoT technologies can be applied to a huge variety of applications, such as intelligent power grid [2], healthcare [3], environmental monitoring [4], localization [5], etc. In an AAL context where assisted living technologies are based on ambient intelligence, smart objects need to use wireless communications because of the requirements of supporting mobile applications and remote monitoring of people. AAL can be used for detecting and preventing distress situations, improving wellness and health conditions of older adults. AAL technologies can also provide more safety for the elderly, using mobile emergency response systems, detecting domestic accidents, monitoring activities of daily living, issuing reminders, as well as helping with mobility and automation, and, overall, improving their quality of life [6,7]. In fact, according [8], AAL should be understood as a system for extending the time people can live in their preferred environment by increasing their autonomy, self-confidence and mobility; supporting the preservation of health and functional capabilities of the elderly, promoting a better and healthier lifestyle for individuals at risk; enhancing security, preventing social isolation and supporting the preservation of the multifunctional network around the individual; supporting carers, families and care organizations; and increasing the efficiency and productivity of used resources in the ageing societies.
A survey of sensors in assisted living of older people is presented in [9], such as passive infrared (PIR) and vibration sensors, accelerometers, cameras, depth sensors, and microphones. These systems should satisfy some requirements as: low-cost, high accuracy, user acceptance and privacy. These can be connected to form a network for an intelligent home designed for elderly people. The data and decision results that the sensors produce can be processed and fused over a cloud or a fog. Authors expect that the IoT will lead to remote health monitoring and emergency notification AAL systems that will operate autonomously, without requiring user intervention. In this context, audio recognition is also a promising way to ensure more safety by contributing to detection of distress situations because of the interaction of each person with her environment may be identified. In fact, in [10] detection of distress situations and monitoring of activity and health are described as two challenges to address in AAL environments. On the one hand, the identification the sounds of everyday life can be particularly useful for detecting distress situations in which the person might be. For instance, the detection of a fall can be used to call an emergency number. On the other hand, audio processing can be quite useful for the monitoring of the person’s activity and the assessment of some decline. For instance, an application might consist of recognising health related symptoms such as coughing, scraping throats and sniffles. Hence, the development of WASN with low power consumption and low cost are suitable for implementing AAL systems. In this research, we are focused in the development of a low cost wireless acoustic sensor with audio processing capabilities and network connectivity to be located at the edge of a WASN.
The WASN have been developed under the paradigms of both the Smart City and the IoT. In recent years, there has been a rapid evolution of WASN, and many works have been developed. To date, several authors have designed and deployed WASN for different purposes such as noise monitoring [11] or sound identification as road traffic, horns, and people [12]. For instance, in [13] the production and analysis of a real-life environmental audio database in two urban and suburban scenarios corresponding to the pilot areas of the DYNAMAP project was presented. The WASN of the DYNAMAP project is based on low cost acoustic sensor but it is connected to digital recorder for data saving. Hence, unlike our research, audio samples cannot be sent to a central server using wireless communications, and neither audio processing can not be carried out at node. Audio recordings have been categorized as road traffic noise, background city noise, and anomalous noise events. However, it was carried out offline with Audicity and Matlab software [14].
In [15], a distributed noise measurement system based on IoT technology was developed. The sensor node is based on a Raspberry Pi with an electret omnidirectional microphone and a sound card in order to record the audio. The data from WASN was interpolated for obtaining a spatial noise level in a small-sized city. However, the system was designed to measure, represent and predict urban noise levels, and not for audio processing and classification.
In [16], the design of low cost wireless sensor node for environmental noise measurement is described. The sensor node platform is built on ATmega128L with 4 kB RAM, and its internal 10-bit ADC can operate a peak sampling rate of 33 kHz. However, according the microcontroller specifications, the maximum sampling rate for 10-bit resolution is 9.8 kHz and not 33 kHz. In addition, only the effective sound pressure is sent, and an audio processing is not carried out.
Nevertheless, the WASN paradigm presents several challenges, ranging from those derived from the design and development of the wireless sensor network, such as energy harvesting and low cost hardware development and maintenance, to some specific challenges derived from the automation of the data collection and subsequent signal processing, such as to detect anomalous noise events [13]. In addition, the sensor of a WASN designed for AAL systems should process the enviromental sounds to rapidly infer hazardous situations instead to send the full audio record to a server for a centralized processing. Thus, processing data at the node can ensure shorter response time and better reliability. In this context, the use of devices with an increasing storage and computation capacity coins a new term: Edge or Fog Computing. This model extends Cloud computing and services to the edge of the network reducing network latency and offloading computation [17], as well as to avoid bottlenecks at remote server due to the throughput and volume of data to be collected and processed. Edge Computing has the potential to address the concerns of response time requirement, battery life constraint, bandwidth cost saving, as well as data safety and privacy [18]. This concept covers computational to be performed at the edge of the network and to exchange data from or to cloud IoT services. In [19], the design and deployment of a WASN at home, inspired by the Mobile Edge Computing paradigm [20] able to gather the data of all acoustic sensing nodes deployed to infer the audio events of interest in an AAL context is described. It follows a distributed implementation, where all digital signal processing is carried out in a concentrator offloading the sensor nodes and avoiding the use of the server to remotely process the data. This concentrator is based on a GPU embedded platform.
As has been discussed, many research using low cost sensors in a WASN have been developed. Nevertheless, those works have been designed to measure only noise levels and not for sound identification. On the other hand, research where audio processing is carried out are based on medium cost platforms, such as Raspberry or GPU, or using cloud services. Hence, the aim of this research is to solve these deficiencies designing a low cost acoustic sensor to do audio processing at the edge of network.
There is no doubt that significant progress has been made in the field of wireless acoustic sensor networks. However, an improvement to the actual sensors is needed because the main drawback of these recent WASN is that their power consumption and cost do not fit some of the critical requirements of AAL applications: power consumption, mobility, size and cost. In addition, humans are most sensitive to frequencies between 2 kHz and 5 kHz, and the speech and environmental sounds are often less than 5 kHz bandwidth. Therefore, the sensor has to be characterized by a spectrum with these frequencies. In this paper, a novel wireless acoustic sensor is proposed. The main novelty of this work comes from the fact that the proposed wireless acoustic sensor is able to record audio samples at least at 10 kHz sampling frequency (5 kHz bandwidth) and 12-bit resolution, and audio signal processing can be carried out at node without compromising the sample rate and the energy consumption. Furthermore, this sensor can be applied in AAL systems for personal healthcare because it has the following significant advantages: low cost, small size, wireless network connectivity, audio sampling and computation capabilities for audio processing. Thus, the identification of sounds for an AAL context, such as fall detection or health related symptoms, could be carried out at the edge of a WASN reducing network latency and improving response time and battery life of proposed sensor, enhancing quality of life and safety of older people.
The remainder of this paper is organized as follows. Section 2 describes the low cost proposed wireless acoustic sensor. Section 3 describes the used methods to validate and evaluate the proposed sensor. Section 4 shows the results of some experiments carried out to validate the designed sensor in this study. Finally, in Section 5 draws some conclusions and discusses some possible directions for future research.

2. Wireless Acoustic Sensor
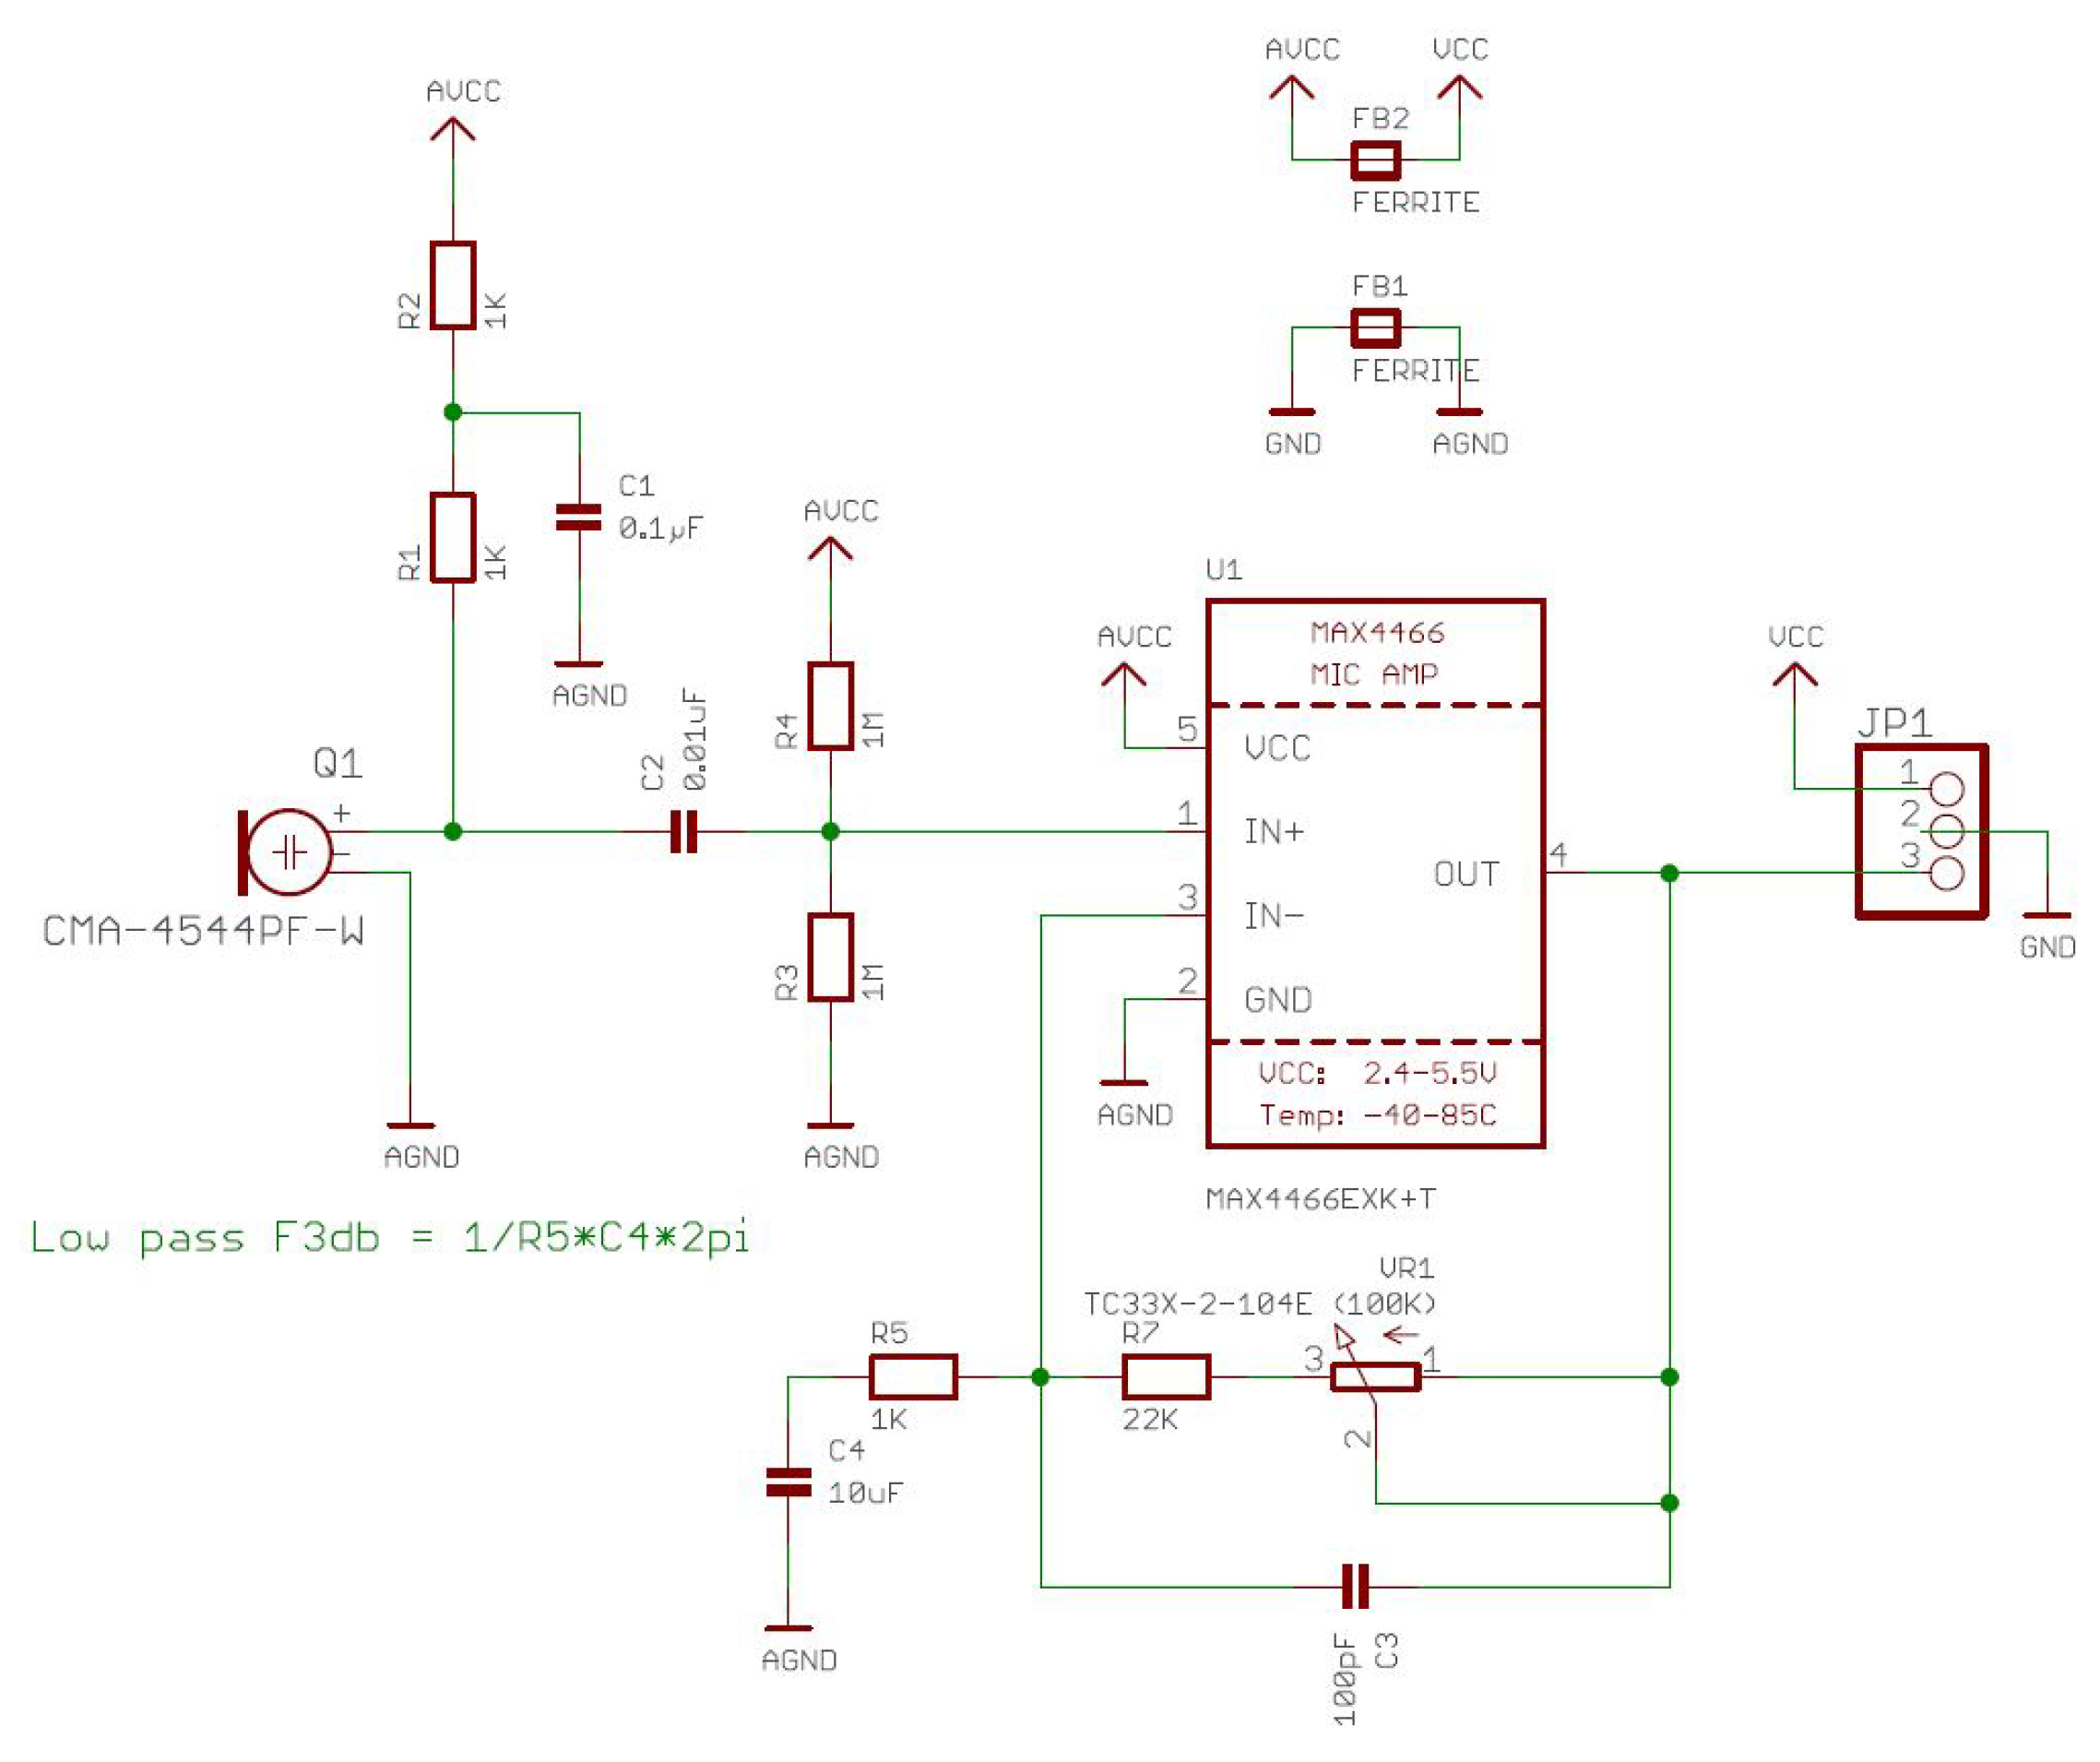
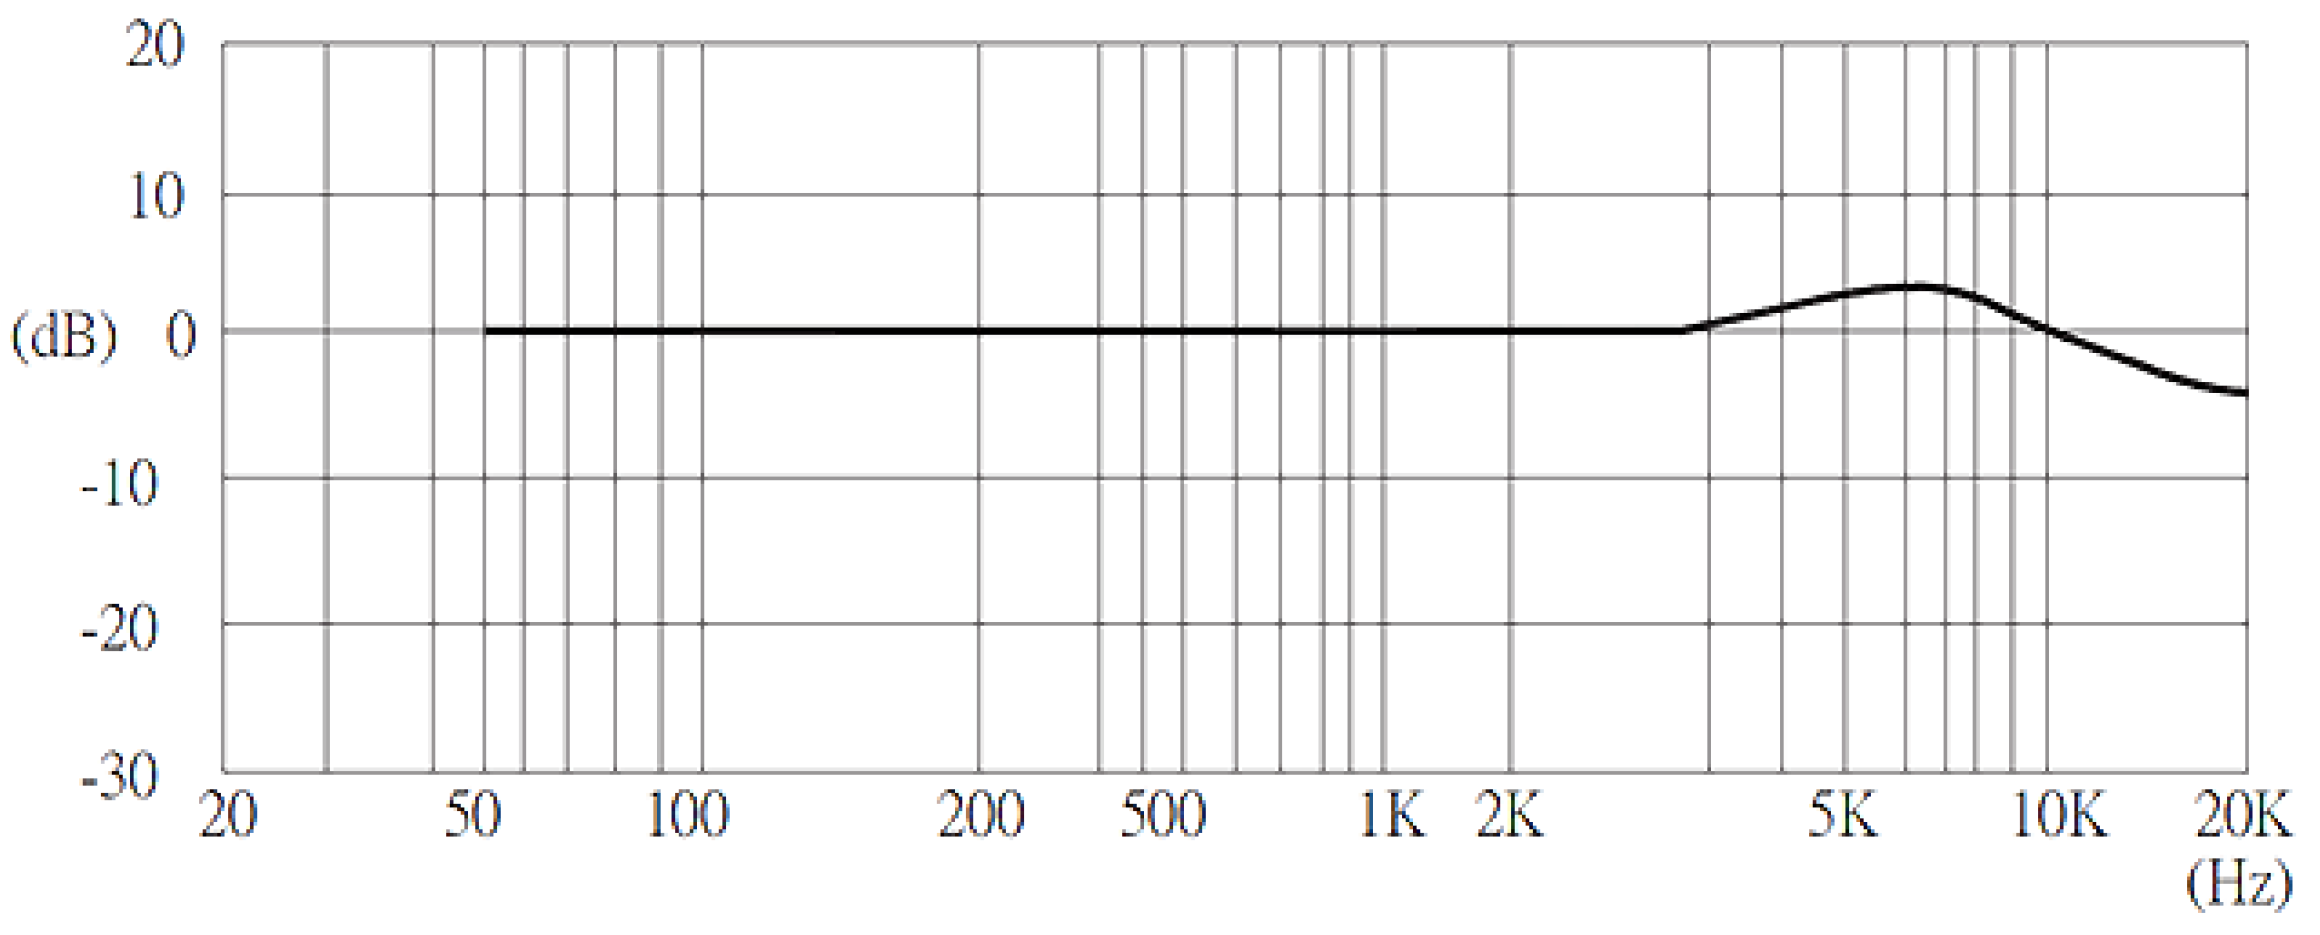
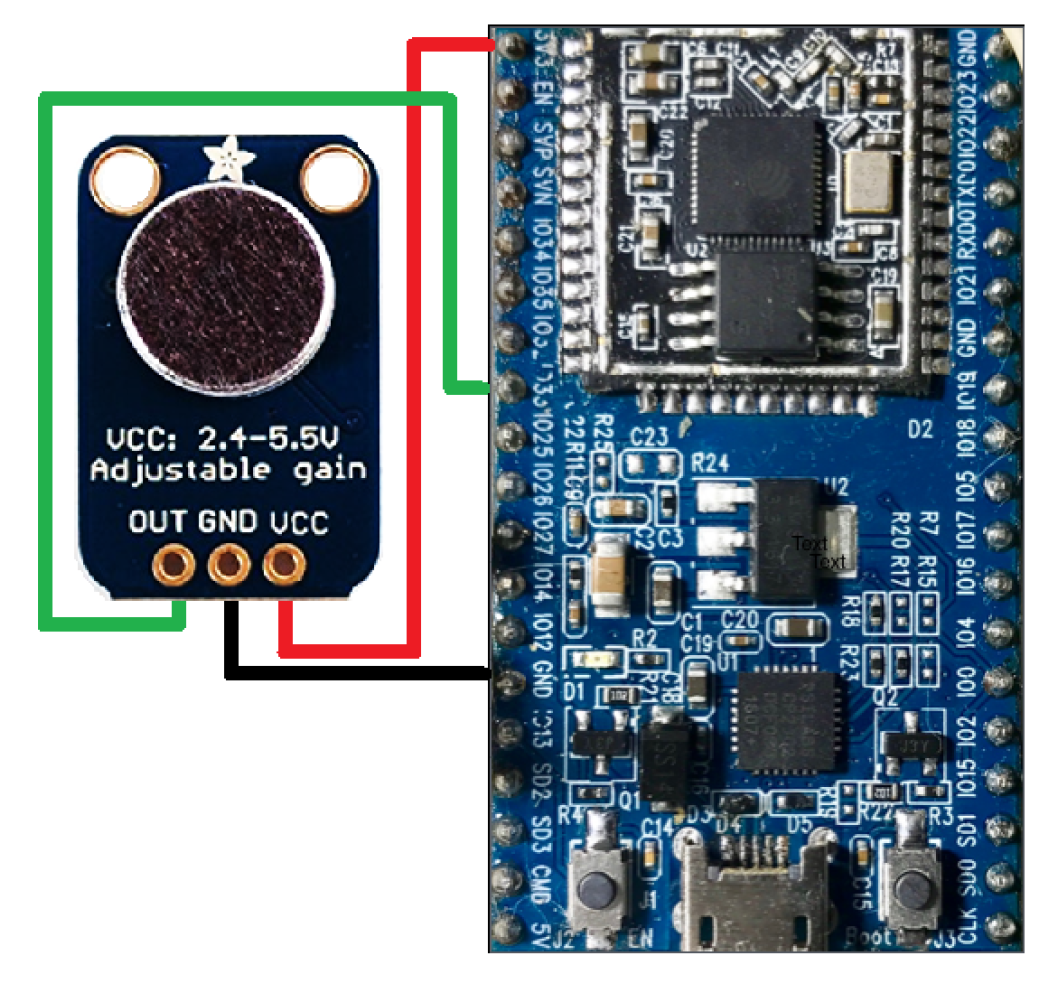
In this section the proposed low cost wireless acoustic sensor is described which is formed by an audio sensor and a microcontroller based board. The main goal in designing the sensor was to obtain a product of small size, low cost, low consumption and versatile which allows to be used in permanent and remote monitoring in AAL systems.

2.1. Audio Sensor

The audio sensor is an electret microphone amplifier with adjustable gain [21]. It is based on an electret omnidirectional microphone, CMA-4544PF-W, and an op-amp specifically optimized for use as microphone preamplifiers, a Maxim MAX4466, Figure 1. They provide the ideal combination of an optimized gain bandwidth product with low voltage operation in ultra-small packages. Furthermore, it has an almost flat response in the frequency range between 50 Hz and 10 kHz, Figure 2. Therefore, the characterization of sensor is fulfilled whose operating frequency lies within the range 100 Hz–5 kHz.

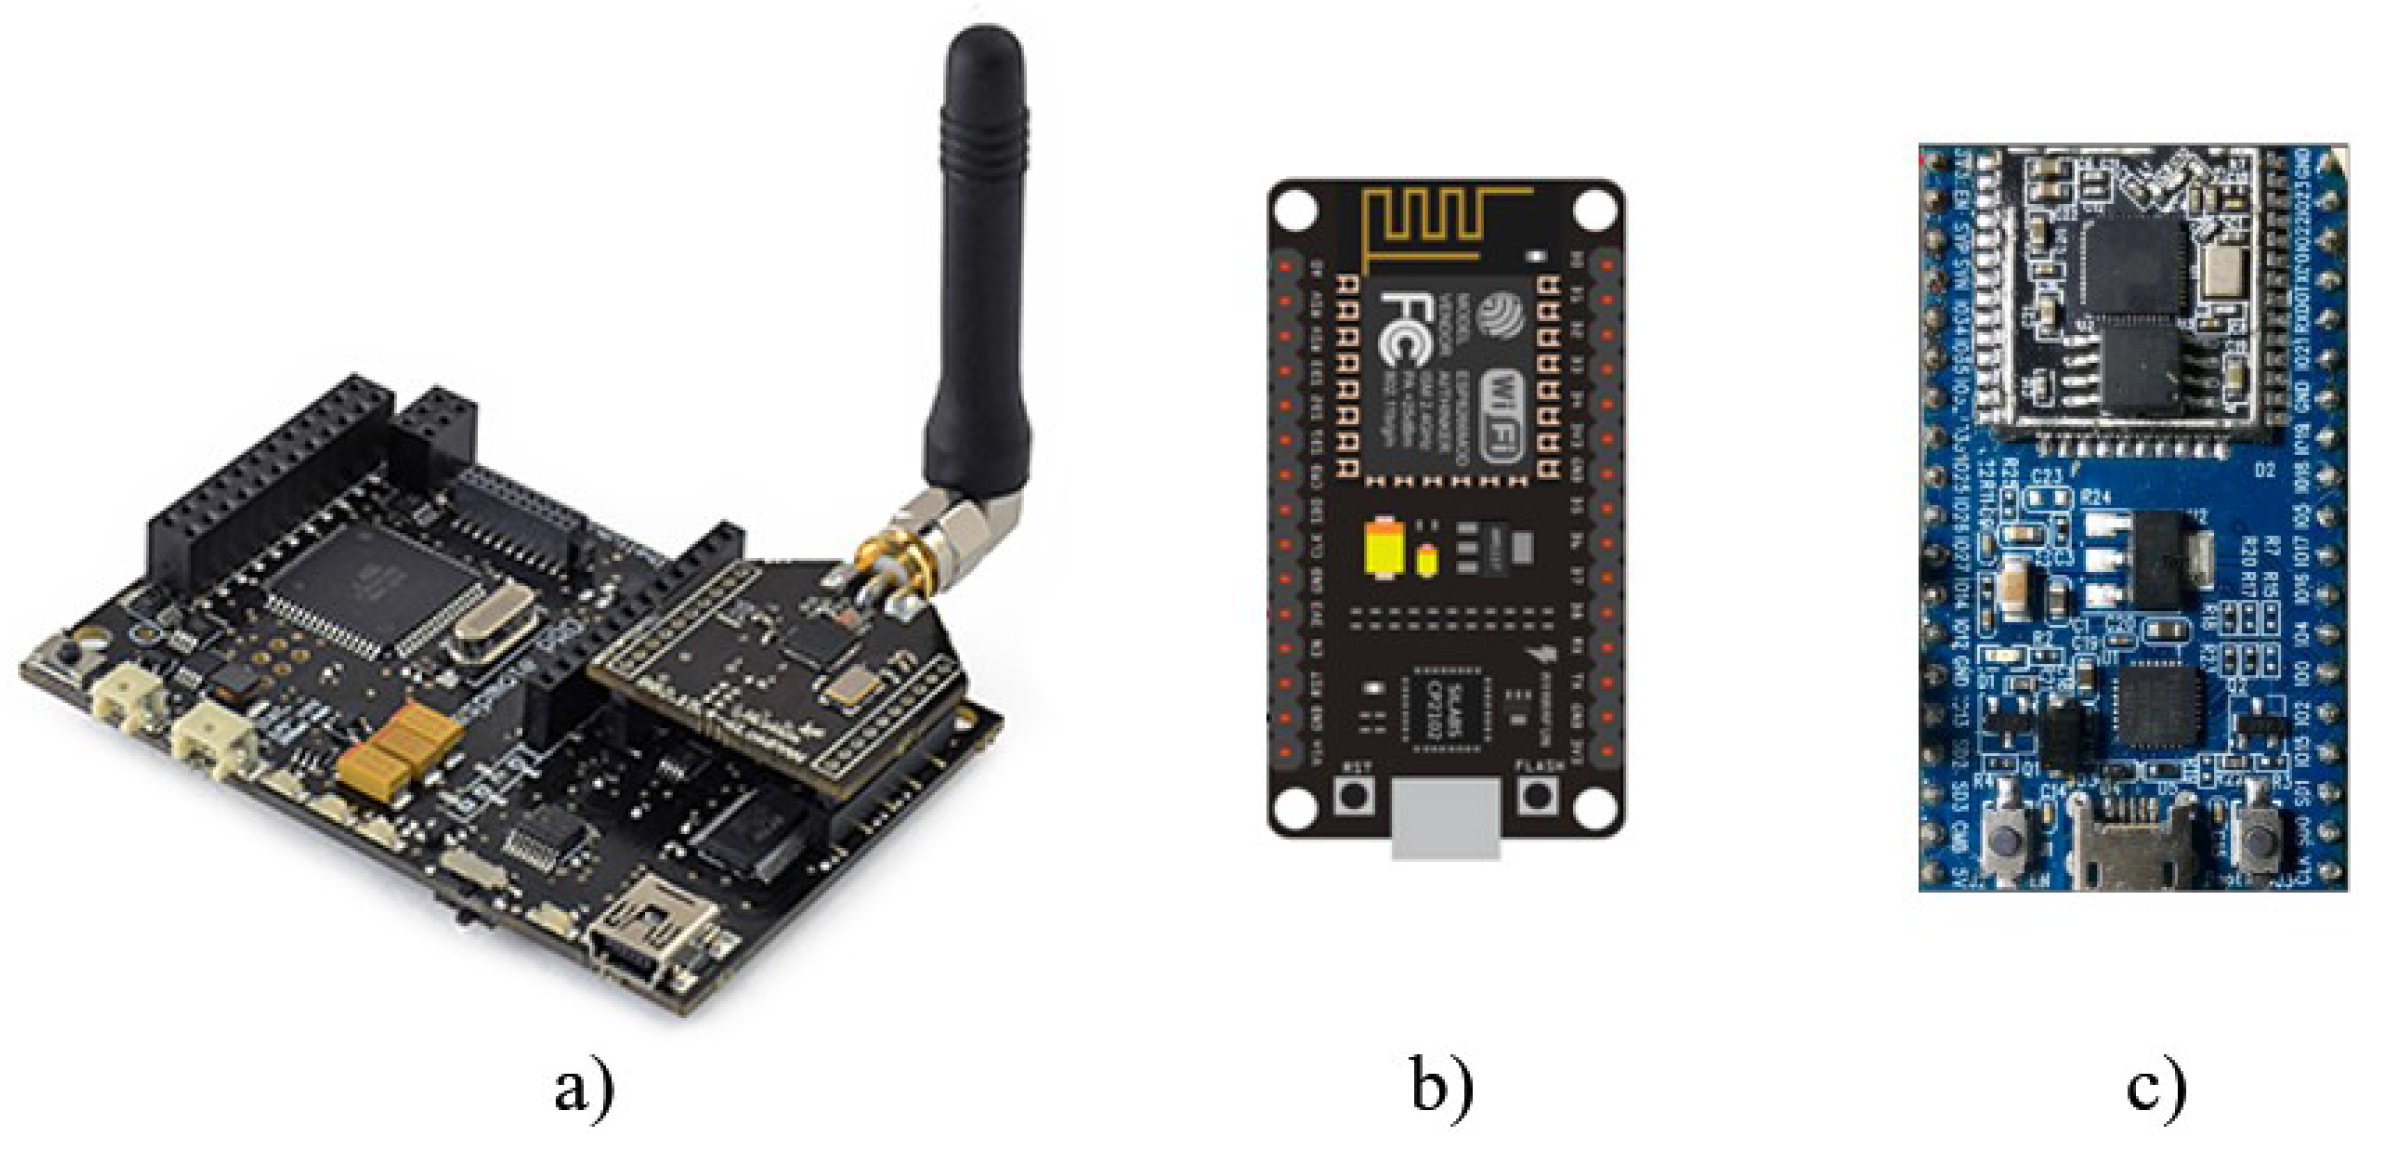
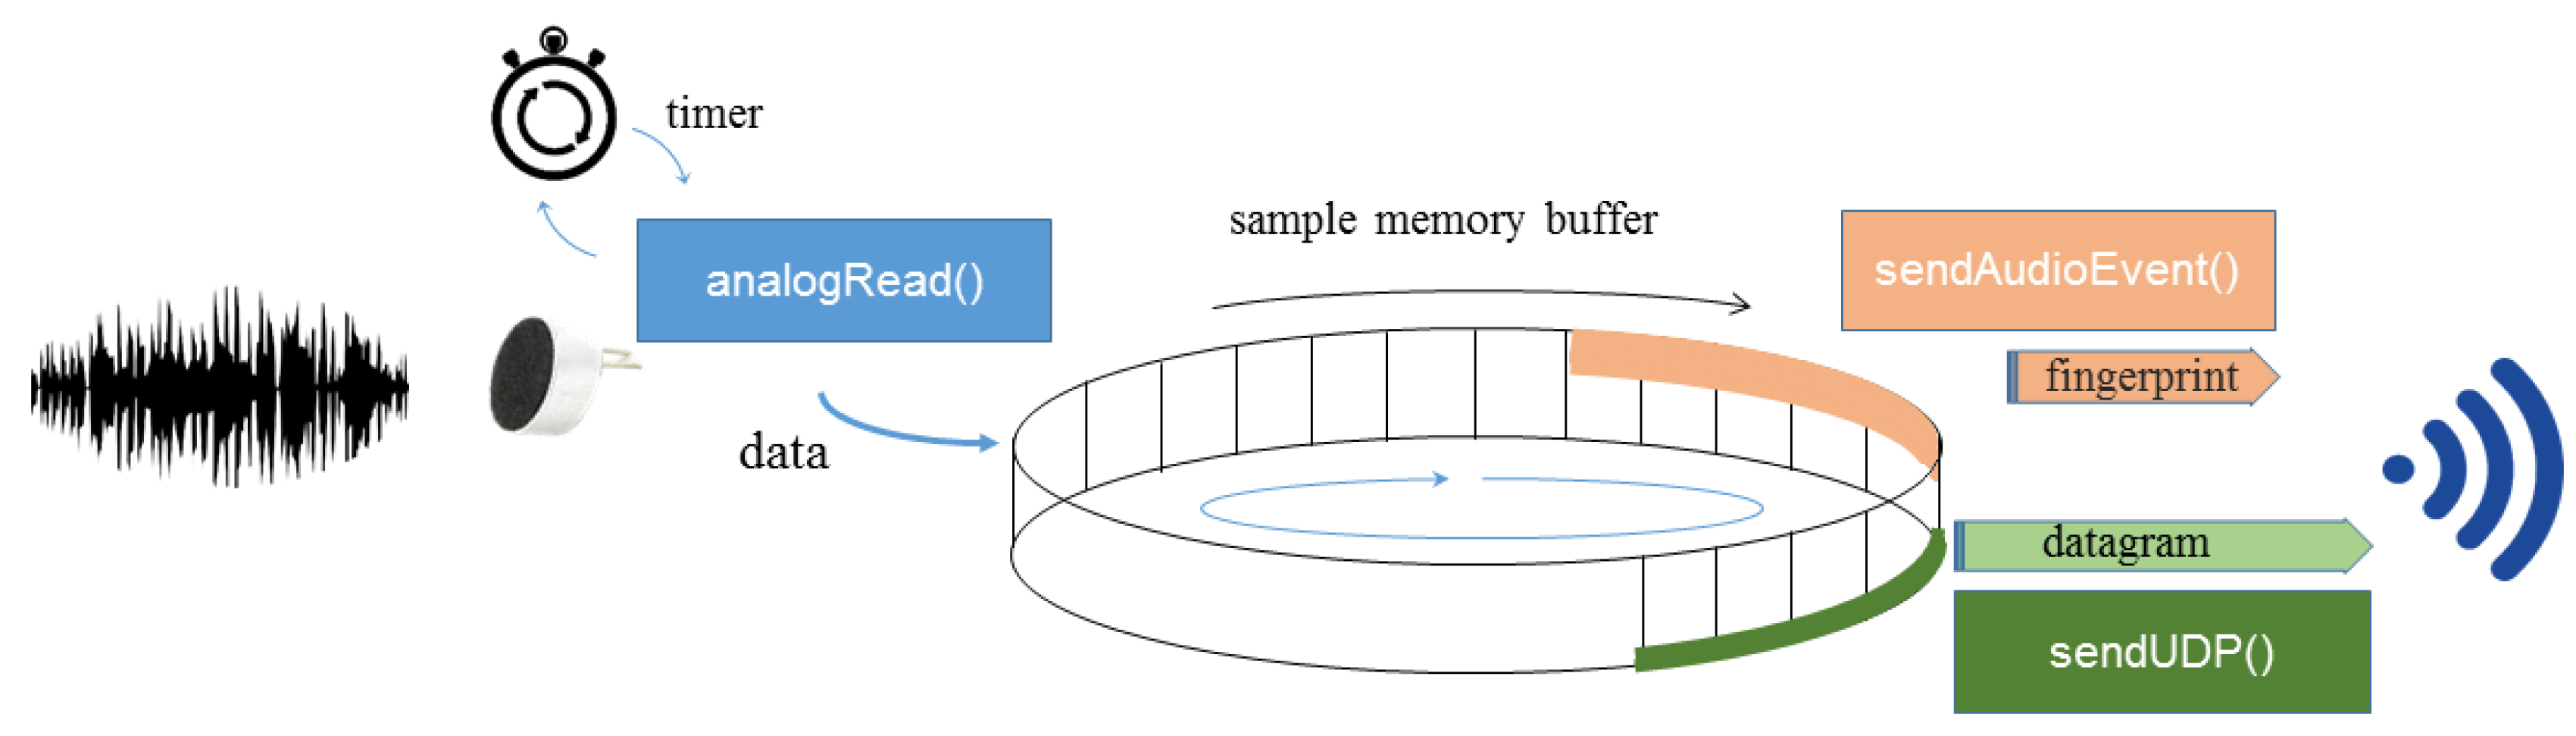
2.2. Microcontroller Based Board

Three low cost microcontroller platforms were evaluated, joinly with the above audio sensor, to determine the best option for the proposed system: Libelium Waspmote platform [22], Espressif ESP8266 board [23], and Espressif ESP32 board [24]. Figure 3 shows the evaluated microcontroller boards.
Waspmote board is a modular device that allows us to install different sensors and different radio transceivers. Waspmote hardware architecture has been specially designed to be extremely low consumption. The Waspmote has an Atmega1281 microcontroller running at 14 MHz with programmable sleep modes. These sleep modes make Waspmote the lowest consumption sensor platform in the market (0.7 uA in hibernate mode and 55 uA in sleep mode). The whole set, formed by Waspmote and audio sensor, has a small size (85 × 75 × 35 mm, included battery). The ATmega1281 has 8 ADC channels with 10-bit resolution. Due to the microcontroller characteristics, the tested maximum ADC sampling frequency was 9.8 kHz. In addition, it has only 8 kB SRAM, and therefore, the audio recording is about a few tenths of a second maximum duration. Waspmote has an SD card and could be used to save the sampled data. Nevertheless, the sample rate of ADC converter must be fit to 8-bit resolution to carry out these extra operations needed.
ESP8266 board delivers a highly integrated Wi-Fi SoC solution for efficient power, with its complete and self-contained Wi-Fi networking capabilities. It integrates an enhanced version of Tensilica’s L106 Diamond series 32-bit processor and on-chip SRAM with an ADC with 10-bit resolution, and can be interfaced with external sensors through the GPIOs, in low development cost at prototyped. One of the most common boards with the ESP8266 is NodeMCU, with ESP-12E module, Figure 3b. The whole set, formed by ESP8266 and audio sensor, has a very small size (50 × 30 × 20 mm) which is very useful to place at different positions in a discrete way. It can support up to 80 MHz frequency clock. It has a built-in SPI flash memory with 4MB capacity and the SRAM capacity available to users is about 36 kB. The tested maximum ADC sampling frequency was 10.6 kHz.
Espressif Systems announced the launch of ESP32 cloud on chip on September 6th, 2016. It is a Dual Core Wi-Fi + BT Combo MCU. Some of features of the ESP32 are the following: the CPU is an Xtensa Dual-Core 32-bit LX6 microprocessor, operating up to 240 MHz, 520 kB SRAM, 12-bit SAR ADC up to 18 channels and built-in Wi-Fi card, supporting IEEE 802.11 b/g/n standards, and Bluetooth v4.2 BR/EDR and BLE. Also, the ESP32 chip features 40 physical GPIO pads which can be used as a general purpose I/O, to connect new sensors, or can be connected to an internal peripheral signal. The most common development board is the ESP32S, with a ESP-WROOM-32 module and an SRAM capacity available to users about 300 kB. As previous board, the whole set, formed by ESP32 and audio sensor, has a very small size (55 × 30 × 20 mm), and is very useful to place at different positions in a discrete way. The tested maximum ADC sampling frequency was 100 kHz. It is enough for the system purposes. Furthermore, ADC is non-blocking, so the conversion process with other instructions execution can be overlapped.
Although all analyzed boards can fulfill for implementing a wireless acoustic sensor, ESP32 board was chosen because it has the biggest: ADC bit resolution, SRAM capacity, and microprocessor frequency. Furthermore, because of it has a dual core and the microcontroller’s connectivity features and functionalities, audio samples are gathered while other operations can be simultaneously done, such as sending data to a server using IP protocol or data processing, thus promoting the edge computing idea. Figure 4 shows the wireless acoustic sensor based on ESP32 board. On the other hand, the cost of proposed sensor is about 10 Euros, being it very competitive for an AAL environment.
Lastly, the principle of operation of the software implementation for the proposed wireless acoustic sensor is shown in Figure 5. First, a timer interruption is enabled for gathering the audio samples from ADC using AnalogRead function. Timer is set to 100 μs to obtain a sampling frequency at 10 kHz. Next, the data obtained from ADC are stored in an endless buffer. Finally, the raw data can be sent to a server for recording the sampled data in a wav format file or a suitable audio fingerprint to identify different sound events that can be used for detecting hazardous situations.

3. System Validation Methods

In order to validate the proposed wireless acoustic sensor a statistical analysis and an audio classification of recorded samples are carrying out. Thus, randomness tests and an audio fingerprint matching were the methods employed for system validation and are described in this section.

3.1. Randomness Tests

Randomness tests can be used to determine whether a dataset has a recognizable pattern, and therefore whether the process that generated it is significantly random. That is, it can be used to test the hypothesis that the elements of a sequence are mutually independent or not. Four randomness tests were used to demonstrate that recorded audio files by the proposed system have a recognizable pattern, and hence, the sampled audio information is not random. The following randomness tests were used: Bartels Test [25], Cox Stuart Test [26], Mann-Kendall Test [27] and Wald-Wolfowitz Test [28].

3.1.1. Bartels Test

This randomness test is the rank version of von Neumann’s Ratio Test for Randomness [29].

3.1.2. Cox Stuart Test

In this test data are grouped in pairs with the i t h observation of the first half paired with the i t h observation of the second half of the time-ordered data. If the length of vector X is odd the middle observation is eliminated. The Cox Stuart test is then simply a sign test applied to these paired data.

3.1.3. Mann-Kendall Test

This randomness test is a non-parametric statistical test that analyzes difference in signs between earlier and later data points. The idea is that if a trend is present, the sign values will tend to increase constantly, or decrease constantly. Every value is compared to every value preceding it in the time series.

3.1.4. Wald-Wolfowitz Test

This randomness test is a non-parametric statistical test that transforms into a dichotomous vector according as each values is above or below a given threshold. Values equal to the level are removed from the sample. The default threshold value used in applications is the sample median.

3.2. Audio Fingerprint Matching

An audio fingerprint is a compact content-based signature that summarizes an audio recording. This technology has attracted attention since they allow the identification of audio independently of its format and without the need of meta-data or watermark embedding [30]. The main objective of an audio fingerprint mechanism is to efficiently compare the equality (or not) of two audio files, not by comparing the files themselves, but by comparing substantially smaller sets of information, referred to as audio fingerprints. Furthermore, audio fingerpint length is a lot less than the raw audio data. In order to validate the proposed wireless acoustic sensor, an open source application, termed Chromaprint [31], is used to generate the fingerprints of original and recorded audios. Then, to find an audio matching between original and recorded audios, the Hamming distance is evaluated using both fingerprints.

3.2.1. Chromaprint Process

Chromaprint converts the audio input to mono and downsampled to 11,025 Hz. The audio signal is converted to the frequency domain by performing a short-time Fourier Transform (STFT) with a frame size of 4096 samples (371 ms) and a 2/3 overlap (2731 samples). The resulting spectrum is converted to 12 bins representing the chroma of the signal. This information is called “chroma features”. Each bin in the chromagram represents the energy that is present in a musical note. The 12 bins represent the 12 notes of the chromatic scale. In order to transform the bins in a more compact form to carry out the fingerprint matching, a 12-by-16 sliding window is moved over the chromagram one sample at a time. On each of them is applied a pre-defined set of 16 filters that capture intensity differences across musical notes and time. Each of the filters quantizes the energy value to a 2-bit number. The 2-bit value is encoded using Gray coding. The 2-bit hash values from each of the 16 filters are converted to a single 32-bit integer representing the subfingerprint of the 12-by-16 window. The window is advanced one sample to calculate the next subfingerprint. The full fingerprint is composed by the all subfinngerprints.

3.2.2. Hamming Distance

In order to find a simple audio matching for verifying and validating the proposed system, the Hamming distance is implemented because is performed at the bit-level and therefore, requires less computational complexity. The Hamming distance between two ( N F x 32 ) -bit binary fingerprint vectors f v 1 and f v 2 is computed as Equation (1):
H d ( f v 1 , f v 2 ) = i = 1 N F x 32 F ( b i t f v 1 ( i ) b i t f v 2 ( i ) )
where N F denotes the number of subfingerprints of vectors, b i t f v 1 ( i ) and b i t f v 2 are the i t h element of binary fingerprint vectors, and F ( ) is an function defined by Equation (2):
F ( x ) = 1 if  x  is true 0 otherwise

3.2.3. Matching Algorithm

Algorithm 1 was used to evaluate the shortest Hamming distance between all original environmental sounds and each recorded audio. The shortest distance identifies and matches the recorded audio with the original sound.
Algorithm 1 Audio Fingerprint Matching
Require: Fingerprint of recorded audio, f v 1
Require: Fingerprint of all original audios, f v s o u r c e
L 1 l e n g t h ( f v 1 )
for s o u r c e 1: all original fingerprints do
   L s o u r c e l e n g t h ( f v s o u r c e )
  for i 1 : ( L s o u r c e - L 1 - 1 ) do
    d i s t a n c e V e c t o r H d ( f v 1 , f v s o u r c e ( i : L 1 + i - 1 ) )
  end for
   d i s t a n c e A l l A u d i o V e c t o r m i n ( d i s t a n c e V e c t o r )
end for
return m i n ( d i s t a n c e A l l A u d i o V e c t o r )

4. Results and Discussion

This section describes the acoustic anechoic chamber where different audio samples from different environmental sounds were gathered and the dataset built to evaluate the validity of the proposed sensor. Afterwards, the results of aforementioned system evaluation methods, randomness tests and audio fingerprint matching, are presented and discussed. Also, the usefulness of the proposed sensor board in terms of energy consumption and audio processing capabilities are carried out.

4.1. Acoustic Anechoic Chamber

The acoustic anechoic chamber where experiments were carried out is located on the second floor of Institute for Technological Development and Innovation in Communications (IDeTIC) building at Las Palmas de Gran Canaria University, Spain. The chamber area is nearly 200 cm wide and 430 cm long, and it has a simple design to absorb reflections of sound waves and is also isolated from waves entering from its surroundings.
The soundproofing of the chamber is carried out using foam pyramidal panels which is a powerful sound absorber that dramatically reduces echo, reverberation and standing waves. For the acoustic insulation is used rock wool and polyurethane panels. Figure 6 shows acoustic anechoic chamber at IDeTIC and the foam pyramidal panels used.

4.2. Dataset

A total of 48 audio records were gathered from fourteen different indoor and outdoor environmental sounds for performing the statistical analysis and audio classification. These environmental records have been downloaded from Freesound website [32]. Table 1 shows the dataset characteristics. Each environmental sound was recorded using a 10 kHz sampling frequency and 8-bit resolution during 10 s. In order to gather different samples, the start point of each recording was randomly established.

4.2.1. Randomness Tests

All recorded audios were evaluated with the four above randomness tests. The null hypothesis of randomness is tested against nonrandomness, and a p-value is calculated which is used in the context of null hypothesis testing in order to quantify the idea of statistical significance of evidence, that is, the probability of finding the observed results when the null hypothesis is true. In the tests, if the p-value is less than 0.05, the null hypothesis is rejected because a significant difference exists.
Table 2 shows the p-values of four randomness tests. As can be seen, all p-values for Bartels, Mann-Kendall and Wald-Wofowitz tests are less than 0.05. For Cox Stuart test, most results return a p-value less than 0.05, and only eight tests are slightly greater than this value. It is not significant, and hence the null hypothesis can be rejected. Thus, it can be considered that the recorded audio files by wireless acoustic sensor are not significantly random, and therefore, have a recognizable pattern.

4.2.2. Audio Fingerprint Matching

To carry out the audio fingerprint matching, an audio fingerprint was computed both for each recorded audio and original environmental sounds. All recorded audios are 10 s long, therefore, each recorded audio fingerprint is 66 subfingerprints long. Thus, the vectors used in Equation (1) are 2112 (66 × 32) bits length. Afterwards, Algorithm 1 was used to evaluate the shortest Hamming distance between all original environmental sounds and each recorded audio. The shortest distance identifies and matches the recorded audio with the original sound.
Table 3 shows the results returned by Algorithm 1 when it was evaluated for each recorded audio. For each one the shortest Hamming Distance is bold marked. As can be seen, most of recorded audios match with its correspondent original sound, yielding an 85.4% accuracy, and there is not dependency with the kind of sound, indoor or outdoor. Furthermore, a 91.6% accuracy is reached when the three shortest Hamming distances are used, that is, a recorded audio is correctly classified and found in a set of three sounds with a 91.6% probability. On the other hand, all S10 recordings were classified as S3 original audio. It can be because doppler effect is perceived in both audios. In any case, the aim of this experiment is not to implement a robust classification system, but to demonstrate the validity of the proposed acoustic sensor. Taking in account the results, it can be asserted that the recorded audios have a high grade of similarity with its original sound, and hence, the proposed acoustic sensor can be validated.

4.3. Energy Consumption and Audio Proccesing Capabilities

In order to evaluate the energy consumption of the proposed sensor, three experiments with different processing capabilities were performed: (A) audio recording, (B) audio recording and Fast Fourier Transform (FFT) calculation, and (C) audio recording and UDP datagram sending via Wi-Fi connection. Audio recording was carried out in an infinite loop using a 10 kHz sampling frequency and 12-bit resolution. The ArduinoFFT library [33] was used to implement the FFT, and it was computed each 12.8 ms, that is, every FFT was run after 128 new samples were recorded. UDP datagram sending was carried out each 25.6 ms, therefore, each UDP datagram is sent when 256 new samples are gathered. The prototype sensor was powered by 5 V, and the current consumption was measurement for each experiment. Table 4 shows the results. As can be seen, the A and B experiments have similar energy consumption because all operations are carried out in an infinite loop and additional resources are not used, only the processor. However, in the C experiment, Wi-Fi module is periodiocally transmitting a datagram, and therefore, the energy consumption is higher. In any case, the maximun energy consumption is about 0.8 W, and the proposed sensor could be powered by battery for a long time.
On the other hand, audio processing capabilities were evaluated implementing the FFT with different number of samples and carrying out an audio recording using the same core. FFT was chosen because is an expensive computational algorithm in audio processing. Each experiment was performed 1000 times and the average execution time was computed. Table 5 shows the average execution time for each experiment. As can be seen, the execution time increases with the number of samples. In addition, using the same number of samples, the FFT execution time is slightly higher when the simultaneous sampling is carried out, that is, the FFT was computed while other samples were gathered. Nevertheless, about 20 ms is only spent to compute a 512 sample FFT. Hence, audio processing capabilities could be performed without compromising the sample rate and the energy consumption, and edge computing paradigm can be implemented in the proposed sensor.

5. Conclusions and Future Work

As was discussed in this paper, in recent years, many authors have experienced a growing interest in remote monitoring of older people, and several systems have been proposed in the literature. These systems are commonly termed as AAL systems, but the acoustic sensors were not designed with low cost and audio processing requisites. In this paper, we described the design of a low cost wireless acoustic sensor for AAL systems based on ESP32 board. In order to choose the best platform, three different low cost microcontroller boards were evaluated. It was given a detailed description of the hardware and the principle of operation of software implementation. The proposed sensor is capable of recording ambient sounds at least to 10 kHz sampling frequency and 12-bit resolution. Furthermore, the sensor board has computation capabilities to carry out audio signal processing and network communications without compromising the sample rate and the energy consumption. Hence, the proposed sensor can improve AAL solutions carrying out the audio identification for monitoring of activity and health, and the detection of distress situations at the edge of WASN. Thus, a shorter response time and better reliability is ensured enhancing quality of life and safety of older people. The acoustic sensor is very small in size, and therefore is very useful to be used in a discrete way for personal healthcare in AAL systems, and the cost of hardware platform is very competitive. The experiments on the proposed system showed that the system worked well. System validation is demonstrated by experimental results, which were statistically obtained analysing several tests of randomness and audio classification. Furthermore, evaluations of energy consumption and audio processing capabilities were carried out demonstrating the usefulness and low power, and that edge computing paradigm can be implemented at the proposed sensor.
In our ongoing work, we are planning to design a better sound classification system based on audio fingerprint to be implemented at each acoustic sensor. Moreover, we are also planning to deploy a WASN using the proposed acoustic sensor in this paper to evaluate the whole system and network performance.

Author Contributions

Miguel A. Quintana-Suárez designed and implemented the prototype of wireless acoustic sensor, and wrote part of manuscript. David Sánchez-Rodríguez, Itziar Alonso-González and Jesús B. Alonso-Hernández conceived and designed the experiments, analized the data, and wrote the rest of the manuscript. All authors have reviewed and approved the final manuscript.

Conflicts of Interest

The authors declare no conflict of interest.

References

  1. Chang, C.Y.; Kuo, C.H.; Chen, J.C.; Wang, T.C. Design and implementation of an IoT access point for smart home. Appl. Sci. 2015, 5, 1882–1903. [Google Scholar] [CrossRef]
  2. Peruzzini, M.; Germani, M.; Papetti, A.; Capitanelli, A. Smart Home Information Management System for Energy-Efficient Networks. In Collaborative Systems for Reindustrialization, Proceedings of the 14th IFIP WG 5.5 Working Conference on Virtual Enterprises, PRO-VE 2013 Dresden, Germany, 30 September–2 October 2013; Springer: Heidelberg, Germany, 2013; pp. 393–401. [Google Scholar]
  3. Amendola, S.; Lodato, R.; Manzari, S.; Occhiuzzi, C.; Marrocco, G. RFID technology for IoT-based personal healthcare in smart spaces. IEEE Internet Things J. 2014, 1, 144–152. [Google Scholar] [CrossRef]
  4. Sánchez-Rosario, F.; Sanchez-Rodriguez, D.; Alonso-Hernández, J.B.; Travieso-González, C.M.; Alonso-González, I.; Ley-Bosch, C.; Ramírez-Casañas, C.; Quintana-Suárez, M.A. A low consumption real time environmental monitoring system for smart cities based on ZigBee wireless sensor network. In Proceedings of the 2015 International Wireless Communications and Mobile Computing Conference (IWCMC), Dubrovnik, Croatia, 24–25 August 2015; IEEE: Washington, DC, USA, 2015; pp. 702–707. [Google Scholar]
  5. Lin, K.; Chen, M.; Deng, J.; Hassan, M.M.; Fortino, G. Enhanced fingerprinting and trajectory prediction for IoT localization in smart buildings. IEEE Trans. Autom. Sci. Eng. 2016, 13, 1294–1307. [Google Scholar] [CrossRef]
  6. Memon, M.; Wagner, S.R.; Pedersen, C.F.; Beevi, F.H.A.; Hansen, F.O. Ambient assisted living healthcare frameworks, platforms, standards, and quality attributes. Sensors 2014, 14, 4312–4341. [Google Scholar] [CrossRef] [PubMed]
  7. Rashidi, P.; Mihailidis, A. A survey on ambient-assisted living tools for older adults. IEEE J. Biomed. Health Inform. 2013, 17, 579–590. [Google Scholar] [CrossRef] [PubMed]
  8. European Comission. Active and Assisted Living Programme. ICT for Ageing Well. Available online: http://www.aal-europe.eu/ (accessed on 1 June 2017).
  9. Erden, F.; Velipasalar, S.; Alkar, A.Z.; Cetin, A.E. Sensors in Assisted Living: A survey of signal and image processing methods. IEEE Signal Proc. Mag. 2016, 33, 36–44. [Google Scholar] [CrossRef]
  10. Vacher, M.; Portet, F.; Fleury, A.; Noury, N. Development of audio sensing technology for ambient assisted living: Applications and challenges. Int. J. E-Health and Medical Commun. 2011, 2, 35–54. [Google Scholar] [CrossRef]
  11. Kivelä, I.; Gao, C.; Luomala, J.; Hakala, I. Design of Noise Measurement Sensor Network: Networking and Communication Part. In Proceedings of the Fifth International Conference on Sensor Technologies and Applications, Sensorcomm, French Riviera, France, 21–27 August 2011; pp. 280–287. [Google Scholar]
  12. Paulo, J.; Fazenda, P.; Oliveira, T.; Carvalho, C.; Felix, M. Framework to Monitor Sound Events in the City Supported by the FIWARE platform. In Proceedings of the 46th Congreso Español de Acústica, Valencia, Spain, 21–23 October 2015; pp. 21–23. [Google Scholar]
  13. Alías, F.; Socoró, J.C. Description of anomalous noise events for reliable dynamic traffic noise mapping in real-life urban and suburban soundscapes. Appl. Sci. 2017, 7, 146. [Google Scholar] [CrossRef]
  14. Sevillano, X.; Socoró, J.C.; Alías, F.; Bellucci, P.; Peruzzi, L.; Radaelli, S.; Coppi, P.; Nencini, L.; Cerniglia, A.; Bisceglie, A.; et al. DYNAMAP—Development of low cost sensors networks for real time noise mapping. Noise Mapp. 2016, 3, 172–189. [Google Scholar] [CrossRef]
  15. Segura Garcia, J.; Pérez Solano, J.J.; Cobos Serrano, M.; Navarro Camba, E.A.; Felici Castell, S.; Soriano Asensi, A.; Montes Suay, F. Spatial Statistical Analysis of Urban Noise Data from a WASN Gathered by an IoT System: Application to a Small City. Appl. Sci. 2016, 6, 380. [Google Scholar] [CrossRef]
  16. Hakala, I.; Kivela, I.; Ihalainen, J.; Luomala, J.; Gao, C. Design of Low-Cost Noise Measurement Sensor Network: Sensor Function Design. In Proceedings of the 2010 First International Conference on Sensor Device Technologies and Applications (SENSORDEVICES), Venice, Italy, 18–25 July 2010; IEEE: Washington, DC, USA, 2010; pp. 172–179. [Google Scholar]
  17. Ahmed, A.; Ahmed, E. A Survey on Mobile Edge Computing. In Proceedings of the 2016 10th International Conference on Intelligent Systems and Control (ISCO), Coimbatore, India, 7–8 January 2016; IEEE: Washington, DC, USA, 2016; pp. 1–8. [Google Scholar]
  18. Shi, W.; Cao, J.; Zhang, Q.; Li, Y.; Xu, L. Edge computing: Vision and challenges. IEEE Internet Things J. 2016, 3, 637–646. [Google Scholar] [CrossRef]
  19. Alsina-Pagès, R.M.; Navarro, J.; Alías, F.; Hervás, M. homeSound: Real-Time Audio Event Detection Based on High Performance Computing for Behaviour and Surveillance Remote Monitoring. Sensors 2017, 17, 854. [Google Scholar] [CrossRef] [PubMed]
  20. Mach, P.; Becvar, Z. Mobile edge computing: A survey on architecture and computation offloading. IEEE Commun. Surv. Tutor. 2017, 19, 1628–1656. [Google Scholar] [CrossRef]
  21. Adafruit. Electret Microphone Amplifier. Available online: https://www.adafruit.com/product/1063 (accessed on 15 July 2017).
  22. Libelium. Waspmote Platform. Available online: http://www.libelium.com/products/waspmote/ (accessed on 3 May 2017).
  23. Espressif. ESP8266 Specification. Available online: https://espressif.com/en/products/hardware/esp8266ex/overview (accessed on 15 July 2017).
  24. Espressif. ESP32 Specification. Available online: https://espressif.com/en/products/hardware/esp32/overview (accessed on 15 July 2017).
  25. Bartels, R. The rank version of von Neumann’s ratio test for randomness. J. Am. Stat. Assoc. 1982, 77, 40–46. [Google Scholar] [CrossRef]
  26. Cox, D.R.; Stuart, A. Some quick sign tests for trend in location and dispersion. Biometrika 1955, 42, 80–95. [Google Scholar] [CrossRef]
  27. Kendall, M. Rank Correlation Methods; Oxford University Press: New York, NY, USA, 1990. [Google Scholar]
  28. Wald, A.; Wolfowitz, J. On a test whether two samples are from the same population. Ann. Math. Stat. 1940, 11, 147–162. [Google Scholar] [CrossRef]
  29. Von Neumann, J. Distribution of the ratio of the mean square successive difference to the variance. Ann. Math. Stat. 1941, 12, 367–395. [Google Scholar] [CrossRef]
  30. Cano, P.; Batlle, E.; Kalker, T.; Haitsma, J. A review of audio fingerprinting. J. VLSI Signal Proc. Syst. Signal Image Video Technol. 2005, 41, 271–284. [Google Scholar] [CrossRef]
  31. Lukáš, L. Chromaprint. Available online: https://acoustid.org/chromaprint (accessed on 3 May 2017).
  32. Freesound. Dataset of Audio Clips. Available online: http://freesound.org/ (accessed on 1 July 2017).
  33. Condes, E. ArduinoFFT. Available online: https://github.com/kosme/arduinoFFT (accessed on 28 July 2017).
Figure 1. Schematic of audio sensor.
Applsci 07 00877 g001
Figure 2. Frequency response curve of microphone.
Applsci 07 00877 g002
Figure 3. Microcontroller boards: (a) Waspmote; (b) ESP8266; (c) ESP32.
Applsci 07 00877 g003
Figure 4. Wireless acoustic sensor based on ESP32 board.
Applsci 07 00877 g004
Figure 5. Graphical flow diagram implemented in the wireless acoustic sensor.
Applsci 07 00877 g005
Figure 6. Acoustic anechoic chamber at IDeTIC.
Applsci 07 00877 g006
Table 1. Audio recordings dataset.
Environmental SoundDuration (s)Number of Records
S1—Traffic jam in a city493
S2—People on a street without traffic343
S3—Very strong traffic705
S4—City park with children333
S5—Pedestrian zone of a city with traffic323
S6—Inside of a noisy room by traffic604
S7—Ambulance passing with the siren294
S8—Drilling machine in a city183
S9—Police car passing with the siren283
S10—Ambulance siren. Doppler effect243
S11—Dense traffic in a city725
S12—Indoor door slam233
S13—Indoor gun shots983
S14—Slicing vegetables in a kitchen403
Table 2. p-values of randomness tests.
RecordBartelsCox StuartMann-KendallWald-Wolfowitz
S1-R100.06≈00
S1-R200.01≈00
S1-R300.09≈00
S2-R10≈0≈00
S2-R20≈0≈00
S2-R30≈0≈00
S3-R10≈0≈00
S3-R200.02≈00
S3-R300.12≈00
S3-R400.13≈00
S3-R500.09≈00
S4-R10≈000
S4-R20≈000
S4-R30≈0≈00
S5-R10≈0≈00
S5-R20≈000
S5-R30≈000
S6-R10≈000
S6-R20≈000
S6-R30≈000
S6-R40≈000
S7-R100.0700
S7-R200.08≈00
S7-R300.02≈00
S7-R40≈0≈00
S8-R10≈0≈00
S8-R200.01≈00
S8-R30≈0≈00
S9-R10≈000
S9-R20≈000
S9-R300.0100
S10-R100.03≈00
S10-R200.03≈00
S10-R300.06≈00
S11-R10≈0≈00
S11-R200.01≈00
S11-R30≈0≈00
S11-R400.06≈00
S11-R50≈0≈00
S12-R100.01≈00
S12-R200.0100
S12-R30≈000
S13-R10≈000
S13-R20≈000
S13-R300.0100
S14-R100.0500
S14-R20≈000
S14-R300.0600
Table 3. Audio fingerprints matching.
RecordS1S2S3S4S5S6S7S8S9S10S11S12S13S14
S1-R17731088107510861132110712491232109612571111123210601146
S1-R210251086104710501111118213231121114611641053123410401239
S1-R388310121022996115111081227115211111180110112529231114
S2-R11058351995101710871100123711181138120899711708551156
S2-R21047336961962108311201231115011611245102210918381127
S2-R310931088108310701124122412651162123012881105120410981194
S3-R111159925491002111110371288121210991298107211508901034
S3-R211449954861053112111101253127711271289110211389241116
S3-R3113810374591053122311261225124711781290109712039271144
S3-R4112210364271035111710911303111611791276108110819621060
S3-R51112106648511261180117712471198116812761061117710231183
S4-R110329391003370113310511250115711601249106411958331159
S4-R21035978996396110711331187115911351270106111508671142
S4-R3110210511089313112211281280118212181172111612119511164
S5-R11112111210601134377110212151157117812621088116210811163
S5-R21095102410331132105310641246117011191376105811439731121
S5-R31140108011081182403110812361174120412701135119311021150
S6-R11209117111531161113159112401198131813061155118811721010
S6-R21141101910801141105959812481149119112771099116610221066
S6-R31043103597210511107104013651106108811521073115310551059
S6-R41134105110261164109348512891151117212751152118510071039
S7-R111671121108911531150117810261220119611701145109510591129
S7-R21208121710911215124712059911226120912341183117911831169
S7-R31236119211331256127312253401371128313111166115913351212
S7-R41201117411361165121611743511246124712401151119612421227
S8-R19811096115510691096119612659491091107997711869821218
S8-R210151111112310471036116112743401095107798611819861236
S8-R310071093113610711081118912898471079102797512179881238
S9-R111131138111111331151103613801056104011031099116710981018
S9-R21164119511431245119210611322115640212281128119911061052
S9-R31140112911421191119911601314113944511951110123110521193
S10-R111511118106511601275120112271355118613801160119711941097
S10-R211491061106011241173110513221250107313051157121911921128
S10-R311911140109210951205120012061218115212991112123711751148
S11-R1107210311105107111061147125911211136133448311419031125
S11-R2107010841085105911251112120710901129128753812389811162
S11-R399710661121105110801138128010301111119048311759221249
S11-R41144117411611208113210951187119211791311358116711361156
S11-R5106610221082103811251086126111631178134048811709311068
S12-R11227122211951219116611401181126312651297119449512881192
S12-R21094105510511033112511151252102911021193108010249531183
S12-R311211095112210941140115612621122123312281054100910741149
S13-R11039103199110191110107614009721108103198511697581060
S13-R2102996695694211401036132310361015112898611656181058
S13-R395395499486010991072124610451055114293712173721180
S14-R1108210521077111111131148129310711102114011201158985758
S14-R2107897910221085110610951295109311221172111711591001768
S14-R3124411581129122811709311381123311101360121910921156249
Table 4. Energy consumption.
ExperimentAverage Current (mA)Energy Consumption (W)
A—Audio recording1390.695
B—Audio recording and FFT1410.705
C—Audio recording and UDP sending1650.825
Table 5. Fast Fourier Transform execution time.
Number of SamplesSimultaneous SamplingAverage Execution Time (ms)
128No3.32
128Yes4.45
256No7.04
256Yes9.43
512No14.92
512Yes19.97

