A Novel Approach to Extract Significant Patterns of Travel Time Intervals of Vehicles from Freeway Gantry Timestamp Sequences †

Abstract
:1. Introduction
2. Materials and Methods
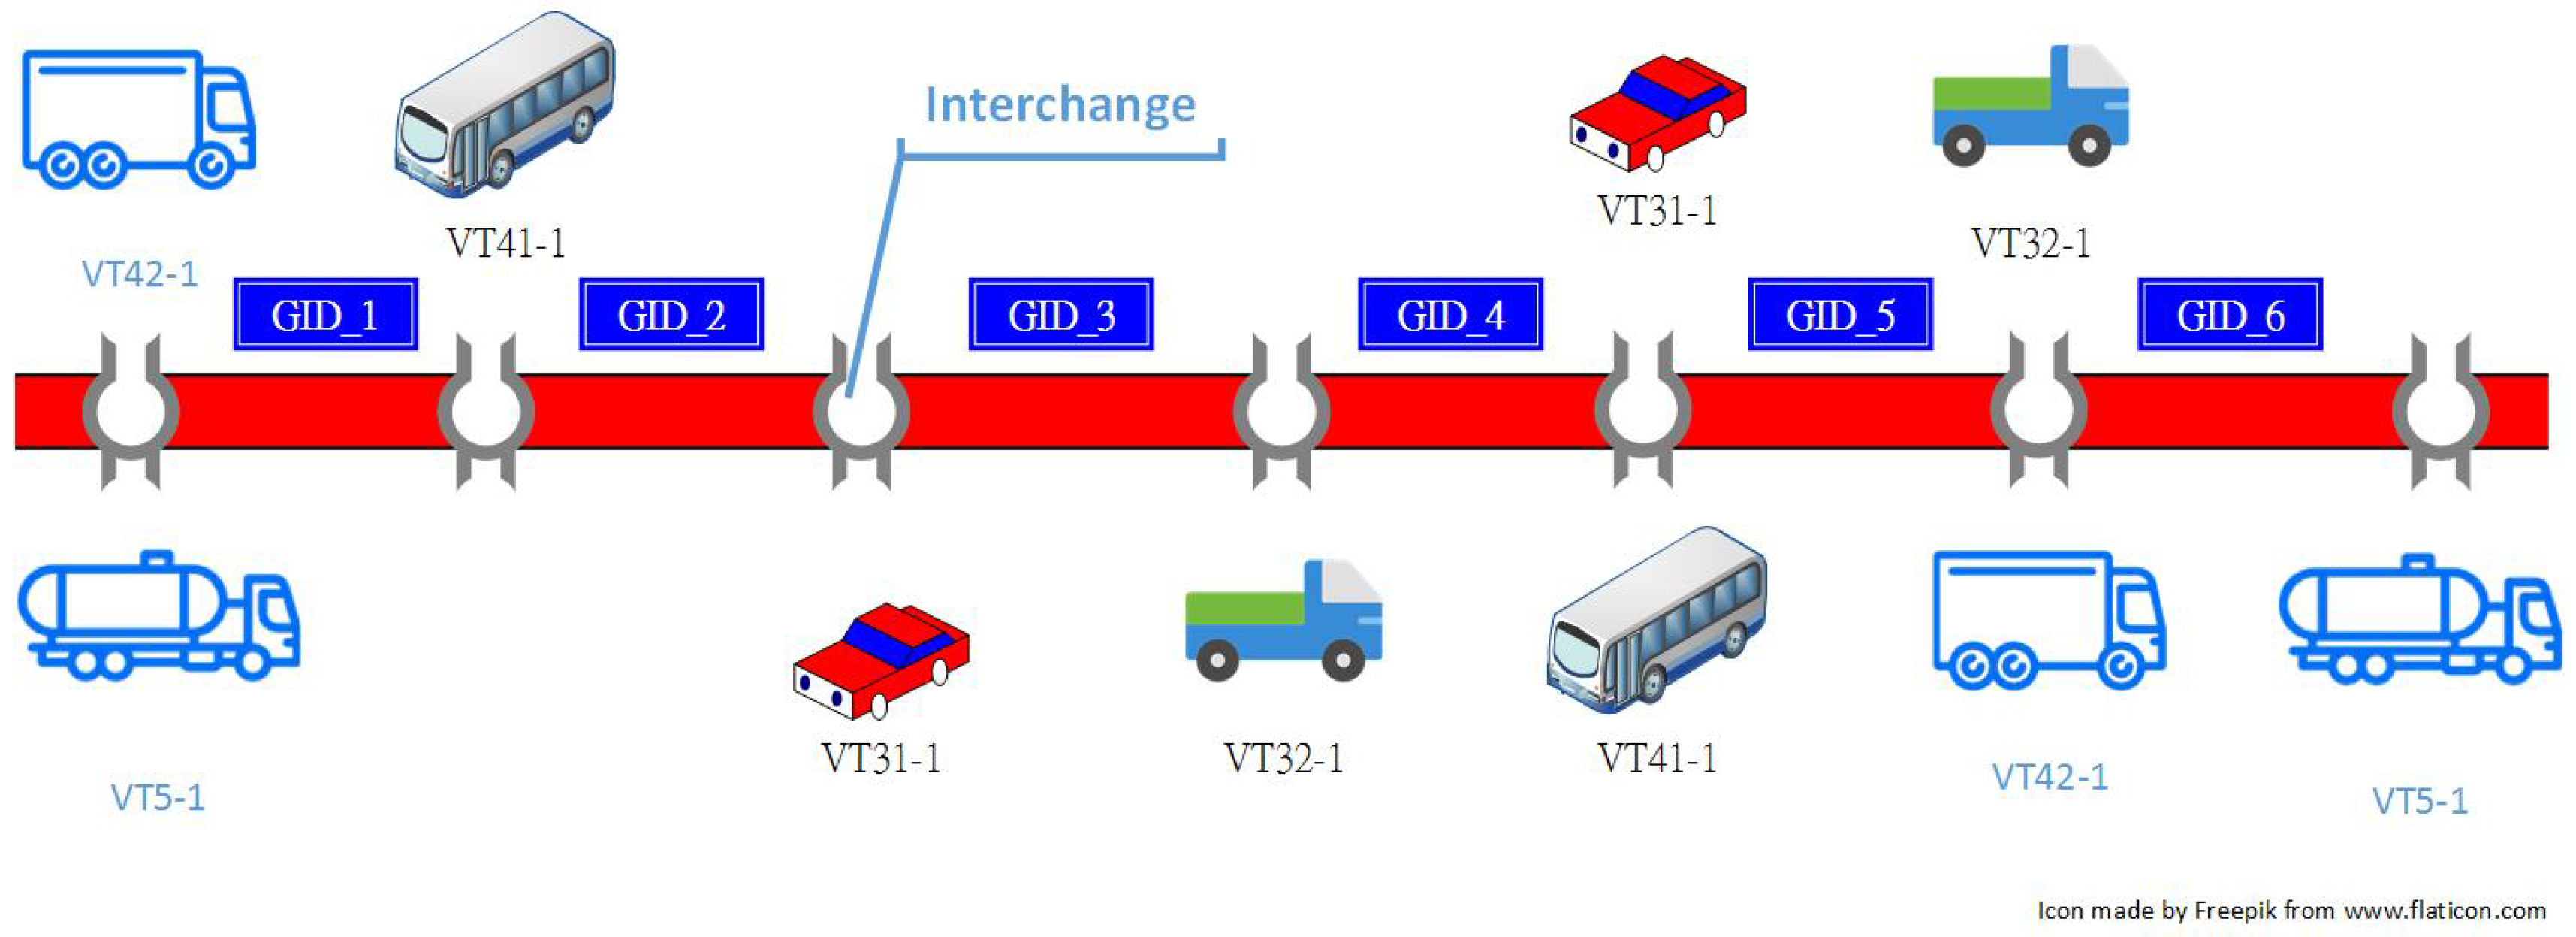
2.1. Gantry Timestamp Sequences from Traffic Data Collection System (TDCS)
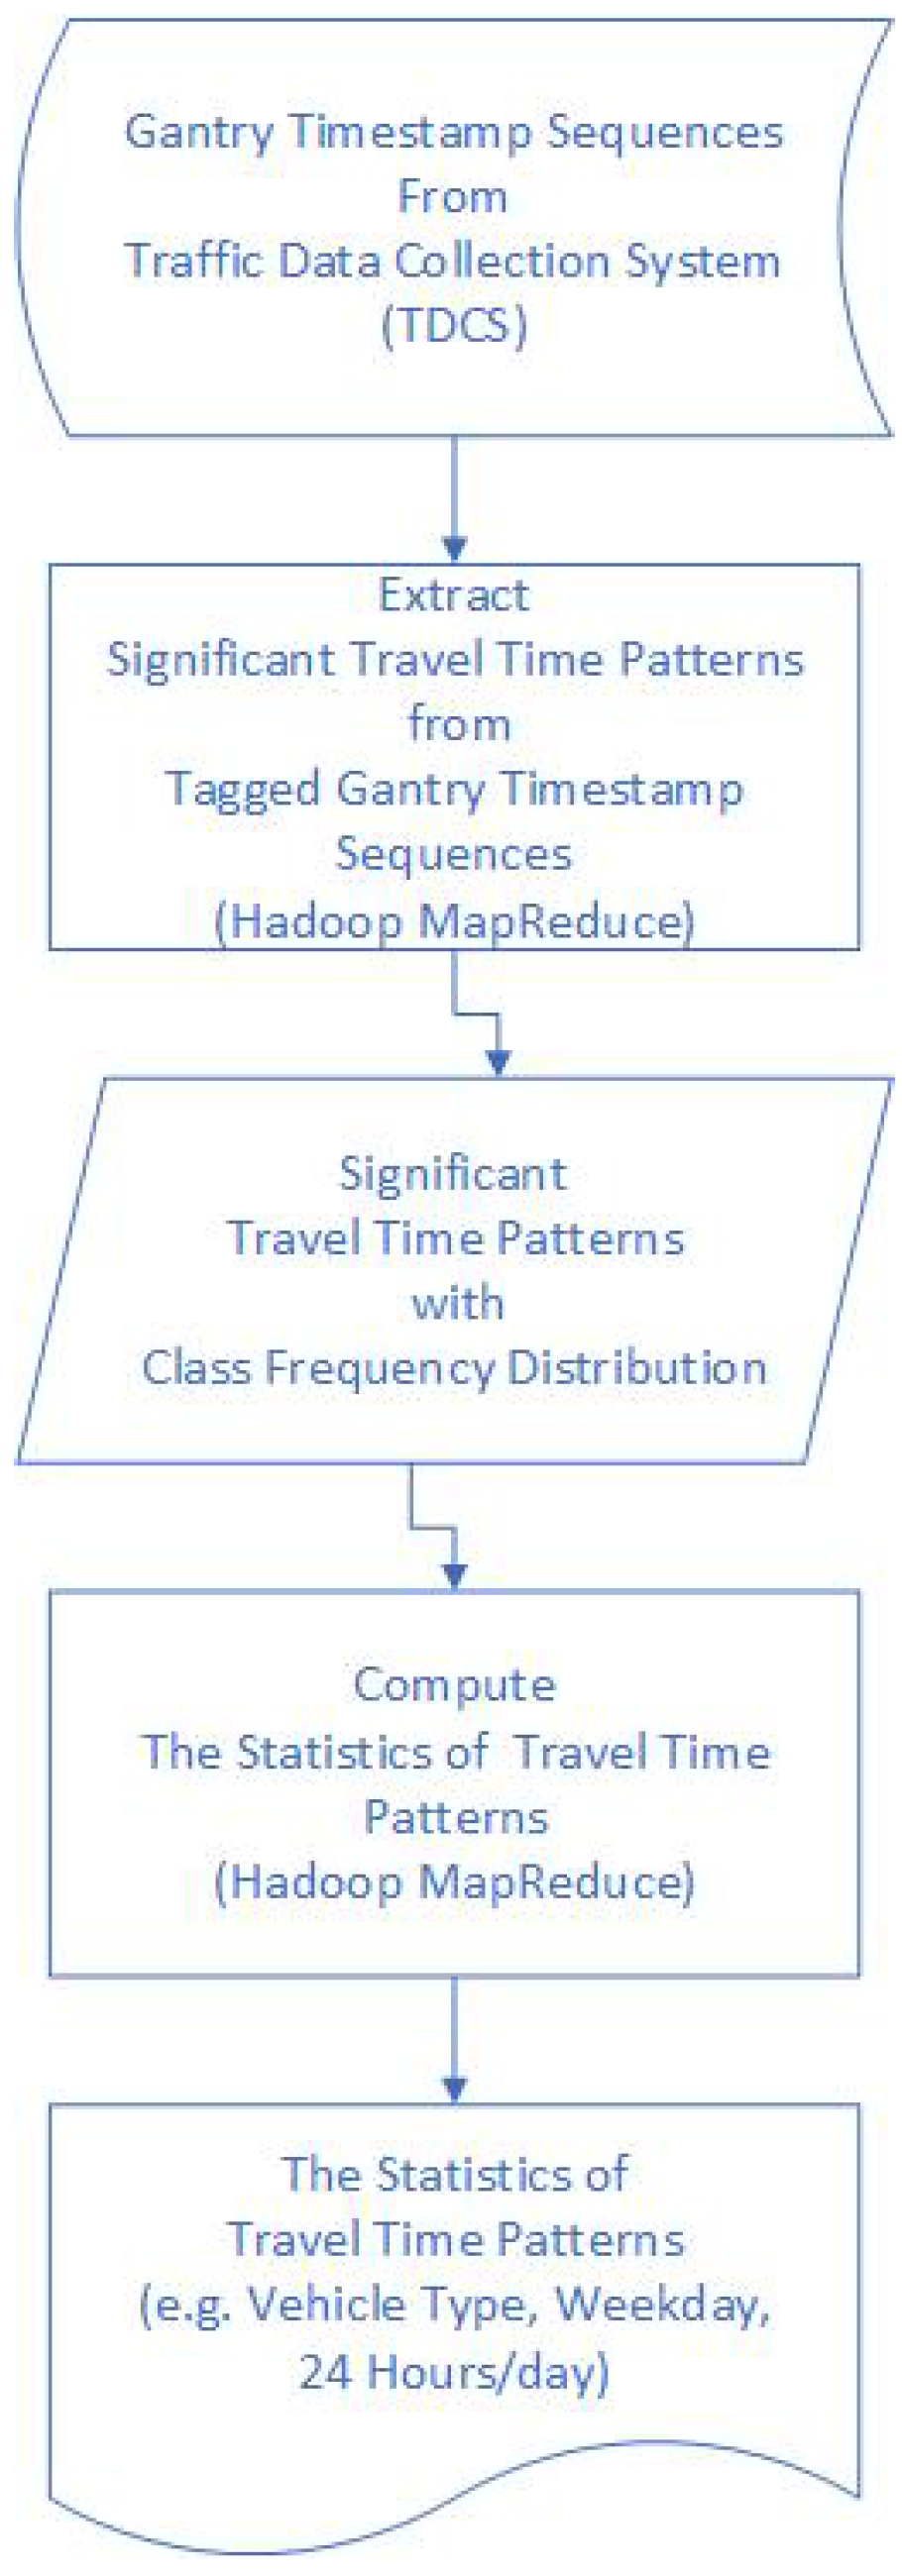
2.2. Extracting Significant Travel Time Patterns and Computing the Statistics of These Patterns
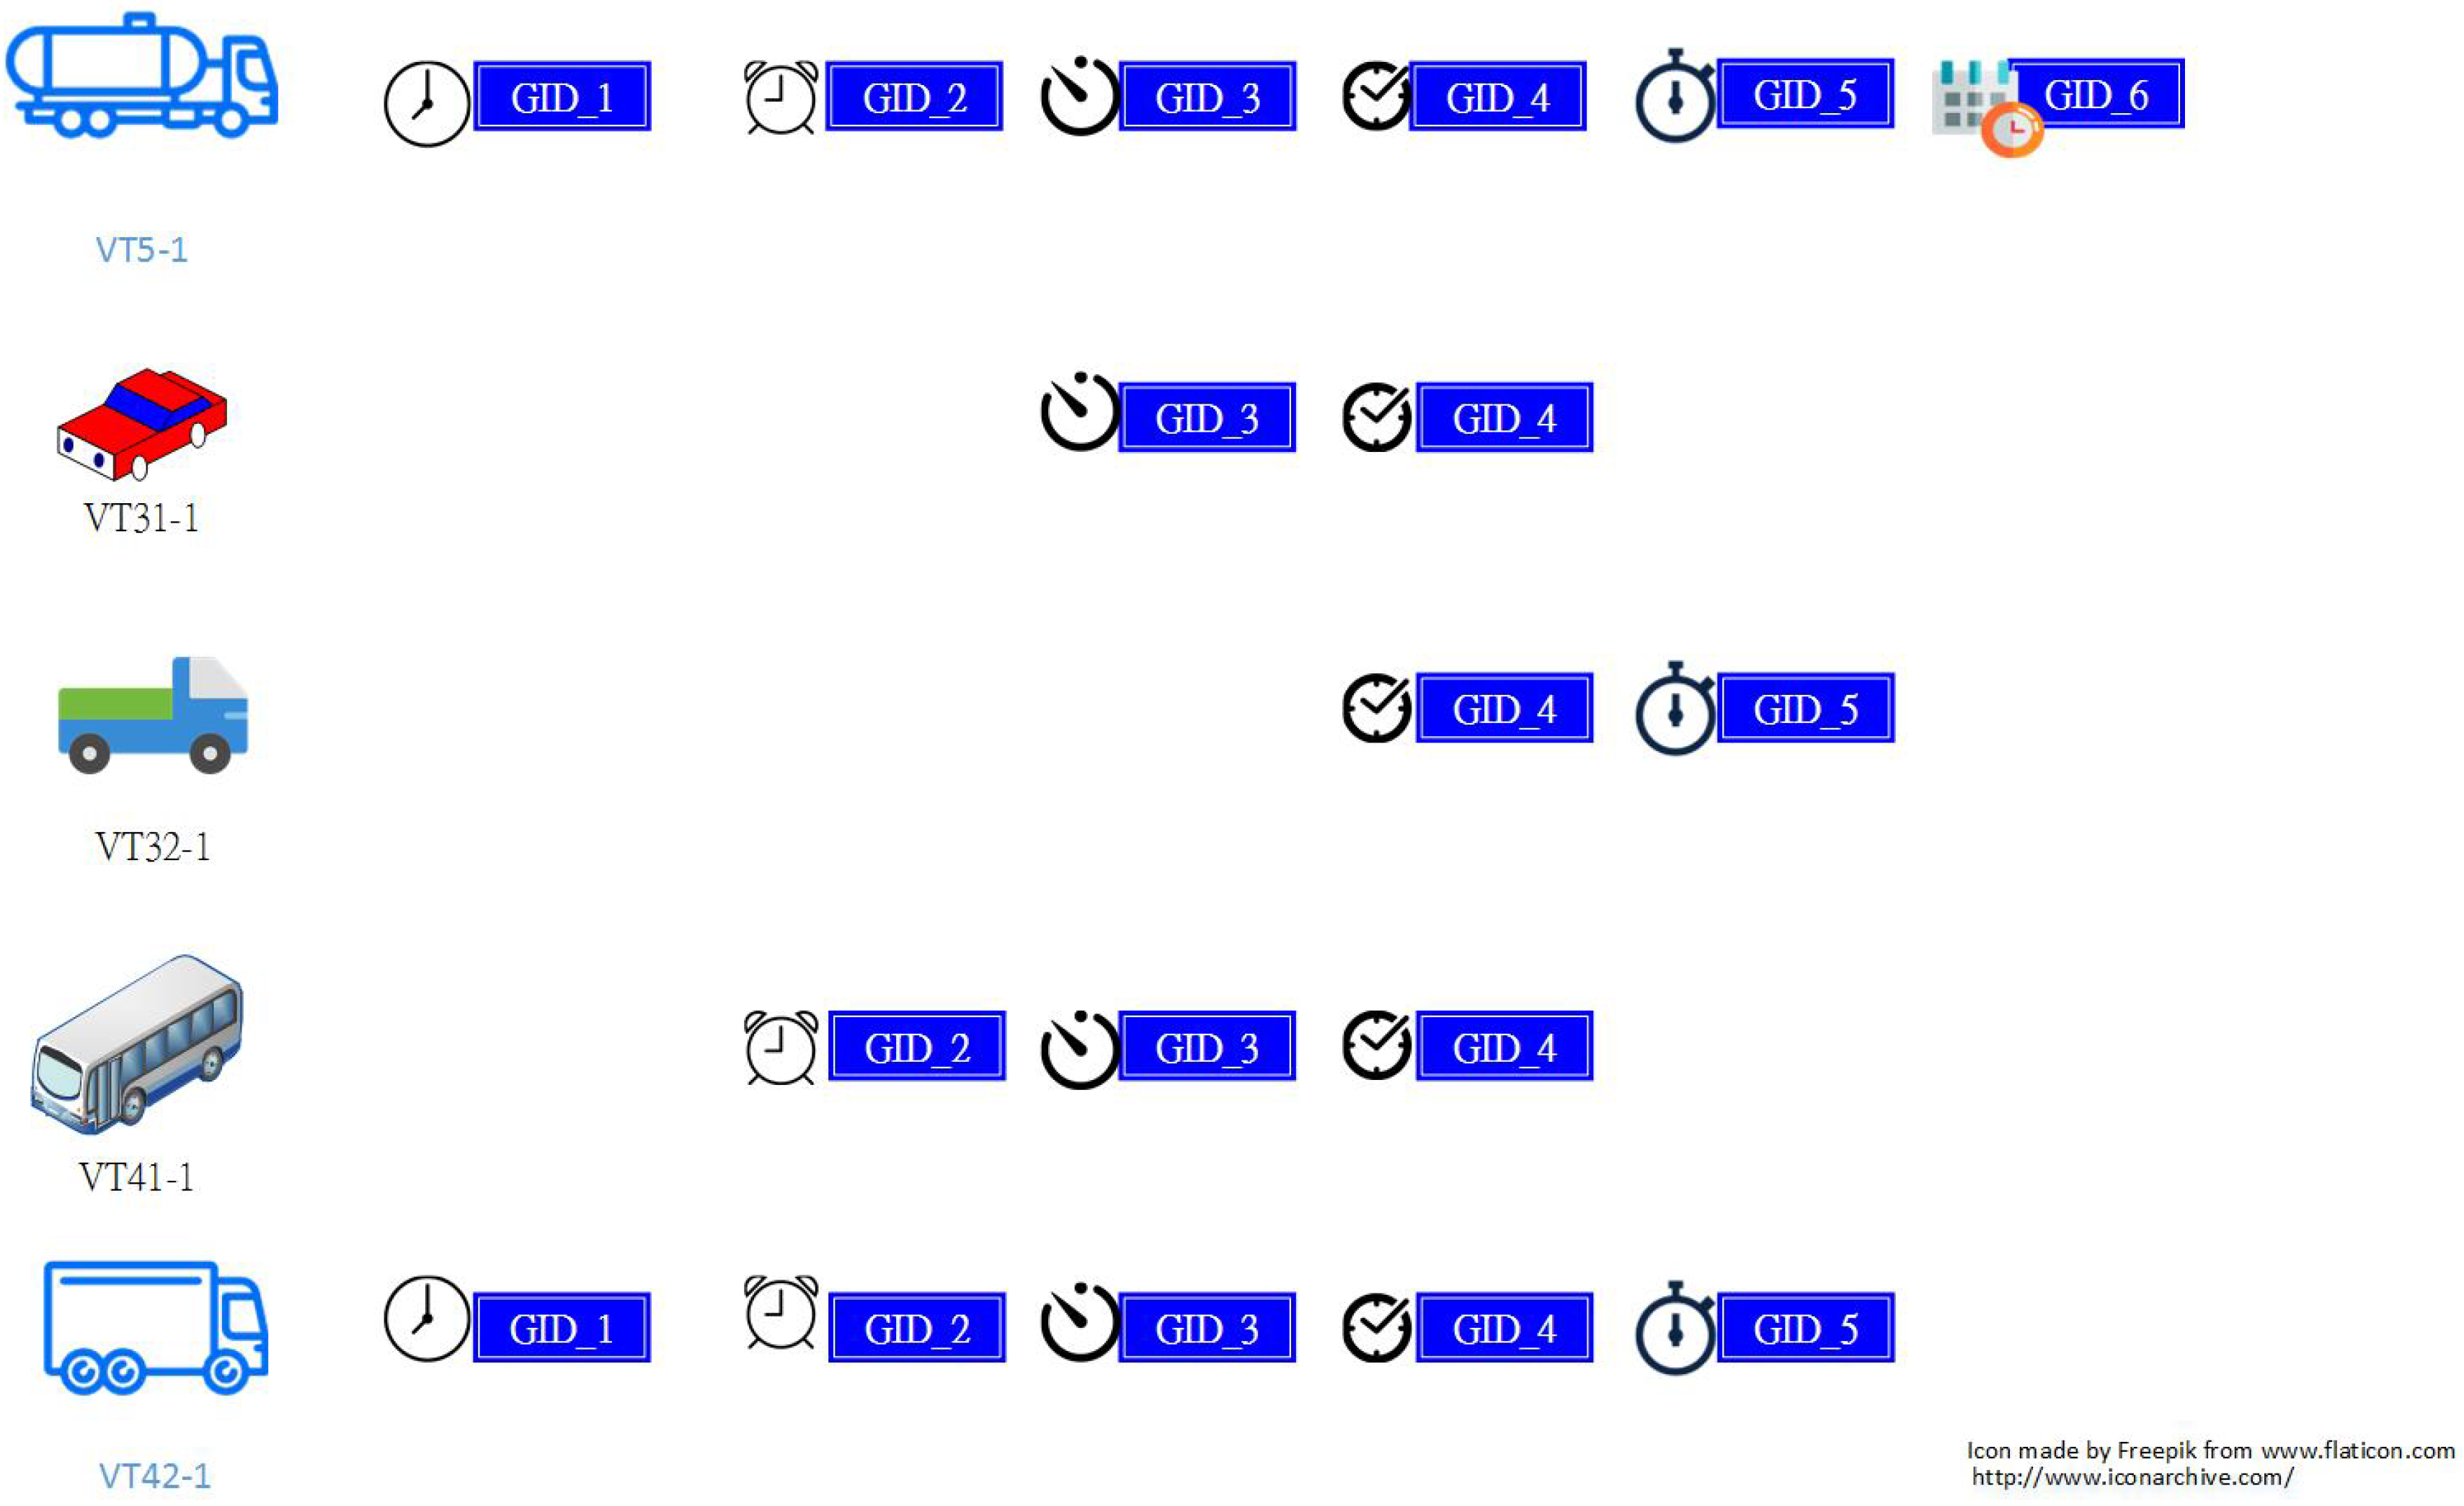
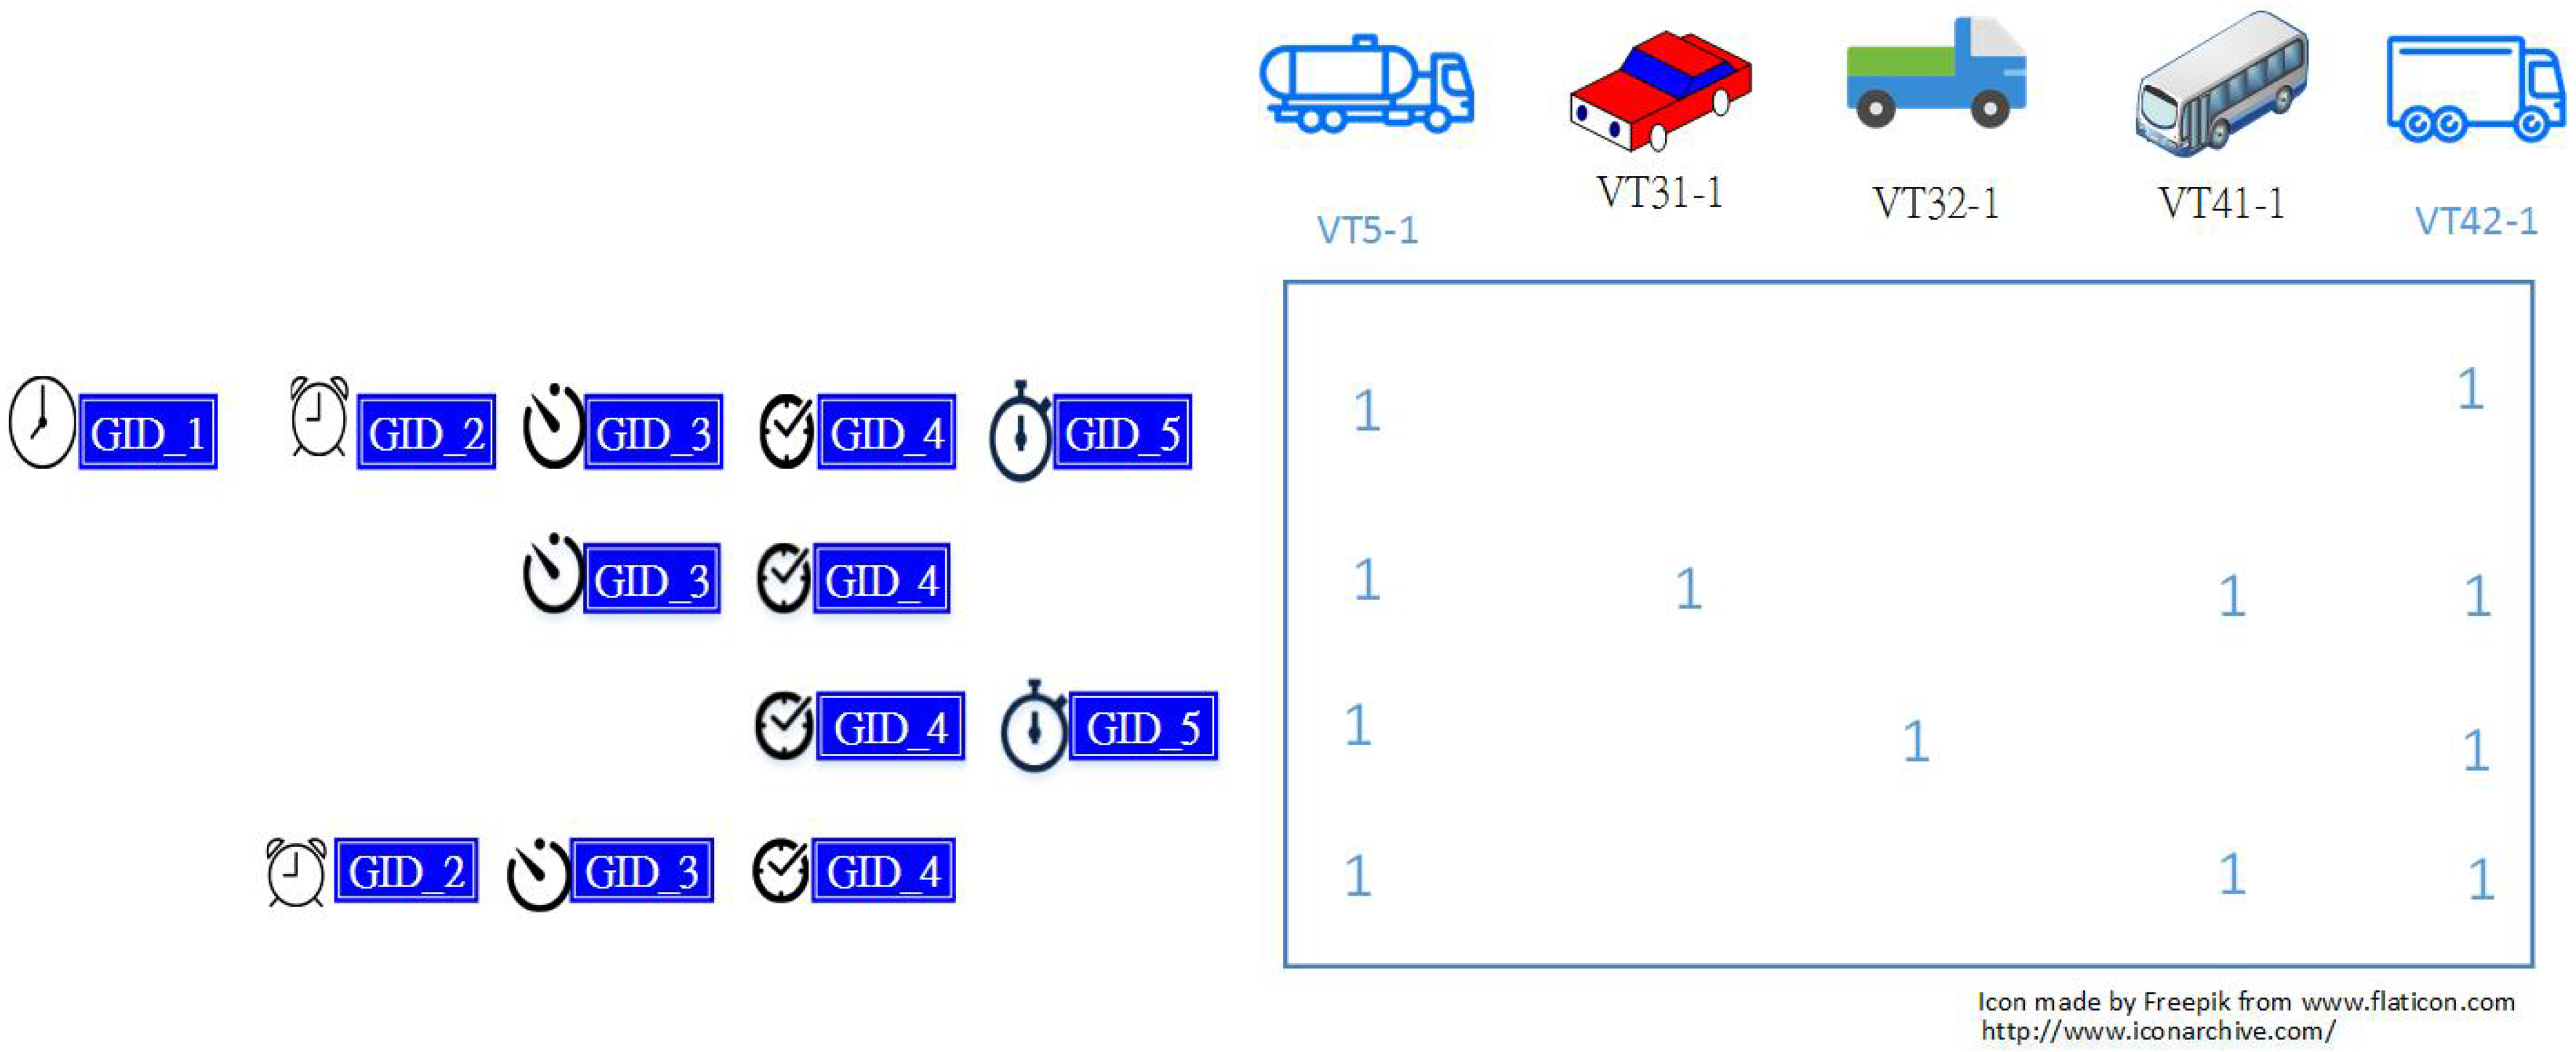
2.2.1. Extracting Significant Travel Time Patterns
2.2.2. Computing the Statistics of Significant Travel Time Patterns
3. Results
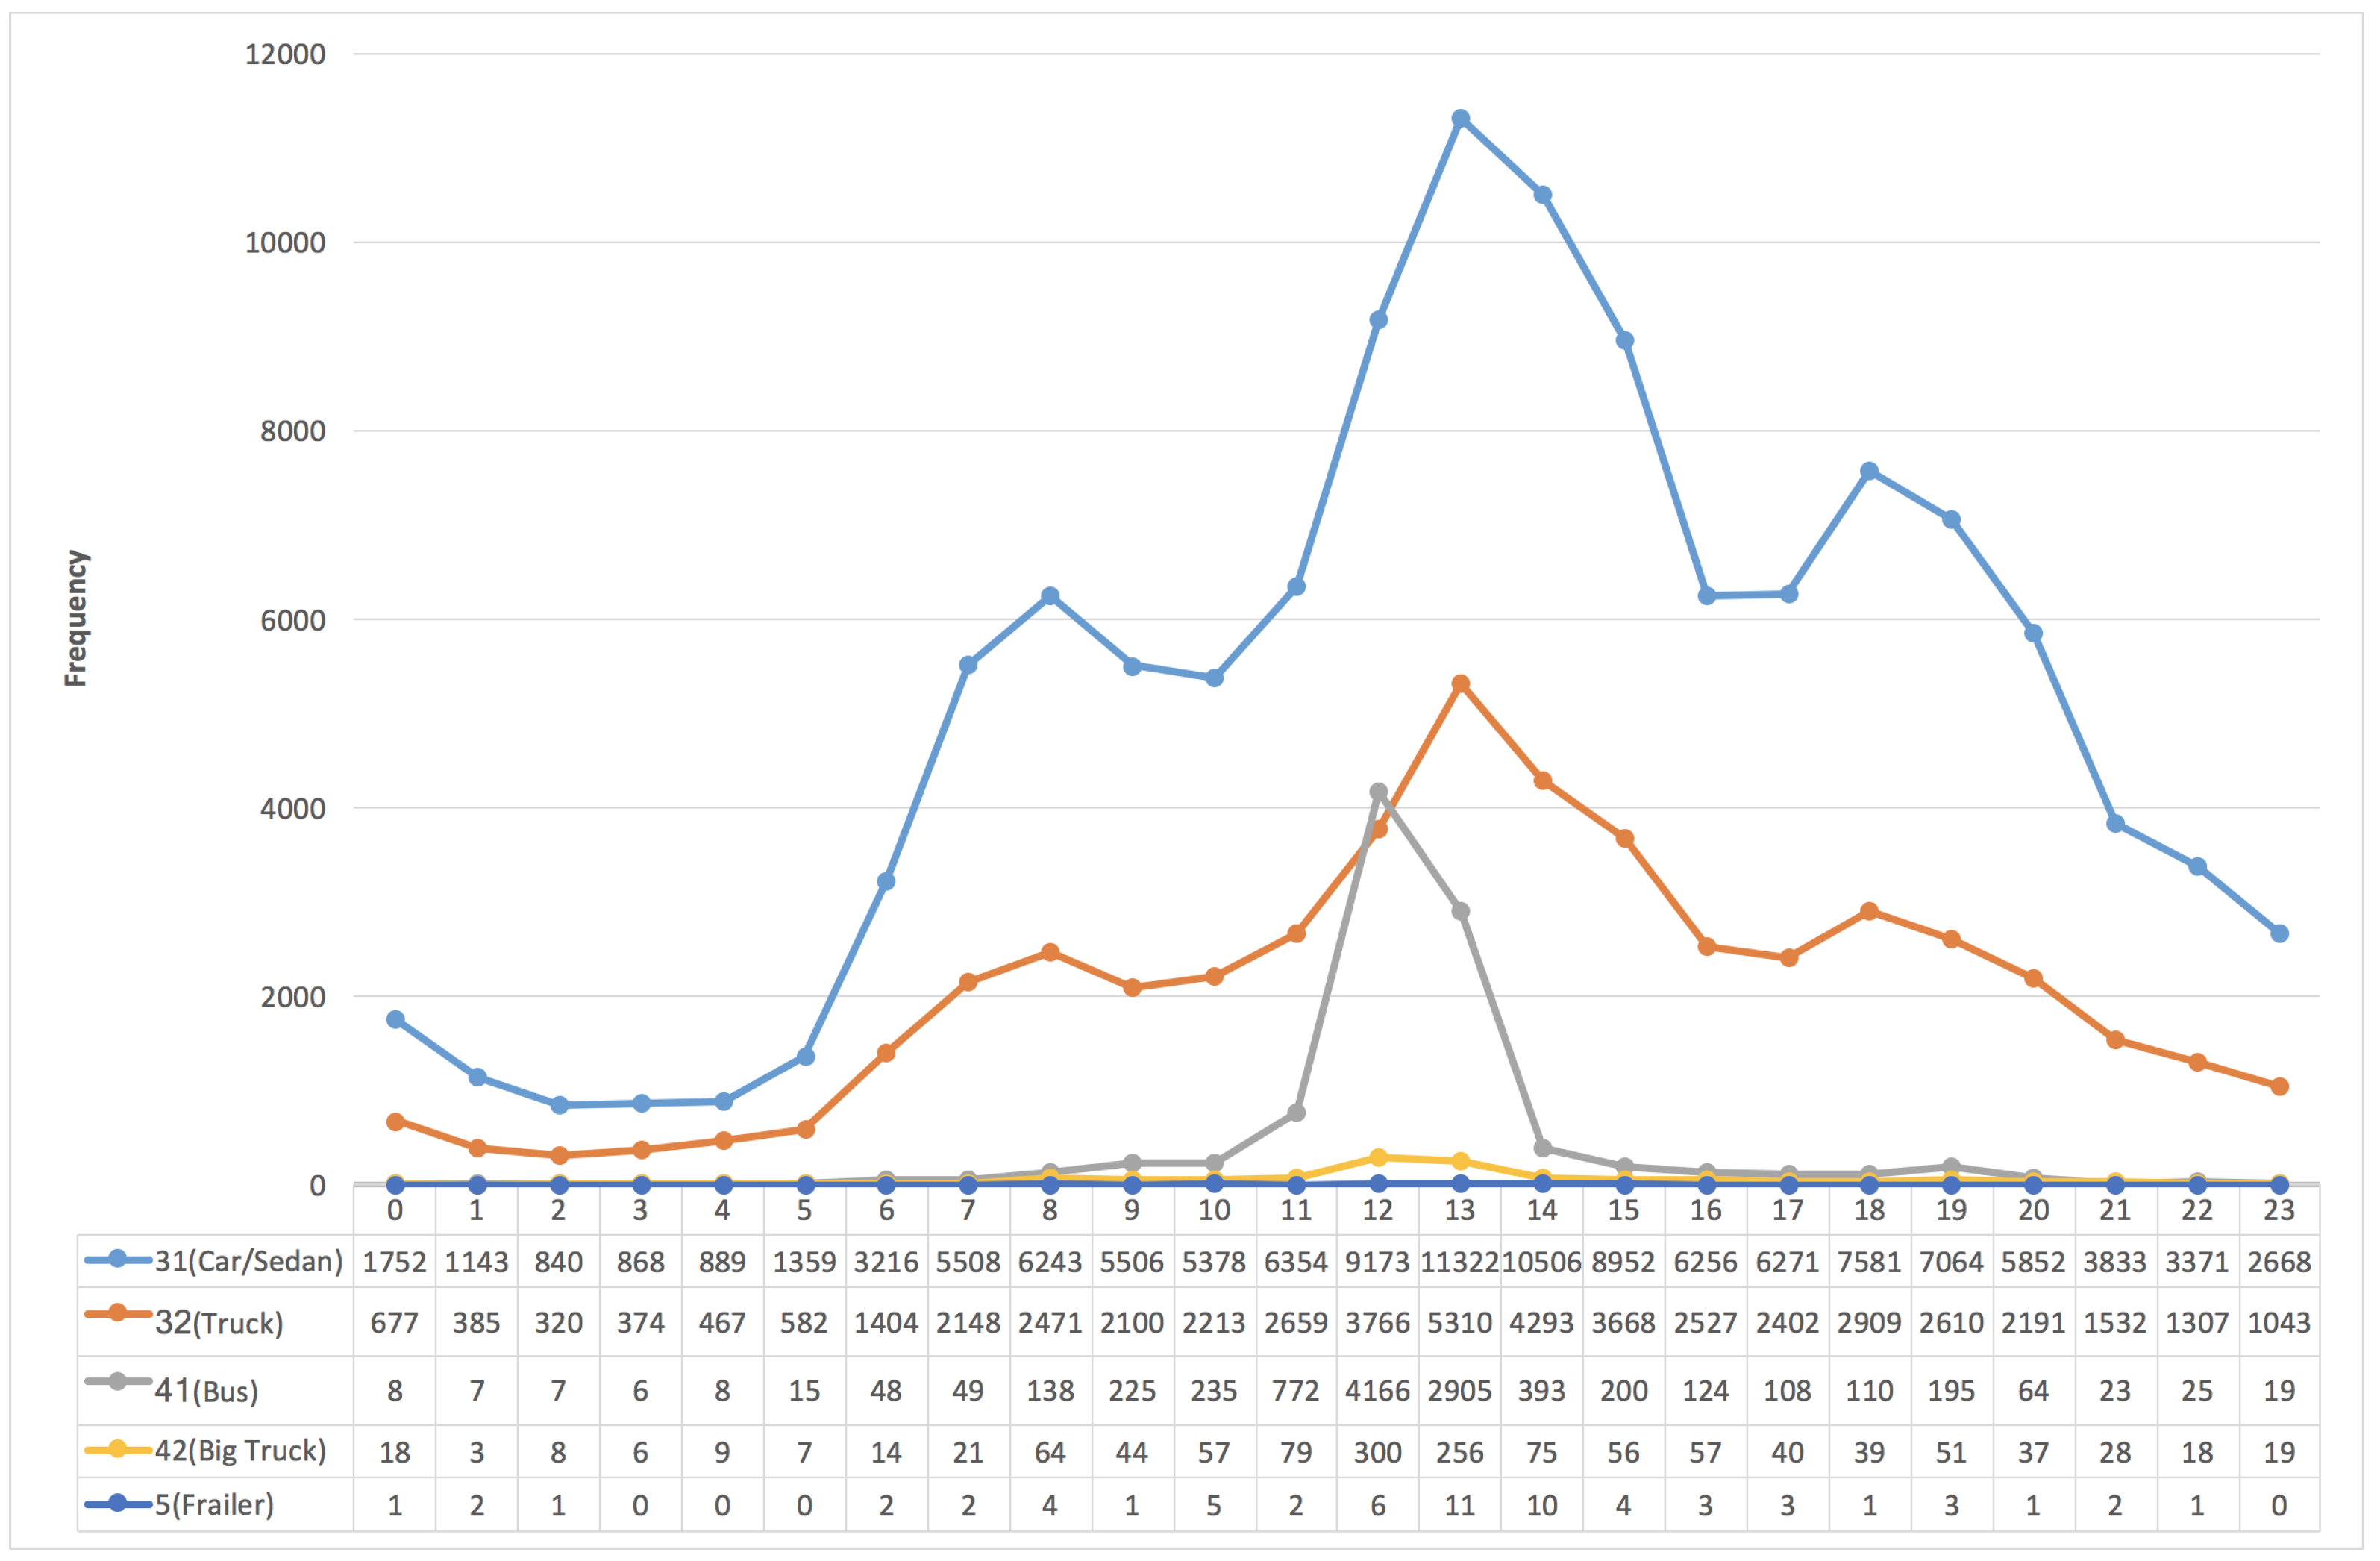
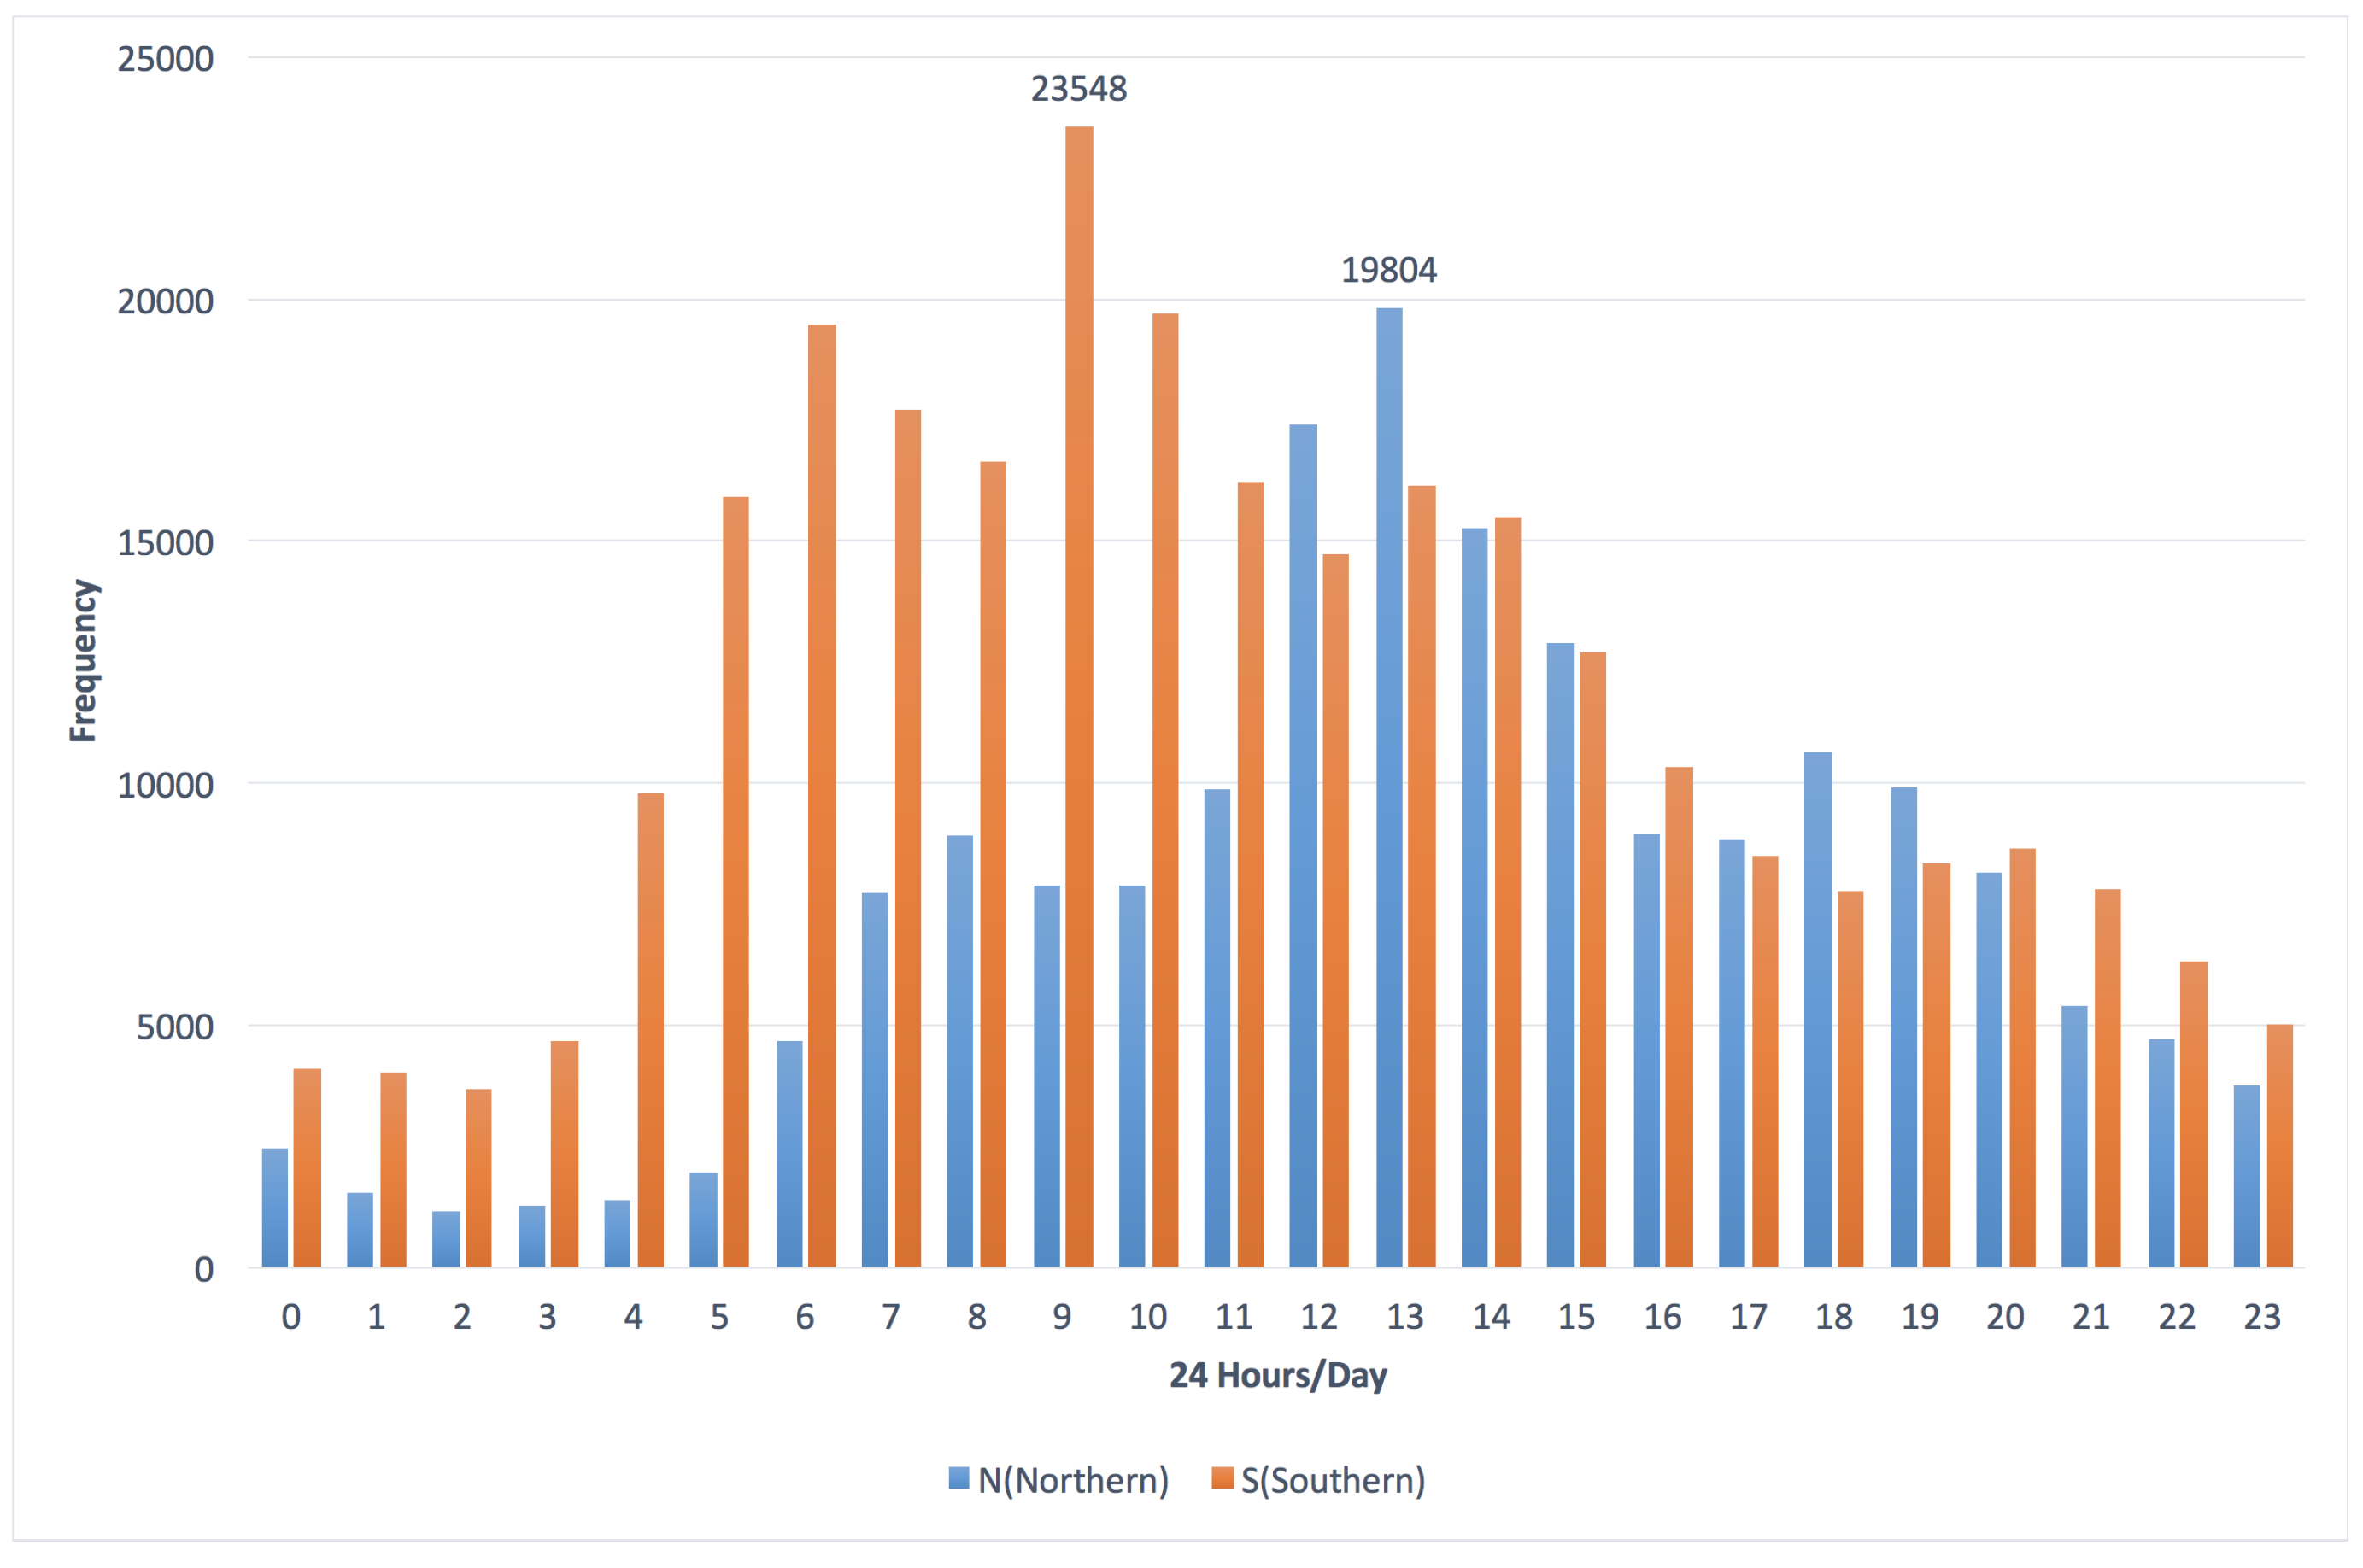
3.1. The Frequency Distribution of Vehicles vs. “the Southern and Northern Directions”
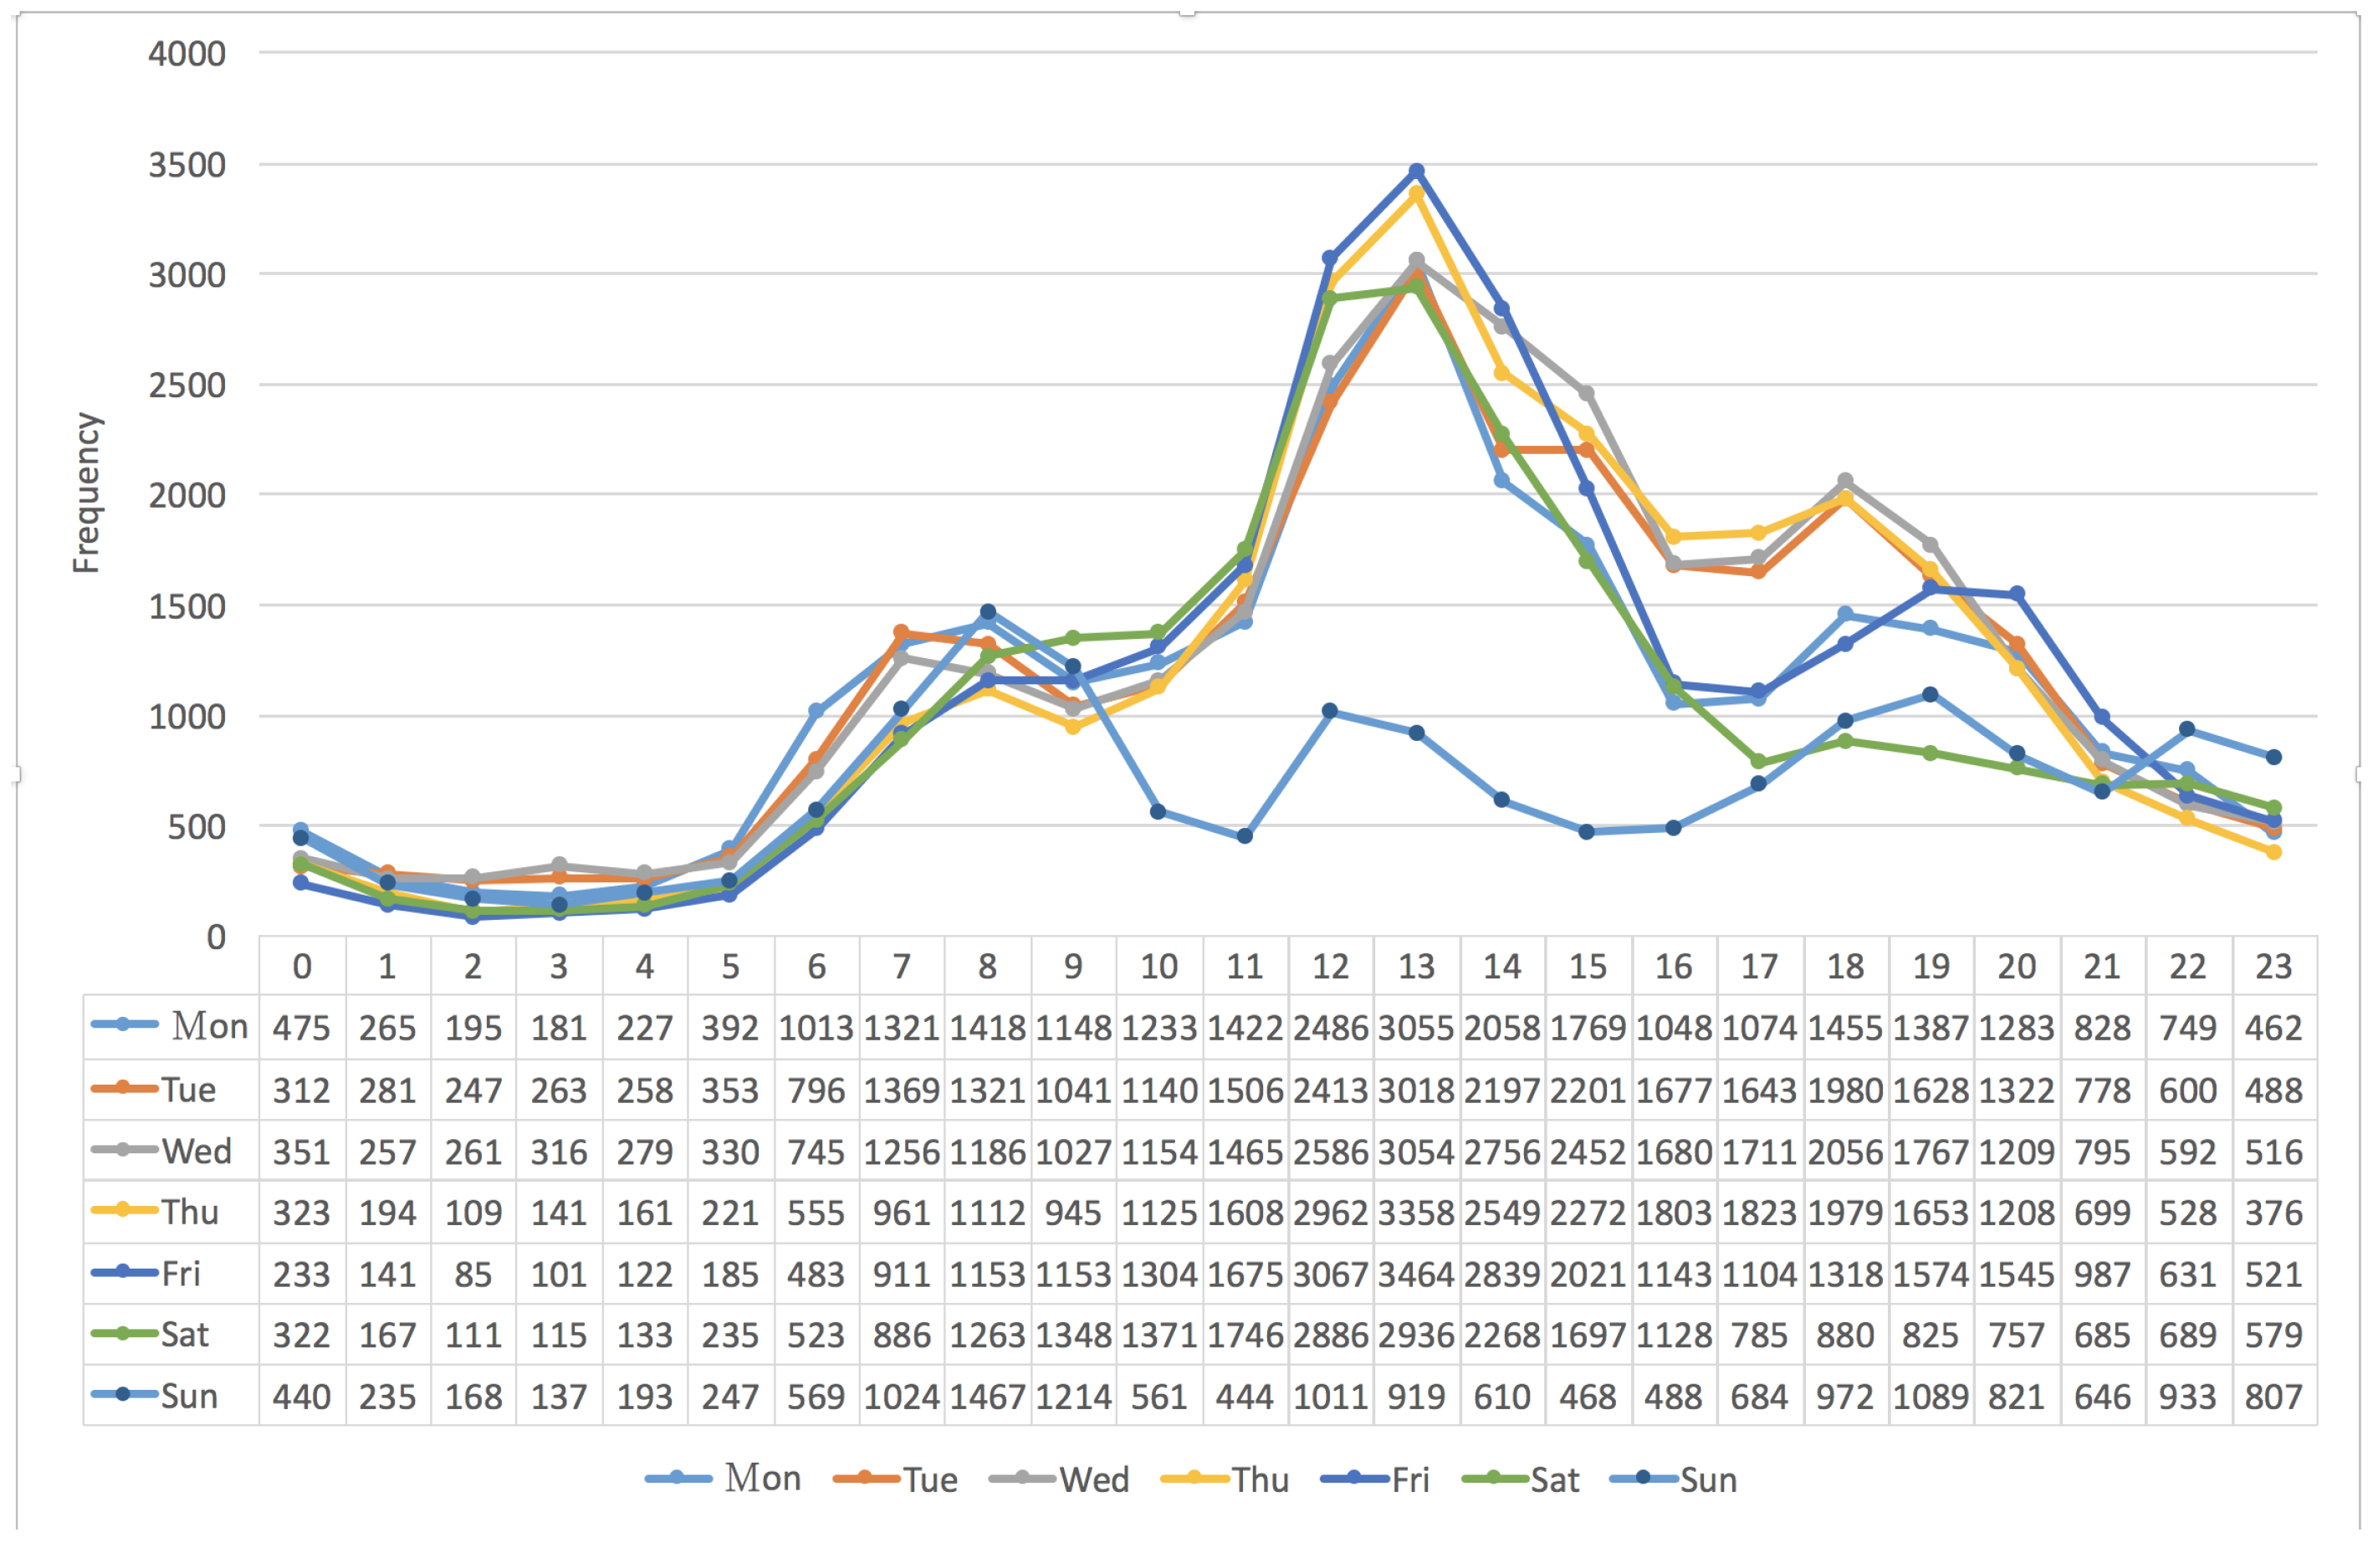
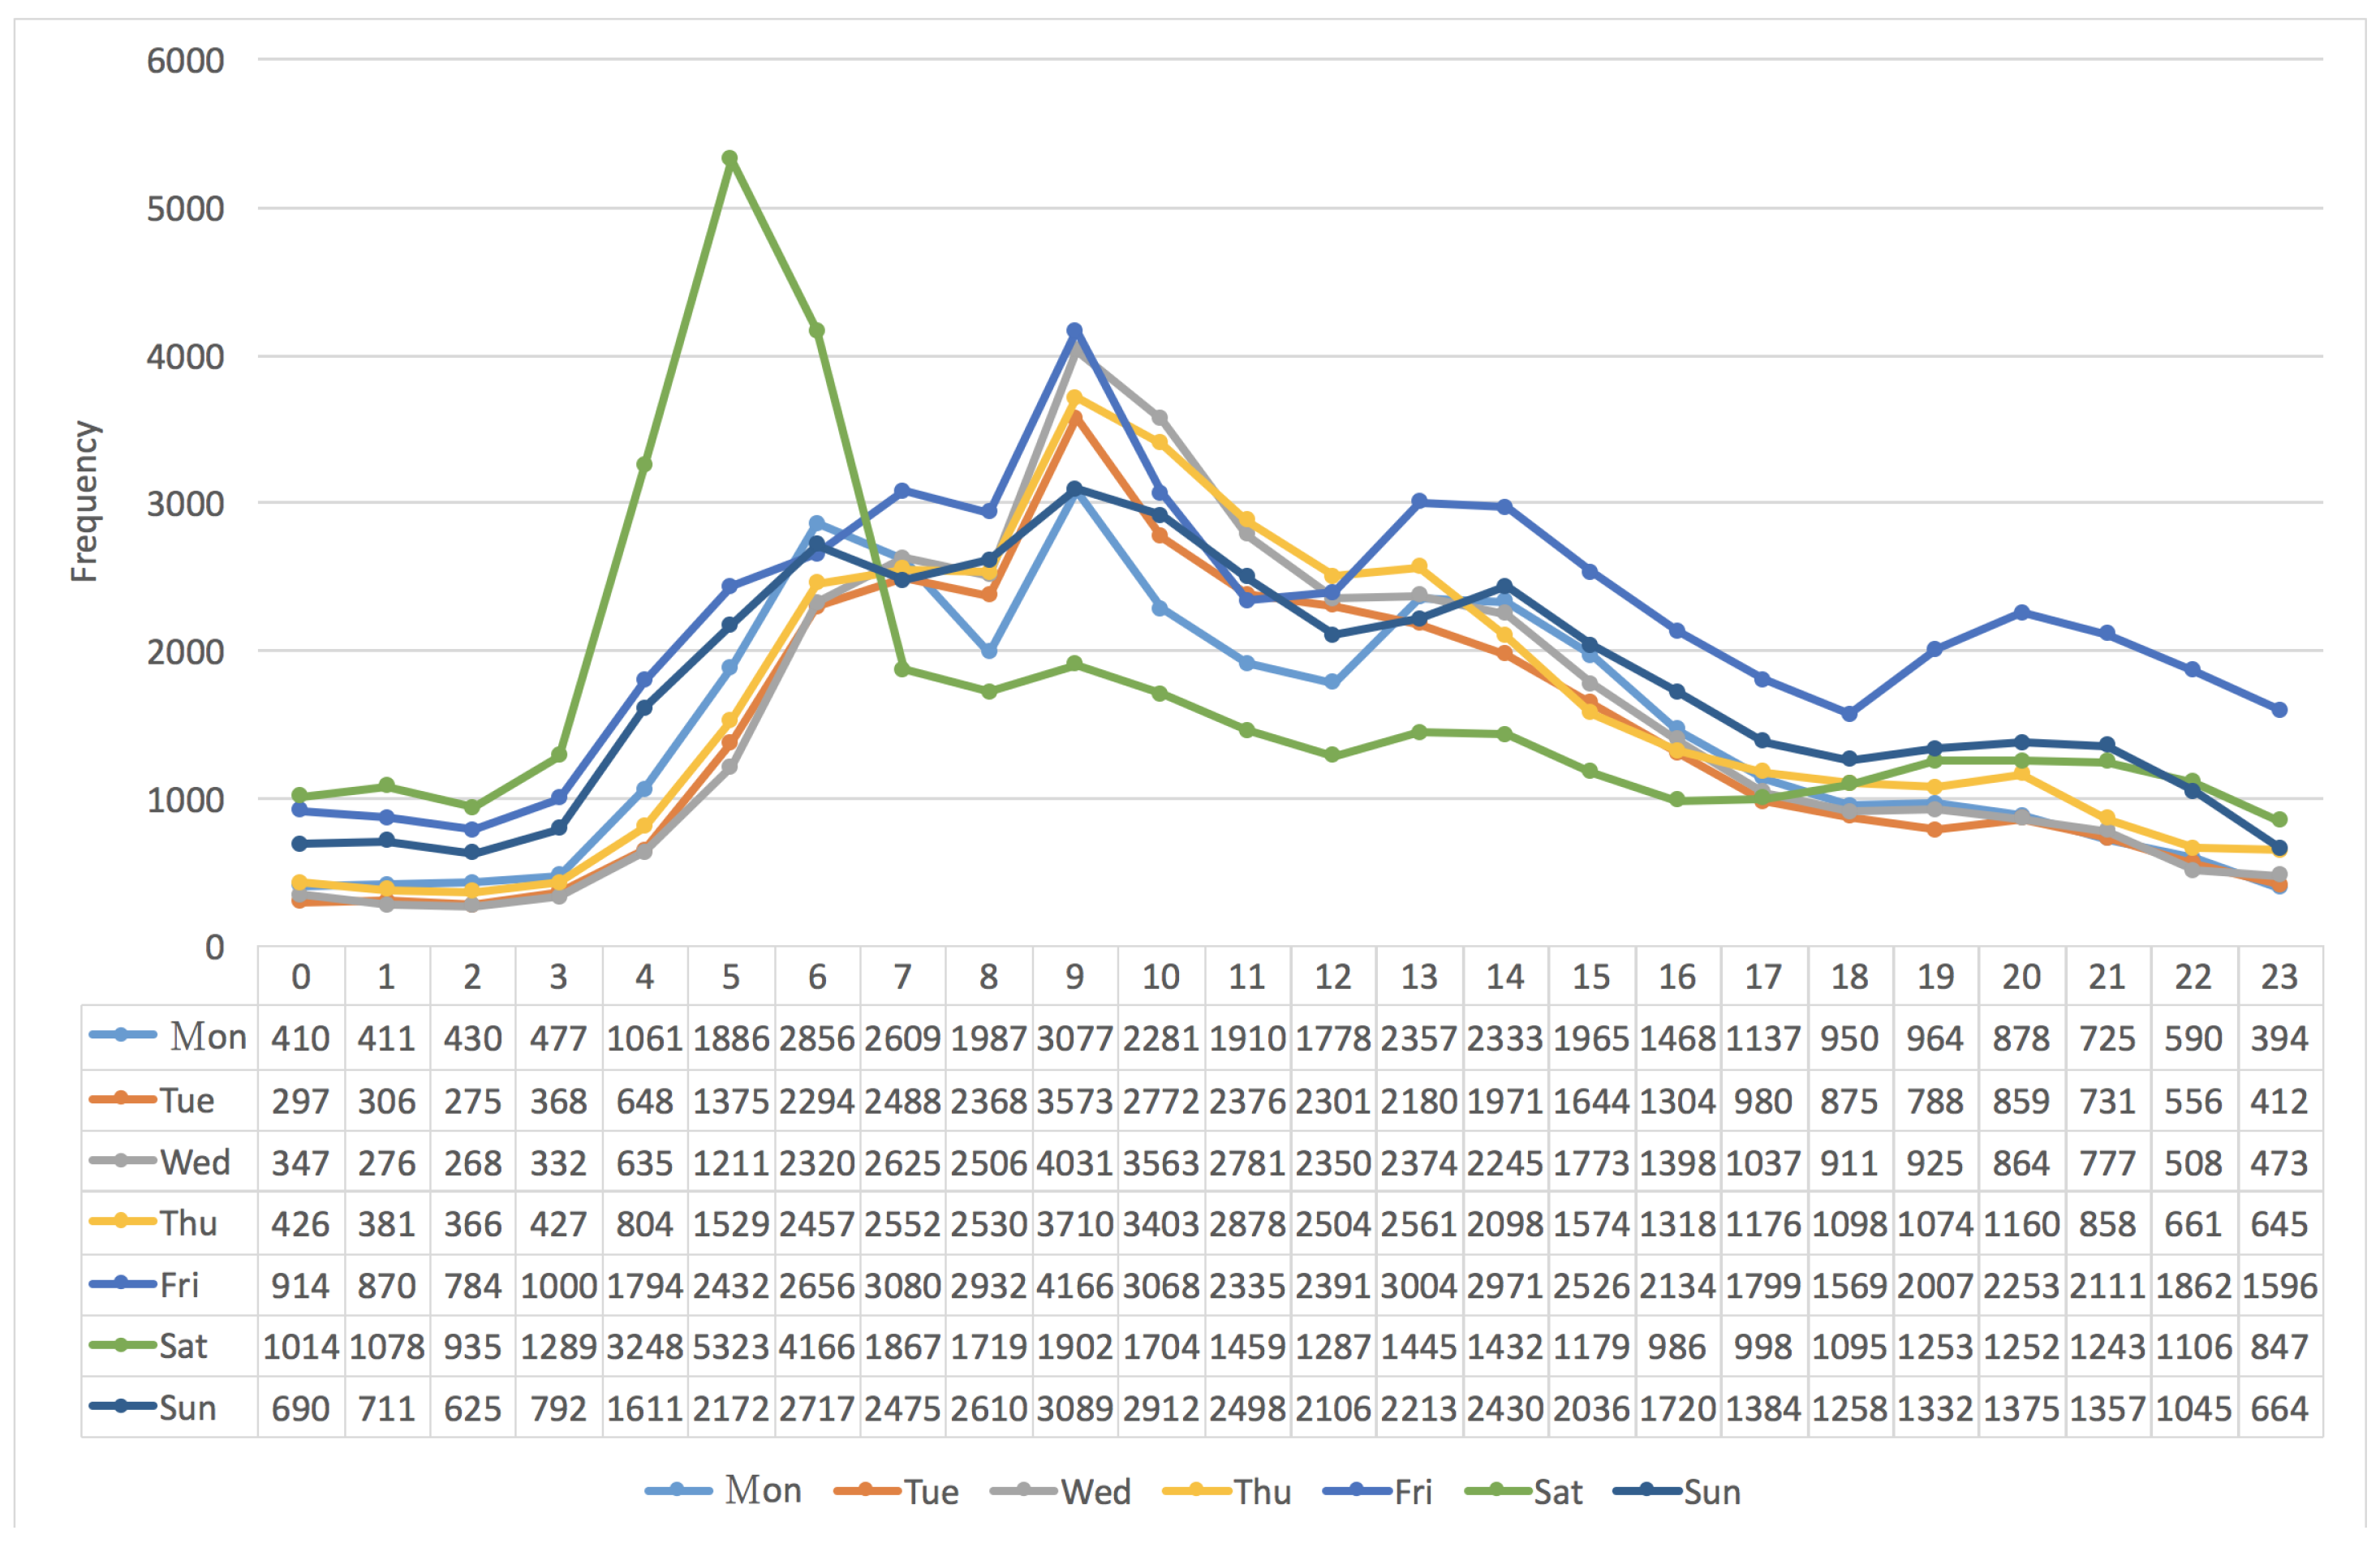
3.2. The Frequency Distribution of Vehicles vs. “Seven Days per Week”
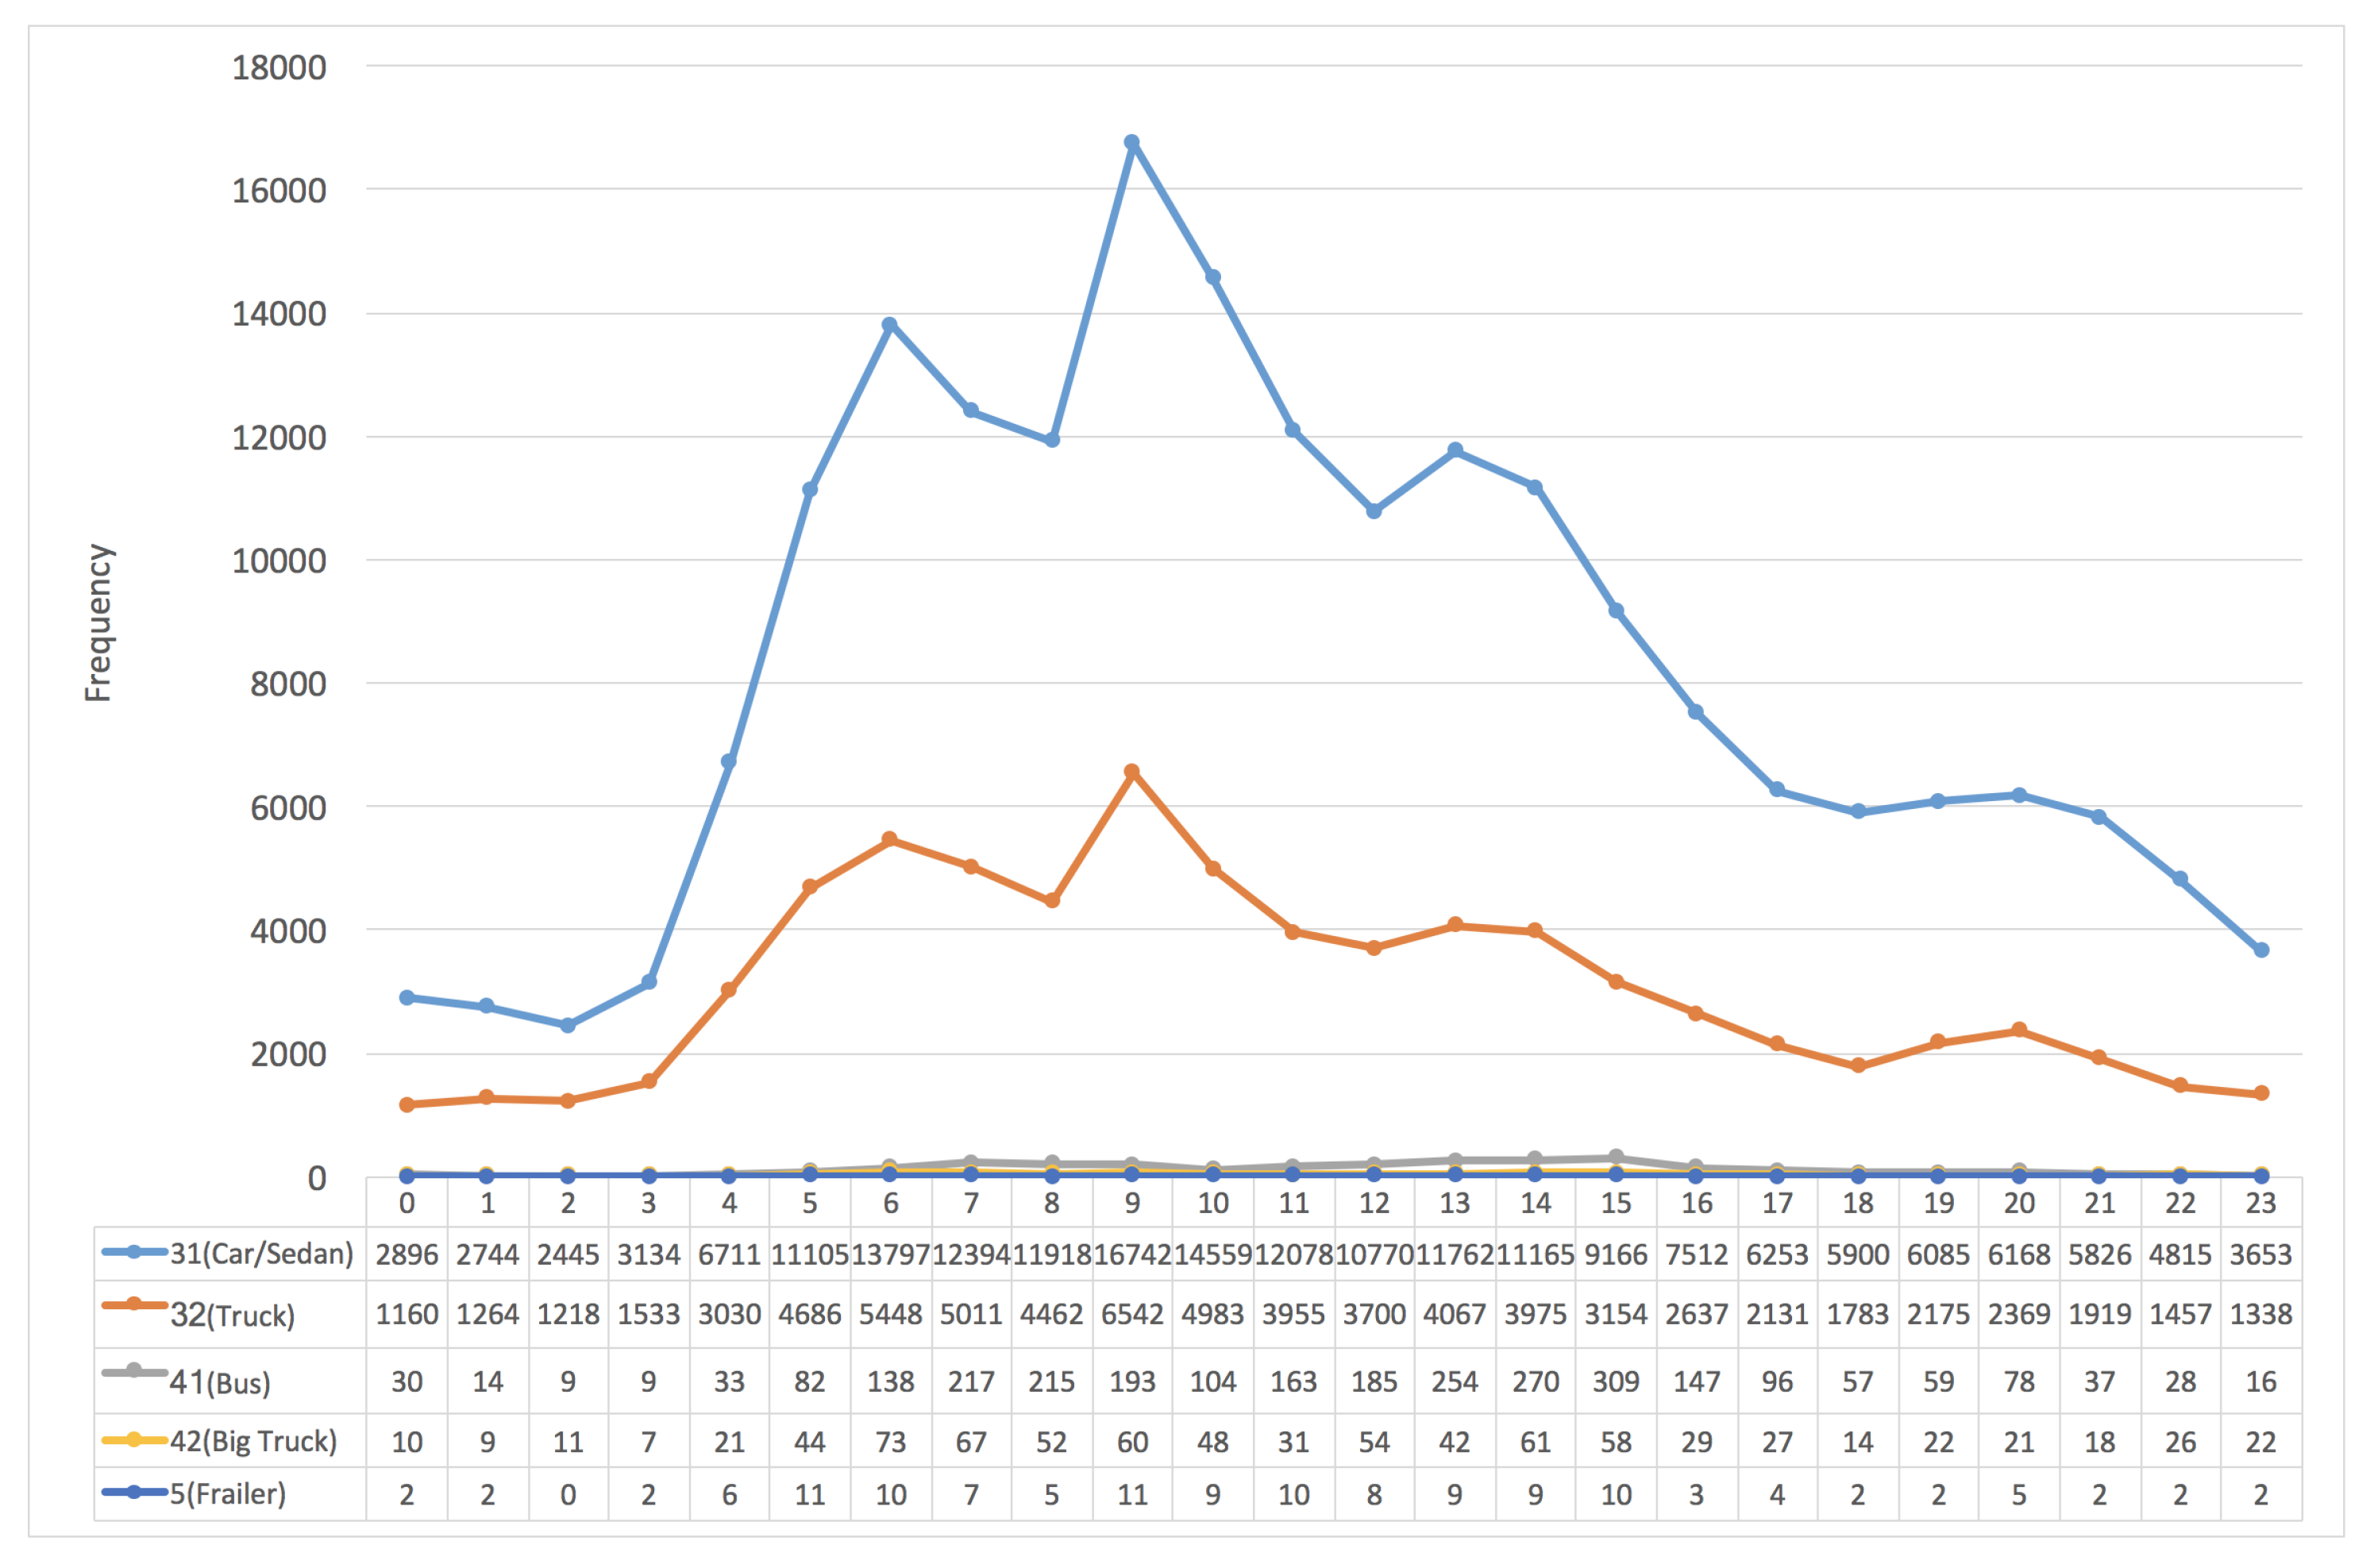
3.3. The Frequency Distribution of Vehicles vs. "VehicleTypes"
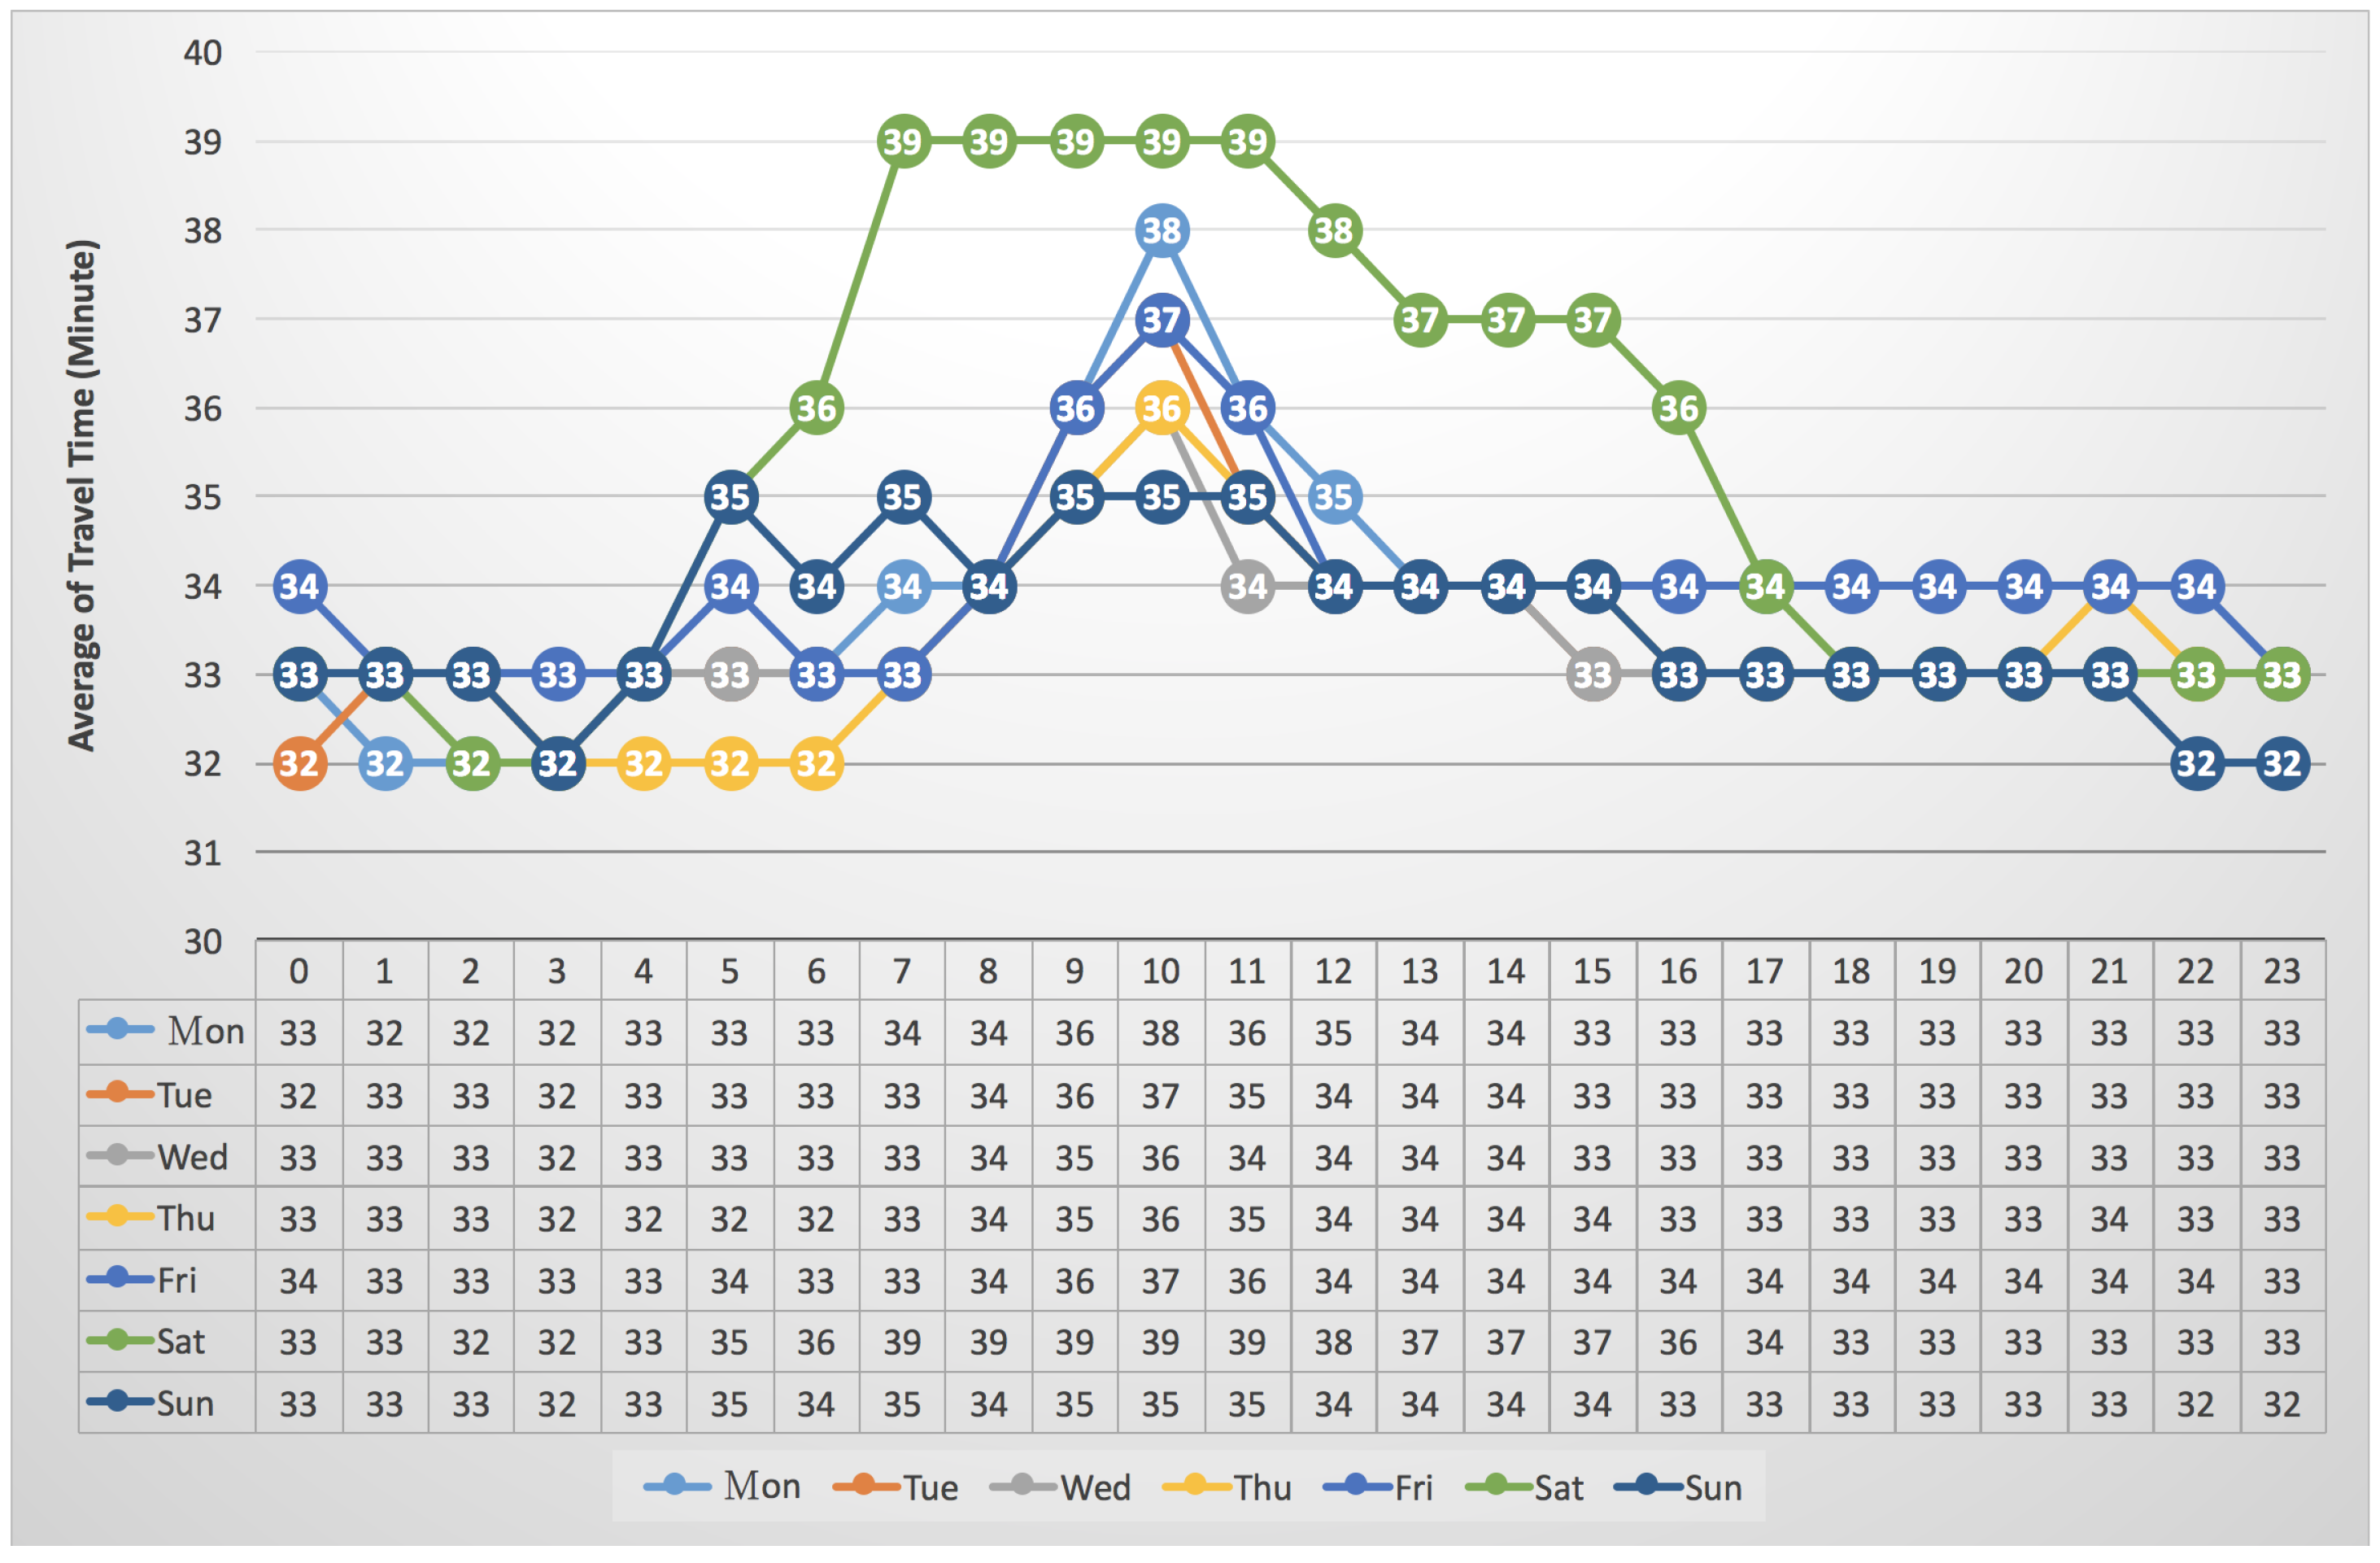
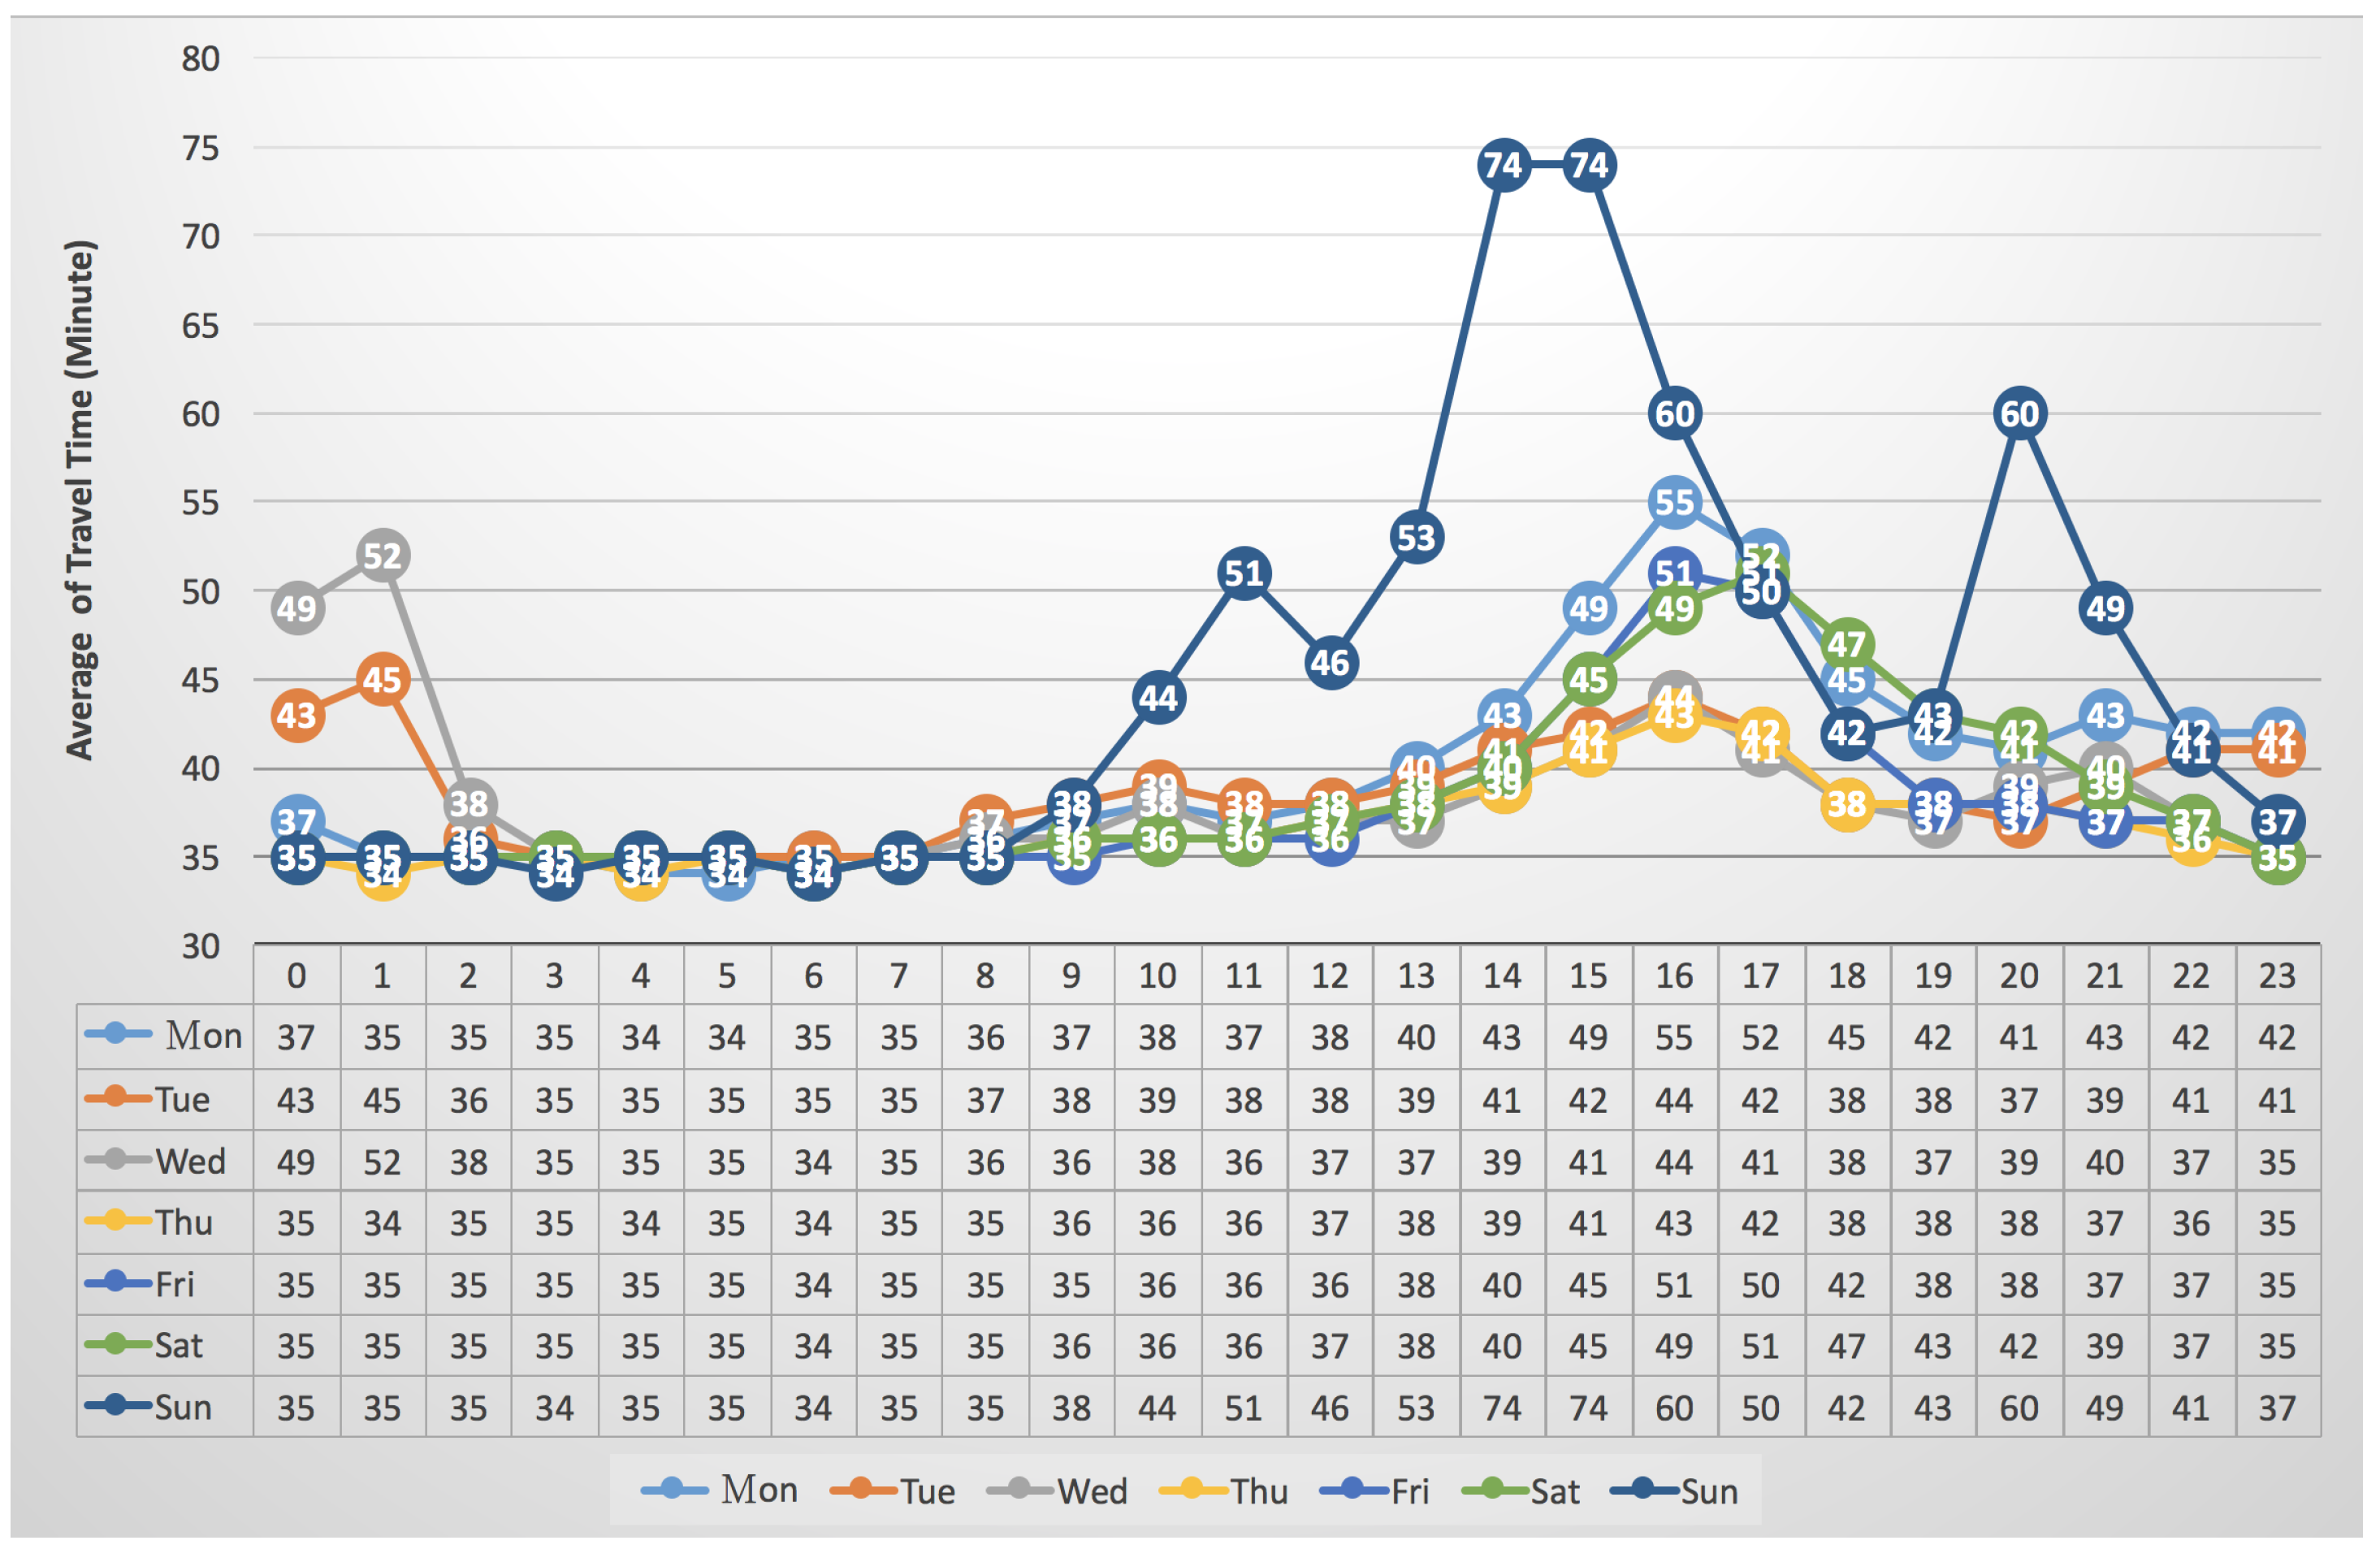
3.4. The Average of Travel Times vs. “Seven Days per Week”
3.5. Computational Time and Environment
4. Discussion
5. Conclusions
Acknowledgments
Author Contributions
Conflicts of Interest
References
- Braess, D. Über ein Paradoxon aus der Verkehrsplanung. Unternehmensforschung 1968, 12, 258–268. [Google Scholar] [CrossRef]
- Braess, D.; Nagurney, A.; Wakolbinger, T. On a Paradox of Traffic Planning. Transp. Sci. 2005, 39, 446–450. [Google Scholar] [CrossRef]
- Dafermos, S.; Nagurney, A. On some traffic equilibrium theory paradoxes. Transp. Res. Part B 1984, 18, 101–110. [Google Scholar] [CrossRef]
- Hwang, M.C.; Cho, H.J. The Classical Braess Paradox Problem Revisited: A Generalized Inverse Method on Non-Unique Path Flow Cases. Netw. Spat. Econ. 2016, 16, 605–622. [Google Scholar] [CrossRef]
- Vlahogianni, E.I.; Karlaftis, M.G.; Golias, J.C. Short-term traffic forecasting: Where we are and where we’re going. Transp. Res. Part C 2014, 43 Pt 1, 3–19. [Google Scholar] [CrossRef]
- Wang, J.D.; Hwang, M.C. A Novel Approach to Extract Significant Time Intervals of Vehicles from Superhighway Gantry Timestamp Sequences. In Proceedings of the 2017 IEEE International Conference on Applied System Innovation, Sapporo, Japan, 13–17 May 2017; pp. 1679–1682. [Google Scholar]
- Wang, J.D. Extracting significant pattern histories from timestamped texts using MapReduce. J. Supercomput. 2016, 72, 3236–3260. [Google Scholar] [CrossRef]
- Gusfield, D. Algorithms on Strings, Trees, and Sequences : Computer Science and Computational Biology; Cambridge University Press: Cambridge, UK, 1997. [Google Scholar]
- Gunarathne, T. Hadoop MapReduce v2 Cookbook, 2nd ed.; Packt Publishing: Birmingham, UK, 2015. [Google Scholar]
- Wang, J.D. External memory approach to compute the maximal repeats across classes from DNA sequences. Asian J. Health Inf. Sci. 2006, 1, 276–295. [Google Scholar]
- Li, F.; Ooi, B.C.; Özsu, M.T.; Wu, S. Distributed Data Management Using MapReduce. ACM Comput. Surv. 2014, 46, 31:1–31:42. [Google Scholar] [CrossRef]
- Qin, L.; Yu, J.X.; Chang, L.; Cheng, H.; Zhang, C.; Lin, X. Scalable Big Graph Processing in MapReduce. In Proceedings of the 2014 ACM SIGMOD International Conference on Management of Data, Snowbird, UT, USA, 22–27 June 2014; pp. 827–838. [Google Scholar]
- Tan, Y.S.; Tan, J.; Chng, E.S.; Lee, B.S.; Li, J.; Date, S.; Chak, H.P.; Xiao, X.; Narishige, A. Hadoop framework: Impact of data organization on performance. Software 2013, 43, 1241–1260. [Google Scholar] [CrossRef]
- Cormen, T.H.; Leiserson, C.E.; Rivest, R.L.; Stein, C. Introduction to Algorithms, 3rd ed.; MIT Press: Cambridge, MA, USA, 2009. [Google Scholar]
- Gerlough, D.; Huber, M. Traffic Flow Theory: A Monograph; Number 165 in Special Report; No. 165; Transportation Research Board, National Research Council: Washington, DC, USA, 1975.
- Ferrari, P. The reliability of the motorway transport system. Transp. Res. Part B 1988, 22, 291–310. [Google Scholar] [CrossRef]
- Elefteriadou, L. An Introduction to Traffic Flow Theory; Springer: Berlin, Germany, 2014. [Google Scholar]
- Kerner, B. Introduction to Modern Traffic Flow Theory and Control: The Long Road to Three-Phase Traffic Theory; Springer: Berlin/Heidelberg, Germany, 2014. [Google Scholar]
- Mauro, R.; Cattani, M.; Guerrieri, M. Evaluation of the safety performance of turbo roundabouts by means of a potential accident rate model. Baltic J. Road Bridge Eng. 2015, 10, 28–38. [Google Scholar] [CrossRef]
- Guerrieri, M.; Mauro, R. Capacity and safety analysis of hard-shoulder running (HSR). A motorway case study. Transp. Res. Part A 2016, 92, 162–183. [Google Scholar] [CrossRef]
- Zhang, Y. Special issue on short-term traffic flow forecasting. Transp. Res. Part C 2014, 43 Pt 1, 1–2. [Google Scholar] [CrossRef]


| Date Set | The Number of Files (24 files/per day) | The total Sizes of Files (GB) |
|---|---|---|
| 2016/11 | 720 | 20.1 |
| 2016/12 | 744 | 21.1 |
| 2017/01 | 744 | 21.6 |
| 2017/02 | 672 | 19.2 |
| 2017/03 | 744 | 21.0 |
| Total | 3624 | 103.0 |
| Vehicle Type | Detection Time_O | Gantry ID_ O | Detection Time_D | Gantry ID_D | Trip Length | Trip End | Trip Information |
|---|---|---|---|---|---|---|---|
| 42 | 11/1/2016 0:21 | 01F1292N | 11/1/2016 0:21 | 01F1292N | 6.6 | Y | 2016-11-01 00:21:55+01F1292N |
| 31 | 11/1/2016 0:13 | 03F4168S | 11/1/2016 0:13 | 03F4168S | 6 | Y | 2016-11-01 00:13:05+03F4168S |
| 31 | 11/1/2016 0:08 | 01F0664S | 11/1/2016 0:09 | 01F0681S | 4.2 | Y | 2016-11-01 00:08:09+01F0664S; 2016-11-01 00:09:15+01F0681S |
| 31 | 11/1/2016 0:44 | 01F1572S | 11/1/2016 0:44 | 01F1572S | 10.4 | Y | 2016-11-01 00:44:15+01F1572S |
| 31 | 11/1/2016 0:28 | 01F0681N | 11/1/2016 0:49 | 01F0339N | 36.1 | Y | 2016-11-01 00:28:46+01F0681N; 2016-11-01 00:29:45+01F0664N; 2016-11-01 00:31:30+01F0633N; 2016-11-01 00:34:39+01H0579N; 2016-11-01 00:42:13+01H0447N; 2016-11-01 00:49:05+01F0339N |
| 31 | 11/1/2016 0:34 | 01H0447N | 11/1/2016 0:41 | 01F0339N | 19.4 | Y | 2016-11-01 00:34:48+01H0447N; 2016-11-01 00:41:08+01F0339N |
| 32 | 11/1/2016 0:04 | 01F0557N | 11/1/2016 0:07 | 01F0509N | 7.9 | Y | 2016-11-01 00:04:42+01F0557N; 2016-11-01 00:06:03+01F0532N; 2016-11-01 00:07:24+01F0509N |
| 42 | 11/1/2016 0:25 | 03F3854N | 11/1/2016 1:29 | 03F2747N | 120.39 | Y | 2016-11-01 00:25:15+03F3854N; 2016-11-01 00:31:17+03F3743N; 2016-11-01 00:35:05+03F3670N; 2016-11-01 00:39:28+03F3588N; 2016-11-01 00:47:06+03F3496N; 2016-11-01 00:49:58+03F3445N; 2016-11-01 00:52:52+03F3392N; 2016-11-01 00:57:31+03F3307N; 2016-11-01 01:00:16+03F3259N; 2016-11-01 01:02:52+03F3211N; 2016-11-01 01:04:13+03F3187N; 2016-11-01 01:10:07+03F3101N; 2016-11-01 01:16:28+03F2985N; 2016-11-01 01:19:57+03F2923N; 2016-11-01 01:21:14+03F2899N; 2016-11-01 01:24:33+03F2840N; 2016-11-01 01:27:54+03F2777N; 2016-11-01 01:29:39+03F2747N |
| 31 | 11/1/2016 0:16 | 01F0339S | 11/1/2016 0:49 | 01F0928S | 62.3 | Y | 2016-11-01 00:16:02+01F0339S; 2016-11-01 00:22:24+01H0447S; 2016-11-01 00:29:49+01H0579S; 2016-11-01 00:31:33+01H0610S; 2016-11-01 00:39:31+01F0750S; 2016-11-01 00:46:51+01F0880S; 2016-11-01 00:49:31+01F0928S |
| 31 | 11/1/2016 0:47 | 01F0376N | 11/1/2016 0:49 | 01F0339N | 8.4 | Y | 2016-11-01 00:47:01+01F0376N; 2016-11-01 00:49:14+01F0339N |
| 32 | 11/1/2016 0:32 | 03F1992N | 11/1/2016 1:52 | 03F0447N | 159.1 | Y | 2016-11-01 00:32:06+03F1992N; 2016-11-01 00:35:00+03F1941N; 2016-11-01 00:39:53+03F1860N; 2016-11-01 00:44:37+03F1779N; 2016-11-01 00:46:48+03F1739N; 2016-11-01 00:48:24+03F1710N; 2016-11-01 00:51:32+03F1651N; 2016-11-01 00:52:27+03F1633N; 2016-11-01 00:59:59+03F1485N; 2016-11-01 01:04:34+03F1395N; 2016-11-01 01:07:49+03F1332N; 2016-11-01 01:11:39+03F1257N; 2016-11-01 01:13:40+03F1215N; 2016-11-01 01:16:24+03F1161N; 2016-11-01 01:18:13+03F1128N; 2016-11-01 01:22:14+03F1051N; 2016-11-01 01:23:44+03F1022N; 2016-11-01 01:25:01+03F0996N; 2016-11-01 01:26:53+03F0961N; 2016-11-01 01:32:45+03F0846N; 2016-11-01 01:36:01+03F0783N; 2016-11-01 01:40:22+03F0698N; 2016-11-01 01:42:49+03F0648N; 2016-11-01 01:47:06+03F0559N; 2016-11-01 01:48:43+03F0525N; 2016-11-01 01:50:02+03F0498N; 2016-11-01 01:52:39+03F0447N |
| 5 | 11/1/2016 0:07 | 01F0155S | 11/1/2016 0:07 | 01F0155S | 1.6 | Y | 2016-11-01 00:07:43+01F0155S |
| 5 | 11/1/2016 0:17 | 01F0155N | 11/1/2016 0:25 | 01F0061N | 11.8 | Y | 2016-11-01 00:17:33+01F0155N; 2016-11-01 00:18:19+01F0147N; 2016-11-01 00:22:34+01F0099N; 2016-11-01 00:25:35+01F0061N |
| 31 | 11/1/2016 0:13 | 03F0846N | 11/1/2016 0:28 | 03F0559N | 35.9 | Y | 2016-11-01 00:13:31+03F0846N; 2016-11-01 00:17:02+03F0783N; 2016-11-01 00:21:46+03F0698N; 2016-11-01 00:24:27+03F0648N; 2016-11-01 00:28:59+03F0559N |
| 31 | 11/1/2016 0:20 | 01F3640N | 11/1/2016 0:20 | 01F3640N | 5 | Y | 2016-11-01 00:20:32+01F3640N |
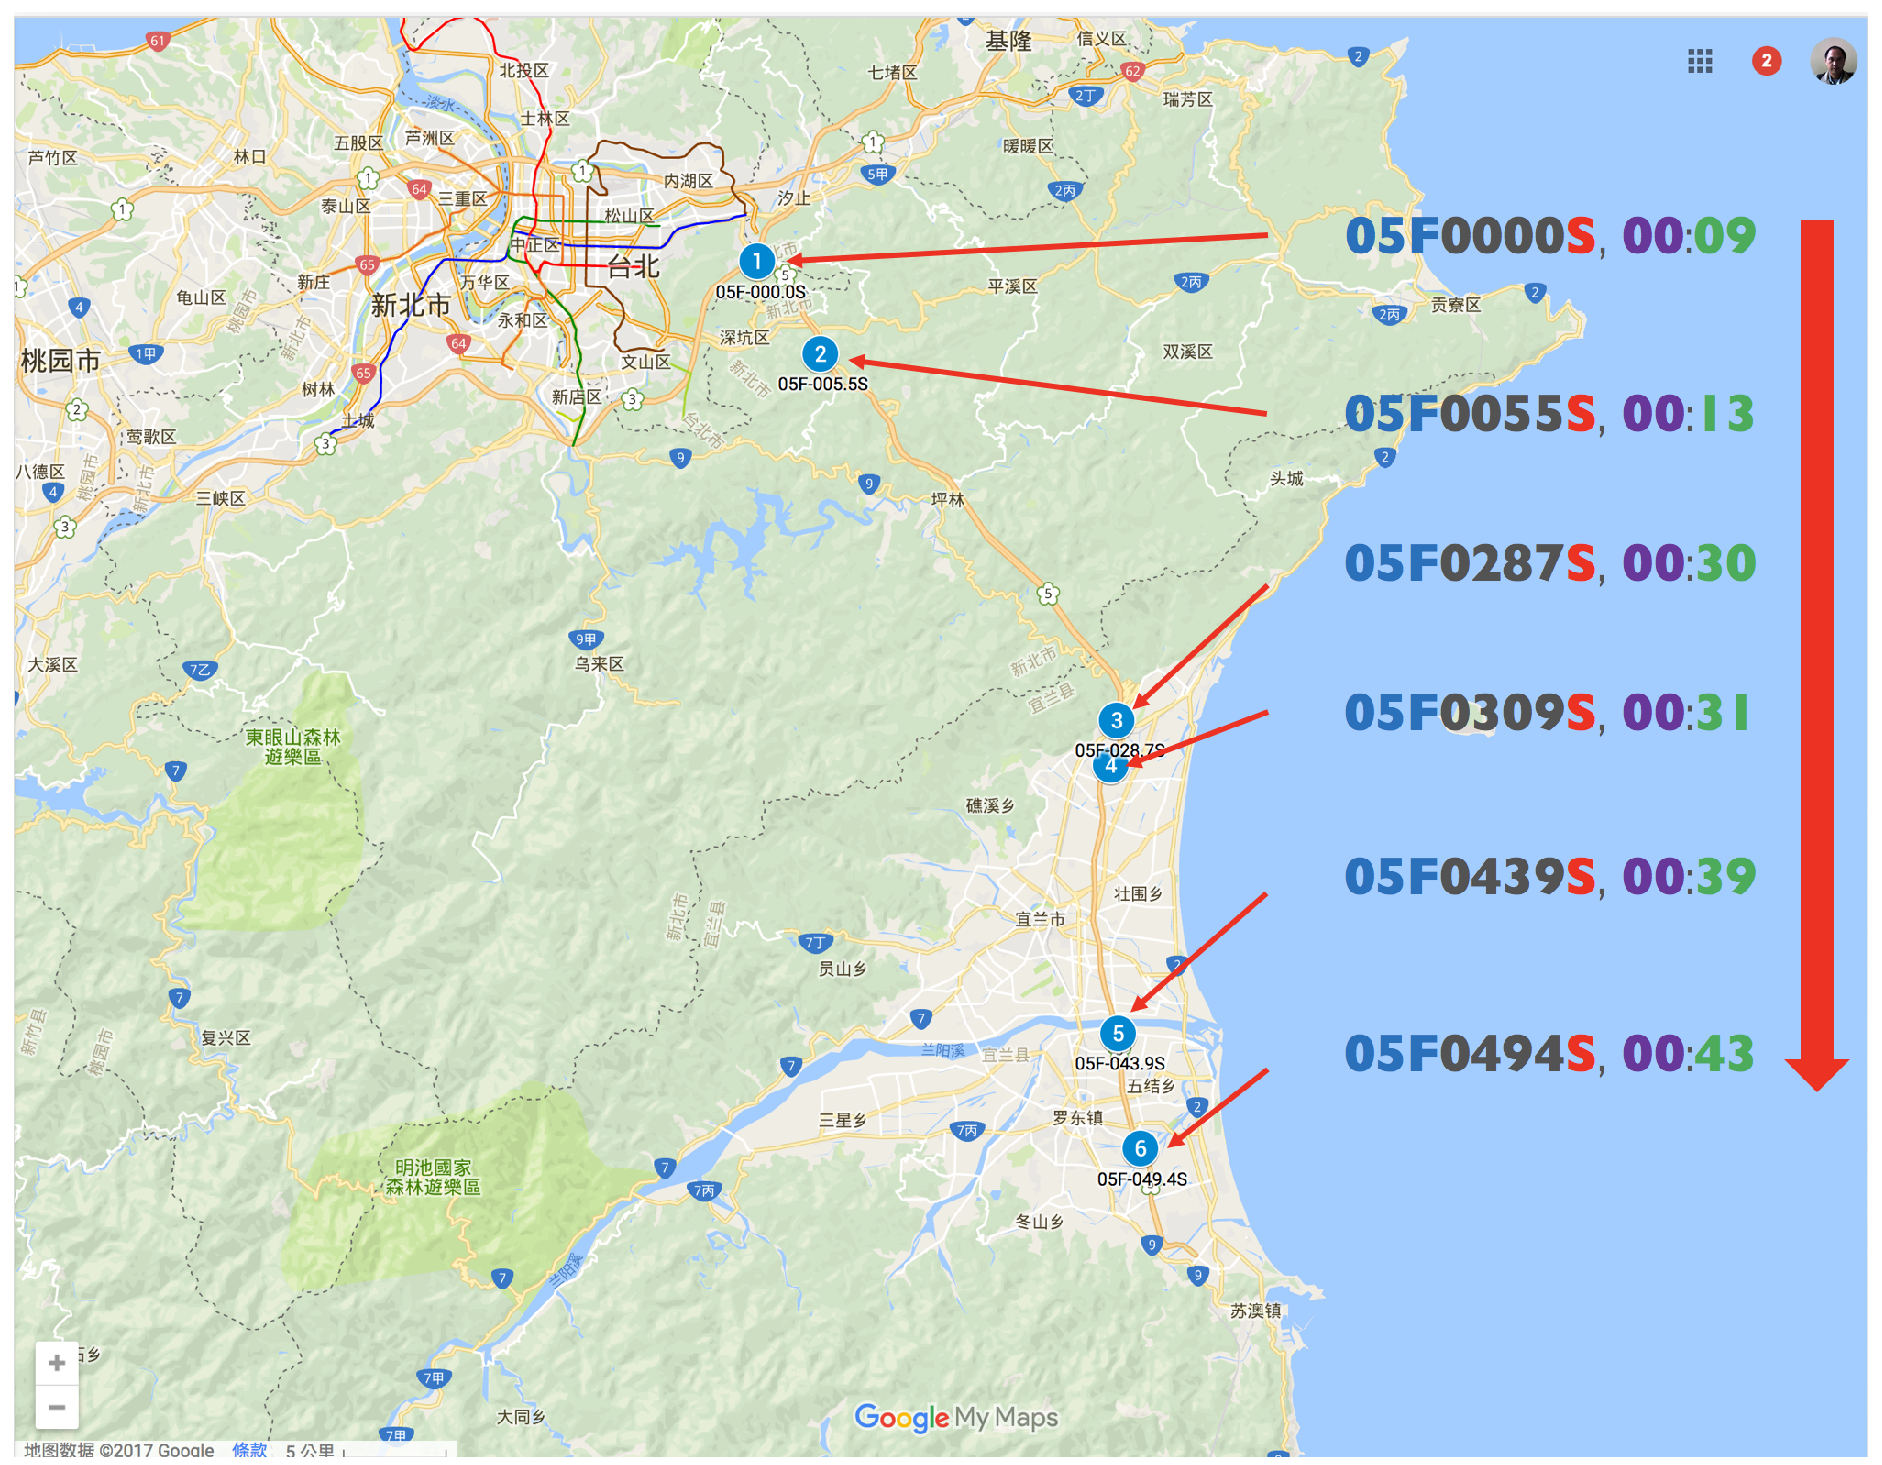
| Direction | Gantry ID | Distance (km) | Fee (TWD) | Interchange (Start) | Interchange (Stop) | North Latitude | East Longitude | |
|---|---|---|---|---|---|---|---|---|
| Northern | 1 | 05F-000.1N | 4.1 | 4.9 | Shihding | Nangang System Interchange (To No.3) | 25.03497222 | 121.6248611 |
| 2 | 05F-005.5N | 10.5 | 12.6 | Pinglin | Shihding | 24.99615556 | 121.6520972 | |
| 3 | 05F-028.7N | 15.7 | 18.8 | Toucheng | Pinglin | 24.84263889 | 121.7892861 | |
| 4 | 05F-030.9N | 6.5 | 7.8 | Yilan (S icheng, Taifu) | Toucheng | 24.82370556 | 121.7862139 | |
| 5 | 05F-043.8N | 5.7 | 6.9 | Luodong | Yilan (Jhuangwei) | 24.71092222 | 121.7895972 | |
| 6 | 05F-052.8N | 6.9 | 8.2 | Su-ao | Luodong | 24.63271667 | 121.8071667 | |
| Southern | 1 | 05F-000.0S | 4.1 | 4.9 | Nangang System Interchange (To No.3) | Shihding | 25.03508889 | 121.6229306 |
| 2 | 05F-005.5S | 10.5 | 12.6 | Shihding | Pinglin | 24.99646667 | 121.6520583 | |
| 3 | 05F-028.7S | 15.7 | 18.8 | Pinglin | Toucheng | 24.84256944 | 121.7889667 | |
| 4 | 05F-030.9S | 6.5 | 7.8 | Toucheng | Yilan (S icheng, Taifu) | 24.82370556 | 121.7862139 | |
| 5 | 05F-043.9S | 5.7 | 6.9 | Yilan (Jhuangwei) | Luodong | 24.71102778 | 121.7894778 | |
| 6 | 05F-049.4S | 6.9 | 8.2 | Luodong | Su-ao | 24.66258056 | 121.7998500 |
| Travel Time Pattern | Gantry Sequence | TimeStamp (h:min) | Travel Time (h:min) | Frequency | Class Frequency Distribution (Date Weekday Vehicle Type#TF) | |
|---|---|---|---|---|---|---|
| 1 | 05F0000S | 0:09 | 0:34 | 4 | (2017-01-05 Thu 32#1) | |
| 05F0055S | 0:13 | (2017-01-30 Mon 31#1) | ||||
| 05F0287S | 0:30 | (2017-03-31 Fri 31#2) | ||||
| 05F0309S | 0:31 | |||||
| 05F0439S | 0:39 | |||||
| 05F0494S | 0:43 | |||||
| 2 | 05F0000S | 5:55 | 0:44 | 7 | (2017-01-28 Sat 31#4) | |
| 05F0055S | 6:02 | (2017-01-28 Sat 32#3) | ||||
| 05F0287S | 6:26 | |||||
| 05F0309S | 6:28 | |||||
| 05F0439S | 6:36 | |||||
| 05F0494S | 6:39 | |||||
| 3 | 05F0528N | 0:11 | 0.35 | 5 | (2016-12-19 Mon 31#1) | |
| 05F0438N | 0:17 | (2017-01-03 Tue 31#1) | ||||
| 05F0309N | 0:25 | (2017-01-06 Fri 32#1) | ||||
| 05F0287N | 0:27 | (2017-01-24 Tue 31#1) | ||||
| 05F0055N | 0:42 | (2017-03-13 Mon 32#1) | ||||
| 05F0001N | 0:46 | |||||
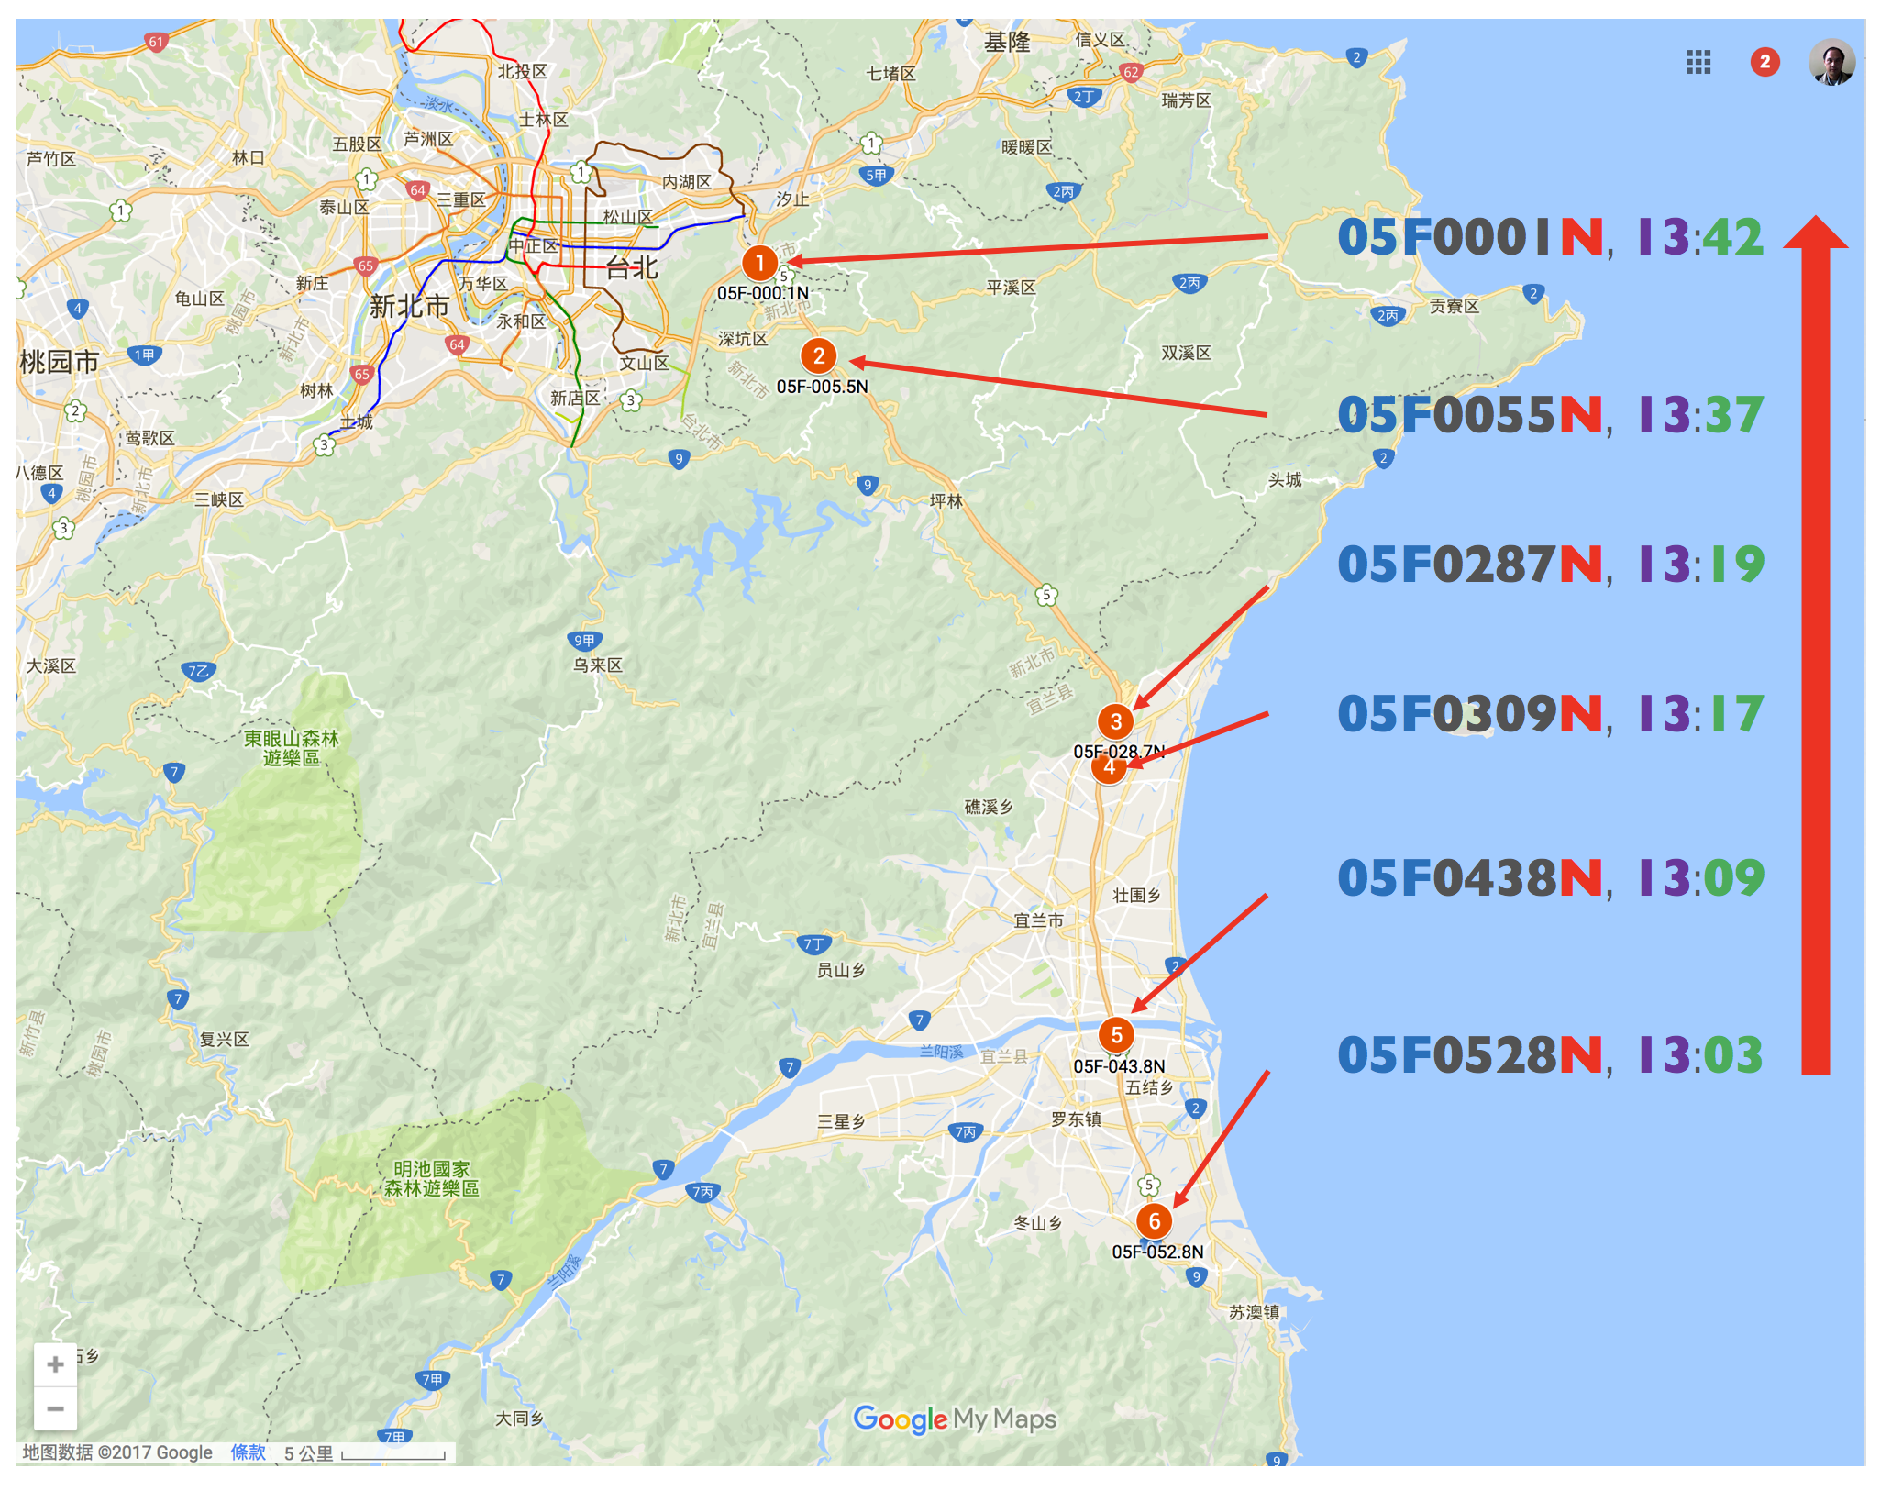
| 4 | 05F0528N | 13:03 | 0.39 | 9 | (2016-12-08 Thu 41#1) | (2017-01-22 Sun 31#1) |
| 05F0438N | 13:09 | (2016-12-15 Thu 31#1) | (2017-02-22 Wed 41#1) | |||
| 05F0309N | 13:17 | (2016-12-23 Fri 41#1) | (2017-03-10 Fri 41#1) | |||
| 05F0287N | 13:19 | (2017-01-19 Thu 42#1) | ||||
| 05F0055N | 13:37 | (2017-01-20 Fri 31#1) | ||||
| 05F0001N | 13:42 | (2017-01-20 Fri 41#1) | ||||
| Hardware/Software | Specifications |
|---|---|
| CPU | Intel® Xeon® Processor E5-2630 v3 (8 cores) |
| RAM | 128 GB (16GB*8, ECC/REG DDR4 2133 ) |
| Hard Disk | 6TB (SATA3 2TB*3, 7200 rpm 3.5 inch) |
| Network Card | Intel Ethernet X540 10GBASE-T RJ45 DualPort *4 |
| OS | CentOS 6.7 |
| Hadoop | Hadoop 2.6 (“Cloudera Express 5.4.5”) |
| Extracting Significant Travel Time Patterns | Processes | Computational Time (h:min:s) |
|---|---|---|
| Pass One | Determining Right Boundary | 13:21:01 |
| Determining Left Boundary | 12:56:47 | |
| Pass Two | Boundary Verification | 0:18:21 |
| Total | 26:36:09 |
© 2017 by the authors. Licensee MDPI, Basel, Switzerland. This article is an open access article distributed under the terms and conditions of the Creative Commons Attribution (CC BY) license (http://creativecommons.org/licenses/by/4.0/).
Share and Cite
Wang, J.-D.; Hwang, M.-C. A Novel Approach to Extract Significant Patterns of Travel Time Intervals of Vehicles from Freeway Gantry Timestamp Sequences. Appl. Sci. 2017, 7, 878. https://doi.org/10.3390/app7090878
Wang J-D, Hwang M-C. A Novel Approach to Extract Significant Patterns of Travel Time Intervals of Vehicles from Freeway Gantry Timestamp Sequences. Applied Sciences. 2017; 7(9):878. https://doi.org/10.3390/app7090878
Chicago/Turabian StyleWang, Jing-Doo, and Ming-Chorng Hwang. 2017. "A Novel Approach to Extract Significant Patterns of Travel Time Intervals of Vehicles from Freeway Gantry Timestamp Sequences" Applied Sciences 7, no. 9: 878. https://doi.org/10.3390/app7090878
APA StyleWang, J.-D., & Hwang, M.-C. (2017). A Novel Approach to Extract Significant Patterns of Travel Time Intervals of Vehicles from Freeway Gantry Timestamp Sequences. Applied Sciences, 7(9), 878. https://doi.org/10.3390/app7090878