1. Introduction
Maintaining roads in good condition is essential for user comfort and safety. Recently, the technical, legal, and moral responsibilities of road management bodies, along with the significant economic impact on communities, have increased interest in road monitoring and maintenance. Research has produced promising results, but these are difficult to generalize because methods depend heavily on available data. Nevertheless, several key concepts are shared by the scientific community and offer a solid basis for further development.
A crucial aspect of any transport system is ensuring an adequate level of serviceability—that is, the ability to use a road within a given period while maintaining expected travel time and cost [
1]. Its evaluation must consider the system vulnerability to internal or external factors. Vulnerability refers not only to susceptibility to adverse and often unpredictable events that reduce serviceability [
2,
3], but also to the system capacity to mitigate their consequences through appropriate maintenance actions.
Difficulties arise when classifying road networks and prioritizing maintenance, since results depend not only on the selected priority ranking index but also, more importantly, on the type and quality of available data and on the chosen network model.
The literature shows that solutions are often selected according to available data rather than the robustness of the results. Thus, the chosen model must relies strongly on information provided by the road operator. Modern automatic detection technologies—such as instrumented vehicles and sensors—now supply large amounts of high-quality, real-time data [
4]. When properly processed, these data support multi-level maintenance planning. This is essential because maintenance and rehabilitation are costly and often exceed available budgets, partly due to the lack of planning tools to distribute investments efficiently over space and time [
5].
Effective maintenance management also requires continuous monitoring across all infrastructure components, including bridges, tunnels, pavements, and safety barriers, to create a complete and hierarchical analytical framework. Digital technologies such as smart sensors, big data, and AI can further enhance this process and support the transition to “smart roads” [
6]. However, clear criteria are still needed to classify and analyze these data to guide maintenance decisions and intervention strategies.
In fact, the final goal of maintenance management is planning interventions and their space–time placement. A database extending to all components of the infrastructure is needed for the optimal allocation of economic resources and, consequently, for the effectiveness of interventions. In the planning phase, the priorities of the actions are defined, and this is conducted through a preliminary selection of road segments within a network. However, although many studies have demonstrated the benefits of preventive maintenance, the practice of road maintenance management based on appropriate and continuous monitoring of the efficiency of the infrastructure components is still not currently widespread.
In this scenario, as confirmed by recent research [
7,
8], big data and BIM can represent innovative convenient approaches for improving maintenance management, ensuring economic and use benefits for administrators and users. Indeed, modern BIM approaches—representing already reliable solutions in civil engineering applications [
9]—have been proven to be potentially suitable for handling road maintenance management problems [
7,
8,
10,
11]. However, despite the expected and potential benefits of BIM adaptation and adoption for maintenance management being clearly depicted [
10], this transition is still at the conceptualization stages [
8,
12].
In this paper, in a more comprehensive vision of evolving traditional road management systems (RMS) and pavement management systems (PMS), the authors propose a BIM-based procedure for preliminarily classify road barrier traits based on specific indicators, aiming at supporting monitoring planning and maintenance management procedures. In this regard, the authors identified three indicators, based on geometric, typological, and performance data of the barriers, for a classification and ranking of maintenance priorities. This defines a network-wide decision support methodology for motorway maintenance strategies, involving also the typical advantages of BIM uses related to operation and management.
Among the various road components safety barriers are certainly strategic for limiting critical consequences of road departures for vehicles and, consequently, increasing safety levels for traffic [
13,
14,
15]. However, like all components, to ensure an adequate and reliable response and efficient service, they must be, first, properly designed and built, according to current standards, and, also, always maintained in acceptable conditions during road use. It is extremely dangerous to keep in service inadequate, damaged or broken barriers, as the effects on vehicles and users in case of impacts can be catastrophic [
16,
17]. On the other hand, maintenance programs should be defined based on rational criteria for efficient budget allocation to obtain the best results in terms of improvement in safety expected performances [
18].
Current practice for road safety barrier management is primarily based on transportation asset management systems, which treat barriers as roadway assets managed through inventory, inspection, and maintenance planning processes [
19]. These systems rely heavily on periodic visual inspections—both scheduled and reactive following crash events—to assess condition and prioritize interventions. However, several studies highlight persistent limitations, including incomplete or outdated inventories and the predominance of manual data collection methods together with the absence of standardized methods, which reduce the reliability and efficiency of decision-making processes [
20]. In response, methodological research has been trying to progressively shift from reactive maintenance strategies toward more proactive and risk-based approaches, incorporating factors such as traffic exposure, roadside hazard severity, and barrier performance levels to optimize resource allocation, with increasing efforts in data collection and management [
18,
21]. Indeed, effective barrier management increasingly requires diverse and high-resolution data—such as geometric, condition, and performance information— as for the approach proposed in recent research [
22]. Analogously, another research has proposed GIS-based methodologies for prioritizing maintenance interventions on road safety barriers through synthetic indices combining degradation and spatial factors, enabling more structured and data-driven decision-making [
21]. However, such data can only be obtained through frequent and up-to-date surveys, generally manual and human-based, which remain difficult to implement consistently across large networks due to operational and economic constraints. On this aspect, interesting benefits can derive from emerging technologies—such as computer vision, mobile mapping, and LiDAR-based surveys—being explored to automate inventory collection and condition assessment of guardrails at the network level, but their adoption remains limited in operational practice [
16,
20,
23,
24]. Despite these advancements, integration with BIM remains largely experimental, with most existing barrier management systems still relying on GIS-based platforms and asset databases rather than fully integrated digital models.
In this context, the proposed procedure represents, at network-scale, a support tool to classify road segments according to quality, vulnerability, and reliability of road barriers, leveraging easy-to-obtain administrative data, for maintenance-related prioritizing needs. The procedure is not intended as a reactive approach, in which management decisions are taken according to localized identified distresses, but aims at ranking, at network-scale, homogeneous segments of the road requiring more urgent attention for renovation of and improvements in roadside safety barriers, since they are equipped with outdated or inadequate components. In other words, the methodology functions as a BIM-based asset screening tool, offering a digital decision support system that identifies critical segments of the road, for the barrier asset, at network-scale in a virtual environment, to optimize the allocation of physical resources and prioritize on-site inspections where they are most needed.
By properly combining three selected indicators, a synthetic performance index, named AC (Attention Class), was defined. It can range between 0 and 100, where 0 means completely inefficient and 100 means fully efficient. Such a classification indicator can support the planning of economic investments and, consequently, the optimal allocation of the budget for road barrier maintenance. Furthermore, this method is directly introduced in I-BIM approaches for simplifying asset feature visualization and data management. ACs are a way to express, quantitatively and by means of a standardized procedure, a priority grading aimed to require the “attention” of the road manager on a possible factor affecting the road safety performance. In fact, poor conditions of the infrastructure and its components represent a potential risk factor that is not yet recognizable in terms of frequency of accidents, but they can increase their probability.
Furthermore, in a similar perspective, analogous indicators can be also defined and developed for other road components (such as pavements, tunnels, bridges, signage, junctions, etc.) and combined for identifying overall synthetic indicators of quality conditions for the various road segments, extending the benefits and the potential advantages of such an approach. In general terms, in fact, road infrastructure maintenance requires a systemic approach since there are many aspects that influence functionality and safety. The proposed approach, combined with the results of analogous applications on pavement asset already available in the literature and with future methodologies dedicated to the other road components can represent a significant boost to RMS definitive evolutionary transformation, leveraging BIM approach as a reference framework for digital representation and management of the infrastructure asset.
In summary, the main objectives of the research presented in this manuscript are as follows:
The proposal of a network-scale attention class indicator for classifying road safety barriers to support road administrators in prioritizing operations in terms of detailed surveys, controls and verifications, or long-segment interventions;
Leveraging existing I-BIM environment to handle and process road safety barrier information linked with asset maintenance management;
Conceiving a procedural framework for allowing road maintenance operators to perform BIM-based asset screening of the road safety barriers;
The transposition of conceptual and methodological approaches for adapting I-BIM environment as maintenance management support platform, positively tested on different road assets.
2. Brief Notices on BIM Applications for Infrastructure Maintenance Management
Management of road assets has been proven to be a complex task, requiring adequate knowledge, reliable models, and convenient support tools, organized in appropriate processes with adequate professionals and leveraging convenient and high-level technologies [
25]. Based on these, RMSs were developed as soon as road network widened remarkably, condition significantly decreased, and research advanced. However, traditional approaches exhibit relevant criticism, mainly because of operational and use complexity, lack of modelling potential (since they are tabular or GIS-based only), and control on asset life cycle [
7], making their applications sparse.
In this context, BIM has been proven to offer a convenient solution for improving data management and maintenance planning and scheduling. It can ensure benefits in terms of realistic representation, data sharing, modelling potential, exploring design options, and analysis opportunities [
26,
27], especially for existing infrastructures [
28], with interesting focus particularly on pavements [
7,
8,
11]. Adaptation of BIM approach to road maintenance management also can guarantee several benefits, such as data clarity, information leveraging, realistic visualization, virtual inspection, and scenario evaluation on the information content [
8], defining a user-friendly and modern decision support tool to improve traditional RMSs. It should be also noted that such an approach adapted to road maintenance management can ensure savings in repair and operating costs [
12], thanks to simplified modelling of asset and condition information and enabling virtual inspection. Automation of construction activities and the creation of road as-built databases supporting management and future project development may represent the most convenient application of BIM for transport infrastructures [
29].
Considering specific literature, in recent years, numerous studies have explored the use of BIM in road maintenance and management focusing on methodological frameworks, potential benefits, and theoretical investigation [
10,
26,
30,
31]. Applications mainly focused on pavements, due to their strategical role and their economic and quality impacts. While some preliminary studies introduced maintenance-related models in a structural/architectural BIM environment [
11], others were specifically conceived in I-BIM (Infrastructure-BIM) platforms, specifically customizing road components with condition indicators typically obtained from advanced surveys [
8] or incorporating sustainability and life cycle cost methods [
32]. Some authors explored an interoperable BIM model using non-destructive survey data—such as Mobile Laser Scanning and Ground-Penetrating Radar—for evaluating pavement distresses [
33]. Cho et al. [
34] proposed a practical framework for managing spalling maintenance within a standard BIM environment, including some automation. Bosurgi et al. [
7] introduced a user-friendly, design-oriented I-BIM framework enabling data visualization, virtual inspections, and rehabilitation planning in different types of BIM environments (prone to planning phases and realistic representation or to detailed design). These developments allow BIM uses such as site modelling, visualization, and record management, and pave the way for further applications like asset management and design review [
12], even though they still lack a comprehensive operational approach for implementing RMS-derived protocols within I-BIM.
Considering traffic barriers, applications are very few and mainly dedicated to design-related tasks [
35]. Interesting research focuses on as-built BIM model reconstruction from point clouds, aiming to implement a semiautomated labelling method together with a supervised classification of guardrails [
36], even if the authors do not focus on asset management issues.
The limited presence of BIM applications for road safety barriers in the literature can be attributed to a combination of technological, methodological, and industry-related factors. BIM has historically been developed for vertical construction and remains predominantly oriented toward buildings, while its extension to linear infrastructure such as roads is still evolving [
35], presenting significant challenges due to their spatial continuity and scale [
37,
38]. Within this context, road safety—and particularly roadside elements like barriers—has received comparatively little attention, as research has primarily focused on design coordination and asset management, with limited exploration in safety-related domains [
39,
40]. The absence of standardized data schemas and object libraries for safety barriers further limits interoperability and reuse, reducing both academic and practical incentives for investigation and requiring specific processing for improving result quality [
35,
39]. Finally, general obstacles to digital transition and innovation in the construction sector and infrastructure fields [
41], related to lack of standardization. High initial investments, skill gaps, and workforce resistance [
42] may represent relevant obstacles for the potential developments and advancements in current practice.
3. Problem Position and Proposed Indicators
As anticipated, the aim of the paper is the definition of a comprehensive and reliable procedure, at the network scale, for classifying and ranking road segments based on side barriers conditions. For this aim, it is fundamental to consider adequate information, easily available for the various traits of the road network. For instance, it would be impractical to refer to speed design diagrams, derived from original design documents, or to accurate accident data, generally not properly aggregated and validated. Moreover, these data are more related to barrier-type selection and design. On the contrary, it would be helpful, considering the aims of the research, to consider some essential aspects for safety, such as barrier conditions or their effective installation features. This is significant, especially because, in current practice, barriers generally result from multiple maintenance interventions (initial construction, maintenance, replacement, etc.), performed at different times and in compliance with various standards. Very often, long road portions present very heterogeneous barriers, with relevant variations in geometric, typological, structural capacity, constraints, and other related parameters.
In general terms, to evaluate efficiency, functionality, and safety conditions of the available systems along the road, factors such as the effective geometric continuity and the structural integration between different restraint elements (placed in succession) or between the barriers and the supports (embankments or curbs), or even the availability of adequate operating spaces, can be considered relevant. However, since these aspects cannot be easily deduced from the available data, at the network scale, it is helpful to carry out some categorizations and typological classifications, considering the aims of the approach.
Within this framework, in the proposed approach, to evidence the potential criticisms of road segments for the barrier asset, the authors defined a methodology for assigning specific scores to the various segments, based on which it is possible to assign them to a specific “Attention Class”. This class is understood as the (relative) level of need and priority for action, with reference to the design and execution of interventions aimed at restoring the functionality and/or extending the useful life of the motorway section in question. It is obvious that such an analysis does not intend to assess safety in operation, for which other aspects would be decisive or even dominant (as, for instance, the human factors). The intent is only to observe the infrastructural component to prioritize its possible improvements. Then, once prioritization and ranking are performed, detailed investigations can be executed on the most critical segments, making available the previously listed factors, useful for safety assessment and intervention plannings.
Finally, it is worth underlining that the procedure was conceived and characterized for the Italian context and, thus, based on Italian standards and regulations, but it is fully exploitable in different countries and in compliance with different rules.
Attention Class Index
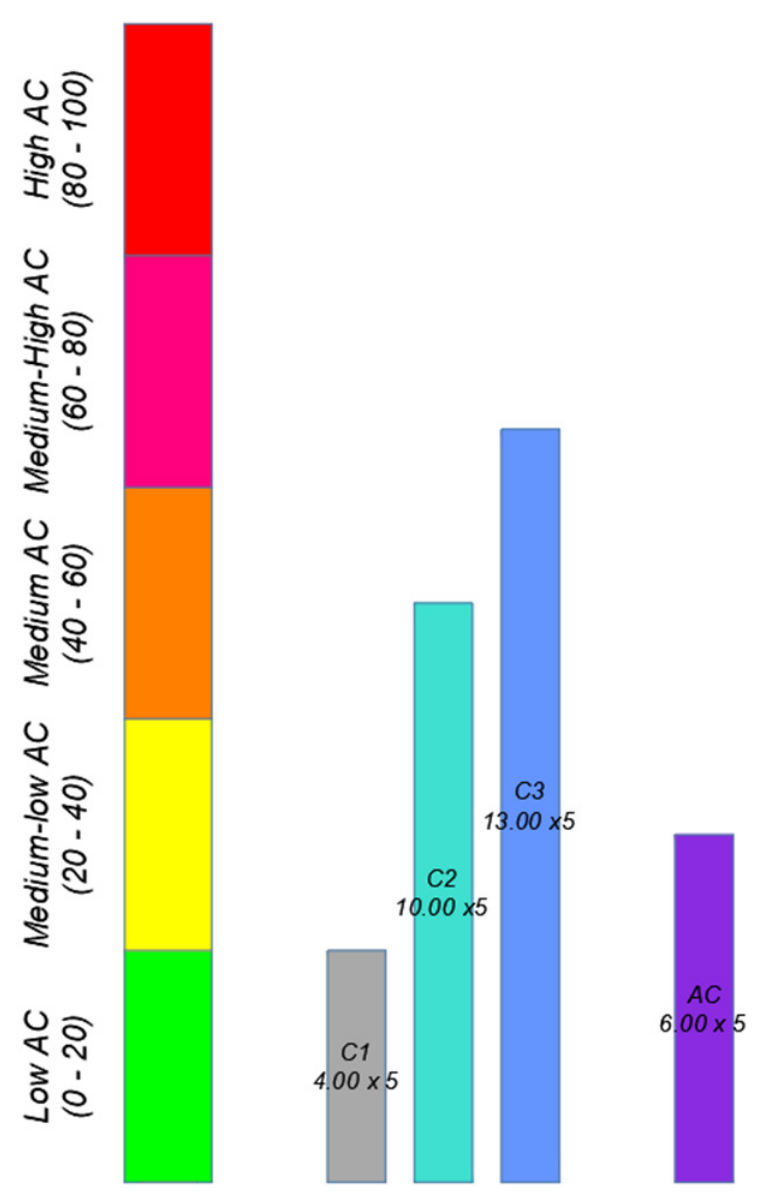
The methodology proposed for the definition of the “Attention Class” (AC) was set up based on comparative assessments, regarding the state of efficiency and functionality of the devices placed at the roadsides, considering parameters and indicators that can be easily deduced from available databases. Five possible ACs, based on the component inefficiency, were considered, with a reference score in the range of {0–100} as follows: (1) high inefficiency {80–100}; (2) medium–high inefficiency {60–80}; (3) medium inefficiency {40–60}; (4) medium–low inefficiency {20–40}; (5) low inefficiency {0–20}.
For assessing the score of each segment and, thus defining the attention class, the following aspects are considered fundamental:
Geometric and structural continuity between successive restraint elements;
Effective structural interaction between barriers and supports (embankments or curbs);
Availability of adequate operating spaces.
These characteristics, in fact, are directly related to the efficiency and performances of longitudinal barriers: geometric continuity is essential in order to ensure that impacting vehicles can be contained and redirected by the restraint system, while lack of continuity can result in dangerous penetration of some parts of the guardrail in the vehicle cockpit; effective structural interaction between the barrier and supports allows to transfer and dissipate dynamic actions (forces and moments) transmitted from vehicle to barrier during the crash; availability of operating spaces is needed to consent barrier deformation without hitting obstacles or other elements behind the restraint system.
Then, the proposed analysis methodology is based on the identification and localization of the following critical situations:
Sections of barrier where the actual installation length is less than a minimum length (or a reference length), suitable for ensuring the full performance of the component;
The time of construction of the system and the consequent discrepancy between the performance and technical characteristics required at the time of installation and those currently required (according to the traffic needs, the characteristics of the road and the way in which vehicular traffic takes place);
Expected performance according to the typical operating mechanisms of the barrier, defined by the characteristic (nominal) performance parameters and their relative ratios (working space “W” and containment level class “H”).
On these premises, three different basic indicators were defined as follows:
C1, an index related to traits shorter than the minimum working length;
C2, an index related to barrier age and obsolescence;
C3, an index related to barrier nominal operating performance.
In detail, C1 considers alert conditions concerning relevant frequency of situations in which typological, geometric, or structural discontinuity happen, with very short segments of different barriers. If Leff is the effective length of each type of barrier along a road and Lmin is the min working length, it is possible to define C1 as in Equation (1).
Considering the different installation times of the existing barriers and the related regulatory indications, enforced at the time, Lmin varies. Then, it may be convenient to identify a single reference value for the entire road section under consideration. As a preliminary attempt, considering average conditions, for uniformity of analysis and speed of treatment, Lmin was fixed equal to 40 m.
C2, instead, tries to consider age and obsolescence of barriers along the selected road. However, a direct knowledge of installation epoch for each barrier segment has low probability and, thus, for generalizing the approach, it is preferable to classify barriers according to standards and regulations in force during construction. This is still efficient to differentiate the various situations in relation to traffic conditions, barrier characteristics and required performance—i.e., the design conditions typically indicated by the legislation—in the different periods in which the barriers were installed. Based on Italian standards and their evolution, it is possible to preliminarily define 3 classes of regulations as follows: class (1) for barriers in compliance with standards prior to 1998; class (2) for barriers in compliance with regulations in force between 1998 and 2004; class (3) for barriers designed after 2004. Then, considering the length of each stretch of barrier along a road segment, and assuming this parameter (the length) as a weight, C2 can be defined (see Equation (2)) as weighted average on the entire road segment.
Finally, C3 considers nominal performance of installed barriers, involving indicators related to typical performance parameters as containment level, H, and working space, W. Instead of their nominal values, in this research, H represents the numerical characteristic code of the containment level, while W is the numerical characteristic code of the working space for the selected value. In detail, these parameters were combined as they are mutually dependent (generally, the higher H, the lower W) and, thus, a H/W indicator ratio was selected as the reference factor. If a barrier can guarantee valid safety performance, high containment and, in contrast, limited working space are expected. A high value of the H/W indicator ratio, therefore, can be considered as a signal of good performance capabilities. Furthermore, because for barriers in place one of the most critical aspects is generally the scarce availability of the working space at the back, it was considered appropriate that W-related indicator should influence the performance index not linearly but quadratically. Relying on these considerations and including a numerical coefficient, γ, for scaling benefits, four classes of barriers, in terms of performance, were defined based on the H/W2 factor, defining the Ipr index (Equation (3)), called “performance indicator”.
Considering the distribution of the barrier performances (in terms of H and W values), in the database available and used for the calibration process, the classes boundaries presented in
Table 1 were defined and the value of the coefficient γ was then assumed to be equal to 25, in order to obtain significant and well-distributed scores for Ipr.
Then, C3 can be calculated as shown in Equation (4).
For each of these indicators, it is possible to assign an attention class for the barriers in the road segment, according to the previously defined ranges. For simplicity, a reference base of 1 km was adopted for indicators C1, C2, and C3. Furthermore, to limit possible distorting numerical effects in ACs due to extreme sudden variations in the indicators in short traits, a moving average on a 3 km base was applied to smooth the obtained function, ensuring greater uniformity and continuity, considering also novel standardized values in the range of {0–100}.
The “overall” state of safety barrier may be synthetized by combining the various indicators through Equation (5), in which w1, w2, and w3 represent customized combinations weights to be specifically defined based on the problem and scenario characteristics. These weights are introduced for hierarchically order the various parameters involved in AC calculation, ascribing relatively less or more influence on the final segment ranking.
4. I-BIM Modelling Solutions and Case Study
In compliance with the research scope, the research proposal regarded modelling solutions conceived for BIM platforms defined and optimized for infrastructures, i.e., I-BIM environments. In particular, the methodology focused on the definition of a network-scale procedure for assigning attention classes (ACs) to different road segments according to the general characteristics of the safety barrier asset.
For testing purposes, all elaborations and solutions were defined using the Autodesk® Infraworks® and Civil 3D® software (version number 26.0.1.72), as pilot platforms, by coding original routines and defining dedicated objects. The implementation of the proposed framework and the specific solutions was performed using academic licenses provided by the University of Messina (software release: 2025). It should be clarified that the selection of this BIM authoring software aims at demonstrating the feasibility of the method within widely adopted I-BIM environments. However, the underlying methodology is fundamentally software-agnostic. The algorithmic logic, developed through specifically conceived routines and interoperable data structures, can be deployed across different openBIM platforms, ensuring that road authorities can implement the AC logic regardless of their specific software ecosystem.
The data structure proposed in this framework is compliant with the reference BIM and information management standards, defined in the still evolving ISO 19650 series [
43]. As known, this represents the international standard for information management along the entire life cycle of buildings and infrastructures, using BIM. Specifically, the defined parameters and indicators (ACs), as defined in the proposed methodology, are intended to populate the Asset Information Model (AIM). By addressing specific Asset Information Requirements (AIR), this methodology ensures that the road safety barrier data are not merely a static collection but can represent a standardized module within a broader Common Data Environment (CDE), facilitating interoperability and streamlined management for road authorities.
For deployment in the two alternative platforms, the proposed methodological solutions for traffic barrier ACs were developed based on customized “Points of Interest” (PI) and customized “Sub-assemblies” in the two operative environments, in analogy with previous research [
7]. These models guarantee clear and immediate representation of traffic barriers scenario along a selected road, based on the parameters described in Section Attention Class Index.
The methodological workflow described in
Section 3 was fully tested on a pilot Italian motorway in the two different I-BIM environments. The experimental segment analyzed in this manuscript is 10 km long. Input data are frequencies (the number of cases per km) related to each indicator considered by the procedure and described in
Section 3: min length (C1), age and obsolescence (C2), and nominal performance (C3). The dataset was organized for reference sections, considering the location of the barrier—right side, left side, and central reserve barrier. For C2, data were organized according to the regulatory class, while for C3, performance class evaluation was necessary. Concerning the values of the weights for Equation (5), in this research, the selection was performed relying on management experience and road agency indications. In general terms, the adopted values were selected in compliance with the influence of each indicator on the overall barrier performance. Indeed, it should be noted that weights for C1 and C3 present higher values than C2 since they represent parameters directly involved in the selection of the barriers during the design phases and strongly influence component performance. Based on these considerations, the weights were preliminarily fixed as w1 = 0.4, w2 = 0.2, and w3 = 0.4. Concerning the scope of the manuscript, related to the overall validation of the methodology and the framework, expert-based selection for weights was considered an acceptable choice.
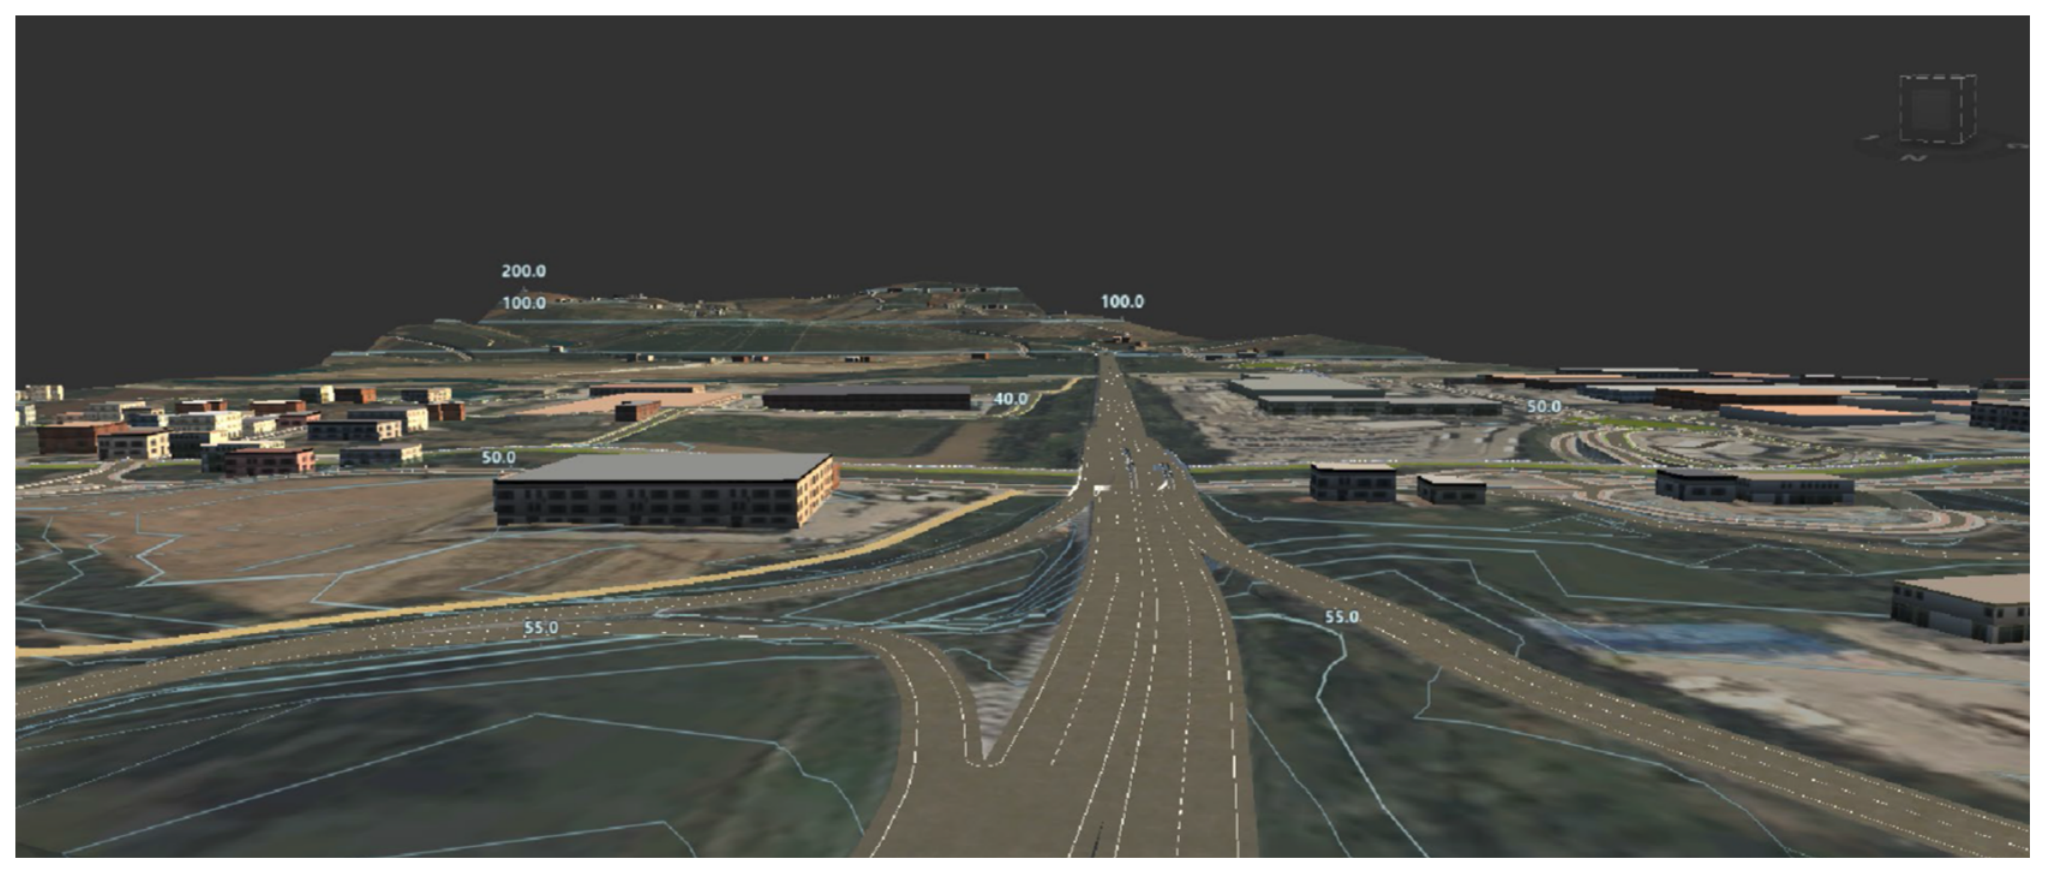
In both I-BIM platforms, the comprehensive model of the road and the environment (an example view of which is provided in
Figure 1) was first reproduced through a built-in simplified preliminary processing tool able to reconstruct the model from public available datasets, in a trade-off between accuracy and operational simplicity. This choice is acceptable for a network-scale approach, as in this research, in which a realistic representation of the asset is enough to test the approach and estimate related benefits and drawbacks.
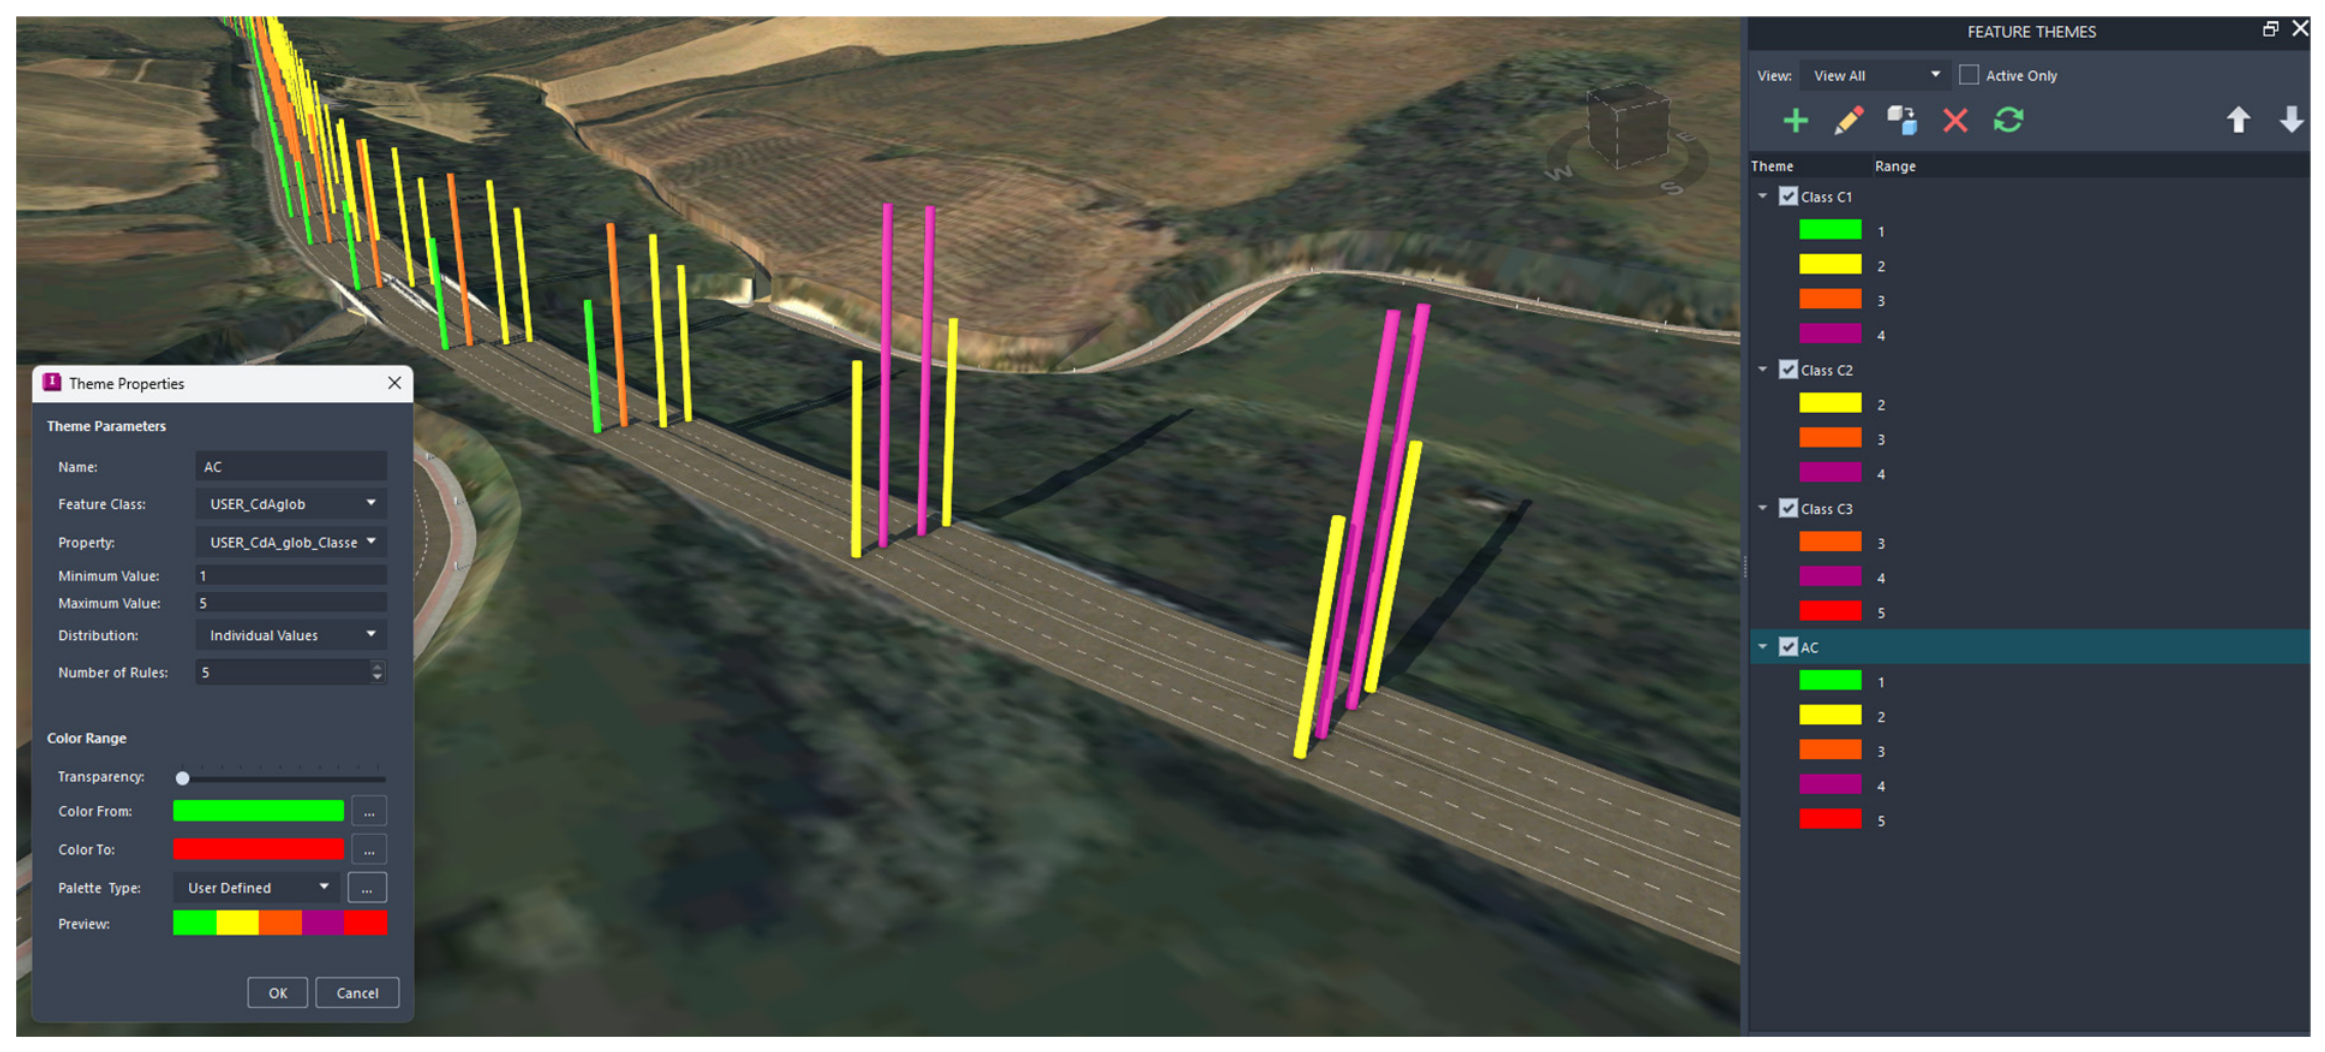
As anticipated, in the realistic I-BIM environment, parametric PI objects were used to store condition information and provide clear charts in the 3D environment. In detail, parametric symbolic cylinders with customizable color were defined and imported in the model, at specific locations with 1 km spacing (based on the alignment chainage). These objects, named in the following BPI (Barrier Points of Interest), represent the smart objects in which introducing the information required for determining AC of the various traits and, thus, showing evaluation results in the model. For each segment, four BPIs were defined and characterized as follows: one for each of the basic indicators defined in Section Attention Class Index (C1, C2, C3) and one representative of the final AC. Each BPI is driven by two parameters: one controlling its height and one its representation color, defined according to the previously defined threshold values in the {0–100} range. Based on the characterization of the external dataset, the BPIs were parametrically introduced in the models and, by using the dedicated scripts, the related attributes were read, assigned to the specific objects (with a more dense spacing of 50 m for simplifying data visualization) to derive C1, C2, C3 values, and combine them for estimating AC.
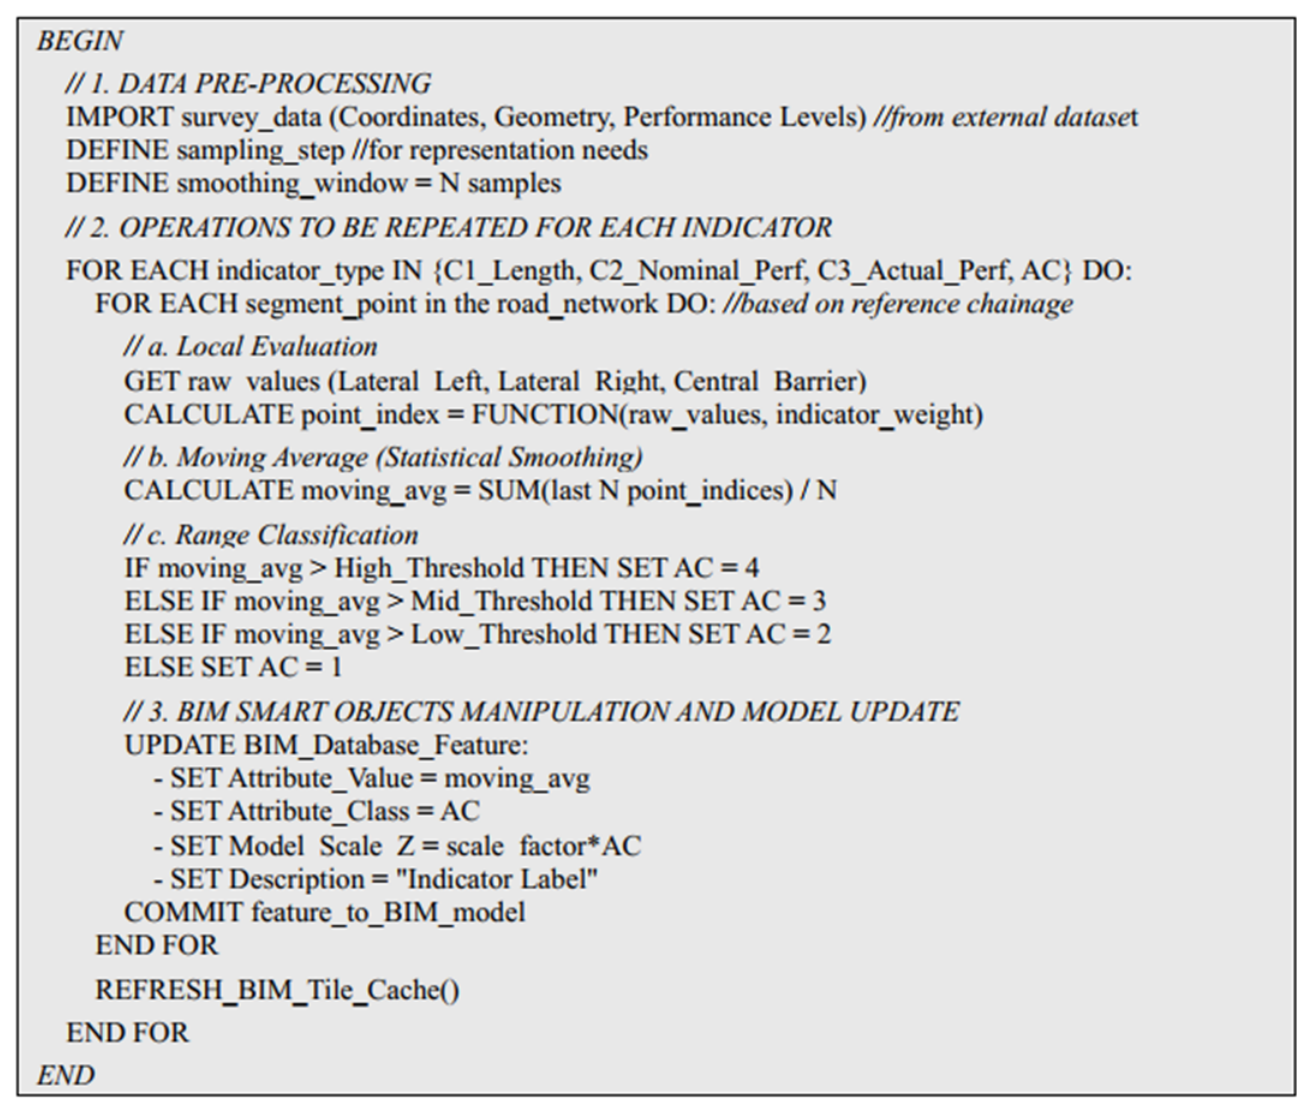
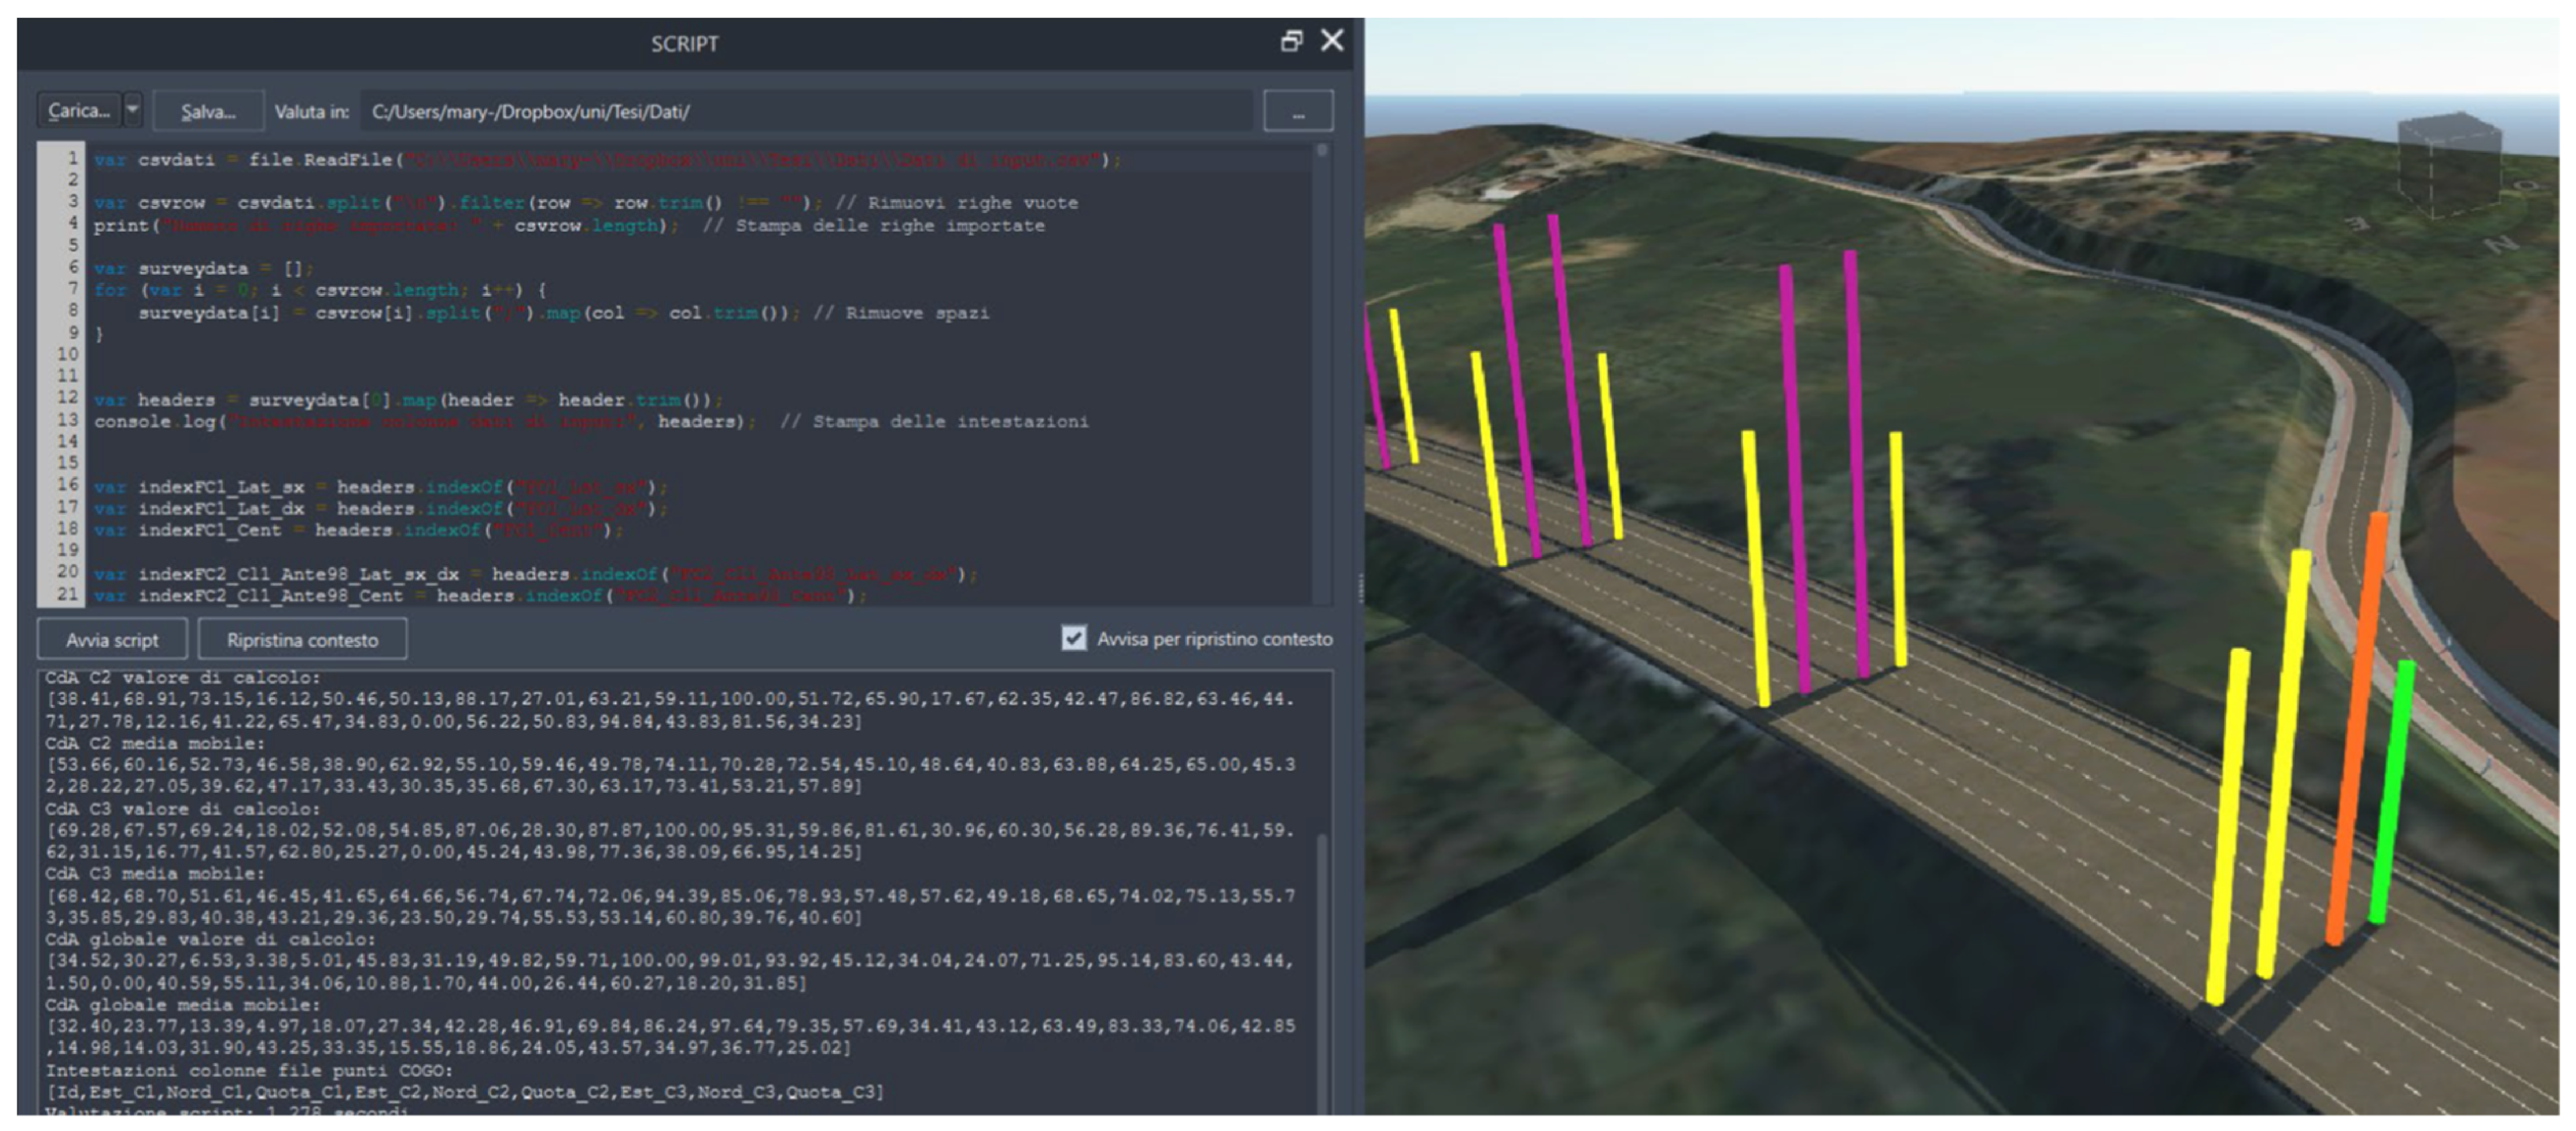
As it is known, the BPIs are originally empty, until the maintenance operator activates the dedicated data import procedure from the external dataset—i.e., an original Javascript routine—that, in detail, assigns representative information to each segment objects, calculates the values of each indicators, combines them for estimating AC of the reference segment, and adapts height and color of each BPI according to the related numerical values. The pseudocode of the BPI value assignment and appearance adaptation routine is provided in
Figure 2.
Figure 3 and
Figure 4 represent example views of the various BPIs related to the considered indicators colored in compliance with a specific color scale, for clearly evidencing most critical segments; this allows an immediate analysis of the barriers along the selected motorway, in a simplified virtual asset screening.
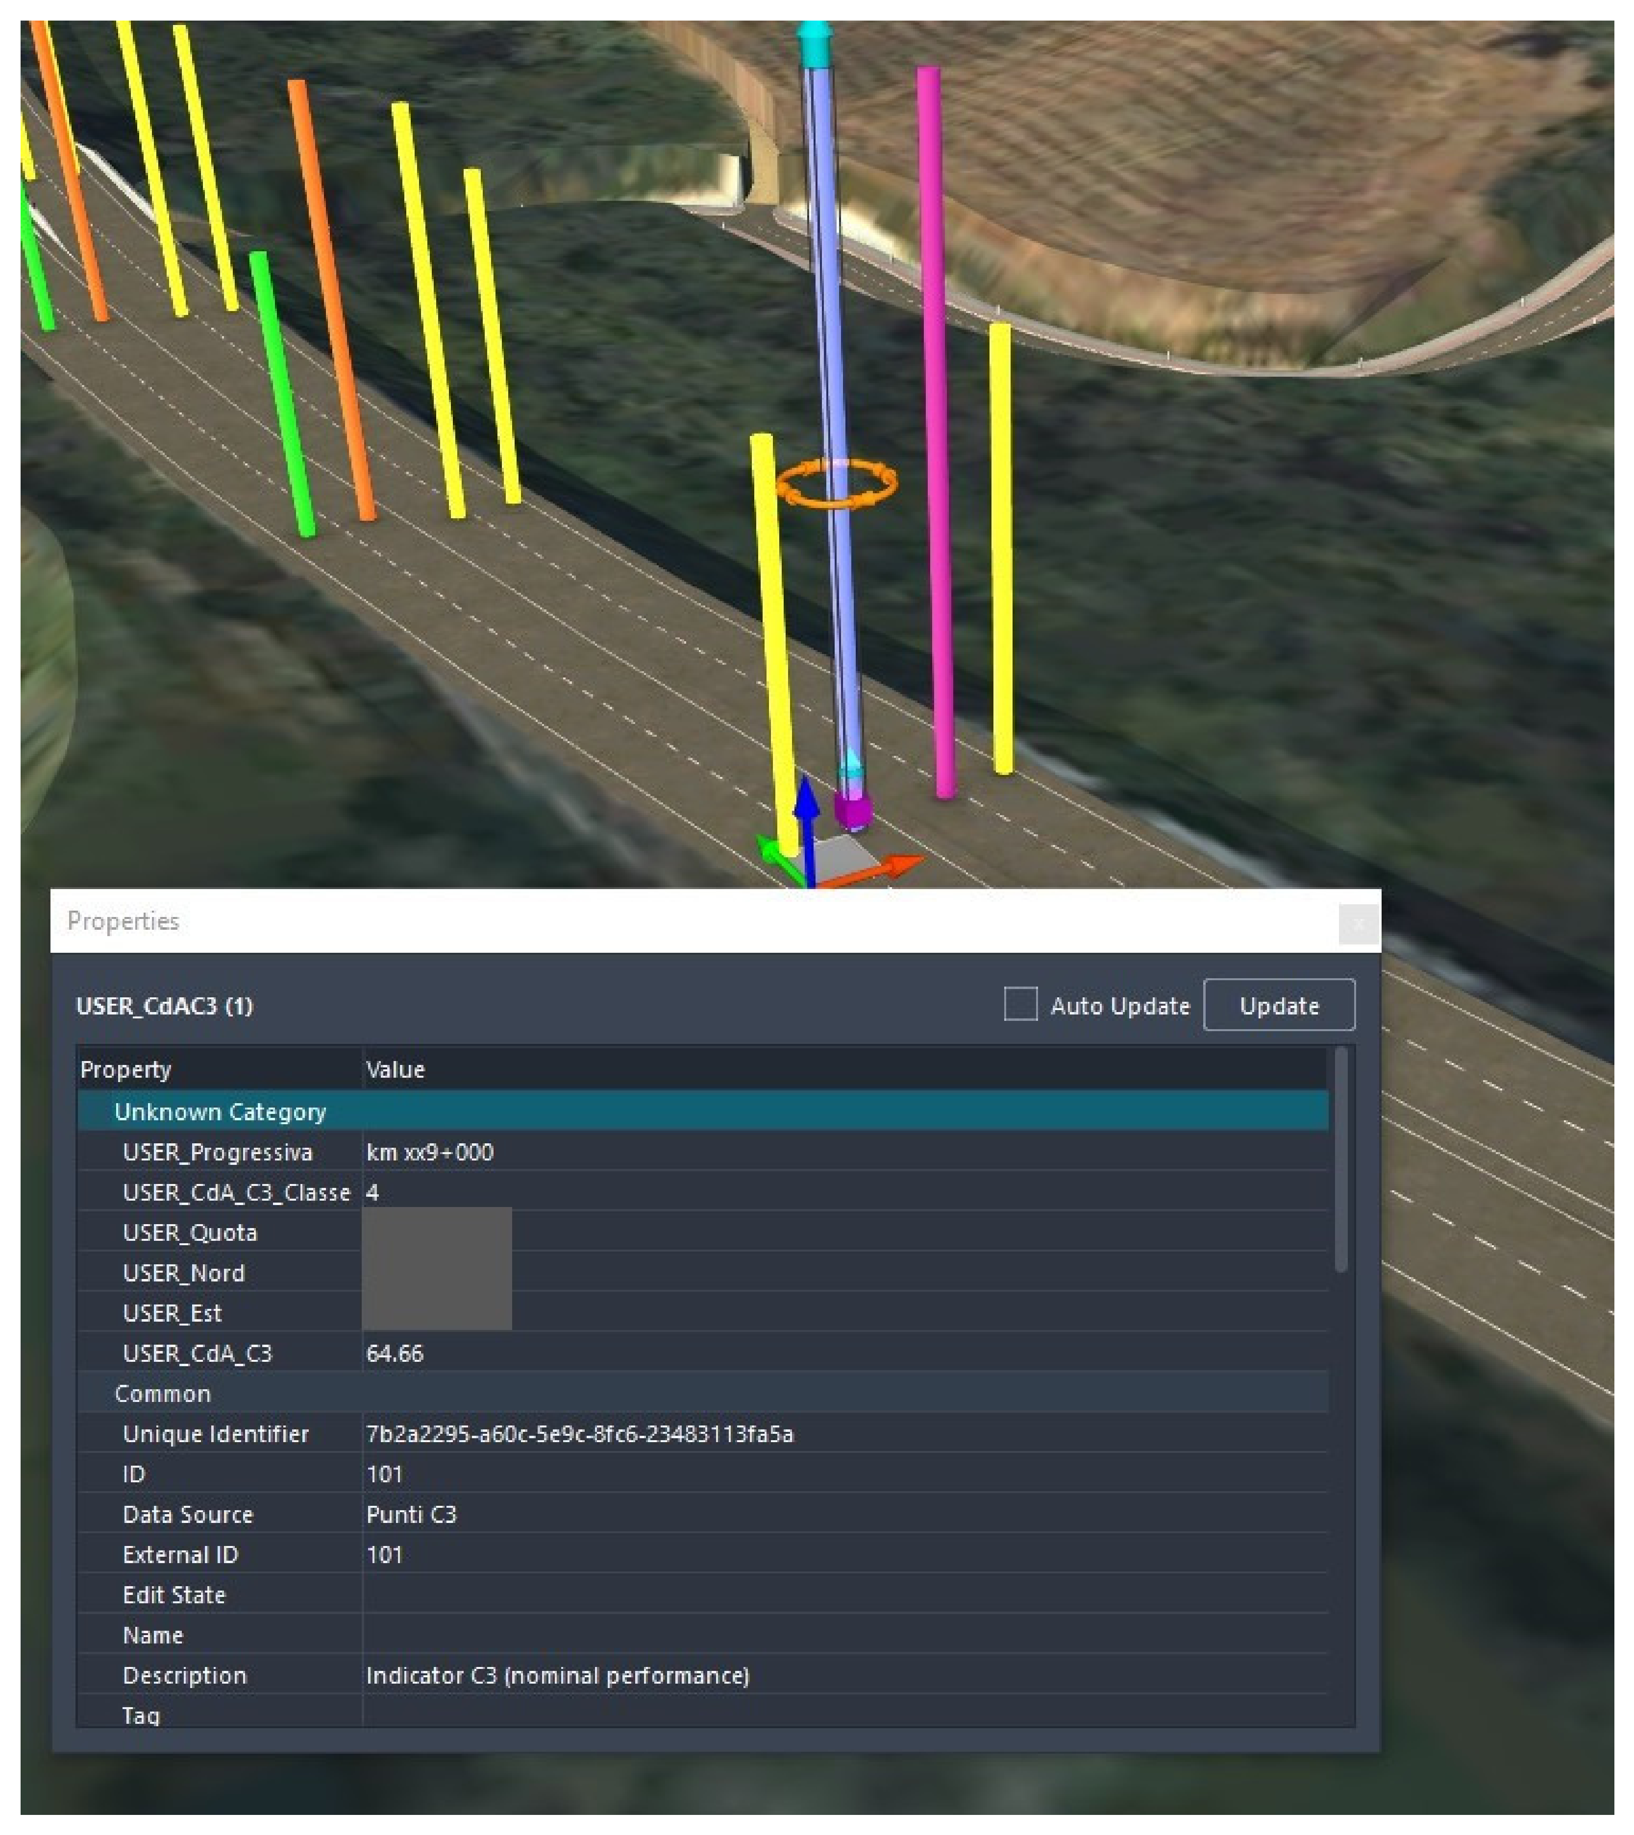
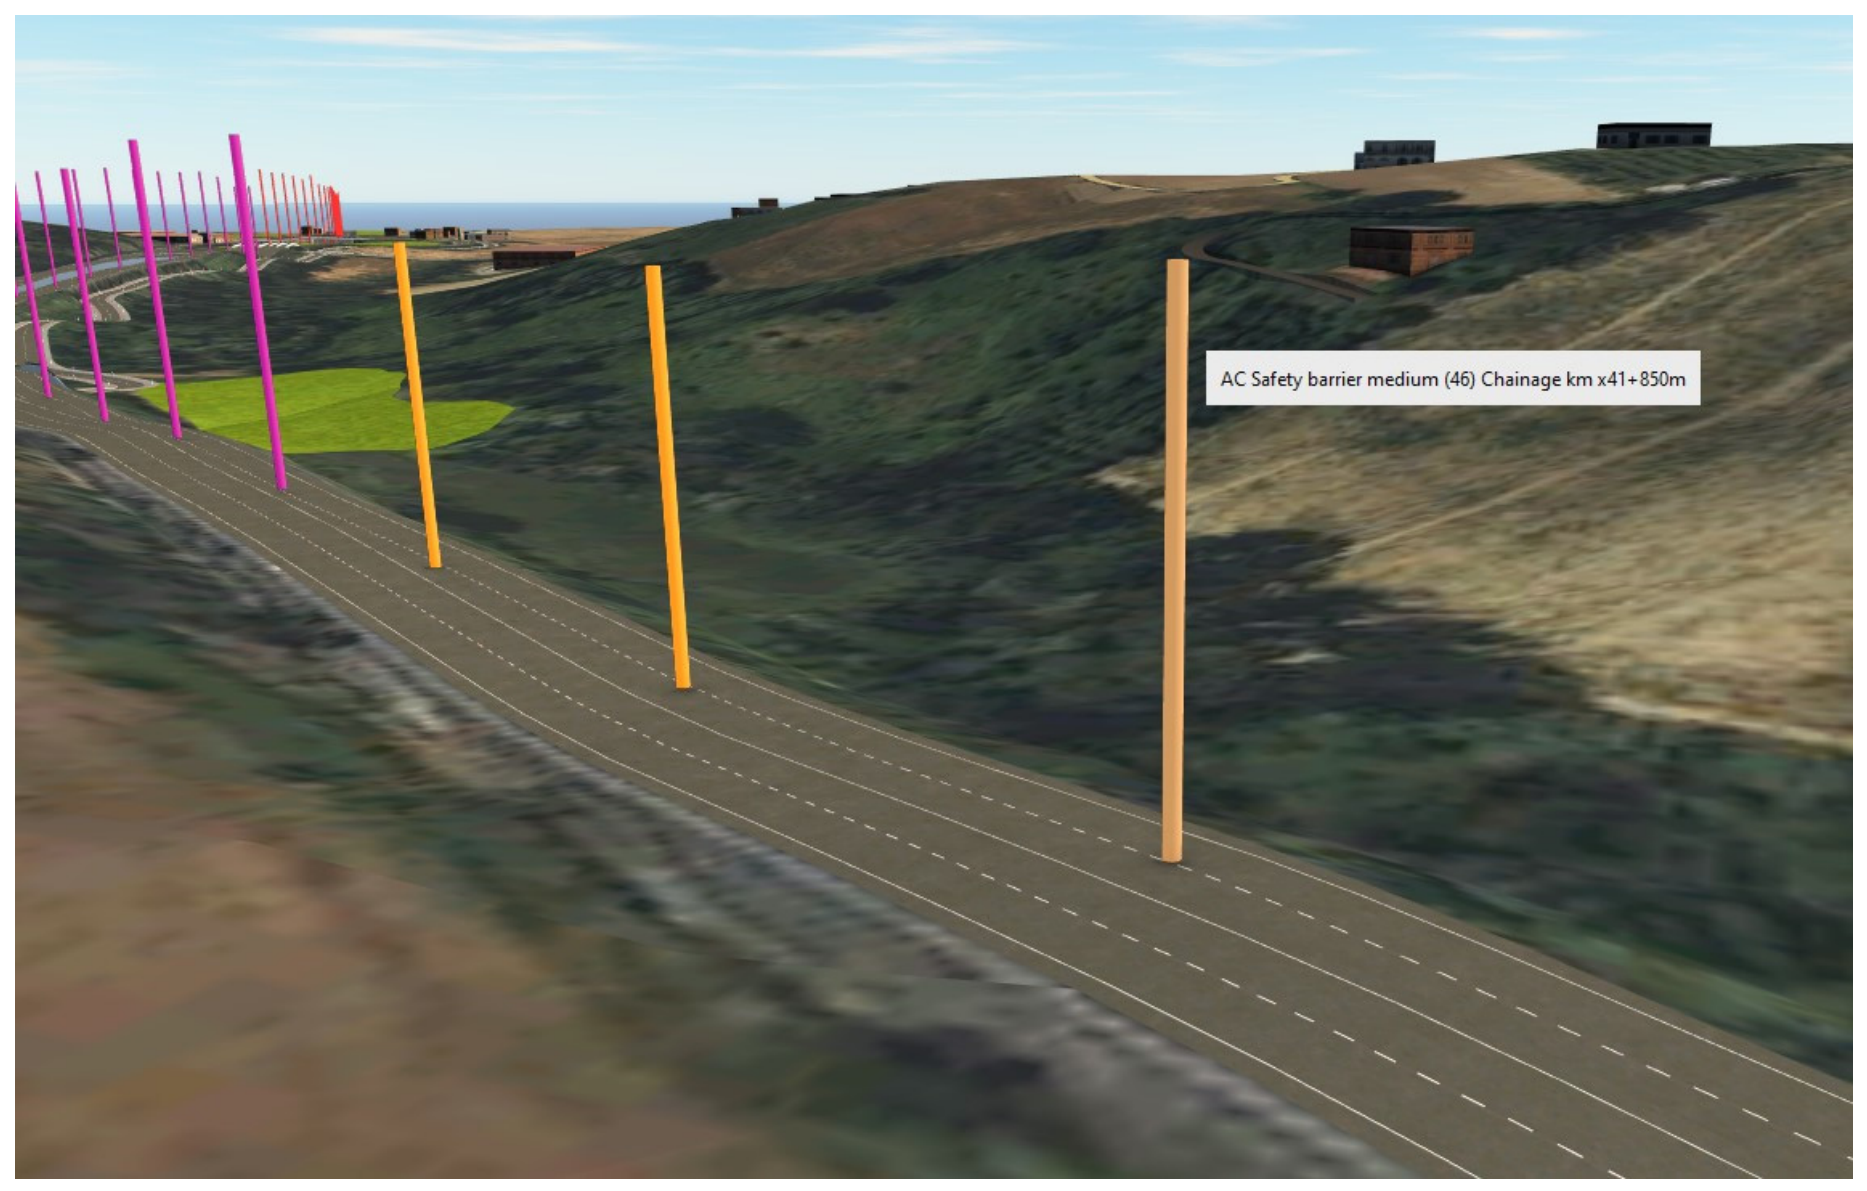
Figure 5 and
Figure 6 represent other visualization examples for the BPIs. As shown in
Figure 5, the operator can readily assess the overall component state (in terms of ACs) or specific critical aspects (by investigating the single parameter values C1, C2, C3), even by checking the properties of the BPIs objects, for more informed evaluations and decisions. Finally, in
Figure 6, an overview of the single AC BPIs is provided, with the color-scale characterization and evidence of useful tooltip in which numerical values can be immediately read by a simple mouse overlay.
On the other hand, the same model and data were exchanged to the second platform, a design-prone I-BIM platform, ready for detailed investigations, ensuring operational links with the subsequent design phases, in a more accurate and detailed environment, offering adequate representation accuracy. In this framework, alignment and cross section details were derived from the previously created simplified motorway model (
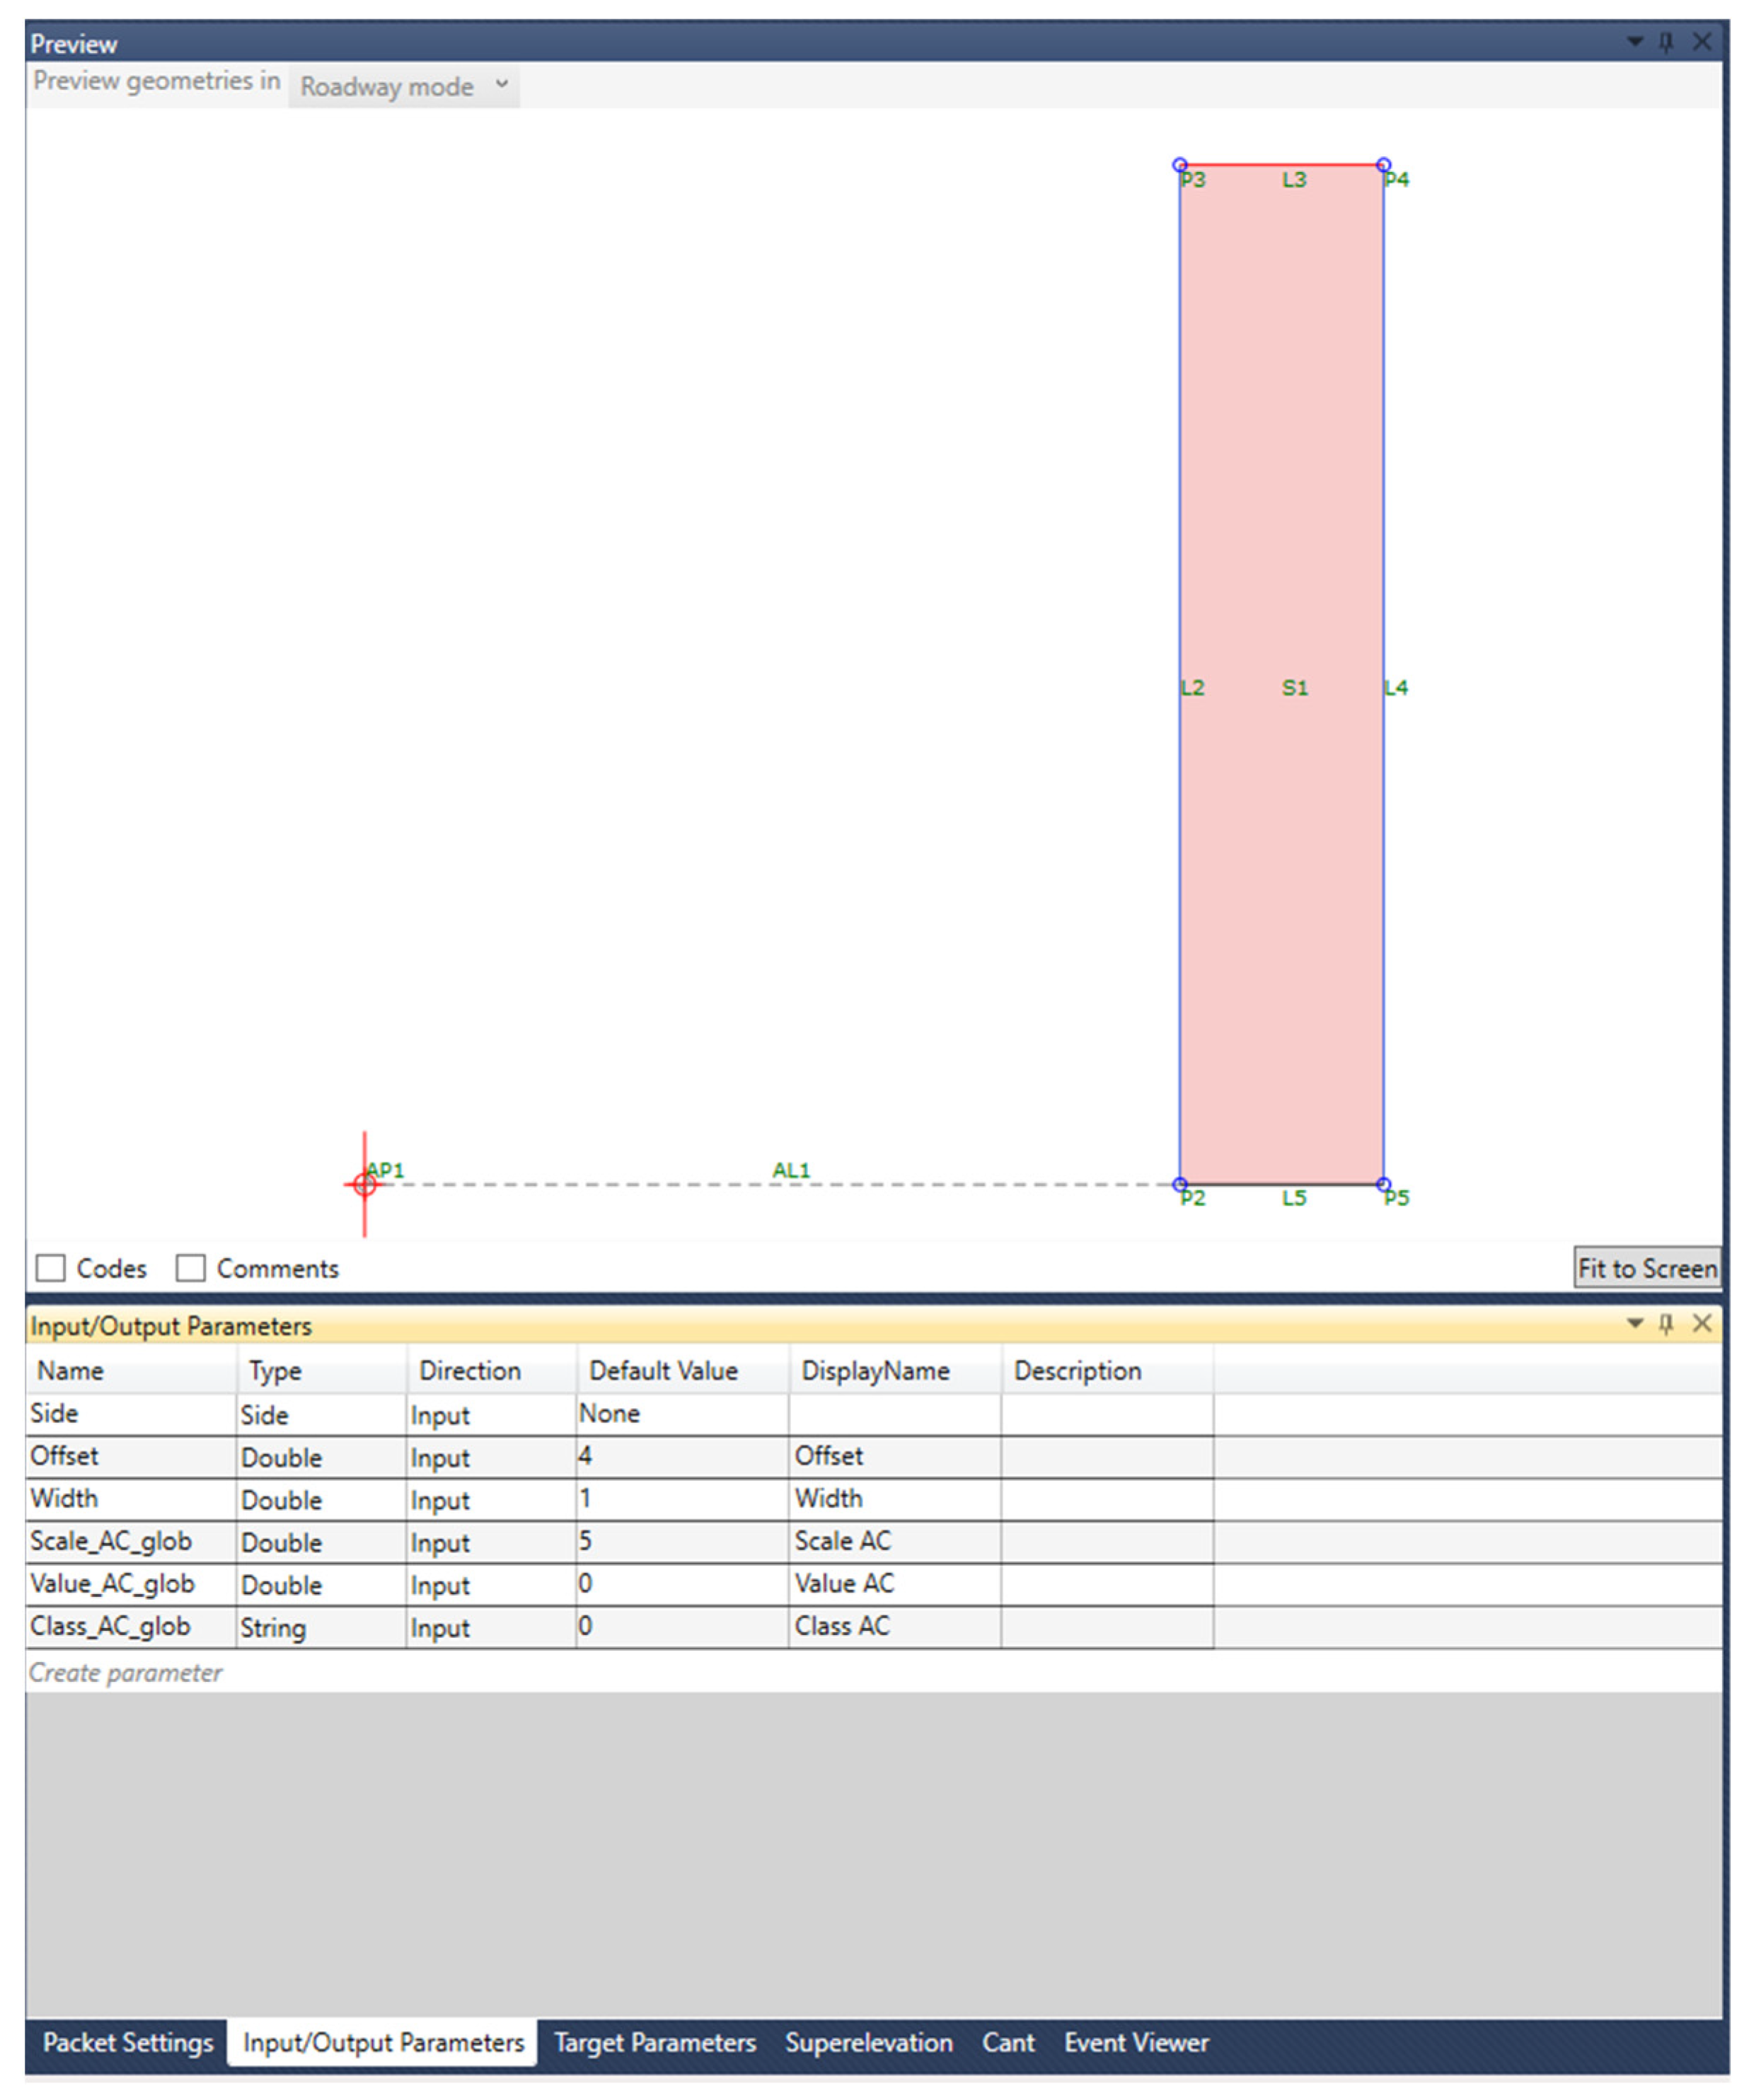
Figure 7 represents a plan view of the resulting imported model). Similarly, a dedicated sub-assembly was defined to act as a container of the relevant information and a representative tool. All these components were, then, processed to define the 3D solid model of the entire road can be defined, in which, based on the proposed approach, it would be possible to represent the AC of the traffic barriers on a 1 km base. In detail, a dedicate “Barrier Information Sub-Assembly” (BIS) was consequently created and specifically customized (
Figure 8). Intentionally, the BIS does not represent any real object along the road, but it only acts as a virtual storing and representation solution [
7]. As for the BPI, specific extended attributes were assigned to the BIS objects (again four for each segment), ensuring analogous shape and color characterization according to indicator and AC values.
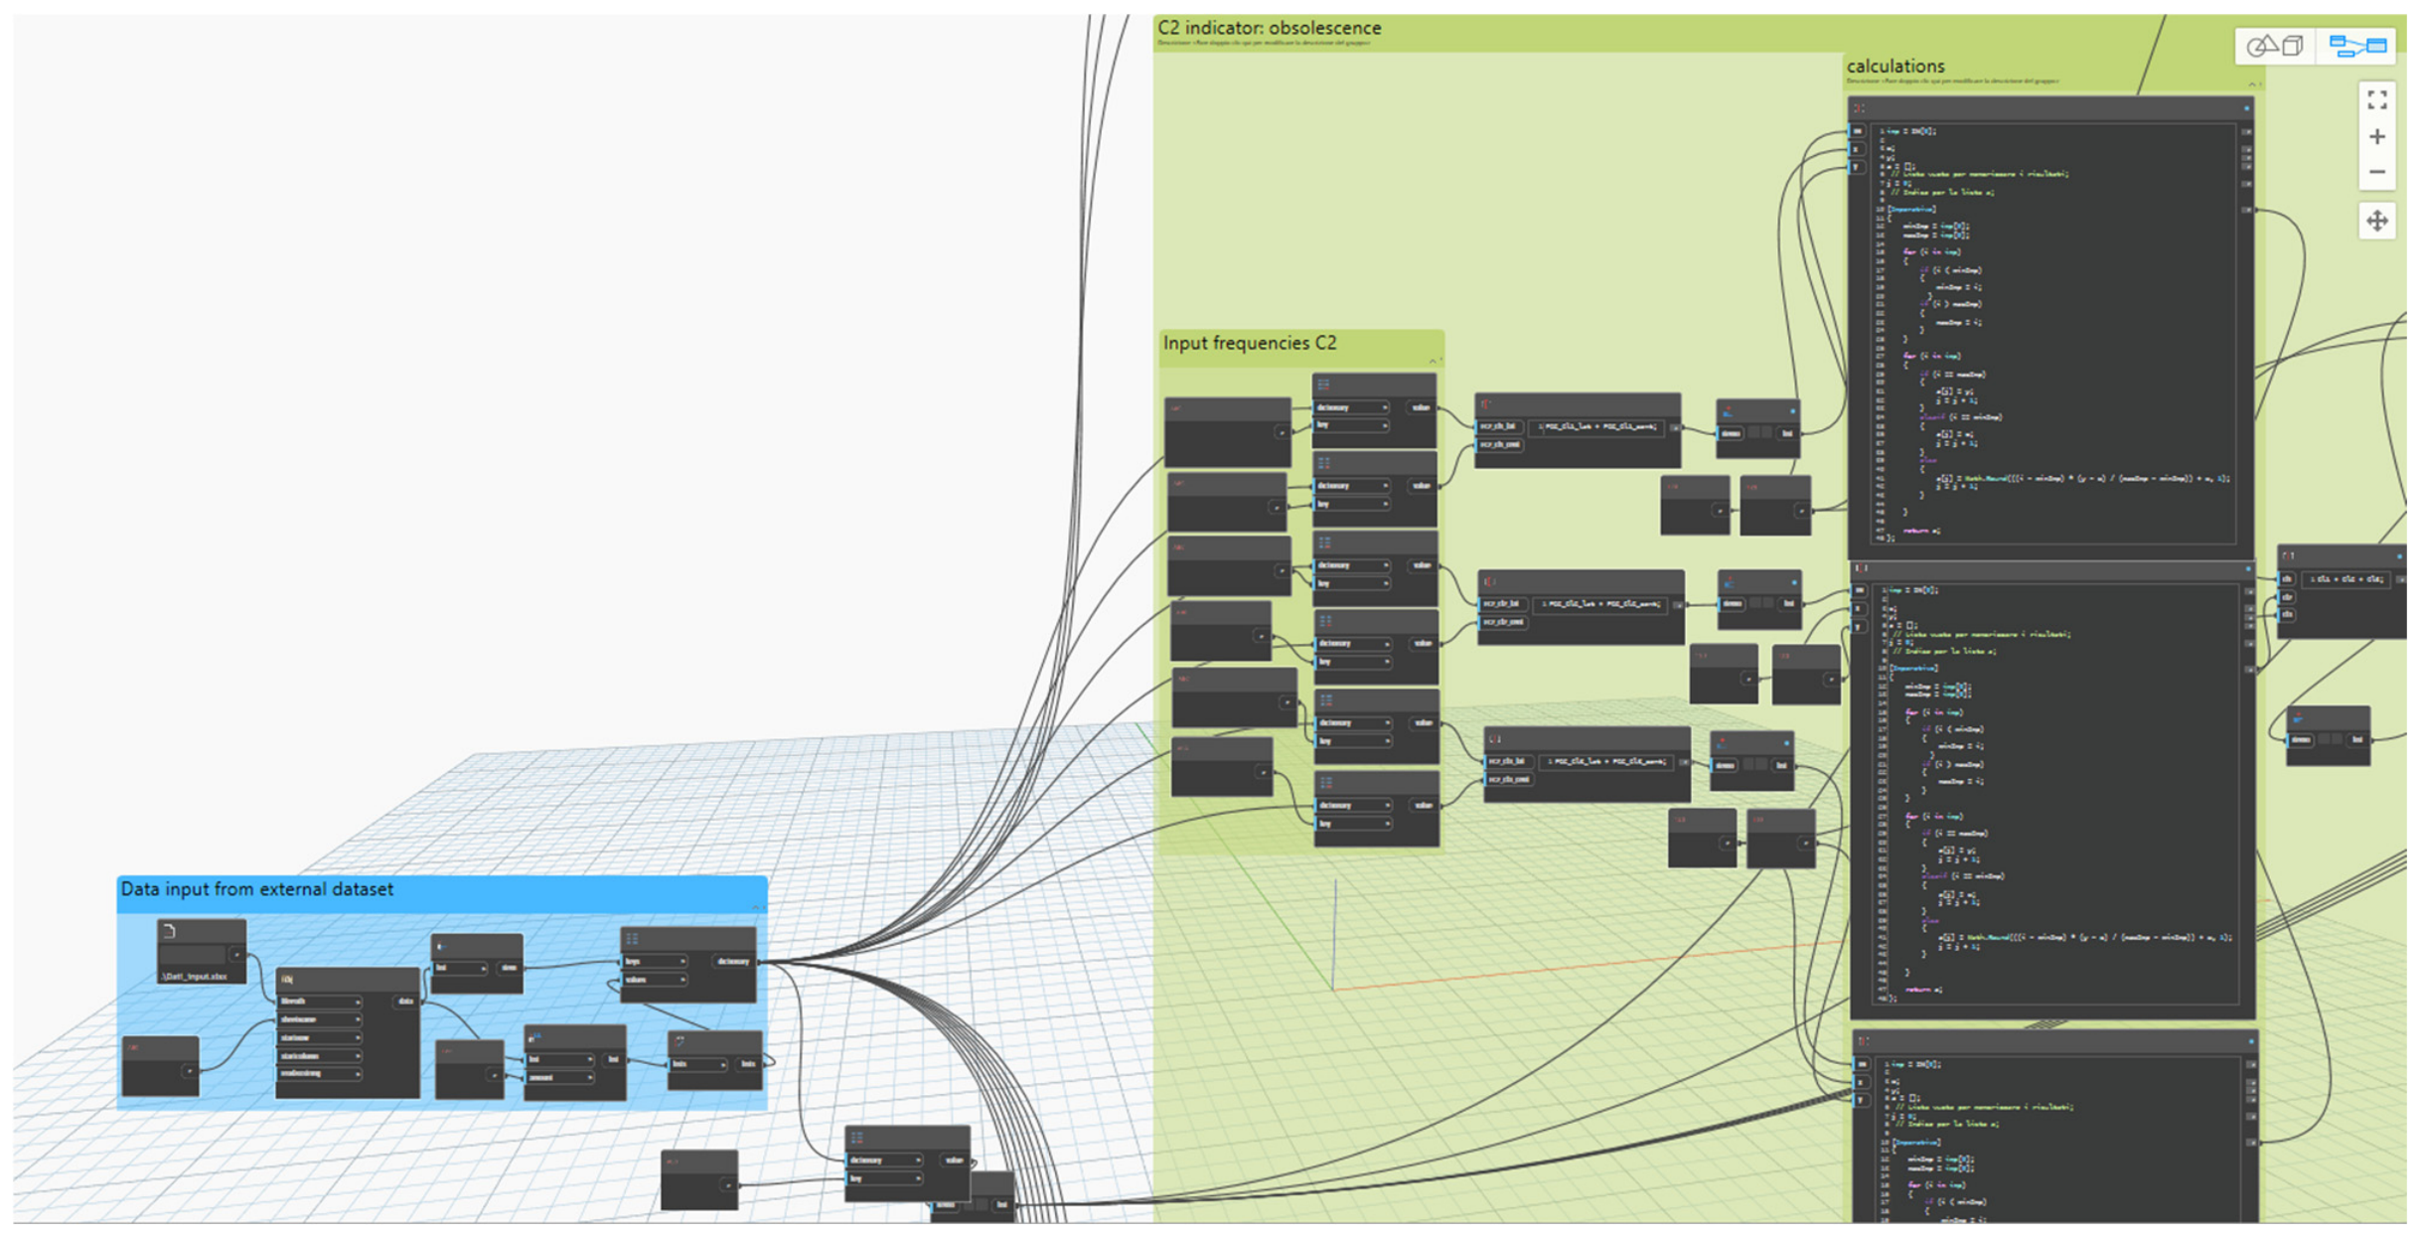
BIS attributes are enriched by numerical values and related information by means of original and customized routines developed in Dynamo
® (a powerful tool conceived for parametric visual coding, aiming at automatizing some activities in the BIM environment). Through these routines (an example view of which is provided in
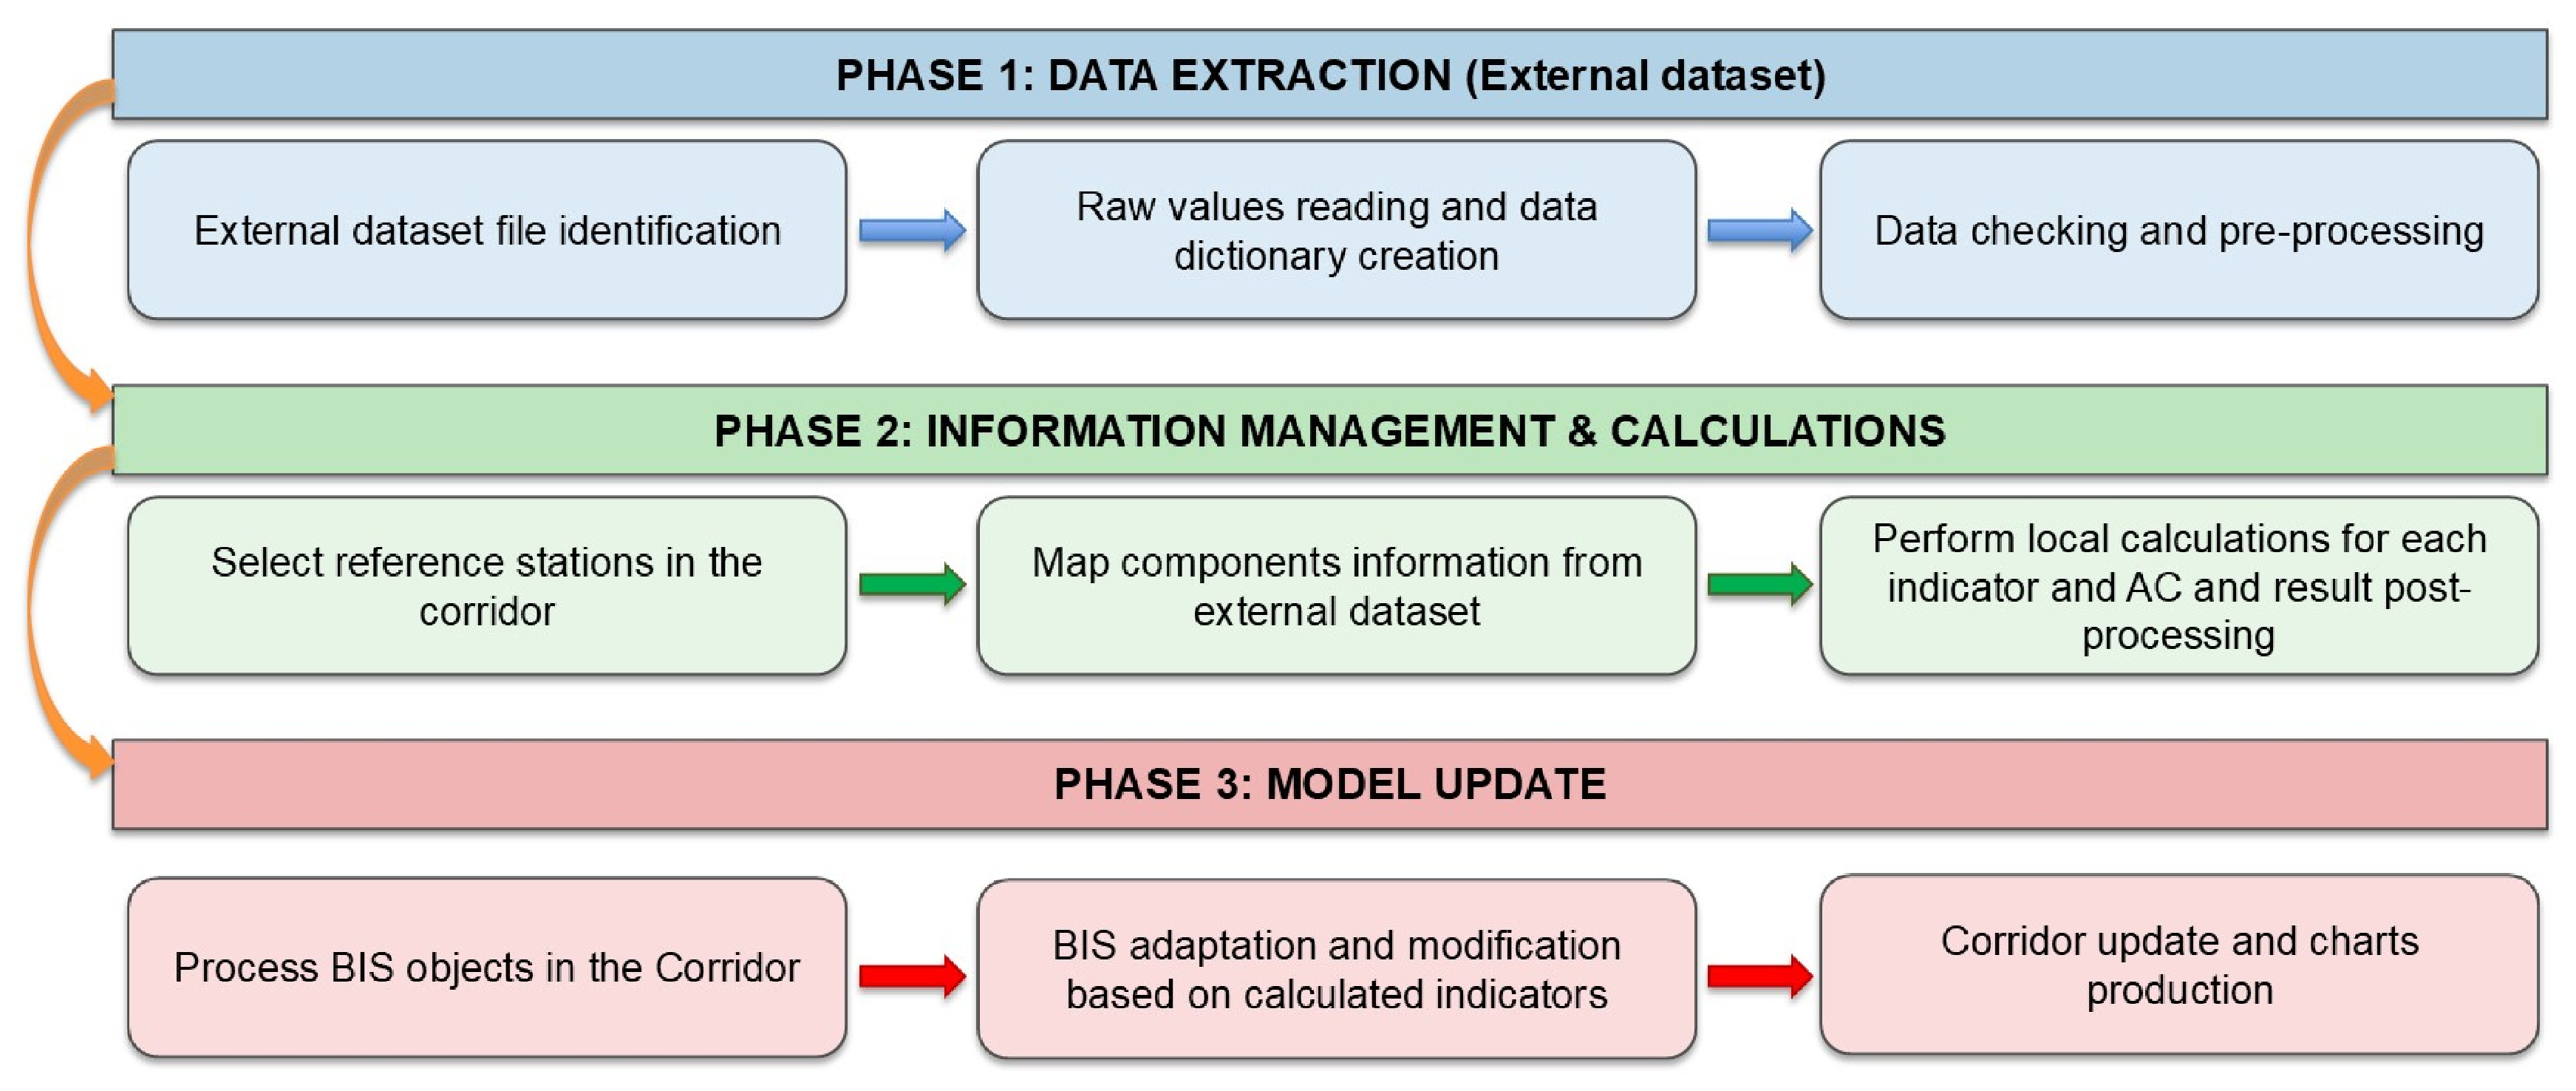
Figure 9), the involved parameters are read from an external database and linked to the various objects representative of the various segments and, thus, the parameters and AC defined in Section Attention Class Index can be calculated and represented in the 3D model. The logic workflow of the parametric visual coding routine for BIS handling and information update is provided in
Figure 10. Once the model is updated, the efficiency score of barrier segments can be evaluated and visualized in a more powerful operative environment, in which benefits of virtual screenings are coupled to those related to accurate design typical of such I-BIM platforms. An example view of the various indicators and the overall ACs for a selected segment of the motorway is provided in
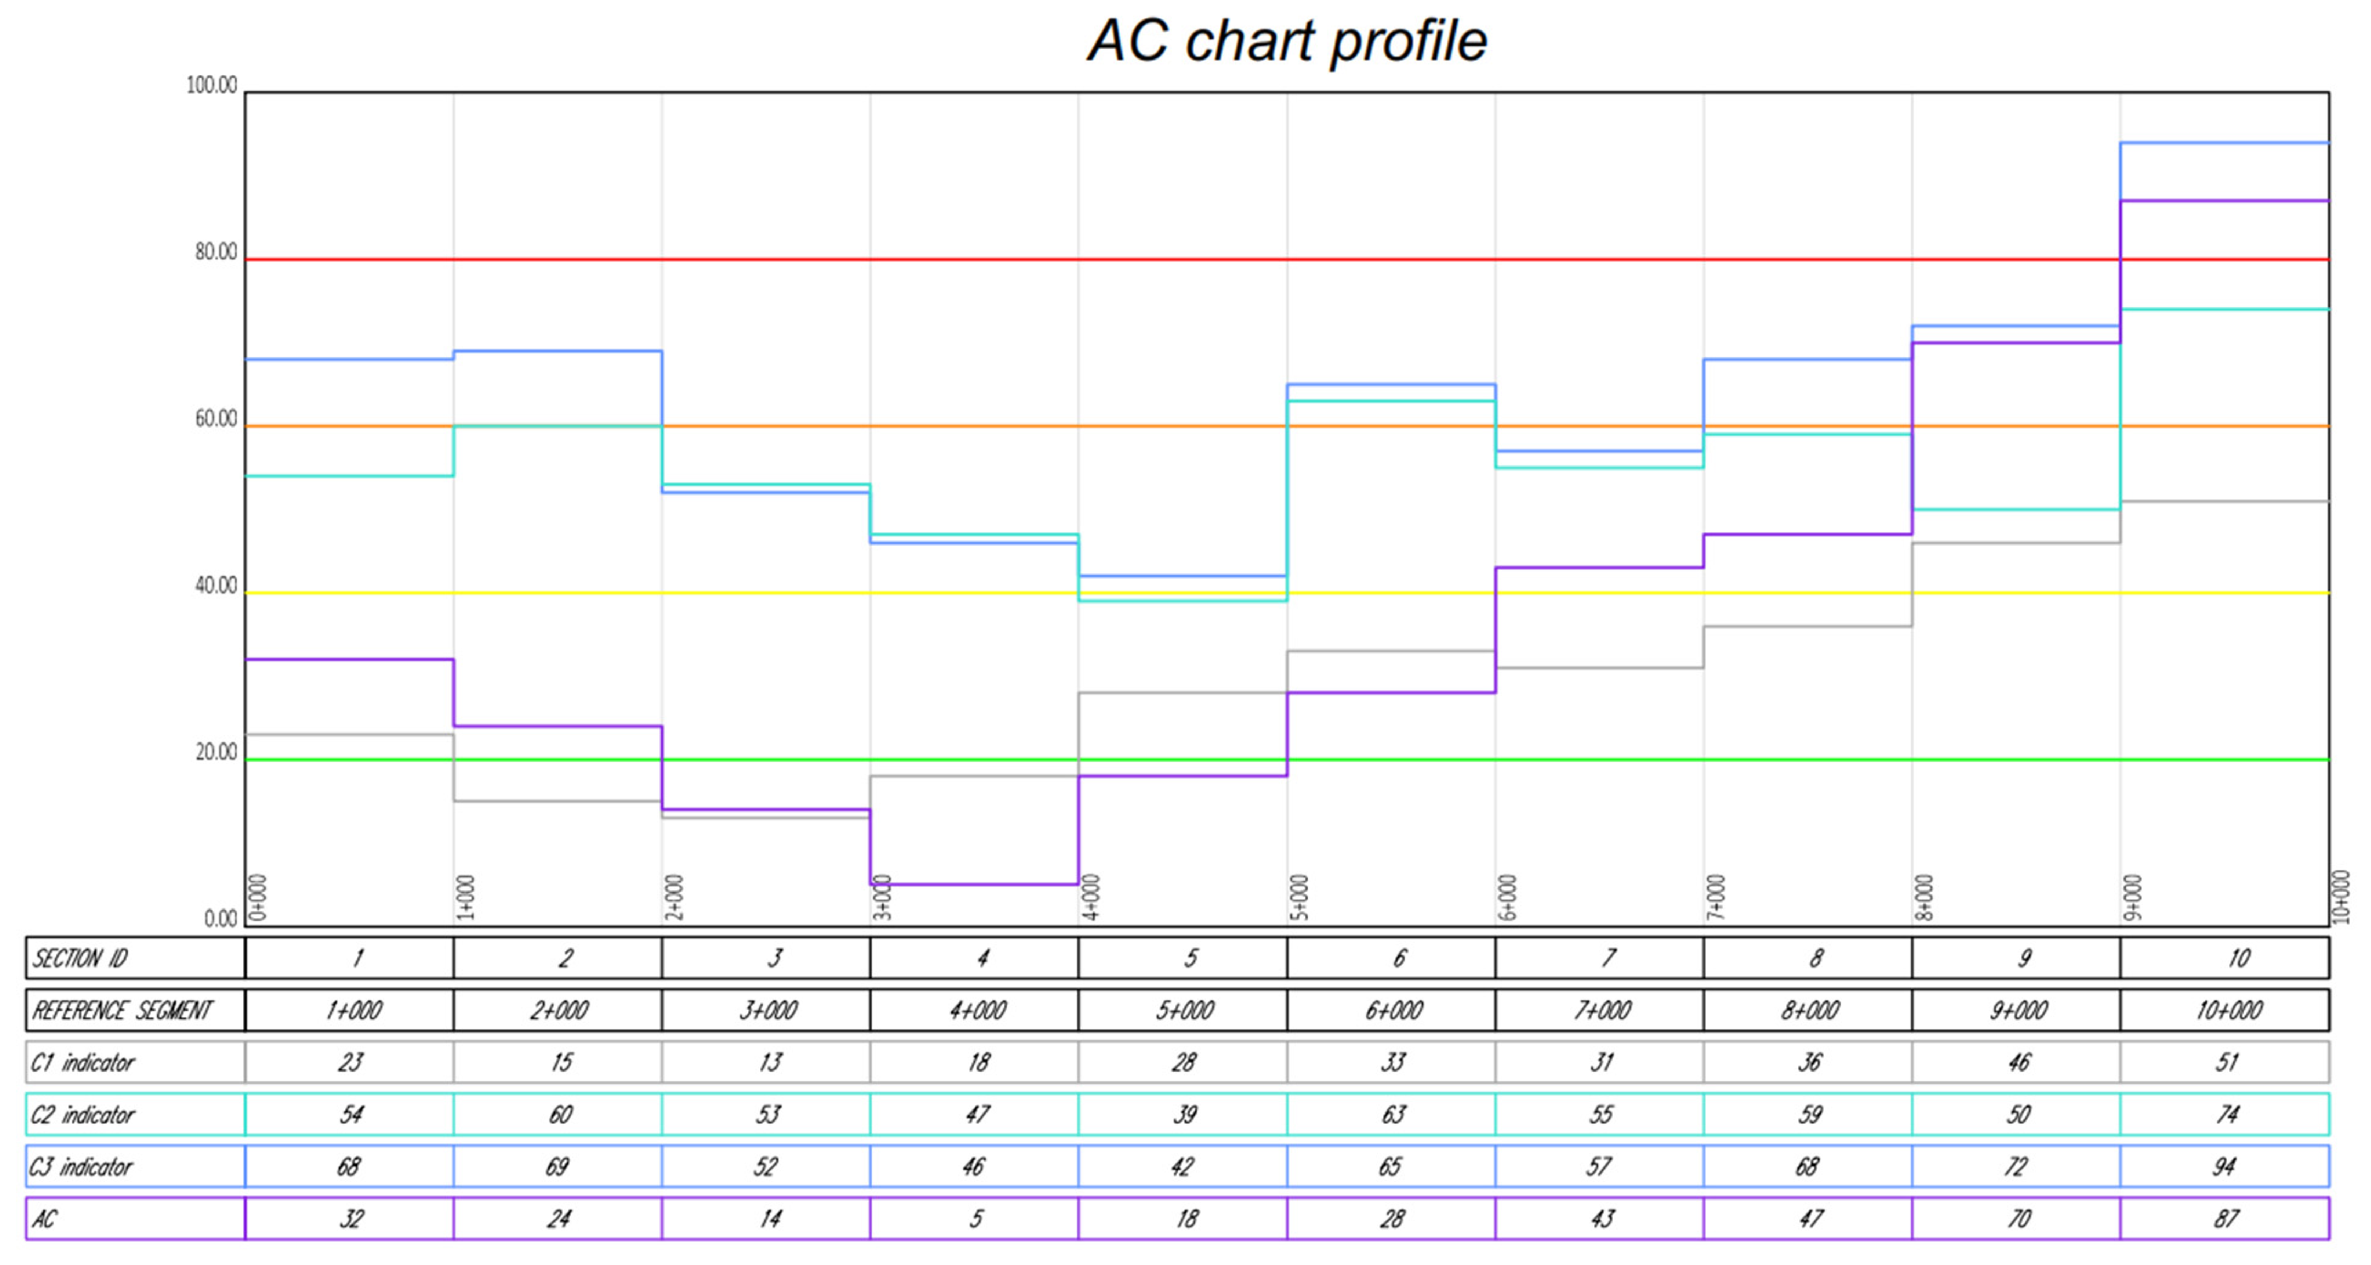
Figure 11. A similar view can be produced at each fixed station alongside the selected segment, for detailed reporting. Furthermore, it is also possible to represent the trend of the various indicators along the entire road, as in the representative chart provided in
Figure 12. This representation, directly developed in the same operative environment, ensures high clarity and an overall view of the asset along the selected road, simplifying the following evaluations and decision by the operators.
This framework can offer a more convenient environment in which evaluating the asset efficiency and defining the subsequent interventions by using dedicated tools and solutions for accurate design and representation of the different components, even for producing the required project tender documentation. Although this second approach can be defined as intervention design-prone, in this pilot study, only the AC estimation and representation procedure was considered, postponing the definition of intervention selection tools to future developments of the research.
5. Discussions
The objective of the study consisted in the development of an automated process for the initial phase of maintenance for identifying the priorities for the intervention of a road section, in relation to the safety barrier asset. The proposed framework permits the analysts to automate the procedure for determining and representing AC of safety barriers described in
Section 3, integrating it within appropriate and differentiated I-BIM environments. The AC of safety barriers was evaluated starting from the analysis of some significant parameters and easy-to-obtain administrative data that could indicate potential criticisms in their functionality.
Through the creation of specific scripts, both textual and visual, automated procedures were defined for the determination of both the basic indicators (C1, C2, C3) and the overall ACs of the asset safety barriers. The authors implemented operational solutions to perform visual representation of these indicators along the selected road segments, through customized smart objects. This will allow for quick asset screening, supporting operators in evidencing of the most critical sections from an administrative perspective. The proposed method does not concern barrier defect identification and localization and is not intended for local interventions and punctual restoration, but aims at identifying, at the network scale, homogeneous segments that, according to their geometrical, historical, and performance features, may require more urgent attention for renovation and improvement strategies and interventions.
The procedure was tested using an available dataset, related to the barriers installed along a pilot motorway section in Italy, in two different operating environments: a realistic tool for planning and preliminary design of infrastructures and an environment dedicated to detailed design.
The proposed operative protocols can store and clearly represent strategical information concerning barrier state, allowing maintenance operators to quickly define maintenance priorities. The operators, furthermore, can absolutely work in a more user-friendly and complete environment adapt to control the entire infrastructure life cycle. It is important, however, to state that available BIM commercial platforms are not conceived for managing these processes and variables through built-in solutions and methods, but the proposed results are specifically designed and involved in this research framework. Furthermore, the proposed procedures can be analogously applied in different alternative BIM environments, with remarkable benefits and advantages for road administrators and, in turn, users.
Figure 4,
Figure 6 and
Figure 8 summarize some results of the proposed approach for the analyzed case study by means of the customized smart objects. This can be useful for creating a condition- and performance-related dataset into the BIM environment that can be exploited in clear and comprehensive visual representations for effective asset condition evaluation and screening. These smart objects can simplify the evaluations and support road agency operators in identification of detailed survey needs and maintenance priorities.
The example presented in this paper effectively further proved the possibility of implementing road maintenance management processes in I-BIM environments. BIM can positively represent a reference framework for digital representation and management of road infrastructures. This was possible by defining original and optimized smart objects (
Figure 4 and
Figure 8) and algorithms (
Figure 2,
Figure 3 and
Figure 10) based on adequate quality factors, overpassing limitations of traditional operative platforms. The proposed methodology ensures asset screening in realistic 3D environments, even with immediate links with intervention design phases. This can simplify handling asset conditions and efficiency data in a realistic environment including a digital model of the road informatively adequate for network-scale management needs, offering a further demonstration of the effective potential of introducing RMS processes and concepts in modern BIM environments, even though the selected software tools are basically designed for planning or executive design of transport infrastructures.
Advantages, Limitations, and Future Studies
In summary, the framework proposed in the manuscript provides the following advantages:
Definition of a network-scale attention class indicator, useful for ranking road segments based on easily-to-obtain administrative data concerning road safety barriers and, thus activating the consequent prioritized decisions (detailed surveys, maintenance planning, etc.);
Possibility of performing quick and effective asset feature screening in a BIM-based realistic environment, helping operators rapidly identify critical segments and creating a user-friendly digital workspace for managing infrastructure life cycle data;
Improvement in clarity and visualization of asset conditions and interoperable workflows across different BIM platforms, allowing continuity between preliminary analysis and detailed design phases.
Further extension of the capability of existing BIM platforms, which are not originally designed for road asset maintenance management, by introducing customized algorithms and smart objects;
Effective demonstration of scalability to other infrastructure components (e.g., pavements, signage, tunnels), supporting unified network-scale maintenance management.
Although the proposed framework demonstrates the potential of introducing maintenance-oriented procedures within I-BIM environments, some limitations should be mentioned. First, the adoption of a 1 km segmentation and the moving-average process may conceal localized defects or abrupt variations in barrier conditions. Moreover, the reliability of the procedure is strongly dependent on the quality, availability, and consistency of administrative input data, which may vary significantly across different networks and agencies, affecting the robustness of the AC estimation. In the proposed approach, the methodology relies on an expert-based definition of the AC weights, useful for testing purposes; however, although the weights were introduced to hierarchically order the involved parameters, different selection criteria will be tested in future applications. Finally, the approach was fully characterized in compliance with Italian regulatory classes for barrier obsolescence and performance, but transferring the methodology to different national contexts requires adequate adaptation of regulatory parameters and classification logic, although the overall framework can be effectively maintained.
Future developments will focus on overcoming these limitations, considering for example multi-scale segmentation (e.g., sub-kilometric intervals) to better capture localized variations while maintaining network-scale operability of automated consistency checks to ensure data quality control. Further work will also, eventually, extend the methodology to integrate AI-based automated inspection outputs—including computer-vision damage detection from mobile laser scanners data—into the BIM workflow to enable fully automated and continuously updated barrier assessments, beyond administrative and characterization data only. Indeed, this approach can be boosted by leveraging the results of automated inspection of the barrier components using computer vision and damage recognition approaches, by providing a fully automated procedure for effective asset management, with focus on punctual and local criticisms and urgent renovation needs also.
In conclusion, while the current research provides a structured digital representation of the asset, for more clarity, the proposed solution should be categorized at a ‘static digital asset’ level. In the context of emerging Digital Twin technologies, this informative layer may serve as the fundamental prerequisite for any future dynamic implementation. By establishing the logic for automated data input and risk-based classification, the proposed model provides the necessary foundation upon which, in future developments of the operative framework, real-time sensor data and synchronization—typical of a full DT—can be subsequently integrated, even for localized distress detection and more detailed maintenance-related applications.