Article

Geometric Radiomic Analysis of Hip Joint Space for Automatic Detection of Developmental Dysplasia of the Hip in Infants


by
Olga Sitsiani
1,†,
Andreas Vezakis
1,†,
Nektaria Karangeli
2,
Ioannis Vezakis
1,
Stavros T. Miloulis
1,
Eleftherios Kontopodis
3,
Ioannis Kakkos
1,3 and
George K. Matsopoulos
1,*
1
Biomedical Engineering Laboratory, School of Electrical & Computer Engineering, National Technical University of Athens, 15773 Athens, Greece
2
School of Medicine, National and Kapodistrian University of Athens, 11527 Athens, Greece
3
Department of Biomedical Engineering, University of West Attica, 12243 Athens, Greece
*
Author to whom correspondence should be addressed.
These authors contributed equally to this work.
Appl. Sci. 2026, 16(9), 4345; https://doi.org/10.3390/app16094345
Submission received: 6 April 2026 / Revised: 24 April 2026 / Accepted: 27 April 2026 / Published: 29 April 2026
(This article belongs to the Section Biomedical Engineering)

Featured Application

This work presents a computer-aided approach for the early detection of developmental dysplasia of the hip (DDH) in infant pelvic radiographs. By extracting geometric and radiomic features from the hip joint articulation space, the proposed methodology can serve as a supplementary diagnostic tool to assist pediatric orthopedists and radiologists in identifying dysplastic hips with improved objectivity and interpretability. The approach can be particularly applicable to screening programs where standardized, quantitative assessment is needed to reduce observer variability and support timely clinical decision-making.

Abstract

Developmental dysplasia of the hip (DDH) is a common musculoskeletal disorder in infancy, and early detection is essential for optimal clinical outcomes. Radiographic assessment is traditionally based on angular measurements, which may be limited by variability in landmark identification and do not fully capture the complex morphology of the hip joint. In this study, we investigate whether geometric features derived from the hip joint articulation space can be used to differentiate between normal and dysplastic hips in infant radiographs. Pelvic X-ray images from infants (mean age 4.5 ± 0.83 months) were analyzed, and custom segmentation masks were developed to isolate the joint space region. A total of 99 geometric and radiomic features were extracted and evaluated using statistical analysis and supervised machine learning methods. Multiple features demonstrated strong discriminative power between normal and DDH (p < 0.001), with shape and spatial distribution characteristics showing the highest relevance. Classification models achieved an F1-score of approximately 80% on the full dataset. Notably, patient age was identified as a significant confounding factor, and analysis on an age-matched subset improved classification performance to 94% accuracy and 93% recall. These findings suggest that geometric characterization of the hip joint space provides a promising and interpretable framework for DDH detection. The results also highlight the importance of age-stratified analysis in pediatric imaging. Further validation on larger and more diverse datasets is required to assess clinical applicability.

1. Introduction

Developmental dysplasia of the hip (DDH) is one of the most common musculoskeletal disorders in infancy, with an estimated incidence of 1–5 cases per 1000 live births [1,2]. The condition encompasses a spectrum of abnormalities characterized by insufficient acetabular development and an abnormal relationship between the femoral head and the acetabulum [3,4]. If left untreated, DDH may lead to long-term complications including joint instability, gait abnormalities, chronic pain, and early-onset osteoarthritis [4,5]. Consequently, early and reliable detection remains a critical objective in pediatric orthopedic care [6].
Initial screening for DDH is typically performed through clinical examination using maneuvers such as the Ortolani and Barlow tests [4]. However, the sensitivity of these methods decreases beyond the neonatal period and in cases of mild dysplasia [6]. Imaging therefore plays a central role in diagnosis and follow-up. Ultrasonography is the preferred modality in early infancy due to the cartilaginous nature of the proximal femur, while anteroposterior pelvic radiography becomes the primary imaging tool after the onset of ossification [7,8], typically around four to six months of age [8].
Radiographic evaluation of DDH is traditionally based on geometric measurements derived from anatomical landmarks, including the acetabular index and reference lines such as Hilgenreiner’s, Perkin’s, and Shenton’s lines [9,10]. While clinically useful, these measurements represent simplified descriptors of a structurally complex joint and are susceptible to variability arising from patient positioning, incomplete ossification, and observer-dependent landmark identification [11]. An illustrative example of Shenton’s line in a normal and dysplastic hip is shown in Figure 1.
Recent advances in medical image analysis have introduced machine learning and deep learning techniques for automated DDH detection [12,13,14,15,16]. Although these approaches have demonstrated promising diagnostic performance, they often rely on global image features and operate as “black-box” models, limiting interpretability and raising concerns regarding clinical trust and potential bias [17]. Moreover, these methodologies predominantly focus on ultrasound-based assessment, with radiograph-based DDH classification remaining largely underexplored. Given that X-ray imaging offers a more quantifiable depiction of the actual hip geometry, addressing this has particular clinical significance.
From a pathophysiological perspective, DDH fundamentally alters the spatial relationship between the femoral head and the acetabulum [18,19,20]. Therefore, the morphology of the hip joint articulation space itself may provide a more direct and informative representation of dysplastic changes. Despite this, the geometric properties of this region have not been systematically investigated as quantitative imaging biomarkers in infant pelvic radiographs.
This study proposes a novel methodology for DDH assessment based on geometric characterization of the hip joint space. Specifically, we develop segmentation masks to isolate the articulation region and extract geometric and radiomic features describing its shape and spatial properties. We hypothesize that these features can effectively differentiate normal from dysplastic hips while providing improved interpretability compared to conventional deep learning approaches. Furthermore, we investigate the influence of patient age on classification performance, highlighting its role as a critical confounding factor in radiographic analysis of infant hip morphology.

2. Related Works

Recent years have seen increasing application of machine learning and deep learning techniques in the diagnosis of developmental dysplasia of the hip (DDH), particularly in ultrasound imaging, which remains the standard modality for early infant screening.
Golan et al. (2016) introduced a deep convolutional neural network framework for automated implementation of Graf’s method, incorporating segmentation and landmark detection to extract clinically relevant measurements [13]. Similarly, Lee et al. (2021) developed a multi-task deep learning system based on Mask R-CNN for segmentation of anatomical structures and key-point detection, achieving good agreement with expert measurements in ultrasound-based DDH assessment [15]. These approaches demonstrate the potential of automation in replicating established diagnostic protocols. Nevertheless, although deep learning approaches demonstrate considerable promise in automated pathology classification, significant challenges persist, including susceptibility to overfitting on small datasets, limited generalizability across diverse patient populations and imaging conditions, and reduced performance on underrepresented or ambiguous classes [21,22].
In contrast, fewer studies have focused on X-ray-based DDH detection, despite radiography being the primary imaging modality after ossification. Fraiwan et al. (2022) applied deep transfer learning for classification of DDH from pelvic radiographs without relying on explicit geometric measurements [14], while Magnéli et al. (2024) developed deep learning models for diagnosis and severity classification of hip dysplasia in radiographic images [16]. Although these methods report strong classification performance, they predominantly rely on global image features and offer limited interpretability regarding the anatomical structures driving the predictions.
The lack of interpretability in deep learning models presents a significant limitation for clinical adoption, as it remains unclear whether predictions are based on pathologically relevant features or confounded by non-clinical factors such as image acquisition variability or demographic patterns [12,17]. This has motivated interest in alternative approaches that emphasize explainable and anatomically meaningful feature extraction. Finally, inherent bias within the dataset may influence the results, as physician-annotated measurements are embedded in the imaging samples, potentially guiding model predictions.
In this context, traditional radiographic assessment relies on predefined geometric measurements, such as the acetabular index and reference lines, which provide interpretable but simplified representations of hip morphology [9,10]. However, these measurements do not capture the full complexity of the joint structure and may overlook subtle spatial variations associated with early dysplasia.
Although recent deep learning systems have demonstrated the ability to automatically measure the acetabular index with accuracy comparable to experienced clinicians [23,24], these approaches remain fundamentally limited to replicating predefined angular measurements. They automate the conventional diagnostic workflow rather than expanding the morphological characterization of the hip joint. Consequently, complex spatial and shape-level properties of the articulation space—which may capture early dysplastic changes that are not reflected in a single angular metric—remain unexploited. The present study addresses this limitation by extracting a comprehensive set of geometric and radiomic descriptors from the joint space region itself, moving beyond measurement automation toward the discovery of novel, interpretable imaging biomarkers for DDH.
The present study addresses this gap by focusing on the geometric characterization of the hip joint articulation space, a region directly affected by the pathological changes in DDH. By combining targeted segmentation with geometric radiomic feature extraction, our approach aims to provide an interpretable methodology that captures complex morphological variations beyond conventional measurements while avoiding the opacity of end-to-end deep learning models.
From a broader perspective, the choice between handcrafted feature-based approaches and end-to-end deep learning in medical imaging involves well-documented tradeoffs. Deep learning models can learn complex representations directly from raw data but typically require large annotated datasets, are susceptible to overfitting on limited samples, and offer reduced interpretability compared to handcrafted approaches. As recent reviews have emphasized, the decision between these two paradigms should be made on a study-specific basis, considering dataset size, clinical requirements, and the importance of model transparency. In particular, handcrafted radiomics retain a distinct advantage when interpretability is valued and when domain expertise can be leveraged to inform feature design [25,26]. However, the present study is not positioned primarily as a technical alternative to deep learning. Rather, its main contribution lies in the clinical and anatomical insight gained from the systematic geometric analysis of the hip joint articulation space—a region that, despite being directly affected by the pathophysiology of DDH, has not been previously investigated as a source of quantitative imaging biomarkers.

3. Materials and Methods

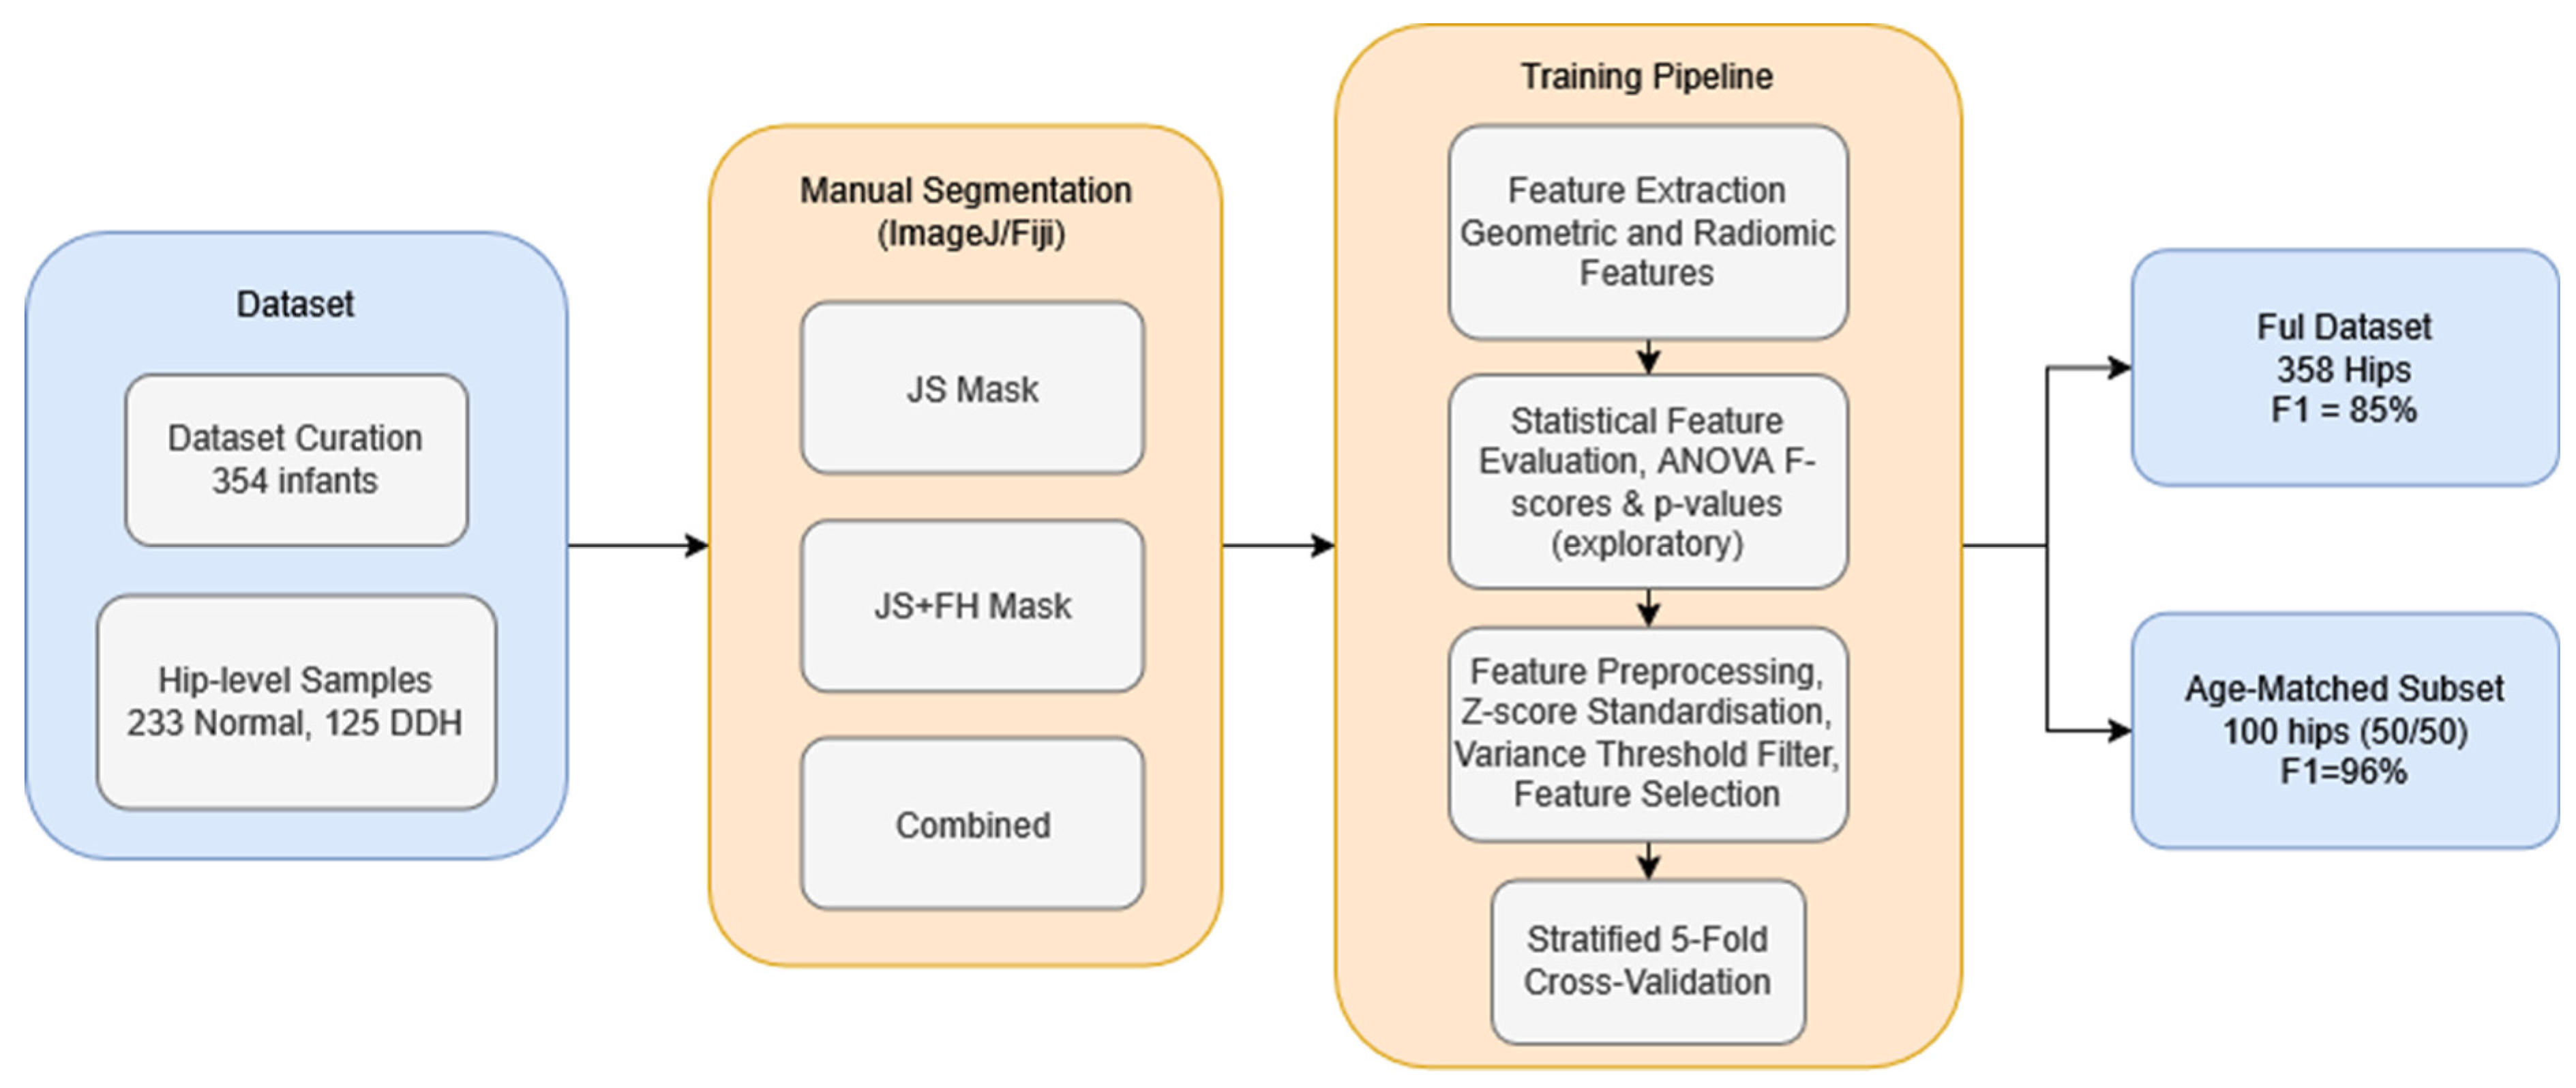
The methodology followed in this study is summarized in Figure 2 and described in detail in the following subsections.

3.1. Dataset Descriptiom

This study utilized a publicly available dataset previously employed by Fraiwan et al. [14], consisting of anteroposterior pelvic radiographs from 354 infants (120 with DDH and 234 normal cases) with a mean age of 4.5 ± 0.83 months. The images were acquired from two hospitals in northern Jordan as part of a DDH screening program.
Following quality control, 175 radiographs were excluded from the original 354 due to the presence of motion blur and imaging artifacts that compromised image quality to an extent that prevented the doctor from performing reliable manual segmentation.
The final dataset comprised 179 radiographs (100 normal and 79 DDH). Each hip joint was treated as an independent sample, resulting in 233 normal hips and 125 dysplastic hips. Since the proposed approach relies exclusively on geometric features rather than raw image data, any clinician annotations or measurements visible on the X-ray images do not influence the classification results.
For dysplastic cases, laterality was further examined: 33 cases involved the left hip, four involved the right hip, and 42 were bilateral. This ensured accurate labeling at the hip level.

3.2. Region of Interest and Mask Segmentation

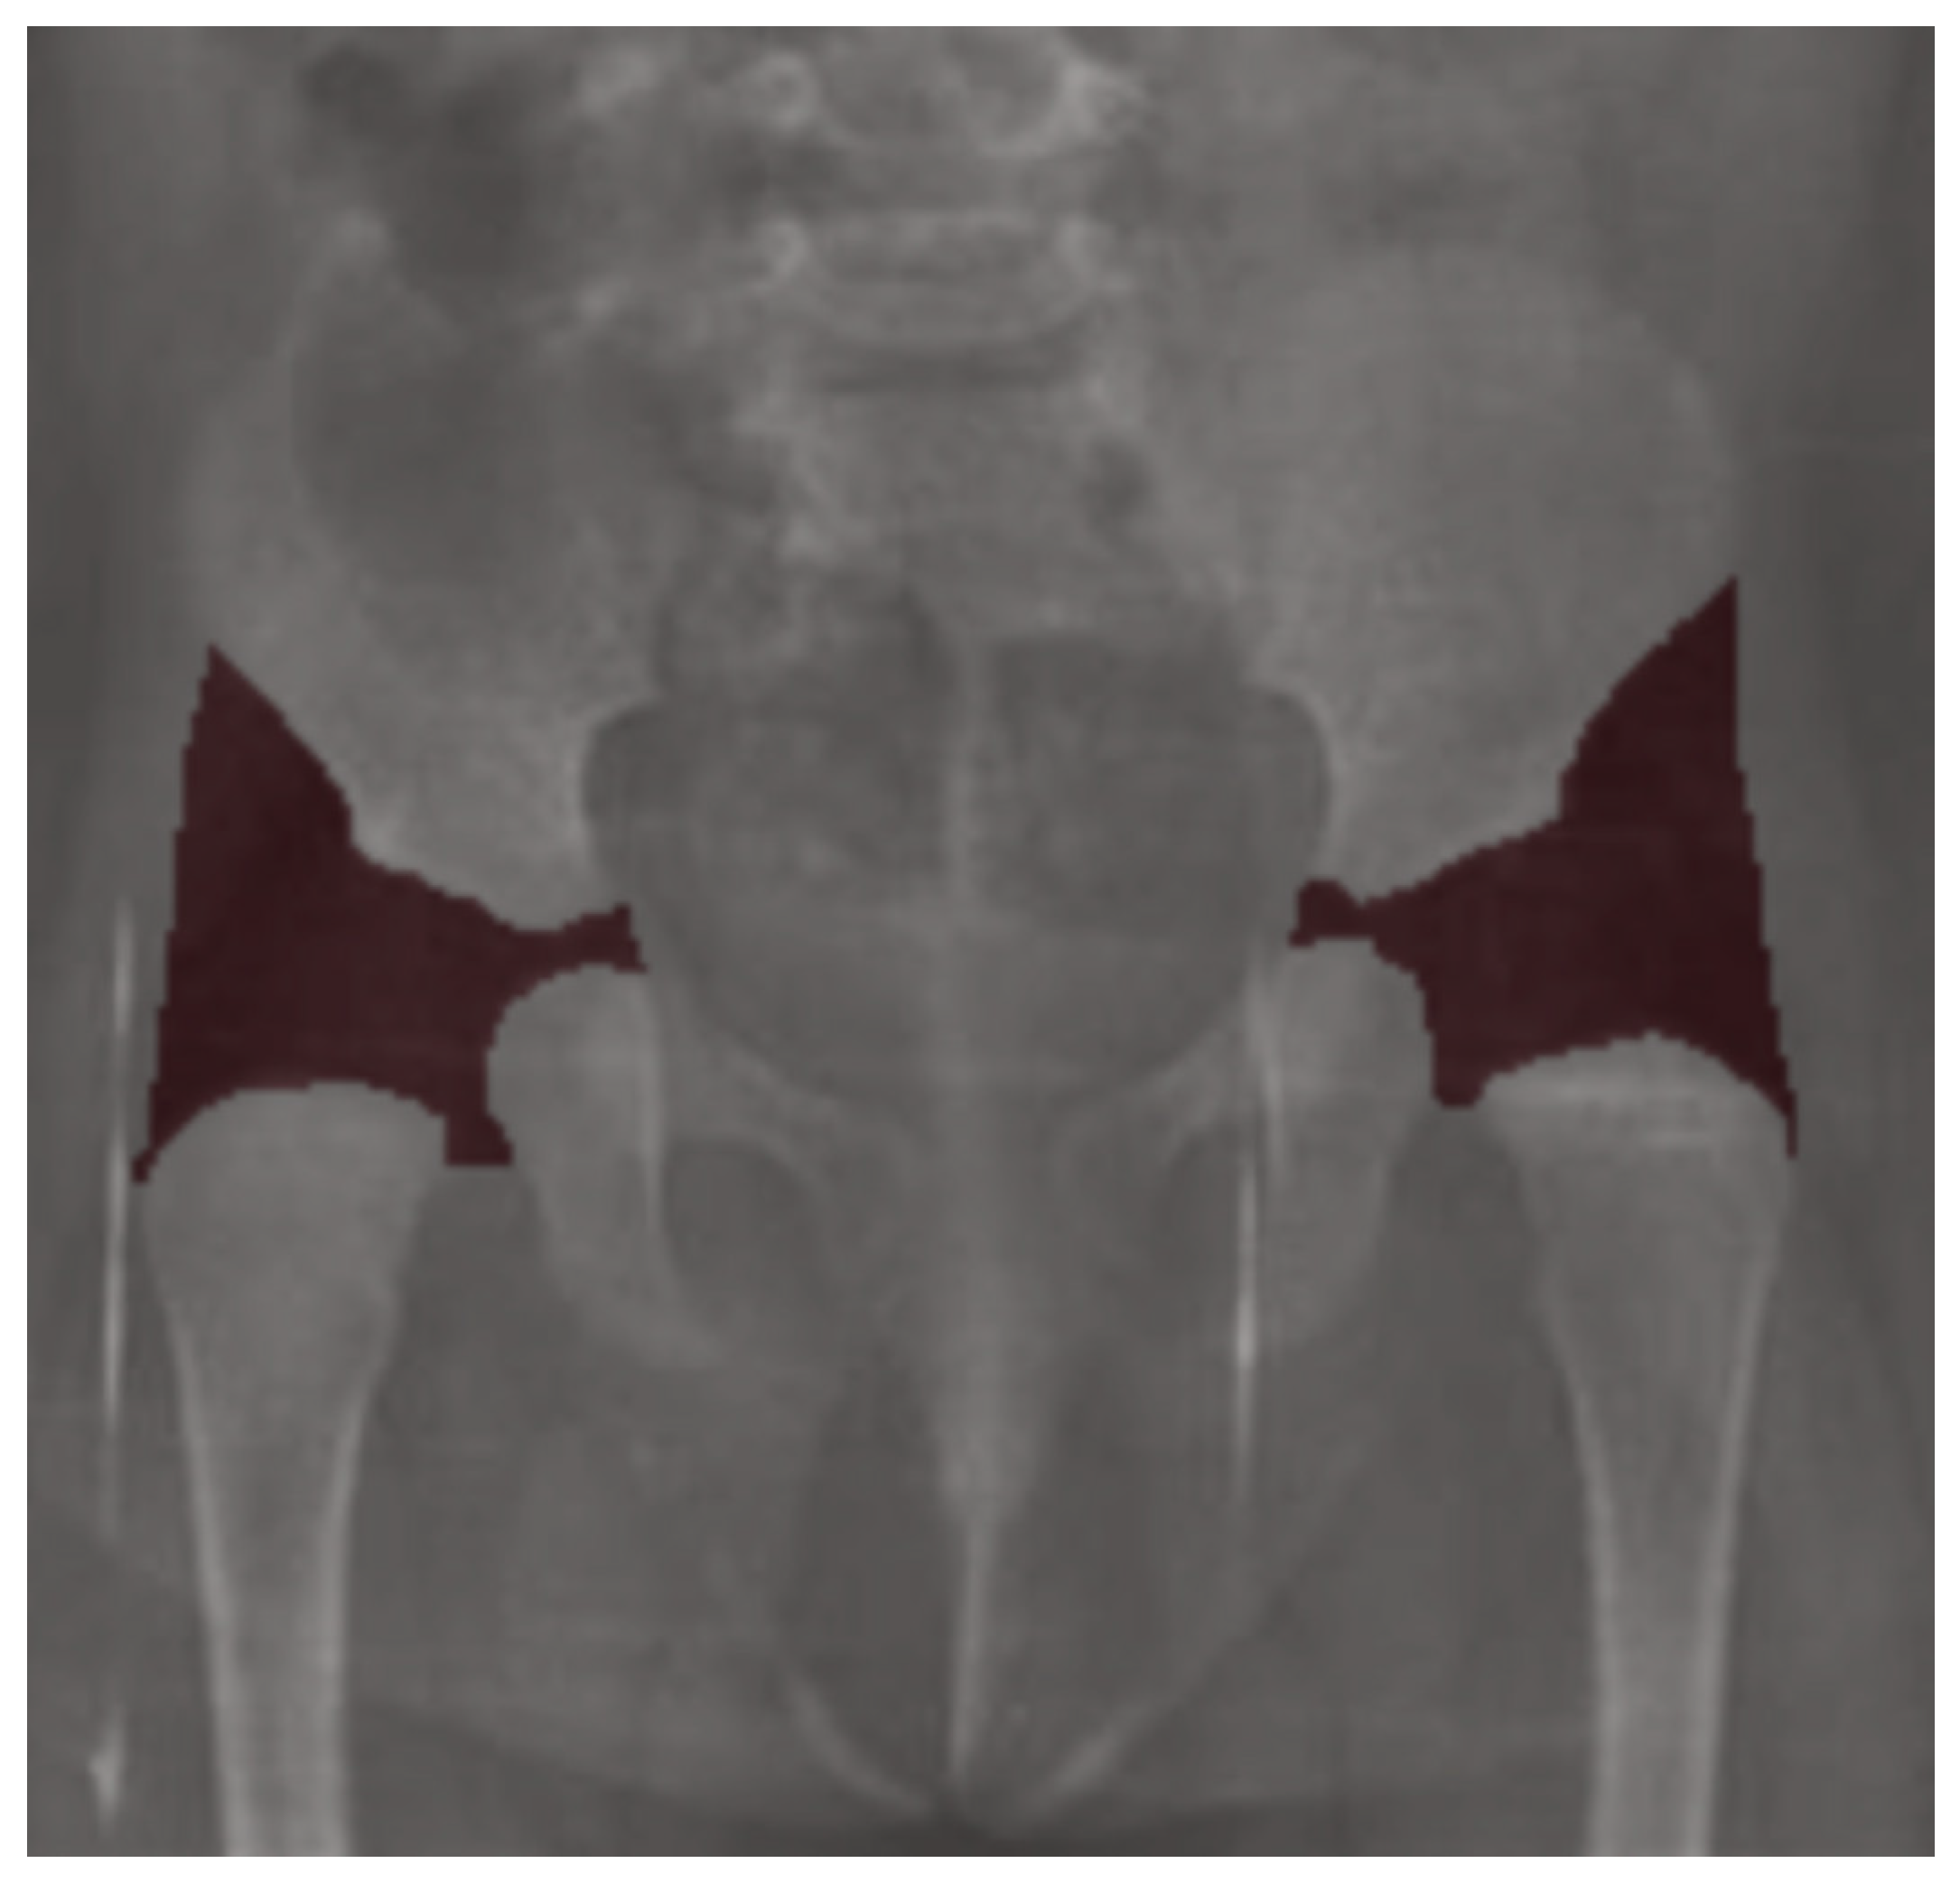
To isolate the anatomical region affected by DDH, segmentation masks were manually generated to capture the hip joint articulation space. This region corresponds to the radiolucent area bounded by the acetabular roof, pubis, ilium, and femoral head region. An example of the segmented region of interest (ROI) is shown in Figure 2.
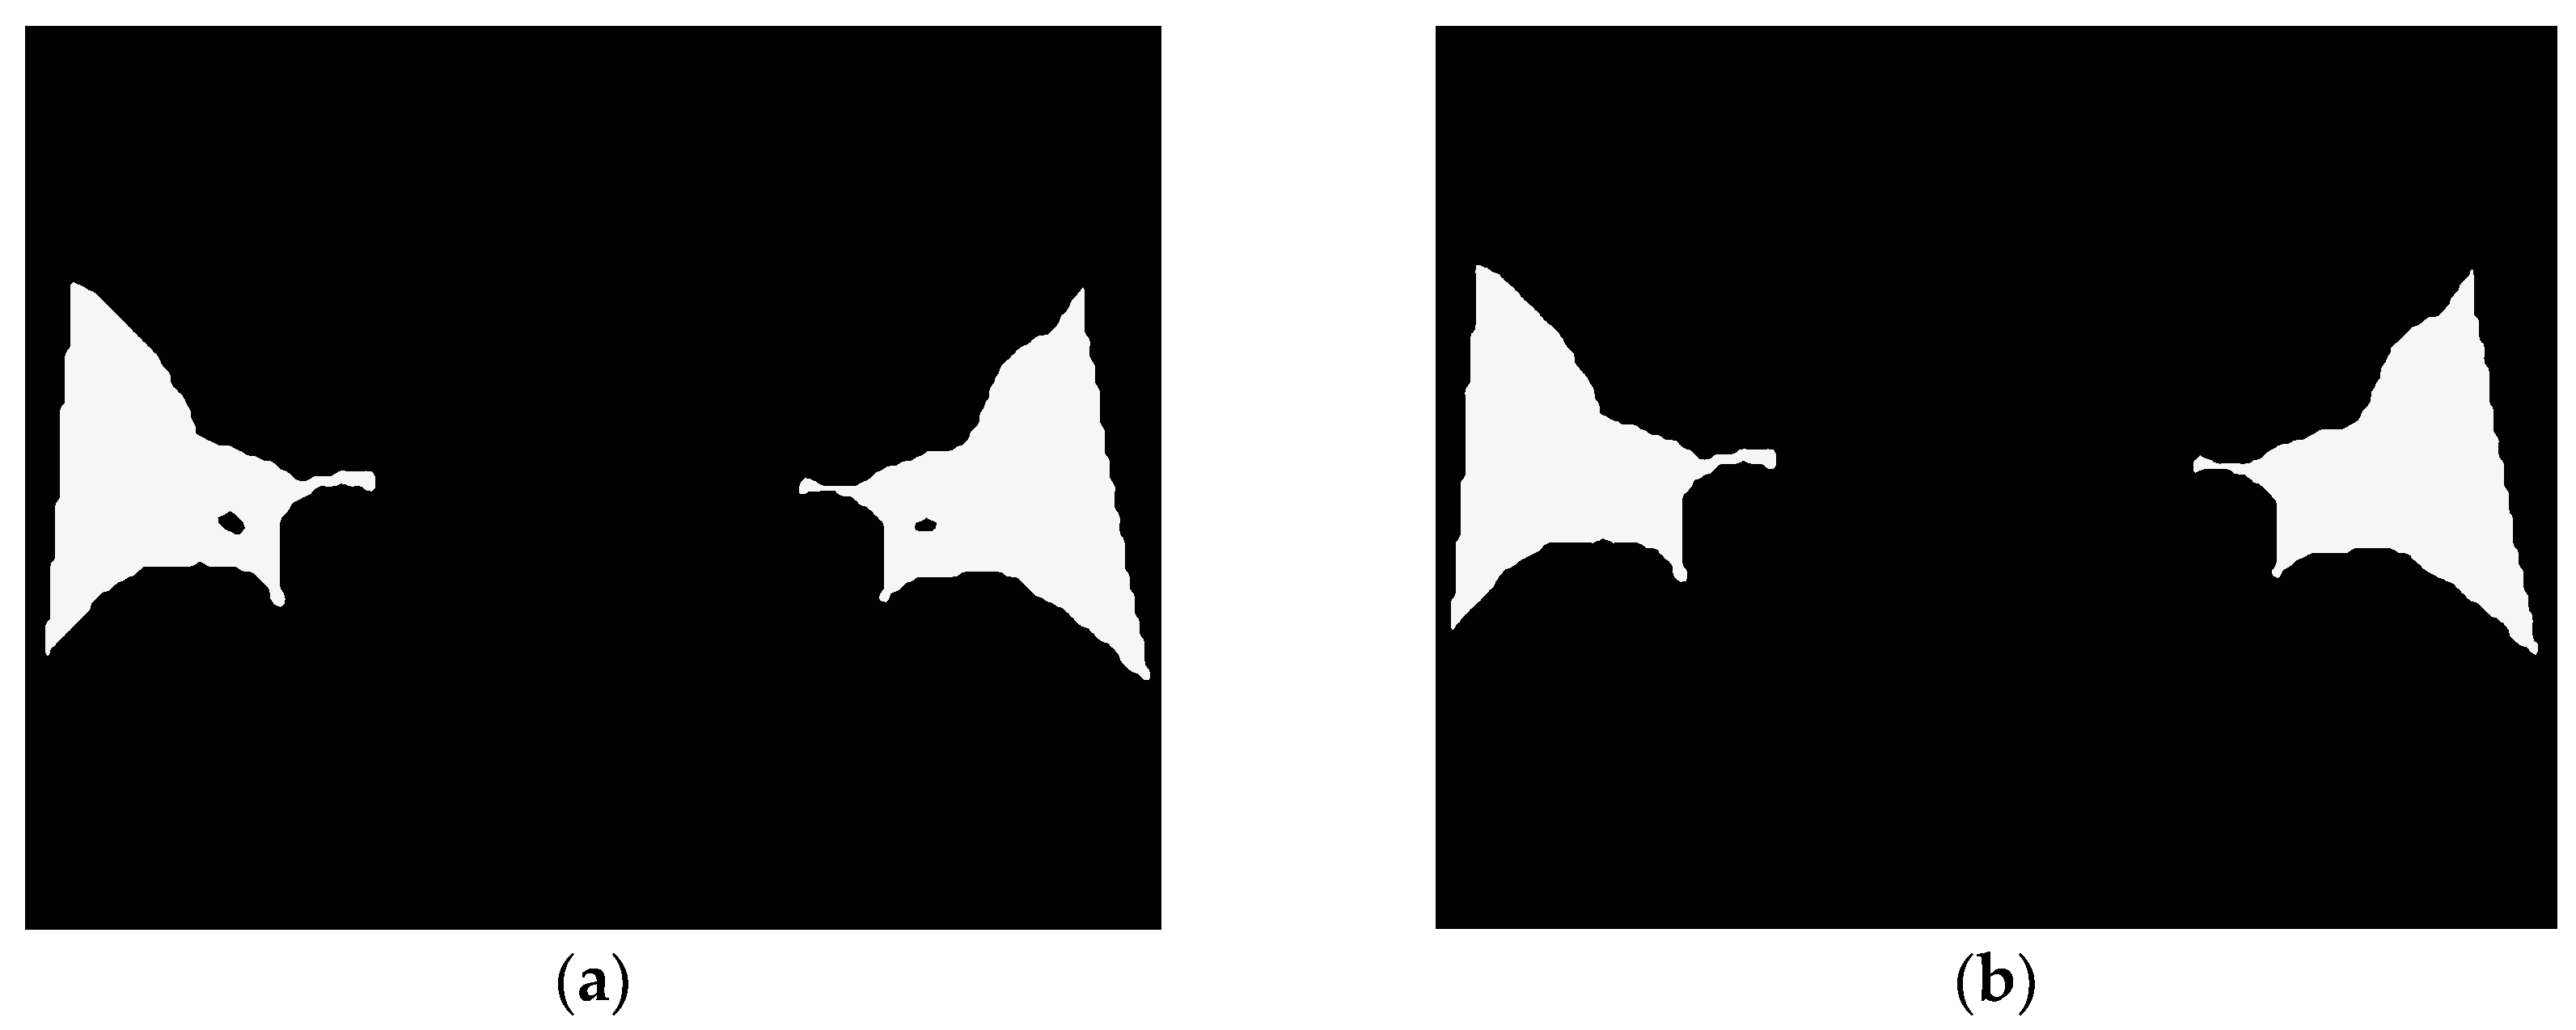
Two segmentation strategies were employed. The joint space mask (JS-mask) defines the articulation space independently of femoral head ossification, capturing only the geometric structure of the joint space. The joint space with femoral head mask (JS+FH mask) includes the ossified femoral head within the segmented region when present. A comparison between these segmentation approaches is illustrated in Figure 3.
Additionally, a combined dataset was constructed by selecting the appropriate mask type based on the visibility of femoral head ossification. To provide a clearer visualization of the segmentation alignment with the original radiograph, Figure 4 presents the JS mask overlaid on the corresponding X-ray image.
All masks were created using the LabKit plugin in ImageJ/Fiji (exact version not recorded, used in 2025). They were created by a radiologist under the supervision of experienced orthopedic clinicians. While formal inter- and intra-observer variability metrics such as the Dice coefficient were not computed, the two-stage annotation process was employed to ensure segmentation reliability.

3.3. Anatomical Background and Feature Rationale

A total of 99 geometric and radiomic features were extracted from each segmented mask to characterize the morphology of the hip joint space. These features were grouped into the following categories:
  • Basic geometric features: area, perimeter, equivalent diameter, major and minor axis lengths, eccentricity, solidity, and extent.
  • Bounding box features: dimensions, aspect ratio, spatial positioning.
  • Shape descriptors: convex hull properties and shape complexity.
  • Radial and skeletal features: radial distance statistics, skeleton length, branching points.
  • Contour features: boundary smoothness, curvature, irregularity.
  • Fourier descriptors: frequency-domain representation of shape.
  • Radiomic shape features: including compactness, sphericity, and surface-to-volume ratios [27].
These features provide a quantitative description of the spatial and morphological properties of the hip joint articulation space.

3.3.1. Acetabular Angle

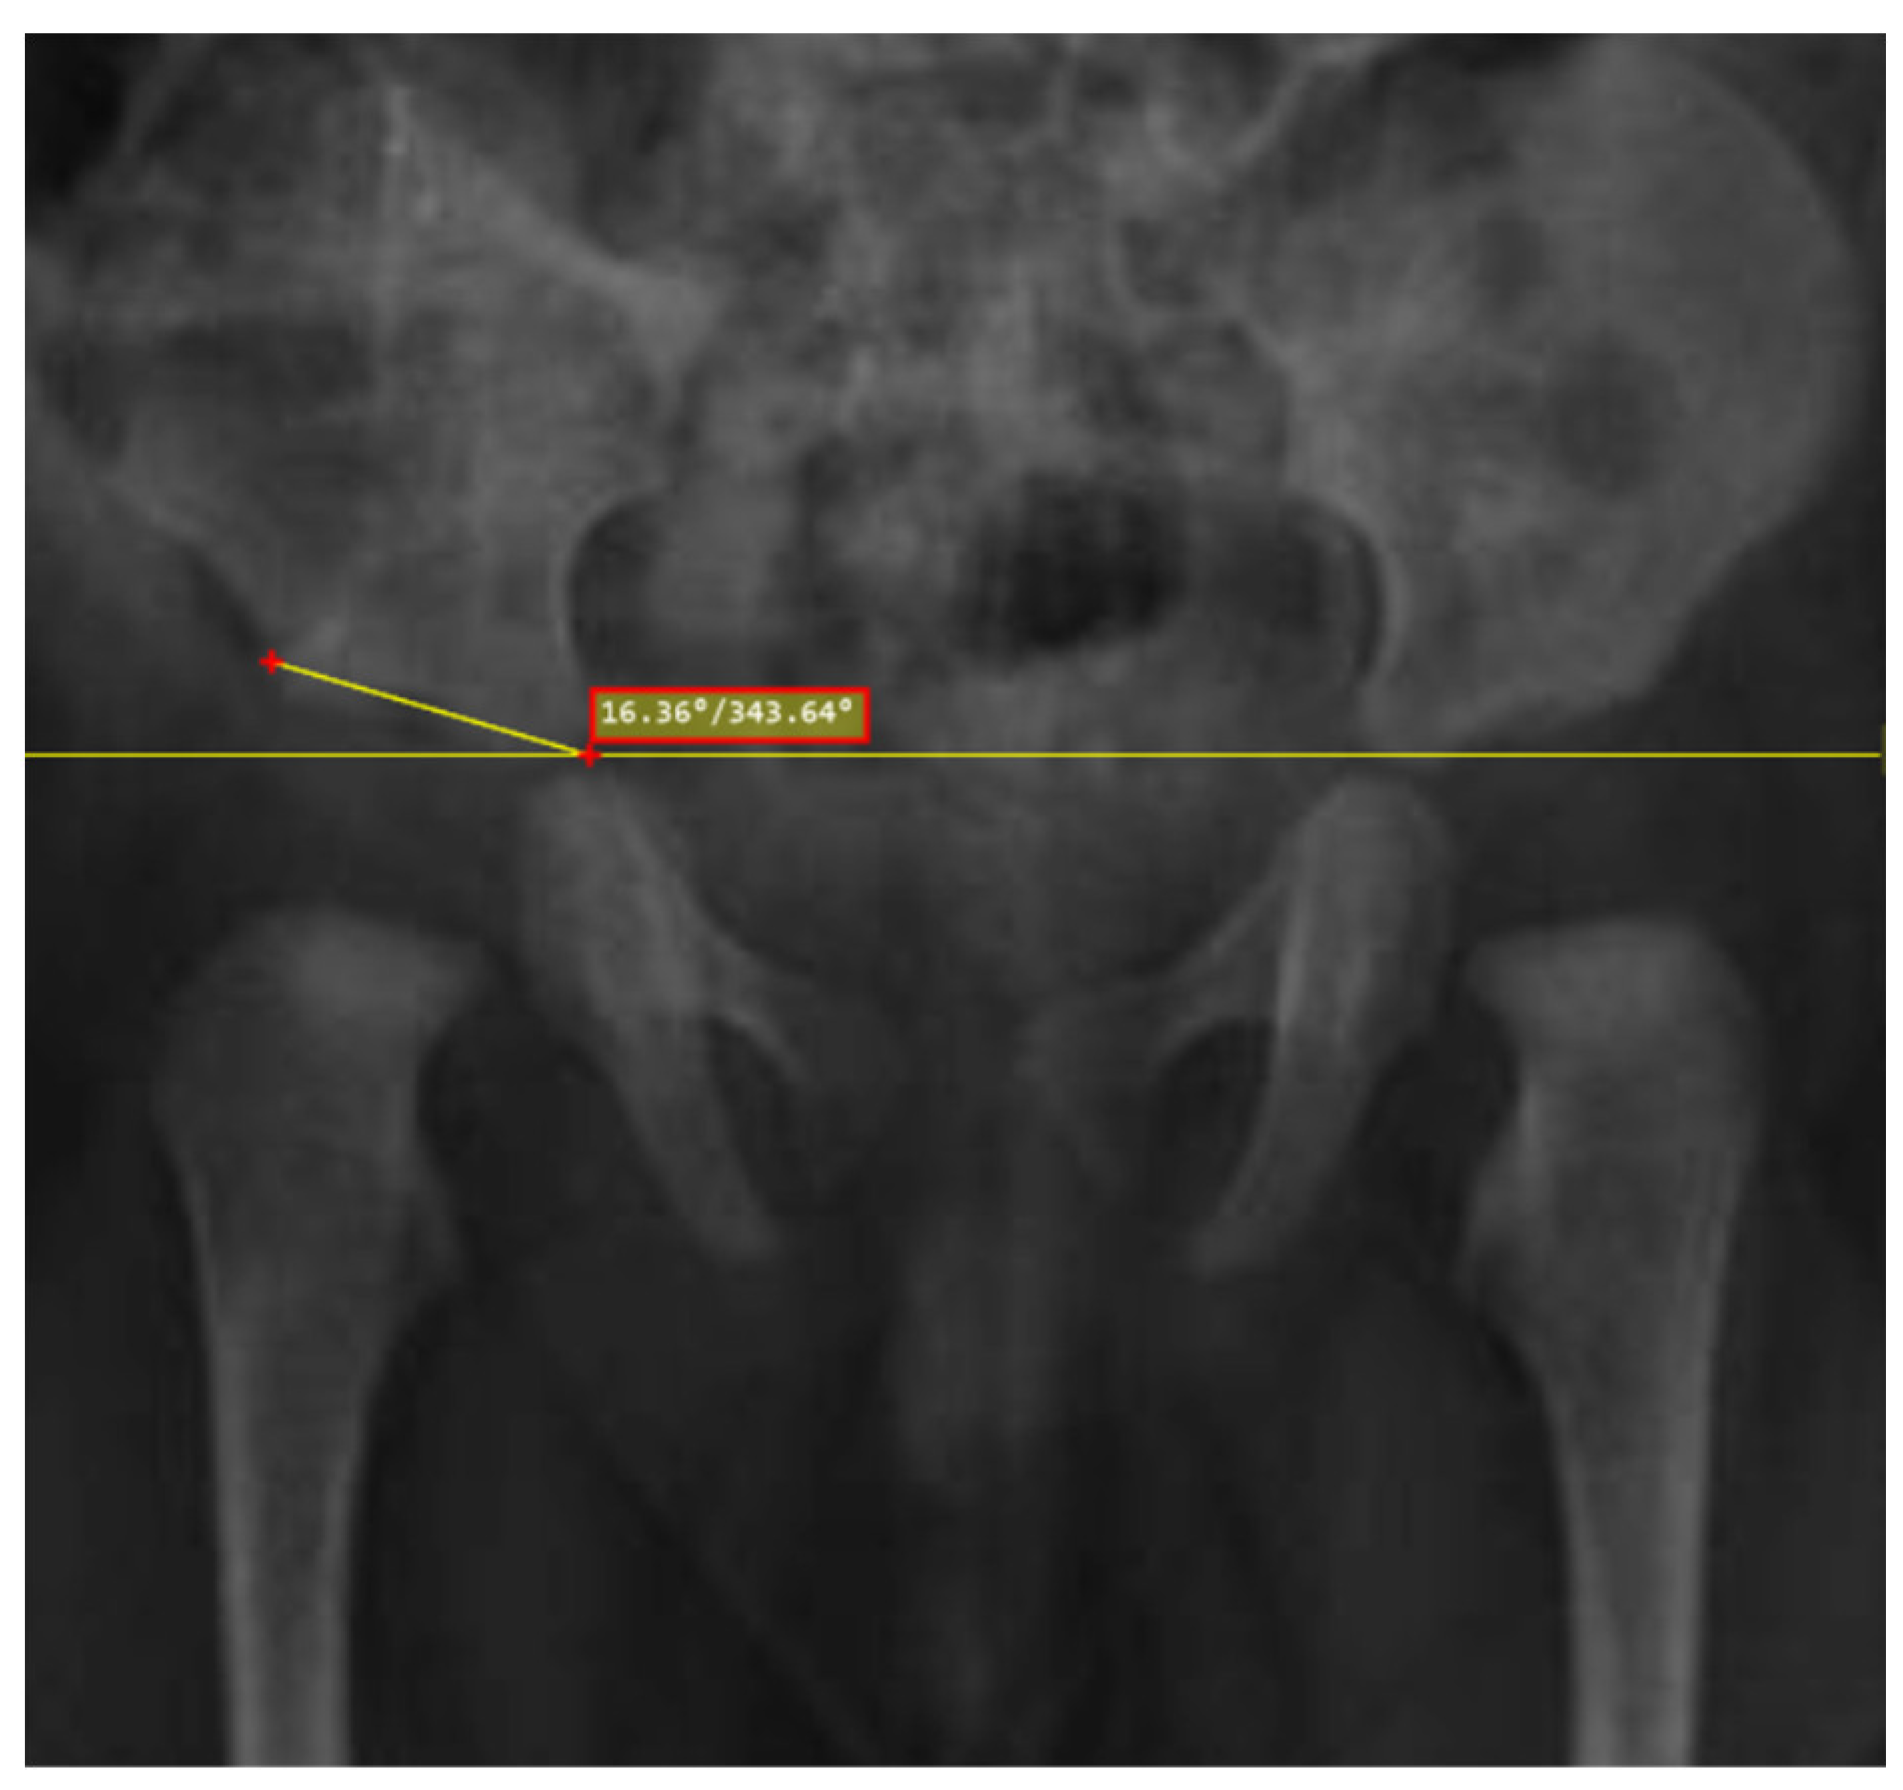
The acetabular angle diminishes normally with age but it actually widens in children with DDH. The acetabular roof flattens as a result of dysplasia. As a consequence, the targeted space will lose volume from the upper limit. This will influence the perimeter characteristics as long as the volume is calculated for this space. An example of the calculation of the acetabular angle is shown in Figure 5.
However, due to the fact that the angle changes based on the age and the dataset that we are given expands in a long age range, it might pose a bias to the metrics. It would be better if we had more thoroughly age-classified data.

3.3.2. Shenton’s Line

As we also highlighted, a Shenton line is another indicator of a dysplastic hip. This morphological characteristic causes an elevation of the femur bone that actually limits the lower part of the space under investigation, leading again to the diminishing of the perimeter and the volume that we are investigating. This is shown as an example of an X-ray from our dataset in which the right hip is normal and the left hip is dysplastic. It is obvious that the dysplastic hip is dislocated towards the upper end of the articulation, causing the hip articulation to occur in a smaller space. The age again plays a pivotal role, as the lower limit of the arthrosis approaches the acetabular roof due to the maturation process.

3.3.3. Femoral Epiphysis Ossification

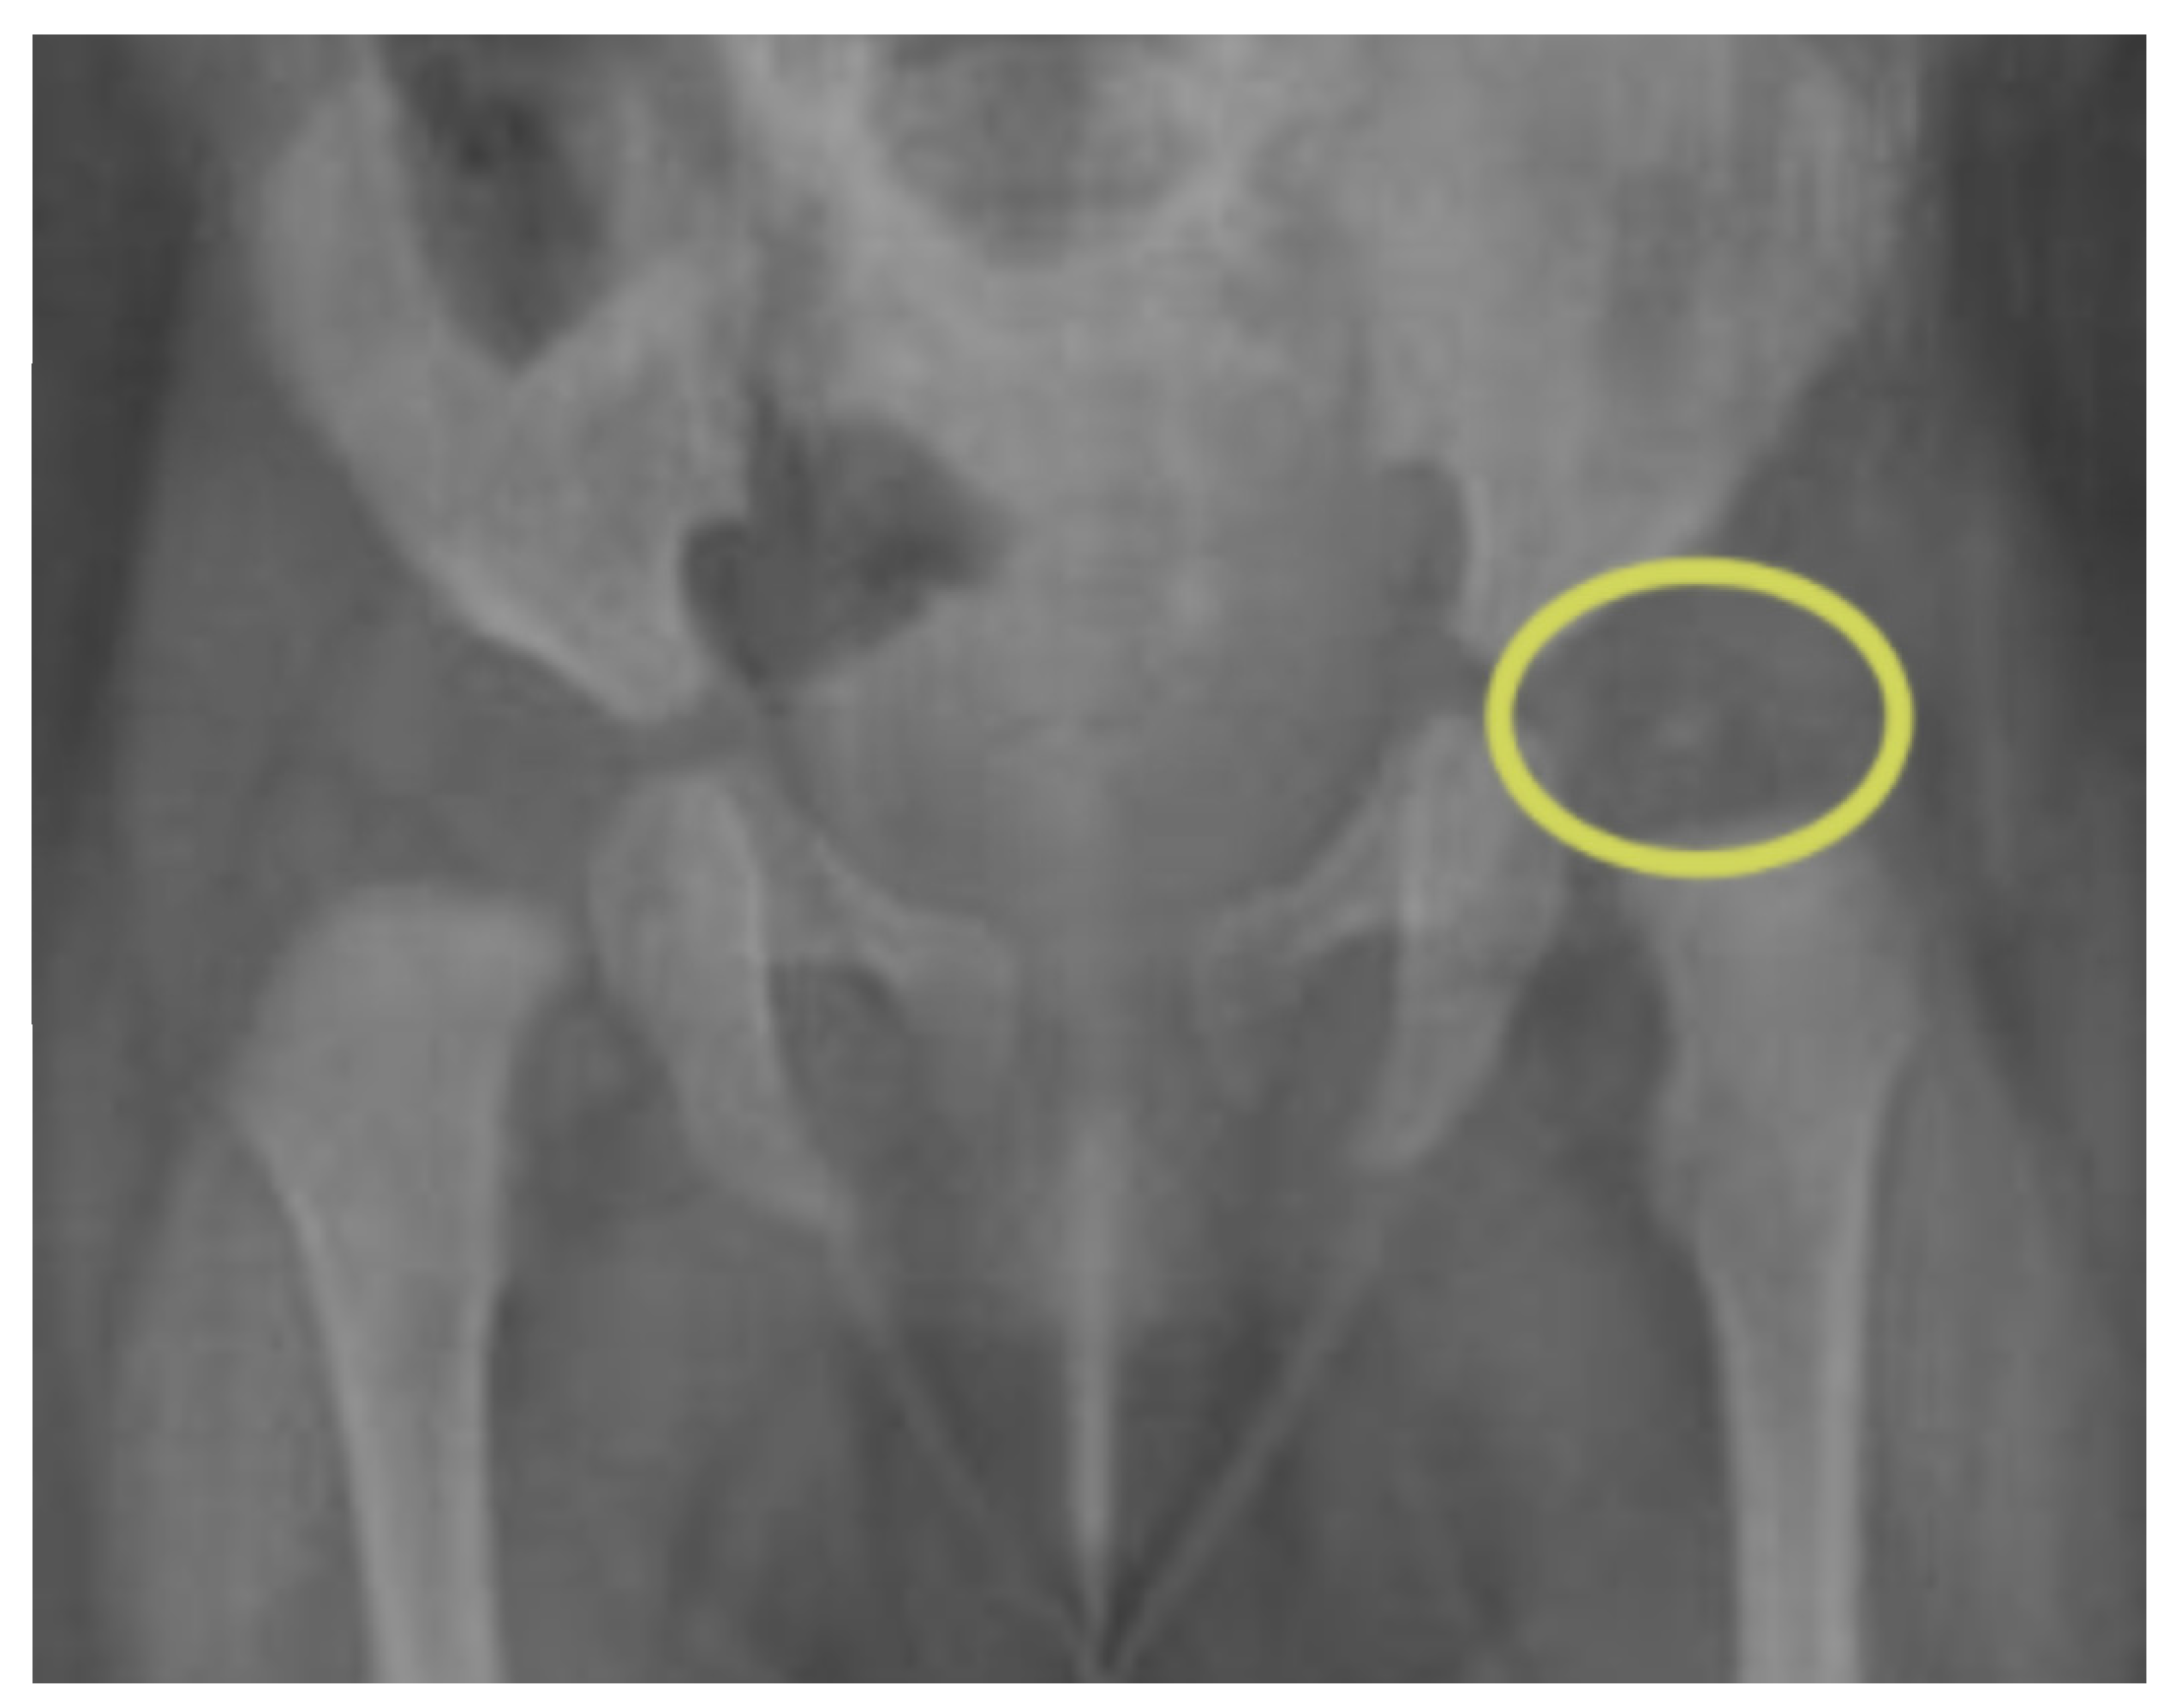
The final major factor that influences the metrics of the space of our bounding box is the visibility of the femoral head ossification center. It should be situated normally in the inferior medial quadrant of the Perkins and Hilgenreiner line. However, in DDH, the ossification may be later than the expected age. It can be situated in the other quadrants and, in very rare cases, ossification centers may be visible prematurely due to a false calcification process. Figure 6 shows a visible femur head in an infant’s X-ray. Figure 7 demonstrates the appearance of the femur head on the hip.
The existence of the femur head may be the reason for the metrics of volume in the masks that take its existence into consideration. In addition, highlighting this affects the max and min diameters calculated within the mask, as they can distort the measurement from one edge to the other. As expected, this property would be of interest if the age limit was set in such a way that ossification was either present or absent. However, this point of view may lead to a more robust effect on the JS mask.
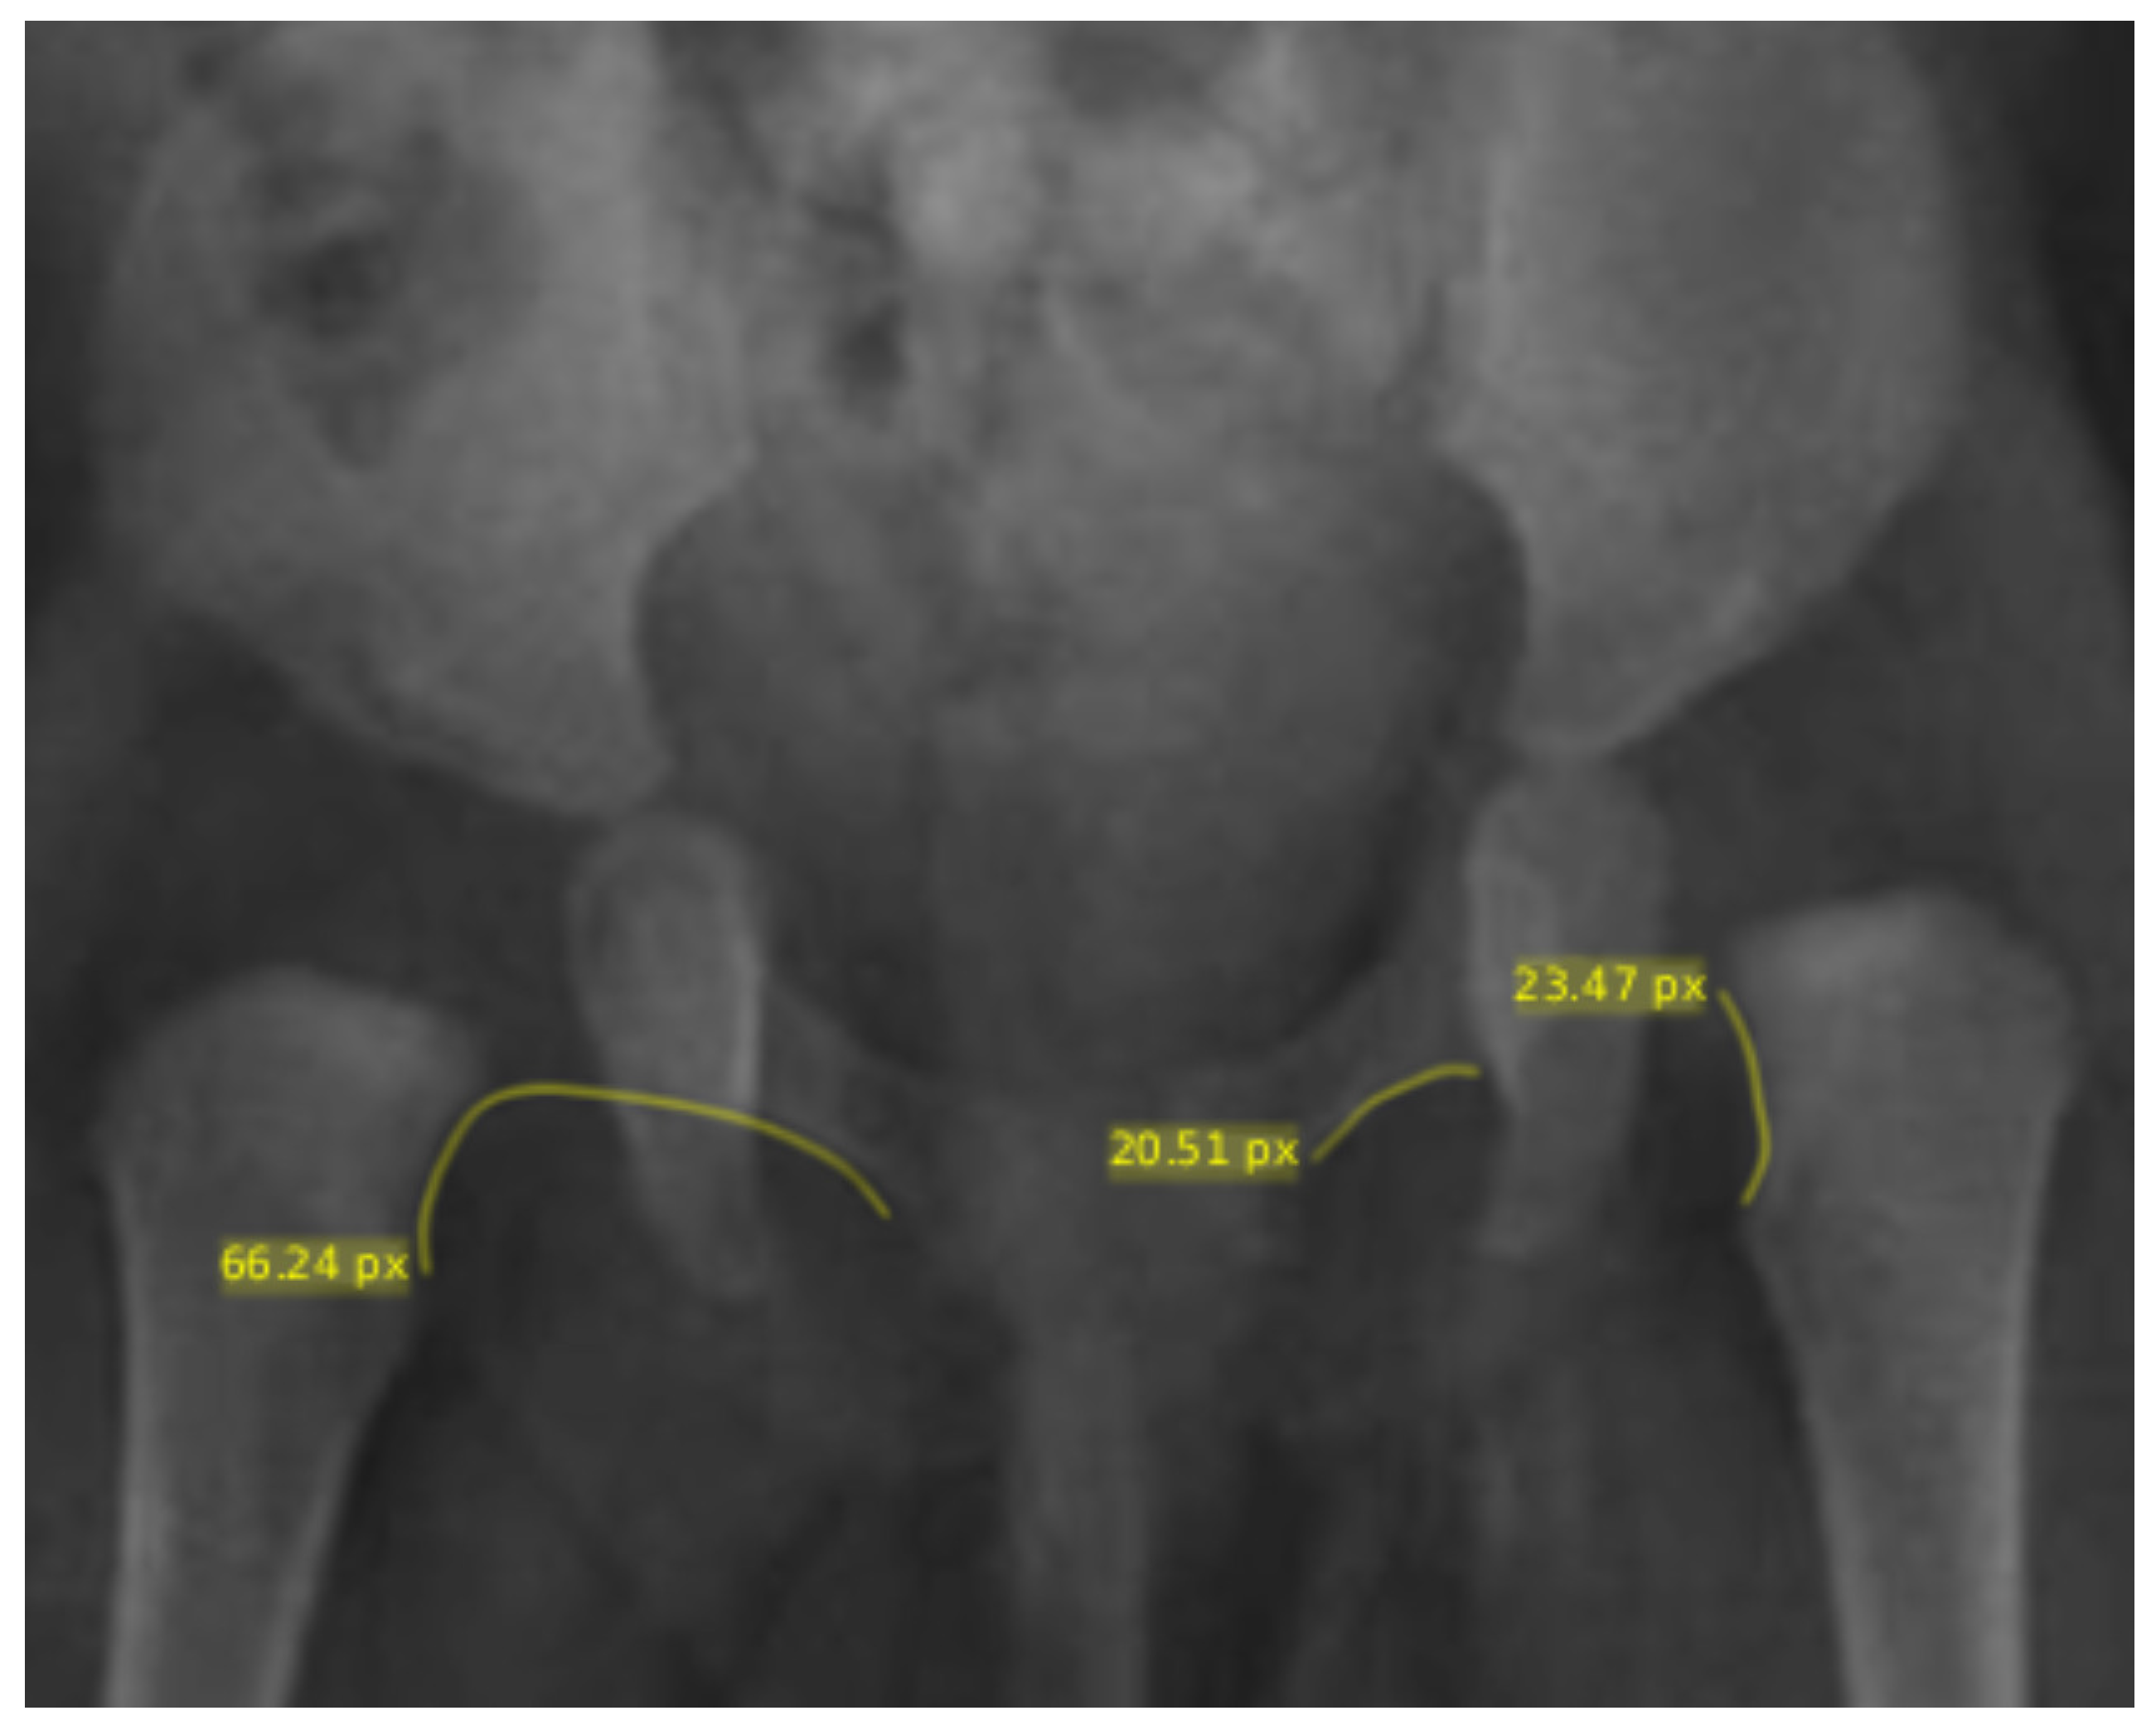
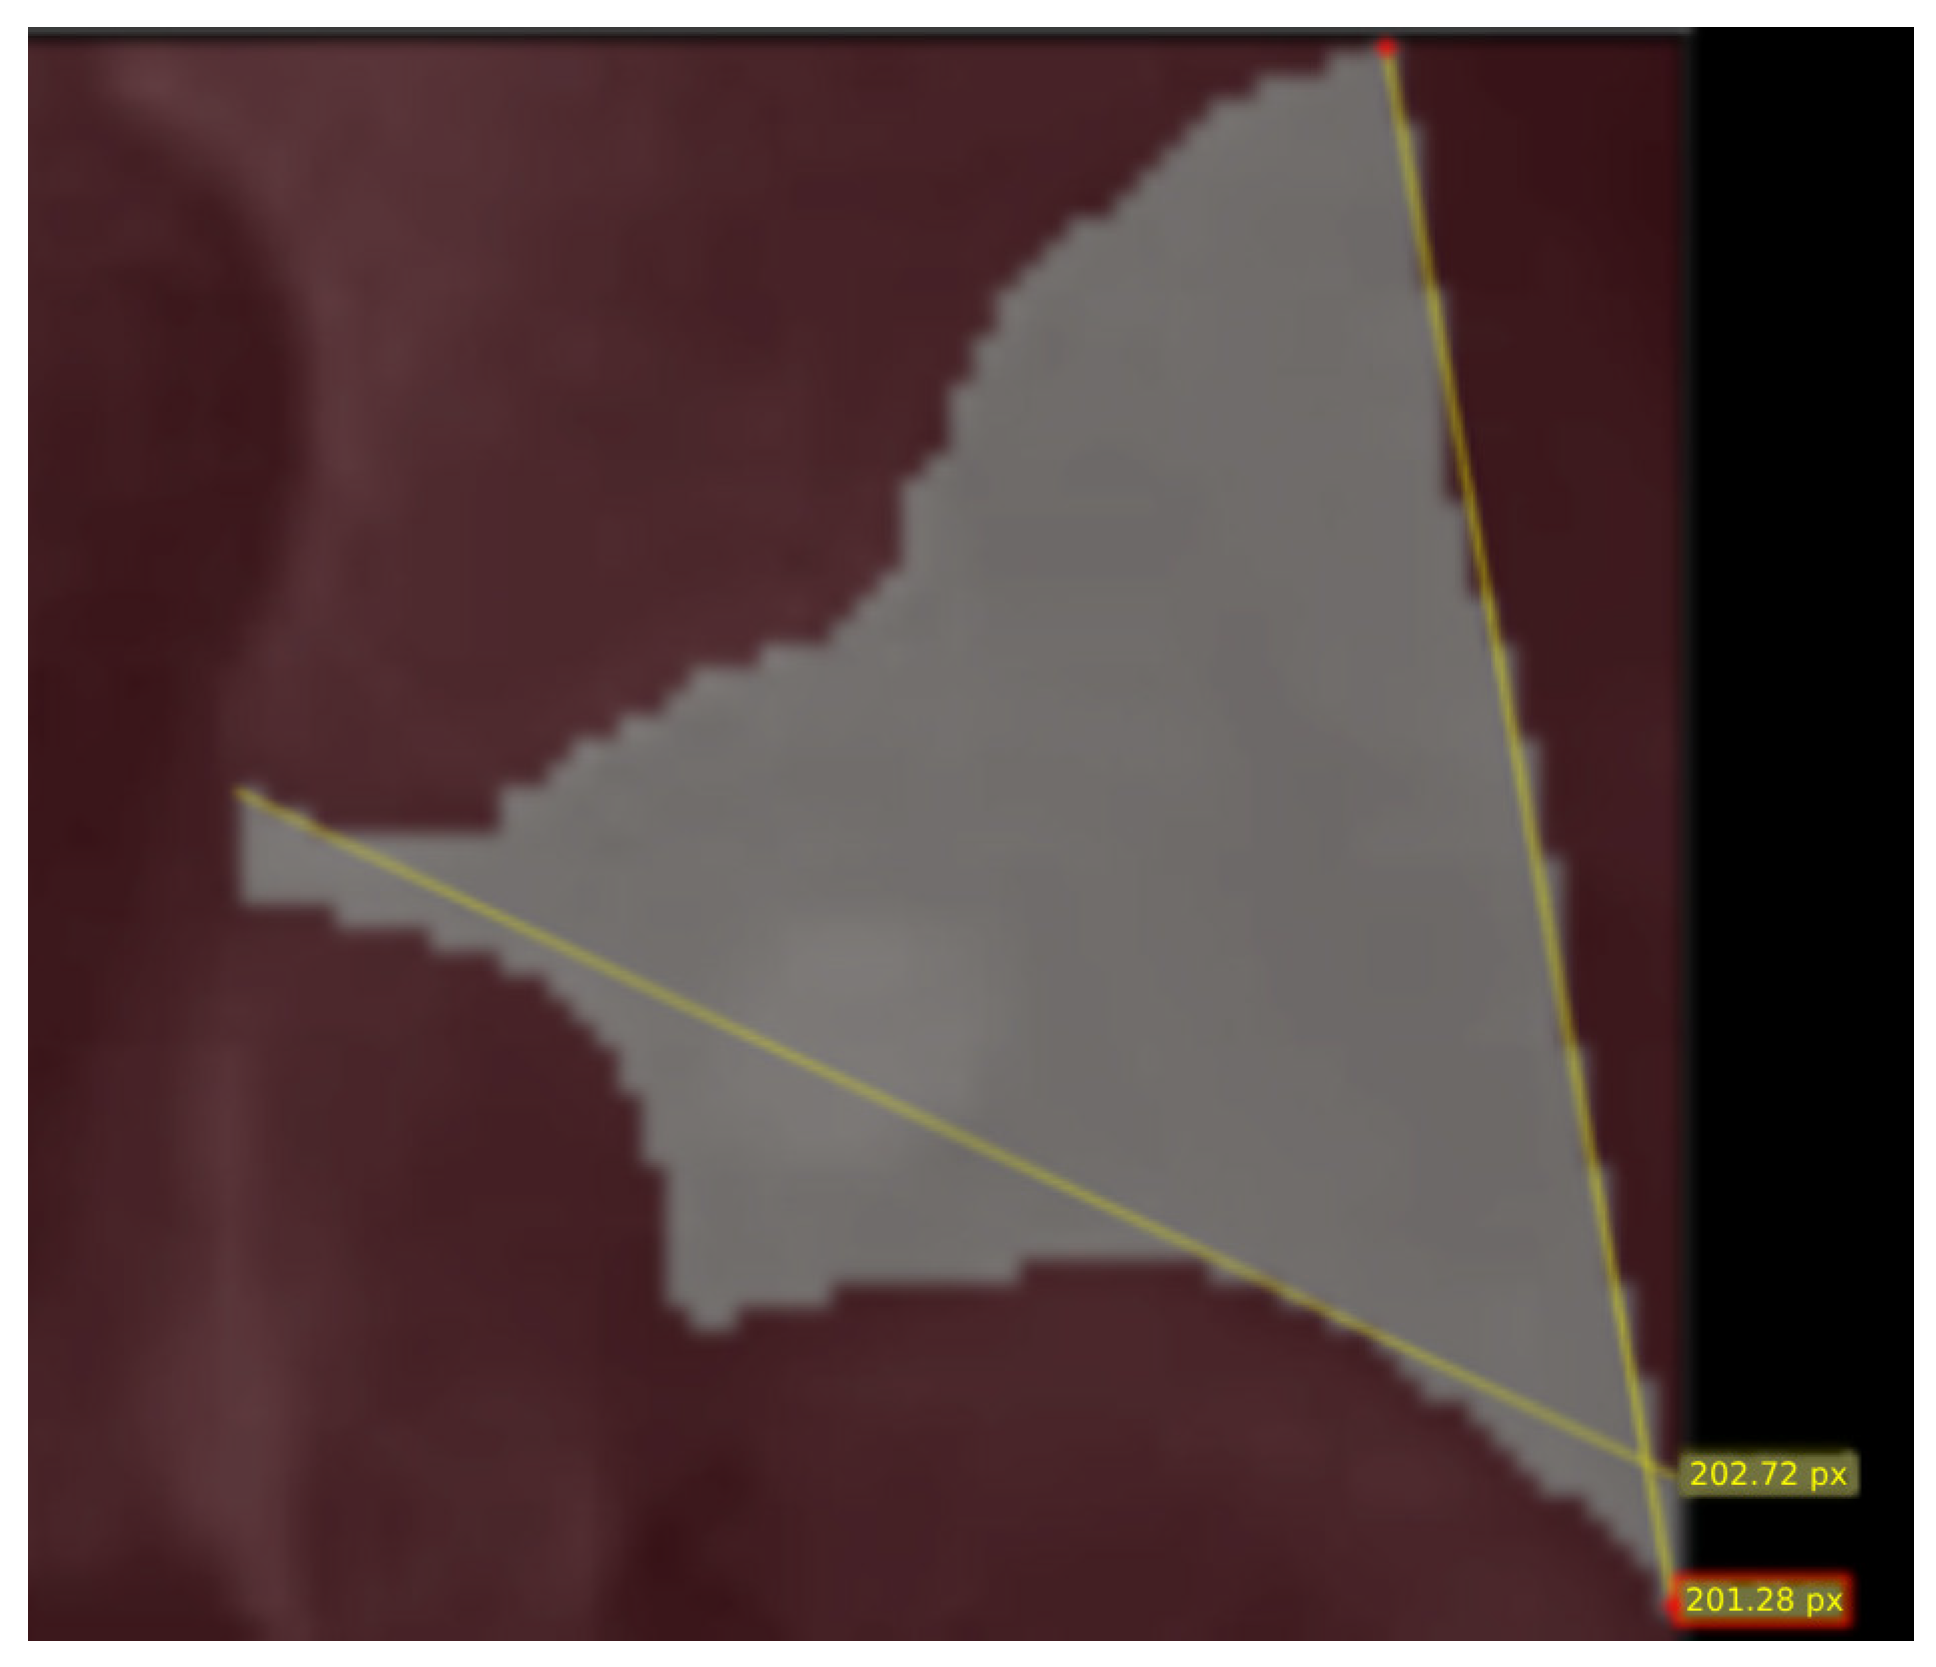
For example, in the mask depicted in Figure 6, we can see that the max diameter of JS mask is the one that starts from the acetabulum roof and ends in the outer space of the articulation near the edge. A handcrafted measurement of this is 202.72 pixels. If the mask was again calculated in the form of the existing femur, the max diameter would be that of the lateral left side of the mask, which is calculated in the picture as 201.28. In a macroscopic view, this might not be a big difference metrically, but if we take into consideration the differentiation in age and the pathology that we want to depict, this differentiation can have a misleading effect on the algorithm function. In each case, it should also be deterministic which metrics are derived and from which part of the mask they are calculated.
In these masks, the early appearance of the femoral head slightly alters volume measurements, which may cause normal hips to be misclassified as dysplastic. This effect likely arises because the ossified head reduces joint space metrics in a way similar to DDH or to older age groups. For this reason, it is important that our data had a smaller age band.

3.4. Feature Extraction and Model Creation

Classification algorithms rely on robust feature extraction and the effective alignment of these features with the corresponding subject labels. In this study, an extensive set of geometrical and radiomic features was computed for each segmented mask. Importantly, because the selected metrics are purely numerical and analog in nature, any potential bias arising from the laterality of the hip (left versus right) is inherently eliminated. The resulting models are therefore designed to classify each hip independently with respect to dysplastic abnormality.
A total of 99 features were extracted, encompassing both geometric descriptors and general radiomics. These included fundamental geometric measurements such as area, perimeter, equivalent diameter, major and minor axis lengths, eccentricity, solidity, and extent. Bounding box features captured dimensional properties, aspect ratio, and spatial positioning. Advanced shape descriptors comprised convex hull metrics (area, perimeter, and vertex count) and indices of shape complexity. Radial and skeletal features were also derived, including statistical measures of radial distances (mean, standard deviation, range, skewness, and kurtosis), skeleton length, branching points, and endpoints. Contour-based analysis further quantified boundary properties such as contour length, smoothness, curvature statistics, and irregularity indices. In addition, Fourier descriptors were computed using the first 24 coefficients to capture shape information in the frequency domain. To enhance clinical relevance, hip-specific geometric features were introduced, targeting morphological alterations associated with developmental dysplasia of the hip (DDH), including angular relationships and spatial distributions within the joint space. Moreover, 28 statistical shape features were calculated to describe higher-order distribution characteristics and shape regularity. Standardized PyRadiomics shape features—such as sphericity, compactness, surface area-to-volume ratio, and flatness—were also incorporated to ensure methodological consistency and reproducibility [27]. All features extracted are presented in the Supplementary Materials Section, with tables showcasing all features and their corresponding F-ANOVA scores and p-values. PyRadiomics (v3.1.0) was configured with force2D = True and force2D dimension = 1 to operate in 2D mode on the X-ray slices. Only the shape2D feature class was enabled; all other feature classes (first-order, texture, etc.) were disabled. Since shape2D features are derived purely from the segmentation mask contour and do not involve intensity sampling, parameters such as bin width, intensity normalization, and resampling interpolation are not applicable and were not set. No image resampling or intensity preprocessing were applied prior to PyRadiomics extraction.
No mirroring, flipping, or orientation normalization were applied to account for laterality. Left and right hips were separated geometrically by comparing the x-coordinates of their segmented centroids in the image plane. Features were then extracted independently from each hip using the same pipeline. Although each hip was treated as an independent sample, potential intra-subject correlation was mitigated through patient-level grouping during cross-validation, ensuring that both hips of the same patient were always assigned to the same fold. Furthermore, since all extracted features are scalar shape and intensity measurements (areas, perimeters, distances), they are inherently laterality-invariant and not influenced by left/right orientation, making the independent treatment of each hip a reasonable assumption in this context.
Notably, many of these morphological descriptors cannot be reliably obtained through conventional handcrafted measurements. Therefore, the two-dimensional joint space observed in X-ray imaging can be quantitatively analyzed beyond the limits of visual assessment, allowing for precise, objective comparisons between healthy and dysplastic hips.

3.5. Statistical Testing

To identify the most diagnostically informative features within the geometric radiomic dataset, we applied statistical feature selection methods to quantify the discriminative capacity of each extracted parameter. This analysis was restricted to the JS mask dataset, as it demonstrated superior performance and provides the advantage of consistent applicability across all images included in the study.
Feature relevance was first evaluated using the ANOVA F-test, which assesses the ratio of between-group variance (normal vs. DDH) to within-group variance, thereby enabling the ranking of features according to their class-separation capability. Complementary to this, independent t-test analysis was conducted to determine the statistical significance of differences in feature distributions between normal and dysplastic hip populations.
The ANOVA F-score serves as a measure of discriminatory strength, with higher values indicating enhanced separation between the two diagnostic groups. Correspondingly, p-values were used to assess statistical significance, with thresholds of p < 0.05 indicating significant differences and thresholds of p < 0.001 denoting highly significant distinctions. Together, these statistical approaches provide a robust framework for identifying the features most relevant to DDH classification.

3.6. Machine Learning Training

It is important to emphasize that prior to model training, ANOVA F-scores and p-values were computed across all hips to evaluate the statistical significance of each extracted feature and identify clinically meaningful differences in feature distributions between normal and dysplastic hips.
For model training, a separate feature reduction pipeline was applied strictly within the cross-validation loop to prevent data leakage. First, Z-score standardization (zero mean, unit variance) was applied to all features, with the scaler fitted exclusively on the training folds and applied to the test fold. Second, a variance threshold filter (threshold = 0.1) was applied to remove near-constant features. Third, an ANOVA-based SelectKBest was used to retain the top-k features by F-score, where k was selected per fold by maximizing the weighted F1 score. Finally, Recursive Feature Elimination with Cross-Validation (RFECV) using an SVM estimator was applied to further reduce the feature set. Only the RFECV-selected features were passed to the final classifier for training. No imputation was performed as no missing values were present in the extracted features, and columns with any non-numeric values were dropped prior to training. No outlier removal was applied.

4. Results

4.1. Feature Discriminability

Statistical analysis was performed to identify geometric features with the highest discriminative power between normal and dysplastic hips using the joint space masks.
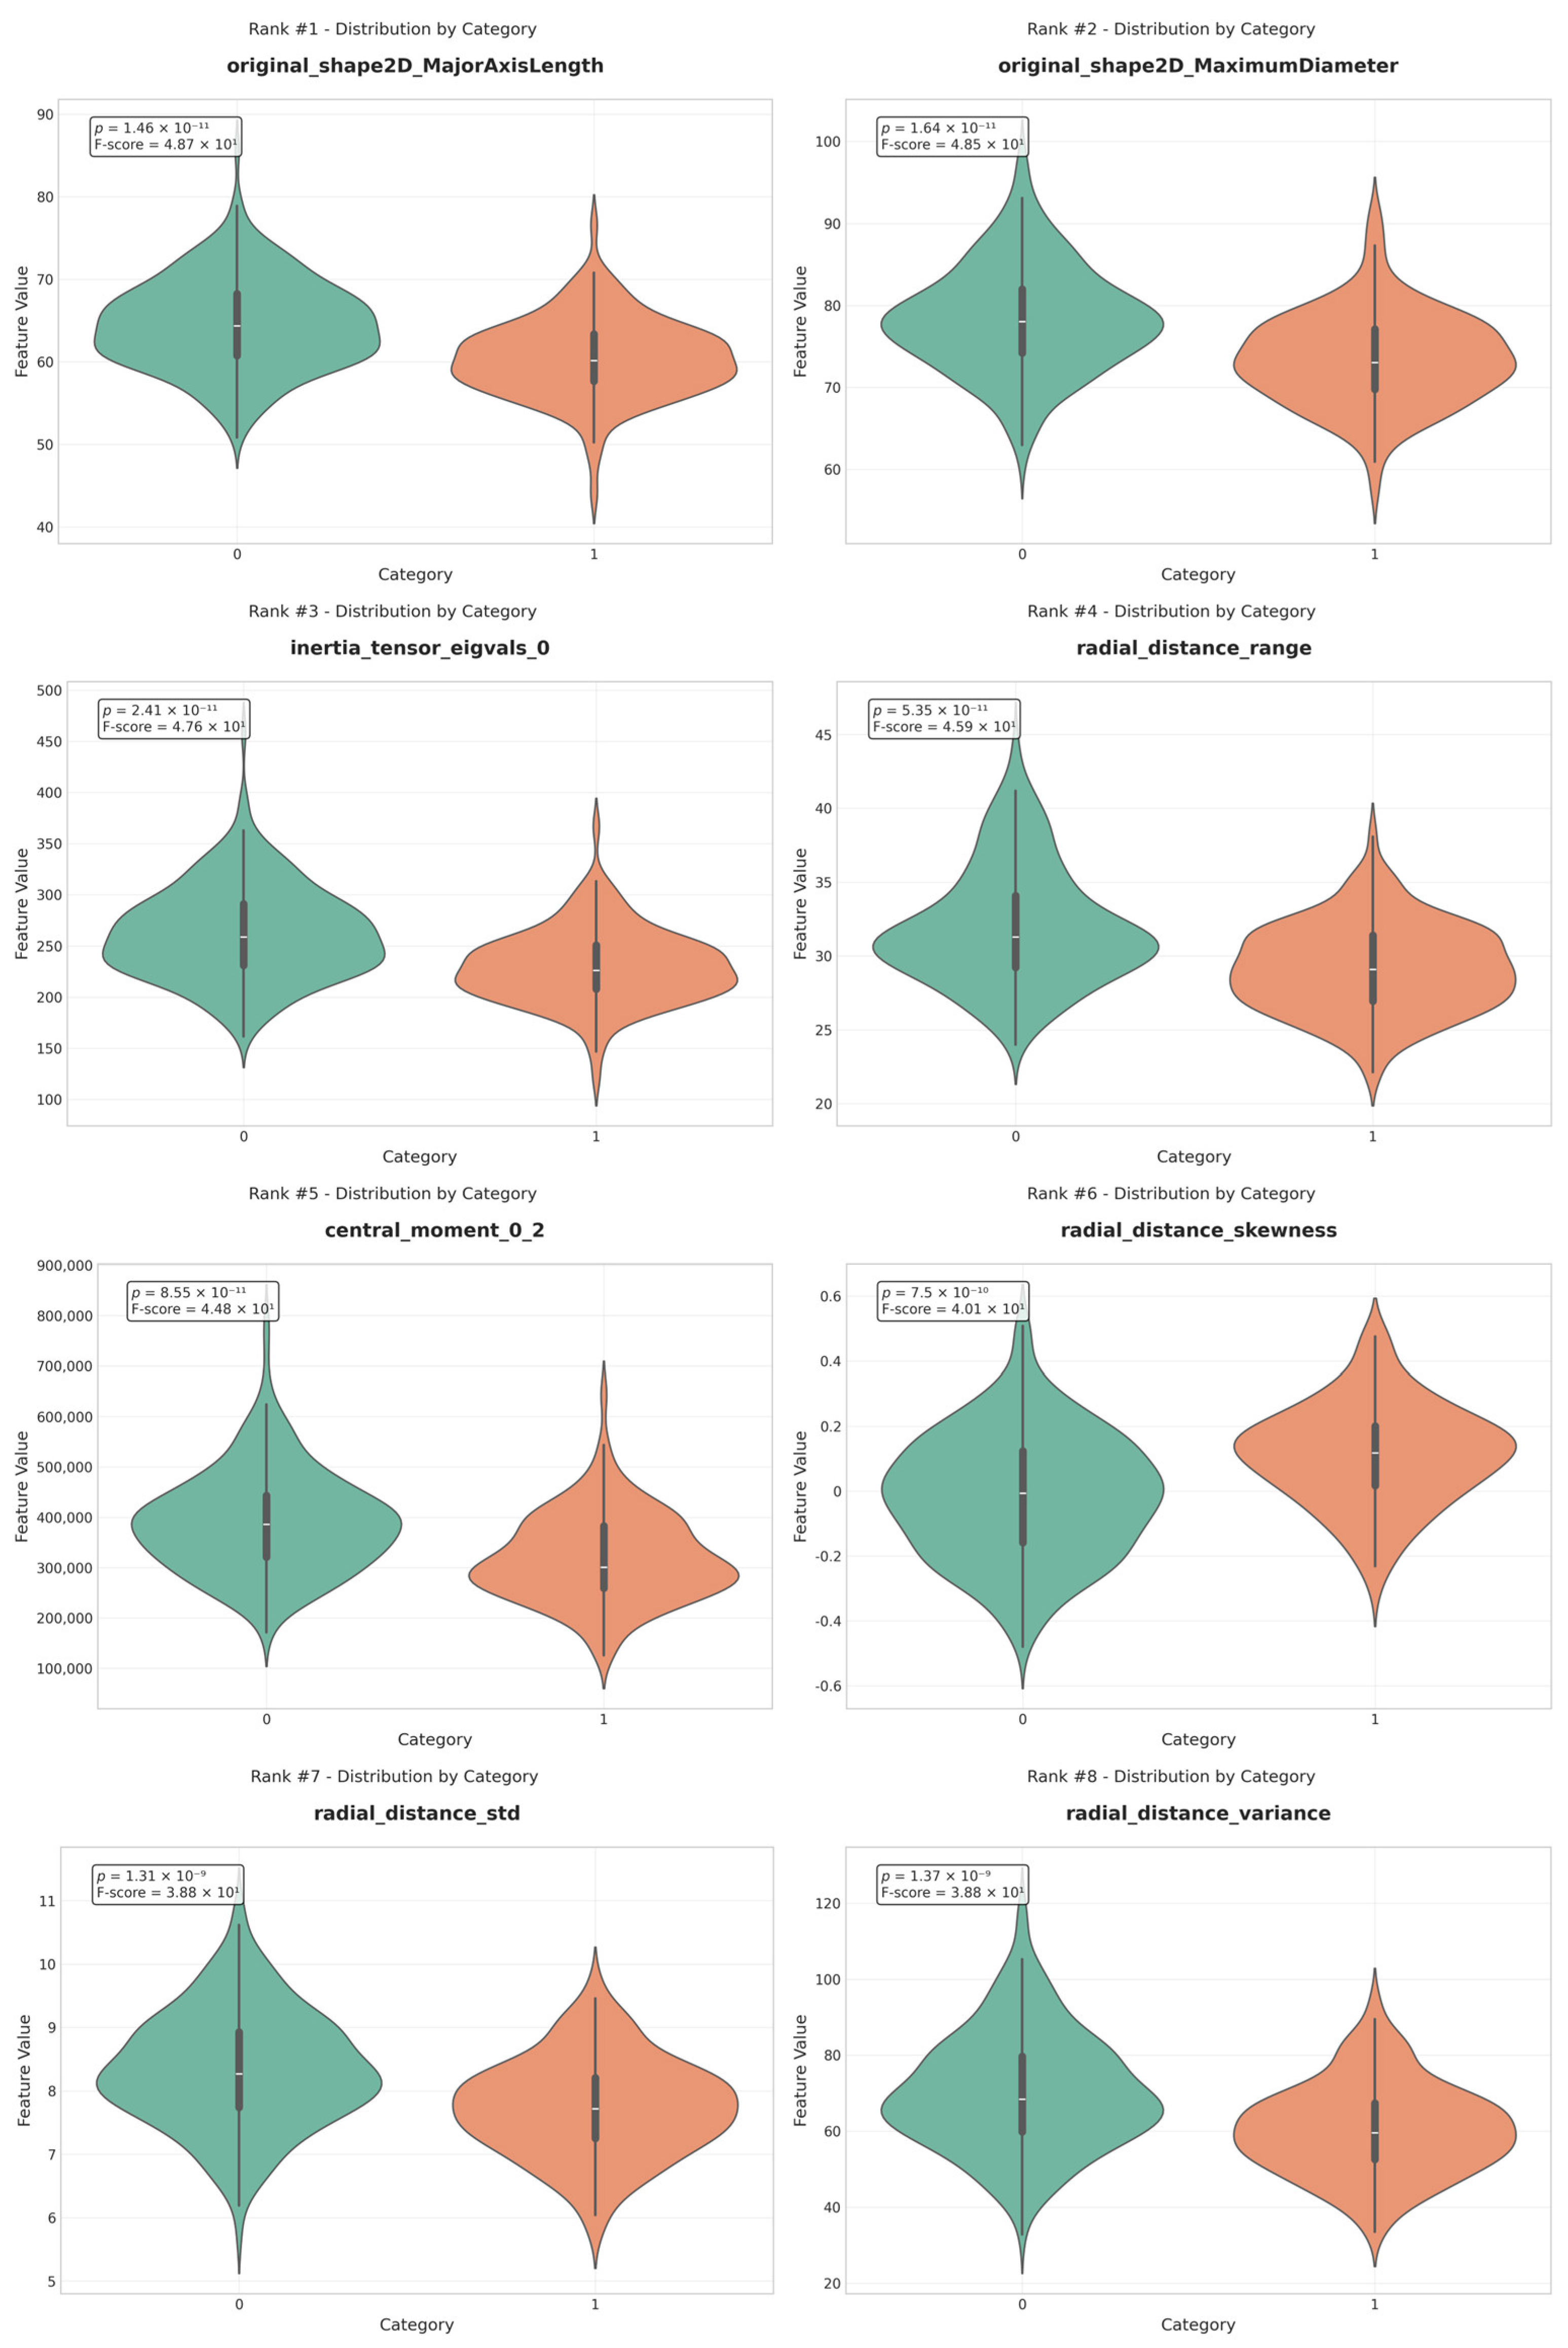
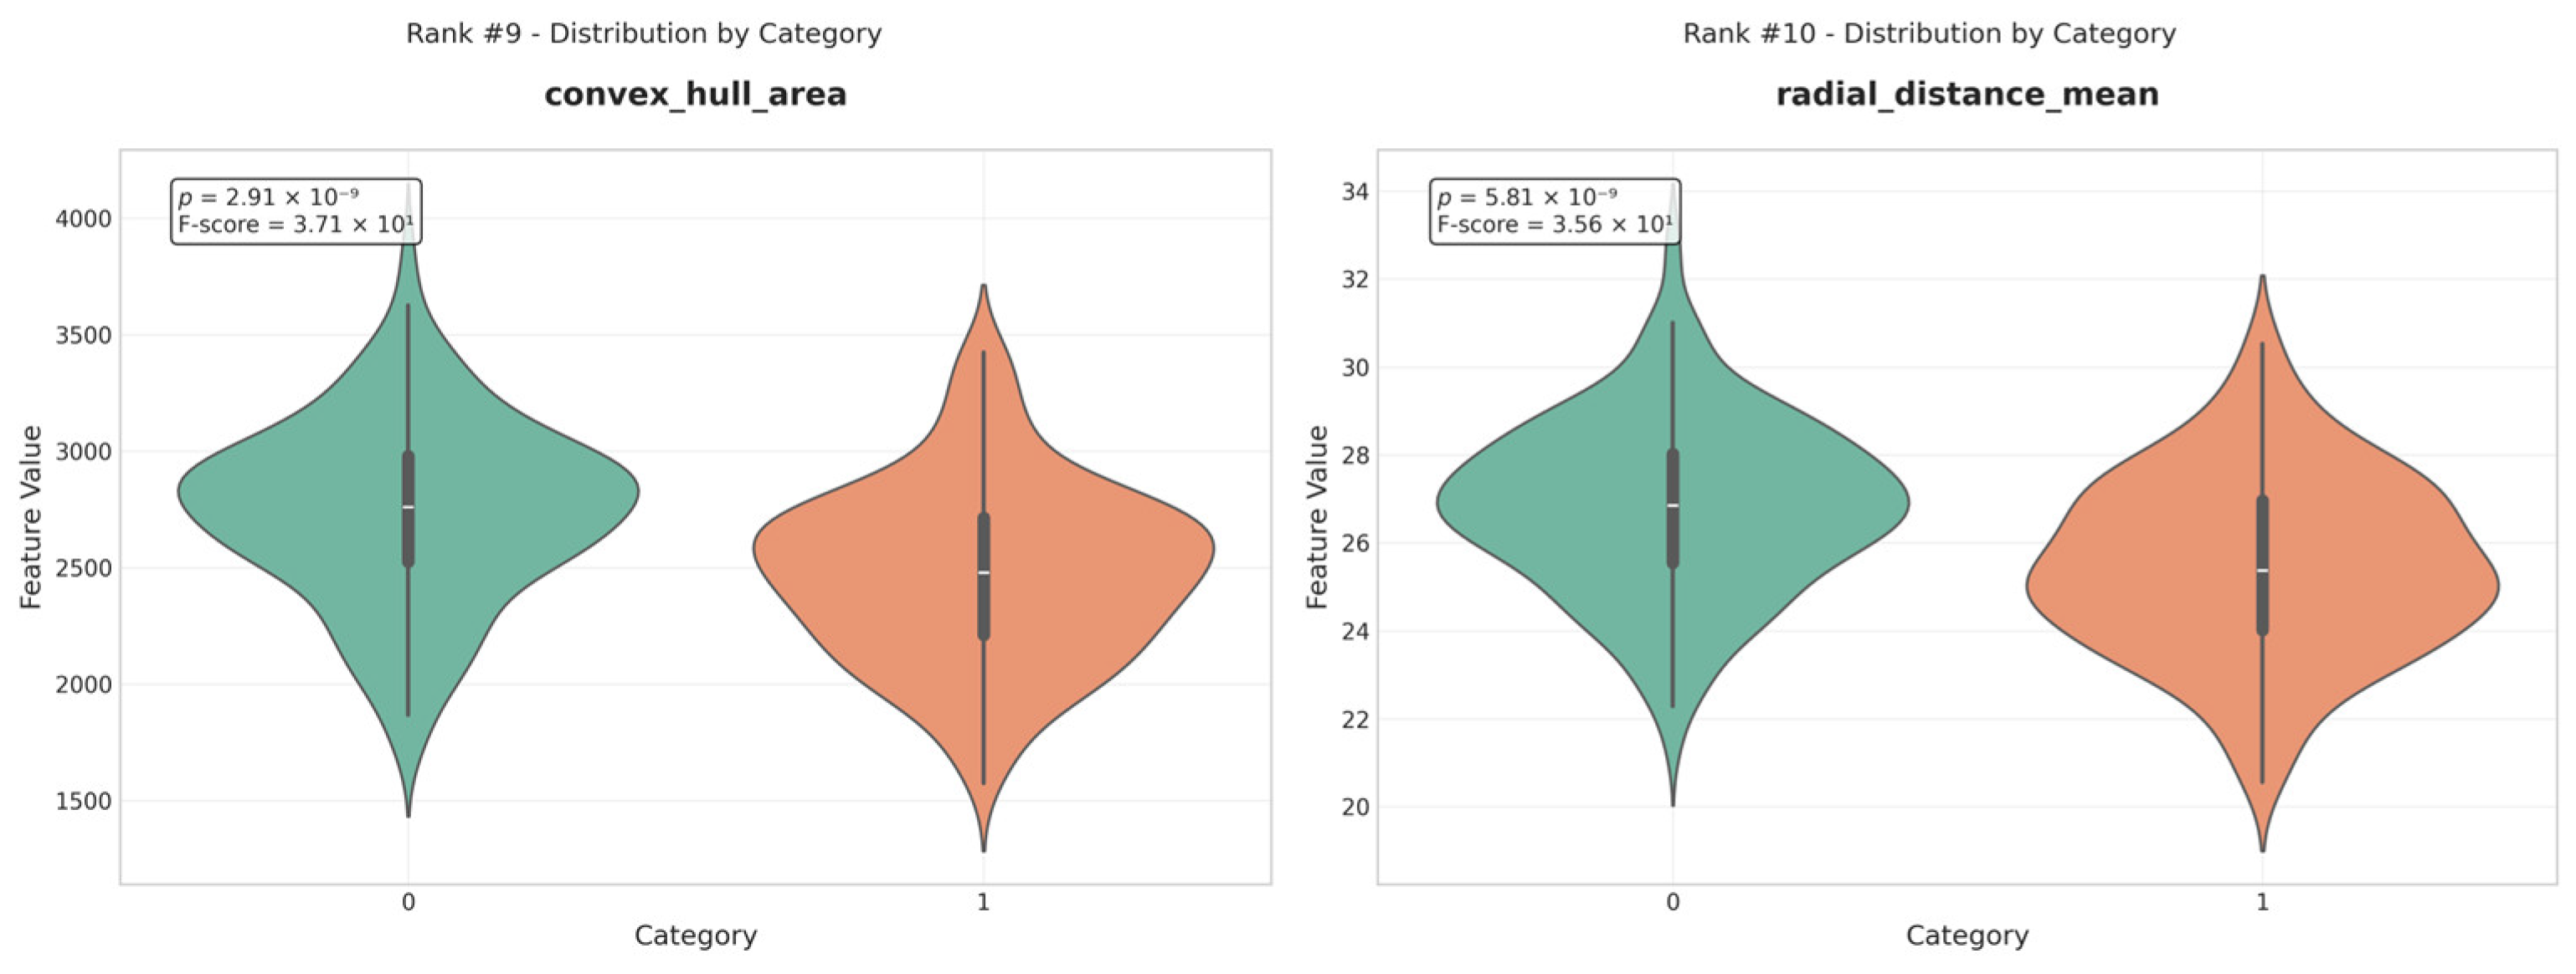
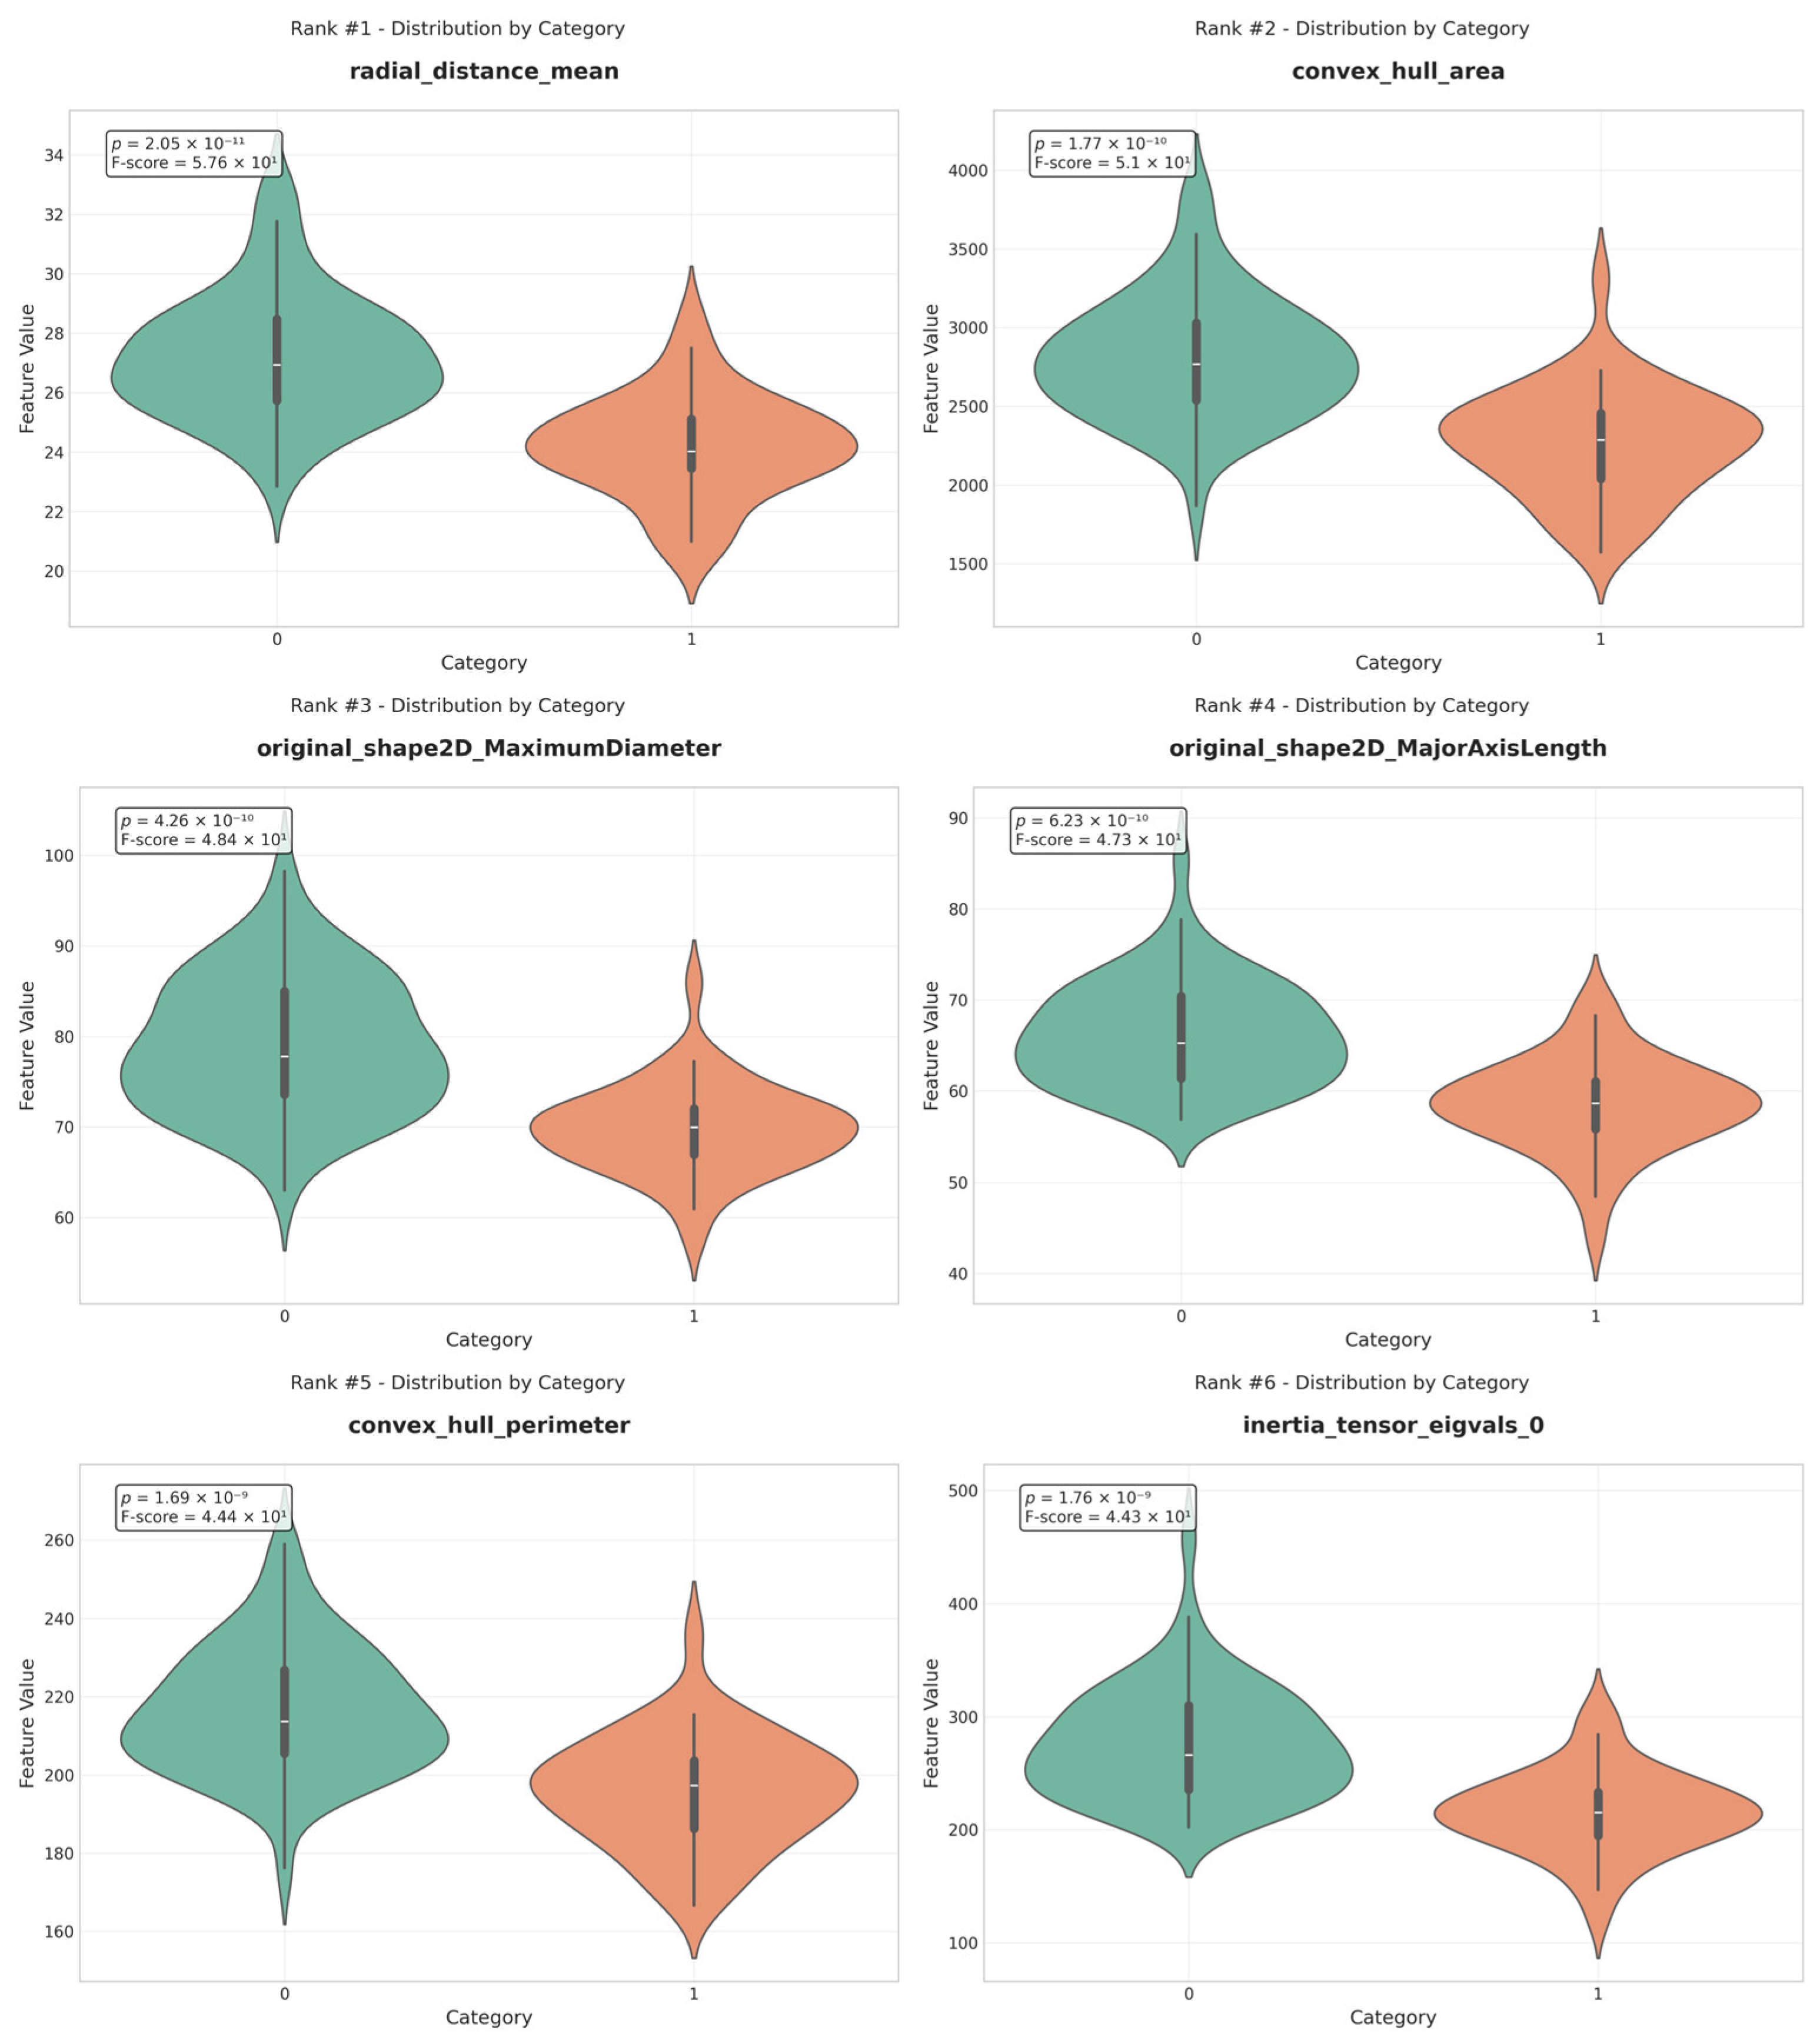
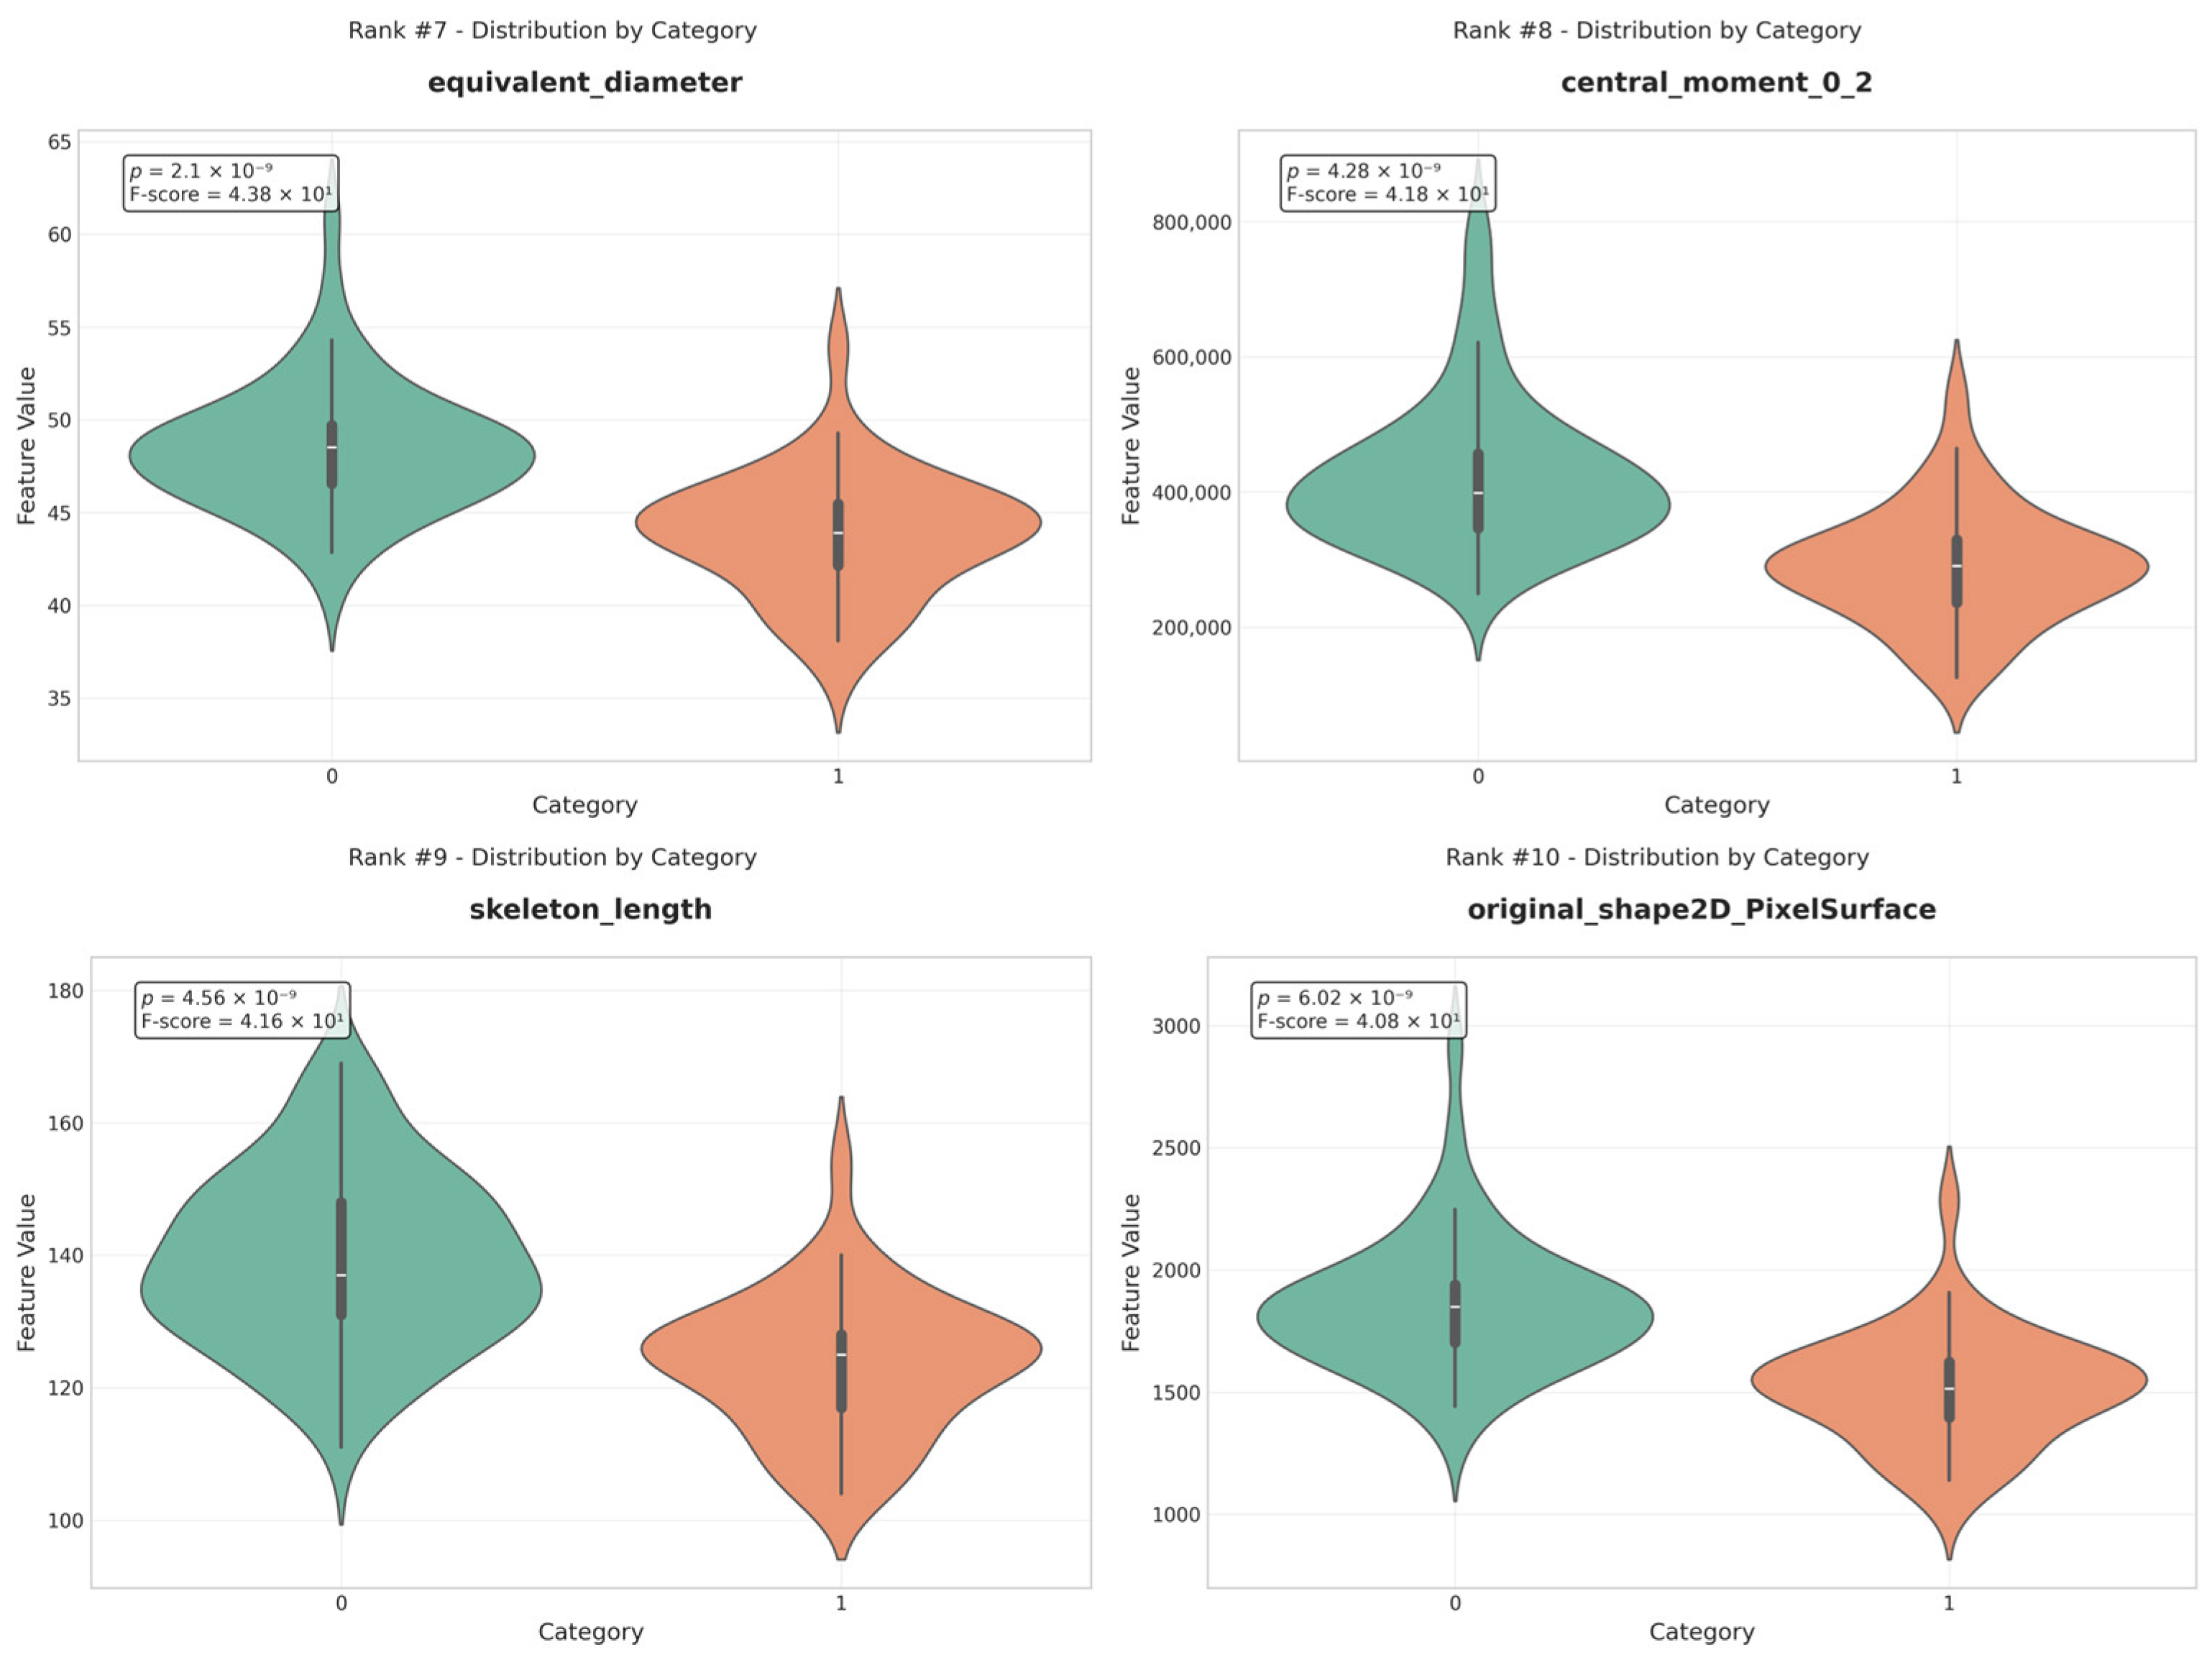
ANOVA ranking revealed that multiple geometric features demonstrated strong separation between the two groups. The most discriminative features included: major axis length with F = 48.74, maximum diameter with F = 48.49, inertia tensor eigenvalue with F = 47.63, radial distance range with F = 45.85 and central moments with F = 44.82. All features p values were in the range of 10−11, indicating that they were highly significant distinctions. Additional features such as convex hull area and radial distance statistics also showed statistically significant differences (F-scores ranging from 35.64 to 37.13 and p < 0.001). All top-ranking features achieved highly significant p-values, with the strongest features reaching values on the order of 10−11, indicating substantial differences in joint space morphology between normal and DDH. The distribution of the ten most discriminative geometric features is illustrated in Figure 8.
The JS+FH mask offered no significant advantage over the JS mask alone, indicating that the inclusion of the femoral head region does not contribute meaningfully to DDH classification. Consequently, this mask was excluded from subsequent analysis and machine learning experiments. Classification models were trained using the top-ranked features identified through ANOVA-based feature selection.
Three segmentation strategies were initially evaluated: the JS mask, which captures the articulation space independently of femoral head ossification; the JS+FH mask, which additionally includes the ossified femoral head when visible; and a combined dataset that selects the appropriate mask type per case based on ossification visibility. Feature evaluation revealed that the JS+FH mask and the combined dataset produced substantially lower ANOVA F-scores compared to the JS mask, indicating poor discriminative ability between normal and DDHs. Consequently, machine learning classification using these masks yielded inferior performance, and their results are not presented in detail. This outcome is consistent with the observation that the inclusion of the femoral head introduces morphological variability associated with the ossification stage rather than with the presence of dysplasia. The JS mask, which was consistently applicable across all cases regardless of ossification status and demonstrated the strongest feature discriminability, was therefore adopted as the sole segmentation strategy for the classification experiments reported in the following sections.

4.2. Classification Results

Supervised machine learning models were trained to classify hips as normal or dysplastic based on the extracted geometric features. Model performance was estimated using stratified five-fold cross-validation, where in each iteration four folds (80%) were used for training and the remaining fold (20%) was used for validation. Patient-level grouping was enforced such that both hips of the same patient were always assigned to the same fold, preventing data leakage. The reported performance metrics, presented in Table 1, represent the mean and standard deviation across the five folds.
Despite the strong statistical separation observed in individual features, classification performance reflects partial overlap between normal and dysplastic cases, consistent with the continuous nature of anatomical variation in infant hip development.

4.3. Effect of Age on Classification

To evaluate the influence of developmental variation, an age-matched subset was constructed consisting of 100 hips (50 normal and 50 DDH). Applying the same feature extraction and classification pipeline to this subset resulted in improved performance presented at Table 2.
In addition, feature distributions demonstrated clearer separation between normal and dysplastic hips compared to the full dataset, as illustrated in Figure 9 and Figure 10. These findings indicate that age-related morphological variation significantly affects classification performance and acts as a confounding factor when analyzing heterogeneous pediatric datasets.
The age-matched subset was constructed by selecting radiographs in which femoral head ossification had not yet occurred. Since ossification typically begins at 4–5 months on average—between 2 and 6 months in girls and between 3 and 7 months in boys—infants aged 3–4 months were selected, as this range precedes ossification onset in the majority of cases. This criterion was applied consistently across both normal and dysplastic hips for two reasons: first, in dysplastic cases the femoral head may be absent or poorly visible on radiograph due to delayed ossification, introducing segmentation inconsistency; second, earlier detection is associated with better treatment outcomes, making this age group of particular clinical relevance. The subset was evaluated using the same stratified 5-fold cross-validation protocol with patient-level grouping as the full dataset.

5. Discussion

5.1. Classification Performance

This study investigated whether geometric characterization of the hip joint articulation space can be used to differentiate between normal and dysplastic hips in infant radiographs. The results demonstrate that multiple geometric features of this region exhibit statistically significant differences between the two groups and can support automated classification with meaningful performance.
A key finding of this work is that the morphology of the joint space itself provides discriminative information beyond traditional angular measurements. While conventional radiographic assessment relies on simplified geometric descriptors such as the acetabular index and reference lines, these approaches do not fully capture the complex spatial relationships within the hip joint. By contrast, the proposed feature-based analysis quantifies the shape, distribution, and structural characteristics of the articulation space, offering a more comprehensive representation of hip morphology.
The results further show that not all segmentation strategies contribute equally to classification performance. The joint space mask excluding the femoral head provided the most stable and consistent results, whereas inclusion of the ossified femoral head introduced additional variability, yielding no significant improvement. This finding suggests that the geometric properties of the articulation space are more robust indicators of dysplasia than the appearance of the femoral head itself, particularly in early developmental stages in which ossification is variable. This observation aligns with the underlying pathophysiology of DDH, where abnormal spatial relationships precede and influence subsequent structural development [18,19,20].
A major contribution of this study is the identification of patient age as a critical confounding factor in geometric analysis of infant hip radiographs. Although highly significant differences between normal and DDHs were observed in the full dataset, classification performance improved substantially when an age-matched subset was used. This indicates that normal developmental changes in hip morphology can overlap with pathological variations, reducing classification accuracy in heterogeneous datasets. The improved separation observed in the age-matched analysis supports the hypothesis that geometric features capture true morphological differences, but their discriminative power is influenced by developmental stage.
The relatively large standard deviations observed across models are consistent with the limited size of the JS mask dataset. When training and evaluating machine learning models on small datasets, cross-validation estimates tend to exhibit higher variability, as each fold represents a substantial proportion of the total data, making performance metrics sensitive to the specific samples included in each split.
These findings highlight an important methodological consideration for future studies: age stratification or age-aware modeling is essential when analyzing pediatric imaging data. Without accounting for developmental variation, models may inadvertently learn age-related patterns rather than pathology-specific features.
Compared to existing approaches, this work offers an interpretable alternative to deep learning-based methods. Previous studies have demonstrated strong classification performance using convolutional neural networks in both ultrasound and radiographic imaging [14,15,16]. However, these models typically operate as black-box systems, limiting insight into the anatomical features driving their predictions [17]. In contrast, the present approach is based on explicit geometric features derived from a clinically meaningful region of interest, allowing direct interpretation of the factors contributing to classification. This improves transparency and may facilitate clinical trust and adoption. At the same time, this study should be interpreted as a proof-of-concept investigation. Several limitations must be acknowledged.
Future research should focus on expanding the dataset, incorporating multi-center data, and integrating age-aware modeling strategies. The development of automated segmentation pipelines and the evaluation of different machine learning algorithms may further enhance the robustness and scalability of the proposed approach. Moreover, combining geometric features with other imaging or clinical data could improve diagnostic performance and support more comprehensive decision-making.
It is worth noting that the central contribution is the demonstration that the hip joint articulation space, when analyzed geometrically, contains meaningful morphological information that differentiates normal from dysplastic hips. This finding is of relevance to clinicians, as it provides evidence supporting the anatomical significance of a region that has been recognized in clinical practice but never systematically characterized through imaging biomarkers. The interpretability of the extracted features—which can be directly mapped to known pathophysiological mechanisms such as acetabular flattening and femoral head displacement—further supports the clinical orientation of this work.

5.2. Future Perspectives and Limitations

This study presents a proof-of-concept methodology for DDH detection based on geometric characterization of the hip joint articulation space. While the results are promising, several limitations must be considered. The dataset size was relatively limited and derived from a restricted number of sources, which may affect the generalizability of the findings. In addition, the dataset lacked detailed demographic and clinical metadata, preventing more comprehensive analysis of potential confounding factors such as sex distribution or clinical severity. Another important limitation is the reliance on manual segmentation. Although the masks were generated by a radiologist under expert supervision, the absence of inter-observer variability assessment introduces potential subjectivity and limits reproducibility. The development of automated segmentation methods represents an important direction for future work and would improve consistency across datasets. Furthermore, variability in image quality and acquisition conditions may influence both segmentation accuracy and feature extraction. Standardization of imaging protocols or inclusion of higher-quality datasets would likely improve the robustness of the proposed methodology. The results also highlight the significant impact of patient age on classification performance. While the age-matched subset demonstrated improved accuracy, its relatively small size raises the possibility of overfitting. Larger datasets with well-defined age stratification are required to validate these findings and to support the development of age-aware diagnostic models. Future research should focus on expanding the dataset through multi-center collaborations, evaluating additional machine learning algorithms, and integrating automated segmentation pipelines. Moreover, combining geometric features with other imaging or clinical parameters may further enhance diagnostic performance and clinical applicability. Lastly, normality and homoscedasticity were not formally verified prior to applying the ANOVA F-test and independent t-tests. While these tests were used primarily as feature ranking tools, their reported p-values carry inferential weight and future work should consider verifying these assumptions or employing non-parametric alternatives such as the Mann–Whitney U test.

6. Conclusions

This study investigated the use of geometric features derived from the hip joint articulation space for the detection of developmental dysplasia of the hip in infant radiographs. The results demonstrate that this region contains discriminative morphological information capable of differentiating between normal and dysplastic hips.
The proposed approach provides an interpretable alternative to conventional methods based on angular measurements and to black-box deep learning models by focusing on anatomically meaningful geometric characteristics of the joint space. Among the evaluated strategies, segmentation of the articulation space without inclusion of the femoral head yielded the most consistent classification performance. A key finding of this work is the significant influence of patient age on geometric feature distributions and classification accuracy, highlighting the need for age-stratified analysis in pediatric imaging studies.
Overall, this work establishes a foundation for the use of geometric radiomic analysis of the hip joint space as a complementary tool for DDH assessment. However, further validation on larger and more diverse datasets is required before clinical application can be considered.

Supplementary Materials

The following supporting information can be downloaded at: https://www.mdpi.com/article/10.3390/app16094345/s1, Table S1: All 99 features extracted per hip segmentation, ranked by ANOVA F-score (computed on the full dataset).

Author Contributions

Conceptualization, O.S.; methodology, O.S. and A.V.; software, O.S., A.V. and I.V.; validation, A.V., I.V. and I.K.; formal analysis, O.S.; investigation, O.S. and A.V.; resources, S.T.M. and I.K.; data curation, O.S. and A.V.; writing—original draft preparation, O.S., N.K. and A.V.; writing—review and editing, S.T.M., N.K., E.K. and I.K.; visualization, O.S. and A.V.; supervision, G.K.M.; project administration, G.K.M.; funding acquisition, G.K.M. All authors have read and agreed to the published version of the manuscript.

Funding

This research received no external funding.

Informed Consent Statement

Informed consent was obtained from all subjects involved in the study.

Data Availability Statement

The original data presented in the study are openly available https://data.mendeley.com/datasets/jf3pv98m9g/1 (accessed on 1 October 2025).

Conflicts of Interest

The authors declare no conflicts of interest.

Abbreviations

The following abbreviations are used in this manuscript:
DDHDevelopmental Dysplasia of the Hip.
ROIRegion of Interest.
JSJoint Space.
FHFemoral Head.
JS+FHJoint Space with Femoral Head.
ANOVAAnalysis of Variance.
SVMSupport Vector Machine.
XGBoostExtreme Gradient Boosting.
KNNK-Nearest Neighbors.
ROC AUCReceiver Operating Characteristic Area Under the Curve.
CNNConvolutional Neural Network.
Mask R-CNNMask Region-based Convolutional Neural Network.
MRIMagnetic Resonance Imaging.
USUltrasonography/Ultrasound.
APAnteroposterior.

References

  1. Bialik, V.; Bialik, G.M.; Blazer, S.; Sujov, P.; Wiener, F.; Berant, M. Developmental Dysplasia of the Hip: A New Approach to Incidence. Pediatrics 1999, 103, 93–99. [Google Scholar] [CrossRef] [Scilit]
  2. Loder, R.T.; Skopelja, E.N. The Epidemiology and Demographics of Hip Dysplasia. ISRN Orthop. 2011, 2011, 1–46. [Google Scholar] [CrossRef] [Scilit]
  3. Gaillard, F.; Knipe, H.; Weerakkody, Y. Developmental dysplasia of the hip. Radiopaedia.org. 2008. Available online: https://www.researchgate.net/publication/355427890_Developmental_dysplasia_of_the_hip (accessed on 26 April 2026).
  4. Aronsson, D.D.; Goldberg, M.J.; Kling, T.F.; Roy, D.R. Developmental dysplasia of the hip. Pediatrics 1994, 94, 201–208. [Google Scholar] [PubMed]
  5. Rogers, B.A.; Garbedian, S.; Kuchinad, R.A.; Backstein, D.; Safir, O.; Gross, A.E. Total Hip Arthroplasty for Adult Hip Dysplasia. J. Bone Jt. Surg. 2012, 94, 1809–1821. [Google Scholar] [CrossRef] [Scilit]
  6. US Preventive Services Task Force Screening for Developmental Dysplasia of the Hip: Recommendation Statement. Pediatrics 2006, 117, 898–902. [CrossRef] [Scilit]
  7. Starr, V.; Ha, B.Y. Imaging Update on Developmental Dysplasia of the Hip With the Role of MRI. Am. J. Roentgenol. 2014, 203, 1324–1335. [Google Scholar] [CrossRef] [Scilit]
  8. Roposch, A.; Moreau, N.M.; Uleryk, E.; Doria, A.S. Developmental Dysplasia of the Hip: Quality of Reporting of Diagnostic Accuracy for US. Radiology 2006, 241, 854–860. [Google Scholar] [CrossRef] [Scilit]
  9. Lee, Y.-K.; Chung, C.Y.; Koo, K.-H.; Lee, K.M.; Kwon, D.G.; Park, M.S. Measuring acetabular dysplasia in plain radiographs. Arch. Orthop. Trauma Surg. 2011, 131, 1219–1226. [Google Scholar] [CrossRef] [Scilit]
  10. Sharp, I.K. Acetabular Dysplasia: The Acetabular Angle. J. Bone Jt. Surg. Br. 1961, 43, 268–272. [Google Scholar] [CrossRef] [Scilit]
  11. Hudak, K.E.; Faulkner, N.D.; Guite, K.; Muchow, R.; Narotam, V.; Nemeth, B.; Halanski, M.; Noonan, K. Variations in AP and Frog-Leg Pelvic Radiographs in a Pediatric Population. J. Pediatr. Orthop. 2013, 33, 212–215. [Google Scholar] [CrossRef] [Scilit] [PubMed]
  12. Yi, P.H.; Garner, H.W.; Hirschmann, A.; Jacobson, J.A.; Omoumi, P.; Oh, K.; Zech, J.R.; Lee, Y.H. Clinical Applications, Challenges, and Recommendations for Artificial Intelligence in Musculoskeletal and Soft-Tissue Ultrasound: AJR Expert Panel Narrative Review. Am. J. Roentgenol. 2024, 222, e2329530. [Google Scholar] [CrossRef] [Scilit] [PubMed]
  13. on behalf of CUD; Golan, L.; Donner, Y.; Mansi, C.; Jaremko, J.; Ramachandran, M. Fully Automating Graf’s Method for DDH Diagnosis Using Deep Convolutional Neural Networks. In Deep Learning and Data Labeling for Medical Applications; Carneiro, G., Mateus, D., Peter, L., Bradley, A., Tavares, J.M.R.S., Belagiannis, V., Papa, J.P., Nascimento, J.C., Loog, M., Lu, Z., et al., Eds.; Lecture Notes in Computer Science; Springer International Publishing: Cham, Switzerland, 2016; Volume 10008, pp. 130–141. [Google Scholar] [CrossRef] [Scilit]
  14. Fraiwan, M.; Al-Kofahi, N.; Ibnian, A.; Hanatleh, O. Detection of developmental dysplasia of the hip in X-ray images using deep transfer learning. BMC Med. Inform. Decis. Mak. 2022, 22, 216. [Google Scholar] [CrossRef] [Scilit] [PubMed]
  15. Lee, S.-W.; Ye, H.-U.; Lee, K.-J.; Jang, W.-Y.; Lee, J.-H.; Hwang, S.-M.; Heo, Y.-R. Accuracy of New Deep Learning Model-Based Segmentation and Key-Point Multi-Detection Method for Ultrasonographic Developmental Dysplasia of the Hip (DDH) Screening. Diagnostics 2021, 11, 1174. [Google Scholar] [CrossRef] [Scilit]
  16. Magnéli, M.; Borjali, A.; Takahashi, E.; Axenhus, M.; Malchau, H.; Moratoglu, O.K.; Varadarajan, K.M. Application of deep learning for automated diagnosis and classification of hip dysplasia on plain radiographs. BMC Musculoskelet. Disord. 2024, 25, 117. [Google Scholar] [CrossRef] [Scilit]
  17. Varoquaux, G.; Cheplygina, V. Machine learning for medical imaging: Methodological failures and recommendations for the future. NPJ Digit. Med. 2022, 5, 48. [Google Scholar] [CrossRef] [Scilit]
  18. Ponseti, I.V. Growth and development of the acetabulum in the normal child. Anatomical, histological, and roentgenographic studies. J. Bone Jt. Surg. Am. 1978, 60, 575–585. [Google Scholar] [CrossRef] [Scilit]
  19. Dunn, P.M. The anatomy and pathology of congenital dislocation of the hip. Clin. Orthop. Relat. Res. 1976, 119, 23–27. [Google Scholar] [CrossRef] [Scilit] [PubMed]
  20. Connolly, P.; Weinstein, S.L. The natural history of acetabular development in developmental dysplasia of the hip. Acta Orthop. Traumatol. Turc. 2007, 41, 1–5. [Google Scholar] [PubMed]
  21. Vezakis, A.; Vezakis, I.; Petropoulou, O.; Miloulis, S.T.; Anastasiou, A.; Kakkos, I.; Matsopoulos, G.K. Comparative Analysis of Deep Neural Networks for Automated Ulcerative Colitis Severity Assessment. Bioengineering 2025, 12, 413. [Google Scholar] [CrossRef] [Scilit]
  22. Vezakis, I.A.; Lambrou, G.I.; Matsopoulos, G.K. Deep Learning Approaches to Osteosarcoma Diagnosis and Classification: A Comparative Methodological Approach. Cancers 2023, 15, 2290. [Google Scholar] [CrossRef] [Scilit]
  23. Wu, Q.; Ma, H.; Sun, J.; Liu, C.; Fang, J.; Xie, H.; Zhang, S. Application of deep-learning–based artificial intelligence in acetabular index measurement. Front. Pediatr. 2023, 10, 1049575. [Google Scholar] [CrossRef] [Scilit] [PubMed]
  24. Xu, W.; Shu, L.; Gong, P.; Huang, C.; Xu, J.; Zhao, J.; Shu, Q.; Zhu, M.; Qi, G.; Zhao, G.; et al. A Deep-Learning Aided Diagnostic System in Assessing Developmental Dysplasia of the Hip on Pediatric Pelvic Radiographs. Front. Pediatr. 2022, 9, 785480. [Google Scholar] [CrossRef] [Scilit] [PubMed]
  25. Rundo, L.; Militello, C. Image biomarkers and explainable AI: Handcrafted features versus deep learned features. Eur. Radiol. Exp. 2024, 8, 130. [Google Scholar] [CrossRef] [Scilit]
  26. Buvat, I.; Dutta, J.; Jha, A.K.; Siegel, E.; Yousefirizi, F.; Rahmim, A.; Bradshaw, T. Should end-to-end deep learning replace handcrafted radiomics? Eur. J. Nucl. Med. Mol. Imaging 2025, 52, 4360–4363. [Google Scholar] [CrossRef] [Scilit] [PubMed]
  27. Van Griethuysen, J.J.M.; Fedorov, A.; Parmar, C.; Hosny, A.; Aucoin, N.; Narayan, V.; Beets-Tan, R.G.H.; Fillion-Robin, J.-C.; Pieper, S.; Aerts, H.J.W.L. Computational Radiomics System to Decode the Radiographic Phenotype. Cancer Res. 2017, 77, e104–e107. [Google Scholar] [CrossRef] [Scilit]
Figure 1. Shenton’s line demonstration: normal right hip versus dysplastic left hip.
Applsci 16 04345 g001
Figure 2. Overview of the computational pipeline for DDH detection, from dataset curation and segmentation through feature extraction, statistical evaluation, and classification on both the full and age-matched datasets. The figure was created using draw.io (diagrams.net, web-based application, accessed April 2026).
Applsci 16 04345 g002
Figure 3. Segmentation of the ROI that DDH affects. The JS mask is shown in white and the background is black.
Applsci 16 04345 g003
Figure 4. Comparison of the segmentations of the ROI that DDH affects. The segmented mask is shown in white and the background is black. (a) JS+FH mask. (b) JS mask.
Applsci 16 04345 g004
Figure 5. A clear presentation of the JS mask on top of the X-ray so that the mask aligns with the segmented ROI. The darker red color indicates the segmented mask.
Applsci 16 04345 g005
Figure 6. The acetabular angle calculated for the right hip.
Applsci 16 04345 g006
Figure 7. An image of the femur head on the left hip in the center of the yellow circle.
Applsci 16 04345 g007
Figure 8. Max diameter of a JS mask.
Applsci 16 04345 g008
Figure 9. Distribution comparison of the ten most discriminative geometric features between normal and DDHs using JS mask. The green violin plots indicate the normal hips and the orange ones indicate the dysplastic hips.
Applsci 16 04345 g009aApplsci 16 04345 g009b
Figure 10. Distribution comparison of the ten most discriminative geometric features between normal and DDHs of the age-matched dataset. The green violin plots indicate the normal hips and the orange ones indicate the dysplastic hips.
Applsci 16 04345 g010aApplsci 16 04345 g010b
Table 1. Classification performance metrics for machine learning models trained on the JS mask dataset. ± values denote standard deviation across cross-validation folds.
ModelRandom ForestSVMGradient BoostingXGBoostK-Nearest NeighborsGaussian Naive Bayes
Accuracy0.72 ± 7%0.77 ± 6%0.79 ± 4%0.69 ± 7%0.76 ± 6%0.65 ± 7%
Precision0.69 ± 6%0.74 ± 5%0.74 ± 5%0.68 ± 5%0.73 ± 5%0.85 ± 6%
Recall0.95 ± 3%0.98 ± 5%1.00 ± 1%0.91 ± 4%0.95 ± 5%0.51 ± 8%
F1-score0.80 ± 5%0.84 ± 6%0.85 ± 4%0.78 ± 6%0.83 ± 6%0.64 ± 7%
Table 2. Classification performance metrics for the models trained on the age-matched dataset. ± values denote standard deviation across cross-validation folds.
ModelRandom ForestSVMGradient BoostingXGBoostK-Nearest NeighborsGaussian Naive Bayes
Accuracy0.94 ±5%0.90 ±3%0.90 ± 5%0.85 ± 6%0.70 ±7%0.85 ± 6%
Precision1.00 ± 1%1.00 ± 2%1.00 ± 2%1.00 ± 1%1.00 ± 1%1.00 ± 1%
Recall0.93 ± 5%0.86 ± 3%0.86 ± 4%0.79 ± 6%0.57 ± 7%0.79 ± 6%
F1-score0.96 ± 4%0.92 ± 4%0.92 ± 3%0.88 ± 5%0.73 ± 6%0.88 ± 6%
Disclaimer/Publisher’s Note: The statements, opinions and data contained in all publications are solely those of the individual author(s) and contributor(s) and not of MDPI and/or the editor(s). MDPI and/or the editor(s) disclaim responsibility for any injury to people or property resulting from any ideas, methods, instructions or products referred to in the content.