1. Introduction
Dental implants represent the predominant treatment modality in contemporary dentistry for restoring esthetics, function, and speech in patients with tooth loss [
1,
2]. The success and long-term survival of dental implants are influenced by several factors, including bone density, implant surface characteristics, surgical technique, and primary stability [
3,
4]. Implant stability can be quantitatively assessed through insertion torque (IT) and removal torque (RT) measurements, which reflect the mechanical engagement between the implant and the surrounding substrate [
5,
6,
7], though advanced predictive modeling and vibration analysis techniques are increasingly being explored [
8,
9]. While IT can be measured clinically during implant placement, RT assessment requires destructive testing and is therefore restricted to in vitro and ex vivo models.
In vitro jaw models fabricated from synthetic materials, as well as human and animal cadaveric specimens, serve as essential tools for biomechanical implant research. These models offer two principal advantages: they enable the execution of studies that would be unfeasible in clinical settings due to ethical constraints, and they provide standardized, reproducible test conditions unaffected by anatomical variations [
5].
Among synthetic materials, polyurethane (PU) has been accepted by the American Society for Testing and Materials (ASTM F1839) as an alternative material for biomechanical testing and evaluation of dental implants, owing to its mechanical properties that closely approximate those of human cancellous and cortical bone tissue [
10,
11]. PU is an elastomeric thermoset polymer produced through an exothermic reaction between two primary components—a polyol system and an isocyanate compound—yielding a cellular structure with tunable density [
12]. The capability to manufacture PU blocks of varying, consistent densities by adjusting component proportions is advantageous, enabling researchers to standardize testing across simulated bone quality types (D1–D4) with high reproducibility [
13,
14,
15]. Furthermore, its structural homogeneity minimizes the high standard deviations often encountered when utilizing natural cadaveric specimens, establishing PU as the gold standard for contemporary in vitro orthopedic and dental simulations [
16].
Polyethylene (PE), synthesized through catalytic polymerization of ethylene monomers, is available in low-density and high-density forms [
17]. High-density PE, and particularly ultra-high-molecular-weight polyethylene (UHMWPE), has been extensively utilized in biomedical applications, including joint prostheses and cardiovascular devices, owing to its favorable biocompatibility, wear resistance, and established mechanical properties [
18,
19]. The semi-crystalline thermoplastic structure of high-density PE yields varied elastic profiles and strength characteristics that are currently being optimized through composite engineering to increasingly match human cortical bone [
20,
21]. Despite PE’s widespread use in the broader medical field, to the authors’ knowledge, no published study has systematically investigated its potential as a bone model material for in vitro dental implant research. Establishing the comparative performance of PE relative to the ASTM-accepted PU standard would provide researchers with quantitative evidence to evaluate PE as a potential candidate bone analog material, pending confirmation across a range of densities and implant designs. High-density PE blocks at 60 pcf density are commercially available, presenting a practical opportunity for initial systematic evaluation.
The aim of this study was to compare the insertion torque and removal torque values of dental implants placed in PE and PU blocks of identical density (60 pcf) under standardized, operator-blinded conditions. The null hypotheses tested were that there would be no significant differences in (1) insertion torque and (2) removal torque values between the two synthetic bone analog materials.
2. Materials and Methods
2.1. Study Design and Sample Size
This operator-blinded, in vitro trial was conducted at the Oral and Maxillofacial Surgery Clinic of the Faculty of Dentistry, Van Yüzüncü Yıl University, in June 2025. As this study exclusively involved synthetic materials without human or animal subjects, it was exempt from ethical review board approval.
The sample size was calculated based on the methodology described by Orhan and Ciğerim [
11], yielding a minimum requirement of 26 implant sockets per group (power = 99%; effect size d = 1.421; α = 0.01). To enhance statistical robustness, the study incorporated a total of 60 implant sockets with 60 implants (30 per group).
2.2. Materials and Grouping
The study comprised two groups based on the bone model material used. Group 1 (PE) consisted of polyethylene blocks (Simitçioğlu Metal Stainless Steel Construction Industry and Trade Limited Company, Istanbul, Turkey), and Group 2 (PU) consisted of polyurethane blocks (Quantum Polyurethane Machine Material Industry and Trade Limited Company, Bursa, Turkey).
Both block types measured 3.5 × 7.5 × 2 cm3 with a density of 60 pcf (0.96 g/cm3).
2.3. Implant Placement and Torque Measurement
To ensure proper operator blinding, an independent surgeon (not involved in the study design or data analysis) prepared all implant sockets in both block types according to the drilling protocol specified by the implant manufacturer. Each group comprised a single bone-analog blocks (each measuring 3.5 × 7.5 × 2 cm
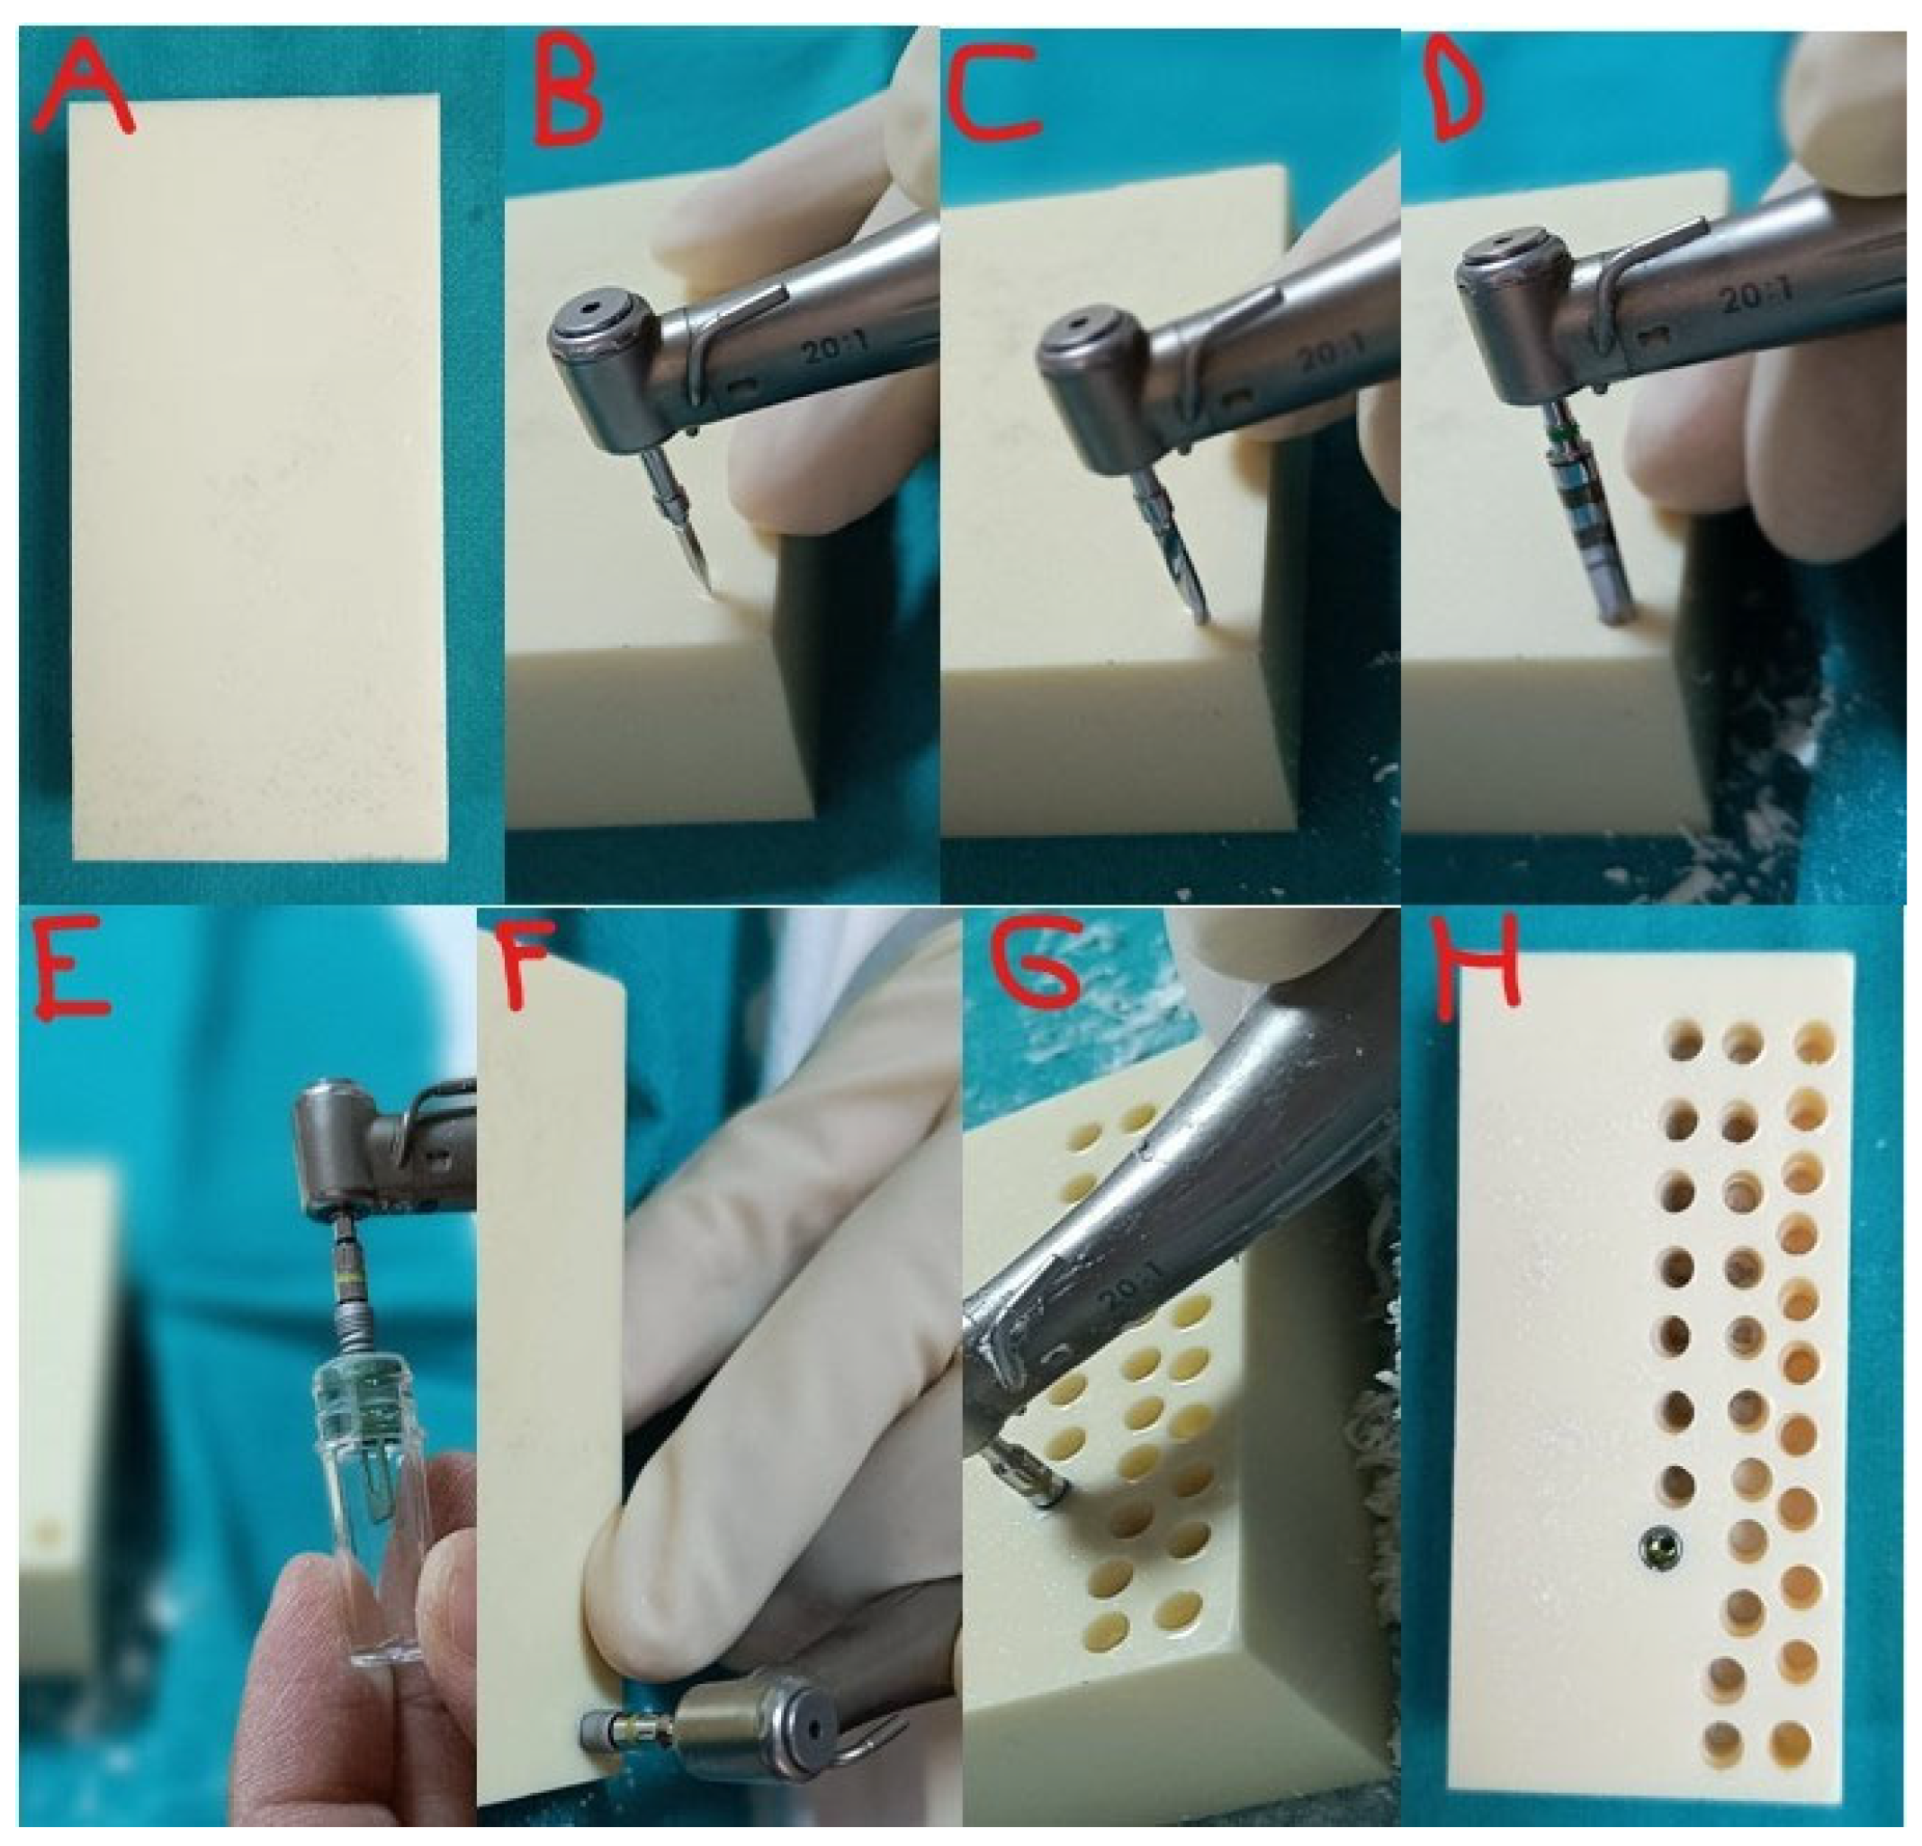
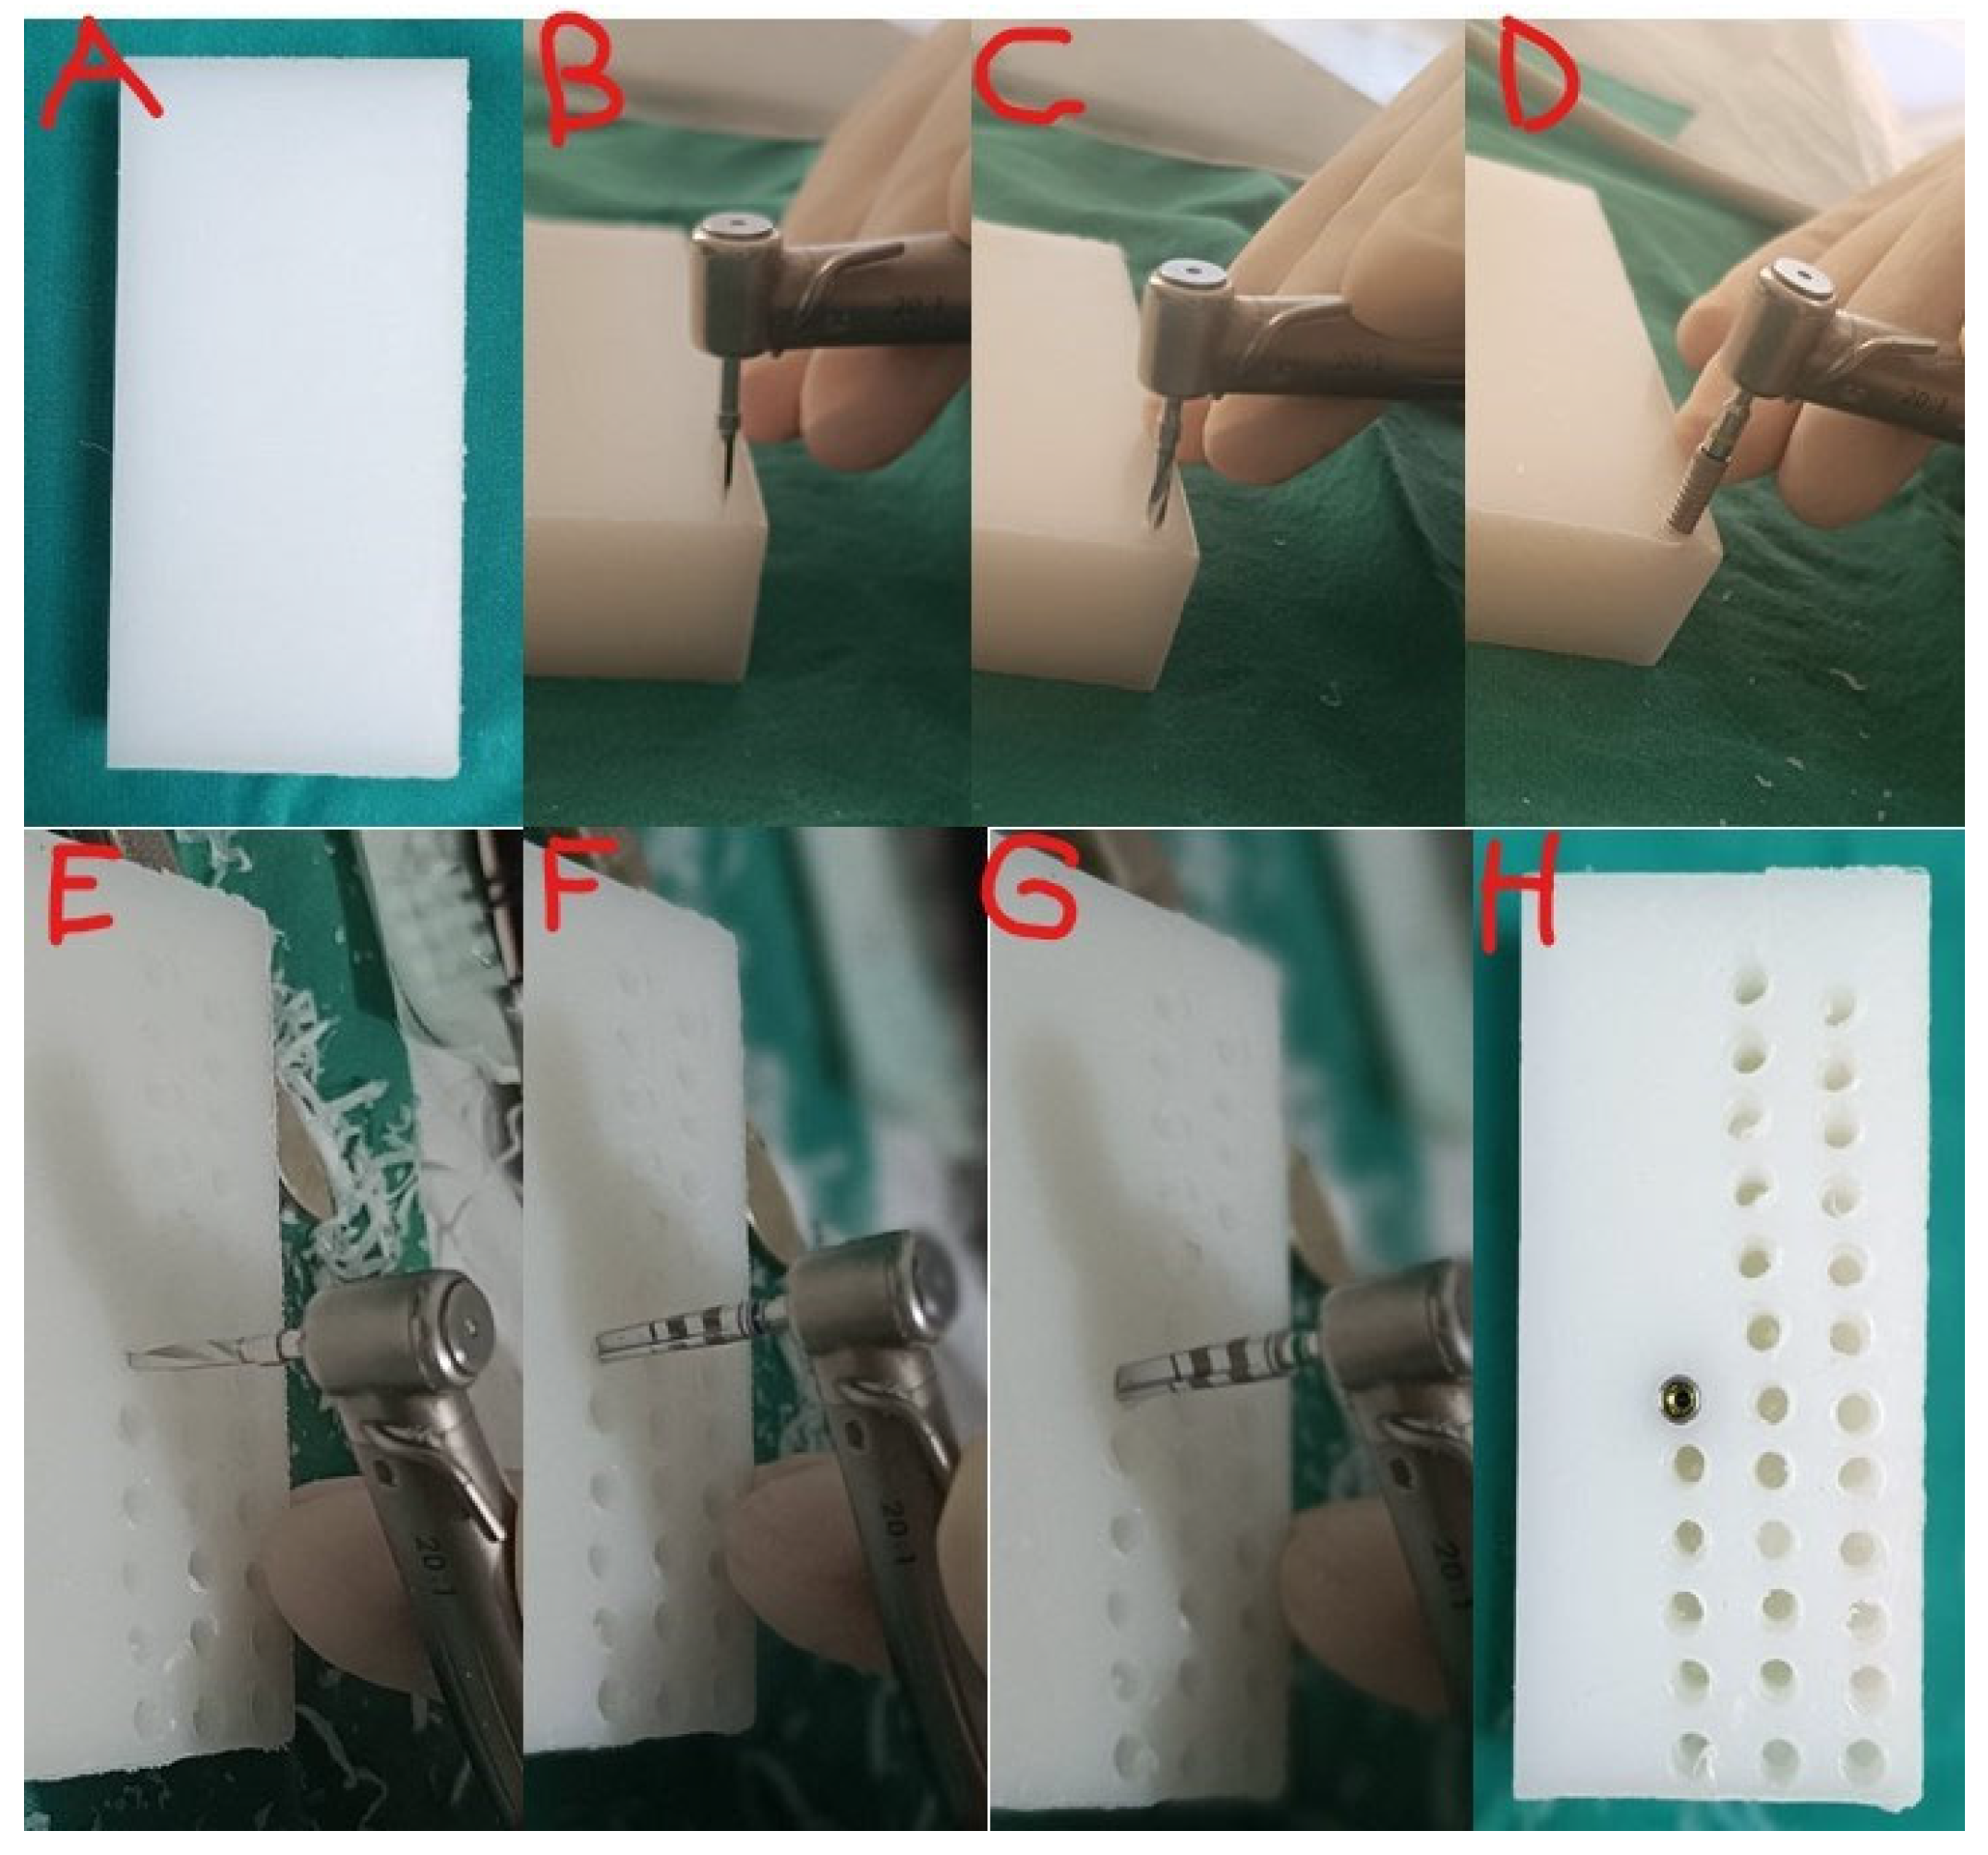
3), and the 30 implant sockets for each group were distributed across four rows (approximately 7–8 sockets per row) to minimize any potential between-block material variability across multiple physical specimens. Within each block, socket positions were spaced uniformly with standardized inter-socket distances so that edge and positional effects would be minimized and balanced across the block surface (
Figure 1 and
Figure 2). Blinding was maintained by wrapping both PE and PU blocks in identical opaque coverings, as the two materials are visually similar in color and surface texture at the tested density; because the blocks were visually indistinguishable to the calibrated operator, PE and PU blocks were presented to the operator in an interleaved order determined by the independent surgeon, such that the operator was unaware of whether a given block was PE or PU at any point during the procedure, preventing any temporal confounding between material identity and procedural order. Furthermore, since the calibrated operator (İ.D.) performed only the implant insertion and removal—not the socket preparation—the operator’s tactile exposure was limited to the final placement and removal steps, during which the standardized drilling protocol and identical implant geometry minimized perceptible tactile or mechanical differences between the two substrates. The drilling sequence involved a 2.0 mm pilot drill, followed by 2.8 mm, 3.4 mm, and 3.8 mm sequential twist drills, with a final countersink drill, all performed at 800 rpm under external saline irrigation. A tap was used prior to implant placement to prevent excessively high torque values.
The calibrated operator (İ.D.), who was blinded to the block material type throughout the insertion and removal procedures, performed all implant insertion and removal procedures for both groups, placing all implants at bone level. Implant insertion was performed at a standardized rotational speed of 25 rpm using a physiodispenser (Straumann Surgical Motor Pro, Basel, Switzerland) with a torque measurement capacity of 5–80 N·cm. The insertion endpoint was defined as the implant platform reaching flush with the block surface, and insertion depth was visually verified for each specimen. Removal torque was recorded immediately after insertion by reversing the rotational direction at the same speed. IT and RT values were digitally recorded from the physiodispenser display at the point of maximum resistance during insertion and the initial peak resistance during removal, respectively.
Both groups received 4.2 × 12 mm tapered dental implants with a resorbable blasting media (RBM) surface and platform switching design (BioInfinity Implant, Istanbul, Turkey). The procedures for implant insertion and removal were performed identically across both groups to ensure standardization, resulting in a uniform distribution of parallel implants across the block surfaces (
Figure 3).
2.4. Statistical Analysis
Statistical analyses were performed using SPSS version 27.0.1 (IBM Corp., Armonk, NY, USA). Quantitative variables were expressed as mean ± standard deviation (SD), with minimum and maximum values. The normality of data distribution was assessed using the Shapiro–Wilk test and skewness–kurtosis coefficients. For normally distributed variables, Student’s t-test was applied; for variables that deviated from normality, Mann–Whitney U tests were additionally performed as a sensitivity analysis and are reported alongside the parametric results. Effect sizes were calculated as Cohen’s d using pooled standard deviations, and 95% confidence intervals (CI) for mean differences were computed. Results were evaluated at a 95% confidence interval with a significance level of p < 0.05. Because the 30 implant sockets in each group were distributed across four physical blocks, the potential for block-level clustering to introduce non-independence between specimens within the same block was considered. Several factors supported treating sockets as independent observations in the present design. First, both PE and PU blocks were manufactured under controlled industrial conditions with certified density (60 pcf; 0.96 g/cm3) and uniform composition, and blocks within each group were drawn from the same manufacturing lot to minimize between-block material variability. Second, the standardized drilling protocol (identical drill sequence, rotational speed, irrigation, and operator) was applied uniformly across all sockets irrespective of block of origin, and specimens were balanced across four physical blocks per group (approximately 7–8 sockets per block), so that any residual between-block variability would be diluted across multiple blocks rather than confounded with a single block. Third, visual inspection of within-block and between-block variability in IT and RT values revealed no systematic block-level trend. Although socket-level torque values have now been recovered and are available to support the present analyses, block-level identifiers (i.e., the specific physical block of origin for each socket) were not retained during data acquisition; a formal mixed-effects model with block as a random effect could therefore not be retrospectively applied. This limitation is explicitly acknowledged in the Discussion. The inferential analyses reported here rely on the assumption of independence, supported by manufacturing homogeneity, balanced socket distribution across multiple blocks, and the absence of visible between-block effects; formal hierarchical modeling of block-level clustering is recommended for future investigations recording block-of-origin identifiers at the individual socket level a priori.
3. Results
A total of 60 implant sockets were evaluated, with 30 sockets in each of the PE and PU groups. The minimum, maximum, and mean IT and RT values for both groups are presented in
Table 1.
No statistically significant difference was observed in IT between the PE and PU groups (58.50 ± 8.42 vs. 58.17 ± 9.60 N·cm; t = 0.143;
p = 0.887; Cohen’s d = 0.04; 95% CI of mean difference: −4.33 to 5.00 N·cm), indicating a negligible effect size. In contrast, RT was significantly higher in the PU group than in the PE group (71.17 ± 7.15 vs. 64.33 ± 9.17 N·cm; t = −3.219;
p = 0.002; Cohen’s d = 0.83; 95% CI of mean difference: −11.08 to −2.58 N·cm), corresponding to a large effect size (
Table 2). Because the Shapiro–Wilk test indicated departure from normality for RT in both groups (
p < 0.05), a Mann–Whitney U test was additionally performed as a sensitivity analysis and confirmed the RT result (U = 242.5;
p = 0.004); a corresponding sensitivity test for IT was non-significant (
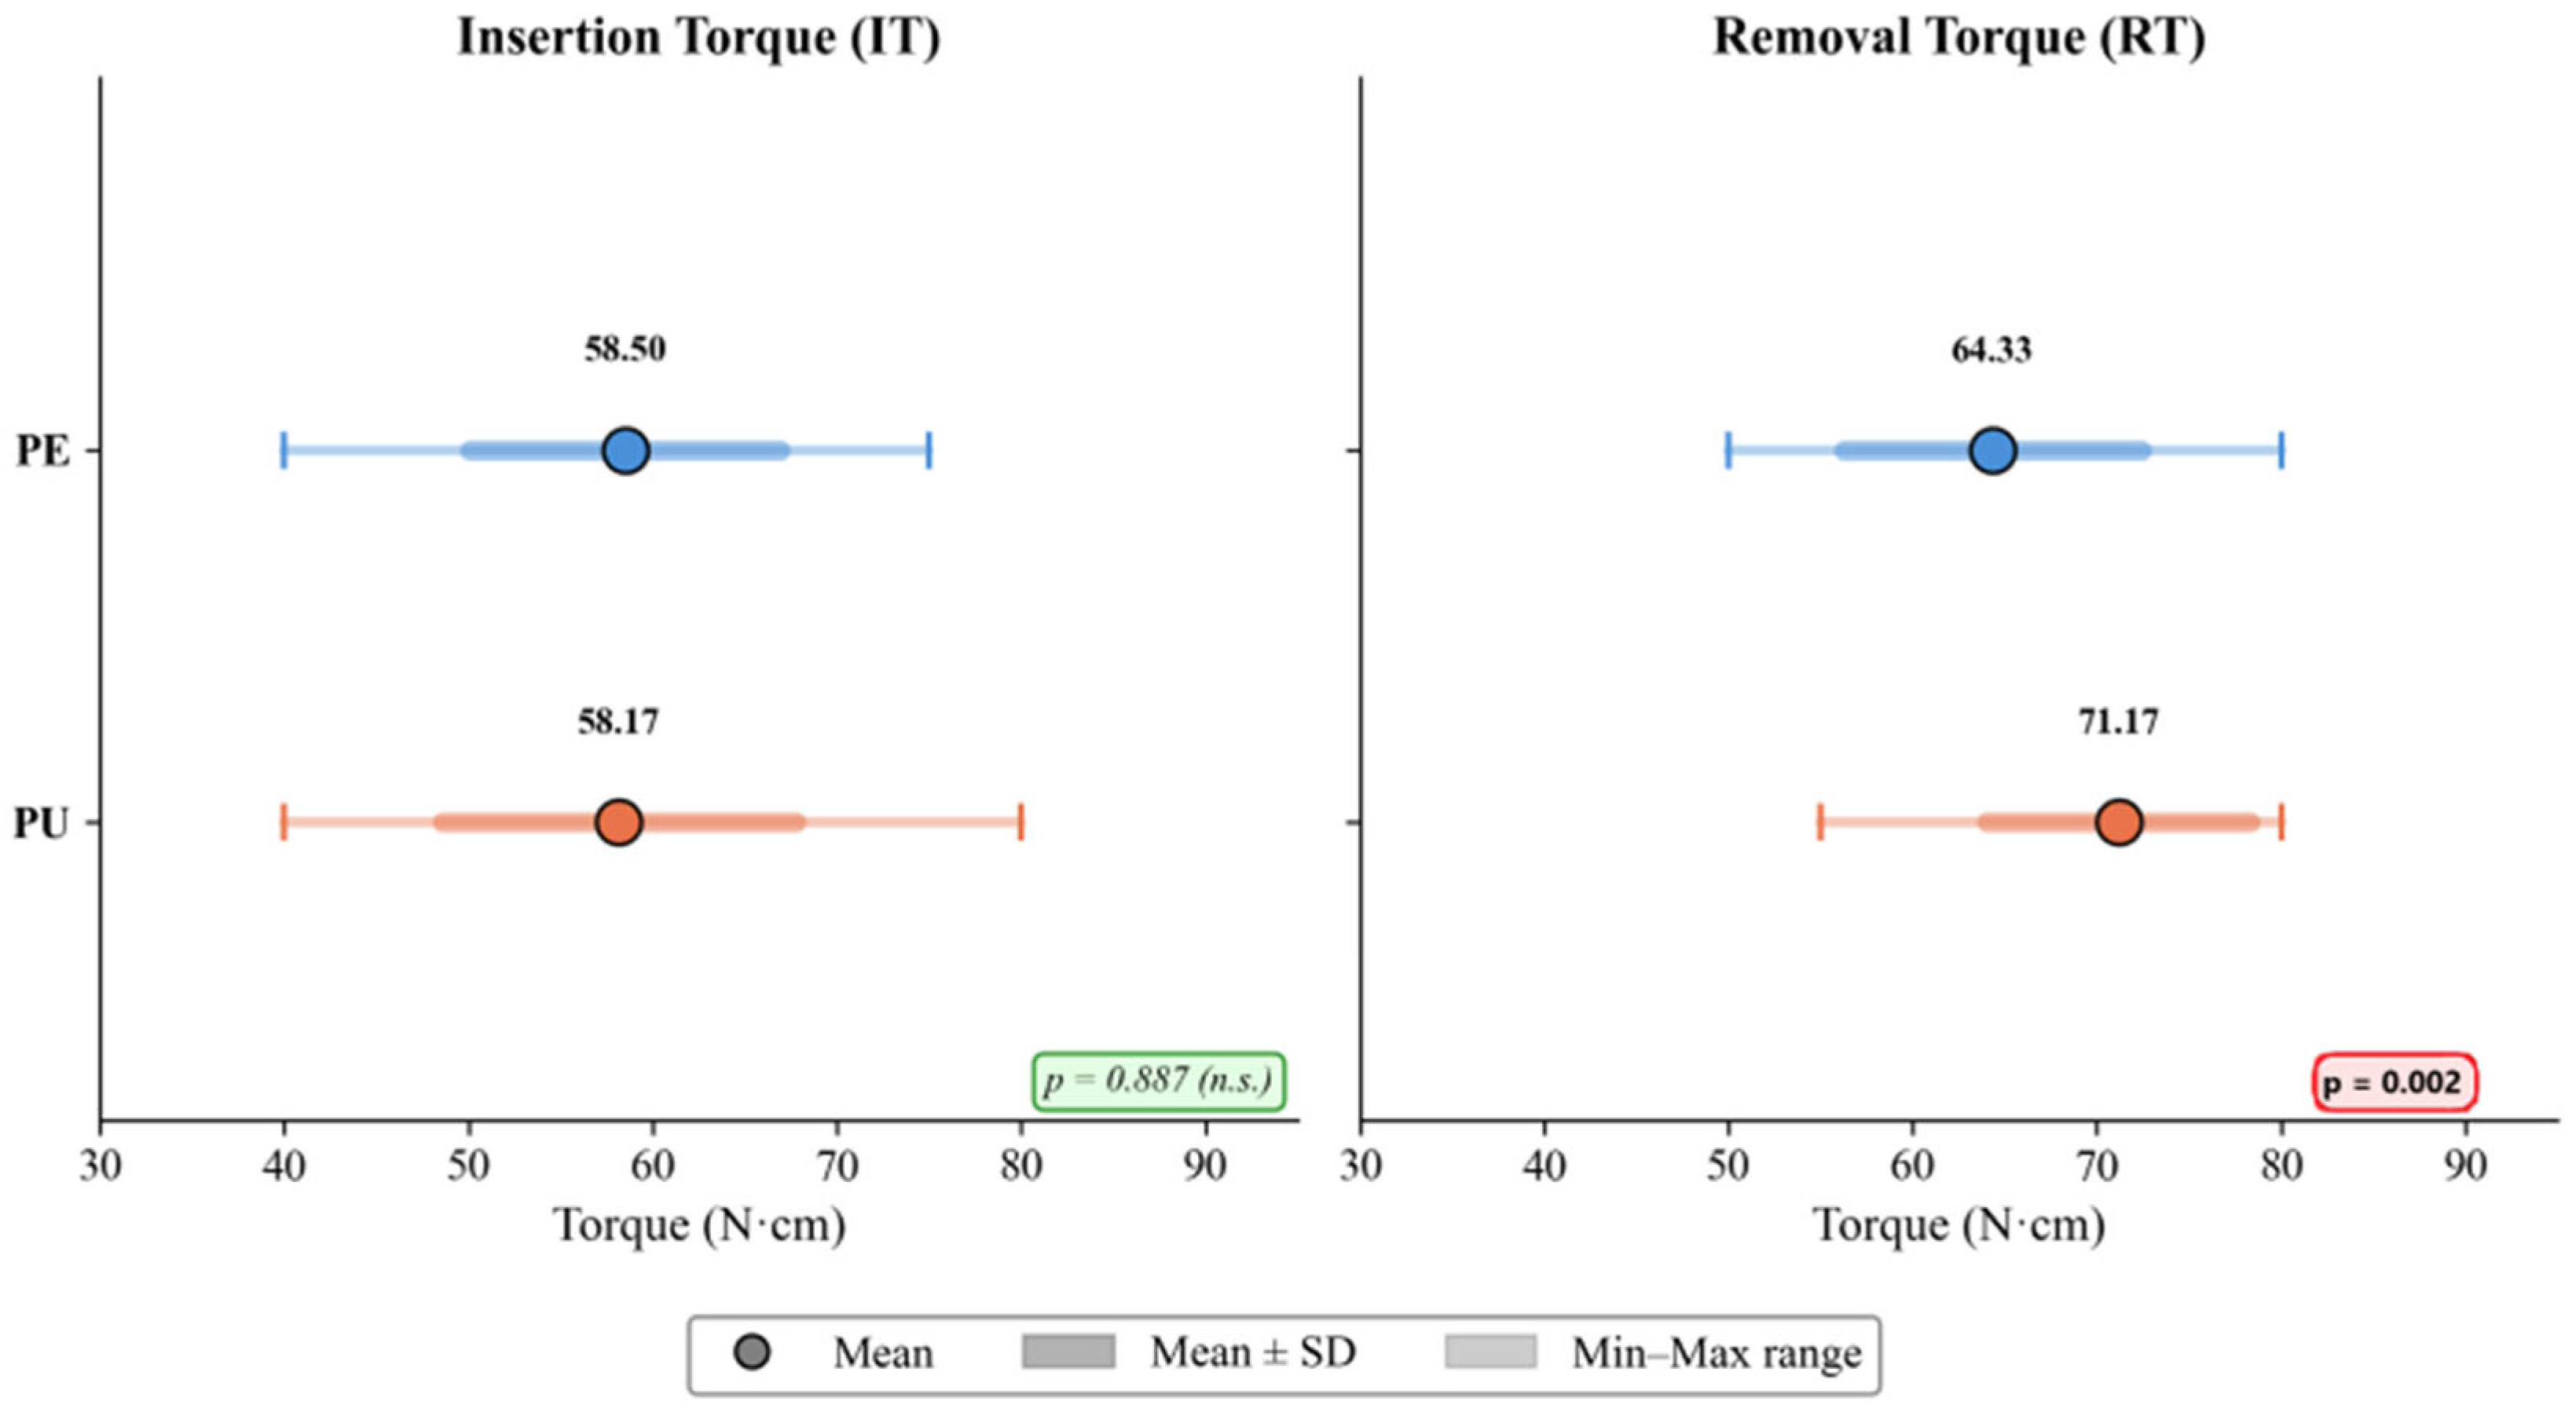
p = 0.893), in agreement with the parametric analysis. A boxplot representation of the distributions is shown in
Figure 4.
The distribution of torque values, including the range (minimum–maximum) and mean ± SD, is depicted in
Figure 4. While the IT distributions overlapped substantially between groups, the RT distribution in the PU group was shifted toward higher values compared to the PE group.
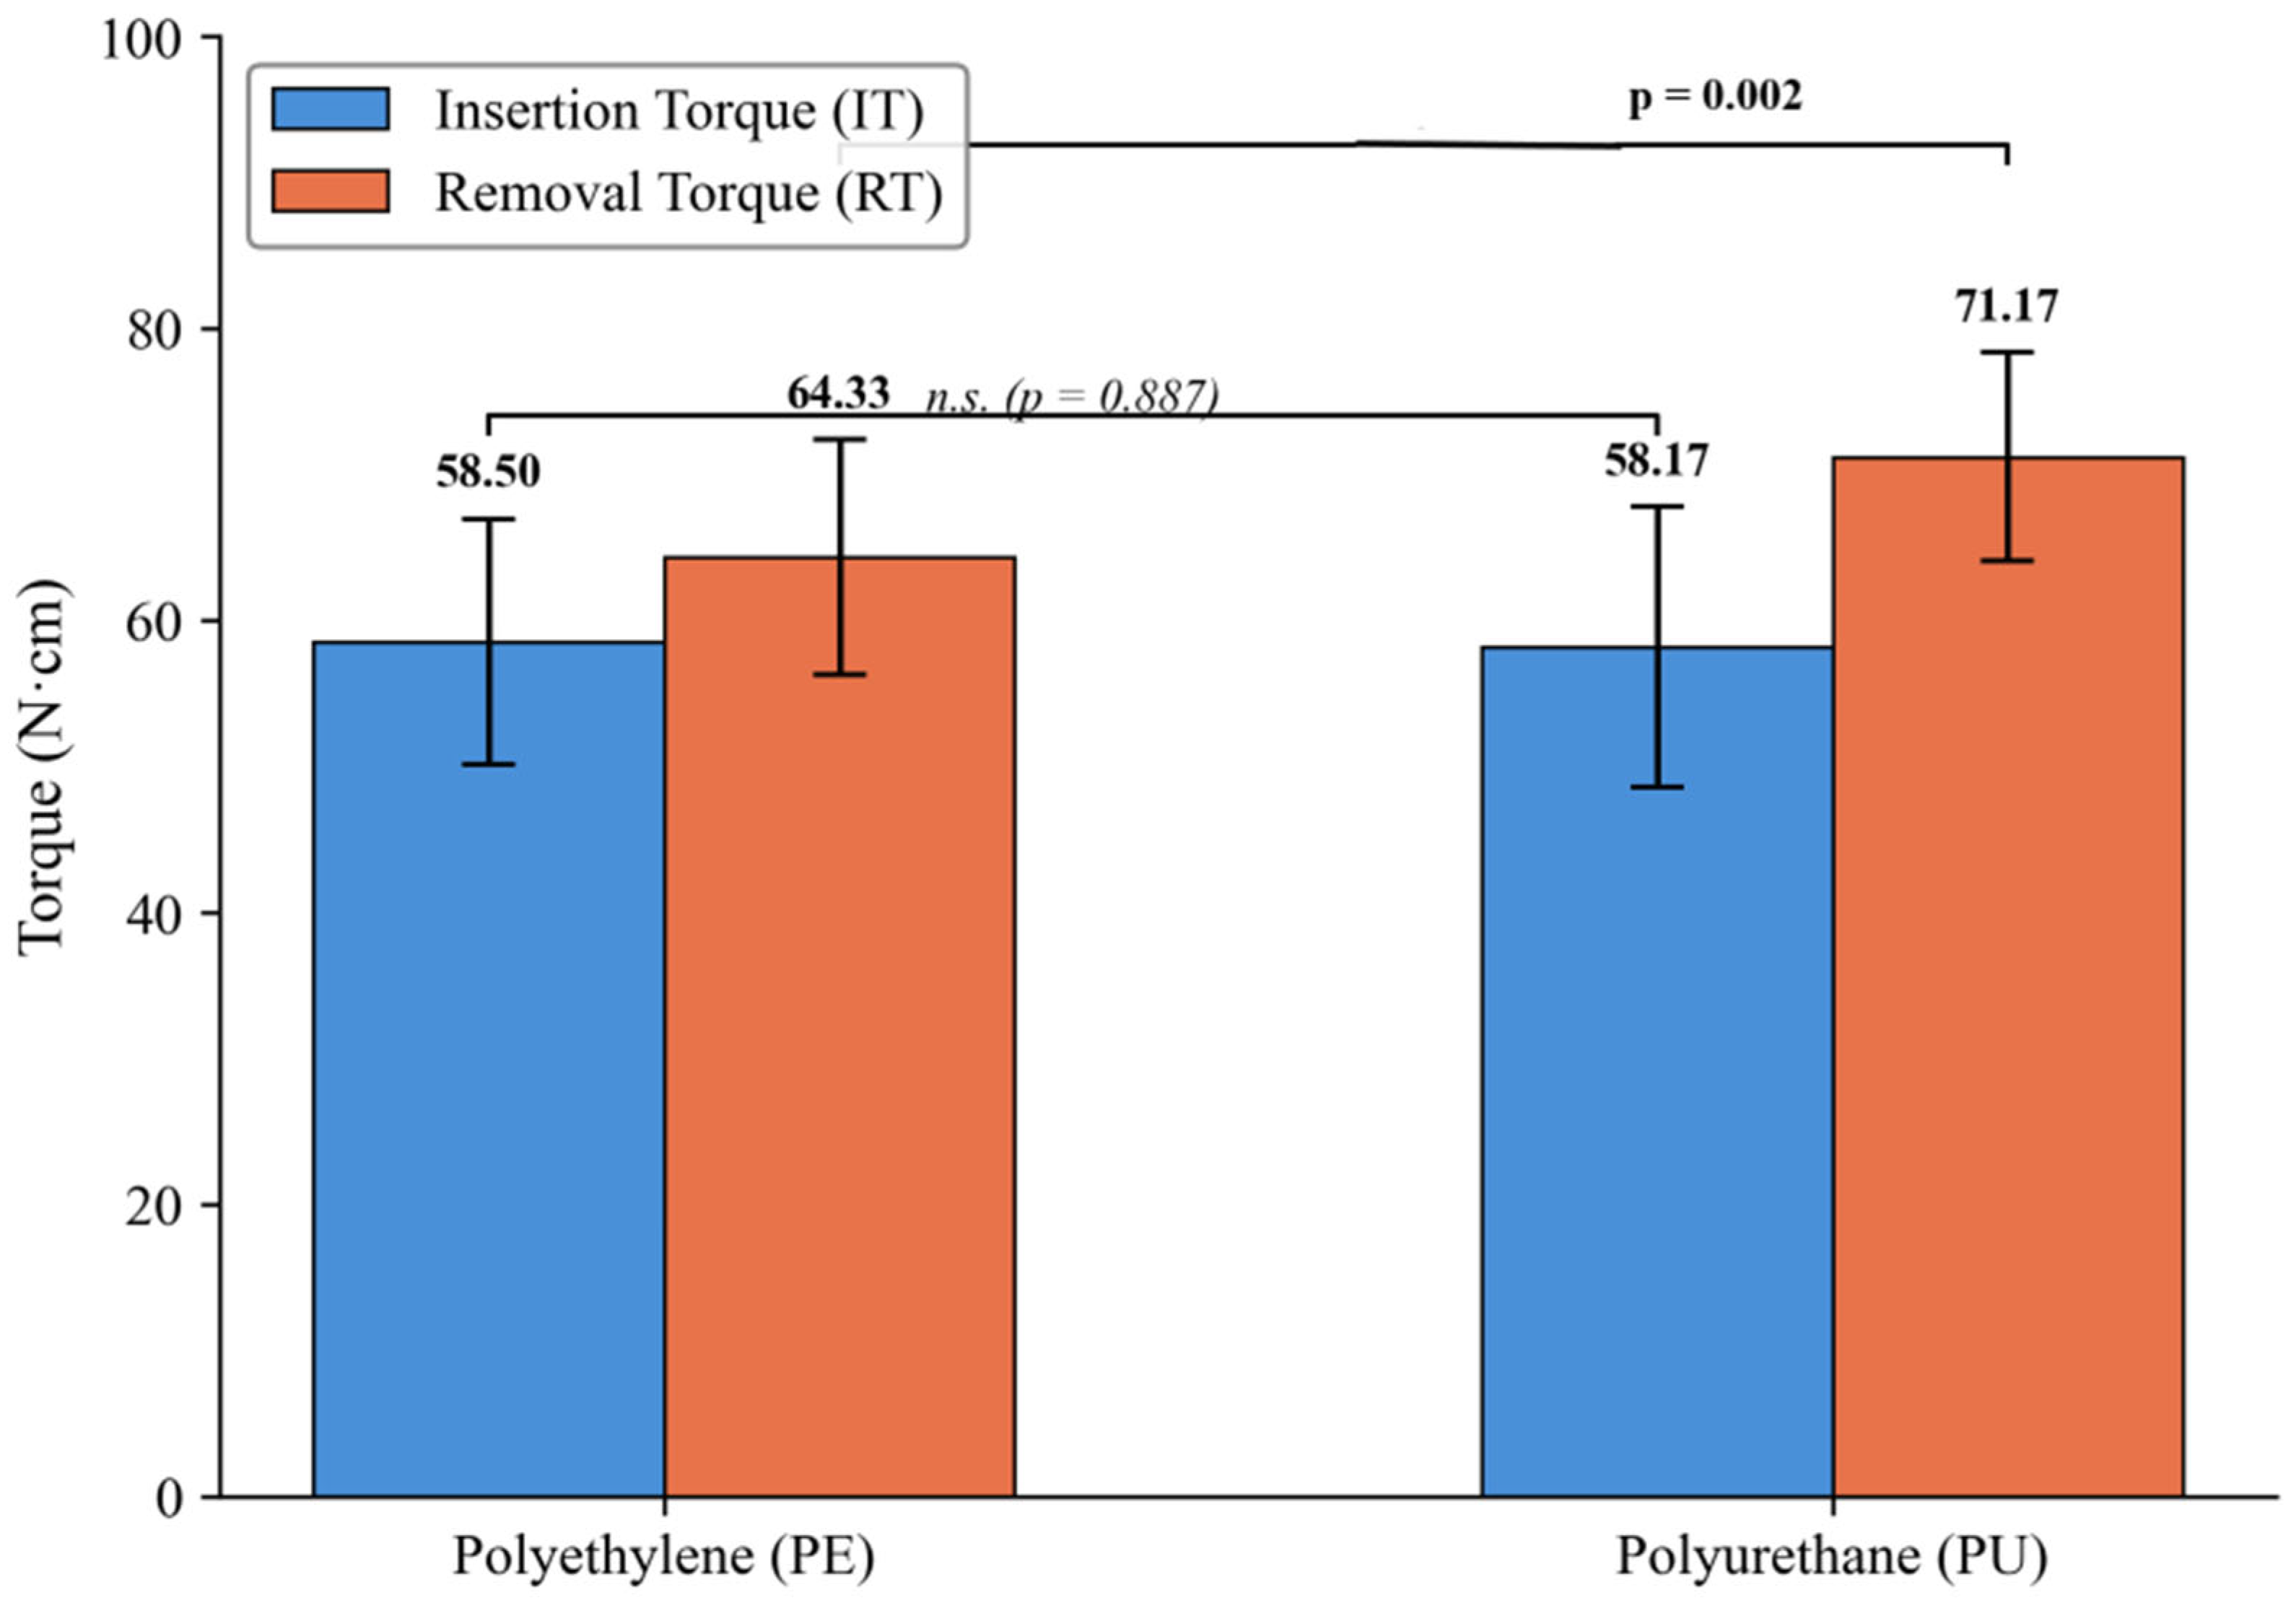
The mean IT and RT values with standard deviations for both groups are illustrated in
Figure 5. The IT values demonstrated substantial overlap between PE and PU groups, while the RT values exhibited a notable difference between groups, with higher values in the PU group.
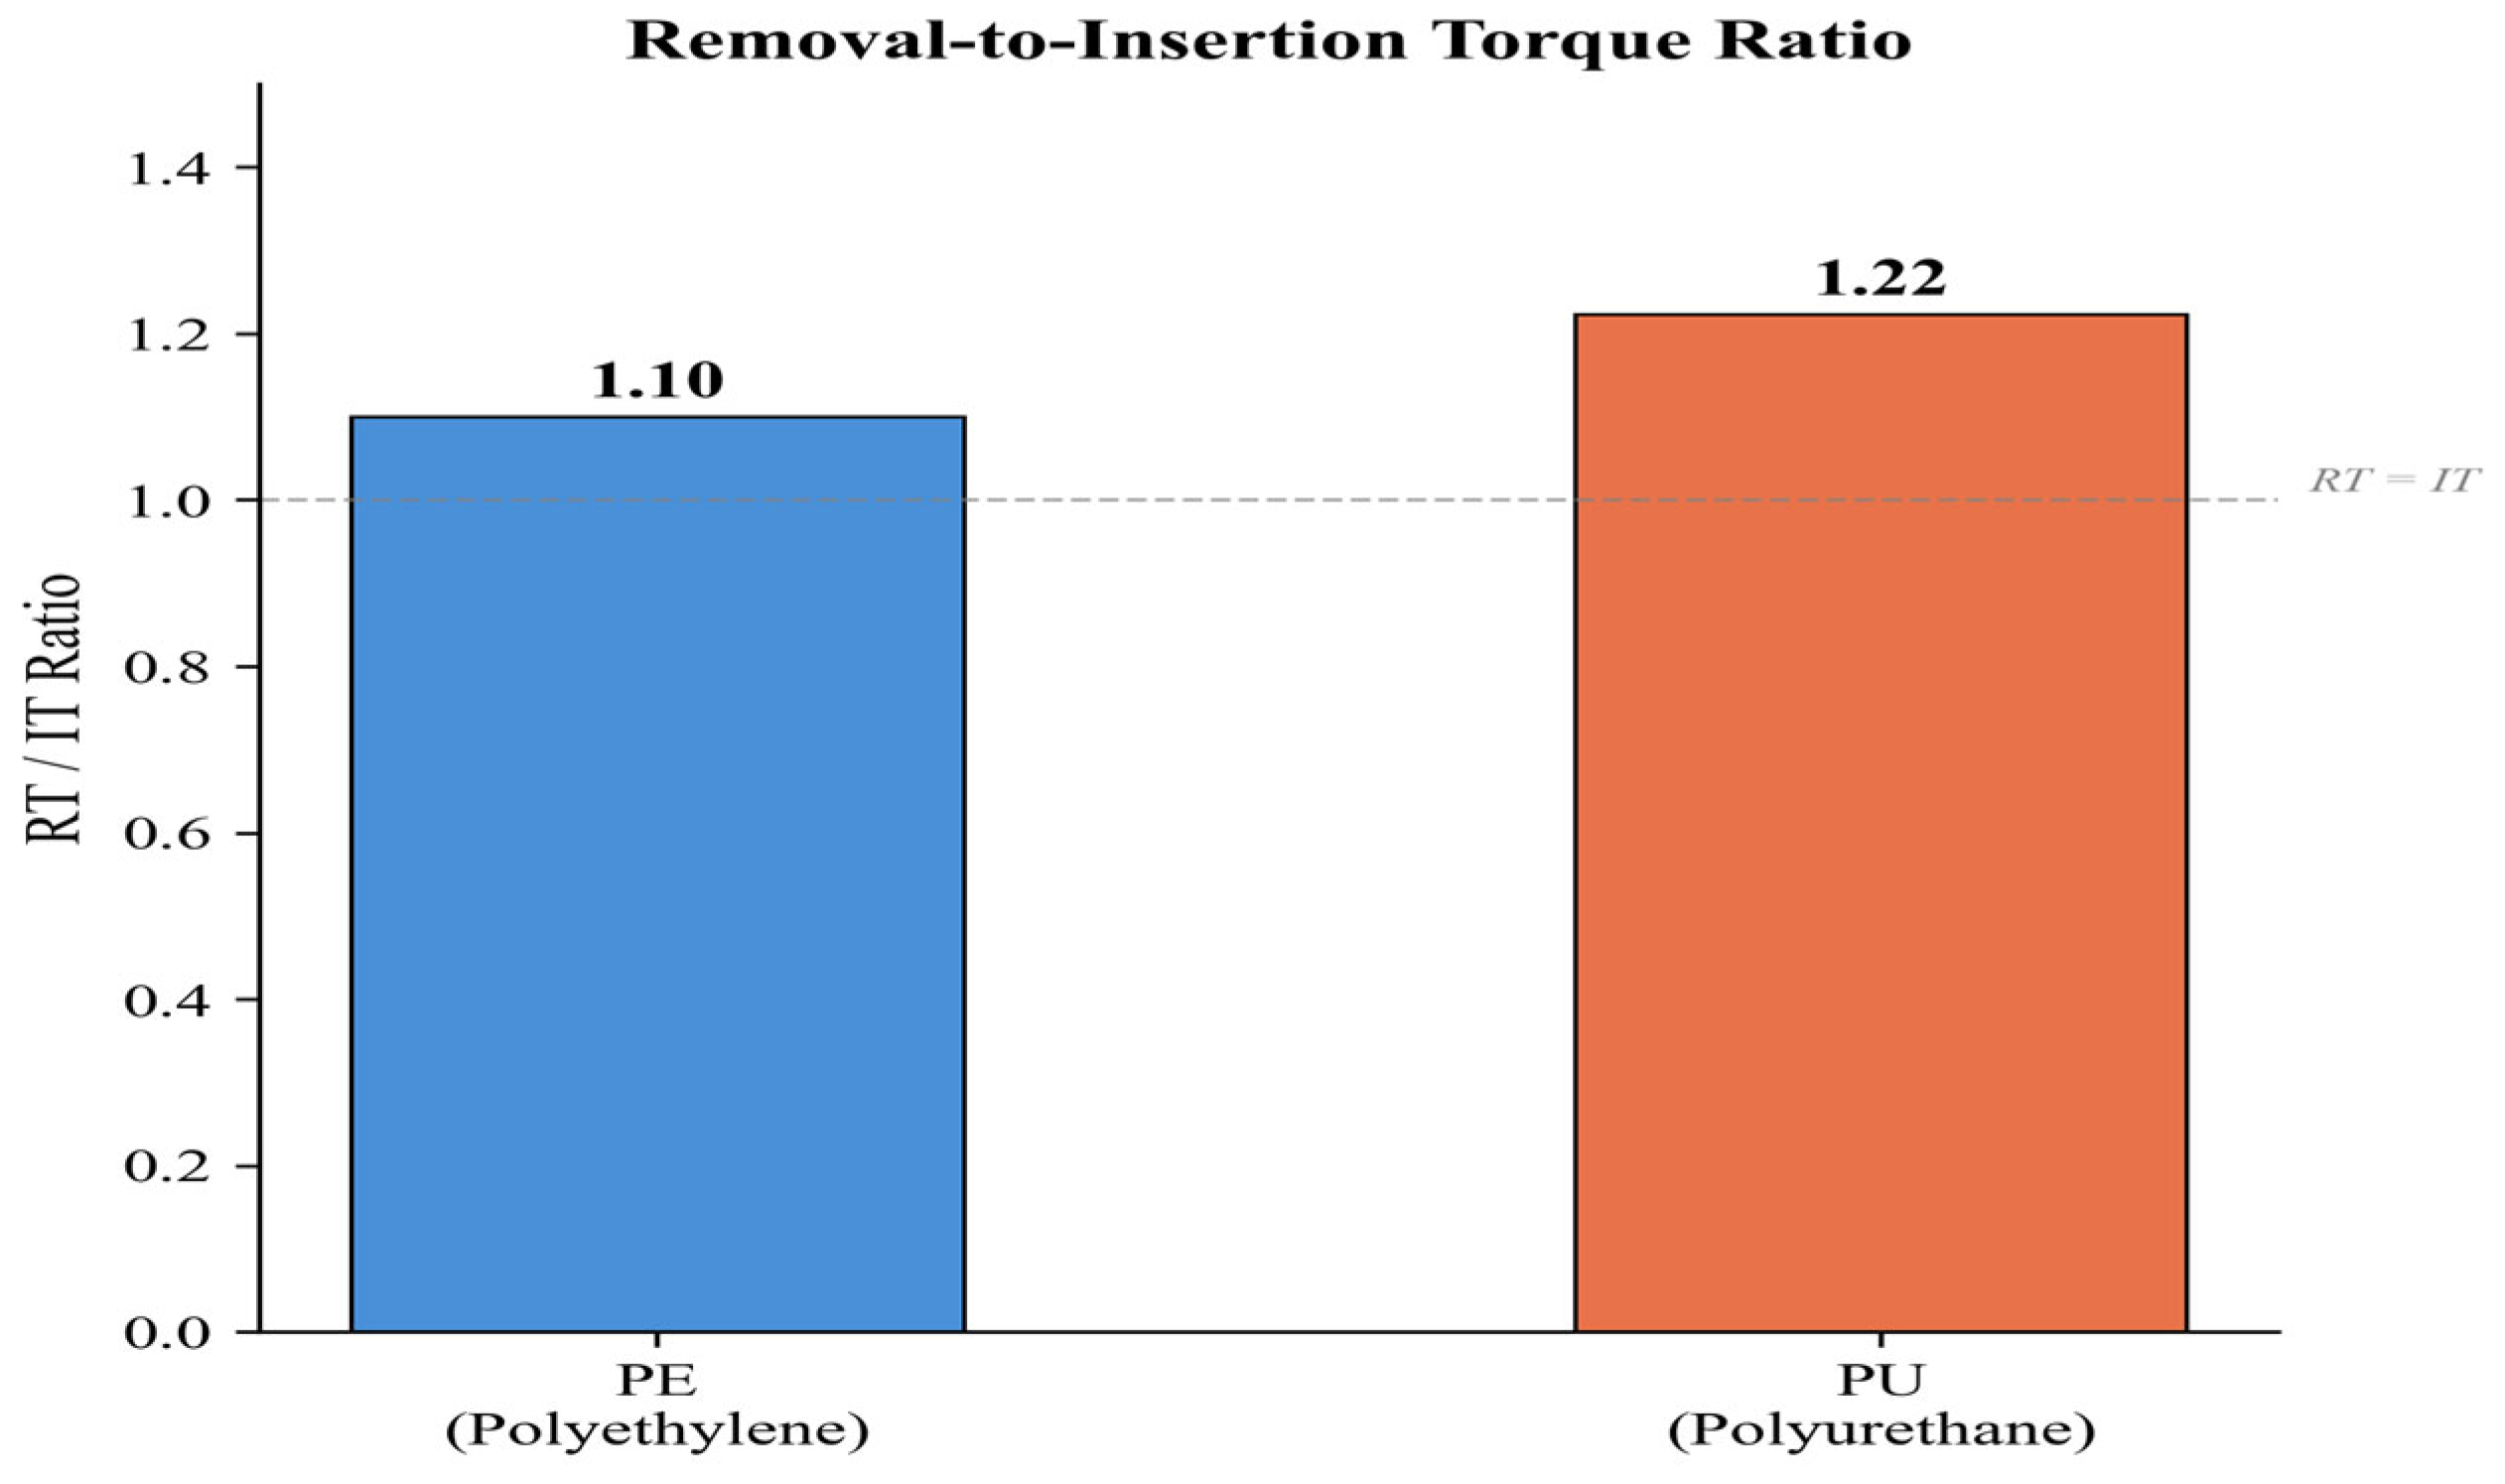
As a descriptive exploratory observation, the removal-to-insertion torque ratio (RT/IT) computed from group-level means was 1.10 for the PE group (64.33/58.50) and 1.22 for the PU group (71.17/58.17) (
Figure 6). This group-mean ratio is presented only as a descriptive index and must not be interpreted as an inferential comparison between groups: no statistical test, effect size, or confidence interval can be validly attached to a ratio derived from group means rather than from individual paired observations. Following the recovery of socket-level measurements, a complementary per-socket RT/IT analysis was additionally performed in which the RT/IT ratio was computed within each individual specimen and compared between groups. The per-socket RT/IT ratio was 1.10 ± 0.09 in the PE group and 1.25 ± 0.20 in the PU group; a Student’s
t-test on the per-socket ratios indicated a statistically significant between-group difference (t = −3.628;
p < 0.001; Cohen’s d = 0.94), suggesting that, in addition to higher absolute RT values, PU specimens also exhibited proportionally greater removal resistance relative to their insertion torque. This per-socket analysis is presented as a hypothesis-generating, exploratory observation that should be interpreted in conjunction with the primary RT analysis rather than as a standalone confirmatory endpoint.
It should be noted that the torque measurement device used in this study had a maximum recording capacity of 80 N·cm, and any torque values exceeding this threshold would have been right-censored at 80 N·cm. Inspection of the socket-level data indicated that the ceiling was reached in 0/30 PE-IT specimens, 2/30 PE-RT specimens, 1/30 PU-IT specimens, and 8/30 PU-RT specimens. The PU group was therefore affected by right-censoring at the 80 N·cm ceiling substantially more often for RT than the PE group (27% vs. 7% of specimens). Because right-censored values underestimate the true torque of specimens whose actual values exceed the ceiling, and because this effect disproportionately affected the PU group for RT, the observed PE–PU RT difference is likely to represent a conservative—rather than inflated—estimate of the true between-group difference under the tested high-density (60 pcf) conditions. This potential ceiling effect is discussed further in the Discussion.
4. Discussion
The present study is, to our knowledge, among the first to evaluate high-density polyethylene (PE) blocks as an alternative bone analog material for in vitro dental implant stability testing. Two principal findings emerged regarding the tested hypotheses: PE and PU blocks at 60 pcf density yielded no statistically significant difference in insertion torque values (
p = 0.887; Cohen’s d = 0.04), with a negligible effect size and confidence interval spanning zero, leading to a failure to reject the first null hypothesis. However, PU blocks produced significantly higher removal torque values than PE blocks (
p < 0.001; Cohen’s d = 0.90), with a large effect size; therefore, the second null hypothesis regarding removal torque equivalence was rejected. It should be noted that the absence of a statistically significant difference in IT does not constitute formal evidence of equivalence, as a formal equivalence or non-inferiority analysis with a pre-specified margin was not performed. Nevertheless, the negligible effect size (Cohen’s d = 0.04) and narrow confidence interval (−4.34 to 5.00 N·cm) provide practical support for a small observed between-group difference in IT under the tested conditions. These results address a notable gap in the biomechanical testing literature, where PU has been the sole synthetic material accepted by ASTM for implant research [
10,
11], despite the availability of other medical-grade polymers with potentially suitable mechanical properties. High-density PE has been widely utilized in biomedical applications, including joint prostheses and cardiovascular devices [
18,
19], yet its potential as a standardized bone model material for dental implant testing has been only limitedly explored.
The finding that PE and PU blocks showed no statistically significant difference in IT values (58.50 ± 8.42 vs. 58.17 ± 9.60 N·cm;
p = 0.887) at identical density suggests that the compressive resistance encountered during implant insertion is primarily governed by material density rather than polymer composition at the tested density level. This observation aligns with previous studies demonstrating that insertion torque is directly proportional to bone analog density across different polyurethane formulations [
5,
10]. Gehrke et al. [
10] reported that IT values in PU blocks were consistent across different drill designs when density was controlled, reinforcing the principle that material density is a dominant determinant of insertion resistance, a concept further supported by recent geometric stress distribution analyses in rigid PU foams [
22]. Similarly, Falco et al. [
5] demonstrated that IT was more strongly influenced by implant geometry and substrate density than by surface characteristics. The absence of a statistically significant IT difference between PE and PU at 60 pcf density, supported by a negligible effect size, suggests that PE may warrant consideration as a candidate material for insertion torque-focused studies under standardized high-density conditions, provided that material density is controlled and these findings are confirmed across additional density levels.
In contrast to IT, removal torque values were significantly higher in the PU group (71.17 ± 7.15 N·cm) compared to the PE group (64.33 ± 9.17 N·cm;
p = 0.002; Cohen’s d = 0.83), with the between-group difference remaining significant in a Mann–Whitney U sensitivity analysis (
p = 0.004). This difference may be partly attributable to fundamental differences in the viscoelastic behavior, elastic recovery, and surface interaction properties of these two polymers. PU is a thermoset polymer formed through an exothermic reaction [
12], resulting in a dense, crosslinked cellular network that yields substantial elastic recovery—a “spring-back” effect—and excellent surface conformity around the implant threads following the initial compressive stress of insertion [
16]. In contrast, high-density PE is a thermoplastic with a semi-crystalline structure characterized by van der Waals interactions between linear chain segments [
17,
20]. This structural property typically results in less elastic deformation memory and reduced frictional engagement at the implant–material interface during rotational removal. The higher RT observed in PU may therefore reflect its capacity for compressive viscoelastic deformation and mechanical interlocking with implant surface micro-irregularities, particularly the RBM-treated surface used in this study [
1,
23,
24]. The interpretation of this RT difference must additionally be considered in the context of the torque measurement device ceiling (80 N·cm). As detailed in the Results, ceiling values of 80 N·cm were observed in 8/30 PU-RT specimens compared with only 2/30 PE-RT specimens, and in 1/30 PU-IT and 0/30 PE-IT specimens. Because right-censored values underestimate the true magnitude of torque in specimens whose actual values exceed the ceiling, and because ceiling effects disproportionately affected the PU group, the observed PE–PU RT difference and its associated effect size (Cohen’s d = 0.83) should be regarded as a plausibly conservative—rather than inflated—estimate of the true between-group RT effect under the tested high-density (60 pcf) conditions. Torque devices with a higher maximum capacity (e.g., ≥ 120 N·cm) are recommended for future studies at 60 pcf to enable unambiguous characterization of the full RT distribution. However, as no direct material characterization (e.g., scanning electron microscopy [SEM] or micro-computed tomography [micro-CT]) was performed in this study, these mechanistic explanations remain speculative and should be confirmed by future investigations incorporating surface and interfacial analyses.
Contextualizing these findings within the broader landscape of synthetic bone analogs further highlights the material-specific dependencies of implant testing. While materials such as short glass fiber-reinforced epoxy resin (e.g., standard Sawbones models) frequently exhibit higher stiffness intended to simulate dense cortical bone, PU foams are broadly recognized for projecting stress–strain distributions that more closely approximate the nuanced compressive yielding of human trabecular bone [
25]. This material-specific dependency has important implications for study design: researchers investigating removal torque as a measure of implant retention should recognize that the choice of bone analog material can significantly influence RT outcomes, and direct extrapolations between studies using fundamentally different analog materials (e.g., rigid epoxy vs. elastomeric PU vs. thermoplastic PE) should be interpreted with caution [
23,
26].
It should be noted that both insertion torque and removal torque are influenced not only by substrate material properties but also by implant macrogeometry. Aleo et al. [
27] demonstrated that conical implants exhibited significantly higher primary stability than cylindrical implants across multiple bone density classes in polyurethane models, indicating that implant taper geometry is an independent determinant of both IT and RT values. Since only tapered implants were used in the present study, the generalizability of the observed PE–PU comparison to cylindrical implant designs remains to be established.
The methodological rigor of this study strengthens the reliability of the reported findings. The operator-blinded design, in which the calibrated operator (İ.D.) performing implant insertion and removal was unaware of the block material throughout the procedure—ensured through identical opaque wrapping of all blocks—minimized performance bias. Although PE and PU may exhibit subtle tactile or mechanical differences during drilling, the operator was not involved in the drilling phase; socket preparation was performed entirely by an independent surgeon, and the operator’s contact with the material was limited to the motorized insertion and removal steps performed at a fixed rotational speed (25 rpm), further reducing the likelihood of unblinding through tactile feedback. The term “operator-blinded” is used here in preference to “single-blind” to more precisely describe the blinding procedure in this in vitro context. Socket preparation by an independent surgeon further ensured protocol standardization across groups. The sample size (n = 30 per group) exceeded the minimum requirement determined by a priori power analysis (n = 26, power = 99%, α = 0.01) based on the methodology described by Orhan and Ciğerim [
11]. Notably, the PU group’s mean IT (58.17 N·cm) and RT (71.17 N·cm) values in the present study are broadly consistent with values reported in previous PU-based implant stability studies [
11,
26], supporting the internal validity of our experimental protocol. This consistency across independent investigations reinforces the reproducibility of PU-based testing while simultaneously providing a validated benchmark against which PE performance can be evaluated.
Several limitations of this study should be acknowledged. First, only a single implant brand, diameter (4.2 mm), and length (12 mm) with RBM surface treatment were tested; results may differ with other implant geometries, macrodesigns (e.g., cylindrical vs. tapered), or surface modifications such as SLA or anodized surfaces. Second, only 60 pcf density blocks were evaluated, corresponding to D1-type dense bone. Since clinical scenarios frequently involve D2–D4 bone qualities (10–40 pcf), the comparative performance of PE and PU at lower densities remains to be established, and the absence of a statistically significant IT difference is specific to the high-density (60 pcf) conditions tested in this study and may not necessarily extend to lower-density bone analogs. Third, resonance frequency analysis (RFA) and implant stability quotient (ISQ) measurements, which provide complementary and non-destructive stability data, were not performed [
10], despite their growing importance in advanced predictive stability models [
28,
29]. Fourth, material surface characterization through scanning electron microscopy (SEM) or micro-computed tomography (micro-CT) was not conducted, which could have provided mechanistic explanations for the observed RT differences at the microstructural level; accordingly, the mechanistic interpretations offered in this discussion should be considered speculative. Fifth, the torque measurement device had a maximum capacity of 80 N·cm, and the ceiling was reached in 8/30 PU-RT, 2/30 PE-RT, 1/30 PU-IT, and 0/30 PE-IT specimens. Because right-censoring disproportionately affected the PU group, the observed PE–PU RT difference likely represents a conservative estimate of the true between-group effect under the tested conditions. Sixth, although the 30 implant sockets in each group were distributed across four physical blocks (approximately 7–8 sockets per block), with all blocks drawn from the same manufacturing lot and certified to identical density, and although visual inspection revealed no systematic block-level trend in IT or RT, a formal mixed-effects model with block as a random effect could not be applied. Although socket-level torque values were recovered for the present analyses, block-of-origin identifiers were not retained at the individual socket level during data acquisition, which precluded retrospective modeling of the hierarchical data structure. The inferences reported here therefore rely on the assumption of independence—justified by block manufacturing homogeneity, balanced specimen distribution across multiple blocks, and the absence of visible between-block effects—while transparent mixed-effects modeling of block-level clustering is strongly recommended for future in vitro studies employing this design and explicitly recording block-of-origin at the specimen level a priori. Seventh, no formal equivalence or non-inferiority analysis with a pre-specified margin was conducted; consequently, the non-significant IT result should not be interpreted as evidence of equivalence between PE and PU. Despite these limitations, this study provides initial quantitative evidence comparing PE and PU as bone analog materials for dental implant testing under standardized high-density (60 pcf) conditions, establishing a foundation for more comprehensive and hierarchically modeled investigations.
Future studies should evaluate PE blocks across a range of densities (10, 20, 30, and 40 pcf) to determine whether the absence of a statistically significant IT difference observed at 60 pcf is maintained at lower densities simulating D2–D4 bone types. Comparative surface characterization using SEM and micro-CT would elucidate the microstructural differences between PE and PU that contribute to the observed RT discrepancy. Testing multiple implant brands, diameters, lengths, and surface treatments would enhance the generalizability of these findings, given that macrogeometry and insertion depth significantly influence primary stability in artificial bone models [
27,
30,
31]. Additionally, the incorporation of RFA measurements alongside torque values would provide a more comprehensive stability assessment framework. From a practical standpoint, if PE blocks demonstrate consistent performance across a range of densities, their potential advantages in terms of cost-effectiveness, commercial availability, and manufacturing standardization could position them as a potential complementary bone analog material for in vitro dental implant research.