1. Introduction
Residual stresses, internal tensile and compressive forces persisting within a material after removal of an external load, are commonly encountered in engineering materials such as steel and aluminum. These stresses can coexist within the same component and often result from plastic deformation that occurs during operations such as rolling, machining, or various forms of surface treatment. In addition, residual stress may arise due to phase transformations and the presence of non-uniform thermal gradients during manufacturing processes such as heating and cooling.
Non-destructive testing (NDT) methods are widely used to detect material irregularities and to characterize mechanical and microstructural properties. Among them, ultrasonic testing (UT) has proven to be an effective tool for material diagnostics. Over the past decades, ultrasonic techniques have been extensively used to assess stress conditions, detect cracks, and monitor changes in material properties [
1,
2]. Acoustic waves and elastic vibrations are particularly useful in analyzing slow crack propagation and the early stages of material degradation [
3].
Therefore, NDT for detecting and predicting the condition of wheel structures has become an important area of research. Structural damage to machines and machine parts can be prevented through early detection of fatigue cracks with the use of NDT methods. Today, the ultrasonic method by means of the ultrasonic velocity determination is often used for characterization of rail wheels that are exposed to great dynamic loads in the transportation of goods and passengers [
4]. Stress states in rail wheels are strongly influenced by the heating and cooling process during and after braking using brake shoes. Therefore, the residual stress in rail wheels is periodically evaluated by measuring the times-of-flight of ultrasonic waves [
5]. Therefore, the research of many authors is focused on new monitoring methods for detecting and predicting the structural condition of the rail system completely [
6]. Guo, together with colleagues, presented verification of the ultrasonic detecting method in detecting the stress of the wheel rim [
7]. In their research, the ultrasonic wheel rim stress detecting method is verified to be reliable and stable in light of the contrast between theoretical and experimental results. In the work of Peng and colleagues, a novel wavelet threshold function was created to remove noise and suppress press-fit interface echoes in axle ultrasonic defect detection [
8]. Young-In Hwang, with their colleague, investigates how the residual stress distribution changes the longitudinal critically refracted (LCR) waves [
9]. In their paper, it was presented how accurate stress measurement of rails is because differences in stress applied to the rail can be detected by measuring LCR waves. Residual stresses of the rail wheels during the quenching process by using the directly coupled thermal structural analysis in ANSYS software were investigated by Milošević and colleagues. The results of their investigation reveal that the stress field is highly sensitive to variable thermal loads. Therefore, the variability of thermal loads significantly influences the stress field of the rail wheels during the heat treatment process. Thus, the mentioned factor is considered to account for the residual stress determination during the quenching process by using the directly coupled thermal-structural analysis [
10].
Today, most science and engineering research, especially in industry, is empirical. But the use of statistical methods for planning the efficiency of the experimentation process could increase, and more reliable conclusions could be established.
In recent years, refinements in ultrasonic methodologies and growing safety requirements in rail transport have driven continued research into advanced non-destructive evaluation (NDE) strategies for wheel stress assessment. The importance of precise, in situ stress measurement has been strengthened by the rising demands for increased train speeds and durability, alongside the recognized life-cycle costs associated with wheel failures. The acoustoelastic effect remains pivotal in this context, enabling direct correlation between stress states and ultrasonic wave propagation characteristics, a principle underpinning numerous contemporary industrial applications [
11,
12].
Diverse ultrasonic techniques—including acoustic birefringence, critically refracted longitudinal (LCR) waves, and electromagnetic acoustic transducers (EMATs)—are increasingly adopted. Strážovec et al. offered detailed insight into ultrasonic methods for effective detection and mapping of residual stresses in railway wheels, demonstrating practical field reliability for such approaches [
11].
Efforts to evaluate the effects of microstructural variables, such as grain anisotropy or porosity, on ultrasonic velocity continue to refine the interpretative capacity of these measurements for different wheel materials [
13,
14].
Together, these developments reflect the critical, continually evolving role of ultrasonic technologies within modern rail infrastructure monitoring. The ongoing integration of statistical methods, technological innovation, and international best practices continues to enhance both safety and operational effectiveness in railway systems.
Recent developments also highlight the increasing role of intelligent and data-driven approaches in ultrasonic-based evaluation. In this context, ref. [
15] presented advanced methodologies that combine signal processing and intelligent analysis to enhance defect detection and stress characterization. Such approaches complement traditional acoustoelastic-based methods and contribute to improving the robustness and reliability of non-destructive stress assessment. While the present study is focused on experimentally validated acoustoelastic relationships and statistical design of experiments, these intelligent techniques represent a promising direction for future research.
This study investigates stress levels and elastic deformation in aluminum EN AW-2011 (AlCu6BiPb) and austenitic stainless steel 1.4301 (X5CrNi18-10) specimens under controlled compressive loading. Specimens were characterized using X-ray fluorescence (XRF) to confirm compositional homogeneity. Mechanical loading was applied using a hydraulic press up to ~100% of the tensile elastic limit, while ultrasonic velocity measurements were taken before and during loading. Stress levels were calculated analytically and compared to the ultrasonic response to assess sensitivity to elastic deformation and potential residual stress indicators.
The methodology of design and analysis of experiments is based on statistical principles. Since the experiments are based on sampling procedures, the results describe the product or process characteristics using uncertainty. There are numerous Design of Experiments (DOE) models that can be suitable for analyzing and interpreting factor effects on the product and process characteristics.
2. Stress Level Analysis
Application of an external load to a metallic material leads to the development of internal stresses. Under elastic response, the material resumes its original shape upon unloading; when the yield strength is exceeded, permanent (plastic) deformation remains, resulting in residual stresses due to the incompatibility of plastically and elastically deformed regions. Early and accurate assessment of these internal states remains crucial for structural health monitoring.
Ultrasonic testing provides a non-destructive and sensitive means of evaluating these stress states. The presence of internal elastic stress induces minor, reversible lattice distortions, which in turn affect the propagation speed of ultrasonic waves within the material. Consequently, ultrasonic velocity can serve as an indicator for stress distribution and the initial development of residual stress.
Experimental emphasis is placed on the development of stress strictly within the elastic regime. Compressive loading applied to EN AW-2011 aluminum and 1.4301 stainless steel specimens is correlated directly to ultrasonic wave velocity changes, clarifying sensitivity and detection limits under conditions relevant to operational railway components.
2.1. Specimen Preparation and Mechanical Loading
Specimens were made from two materials: aluminum EN AW-2011 and steel 1.4301. EN AW-2011 aluminum and 1.4301 austenitic stainless steel were intentionally chosen as model materials with well-defined and contrasting mechanical and elastic properties, enabling a controlled investigation of the acoustoelastic response. Although these materials are not direct equivalents of typical wheel rim steels, they provide a reliable experimental framework for isolating key influencing parameters. The obtained insights form a basis for future studies involving materials that are more directly representative of real wheel rim applications.
The materials were supplied in the form of cold-rolled solid profiles. In order to eliminate the influence of cold deformation on the material’s microstructure, a recrystallization annealing heat treatment was performed. The aluminum material was annealed at 465 ± 5 °C for a period of 1 h ± 5 min, quenched immediately by immersing vertically into water at room temperature, and aged in air at room temperature for 4 days ± 1 h. The steel material was annealed at 920 °C for 30 min, rapidly cooled (quenched) in water, tempered by heating to 650 °C for 3 h, and then cooled in air.
Specimens were machined with precise dimensions and measured using a digital micrometer. The cross-sectional area of the loaded surface was calculated as:
where
Ai is the cross-sectional area,
ci is the specimen width, and
li is the specimen height. Dimensions in the unloaded state are presented in
Table 1.
Elastic stress induces minor lattice distortions, which affect ultrasonic wave velocity, i.e., the propagation speed of ultrasonic pulses through the component volume. Therefore, before loading, specimens were analyzed using X-ray fluorescence (XRF) to verify microstructural homogeneity. Results confirmed that no prior forming processes had significantly altered the internal structure. The aluminum samples were identified as EN AW-2011, known for high machinability and strength, while the steel specimens corresponded to grade 1.4301.
Compression tests were performed using a single-acting hydraulic press. To ensure that only elastic deformation occurred, the applied stresses were kept below the material-specific yield strength (σ
E), as listed in
Table 2.
Two force levels were applied: 196.133 kN and 274.5862 kN. These levels were chosen to represent ~70% and ~100% of the material’s elastic limit under tension, acknowledging that elastic limits are generally higher in compression.
Stress was calculated using the basic relation:
The resulting stress levels and their percentage of the tensile elastic limit are summarized in
Table 3.
These values show that the first load remains within the elastic regime for both materials. The second load slightly exceeds the nominal yield strength for aluminum, suggesting the possible onset of plastic deformation.
2.2. Elastic Deformation Estimation
When metallic materials are subjected to external loading, stress is initially accommodated within the elastic regime, governed by Hooke’s law:
where
E is Young’s modulus, and ε is a strain. In the context of Hooke’s law, strain represents the ratio of change in the observed dimension to the initial dimension:
where,
c0 and
l0 are initial dimensions of the specimens, and
c1 and
l1 are dimensions of the loaded specimens.
Elastic moduli:
Aluminum (EN AW-2011): 70 GPa
Steel (1.4301): 210 GPa
Measured deformations under the two loading regimes are shown in
Table 4.
It is evident that aluminum undergoes approximately three times greater deformation than steel under equivalent load levels. This is consistent with the material’s lower modulus of elasticity.
2.3. Verification of the State of Elastic Deformation
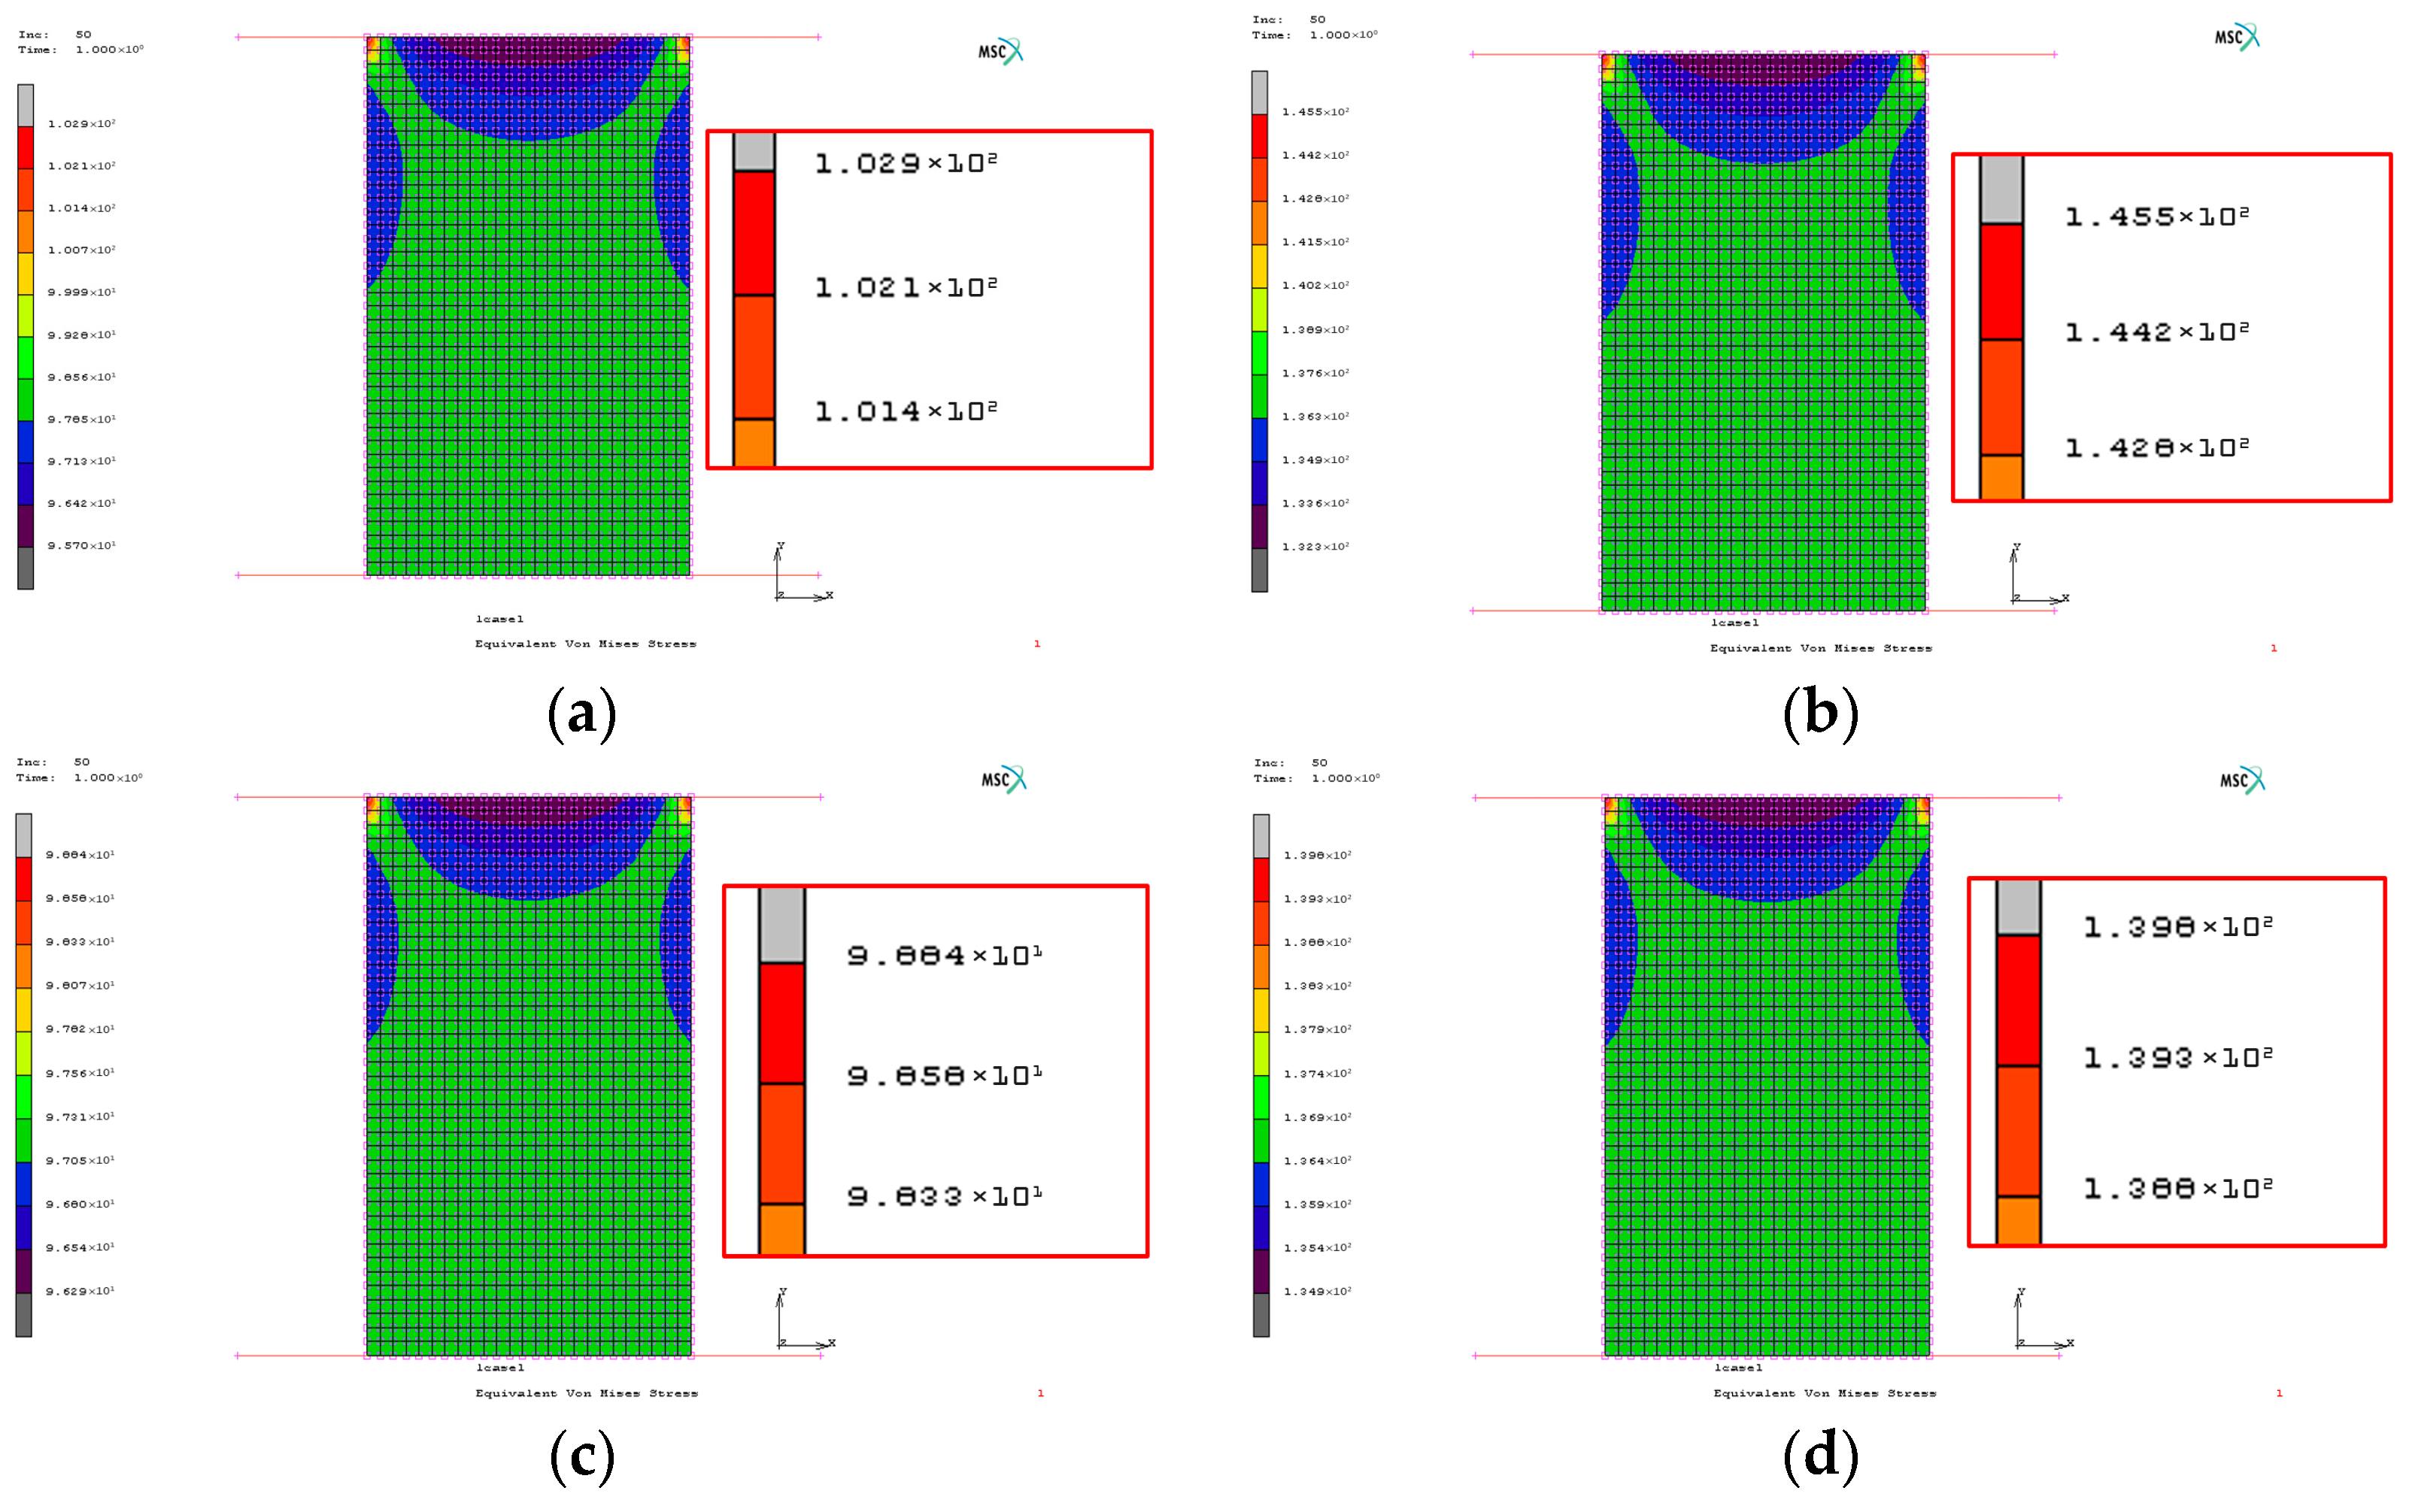
To verify the state of elastic deformation in the material and to avoid the possibility of entering the plastic region, a numerical simulation of the experimental upsetting procedure was performed for each stress state. The stress state in the material was simulated at the corresponding measured displacement Δ
c. The simulation was carried out using the MSC Marc-Mentat 2016, Academic License software. The simulation results are shown in
Figure 1.
As can be seen from the simulation results, in none of the specimens did the material exceed the analytically obtained stress limit shown in
Table 3. This confirms that the stress in the material does not exceed the elastic limit and that all measurements were carried out within the elastic region.
3. Ultrasonic Velocity
When metallic materials are subjected to external loading, the resulting stress is initially accommodated within the elastic regime, as described by Hooke’s law. Once the yield strength is exceeded, plastic deformation occurs, and upon unloading, residual stresses may remain. These residual stresses arise from the interaction between plastically and elastically deformed regions within the material’s microstructure. The propagation velocity of ultrasonic waves in solid materials is sensitive to both the elastic properties of the material and its internal stress state. In an unstressed, homogeneous medium, wave speed is primarily determined by the material’s density and elastic moduli. However, when stress is applied—particularly within the elastic regime—microstructural changes (such as lattice strain) result in measurable shifts in wave velocity.
Ultrasonic velocity is a material property that can vary significantly between different types of materials and can be determined by measuring the Time of Flight (TOF) of a short ultrasonic pulse as it travels through a material of known thickness. The measured velocity depends on the microstructure and mechanical properties of the material, such as hardness, density, elastic moduli, grain orientation, and other factors that describe the material’s condition during service, including residual stresses within the component. Furthermore, ultrasonic velocity also depends on the type of wave being propagated. Assuming the material is isotropic, the ultrasonic velocity can be calculated using the following expressions:
where
vL: compression wave velocity;
vT: shear wave velocity;
E: Young’s modulus;
G: shear modulus; v: Poisson’s ratio; and
ρ: density.
In anisotropic materials, ultrasonic velocity can differ significantly depending on the orientation of the grain structure. Anisotropy can result from forming processes, where deformation alters the microstructure by changing grain size and elongation in certain directions, based on the direction and magnitude of the applied force.
In this study, longitudinal wave velocities were measured in both aluminum and steel specimens using a precision ultrasonic transducer with a 5 MHz longitudinal probe. Measurements were recorded in the unloaded state and under two compressive loading regimes: 196.133 kN and 274.5862 kN. The aim was to determine whether compressive elastic stress produces a measurable and consistent change in ultrasonic velocity.
The results, shown in
Table 5, demonstrate that both EN AW-2011 aluminum and 1.4301 steel specimens exhibit an increase in wave velocity with increasing compressive load. Specifically, the absolute change in wave velocity between the unloaded state and the maximum applied load (274.6 kN) is approximately 40 m/s for both materials.
4. Experimental Design and Analysis of the Results
Today’s research in terms of determining the ultrasonic velocity leads us to the development of numerous methods that are based on the processing of ultrasonic signals. Over time, the ultrasonic velocity can be determined using an oscilloscope on a material with known thickness. To investigate the impact effect in the process of residual stress detection, ultrasonic longitudinal wave velocity measurements were conducted on two prepared specimens made of steel and aluminum. It is well established that measurement uncertainty associated with measurement results is influenced by numerous contributing factors [
16,
17]. Many scientists use the Ishikawa (fishbone) diagram to identify, explore, and visually display the root causes of a specific measurement system to categorize potential risk factors in measurement results [
18,
19].
To minimize the effects of individual variables, all relevant factors identified within this study were systematically controlled. Particular importance is attributed to specimen preparation, as a significant influence on the determination of ultrasonic velocity may be affected. It is recognized that material inhomogeneity and anisotropy can lead to distortion of ultrasonic wave propagation, whereby the measured ultrasonic velocity may be influenced [
20]. In order to reduce variations in ultrasonic velocity arising from material inhomogeneity and anisotropy, the specimens were prepared and heat-treated in accordance with applicable standards and relevant technical specifications. With the scope to ensure uniformly microstructure and isotropy of the testing sample, the recommended relevant standards were considered. In that sense, the ASTM E127 standard defines the fabricating reference blocks made of aluminum alloy, which is commonly used for ultrasonic system settings [
21]. Furthermore. The relevant standard for specifying the calibration block made of steel is EN ISO 2400, which specifies requirements for the dimensions, material, and manufacture of a steel block for calibrating an ultrasonic testing system [
22].
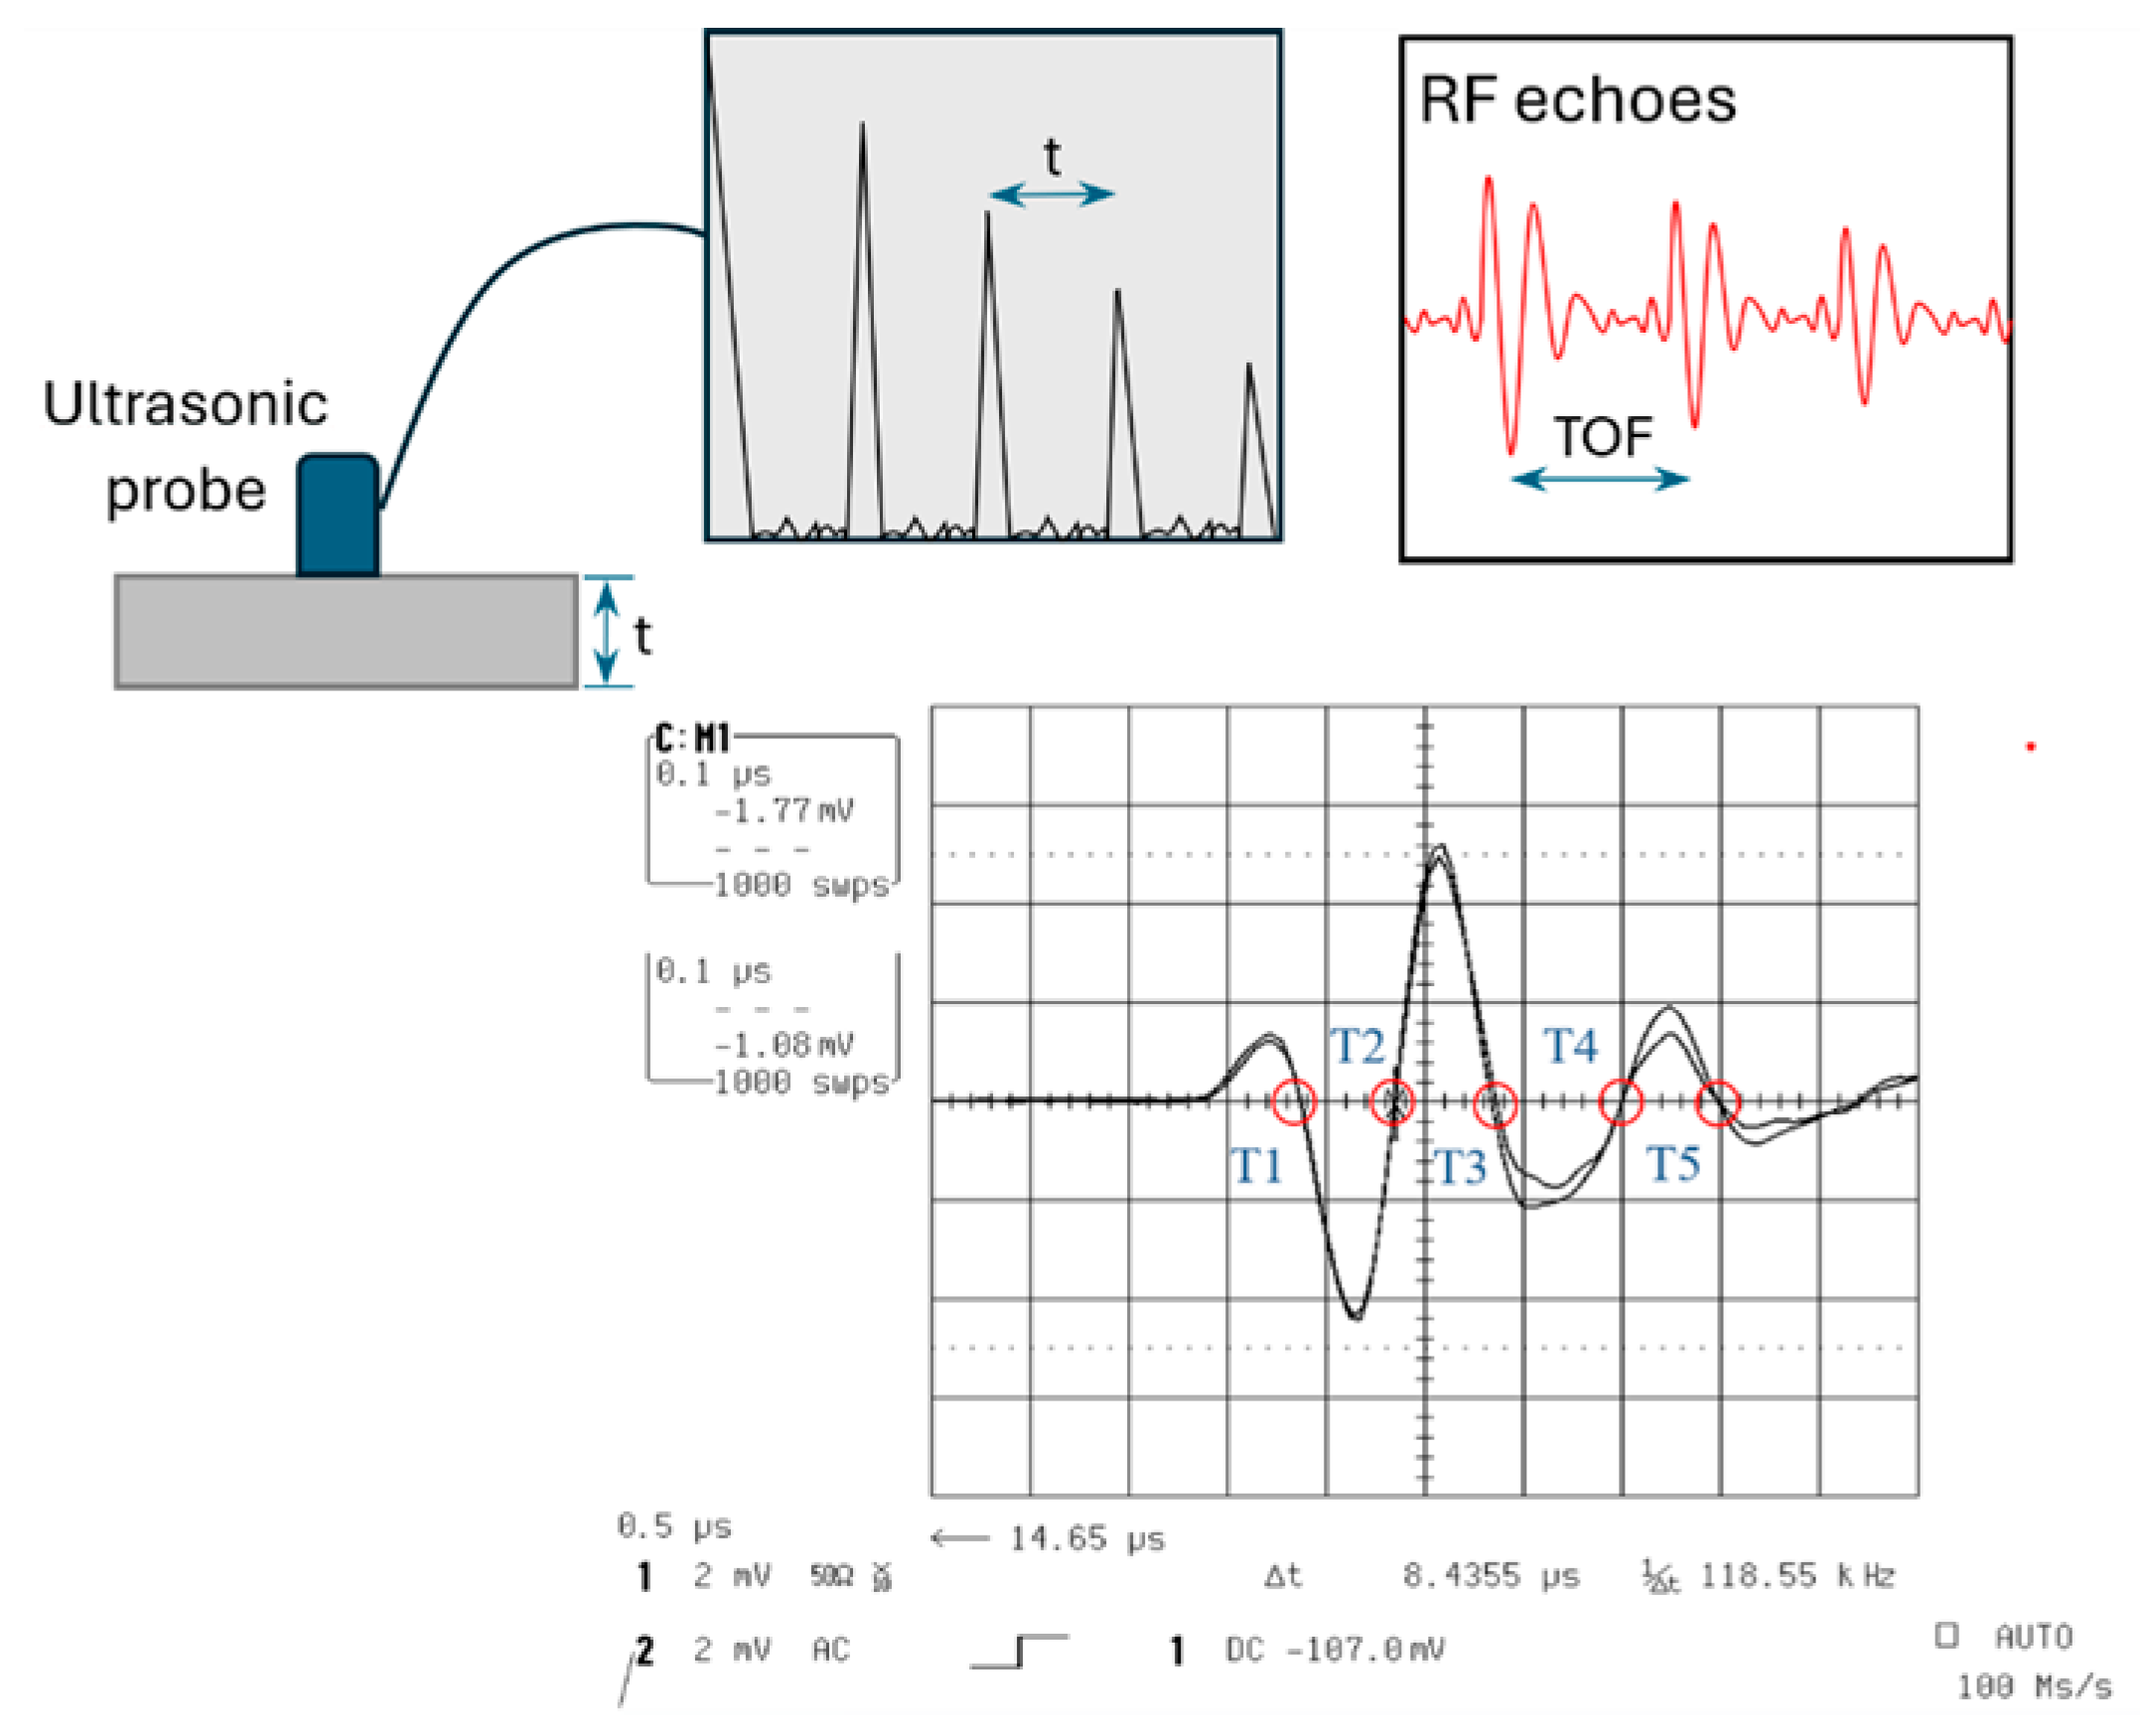
Ultrasonic velocity measurements were performed using a 400 MHz digital oscilloscope (LeCroy 9310AM) with a maximum sampling rate of 100 MS/s. The corresponding temporal resolution was determined by the sampling interval. The Pulse-Echo Overlap Method (PEO Method) was used, where two RF echoes are overlapped on a digital oscilloscope (
Figure 2). The PEO Method is based on measuring the Time of Flight between the first and second reflected pulse generated from the single-element ultrasonic probe. Measurements were conducted on 5 selected points on overlapped pulses (T1, T2, T3, T4, T5). The measurements were repeated five times.
In order to ensure measurement repeatability, the influencing factors were maintained under controlled conditions. The measurements were carried out by three operators: one operator controlled the single-acting hydraulic press, one was responsible for positioning the ultrasonic probe at the designated location, and one performed data acquisition using the oscilloscope. In this way, operator-related influence was minimized, particularly with regard to ensuring consistent contact between the ultrasonic transducer and the contact surface.
It is well known that the type and thickness of the coupling medium can significantly contribute to measurement uncertainty [
23]. To minimize the influence of coupling layer thickness on the measured results, water was selected as the couplant.
Ultrasonic time-of-flight was measured using the pulse-echo mode. The path length was defined by the known specimen height
l, and the wave velocity v was calculated as:
where:
v is the longitudinal wave velocity;
l is the height of the specimen in the direction of wave propagation;
tTOF is the measured time of flight (TOF);
factor 2 accounts for the round-trip path in pulse-echo mode.
The average velocities were calculated from three measurements per condition to ensure repeatability. Prior to each set of measurements, gel as the ultrasonic couplant was applied to minimize acoustic impedance mismatch, and probe positioning was carefully aligned perpendicular to the specimen surface.
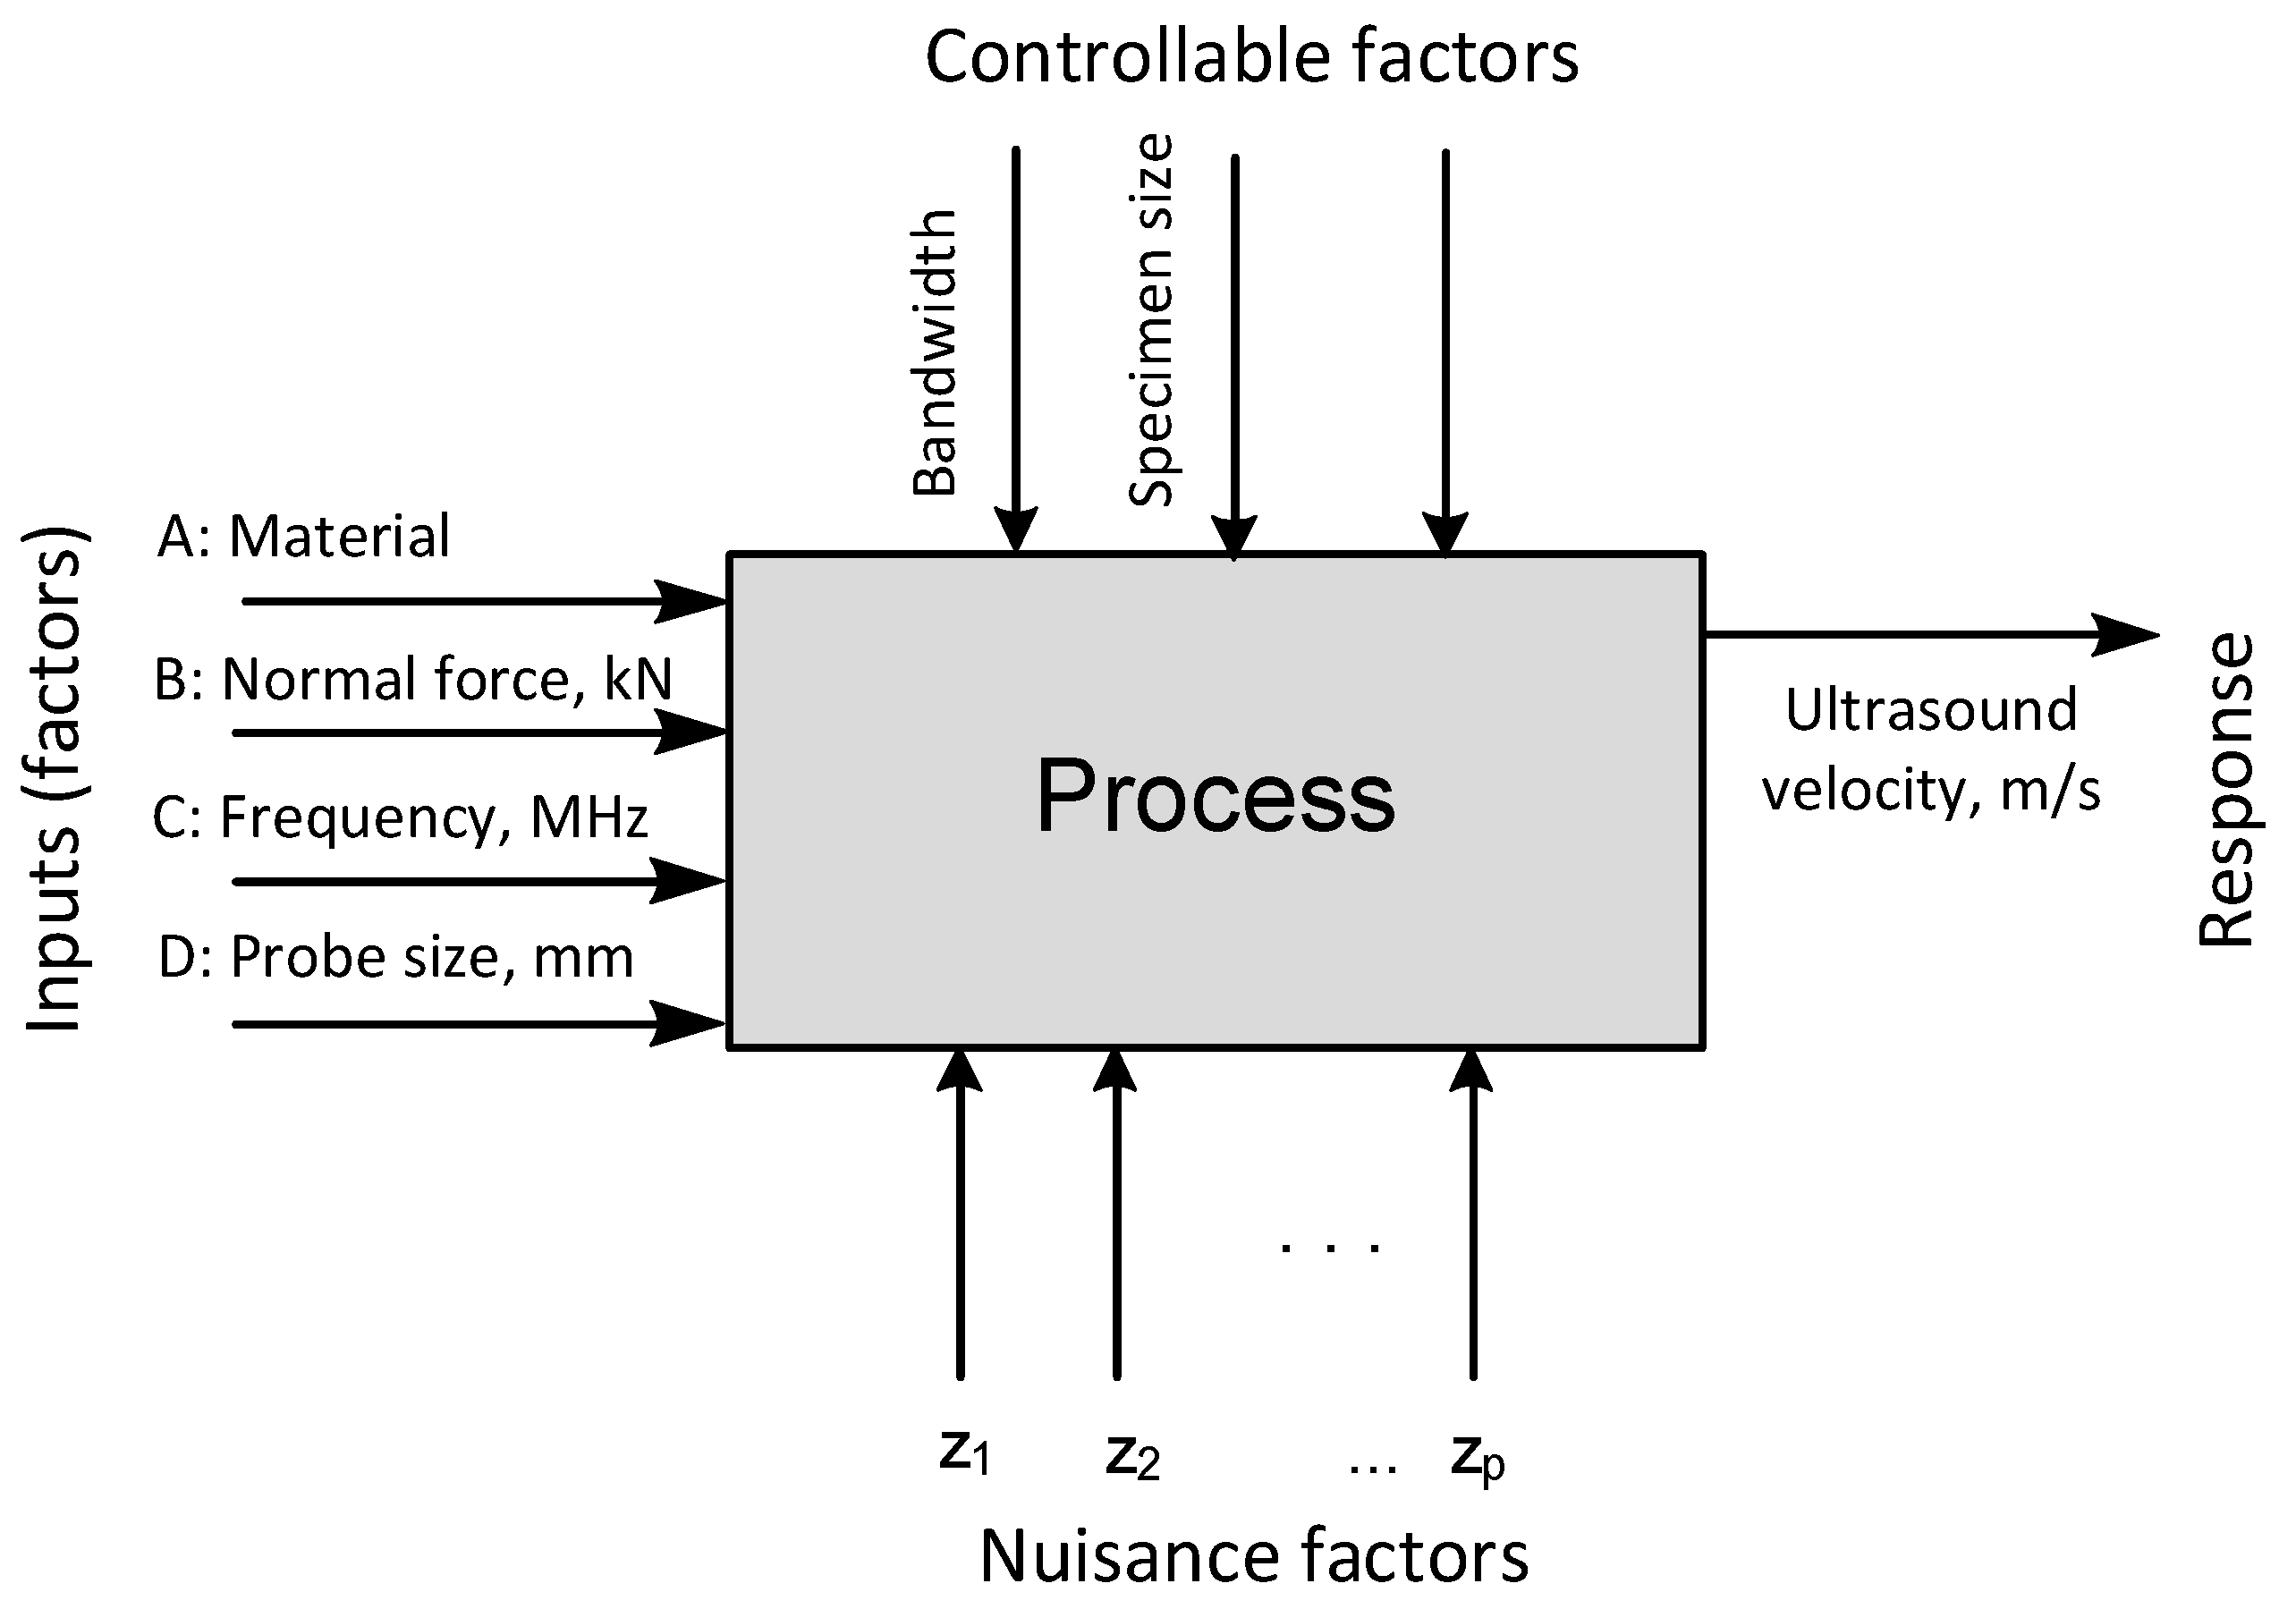
The scope of the research is to model the relationship between the ultrasonic velocity of the process variables and the response variable. The following process variables were chosen: material, normal force, frequency, and size of the probe. The process scheme is presented in
Figure 3.
The process factors (independent variables) were varied at two levels each. The normal force was set at 0 and 275 kN, the frequency at 5 and 10 MHz, and the probe size at 5 and 10 mm. Two materials, aluminum and steel, were selected as levels for the material factor. To examine the main effects and interactions among the four process variables, a full factorial 2
4 experimental design was employed. The process factors were denoted as follows: A—Normal force, B—Material, C—Frequency, and D—Probe size. This design resulted in 16 experimental combinations, which were performed in random order to ensure unbiased estimation of the experimental error (see
Table 6). Furthermore, each combination was replicated three times to provide a reliable estimate of pure error, resulting in a total of 48 experimental runs.
During experimentation, an issue arose that resulted in missing data for the probe with a nominal frequency of f = 10 MHz and a probe size of D = 10 mm. These data points were treated as missing values, which added some complexity to the analysis and necessitated caution when interpreting the results. Ultimately, the experiment yielded a final sample size of 36 data points (
Table 7).
Analyzing the final dataset, which excludes missing design points and the excluded outlier (point 18), results in aliased model terms. The alias structure shows that the main effects are confounded with higher-order interactions. However, since higher-order interactions typically explain only a small portion of the total variance, they can be neglected. This allows the main effects to be interpreted primarily as true main effects.
Analysis of variance (
Table 8) was conducted to identify significant terms at the 5% significance level. The significant model terms include all main effects (A, B, C, D), two-factor interactions (AB, AC, AD, BC, BD), and the three-factor interaction (ABC). All other terms were excluded from the model and are considered non-significant.
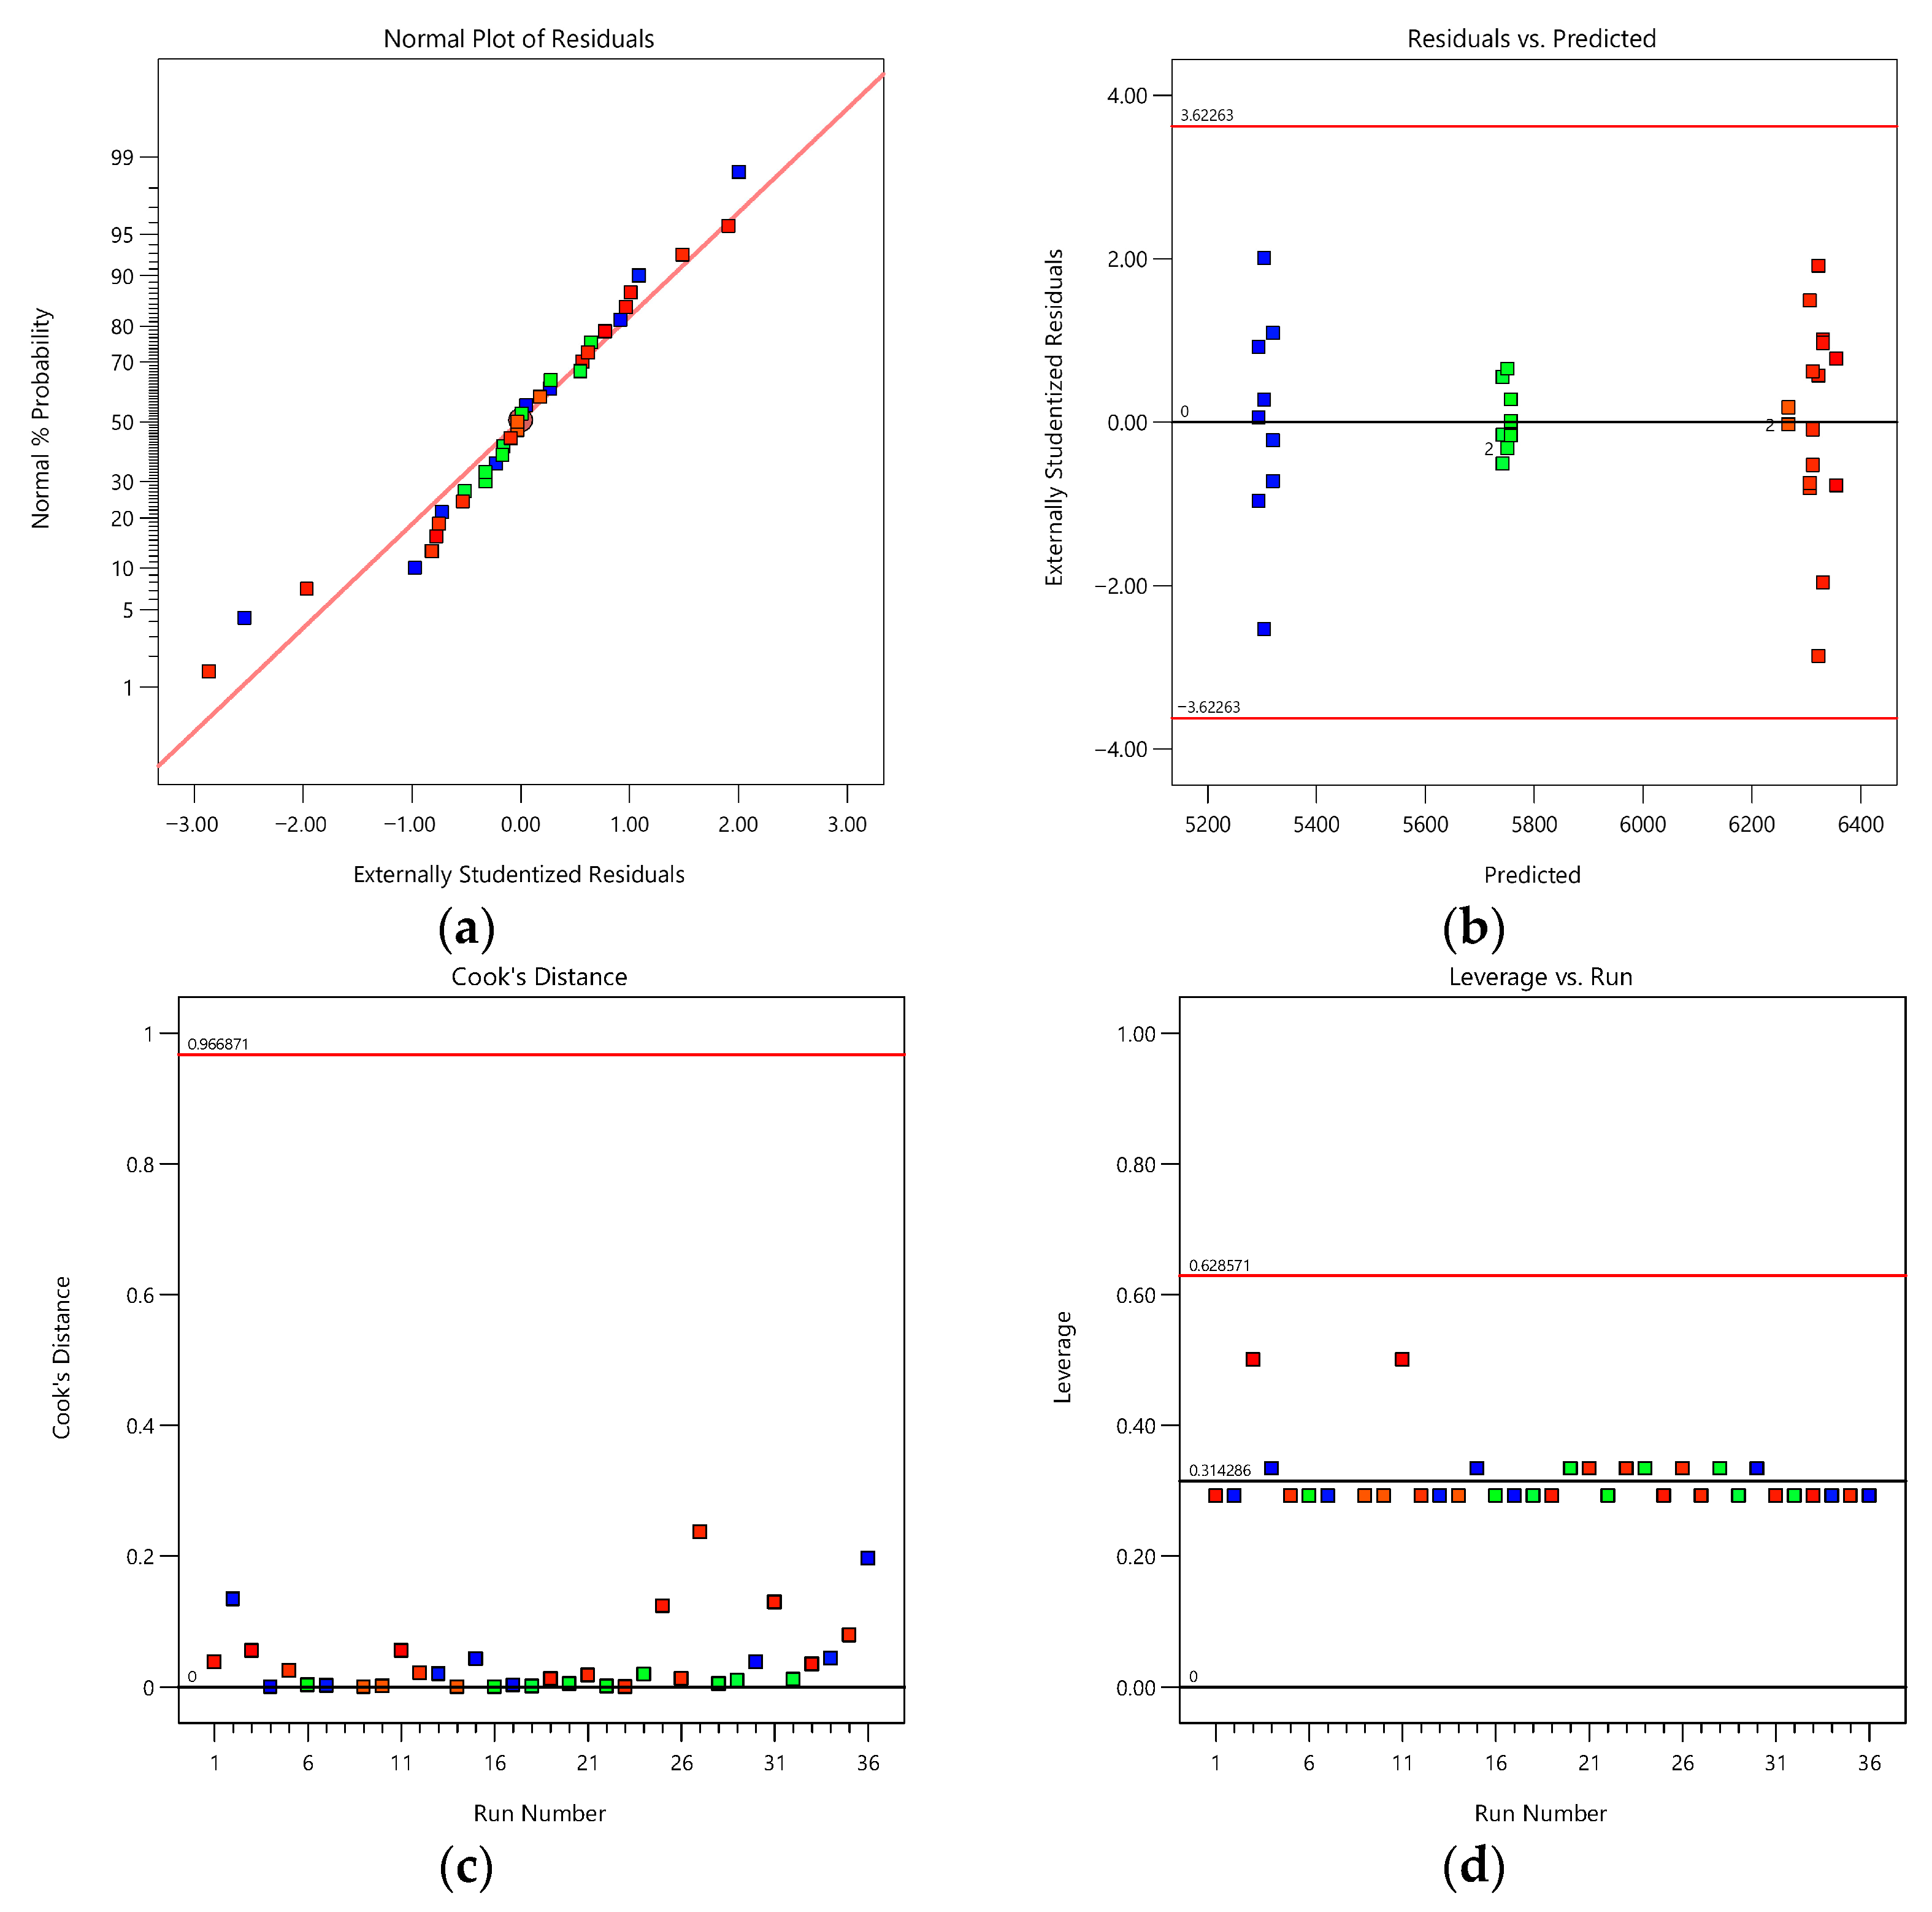
The residual analysis and diagnostic tools were applied to support the hypothesis of unbiased and factor-value independent lack of fit.
Figure 4a shows the normality of the residuals, which points out that there is no structure included in the residuals and that we have a good model for the estimation of the process. Additionally, the adjusted R
2 is 0.999, which is rather high and leaves only a small percentage of the variability uncovered by the model. The diagnostics plots confirm that the high R
2 value reflects the strong physical dependence between applied stress and ultrasonic velocity rather than statistical overfitting. Furthermore, the model includes main effects and physically meaningful interactions, which reduces the likelihood of overfitting.
The model is expressed by the regression Equation (1) in terms of the coded factors (−1 means low level and +1 means higher level of the factor). Using the equation, it is possible to estimate and predict the values of the ultrasonic velocity at any level of the factor in the experimental area. Comparing the coefficients, it is possible to estimate the relative impact (effects) of the factors on the response.
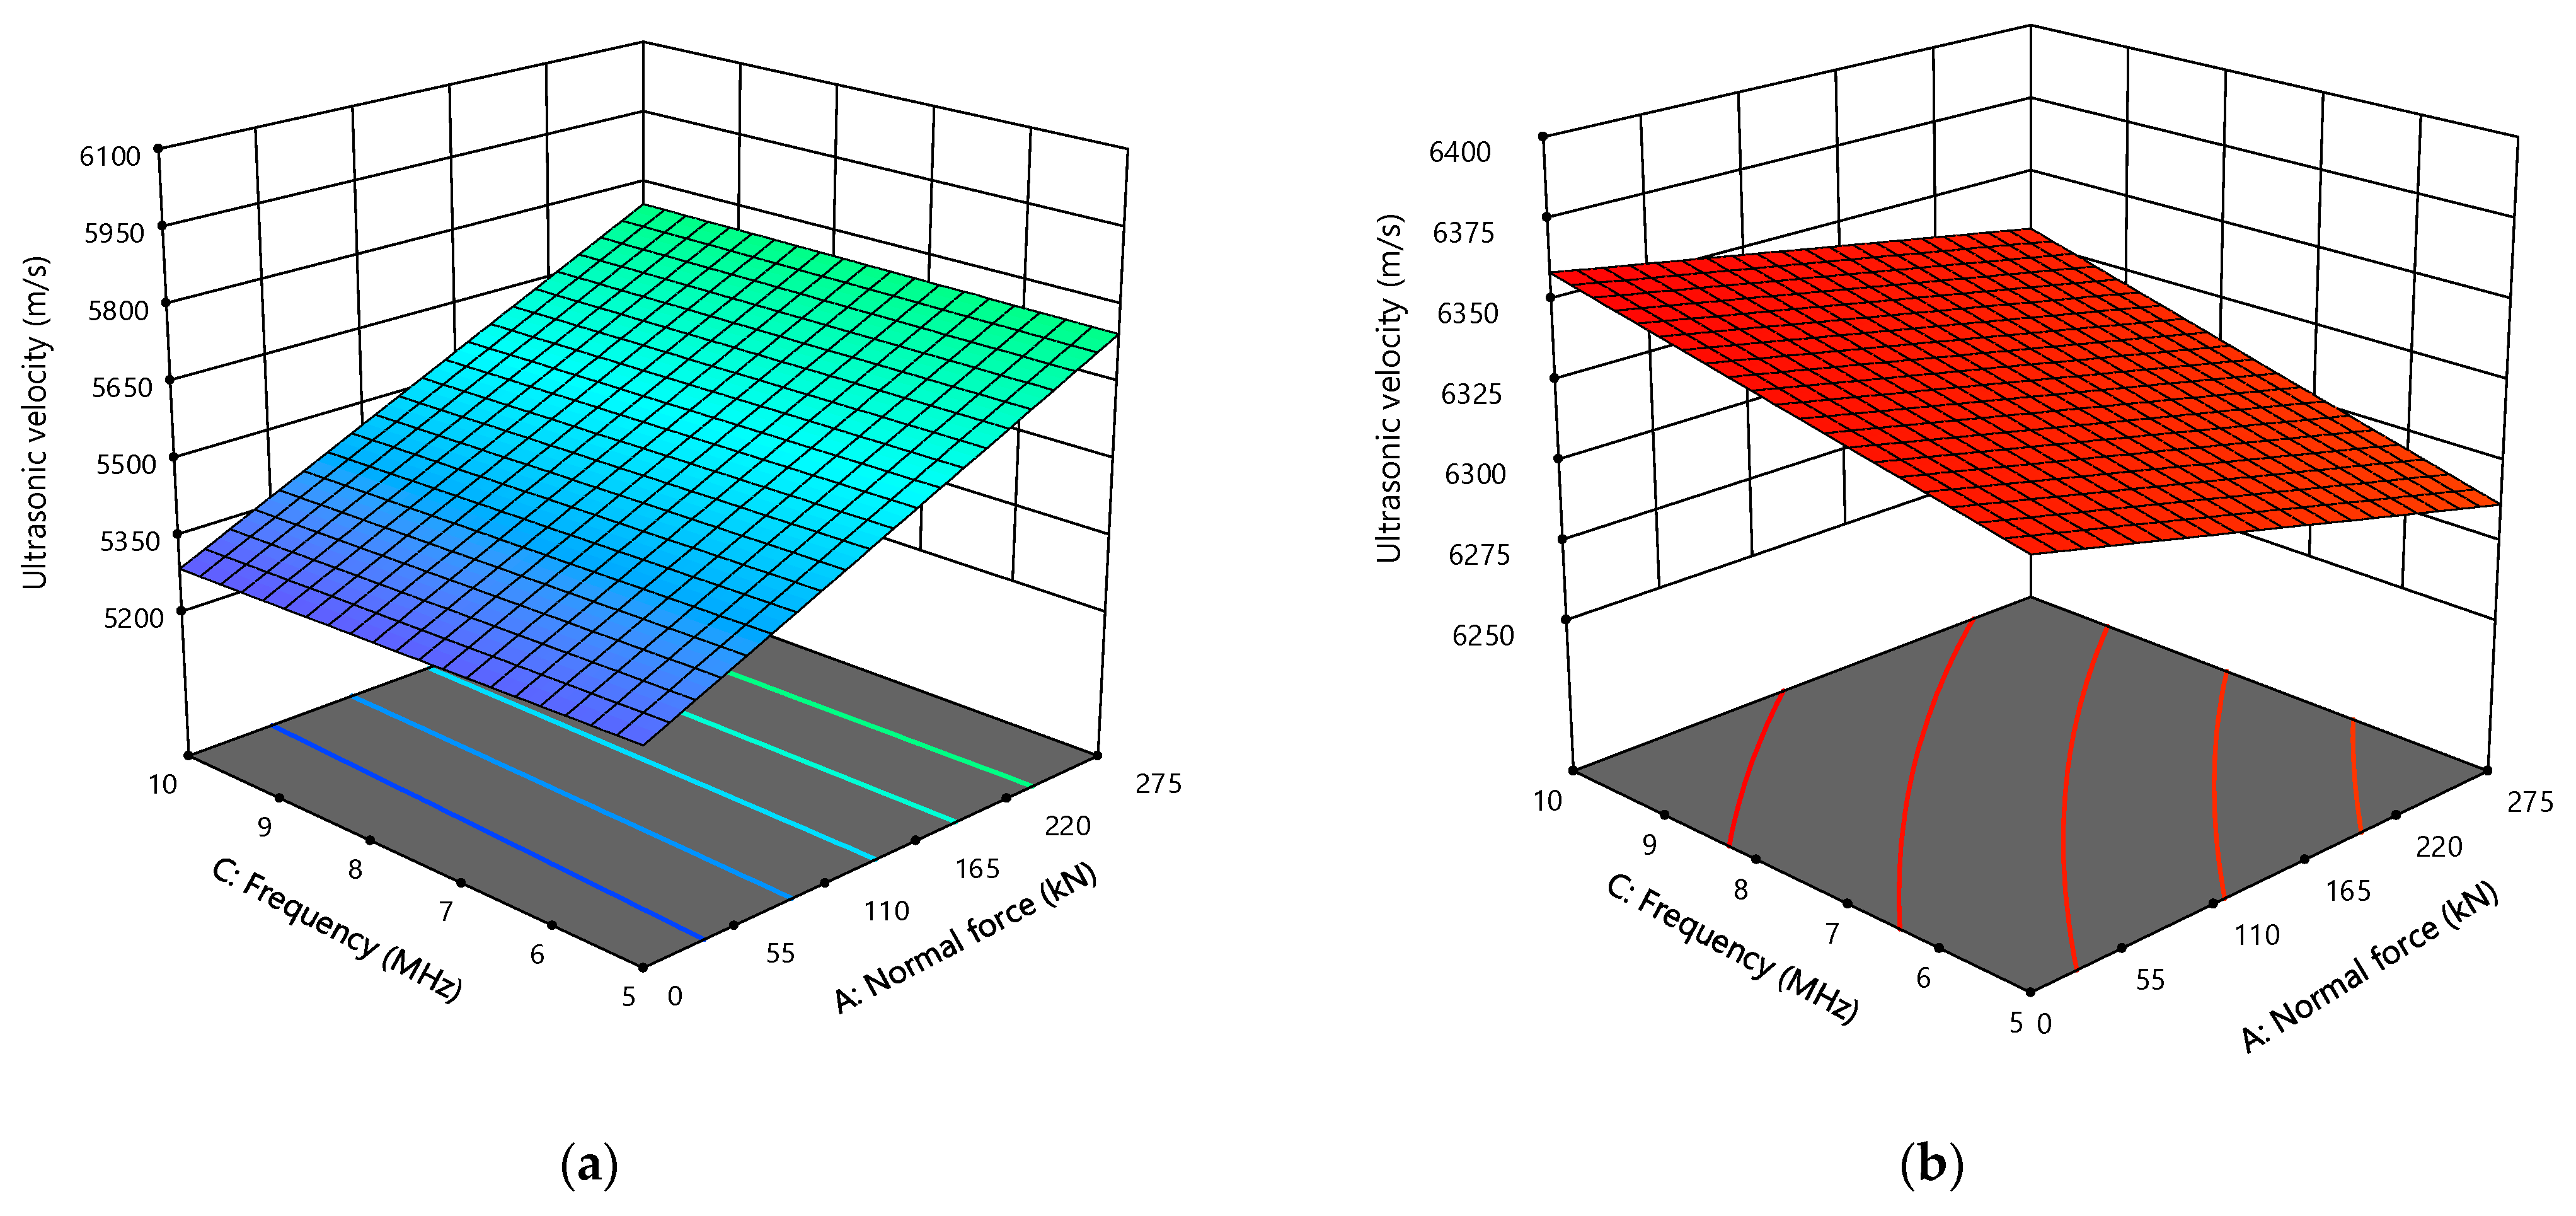
Analysis of the coefficients indicates that the material exerts the largest effect on ultrasonic velocity. Among the measurement process parameters, normal force has the most significant impact on the response. On average, the ultrasonic velocity is approximately 800 m/s higher in the aluminum specimen than in the steel specimen, and about 200 m/s higher when a normal force of 275 kN is applied. The detailed variation in ultrasonic velocity with respect to the process factors is illustrated by the response surfaces in
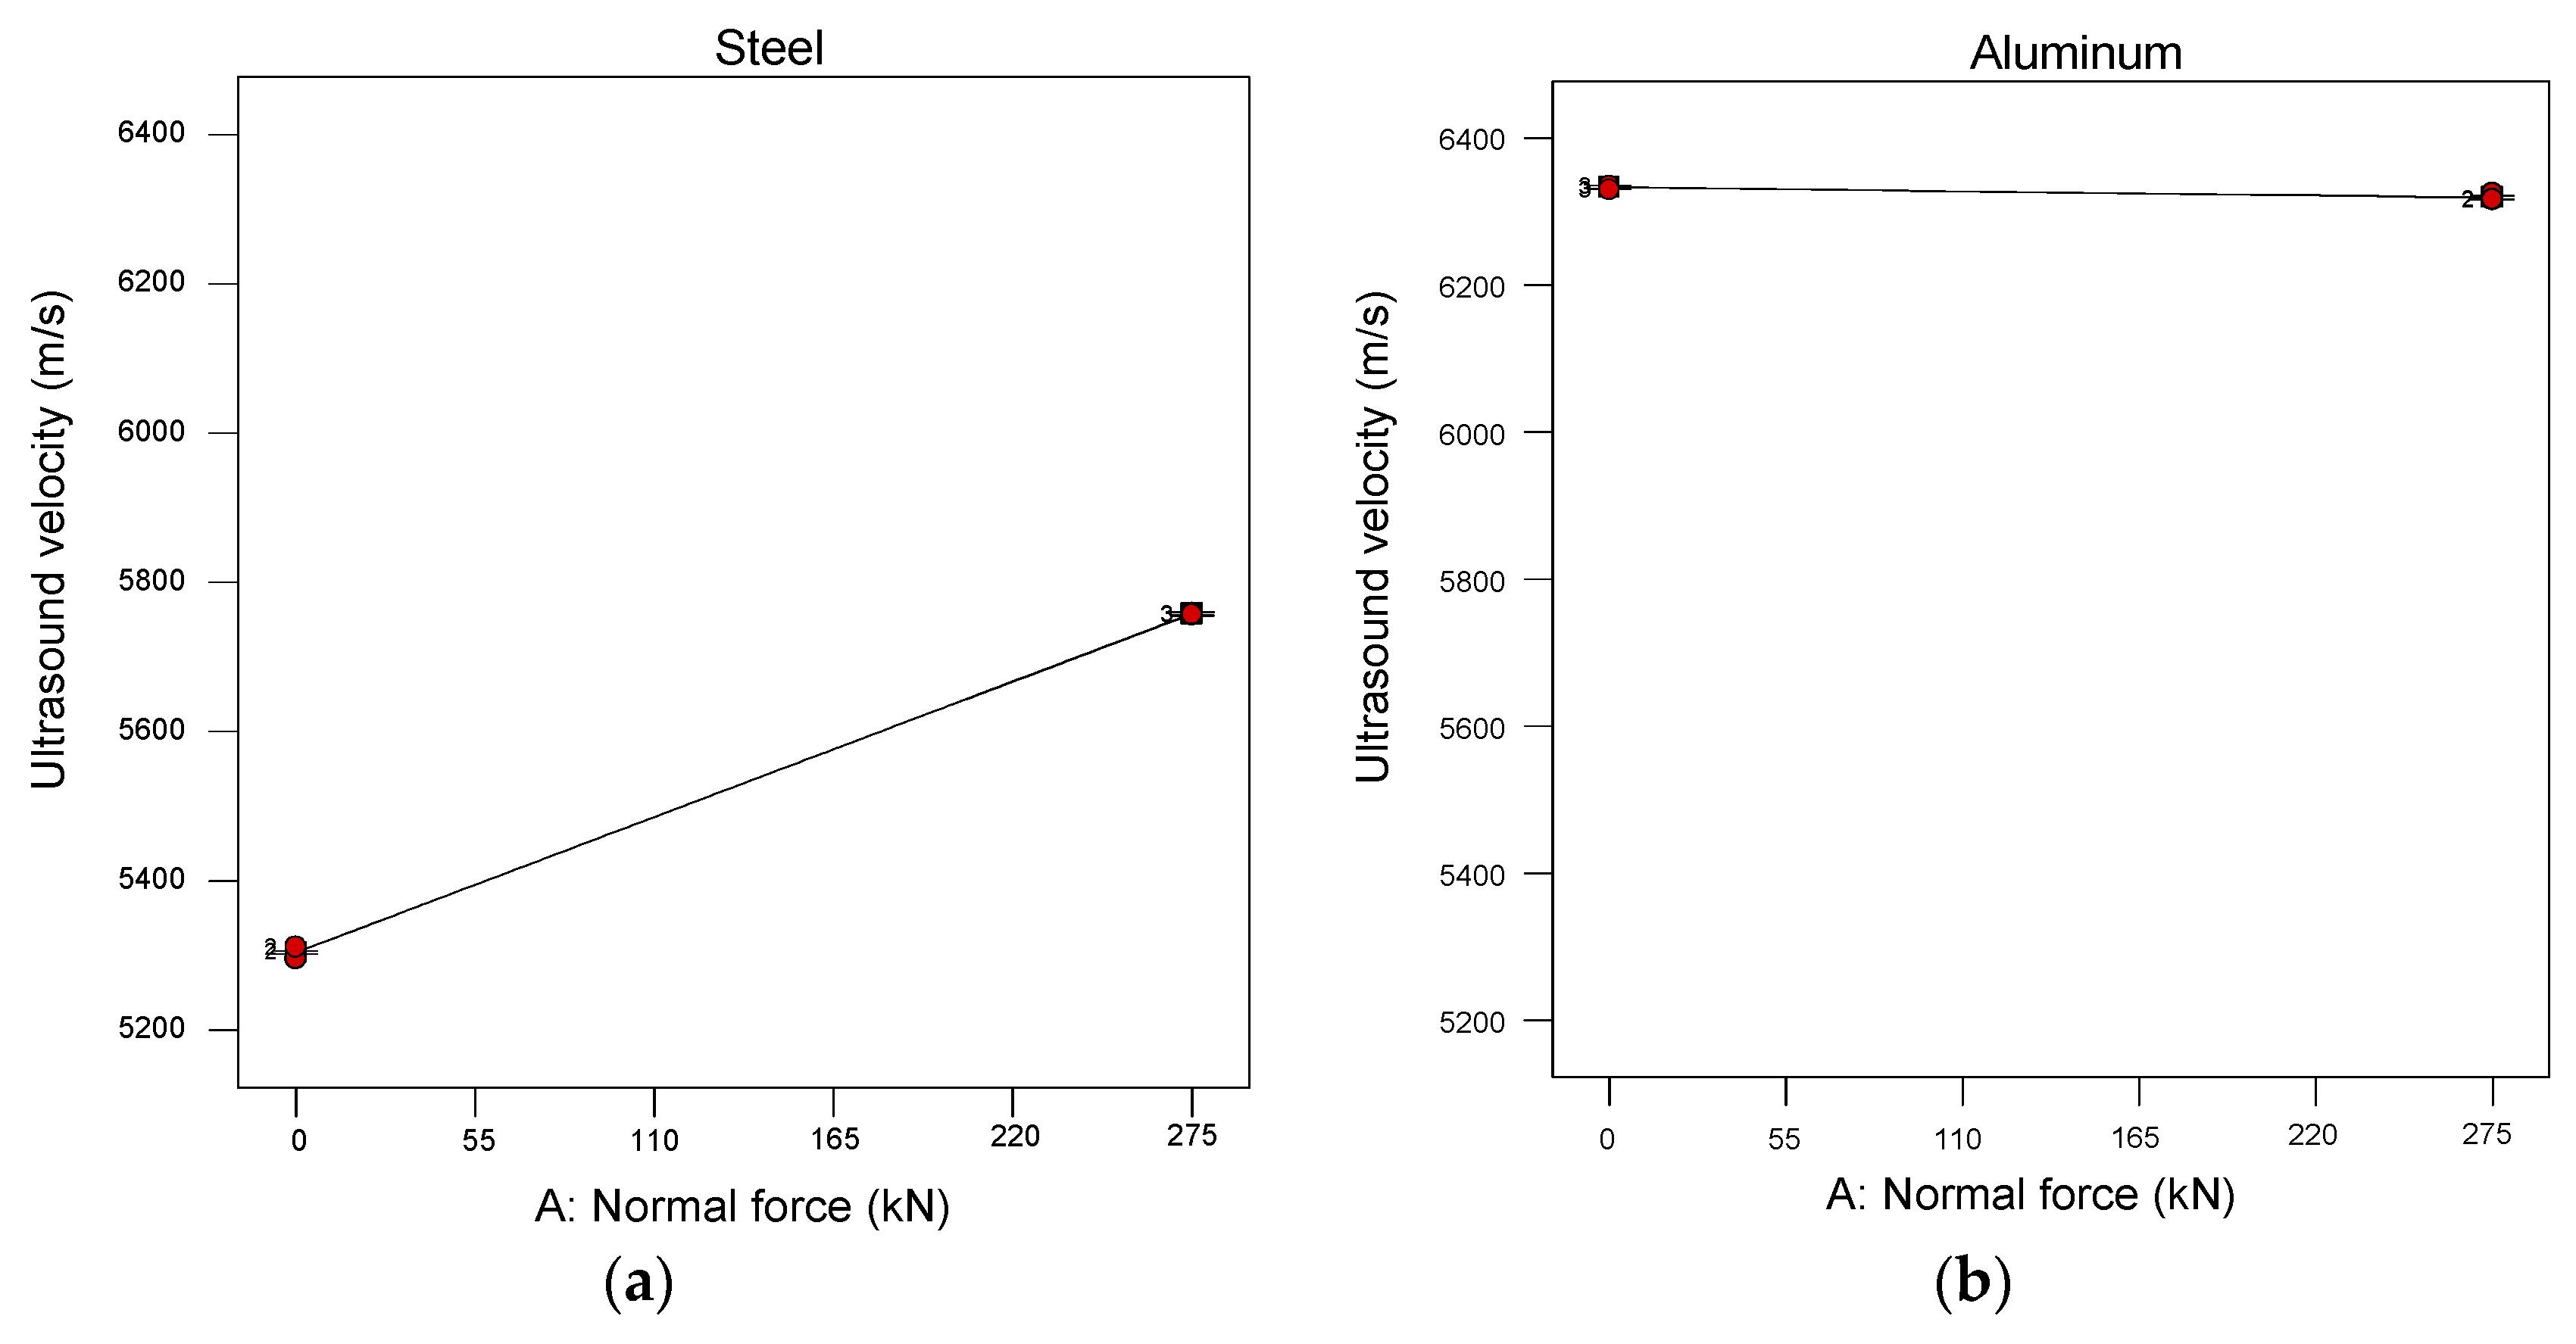
Figure 4. It is evident that the average change in ultrasonic velocity for aluminum is relatively small compared to that observed in steel. Furthermore, the ultrasonic velocity in steel increases significantly with increasing normal force, whereas in aluminum, the trend is reversed; ultrasonic velocity decreases as the normal force increases (
Figure 5). This opposite behavior can be attributed to the different elastic properties and microstructural responses of the two materials, which govern their acoustoelastic response under applied stress. In particular, the lower elastic modulus and higher deformability of aluminum compared to steel may result in a different sensitivity of ultrasonic wave velocity to applied stress.
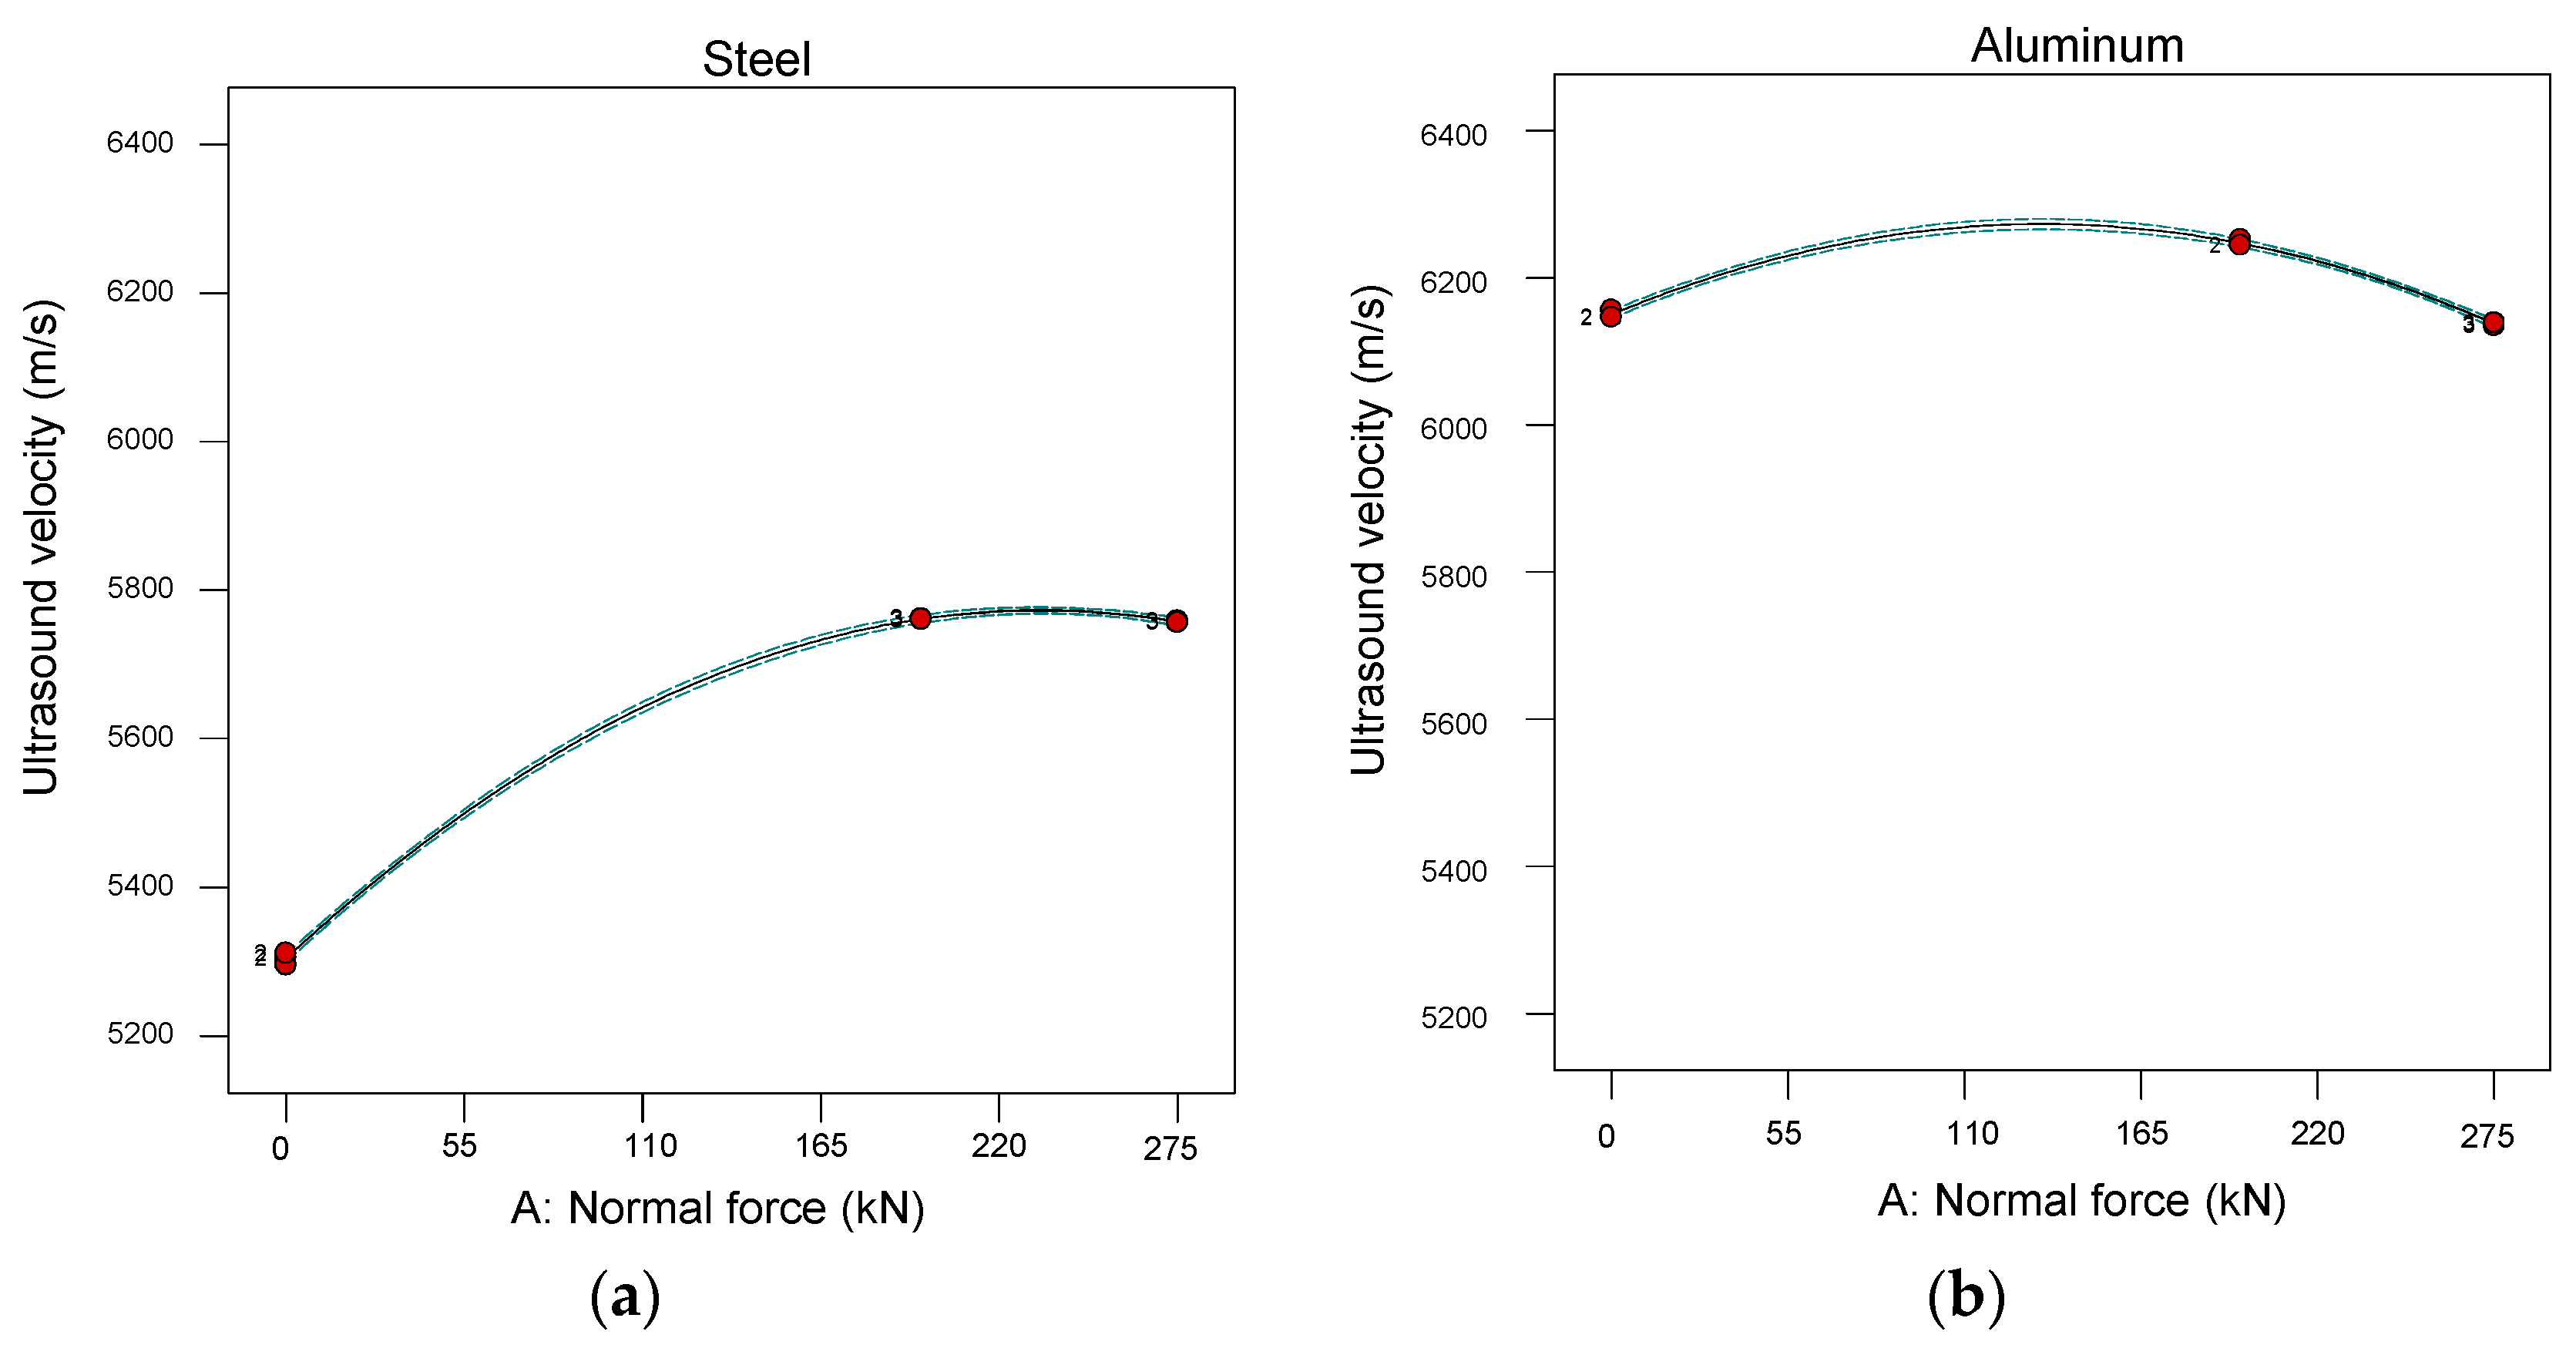
Due to the inability to detect whether the aluminum specimens were previously thermal or mechanically processed, and to ensure that the specimens are uniformly structured, the process of annealing was applied. Another experiment was conducted to compare with previous experimental results. A mixed-level factorial design was applied using two factors: material and normal force. Normal force varied over 3 levels (0, 196, 275 kN), and ultrasonic velocity was measured using a probe with a 5 MHz frequency and 10 mm size. After model analysis, polynomial regression equations were calculated, and the comparison of response functions was made (
Figure 6 and
Figure 7).
5. Discussion
Residual stress in wheel rims may cause serious incidents that could negatively impact vehicle safety. In that sense, with a systematic approach and accurate estimation, it is possible to detect the impact effects on measuring the residual stress in wheel rims. In this way, the presented methodology contributes to improving the safety and reliability of residual stress detection in selected components of railway vehicles.
This study confirms that ultrasonic velocity measurements are sensitive to elastic stress states in metallic specimens. By applying a systematic DOE approach, we identified the key process parameters affecting ultrasonic velocity and quantified their individual and interactive effects. The DOE analysis revealed that material type and applied force are the most significant factors influencing ultrasonic velocity, while probe frequency and size have smaller but measurable significance. Although the reduced experimental design introduces aliasing between main effects and higher-order interactions, the sparsity-of-effects principle suggests that the dominant contribution to the response originates from a limited number of low-order effects. Therefore, the estimated main effects can still be interpreted with reasonable confidence.
Furthermore, the interaction effects between material and frequency, as well as material type and probe size, suggest that careful calibration is needed when applying ultrasonic velocity measurements across different material systems for stress assessment.
Importantly, the results emphasize that the successful implementation of ultrasonic stress monitoring in real-world components, such as wheel rims, requires material-specific calibration and careful consideration of probe and measurement parameters. Future work should focus on extending these methods to in situ applications, incorporating residual stress analysis using adequately selected and prepared ultrasonic measurement systems.
The application of the proposed methodology to real wheel rim components is associated with several challenges, including complex geometry, variable boundary conditions, and limited accessibility for in situ measurements. Therefore, further investigation under realistic operating conditions is required.