Article

Impact of Post-Maize Residual Nitrogen on Functional Properties of Grain in Spring and Winter Wheat


by
Piotr Szulc
1,*,
Joanna Kobus-Cisowska
2 and
Katarzyna Ambroży-Deręgowska
3
1
Department of Agronomy, Poznań University of Life Sciences, Dojazd 11, 60-632 Poznan, Poland
2
Department of Gastronomy Sciences and Functional Foods, Faculty of Food Science and Nutrition, Poznan University of Life Sciences, 60-637 Poznan, Poland
3
Department of Mathematical and Statistical Methods, Poznań University of Life Sciences, Wojska Polskiego 28, 60-637 Poznan, Poland
*
Author to whom correspondence should be addressed.
Appl. Sci. 2026, 16(8), 3886; https://doi.org/10.3390/app16083886
Submission received: 15 March 2026 / Revised: 14 April 2026 / Accepted: 14 April 2026 / Published: 16 April 2026

Abstract

Common wheat (Triticum aestivum ssp. vulgare) is one of the three major cereal crops cultivated worldwide and plays a key role in ensuring food safety. Adequate nitrogen supply is a key factor affecting the yield and functional properties of the grain of common wheat. Improving the efficiency of soil nitrogen use can be achieved through the application of appropriate mineral fertilizers and proper variety selection. The aim of this study was to determine the effect of residual nitrogen (Nres) remaining after maize cultivation on the functional properties of winter and spring wheat grain. The results of the present study clearly indicate that appropriate selection of the maize hybrid (preceding crop) and nitrogen fertilization strategy (residual nitrogen, Nres) can significantly enhance the antioxidant potential of grain in both forms of wheat (winter and spring). At the same time, our results highlight the practical importance of agronomic practices in improving the functional value of grain, both in terms of nutritional quality and health-promoting potential. Total polyphenol content in grain was stable, while antioxidant activity (ABTS+, DPPH) depended on genotype × fertilization interaction, particularly in winter wheat. These changes likely result from differences in polyphenol profile and the proportion of other antioxidants. Appropriate cultivar selection and nitrogen fertilization can enhance the antioxidant potential of wheat. No significant effect of either the preceding crop (maize) or its cultivar, or the form of nitrogen fertilizer, was found on the amino acid and total polyphenol content in winter and spring wheat grain. Population growth and the need to ensure adequate food supply highlight the importance of improving nitrogen management efficiency in agriculture by accounting for the amount and quality of residual soil nitrogen after the preceding crop.

1. Introduction

Wheat grain is of high economic and nutritional importance [1]. Cultivation factors primarily determine yield as well as its quality, in terms of the content of macro- and micronutrients affecting its nutritional, functional, and technological value [2]. Components such as proteins, starch, and mineral elements, as well as their relative proportions, have a decisive influence on these properties. Wheat grain also contains low-molecular-weight compounds, whose content is directly dependent not only on the variety but also on environmental factors affecting cereal growth [3,4]. Crop growth conditions, including soil salinity and the associated disturbances in ionic and water balance, can significantly affect the secondary metabolism of cereals and, consequently, the content of phenolic compounds and grain antioxidant activity. Environmental stress induces excessive production of reactive oxygen species, leading to the activation of plant antioxidant systems, including both enzymatic and non-enzymatic defense mechanisms [5]. In response to oxidative stress, plants can increase the synthesis of polyphenols and other secondary metabolites with antioxidant properties, which play protective roles at the cellular level [6]. At the same time, fertilization practices, particularly potassium supply, affect ionic homeostasis, efficiency of antioxidant mechanisms, and oxidative damage reduction. As a result, diverse agronomic practices and growing conditions can lead to significant differences in polyphenol content and antioxidant activity of the grain, which is important both for raw material quality and its health-promoting value [7]. Grain antioxidant activity can be measured using various in vitro methods, among which DPPH (1,1-diphenyl-2-picrylhydrazyl) radical scavenging capacity and ABTS (2,2′-azino-bis(3-ethylbenzothiazoline-6-sulfonic acid)) cation radical reduction capacity are widely used to assess total antioxidant potential. Antioxidant activity is dependent on the presence of various compounds and reflects not only their levels but also the relative proportions of individual components. Most commonly observed is a relationship between polyphenols and radical scavenging potential, although this association is not always straightforward, and it applies not only to grains but also to other plant-based materials [8]. The literature emphasizes that agronomic practices, particularly nitrogen fertilization, significantly modulate plant secondary metabolism by affecting the synthesis of polyphenols, plant pigments, and selected amino acids. Nitrogen, as a key yield-forming element [9], influences not only the quantity and quality of the yield but also plant physiological parameters, such as chlorophyll content and photosynthetic efficiency, which indirectly determine the accumulation of antioxidant compounds in the grain. At the same time, plant responses to nitrogen fertilization can vary depending on the variety and wheat type, including spring and winter varieties [10,11,12,13]. The effect of residual nitrogen on the yield of both forms of common wheat and the indicators of nitrogen application in their cultivation have been presented in earlier publications by the co-author [14,15]. The experimental hypothesis assumed that unused nitrogen remaining after harvesting the preceding crop can significantly modify the functional properties of grain and cereal plants. In our case, these were both forms of wheat (spring and winter). The aim of this study was to determine the effect of residual nitrogen (Nres) remaining in the soil after the cultivation of three common maize (Zea mays L.) varieties, fertilized with different types of nitrogen fertilizers, on the functional properties of winter and spring common wheat (Triticum aestivum ssp. vulgare) grains.

2. Materials and Methods

The field experiment with maize as a preceding crop for wheat was conducted from 2017 to 2019 at the Research Centre for Cultivar Testing in Chrząstowo, Kuyavian-Pomeranian Voivodeship (Poland—53°11′ N, 17°35′ E). The experiment was conducted over three growing seasons using a split-plot design with two experimental factors and three replications. Maize variety was the main factor (A): A1: ES Bombastic (FAO 230–240)—single-cross hybrid (SC); A2: ES Abakus (FAO 230–240)—triple-cross hybrid (TC, stay-green); and A3: ES Metronom (FAO 240)—single-cross hybrid (SC, stay-green + roots power). Type of nitrogen fertilizer was the secondary factor (B): B1: control (no nitrogen fertilization); B2: ammonium nitrate; B3: urea; B4: ammonium nitrate + N-Lock nitrogen stabilizer; B5: urea + N-Lock nitrogen stabilizer; B6: Super N-46; and B7: UltraGran Stabilo. Mineral fertilization with primary macronutrients conducted for all plots, expressed as the amount of the pure element, was as follows: 150 kg N/ha, 120 kg P2O5/ha, and 130 kg K2O/ha. No nitrogen fertilizer was applied in the control plot (B1); however, phosphorus and potassium fertilizers were used. Nitrogen fertilizers were applied to the plots directly before maize sowing and mixed with the soil. In treatments B4 and B5, the nitrogen stabilizer (N-Lock) was applied as a spray at a rate of 1.7 L/ha, five days after nitrogen fertilizer applications.

2.1. Conditions for Conducting Experiments with Winter and Spring Wheat Sown After Maize Harvest

After the maize harvest, winter wheat was sown in 2018 and spring wheat in 2020 on plots corresponding to the respective treatment combinations. Spring and winter wheat were harvested, yields were determined, and the grain was subjected to laboratory analysis. The gross plot area for sowing was 24 m2, while the net plot area for harvest was 12 m2.

2.2. Agronomic Conditions for Wheat Cultivation

Winter wheat, the bread wheat variety Hondia (A), developed by the Polish plant breeding company Danko, was sown on 27 September 2018 (Table 1). The plant density was 400 plants/m2. No mineral fertilization was applied to the plots. Agronomic practices were limited to the application of a growth regulator, fungicidal protection, and insecticidal treatment. The experiment was harvested on 22 July 2019 using a Wintersteiger Delta plot combine. After harvest, the yield was determined and adjusted to 14% moisture. Spring wheat, the quality bread wheat variety Tybalt (A), developed by Wiersum Plantbreeding B.V., was sown on 21 March 2020 (Table 1). The plant density was 450 plants/m2. No mineral fertilization was applied to the plots. Agronomic practices were limited to the application of a growth regulator, fungicidal protection, and insecticidal treatment. The crop was harvested on 14 August 2019 using a Wintersteiger Delta plot combine. After harvest, the yield was determined and adjusted to 14% moisture content.

2.3. Climatic Conditions

The weather conditions during the study were documented using data from the meteorological station at the Research Centre for Cultivar Testing in Chrząstowo, located on the premises of the station (Poland—53°11′ N, 17°35′ E). Table 2 presents the meteorological conditions from sowing to harvest of winter wheat (2018–2019). The growing season for winter wheat was defined as the period from March to July. These data were compared with the results from the long-term period of 2007–2019. In 2019, during the winter wheat growing season (March–July), the average monthly air temperatures were 1.1 °C higher than in the same period of the long-term 2007–2019 dataset. Average monthly temperatures were lower compared to the long-term period only in May and July. The largest temperature difference, reaching 4.3 °C, was recorded in June. During the 2019 growing season (March–July), total precipitation was 114 mm lower than in the long-term period (2007–2019). Total precipitation in 2019 exceeded the long-term average only in May. In April 2019, total precipitation amounted to only 3 mm. Table 3 presents the meteorological conditions during the spring wheat growing season in 2020 (April–August). These data were compared with the results from the long-term period of 2007–2019.
In 2020, the average temperature during the growing season was 0.8 °C lower than the long-term (2007–2019) average. Except for June and August, monthly average temperatures remained below those of the long-term period throughout the growing season. Total precipitation during the 2020 growing season was 85 mm higher than the long-term average. The highest precipitation was recorded in June (166 mm) and August (105 mm). In April, monthly precipitation reached only 4 mm.

2.4. Statistical Analysis

Analysis of variance (ANOVA) was performed according to a split-plot design model [16]. In this experiment, factor A (maize variety) was treated as the whole-plot factor, while factor B (nitrogen fertilizer) was treated as the sub-plot factor. In the split-plot design, the mixed model of observations has the following form:
y i j k = μ + γ i + α j + η i j + β k + α β j k + ε i j k ,
where
  • y i j k —observation obtained in the i-th block, for j-th level of the factor A and the k-th level of factor B;
  • μ —overall mean;
  • γ i —random effect of the i-th block (i = 1, 2, 3);
  • α j —fixed effect of the j-th level of factor A (j = 1, 2, 3);
  • β k —fixed effect of the k-th level of factor B (k = 1, 2, 3, 4, 5, 6, 7);
  • α β j k —fixed effect of the interaction between the j-th level of factor A and the k-th level of factor B;
  • η i j —random error effect of whole-plot;
  • ε i j k —random error effect of sub-plot.
Errors are assumed to have independent normal distributions:
η i j ~ N ( 0 , σ η ) , ε i j k ~ N ( 0 , σ ε ) .
The assumptions of the ANOVA model were checked by analyzing the residuals for normality (Shapiro–Wilk test) and homogeneity of variance (Levene’s test).
When the main effects (maize variety or nitrogen fertilizer) or their interaction were statistically significant in the analysis of variance (ANOVA), mean comparisons were conducted using Tukey’s HSD post hoc test.
All calculations were performed using the STATISTICA software package (version 13.3; TIBCO Software Inc., Palo Alto, CA, USA) and Microsoft Excel. Statistical analyses were carried out at a significance level of α = 0.05. Visualizations were prepared in Microsoft Excel; the bar charts show means and the standard error of the mean (SEM).

2.5. Observations and Measurements

One sample was taken from each plot. Because the experiment was designed with three replicates, three samples were analyzed for each trait. Technical replicates of laboratory analyses were performed once. If the obtained result differed from the first measurement, a second technical measurement was performed to ensure accuracy. Each measurement was performed on the same sample.

2.5.1. Amino Acid Content

Amino acids in wheat grain were assessed using NIRS (Near-Infrared Reflectance Spectroscopy) with an NIRFlex N-500 instrument (Buchi, Flawil, Switzerland).

2.5.2. Grain Color and Chlorophyll a and b Content

Grain color and the content of chlorophyll a and b in wheat grain were determined using high-performance liquid chromatography (HPLC).

2.5.3. Polyphenolic Compounds

Compounds reacting with the FC reagent were extracted using a methanol–water solution (1:1) acidified to pH 4.20 with 1 M HCl. The samples were obtained after a 90 min extraction and subsequently filtered using a Büchner funnel. Polyphenol content, expressed as chlorogenic acid equivalents, was determined according to the method of Cheung et al. [17] using the Folin–Ciocalteu reagent. The method is based on spectrophotometric measurement (Metertek SP-830, Taiwan) of the colored complex formed by the reaction of phenolic groups in the extract with the Folin–Ciocalteu reagent at 765 nm. Results are expressed as quercetin equivalents in mg/g seed extract DM.

2.5.4. Antioxidant Activity Against the DPPH Radical

The determination was carried out on the previously obtained extracts, based on the method described by Amarowicz et al. [18]. The method is based on spectrophotometric measurements (Metertek SP-830, Taiwan) of the color of the reaction mixture, in which free nitrogen radicals from a methanolic DPPH (1,1-diphenyl-2-picrylhydrazyl) solution are scavenged depending on the antioxidant capacity of the tested extract. Absorbance was measured at 517 nm after a 30 min incubation at room temperature in the dark.
DPPH radical scavenging activity was calculated using the following formula:
A A = 100 ( E p E 0 ) E K 100 % ,
where A A —DPPH radical scavenging activity [%], Ep—sample absorbance, E 0 —blank absorbance, and E K —control absorbance.

2.5.5. Antioxidant Activity Against the ABTS Radical

The prepared extracts were analyzed using the method described by Re et al. [19]. This method was used to measure the total antioxidant capacity of the wheat extract samples. The test solution was added to a reaction mixture containing the pre-generated ABTS cation radical [2,2′-azino-bis(3-ethylbenzothiazoline-6-sulfonic acid)]. The presence of antioxidants caused a reduction in the blue-green color intensity proportional to the antioxidant activity. In parallel, a calibration curve was prepared by measuring the absorbance of samples containing known concentrations of the standard compound Trolox at 735 nm, with results expressed as Trolox equivalents. ABTS cation radical scavenging activity was calculated from the regression equation of the calibration curve, prepared using Trolox concentrations of 2.0, 1.5, 1.0, and 0.5 mg/mL.
Regression equation:
y = 32.355 x + 0.453 ,
where x —Trolox concentration [mM], and y —ABTS cation radical scavenging [%].

3. Results

3.1. Cysteine Content

The study demonstrated a significant effect of the preceding crop on cysteine content in the grain of both winter and spring wheat (Tables S1 and S2). Analysis of the effect of the preceding crop showed that the largest significant differences in cysteine content in the grain of winter and spring wheat occurred between variants A3 and A2 (Table 4). In addition, spring wheat contained, on average, a 40.68% higher cysteine content in the grain than winter wheat.

3.2. Methionine Content

Analysis of the results showed no significant effect of the experimental factors on methionine content in the grain of either winter or spring wheat (Tables S3 and S4). Nevertheless, spring wheat grain had, on average, a 15.6% higher content of this amino acid compared to winter wheat (Table 5).

3.3. Lysine Content

The experimental factors had no significant effect on lysine content in the grain of either winter or spring wheat (Tables S5 and S6). Moreover, spring wheat had, on average, a 40.59% higher content of this amino acid in the grain than winter wheat (Table 6).

3.4. Grain Lightness Component

Analysis of variance for the grain lightness component showed no significant effect of the experimental factors on this trait (Tables S7 and S8). Nevertheless, winter wheat was characterized by lighter grain coloration than spring wheat (Table 7).

3.5. Chlorophyll a Content

Analysis of the effect of maize varieties and nitrogen carrier types on chlorophyll a content showed no significant influence of the experimental factors on this parameter (Tables S9 and S10). Additionally, despite the lack of a significant effect of the experimental factors on chlorophyll a content, winter wheat showed a 32.09% higher level of this pigment compared to spring wheat (Table 8).

3.6. Chlorophyll b Content

The study demonstrated that the experimental factors had no significant effect on chlorophyll b content in either winter or spring wheat (Tables S11 and S12). Nevertheless, winter wheat had a higher average chlorophyll b content (31.68) compared to spring wheat (21.03) (Table 9).

3.7. Total Polyphenol Content

The study showed that the experimental factors had no significant effect on polyphenol content in either winter or spring wheat (Tables S13 and S14). Average polyphenol content in winter wheat grain (152.76 mg/100 g) and spring wheat grain (155.84 mg/100 g) was similar, with a difference of only 3.08 mg/100 g (Table 10).

3.8. ABTS+ Cation Radical Content

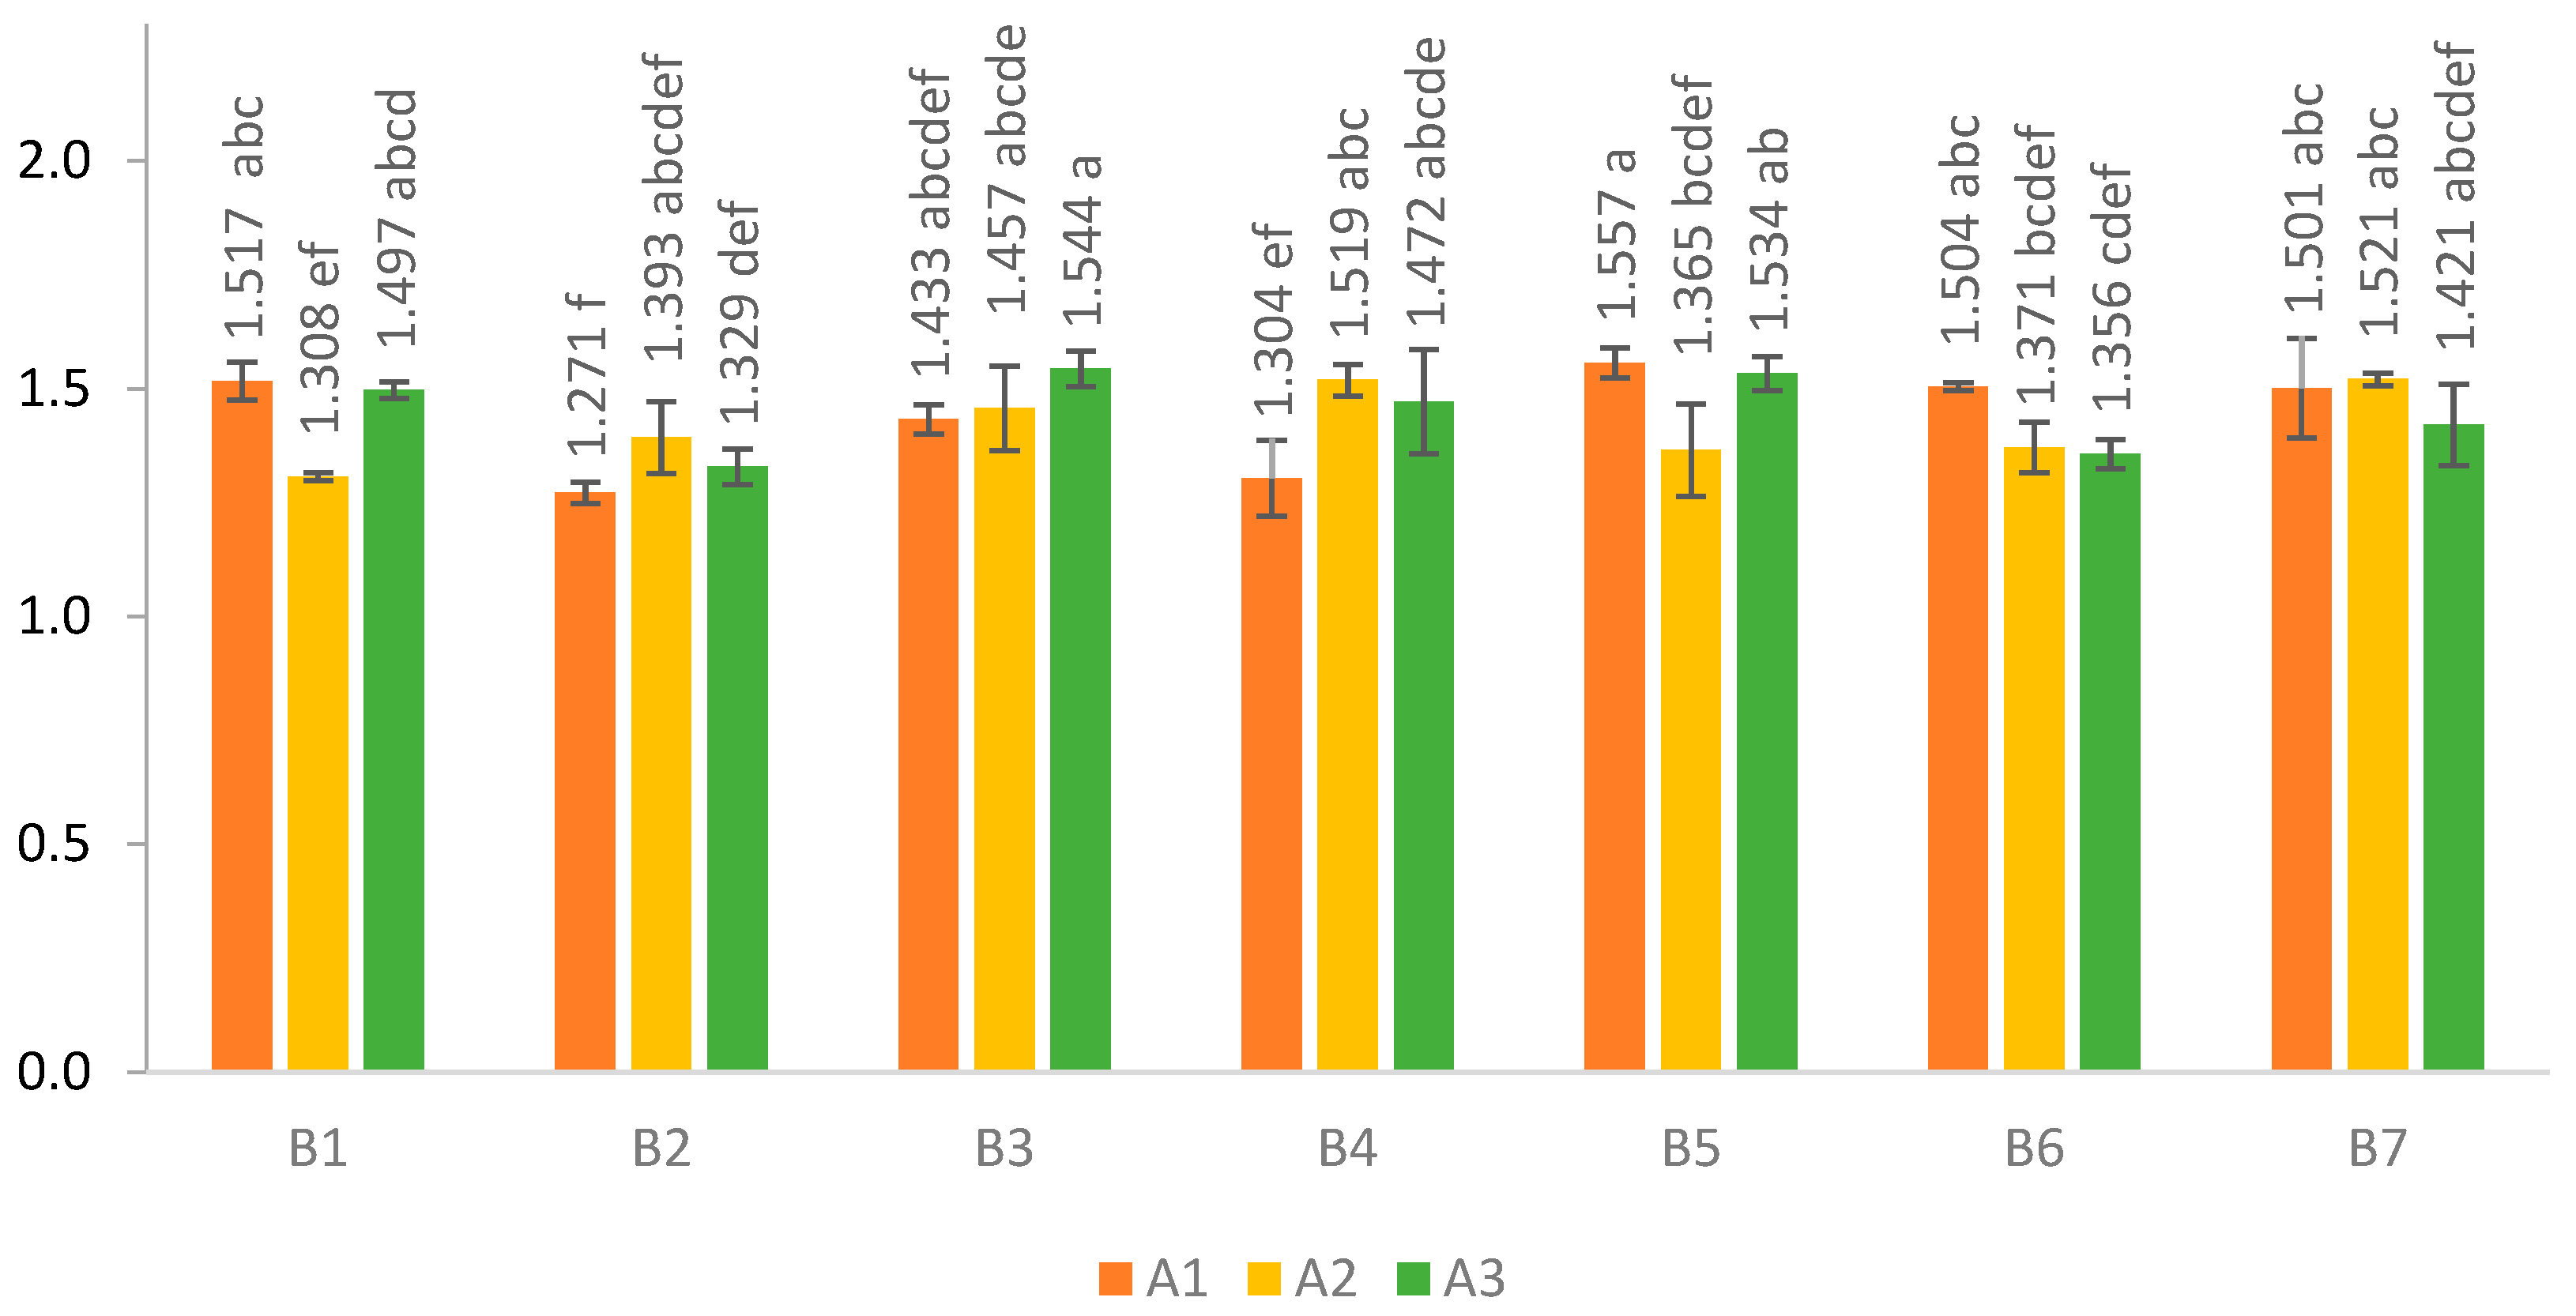
The study assessed the effect of nitrogen fertilizer type and its interaction with maize hybrid type on ABTS+ cation radical scavenging activity in the grain of winter and spring wheat. Analysis of variance showed that both the type of nitrogen fertilizer (B) and its interaction with the maize hybrid type (A × B) had a significant effect on ABTS+ cation radical scavenging in winter wheat grain, whereas the effects of the maize hybrid alone (A) were not statistically significant (Table 11 and Table S15, and Figure 1). In the case of spring wheat, the ABTS+ cation radical scavenging activity in the grain was not significantly affected by the maize hybrid, the fertilizer, or their A × B interaction (Table 11 and Table S16).
The study found that winter wheat fertilized with ammonium nitrate (B2) had the lowest ABTS+ cation radical scavenging capacity. The highest scavenging activity was recorded for the combination of fertilizer B5 with hybrid A1, as well as for fertilizer B3 with hybrid A3, indicating a significant effect of the fertilizer–hybrid interaction on the grain’s antioxidant properties. In contrast, the lowest activity was observed for the combination of fertilizer B2 with hybrid A1. Overall, it can be concluded that both the choice of nitrogen fertilizer and its interaction with the maize hybrid type significantly affect the antioxidant potential of wheat, as measured by ABTS+ cation radical scavenging capacity. In spring wheat, differences between fertilizers were not statistically significant compared with winter wheat, which may be due to the distinct biology and chemical composition of the grains of the two wheat types.

3.9. DPPH Cation Radical Scavenging Capacity

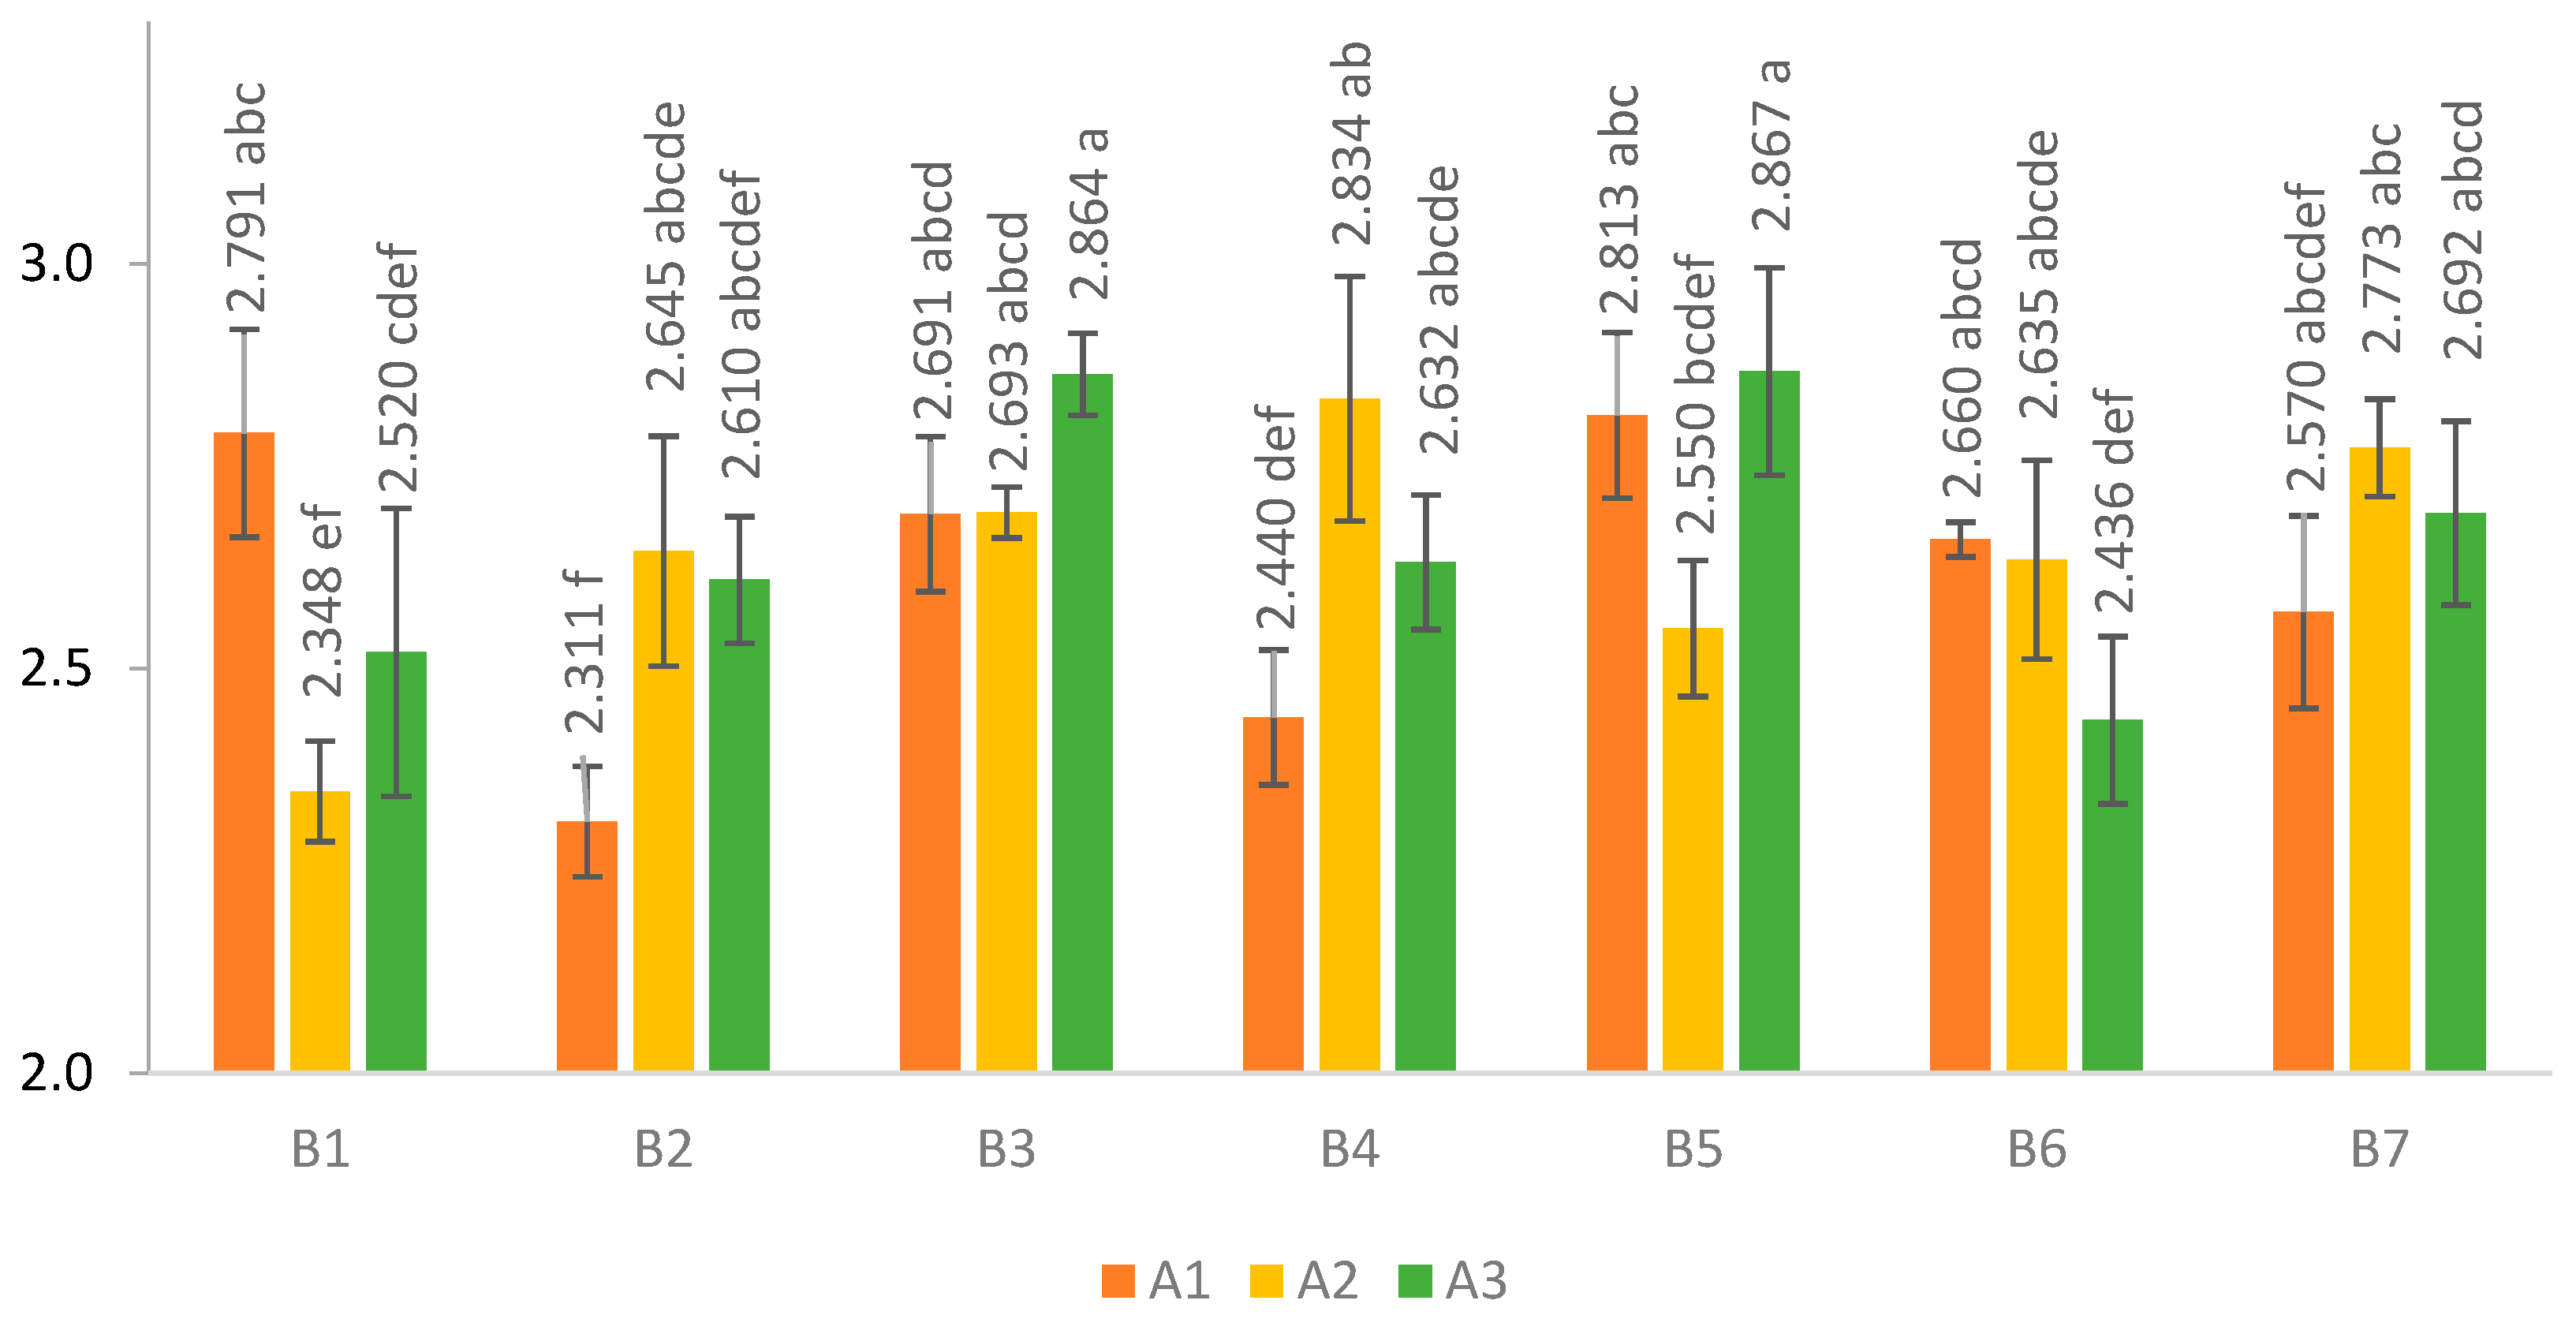
The effect of maize hybrid type and nitrogen fertilization on DPPH radical scavenging capacity was assessed in the grain of winter and spring wheat (Table 12). This parameter is an indicator of the grain antioxidant potential, reflecting its capacity to neutralize free radicals that may induce oxidative stress. Measurement of this trait enables assessment of the functional value of the grain and its suitability for the production of functional foods and products with enhanced nutritional quality. Analysis of variance showed that the interaction between fertilizer type and hybrid in winter wheat had a significant effect on radical scavenging activity, indicating that the selection of both fertilizer and wheat variety can shape the grain antioxidant potential (Table S17). The highest values of this trait were recorded for cultivar A3 following the application of fertilizer B3 (2.864 mmol TX/g grain DM) and fertilizer B5 (2.867 mmol TX/g grain DM). In contrast, cultivar A1 exhibited the highest radical scavenging capacity in the control treatment (Figure 2).
In the case of spring wheat, values of radical scavenging capacity were not significantly affected by the maize hybrid, the fertilizer, or their A × B interaction (Table S18).
Mean values for the entire experiment were 2.637 mmol TX/g grain DM for winter wheat and 2.611 mmol TX/g grain DM for spring wheat. The results indicate that the appropriate selection of nitrogen fertilizer combined with a suitable hybrid can substantially improve the antioxidant potential of the grain, which is important in terms of food quality and functional properties. These findings may be used to optimize agronomic practices to obtain grain with higher health-promoting value and improved quality for consumers.

4. Discussion

Variety and cultivation conditions determine not only yield but also the content of bioactive compounds [20]. These methods often capture only a portion of the compounds responsible for such activity. In studies on polyphenol composition in chia seeds, the authors showed that the seed color from a single plant also varied. Differences were also observed in the extract contents. They amounted to 6–31% of the total content of phenolic acids. Vanillic acid, caffeic acid, gallic acid, and chlorogenic acid predominated in the colored seed extracts. Aqueous-ethanol extracts from colored seeds had statistically the highest total content of phenolic acids [21]. Studies on the effect of barley cultivation conditions showed that the synthesis of phenolic compounds, and thus their accumulation in the grain, is increased under moderate environmental stress and the application of moderate nitrogen doses. This process is closely associated with leaf chlorophyll content and photosynthetic apparatus efficiency. Appropriately selected nitrogen fertilization contributes to an increase in phenolic compound concentration in the grain, as a result of improved plant physiological parameters, such as the SPAD index and photosynthetic energy absorption efficiency (PIabs). Nitrogen fertilization has a significant impact on plant metabolism, including the synthesis of phenolic compounds in cereal seeds [22,23]. Phenolic compounds perform protective functions in plants, including antioxidant and anti-pathogen functions. Increasing nitrogen availability typically promotes more intensive biomass growth and increased yield, but it can also reduce the accumulation of certain phenols in seeds. This is because plants under conditions of high nitrogen availability more often direct their metabolism towards the synthesis of proteins and enzymes rather than secondary compounds such as phenols. However, this effect varies depending on the cereal species, the type of phenolic compound, and the plant’s developmental stage. Grain chemical composition and its antioxidant potential are also determined by the photosystem II photochemical efficiency, expressed by the Fv/Fm ratio, which decreases under hydrothermal stress conditions [24]. The content of phenolic acids (ferulic, p-coumaric, vanillic, syringic, p-hydroxybenzoic, caffeic acids, and syringaldehyde), total polyphenols, and antioxidant activity were analyzed by Brandolini [25] in extracts of the soluble conjugated and insoluble-bound fractions. Ferulic acid was the predominant compound in both fractions. Insoluble-bound phenolic acids accounted for over 90% of the total phenolic acid content. The highest concentration of conjugated phenolic acids was found in einkorn wheat (Triticum monococcum) grain—50.5 mg/kg DM—whereas durum wheat and common wheat contained the highest content of bound phenolic acids, at 651.8 and 629.2 mg/kg DM, respectively. The cultivation year influenced the content of conjugated phenolic acids, whereas it did not significantly affect the levels of bound phenolic acids [26]. Literature reports indicate that the content of phenolic acids and the antioxidant capacity of wheat grain are strongly related to its chemical composition and the distribution of phenols within the grain. Analyses showed that ferulic acid is the predominant compound in both conjugated and insoluble-bound fractions, with the insoluble fractions accounting for over 90% of the total phenolic acid content [27]. Individual wheat species show varied phenolic content: einkorn wheat has the highest concentration of conjugated phenolic acids, whereas durum and common wheat contain the highest levels of bound phenolic acids. Moreover, polyphenol content and antioxidant capacity are higher in the germ and pericarp than in the endosperm, and the total antioxidant activity is strongly correlated with phenolic acid levels. In our study, polyphenol content did not change significantly, yet differences were observed in antioxidant capacity, measured by ABTS+ and DPPH methods, suggesting that factors other than total phenolic content determined the radical scavenging capacity. One possible explanation is a change in the phenolic profile rather than in their total quantity. Methods for determining total polyphenols, such as the Folin–Ciocalteu assay, measure the overall content of phenolic compounds without distinguishing individual fractions [18,20]. Fertilization may have influenced the proportions of phenolic acids, such as ferulic, p-coumaric, and sinapic acids, altered the balance between free and fiber-bound forms, and affected the biological activity of individual components without changing the total polyphenol contents [8,21]. As a result, the total polyphenol content remained similar, but their composition, i.e., the phenolic profile, differed, directly affecting the radical scavenging capacity [6]. Differences in antioxidant activity may have also resulted from the contribution of antioxidants other than polyphenols. In wheat grain, tocopherols and tocotrienols, carotenoids, antioxidant peptides and proteins, as well as nitrogen-containing compounds, produced in response to fertilization, play an important role. The type of nitrogen fertilizer can modify nitrogen and carbon metabolism, affecting the synthesis of reducing compounds independently of total phenolic contents [5,9,13]. Our study has confirmed that both genotype and fertilization practices influence the antioxidant potential of winter and spring wheat grain, as measured by DPPH radical scavenging capacity. In winter wheat, the interaction between hybrid and fertilizer type was significant, with the highest radical scavenging capacity recorded for hybrid A3 following the application of fertilizer B3 (2.864 mmol TX/g grain DM) and fertilizer B5 (2.867 mmol TX/g grain DM). The mean values for the entire experiment were 2.637 mmol TX/g grain DM for winter wheat and 2.611 mmol TX/g grain DM for spring wheat. These results indicate that the appropriate selection of hybrid and nitrogen fertilization strategy (Nres) can substantially enhance the antioxidant potential of the grain, which is consistent with literature reports linking phenolic content to antioxidant activity. At the same time, the present data highlight the practical importance of agronomic practices in enhancing the functional value of grain, both in terms of nutritional quality and health-promoting potential.

5. Conclusions

The present results indicate that, although total polyphenol content remained relatively stable, the antioxidant capacity of the grain, evaluated using ABTS+ and DPPH radical scavenging assays, was influenced by the genotype × fertilization interaction. This interaction was statistically significant only for winter wheat, indicating that this wheat type is more responsive to agronomic practices with respect to the functional properties of the grain. The modification of antioxidant capacity is likely related to changes in the phenolic profile as well as to the contribution of other antioxidant compounds, which can affect radical scavenging activity independently of total polyphenol content. From a practical perspective, these findings suggest that optimizing nitrogen fertilization in combination with appropriate cultivar selection may represent an effective strategy for enhancing the antioxidant potential of winter wheat. This is of particular relevance for the production of raw materials with improved functional value and for the development of food products with increased antioxidant activity. In contrast, the type of nitrogen fertilizer applied to the preceding crop (maize) did not significantly affect the content of amino acids (cysteine, methionine, and lysine) in the grain of either winter or spring wheat. Furthermore, neither the maize cultivar used as a preceding crop nor the type of nitrogen fertilizer had a significant effect on total polyphenol content in the grains of either wheat type.

Supplementary Materials

The following supporting information can be downloaded at: https://www.mdpi.com/article/10.3390/app16083886/s1; Table S1: Analysis of variance of cysteine content in winter wheat grain; Table S2: Analysis of variance of cysteine content in spring wheat grain; Table S3: Analysis of variance of methionine content in winter wheat grain; Table S4: Analysis of variance of methionine content in spring wheat grain; Table S5: Analysis of variance of lysine content in winter wheat grain; Table S6: Analysis of variance of lysine content in spring wheat grain; Table S7: Analysis of variance of grain lightness component [L*] in winter wheat; Table S8: Analysis of variance of grain lightness component [L*] in spring wheat; Table S9: Analysis of variance of chlorophyll a content in winter wheat grain; Table S10: Analysis of variance of chlorophyll a content in spring wheat grain; Table S11: Analysis of variance of chlorophyll b content in winter wheat grain; Table S12: Analysis of variance of chlorophyll b content in spring wheat grain; Table S13: Analysis of variance of total polyphenol content in winter wheat grain; Table S14: Analysis of variance of total polyphenol content in spring wheat grain; Table S15: Analysis of variance of ABTS+ cation radical content in winter wheat grain; Table S16: Analysis of variance of ABTS+ cation radical content in spring wheat grain; Table S17: Analysis of variance of DPPH radical scavenging capacity in winter wheat grain; Table S18: Analysis of variance of DPPH radical scavenging capacity in spring wheat grain.

Author Contributions

Conceptualization, P.S. and J.K.-C.; methodology, J.K.-C.; software, K.A.-D.; validation, J.K.-C., K.A.-D. and P.S.; formal analysis, K.A.-D.; investigation, P.S.; resources, J.K.-C.; data curation, K.A.-D.; writing—original draft preparation, P.S.; writing—review and editing, K.A.-D.; visualization, K.A.-D.; supervision, J.K.-C.; project administration, P.S.; funding acquisition, P.S., J.K.-C. and K.A.-D. All authors have read and agreed to the published version of the manuscript.

Funding

This research received no external funding.

Institutional Review Board Statement

Not applicable.

Informed Consent Statement

Not applicable.

Data Availability Statement

The original contributions presented in this study are included in the article/Supplementary Material.

Conflicts of Interest

The authors declare no conflicts of interest.

References

  1. Wu, Z.; Hu, X.; Zhang, X.; He, N.; Wang, X.; Zhang, J.; Xue, X.; Wang, Y.; Xu, S. Advances in understanding wheat grain color: Genetic, nutritional and agronomic perspectives. Agronomy 2025, 15, 1108. [Google Scholar] [CrossRef]
  2. Ali, A.; Niu, G.; Masabni, J.; Ferrante, A.; Cocetta, G. Integrated nutrient management of fruits, vegetables, and crop through the use of biostimulants, sosoillessultivation, and traditional and modern approaches—A mini review. Agriculture 2024, 14, 1330. [Google Scholar]
  3. Sadhukhan, R.; Kumar, D.; Bhupenchandra, I.; Singh, A. Precision nutrient management influences the productivity, nutrient use efficiency, N2O fluxes and soil enzymatic activity in zero-till wheat (Triticum aestivum L.). Field Crops Res. 2024, 317, 109526. [Google Scholar] [CrossRef]
  4. Al-Kofahi, S.D.; Almrahleh, R.Y.; Sawalhah, M.N.; Othman, Y.A. Yield and physiological responses of wheat (Triticum aestivum L.) in relation to different levels of nutrient. S. Afr. J. Bot. 2025, 184, 1051–1061. [Google Scholar] [CrossRef]
  5. Panda, S.K.; Gupta, D.; Patel, M.; Vyver, C.V.D.; Koyama, H. Functionality of reactive oxygen species (ROS) in plants: Toxicity and control in Poaceae crops exposed to abiotic stress. Plants 2024, 13, 2071. [Google Scholar] [CrossRef] [PubMed]
  6. Hussain, S.; Zhang, R.; Liu, S.; Wang, Y.; Ahmad, I.; Chen, Y.; Hou, H.; Dai, Q. Salt stress affects the growth and yield of wheat (Triticum aestivum L.) by altering the antioxidant machinery and expression of hormones and stress-specific genes. Phyton Int. J. Exp. Bot. 2023, 92, 861–881. [Google Scholar]
  7. Ahanger, M.A.; Agarwal, R.M. Salinity stress induced alterations in antioxidant metabolism and nitrogen assimilation in wheat (Triticum aestivum L.) as influenced by potassium supplementation. Plant Physiol. Biochem. 2017, 115, 449–460. [Google Scholar] [CrossRef] [PubMed]
  8. Amessis-Ouchemoukh, N.; Ouchemoukh, S.; Madani, K. Valorization of the whole grains of Triticum aestivum L. and Triticum vulgare L. through the investigation of their biochemical composition and in vitro antioxidant, anti-inflammatory, anticancer and anticalpain activities. J. Cereal Sci. 2017, 75, 179–187. [Google Scholar] [CrossRef]
  9. Fathi, A. Role of nitrogen (N) in plant growth, photosynthesis pigments, and N use efficiency: A review. Agrisost 2022, 28, e3917. [Google Scholar]
  10. Nidhi; Saify, S.; Albaqami, M.; Khan, N.A. Spermine-mediated modulation of ethylene governs photosynthetic efficiency, nitrogen utilization, and heat stress tolerance in wheat (Triticum aestivum L.). Plant Stress 2025, 9, 100240. [Google Scholar] [CrossRef]
  11. Yu, S.Y. The impact of nitrogen fertilization on yield and quality of different wheat varieties. Mol. Soil Biol. 2025, 16, 265–271. [Google Scholar] [CrossRef]
  12. Jarecki, W. Response of winter wheat to delayed sowing and varied nitrogen fertilization. Agriculture 2024, 14, 121. [Google Scholar] [CrossRef]
  13. Zecevic, V.; Knezevic, D.; Boskovic, J.; Micanovic, D.; Dozet, G. Effect of nitrogen fertilization on winter wheat quality. Cereal Res. Commun. 2010, 38, 244–250. [Google Scholar] [CrossRef]
  14. Szulc, P.; Idziak, R.; Ambroży-Deręgowska, K.; Strażyński, P.; Wąsala, R.; Górecki, K. Effect of maize residual nitrogen on grain yield and composition of subsequent wheat crops. Appl. Sci. 2026, 16, 113. [Google Scholar] [CrossRef]
  15. Szulc, P.; Ambroży-Deręgowska, K.; Idziak, R.; Strażyński, P.; Górecki, K.; Wąsala, R. The effect of maize residual nitrogen on nitrogen use efficiency indicators of subsequent wheat crops. Appl. Sci. 2026, 16, 1314. [Google Scholar] [CrossRef]
  16. Gomez, K.A.; Gomez, A.A. Statistical Procedures for Agricultural Research, 2nd ed.; John Wiley & Sons: New York, NY, USA, 1984; p. 680. [Google Scholar]
  17. Cheung, L.M.; Cheung, P.K.C.; Ooi, V.E.C. Antioxidant activity and total phenolic of edible mushrooms extracts. Food Chem. 2003, 81, 249–255. [Google Scholar] [CrossRef]
  18. Amarowicz, R.; Naczk, M.; Shahidi, F. Antioxidant activity of crude tannins of canola and rapeseed hulls. J. Am. Oil Chem. Soc. 2000, 77, 957–961. [Google Scholar] [CrossRef]
  19. Re, R.; Pellegrini, N.; Proteggente, A.; Pannala, A.; Yang, M.; Rice-Evans, C. Antioxidant activity applying an improved ABTS radical cation decolorization assay. Free Radic. Biol. Med. 2019, 26, 1231–1237. [Google Scholar] [CrossRef]
  20. Zheng, C.; Chen, J.P.; Wang, X.W.; Li, P. Reactive oxygen species in plant: Metabolism, signaling, and oxidative modifications. Antioxidants 2025, 14, 617. [Google Scholar] [CrossRef]
  21. Kobus-Cisowska, J.; Szymanowska, D.; Maciejewska, P.; Kmiecik, D.; Gramza-Michałowska, A.; Kulczyński, B.; Cielecka-Piontek, J. In vitro screening for acetylcholinesterase and butyrylcholinesterase inhibition and antimicrobial activity of chia seeds (Salvia hispanica). Electron. J. Biotechnol. 2019, 37, 1–10. [Google Scholar] [CrossRef]
  22. Boutahiri, S.; Benrkia, R.; Tembeni, B.; Idowu, O.E. Effect of biostimulants on the chemical profile of food crops under normal and abiotic stress conditions. Curr. Plant Biol. 2024, 40, 100410. [Google Scholar] [CrossRef]
  23. Rachoń, L.; Cebulak, T.; Krochmal-Marczak, B.; Kapusta, I.; Betlej, I. The phenolic acid content in wheat depending on the intensification of cultivation technology. Foods 2025, 14, 633. [Google Scholar] [CrossRef]
  24. Nowak, R.; Szczepanek, M.; Kobus-Cisowska, J.; Stuper-Szablewska, K.; Graczyk, R.; Błaszczyk, K. Relationships between photosynthetic efficiency and grain antioxidant content of barley genotypes under increasing nitrogen rates. Agriculture 2024, 14, 1913. [Google Scholar] [CrossRef]
  25. Brandolini, A.; Castoldi, P.; Plizzari, L.; Hidalgo, A. Phenolic acids composition, total polyphenols content and antioxidant activity of Triticum monococcum, Triticum turgidum and Triticum aestivum: A two-years evaluation. J. Cereal Sci. 2013, 58, 123–131. [Google Scholar] [CrossRef]
  26. Lee, H.G.; Yang, J.Y.; Ra, J.E.; Ahn, H.J.; Lee, M.J.; Kim, H.Y.; Song, S.Y.; Kim, D.H.; Lee, J.H.; Seo, W.D. Elucidation of phenolic metabolites in wheat seedlings (Triticum aestivum L.) by NMR and HPLC-Q-Orbitrap-MS/MS: Changes in isolated phenolics and antioxidant effects through diverse growth times. Food Chem. 2020, 326, 126929. [Google Scholar] [CrossRef] [PubMed]
  27. Maaz, T.M.C.; Dobermann, A.; Lyons, S.E.; Thomson, A.M. Review of research and innovation on novel fertilizers for crop nutrition. Sustain. Agric. 2025, 3, 25. [Google Scholar] [CrossRef]
Figure 1. Effect of the interaction between nitrogen fertilizer and maize hybrid on ABTS+ cation radical content [mM TX/g grain DM] [2,2′-azino-bis(3-ethylbenzothiazoline-6-sulfonic acid)] in winter wheat grain. Means followed by different letters differ significantly (p < 0.05).
Applsci 16 03886 g001
Figure 2. Effect of the interaction between nitrogen fertilizer type and maize hybrid type on DPPH radical scavenging capacity [mmol TX/g grain DM] [2,2-diphenyl-1-picrylhydrazyl] in winter wheat grain. Means followed by different letters differ significantly (p < 0.05).
Applsci 16 03886 g002
Table 1. Dates of agronomic practices.
Treatment TypeWinter Wheat
2018/2019
Spring Wheat
2020
1. Plowing12 September 201828 November 2019
2. Harrowing-17 March 2020
3. Sowing27 September 201821 March 2020
4. Herbicide treatmentKomplet 560 SC—0.5 L,
17 October 2018
Biathlon 4D—70 g + Dash HC, 18 May 2020
5. Insecticide treatment-Sparviero—0.075 L
10 June 2020
6. Fungicide applicationAmistar 250 SC—0.6 L +
Artea 330 EC—0.4 L,
29 April 2019
Topsin M 500 SC—1.4 L,
25 May 2020
Prosaro 250 EC—1 L,
22 May 2019
Soligor 425 EC—1 L,
6 June 2020
7. Growth regulator applicationCerone 480 SL—0.75 L,
7 May 2019
Ephon Top—0.75 L
4 June 2020
8. Harvest and threshing22 July 201914 August 2020
Table 2. Average monthly air temperature and monthly total precipitation during winter wheat growing season.
YearsXXIXIIIIIIIIIVVVIVIITotal/Average
(X–VII)
Temperature [°C]
2018/20199.74.22.0–0.62.55.49.812.121.718.813.6
Long-term
(2007–2019)
8.64.30.7–1.4–0.53.39.013.717.419.112.5
Precipitation [mm]
2018/2019259522817313721825118
Long-term
(2007–2019)
43383736203426565892232
Table 3. Average monthly air temperature and monthly total precipitation during spring wheat growing season.
YearsAprilMayJuneJulyAugustTotal/Average
(April–August)
Temperature [°C]
20208.010.817.718.219.714.9
Long-term
(2007–2019)
9.013.717.419.119.315.7
Precipitation [mm]
202044516657105377
Long-term
(2007–2019)
2656589260292
Table 4. Effect of the experimental factors on cysteine content in grain [%].
Specification/
Experimental Factor
Factor LevelsWinter WheatSpring Wheat
Year2018/20192020
AA10.206 ± 0.007 ab0.347 ± 0.007 ab
A20.190 ± 0.006 b0.340 ± 0.006 b
A30.225 ± 0.005 a0.360 ± 0.006 a
BB10.198 ± 0.014 ns0.359 ± 0.007 ns
B20.209 ± 0.008 ns0.354 ± 0.007 ns
B30.222 ± 0.008 ns0.343 ± 0.009 ns
B40.215 ± 0.006 ns0.341 ± 0.013 ns
B50.208 ± 0.009 ns0.350 ± 0.012 ns
B60.190 ± 0.012 ns0.351 ± 0.009 ns
B70.205 ± 0.011 ns0.345 ± 0.011 ns
Mean0.2070.349
Data are presented as means ± standard error of mean (SEM). Means followed by different letters differ significantly (p < 0.05); ns—means not significantly different (p > 0.05).
Table 5. Effect of the experimental factors on methionine content [%].
Specification/
Experimental Factor
Factor LevelsWinter WheatSpring Wheat
Year2018/20192020
AA10.170 ± 0.002 ns0.204 ± 0.003 ns
A20.172 ± 0.002 ns0.200 ± 0.003 ns
A30.177 ± 0.003 ns0.212 ± 0.003 ns
BB10.172 ± 0.004 ns0.203 ± 0.005 ns
B20.172 ± 0.003 ns0.211 ± 0.004 ns
B30.174 ±0.003 ns0.211 ± 0.004 ns
B40.172 ± 0.004 ns0.204 ± 0.006 ns
B50.177 ± 0.005 ns0.207 ± 0.005 ns
B60.170 ± 0.003 ns0.206 ± 0.003 ns
B70.172 ± 0.004 ns0.195 ± 0.006 ns
Mean0.1730.205
Data are presented as means ± standard error of mean (SEM); ns—means not significantly different (p > 0.05).
Table 6. Effect of the experimental factors on grain lysine content [%].
Specification/
Experimental Factor
Factor LevelsWinter WheatSpring Wheat
Year2018/20192020
AA10.3645 ± 0.0198 ns0.5921 ± 0.0352 ns
A20.2934 ± 0.0203 ns0.5550 ± 0.0332 ns
A30.3739 ± 0.0234 ns0.5895 ± 0.0290 ns
BB10.3891 ± 0.0329 ns0.6310 ± 0.0437 ns
B20.3443 ± 0.0351 ns0.5859 ± 0.0281 ns
B30.3628 ± 0.0304 ns0.5368 ± 0.0529 ns
B40.3790 ± 0.0206 ns0.5215 ± 0.0630 ns
B50.3025 ± 0.0353 ns0.6034 ± 0.0615 ns
B60.2971 ± 0.0371 ns0.5685 ± 0.0528 ns
B70.3326 ± 0.0421 ns0.6049 ± 0.0405 ns
Mean0.34390.5789
Data are presented as means ± standard error of mean (SEM); ns—means not significantly different (p > 0.05).
Table 7. Effect of the experimental factors on the grain lightness component [L*].
Specification/
Experimental Factor
Factor LevelsWinter WheatSpring Wheat
Year2018/20192020
AA163.36 ± 1.78 ns51.36 ± 0.63 ns
A263.36 ± 1.71 ns49.43 ± 0.51 ns
A363.19 ± 1.78 ns50.84 ± 0.66 ns
BB162.53 ± 2.54 ns50.45 ± 0.48 ns
B269.62 ± 2.90 ns51.53 ± 0.94 ns
B361.99 ± 2.26 ns50.06 ± 1.08 ns
B461.12 ± 2.89 ns49.19 ± 0.98 ns
B561.71 ± 2.92 ns51.43 ± 0.76 ns
B665.51 ± 1.41 ns50.00 ± 1.31 ns
B760.65 ± 2.73 ns51.16 ± 0.93 ns
Mean63.3050.54
Data are presented as means ± standard error of mean (SEM); ns—means not significantly different (p > 0.05); (L* = 0—black, 100—white).
Table 8. Effect of the experimental factors on chlorophyll a content.
Specification/
Experimental Factor
Factor LevelsWinter WheatSpring Wheat
Year2018/20192020
AA115.59 ± 0.97 ns10.88 ± 0.26 ns
A216.82 ± 1.26 ns11.26 ± 0.26 ns
A315.99 ± 0.85 ns10.74 ± 0.30 ns
BB117.16 ± 1.61 ns11.07 ± 0.37 ns
B212.59 ± 1.05 ns10.90 ± 0.44 ns
B320.06 ± 2.92 ns10.87 ± 0.28 ns
B416.39 ± 1.41 ns10.71 ± 0.18 ns
B515.84 ± 1.39 ns11.12 ± 0.39 ns
B615.57 ± 1.01 ns11.05 ± 0.44 ns
B715.36 ± 1.75 ns10.99 ± 0.76 ns
Mean16.1410.96
Data are presented as means ± standard error of mean (SEM); ns—means not significantly different (p > 0.05).
Table 9. Effect of the experimental factors on chlorophyll b content.
Specification/
Experimental Factor
Factor LevelsWinter WheatSpring Wheat
Year2018/20192020
AA132.44 ± 1.13 ns21.39 ± 0.34 ns
A230.92 ± 1.14 ns21.02 ± 0.31 ns
A331.67 ± 1.16 ns20.68 ± 0.28 ns
BB133.89 ± 2.19 ns21.03 ± 0.34 ns
B232.41 ± 1.92 ns21.11 ± 0.32 ns
B329.47 ± 1.69 ns20.86 ± 0.55 ns
B431.29 ± 1.74 ns20.67 ± 0.45 ns
B531.64 ± 1.88 ns21.25 ± 0.35 ns
B632.30 ± 1.01 ns20.89 ± 0.38 ns
B730.75 ± 1.67 ns21.39 ± 0.41 ns
Mean31.6821.03
Data are presented as means ± standard error of mean (SEM); ns—means not significantly different (p > 0.05).
Table 10. Effect of the experimental factors on total polyphenol content [mg/100 g grain].
Specification/
Experimental Factor
Factor LevelsWinter WheatSpring Wheat
Year2018/20192020
AA1152.93 ± 0.85 ns155.61 ± 2.97 ns
A2151.96 ± 0.66 ns156.74 ± 2.26 ns
A3153.39 ± 0.67 ns155.16 ± 3.32 ns
BB1151.37 ± 1.14 ns154.06 ± 4.42 ns
B2154.41 ± 0.53 ns154.91 ± 3.47 ns
B3151.49 ± 1.39 ns155.23 ± 5.07 ns
B4151.94 ± 0.92 ns153.64 ± 3.24 ns
B5152.07 ± 1.04 ns152.92 ± 5.12 ns
B6154.34 ± 0.96 ns155.09 ± 2.76 ns
B7153.71 ± 1.38 ns165.02 ± 5.60 ns
Mean152.76155.84
Data are presented as means ± standard error of mean (SEM); ns—means not significantly different (p > 0.05).
Table 11. Effect of the experimental factors on ABTS+ cation radical content [mM TX/g grain DM] [2,2′-azino-bis(3-ethylbenzothiazoline-6-sulfonic acid)].
Specification/
Experimental Factor
Factor LevelsWinter WheatSpring Wheat
Year2018/20192020
AA11.441 ± 0.092 ns1.541 ± 0.050 ns
A21.419 ± 0.027 ns1.505 ± 0.031 ns
A31.450 ± 0.026 ns1.518 ± 0.037 ns
BB11.440 ± 0.036 ab1.631 ± 0.096 ns
B21.331 ± 0.032 b1.534 ± 0.053 ns
B31.478 ± 0.035 ab1.461 ± 0.044 ns
B41.432 ± 0.053 ab1.532 ± 0.050 ns
B51.485 ± 0.045 a1.440 ± 0.049 ns
B61.411 ± 0.030 ab1.553 ± 0.057 ns
B71.481 ± 0.044 ab1.496 ± 0.056 ns
Mean1.4371.521
Data are presented as means ± standard error of mean (SEM). Means followed by different letters differ significantly (p < 0.05); ns—means not significantly different (p > 0.05).
Table 12. Effect of the experimental factors on DPPH radical scavenging capacity [mmol TX/g grain DM] [2,2-diphenyl-1-picrylhydrazyl].
Specification/
Experimental Factor
Factor LevelsWinter WheatSpring Wheat
Year2018/20192020
AA12.611 ± 0.048 ns2.605 ± 0.078 ns
A22.640 ± 0.052 ns2.618 ± 0.051 ns
A32.660 ± 0.049 ns2.609 ± 0.060 ns
BB12.553 ± 0.092 ns2.702 ± 0.180 ns
B22.522 ± 0.093 ns2.576 ± 0.080 ns
B32.749 ± 0.043 ns2.507 ± 0.062 ns
B42.635 ± 0.079 ns2.699 ± 0.093 ns
B52.743 ± 0.072 ns2.466 ± 0.058 ns
B62.577 ± 0.059 ns2.715 ± 0.044 ns
B72.678 ± 0.059 ns2.610 ± 0.086 ns
Mean2.6372.611
Data are presented as means ± standard error of mean (SEM); ns—means not significantly different (p > 0.05).
Disclaimer/Publisher’s Note: The statements, opinions and data contained in all publications are solely those of the individual author(s) and contributor(s) and not of MDPI and/or the editor(s). MDPI and/or the editor(s) disclaim responsibility for any injury to people or property resulting from any ideas, methods, instructions or products referred to in the content.