1. Introduction
Among lead-free piezoelectric materials, barium titanate (BaTiO3) is one of the most extensively studied ferroelectric and piezoelectric ceramics, owing to its excellent dielectric properties, low processing cost, and compatibility with a wide range of applications. As a lead-free ceramic with a perovskite-type crystal structure, BaTiO3 has become essential in the manufacturing of multilayer ceramic capacitors, sensors, actuators, and electro-optical devices.
One of the most effective approaches for improving or tailoring the properties of BaTiO3 is doping with small amounts of aliovalent elements. The introduction of dopants can significantly influence various characteristics, including the Curie temperature, grain growth behavior, dielectric constant, electrical conductivity, and phase stability. Depending on the type and concentration of the dopant, these effects can be exploited to enhance material performance for specific functional applications.
The novelty of this work lies in the comparative investigation of single-doped and co-doped BaTiO3 powders synthesized under identical conditions, aiming to identify suitable dopant combinations and structural trends for further development of co-doped and multi-doped BaTiO3 materials processed by advanced thermal methods.
Influence of Dopants on the Crystal Lattice and Properties of Barium Titanate
Manganese doping [
1,
2,
3,
4,
5,
6,
7] directly affects the crystal structure of barium titanate through the substitution of titanium ions (Ti
4+) at the octahedral B-sites of the perovskite lattice with lower-valence manganese ions (Mn
2+ or Mn
3+). This substitution requires charge compensation, which is typically achieved through the formation of oxygen vacancies, leading to local lattice distortions and defect–lattice interactions. The formation of oxygen vacancies associated with Mn acceptor doping in BaTiO
3 has been widely reported and is known to influence grain boundary mobility, defect chemistry, and ferroelectric behavior [
8,
9,
10]. These distortions alter the symmetry of the unit cell and may induce slight variations in the lattice parameters, often resulting in a reduced unit cell volume due to the smaller ionic radius of manganese compared to titanium.
The presence of manganese also tends to stabilize the tetragonal phase at room temperature or to broaden the coexistence region between the tetragonal and cubic phases, depending on dopant concentration and sintering conditions. At higher concentrations, Mn may reduce the tetragonality (c/a ratio), promoting a more diffuse phase transition. The interaction between Mn ions and oxygen vacancies can lead to the formation of stable defect complexes, which reduce defect mobility and influence local dipole orientation, thereby modifying the ferroelectric behavior and the crystal response to electric fields or temperature variations.
Niobium doping [
11,
12,
13,
14,
15,
16,
17,
18,
19] in barium titanate is generally achieved by substituting Ti
4+ ions with Nb
5+ ions at the octahedral B-sites of the perovskite structure. This substitution introduces excess positive charge, which is compensated either by the generation of free electrons or by the reduction of Ti
4+ to Ti
3+, imparting n-type semiconducting behavior to the material. At the crystallographic level, Nb doping results in a slight increase in lattice parameters due to the marginally larger ionic radius of Nb
5+ compared to Ti
4+. Moreover, niobium tends to stabilize the cubic perovskite structure by reducing the degree of tetragonal distortion, leading to a more uniform lattice and lower internal stresses, which contribute to a more homogeneous microstructure.
Lanthanum (La
3+) typically substitutes for barium ions (Ba
2+) at the A-sites of the perovskite lattice and acts as a donor dopant. Charge compensation occurs through the formation of free electrons or the partial reduction of Ti
4+ to Ti
3+, also resulting in n-type semiconducting behavior. Structurally, the incorporation of La
3+ causes a slight contraction of the lattice parameters due to the ionic radius difference between La
3+ and Ba
2+. Lanthanum doping reduces the tetragonal distortion and tends to stabilize the cubic phase at room temperature, an effect associated with decreased spontaneous polarization. At the same time, La doping limits excessive grain growth during sintering, promoting a fine-grained and dense microstructure [
20,
21,
22,
23,
24,
25,
26,
27,
28].
Cerium can exist in two valence states (Ce
3+ and Ce
4+), which leads to complex behavior in the BaTiO
3 lattice. When substituting Ba
2+, Ce
3+ acts as a donor dopant, whereas Ce
4+ substituting Ti
4+ behaves as an isovalent dopant. In both cases, cerium incorporation influences lattice defect chemistry by generating oxygen vacancies and local structural distortions. The main effect is a slight reduction in tetragonality and an increase in lattice symmetry, favoring the transition toward the cubic phase. Additionally, Ce doping enhances structural stability, inhibits grain growth, and reduces pore formation [
29,
30,
31,
32,
33,
34,
35].
Overall, doping with elements such as Mn, Nb, La, and Ce modifies the crystal lattice of barium titanate through controlled ionic substitutions, leading to subtle variations in lattice parameters, symmetry, and defect density. Niobium tends to stabilize the cubic structure and improve electronic conductivity, lanthanum contributes to microstructural control and reduced tetragonal distortion, while cerium introduces redox flexibility and enhances lattice stability under varying thermal conditions. These structural effects are directly reflected in the electrical, dielectric, and ferroelectric properties of the material.
In addition to chemical composition, thermal treatment during synthesis plays a crucial role in determining the final properties of BaTiO
3-based powders [
36]. Calcination temperature significantly affects crystallite growth, densification, and phase formation. Investigating the combined effects of different dopants and calcination temperatures provides valuable insights into the structure–property relationships governing these materials.
Calcination temperature strongly influences the formation of the crystalline phase and the evolution of the microstructure of barium titanate. At 1000 °C, the formation of the BaTiO3 perovskite phase is generally complete; however, the structure may still exhibit residual lattice strains and slightly reduced lattice parameters due to partial crystallization and the presence of residual defects or intermediate phases. Increasing the temperature to 1100 °C results in a more ordered and relaxed crystal lattice, stabilization or slight expansion of lattice parameters, and increased intensity of XRD peaks, indicating higher crystallinity. From a microstructural perspective, higher calcination temperatures promote crystallite and grain growth, reduce porosity, and yield a more uniform and dense microstructure.
The presence of dopants (Mn, Nb, La, and Ce) affects both lattice parameters and grain morphology. Acceptor dopants such as Mn tend to induce lattice contraction and a slight decrease in tetragonality due to Ti4+ substitution by lower-valence ions and the formation of oxygen vacancies. In contrast, donor dopants such as Nb and La may induce minor lattice expansion and reduce tetragonal distortion, thereby stabilizing the cubic phase. Cerium doping, owing to its mixed valence states (Ce3+/Ce4+), produces intermediate effects, contributing to structural stabilization and inhibition of grain growth.
The present experimental study was conducted on nine BaTiO3-based powders: one commercial reference powder and eight laboratory-synthesized samples doped with Mn, Nb, La, or Ce and calcined at 1000 °C and 1100 °C.
In addition to single-doped compositions, two co-doped BaTiO
3 powders (Mn–Nb and La–Nb) were also investigated in order to evaluate the combined effect of acceptor–donor and donor–donor doping on the structural and microstructural evolution of BaTiO
3. Co-doping is known to influence defect chemistry, charge compensation mechanisms, lattice distortion, and grain growth behavior, often leading to improved dielectric and piezoelectric properties compared to single-doped systems. Previous studies have reported that Mn–Nb and La–Nb co-doping in BaTiO
3 can improve dielectric stability, electrical behavior, and microstructural homogeneity due to charge compensation and defect control mechanisms [
37,
38].
Characterization techniques included scanning electron microscopy (SEM), grain size analysis, energy-dispersive X-ray spectroscopy (EDS), elemental mapping, and X-ray diffraction (XRD). The influence of each dopant and processing condition on microstructure, composition, and crystal structure was systematically evaluated. The effect of doping on piezoelectric behavior was assessed by estimating the piezoelectric coefficient d33 as a function of the tetragonality ratio (c/a) and further correlating this ratio with crystallite size.
The objective of this work was not to optimize dopant concentration but to perform a comparative analysis of different dopant types and co-doping strategies under identical processing conditions. Therefore, a fixed dopant concentration and two representative calcination temperatures were selected to allow direct comparison of structural and microstructural evolution. More detailed gradient studies may be explored in future work.
2. Materials and Methods
The synthesis of BaTiO3-based powders was carried out using the conventional solid-state reaction method. As the base material, a high-purity commercial BaTiO3 powder was used (China XIAN FUNCTION MATERIAL GROUP CO., LTD), with a purity of 99.5%, a crystallite size below 5 μm, and a tetragonal crystal structure.
The dopant precursors were introduced in the form of high-purity (≥ 99%) oxides: MnO2 (Sigma-Aldrich, St. Louis, MO, USA), Nb2O5 (Fluka, Buchs, Switzerland), La2O3 (Fluka, Buchs, Switzerland), and CeO2 (Sigma-Aldrich, St. Louis, MO, USA). Each dopant was added at a concentration of 5 at%, substituting ions either at the A-site (Ba2+) or the B-site (Ti4+) of the perovskite structure, depending on the chemical nature of the dopant.
The raw materials were weighed according to the stoichiometric formula to obtain 50 g batches. Distilled water was used as the liquid medium, and mixing was performed in agate recipients using a planetary ball mill (Pulverisette 5, Fritsch GmbH, Idar-Oberstein, Germany) operated at a rotational speed of 150 rpm for 10 h. Agate balls were employed as grinding media, and the mass ratio of powder to balls to water was maintained at 1:1:1.
After homogenization, the resulting slurries were dried in an oven at temperatures between 80 and 105 °C until a residual moisture content of approximately 2% was reached. The dried powders were then sieved and subjected to calcination treatments in air for 2 h at maximum temperatures of 1000 °C and 1100 °C. A heating rate of 200 °C/h was applied up to the maximum temperature. The calcinated powders were re-milled for another 10 h, dried and sieved again.
SEM–EDS analyses were performed using a Hitachi SU5000 (Hitachi High-Tech Corporation, Tokyo, Japan) scanning electron microscope for all the samples. Grain size was determined based on SEM images. Elemental chemical analysis and dopant distribution were evaluated using energy-dispersive X-ray spectroscopy (EDS) and elemental mapping.
Grain size measurements were performed on SEM micrographs using the measurement software integrated in the scanning electron microscope. For each sample, a set of representative grains (typically between 8 and 12 grains) was measured using the equivalent circle diameter approach. The grain size values reported in this study are intended to provide comparative information regarding microstructural evolution among the investigated samples rather than a full statistical grain size distribution, as the primary focus of the work was on structural, crystallographic, and phase evolution induced by doping and calcination temperature.
Qualitative phase analysis by X-ray diffraction (XRD) was carried out using Cu-Kα radiation with a RIGAKU ULTIMA IV diffractometer (Rigaku, Tokyo, Japan). Phase identification, lattice parameter determination, and crystallite size estimation were performed using the PDF-5+ 2025 database (ICDD).
3. Results
The comprehensive experimental evaluation of the nine BaTiO3-based powders reveals clear differences in microstructure, grain growth behavior, dopant incorporation, and crystallographic stability, influenced by both the dopant type and the applied calcination temperature.
The following sections present detailed interpretations of the structural and compositional modifications observed by SEM, EDS, elemental mapping, and XRD for each composition. Finally, the piezoelectric coefficient d33 is estimated based on the structural parameters.
3.1. Commercial BaTiO3 (Undoped)
The commercial undoped BaTiO3 powder serves as the reference material for comparison.
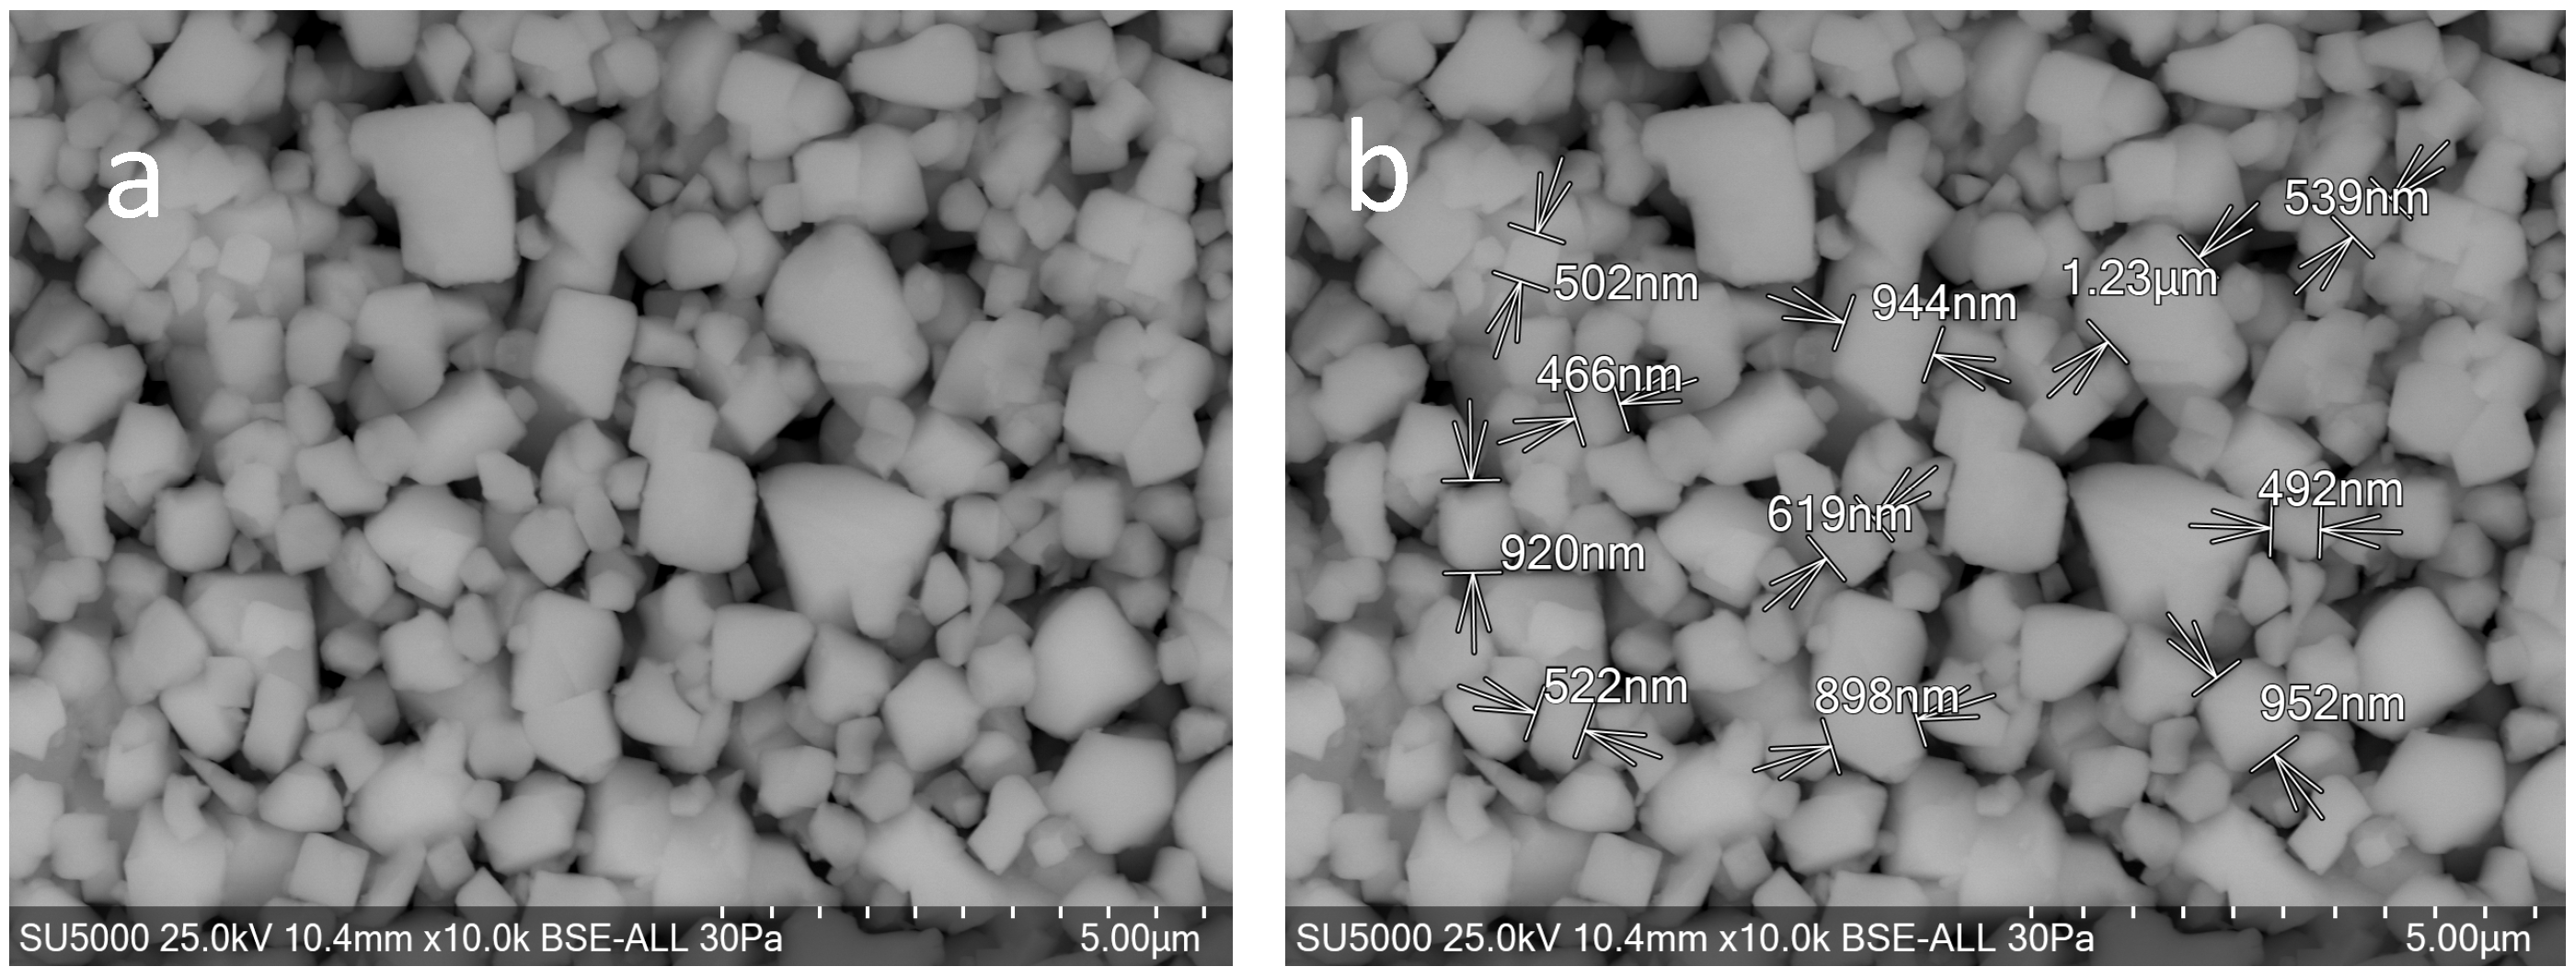
SEM images (
Figure 1a) show a polydisperse and agglomerated morphology, with irregular grain boundaries, characteristic of industrial powders that have not undergone a controlled synthesis process.
Grain size analysis (
Figure 1b) indicates a broad size distribution ranging from 466 nm to 1230 nm. This large dispersion suggests a heterogeneous thermal history.
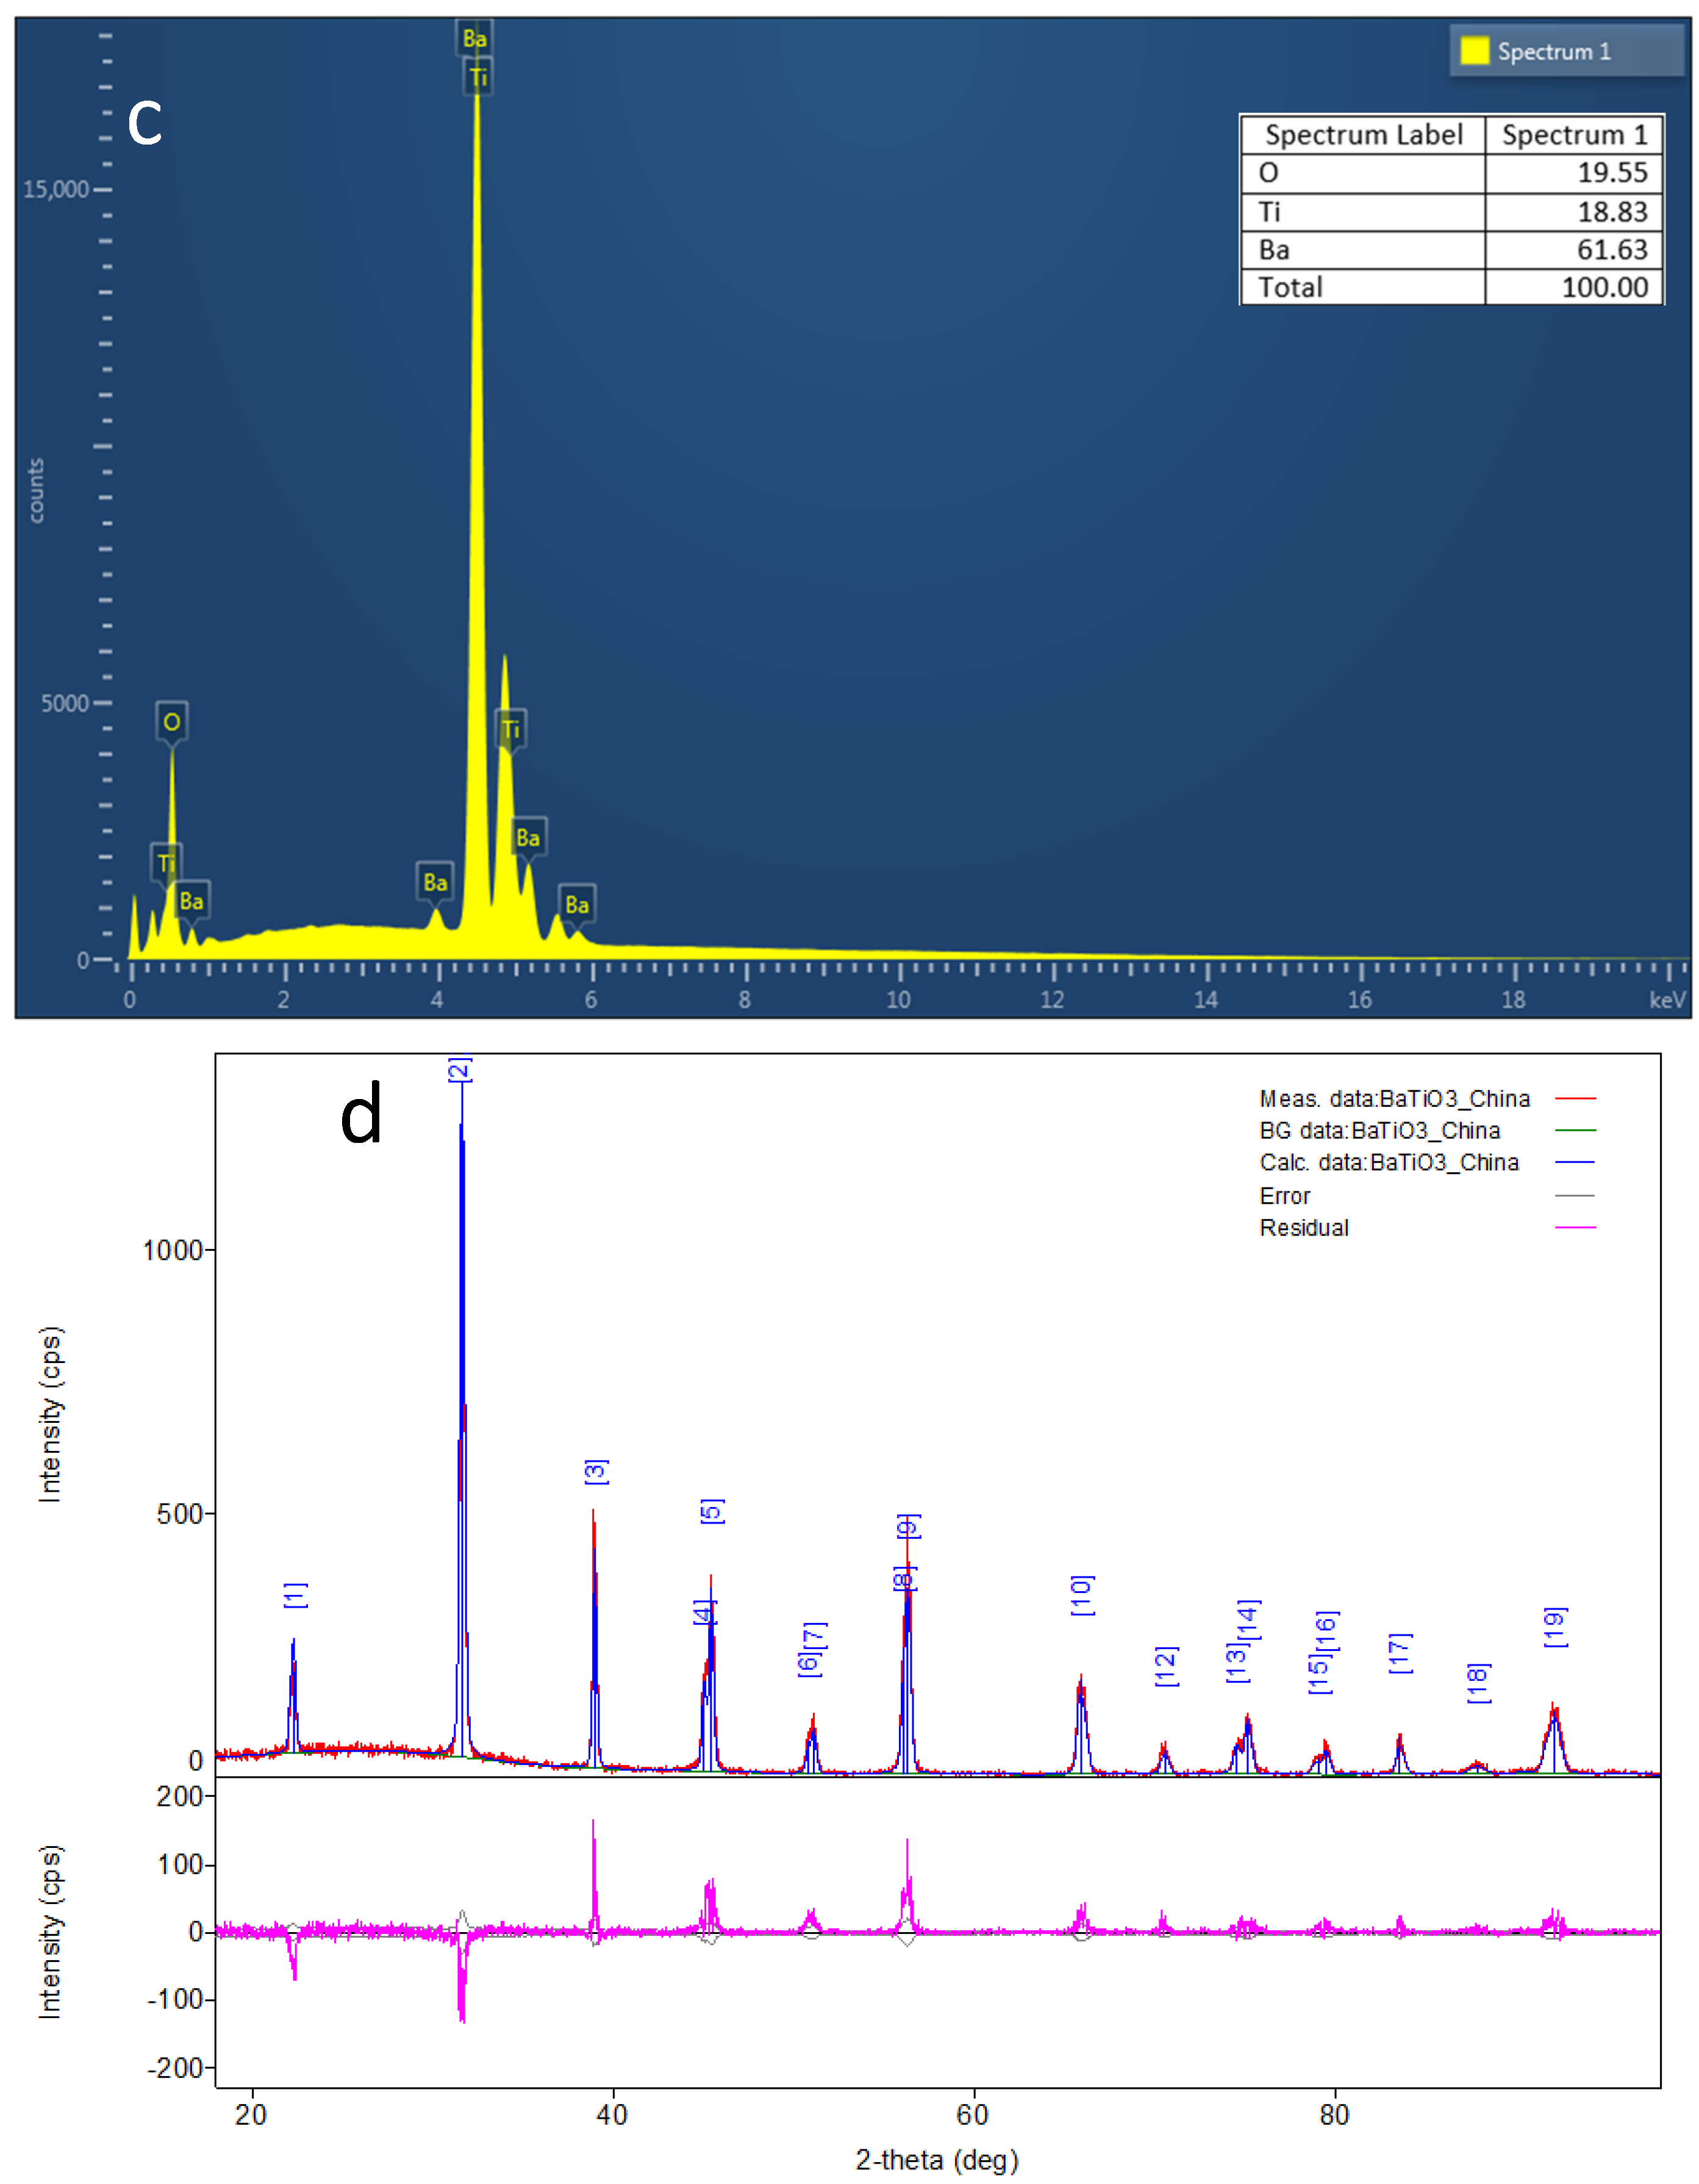
EDS spectra (
Figure 1c) confirm the presence of Ba, Ti, and O in the expected stoichiometric proportions.
The XRD pattern (
Figure 1d) confirms the predominance of the tetragonal BaTiO
3 phase, with lattice parameters a = 3.995 Å and c = 4.028 Å, corresponding to a tetragonality ratio c/a = 1.008.
The obtained c/a ratio indicates ferroelectric behavior, while the crystallite size (~76.7 nm) suggests a moderate thermal treatment.
3.2. BaTi0.95Mn0.05O3 Calcined at 1000 °C
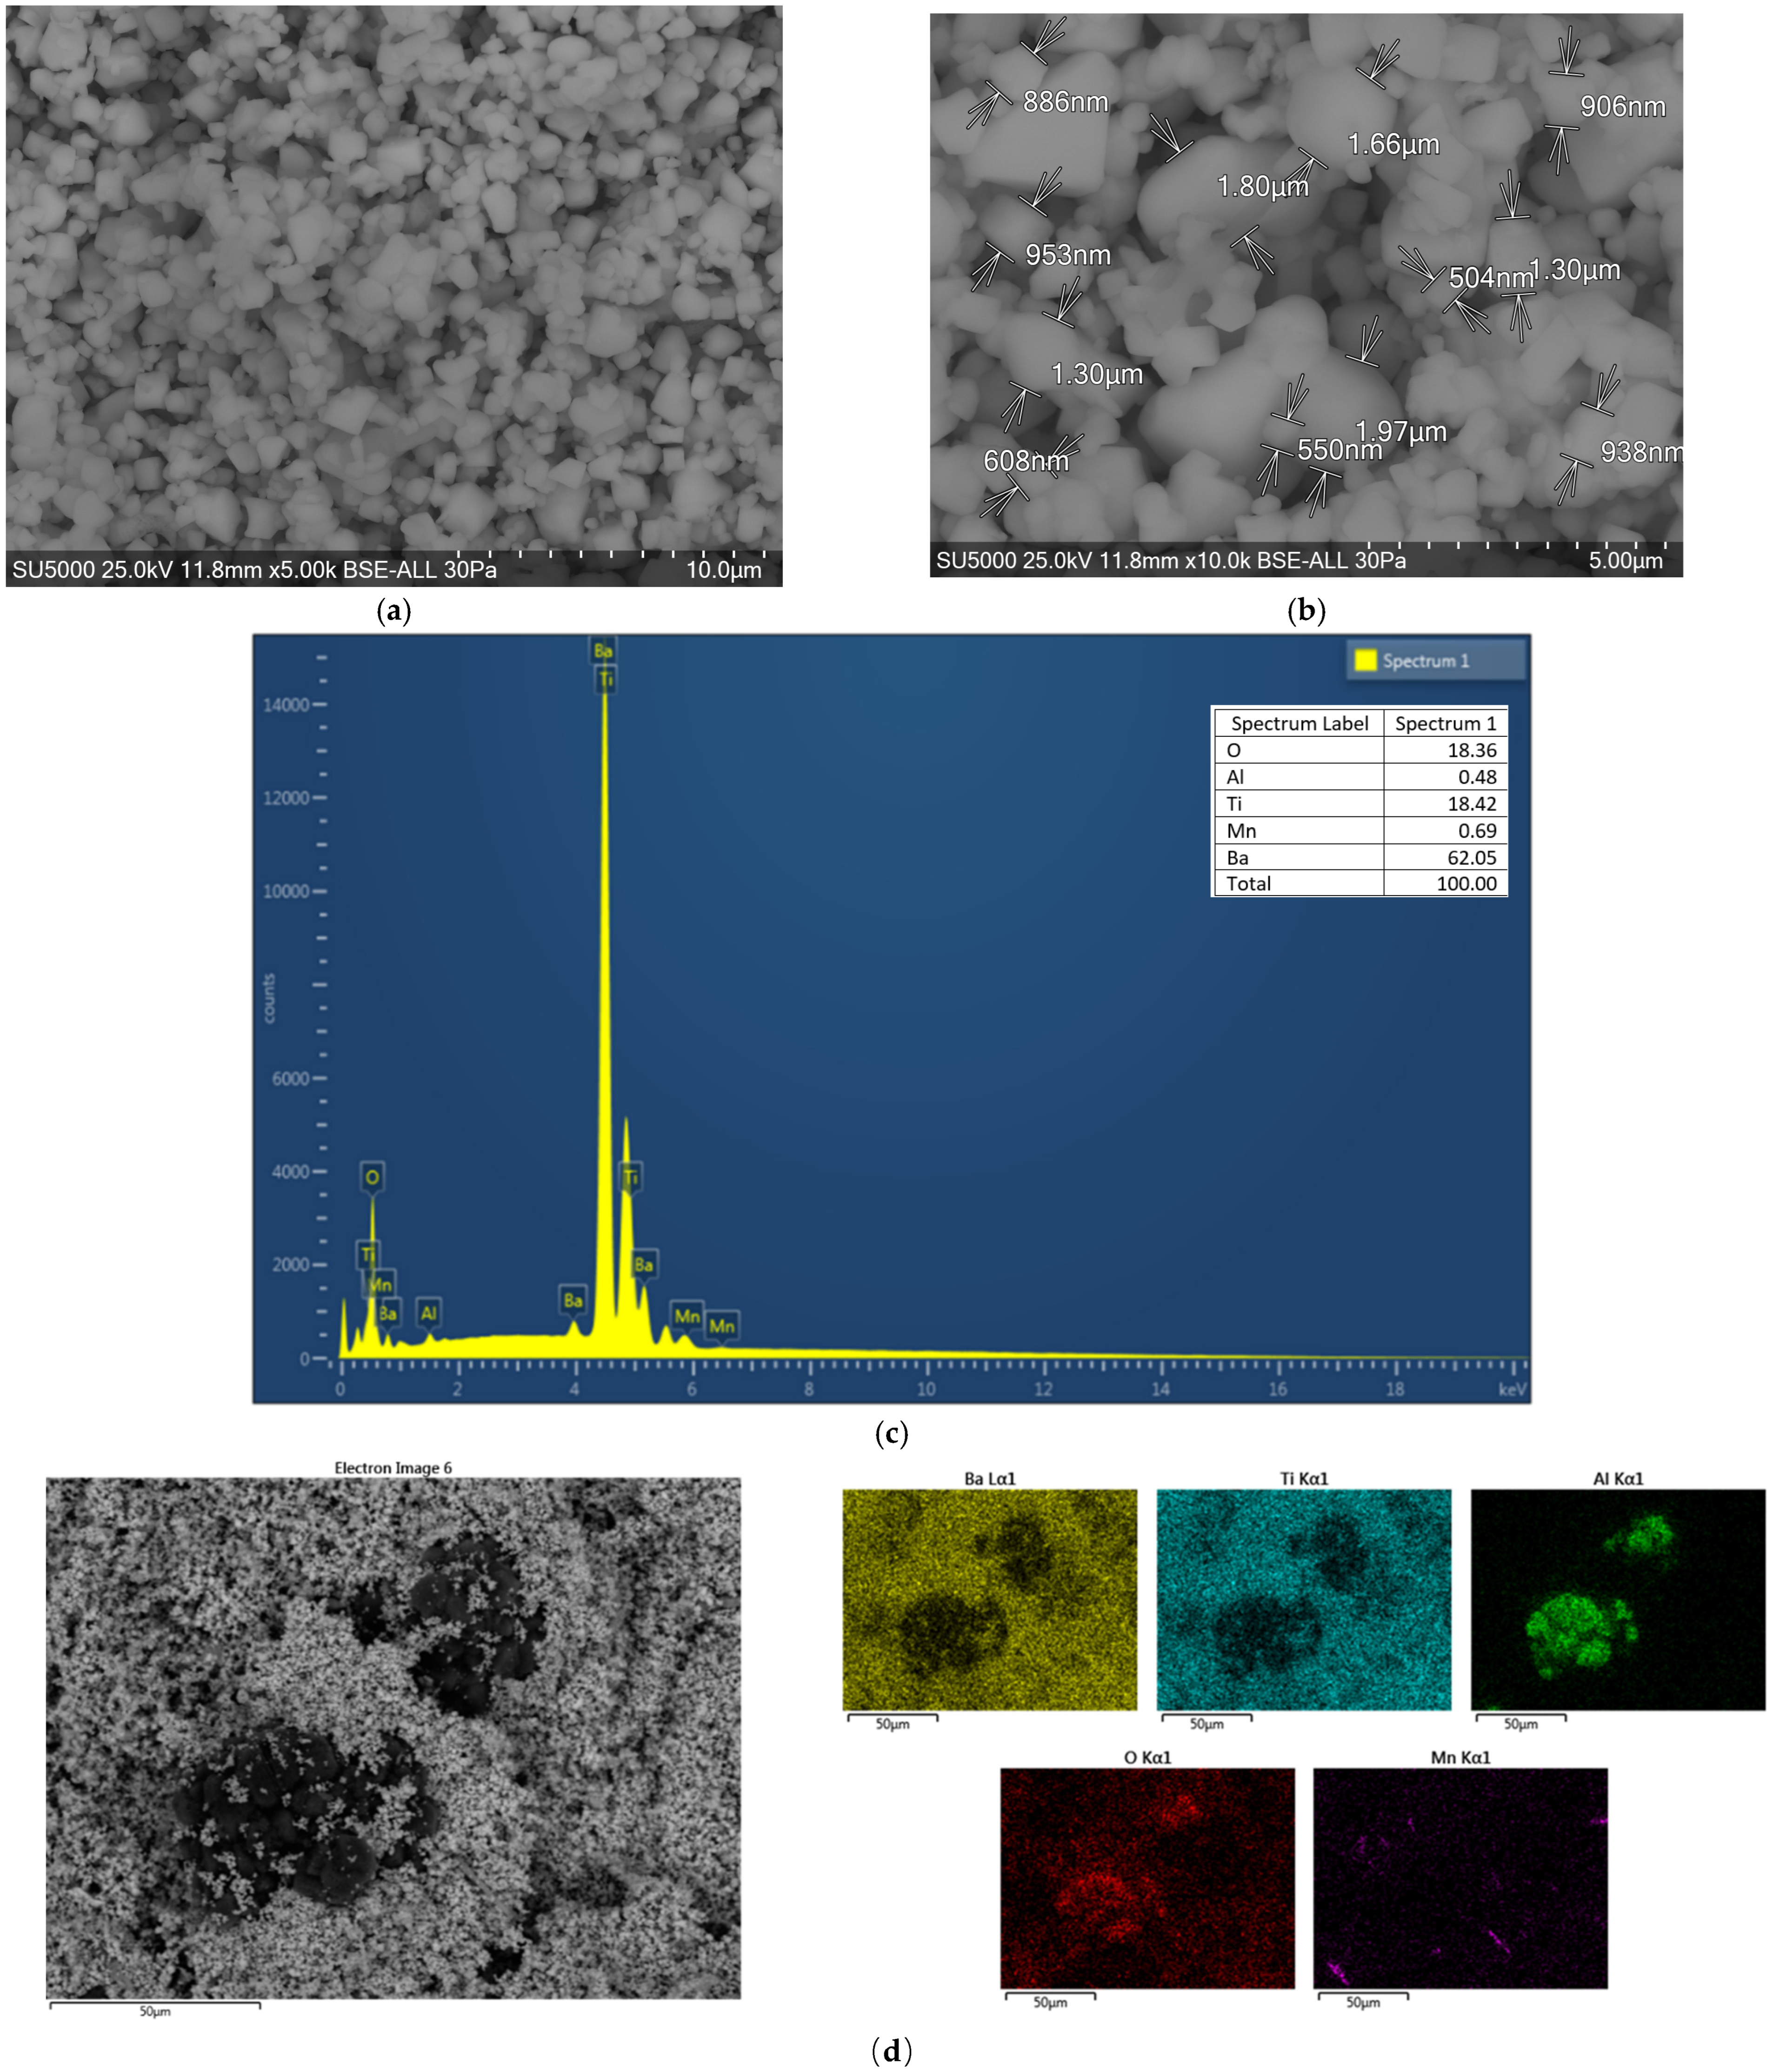
At 1000 °C, the Mn-doped BaTiO
3 powder shows an agglomerated morphology with irregular particles and thermally induced interparticle contacts typical of calcined ceramic powders (
Figure 2a). Grain sizes range from 504 nm to 1970 nm (
Figure 2b), indicating significant grain growth compared to the commercial reference powder.
Manganese, which substitutes Ti4+ ions at the B-site, acts as an acceptor dopant and introduces oxygen vacancies, known to enhance grain boundary mobility.
The EDS spectrum (
Figure 2c) shows distinct Mn peaks along with Ba and Ti, while a minor Al signal is attributed to sample preparation contamination. Elemental mapping (
Figure 2d) confirms a homogeneous distribution of Mn, demonstrating effective dopant incorporation.
XRD analysis (
Figure 2e) indicates the preservation of the tetragonal structure, with lattice parameters a = 3.998 Å and c = 4.034 Å, corresponding to a slightly increased tetragonality (c/a = 1.009) and an increased crystallite size of 91.9 nm. These results suggest that Mn influences both structural distortion and grain development.
3.3. BaTi0.95Mn0.05O3 Calcined at 1100 °C
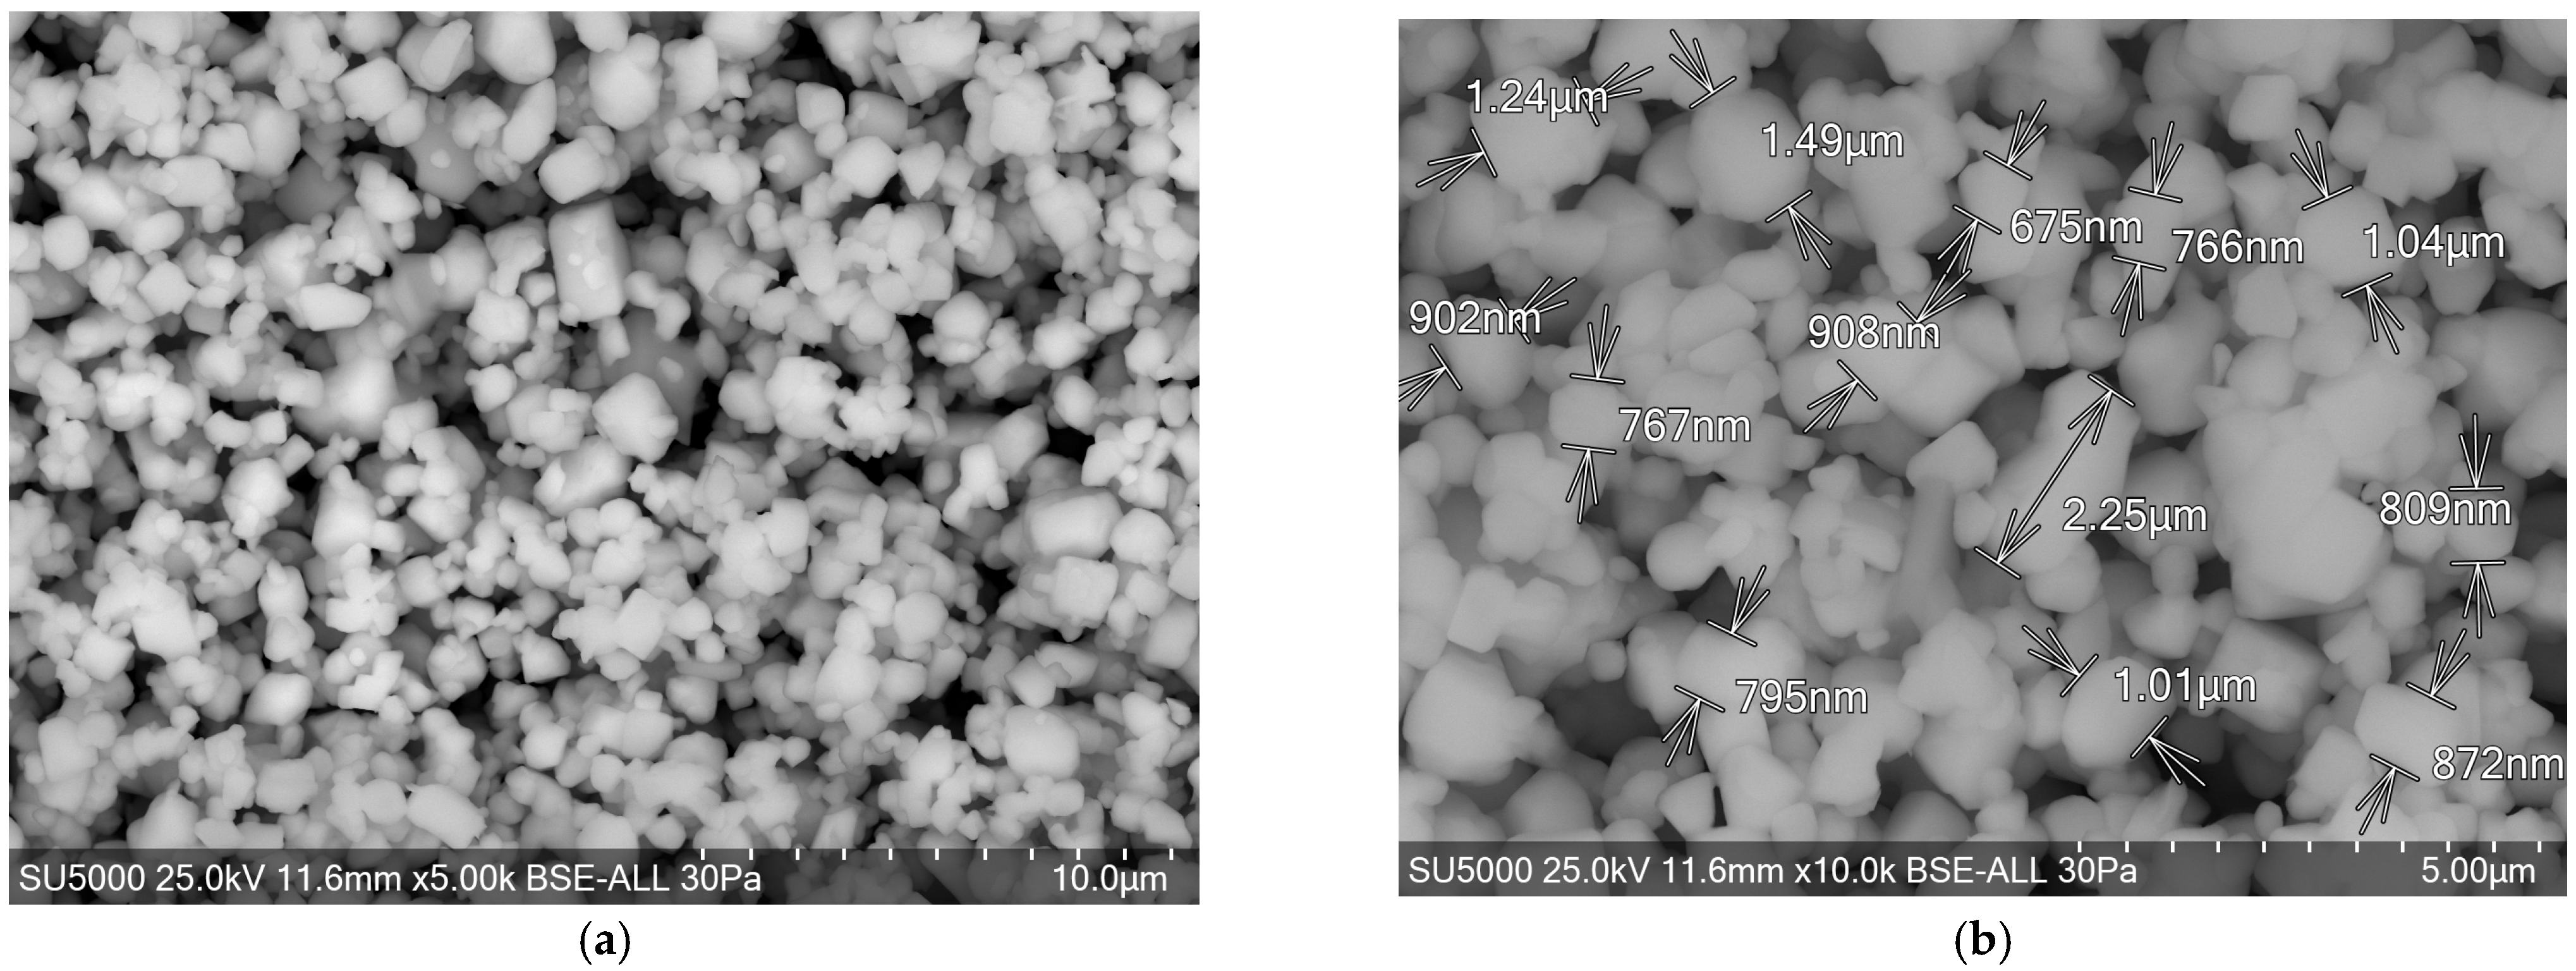
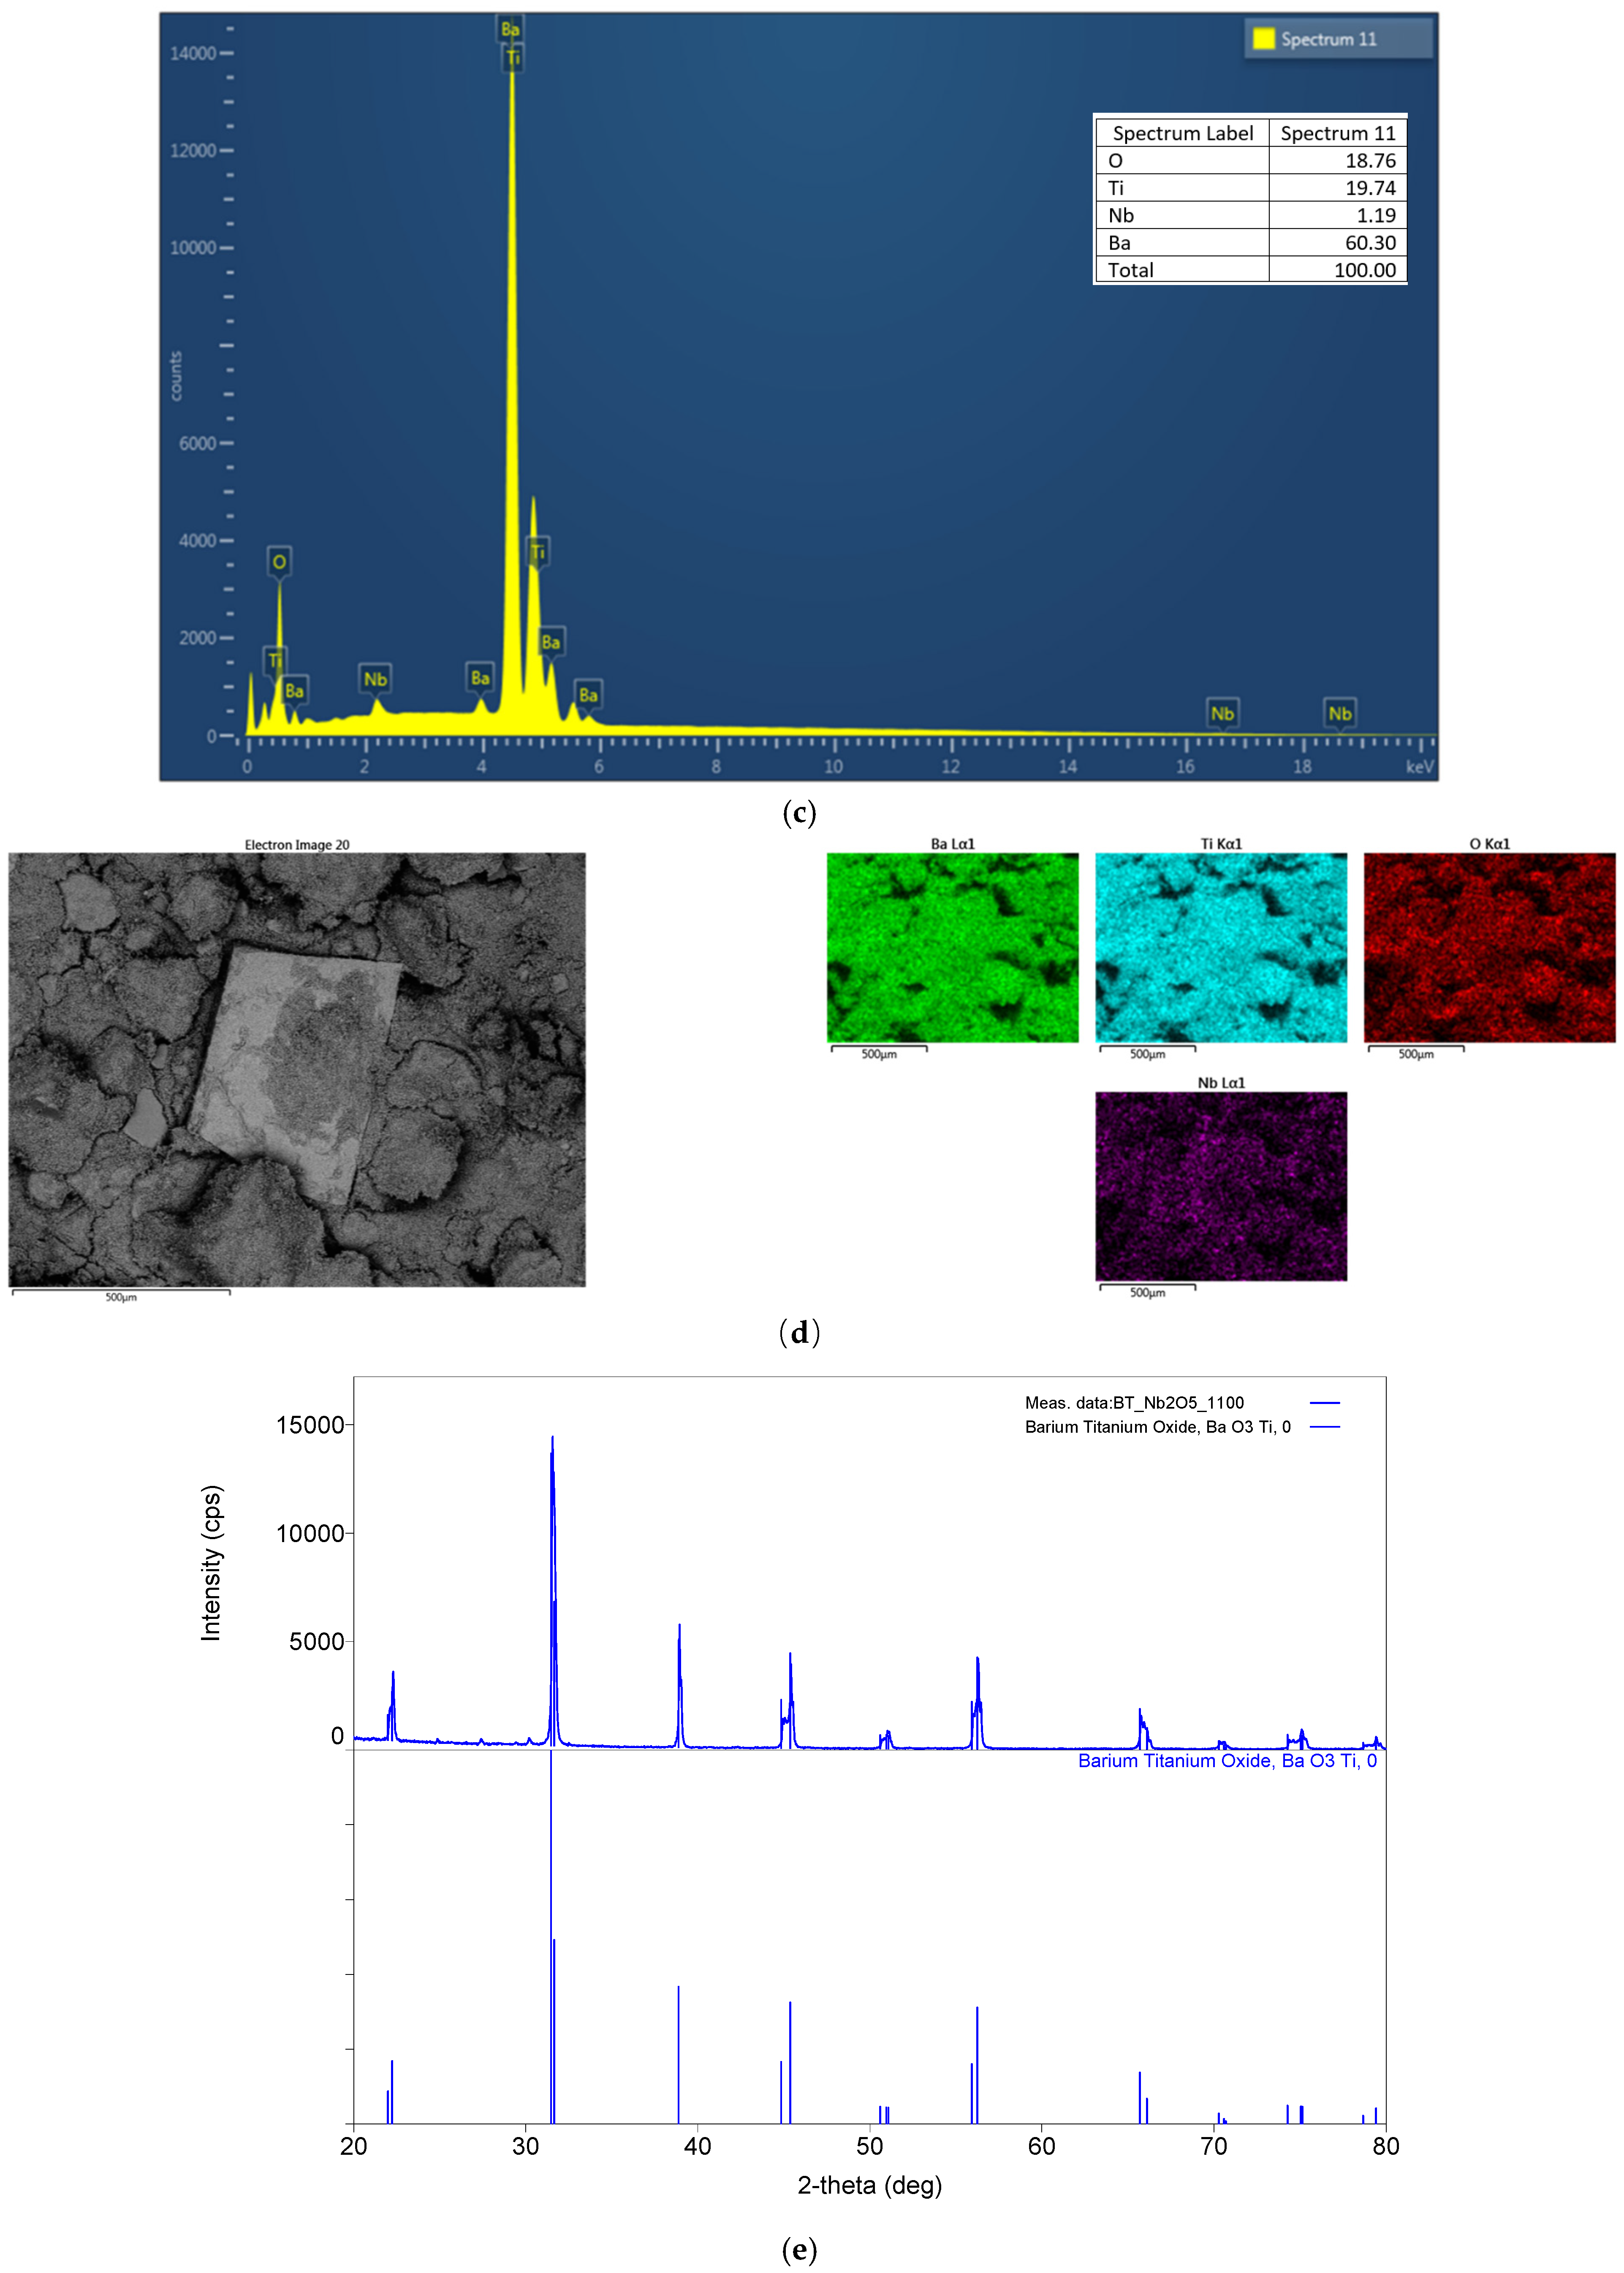
With increasing calcination temperature to 1100 °C, the Mn-doped sample exhibits a more compact microstructure (
Figure 3a), an increase in grain size, with a range that varies from 675 to 2250 nm, indicative of enhanced densification (
Figure 3b).
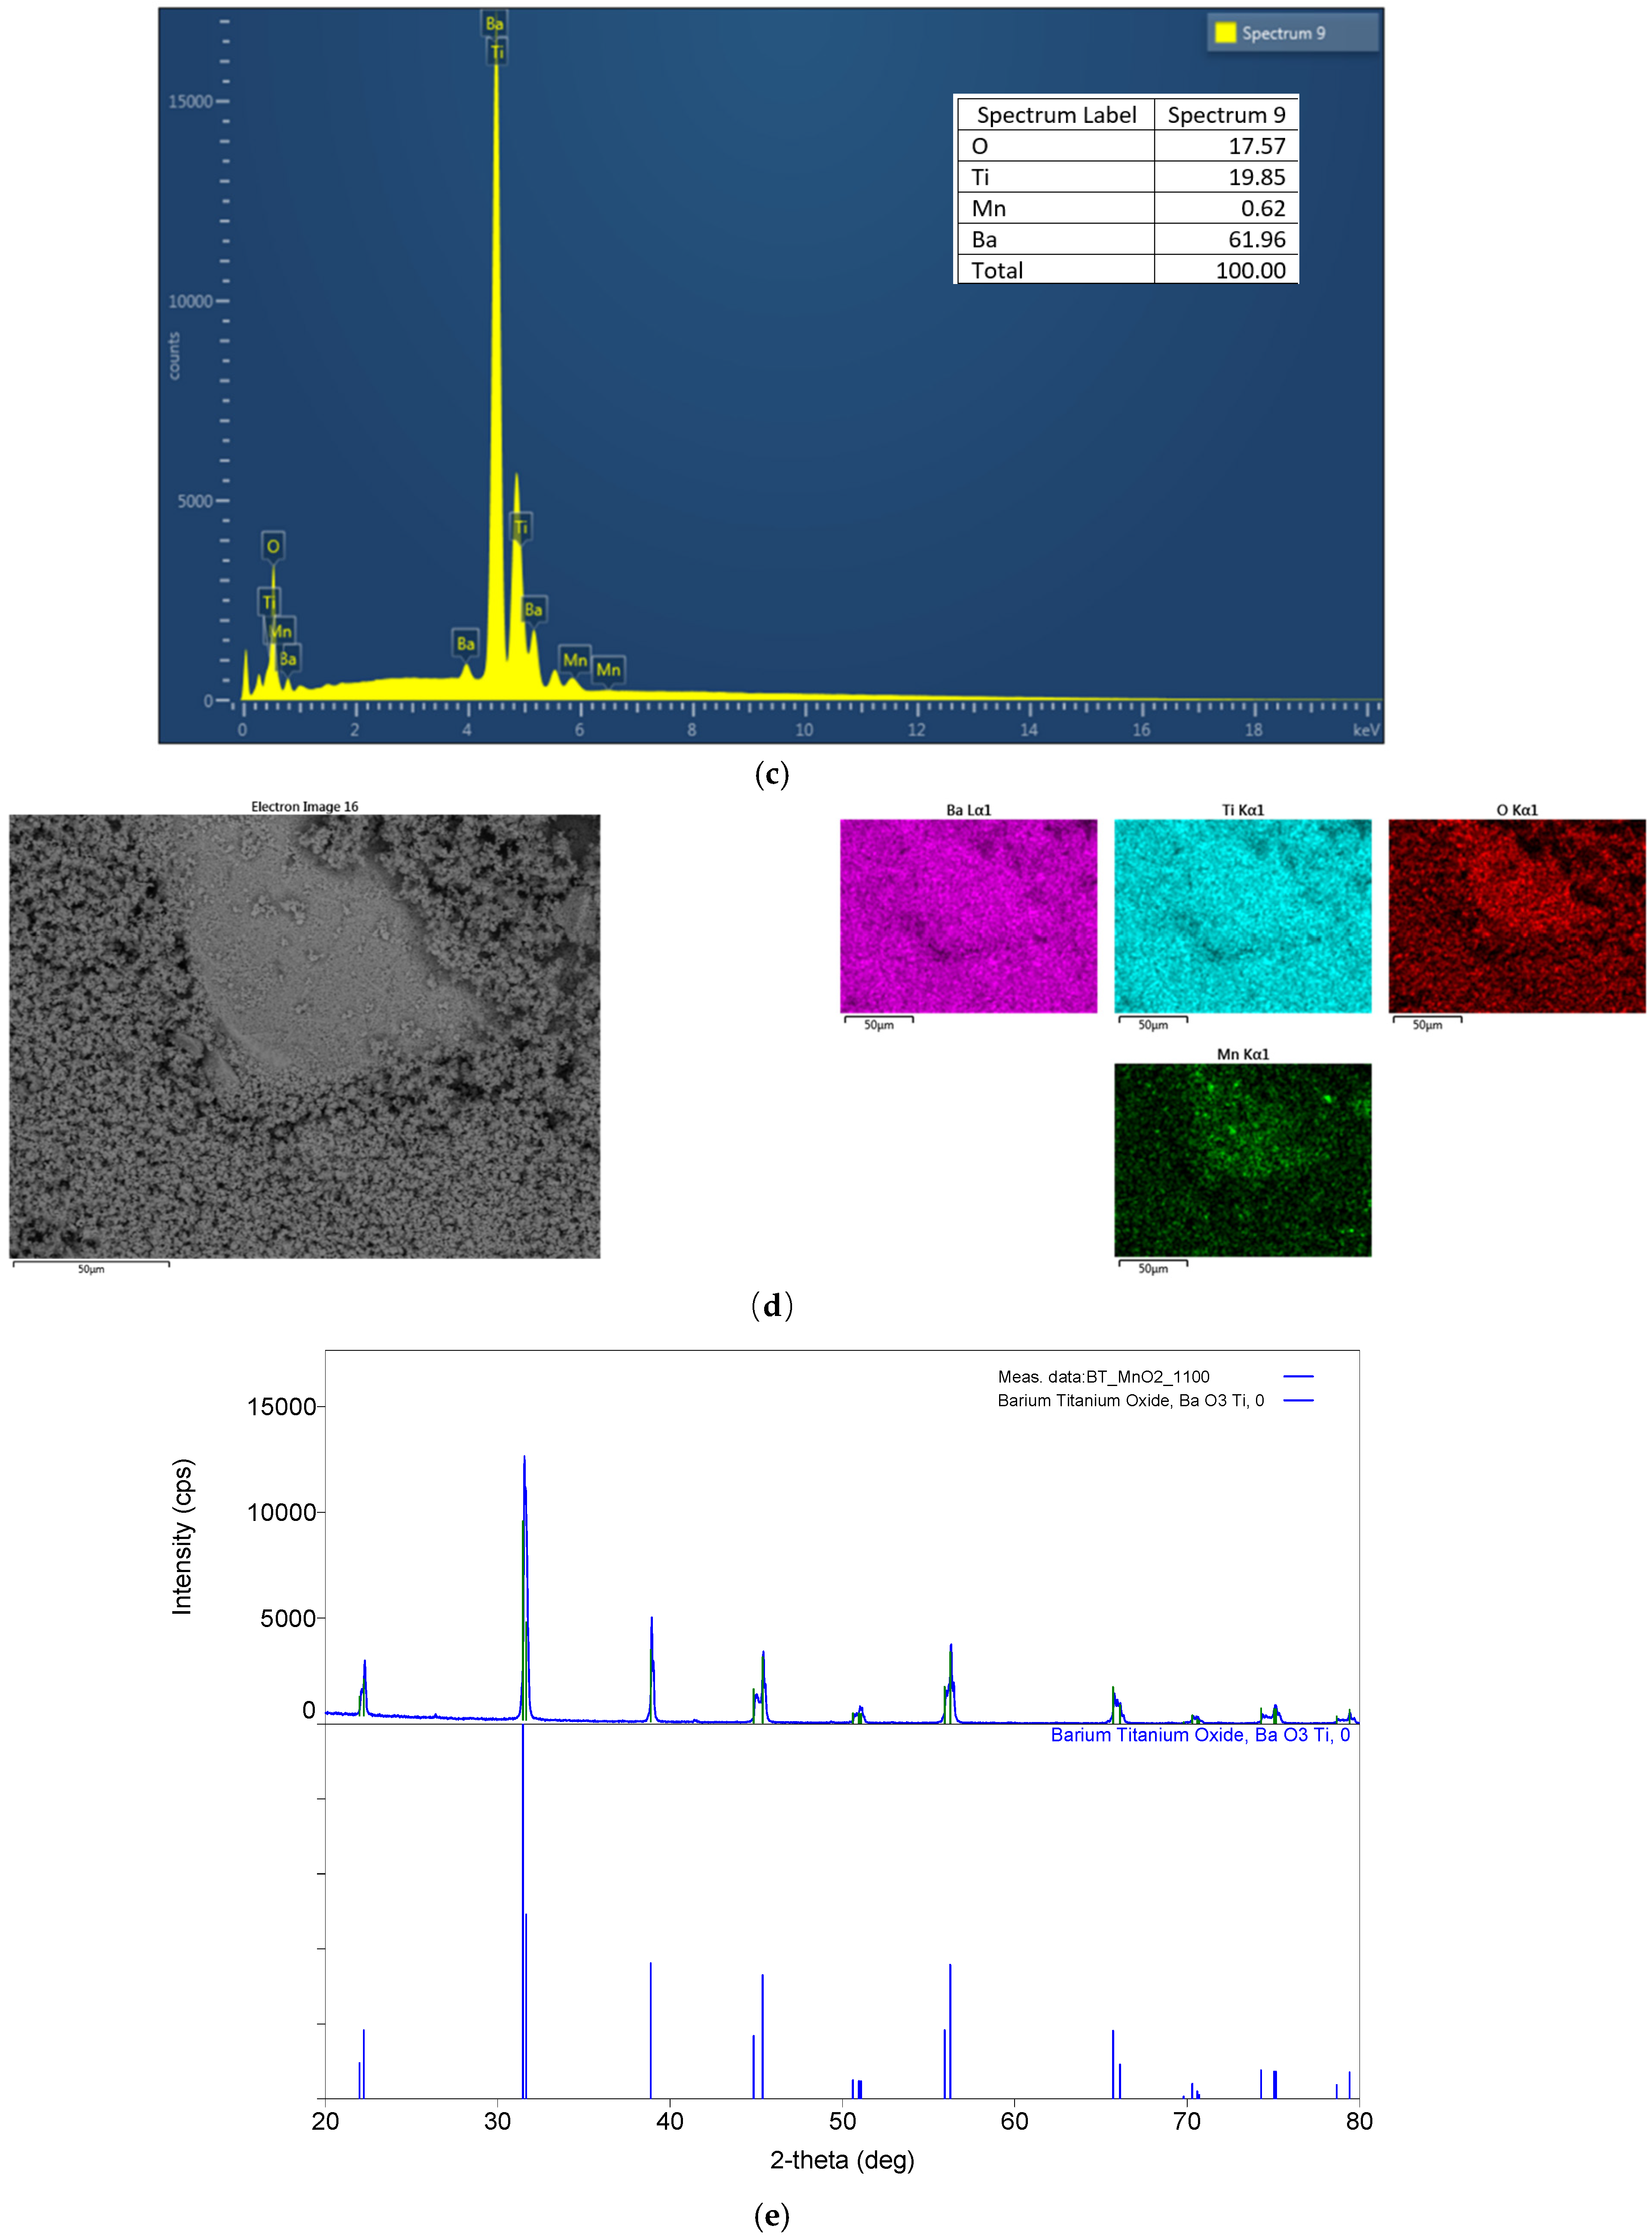
EDS spectra (
Figure 3c) confirm Mn retention, and elemental maps (
Figure 3d) show a uniform dopant distribution.
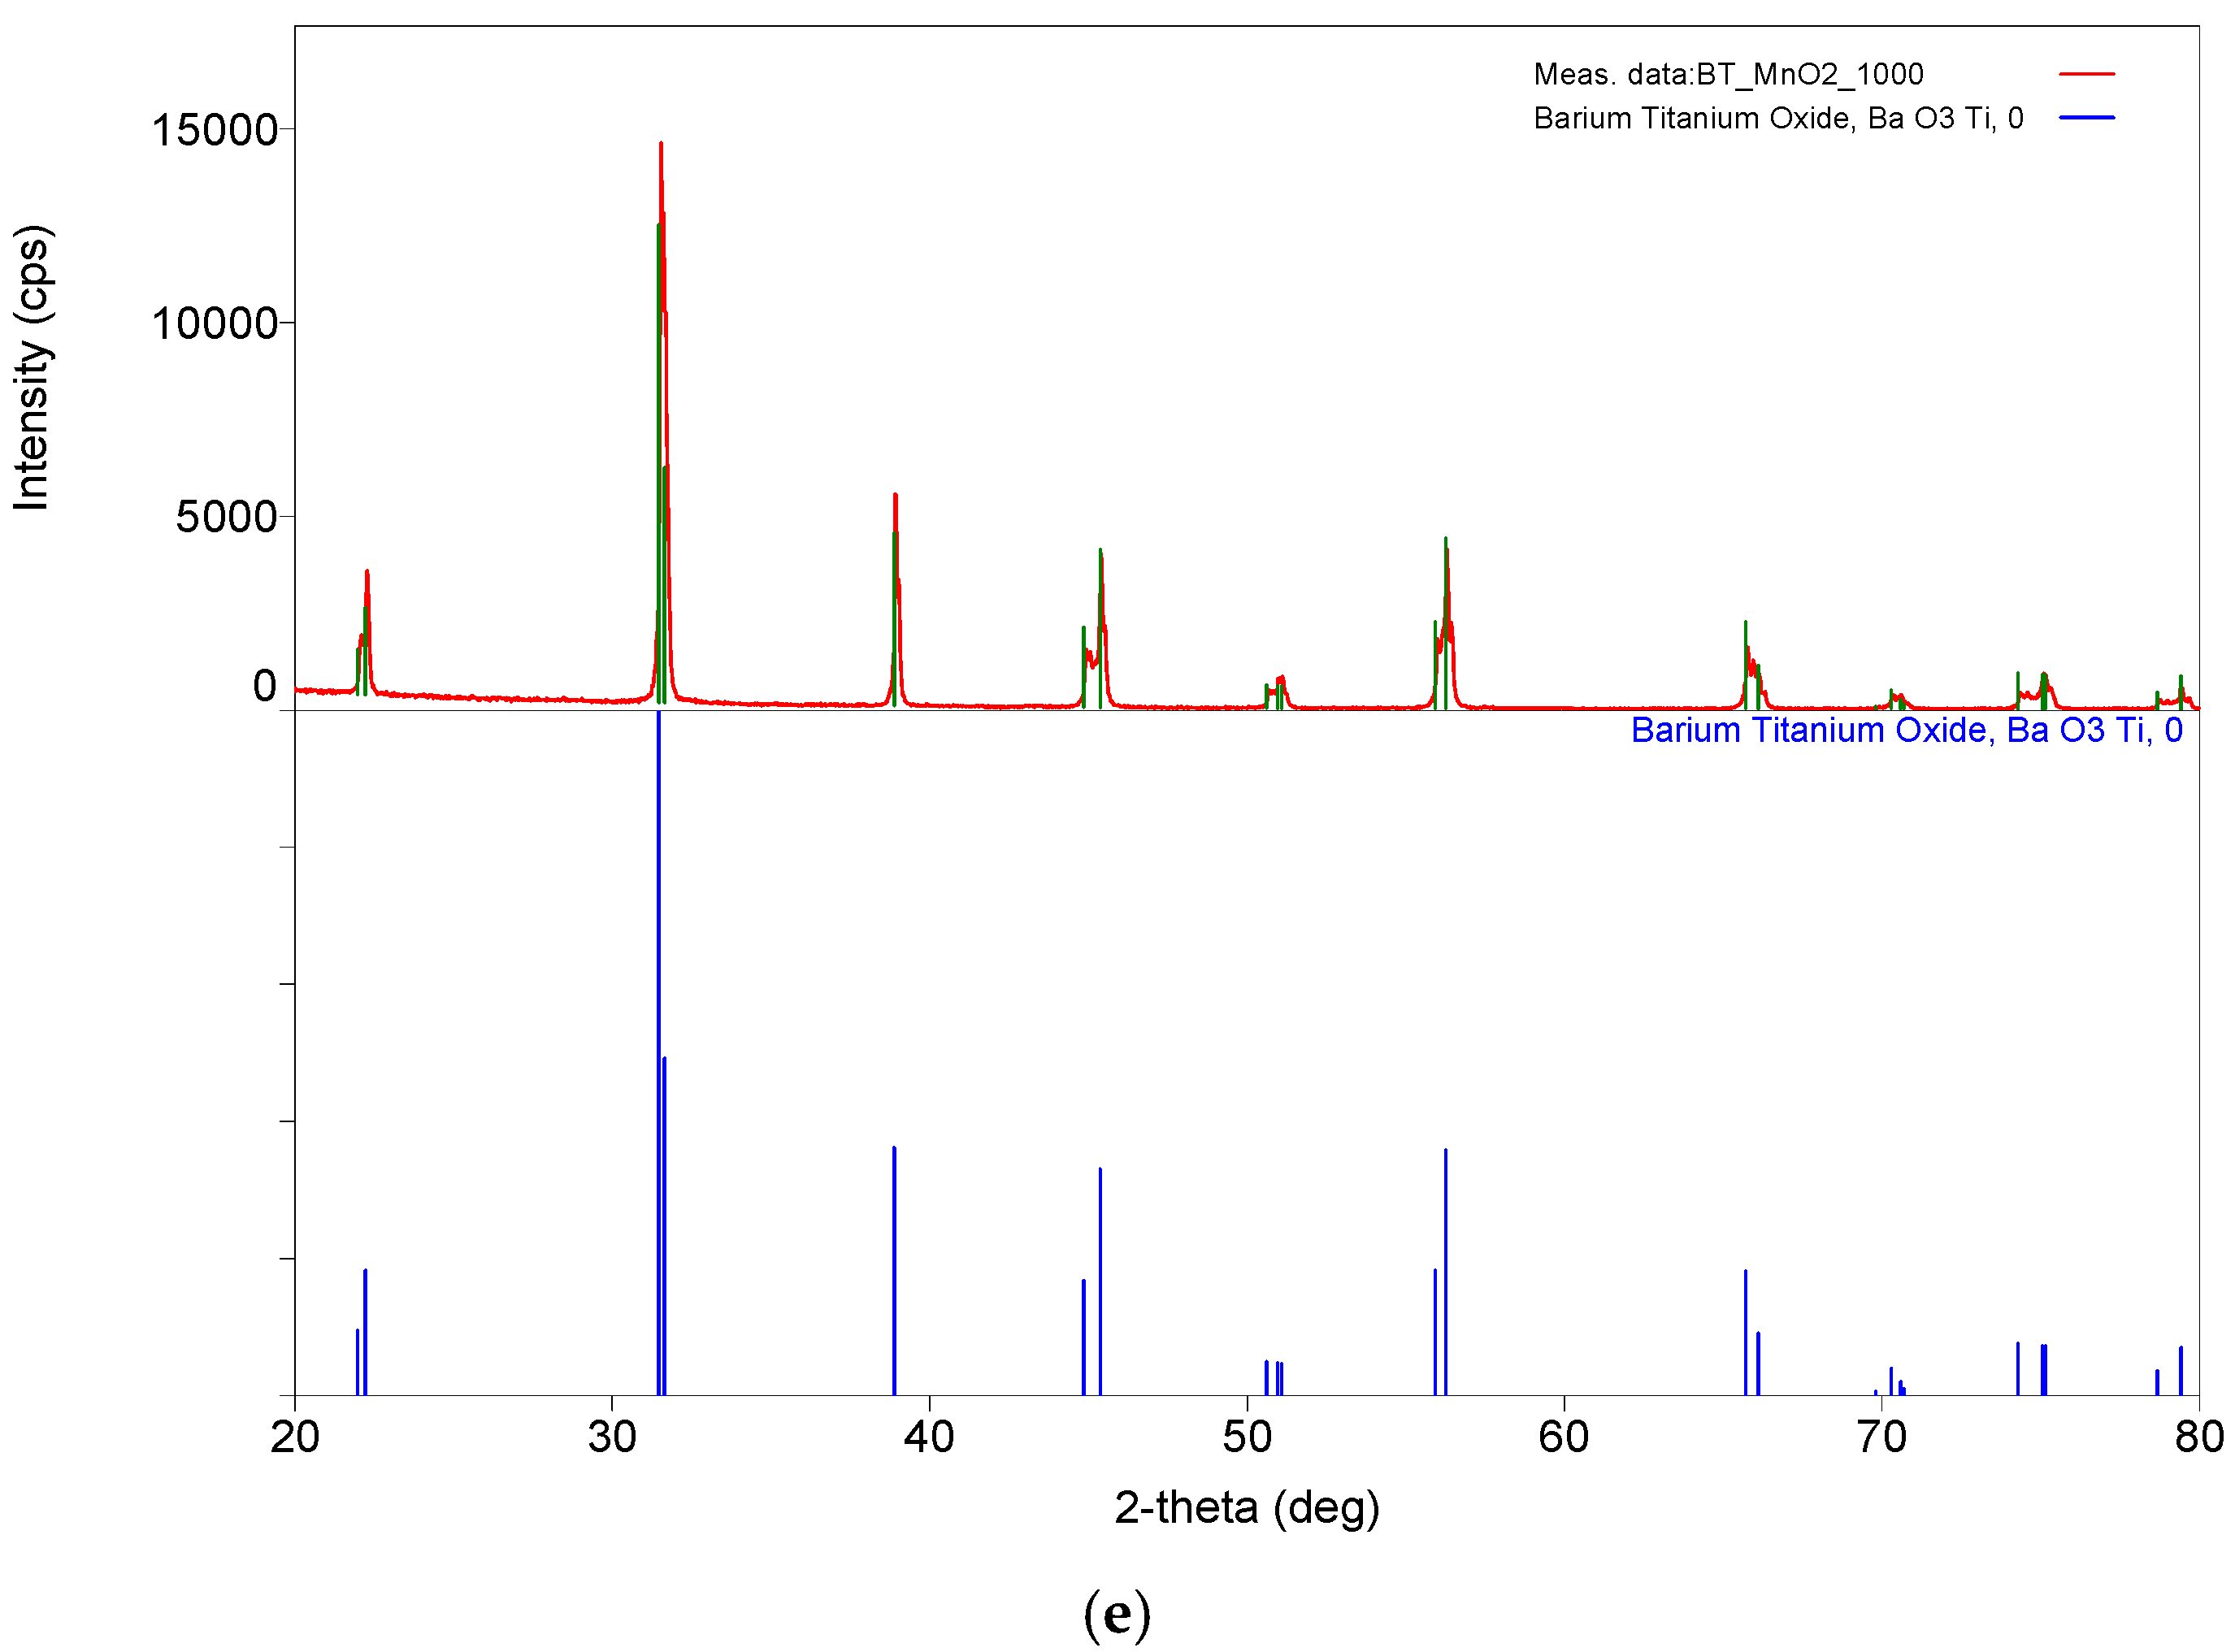
XRD analysis (
Figure 3e) again confirms the tetragonal phase, with lattice parameters a = 3.999 Å and c = 4.033 Å and a tetragonality ratio c/a = 1.0085. The crystallite size decreases to 83.8 nm, suggesting structural reorganization at elevated temperature without excessive particle growth.
3.4. BaTi0.95Nb0.05O3 Calcined at 1000 °C
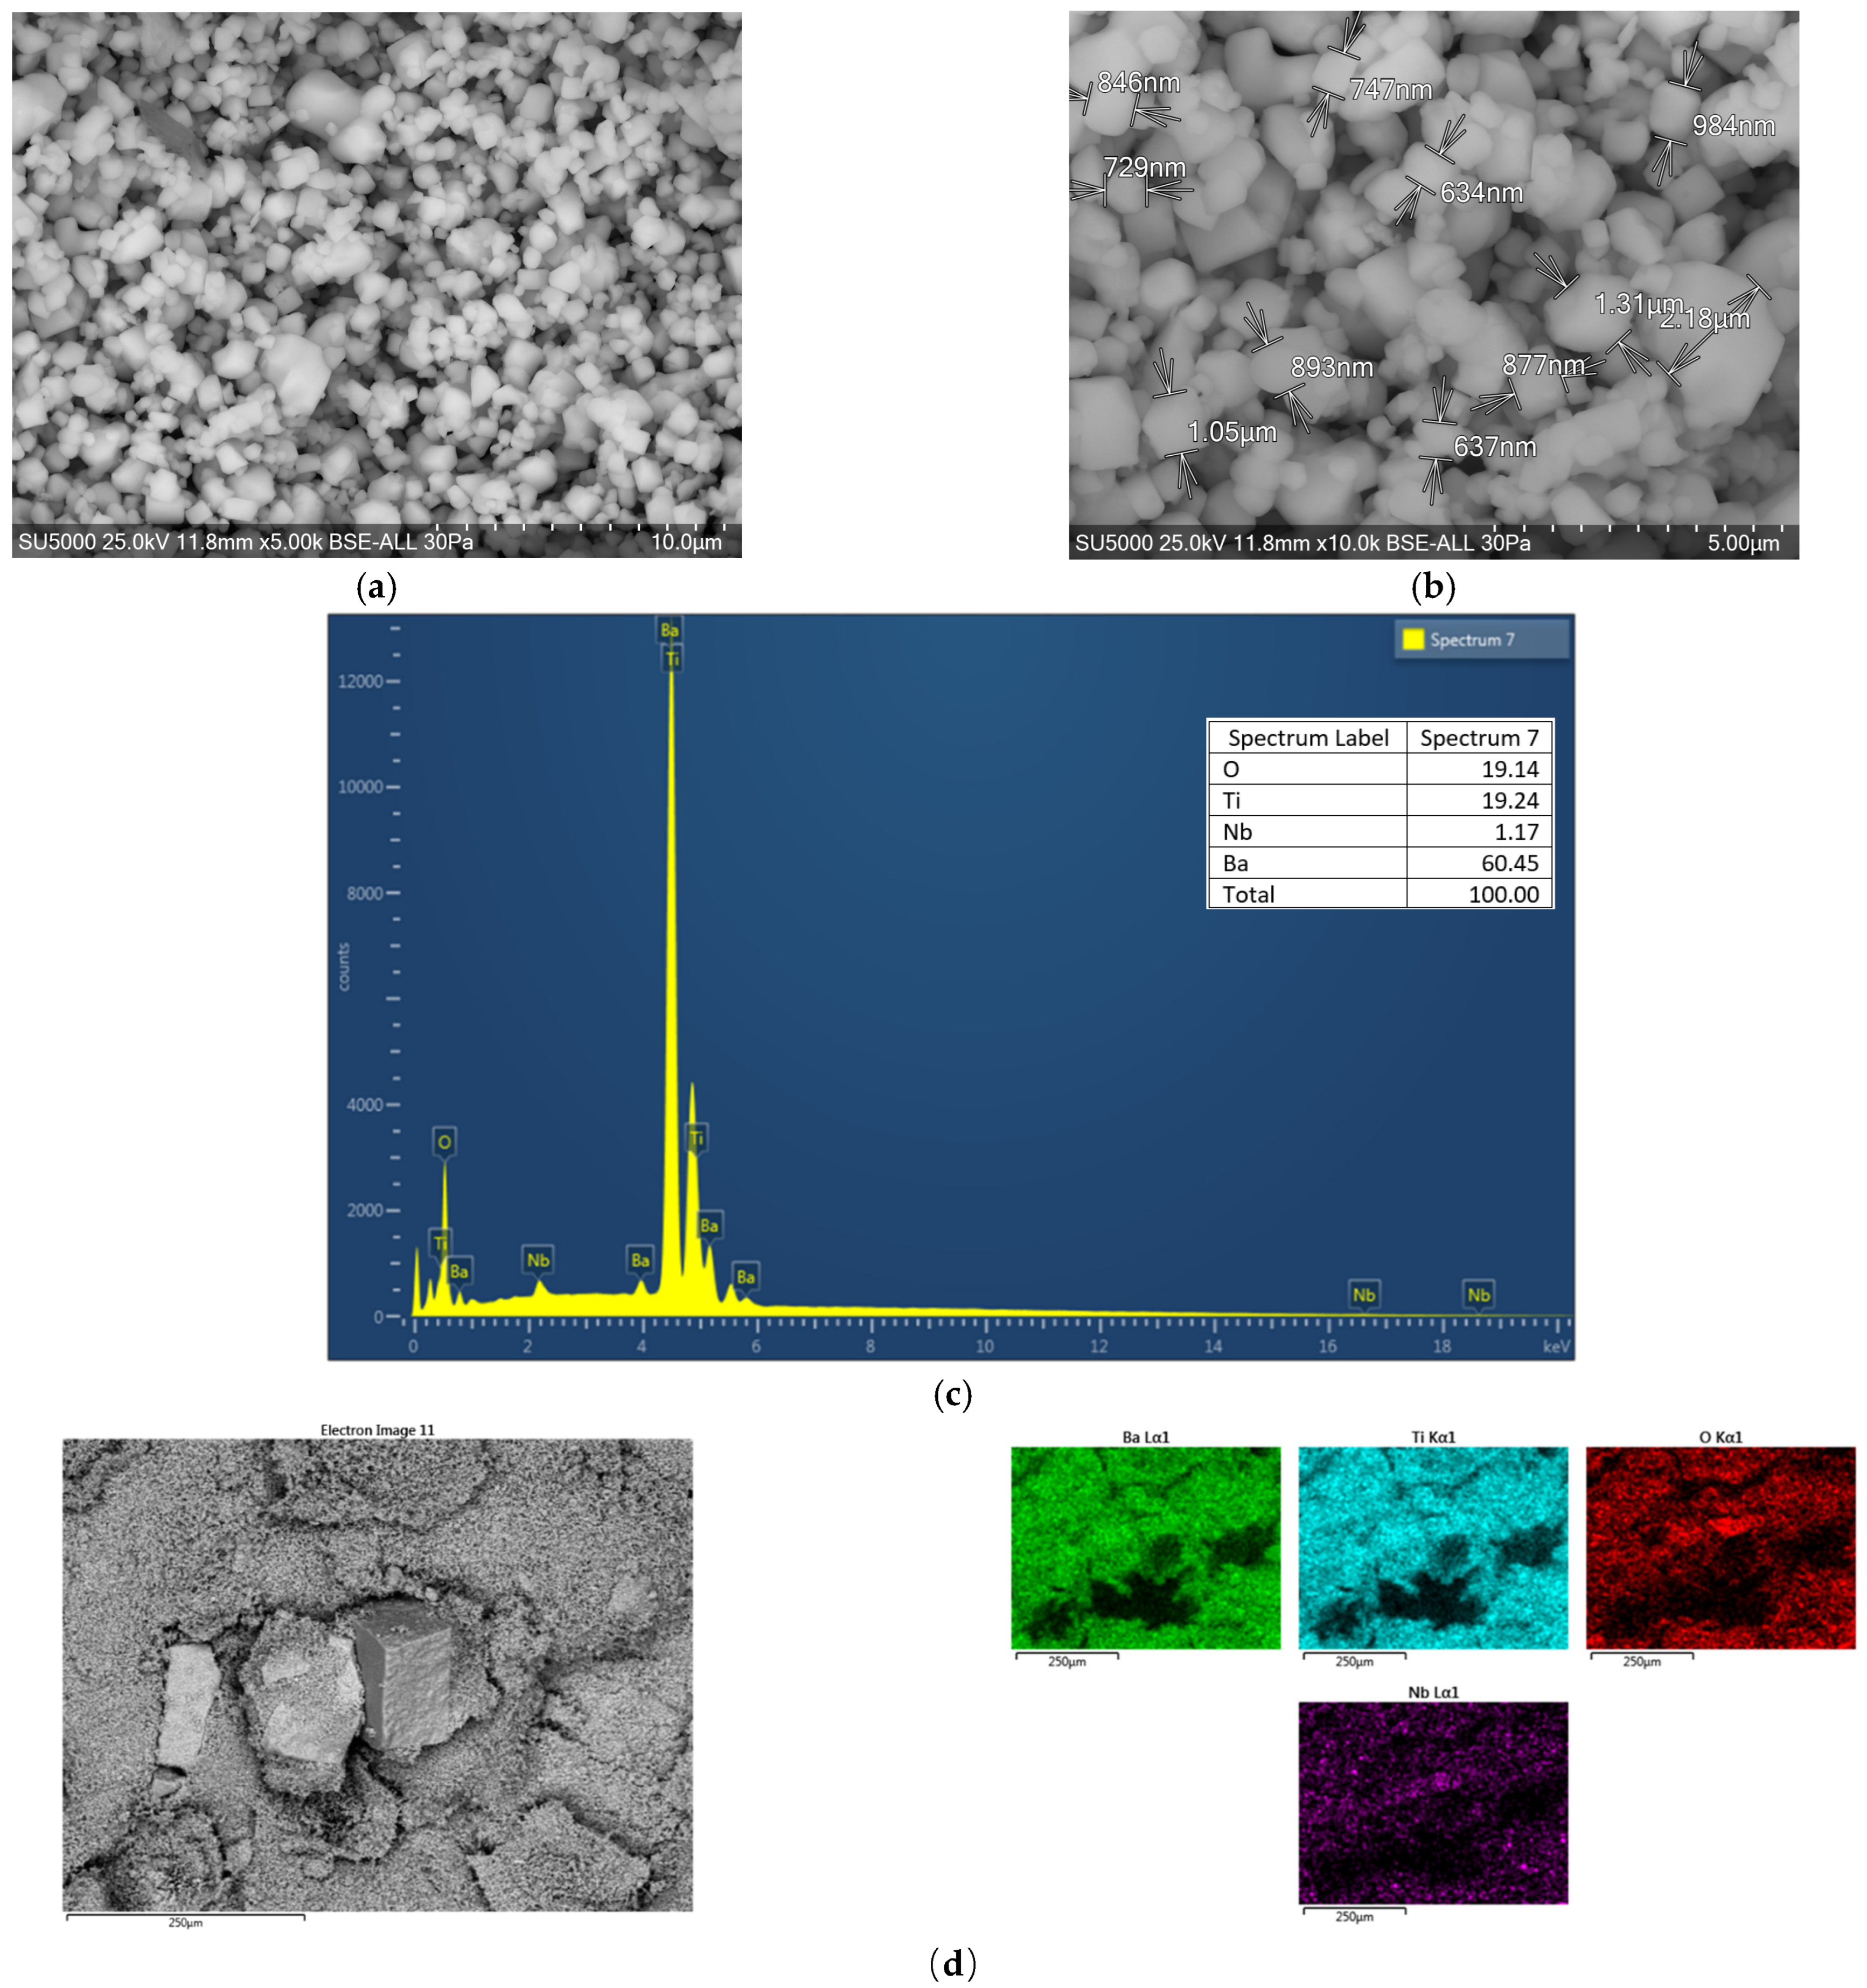
The Nb-doped sample calcined at 1000 °C displays angular grains and a relatively weakly agglomerated microstructure (
Figure 4a). Niobium acts as a donor dopant, introducing additional electrons and suppressing oxygen vacancy formation. Grain sizes range from 634 nm to 2180 nm (
Figure 4b).
EDS spectra (
Figure 4c) confirm the presence of Nb without notable contamination, while elemental mapping (
Figure 4d) indicates uniform dopant distribution and effective substitution at the Ti site.
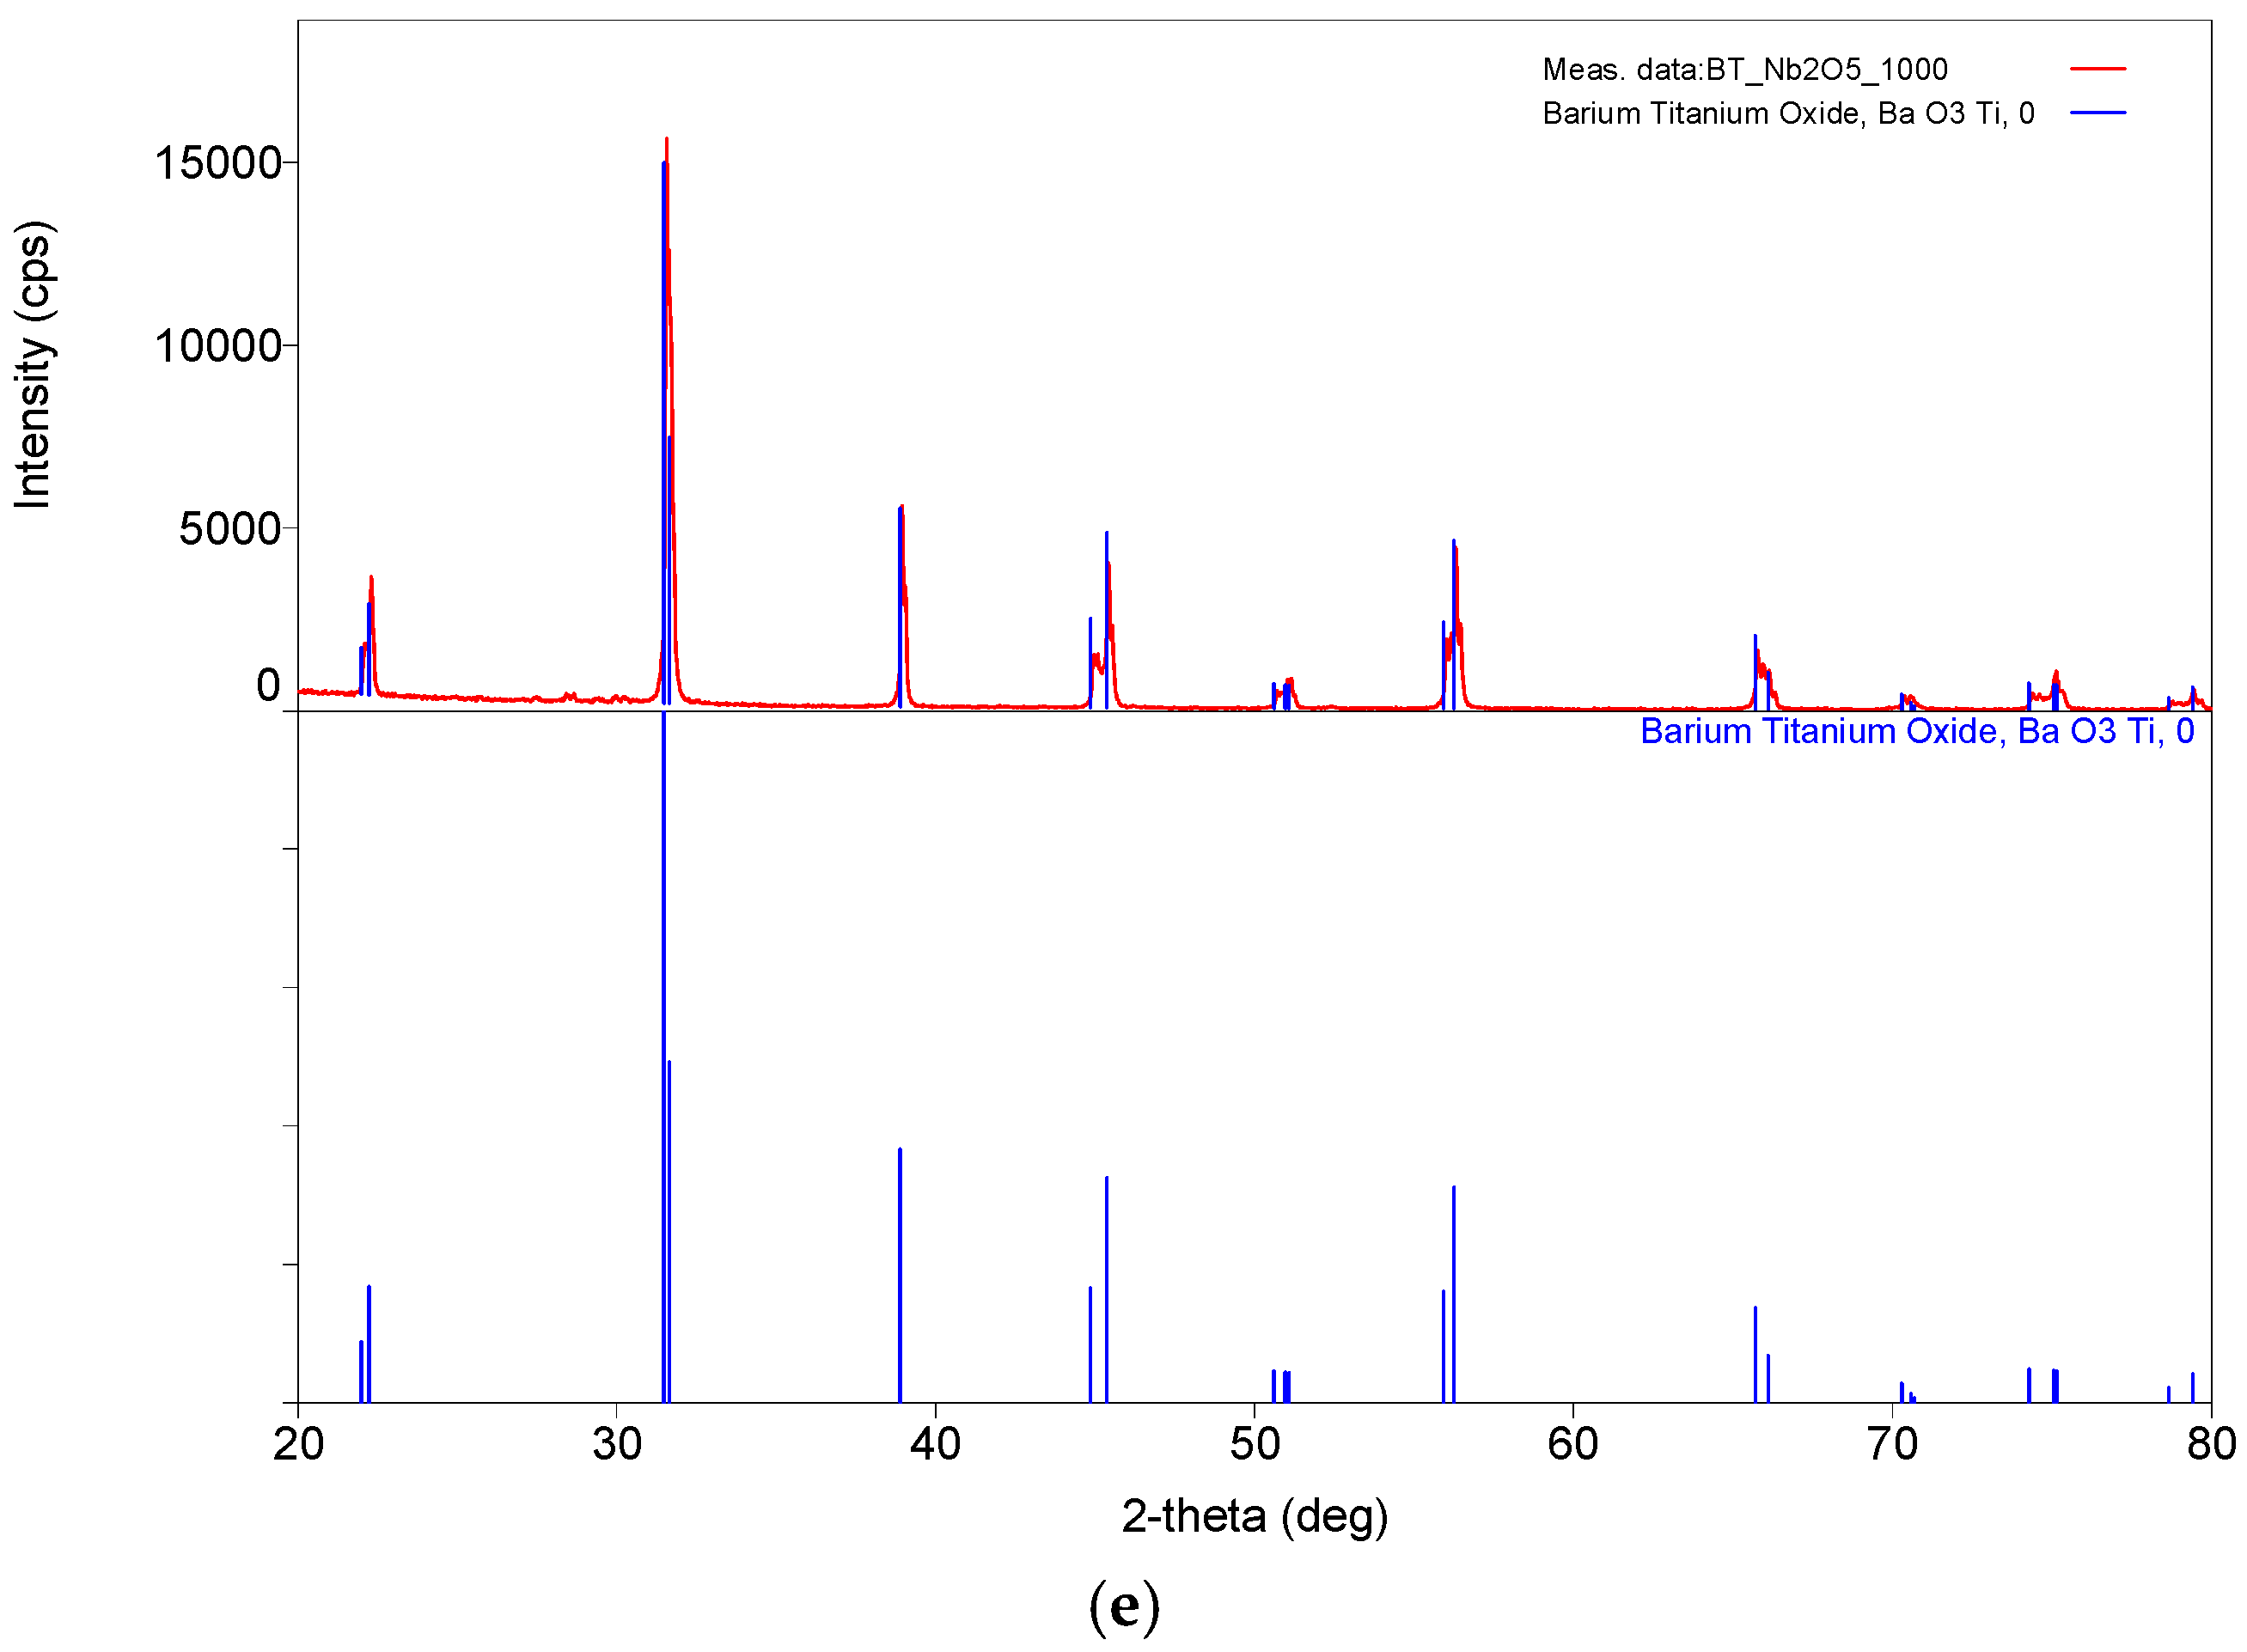
The XRD pattern (
Figure 4e) reveals a tetragonal phase with lattice parameters a = 3.999 Å and c = 4.034 Å, corresponding to a c/a ratio of 1.0087 and a crystallite size of 92.7 nm, comparable to the Mn-doped sample.
3.5. BaTi0.95Nb0.05O3 Calcined at 1100 °C
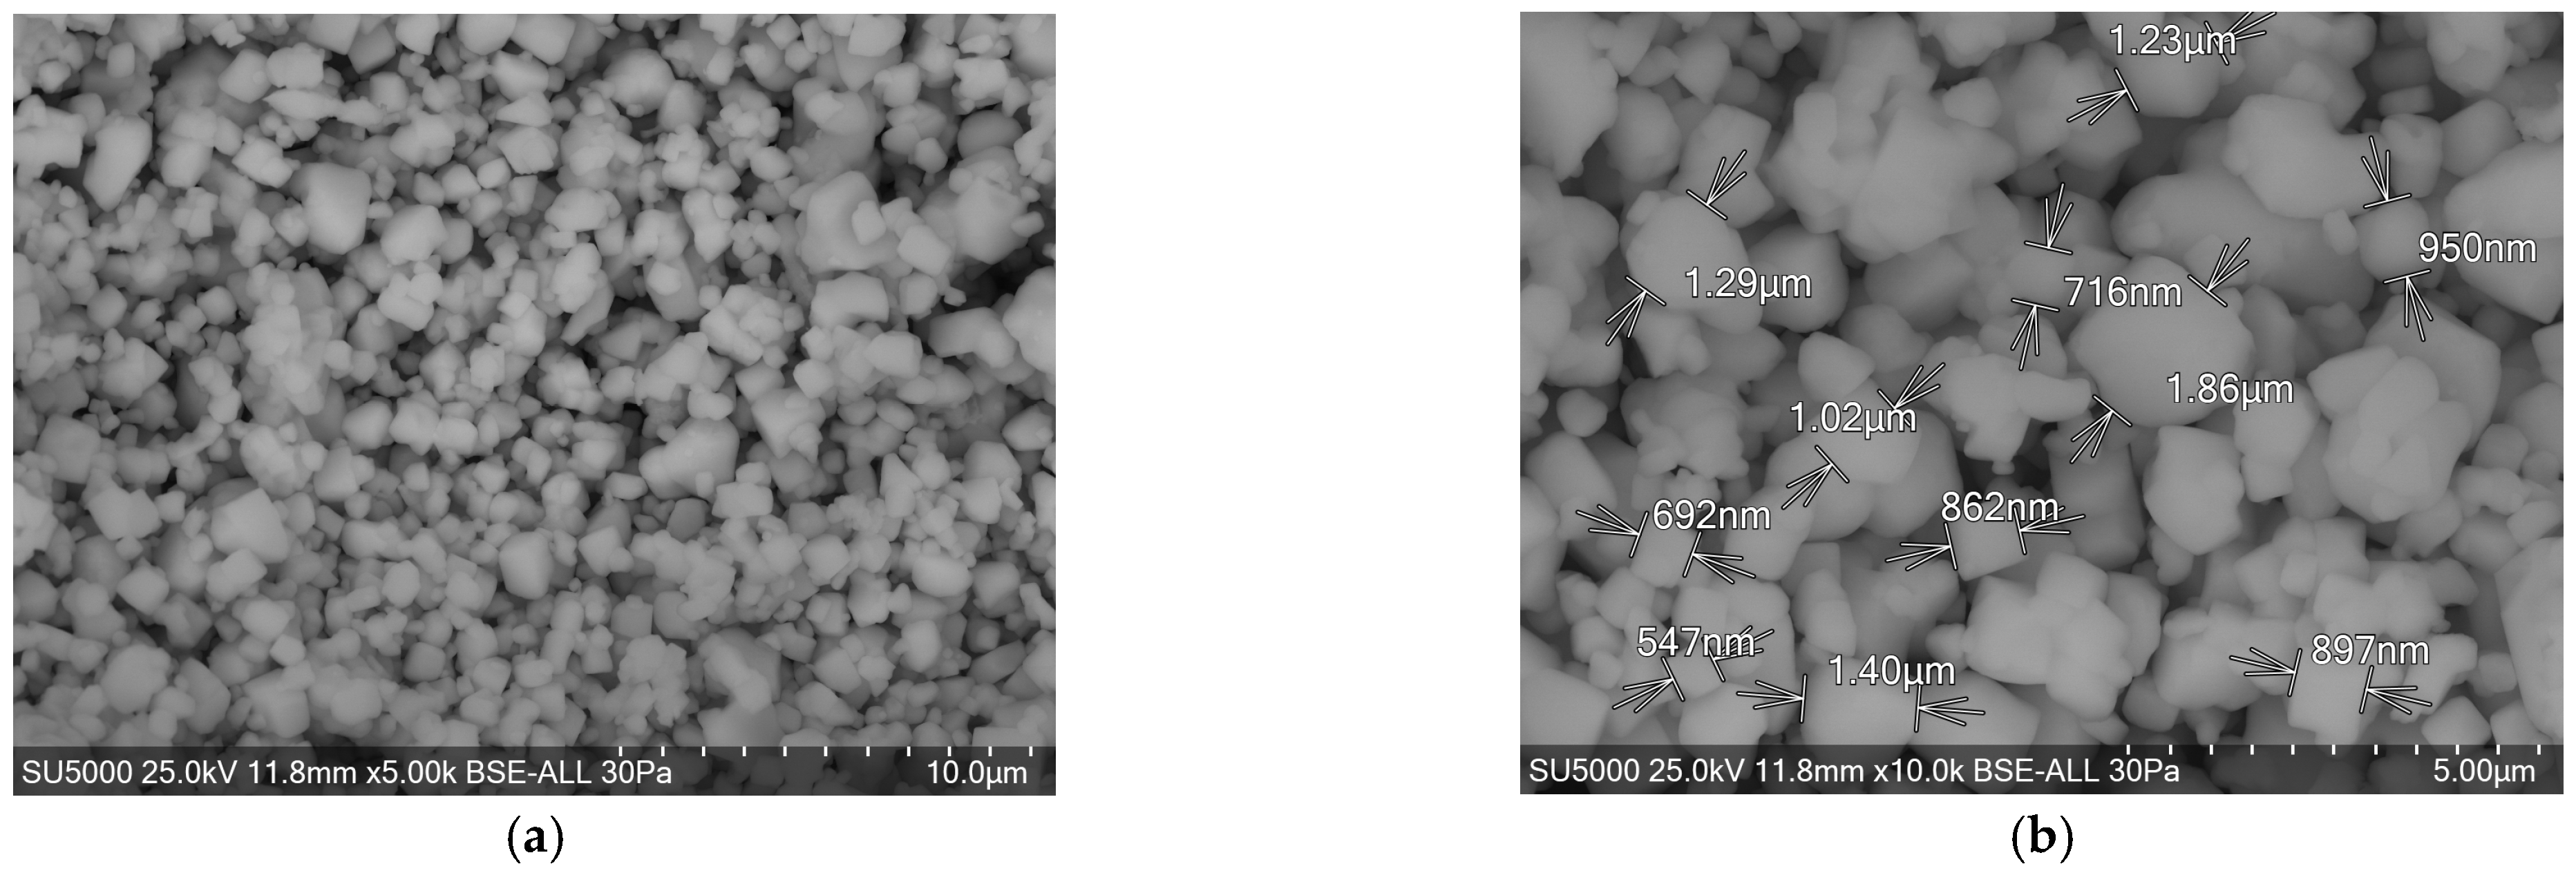
After calcination at 1100 °C, the Nb-doped sample exhibits a more coherent microstructure with improved intergranular contacts (
Figure 5a). The distribution of grain size varies between 547–1860 nm (
Figure 5b), indicating that Nb limits excessive grain growth.
EDS analysis (
Figure 5c) and elemental mapping (
Figure 5d) confirm uniform dopant retention.
XRD analysis (
Figure 5e) shows no secondary phases and a stable tetragonal structure, with lattice parameters a = 3.999 Å and c = 4.031 Å, corresponding to c/a = 1.008. The slight reduction in the c-axis suggests densification and partial relaxation of internal stresses. This behavior is associated with lattice relaxation and improved crystallographic ordering at higher calcination temperature, which reduces internal stresses and lattice strain, leading to slight adjustments of lattice parameters and contributing to the densification of the material.
3.6. Ba0.95La0.05TiO3 Calcined at 1000 °C
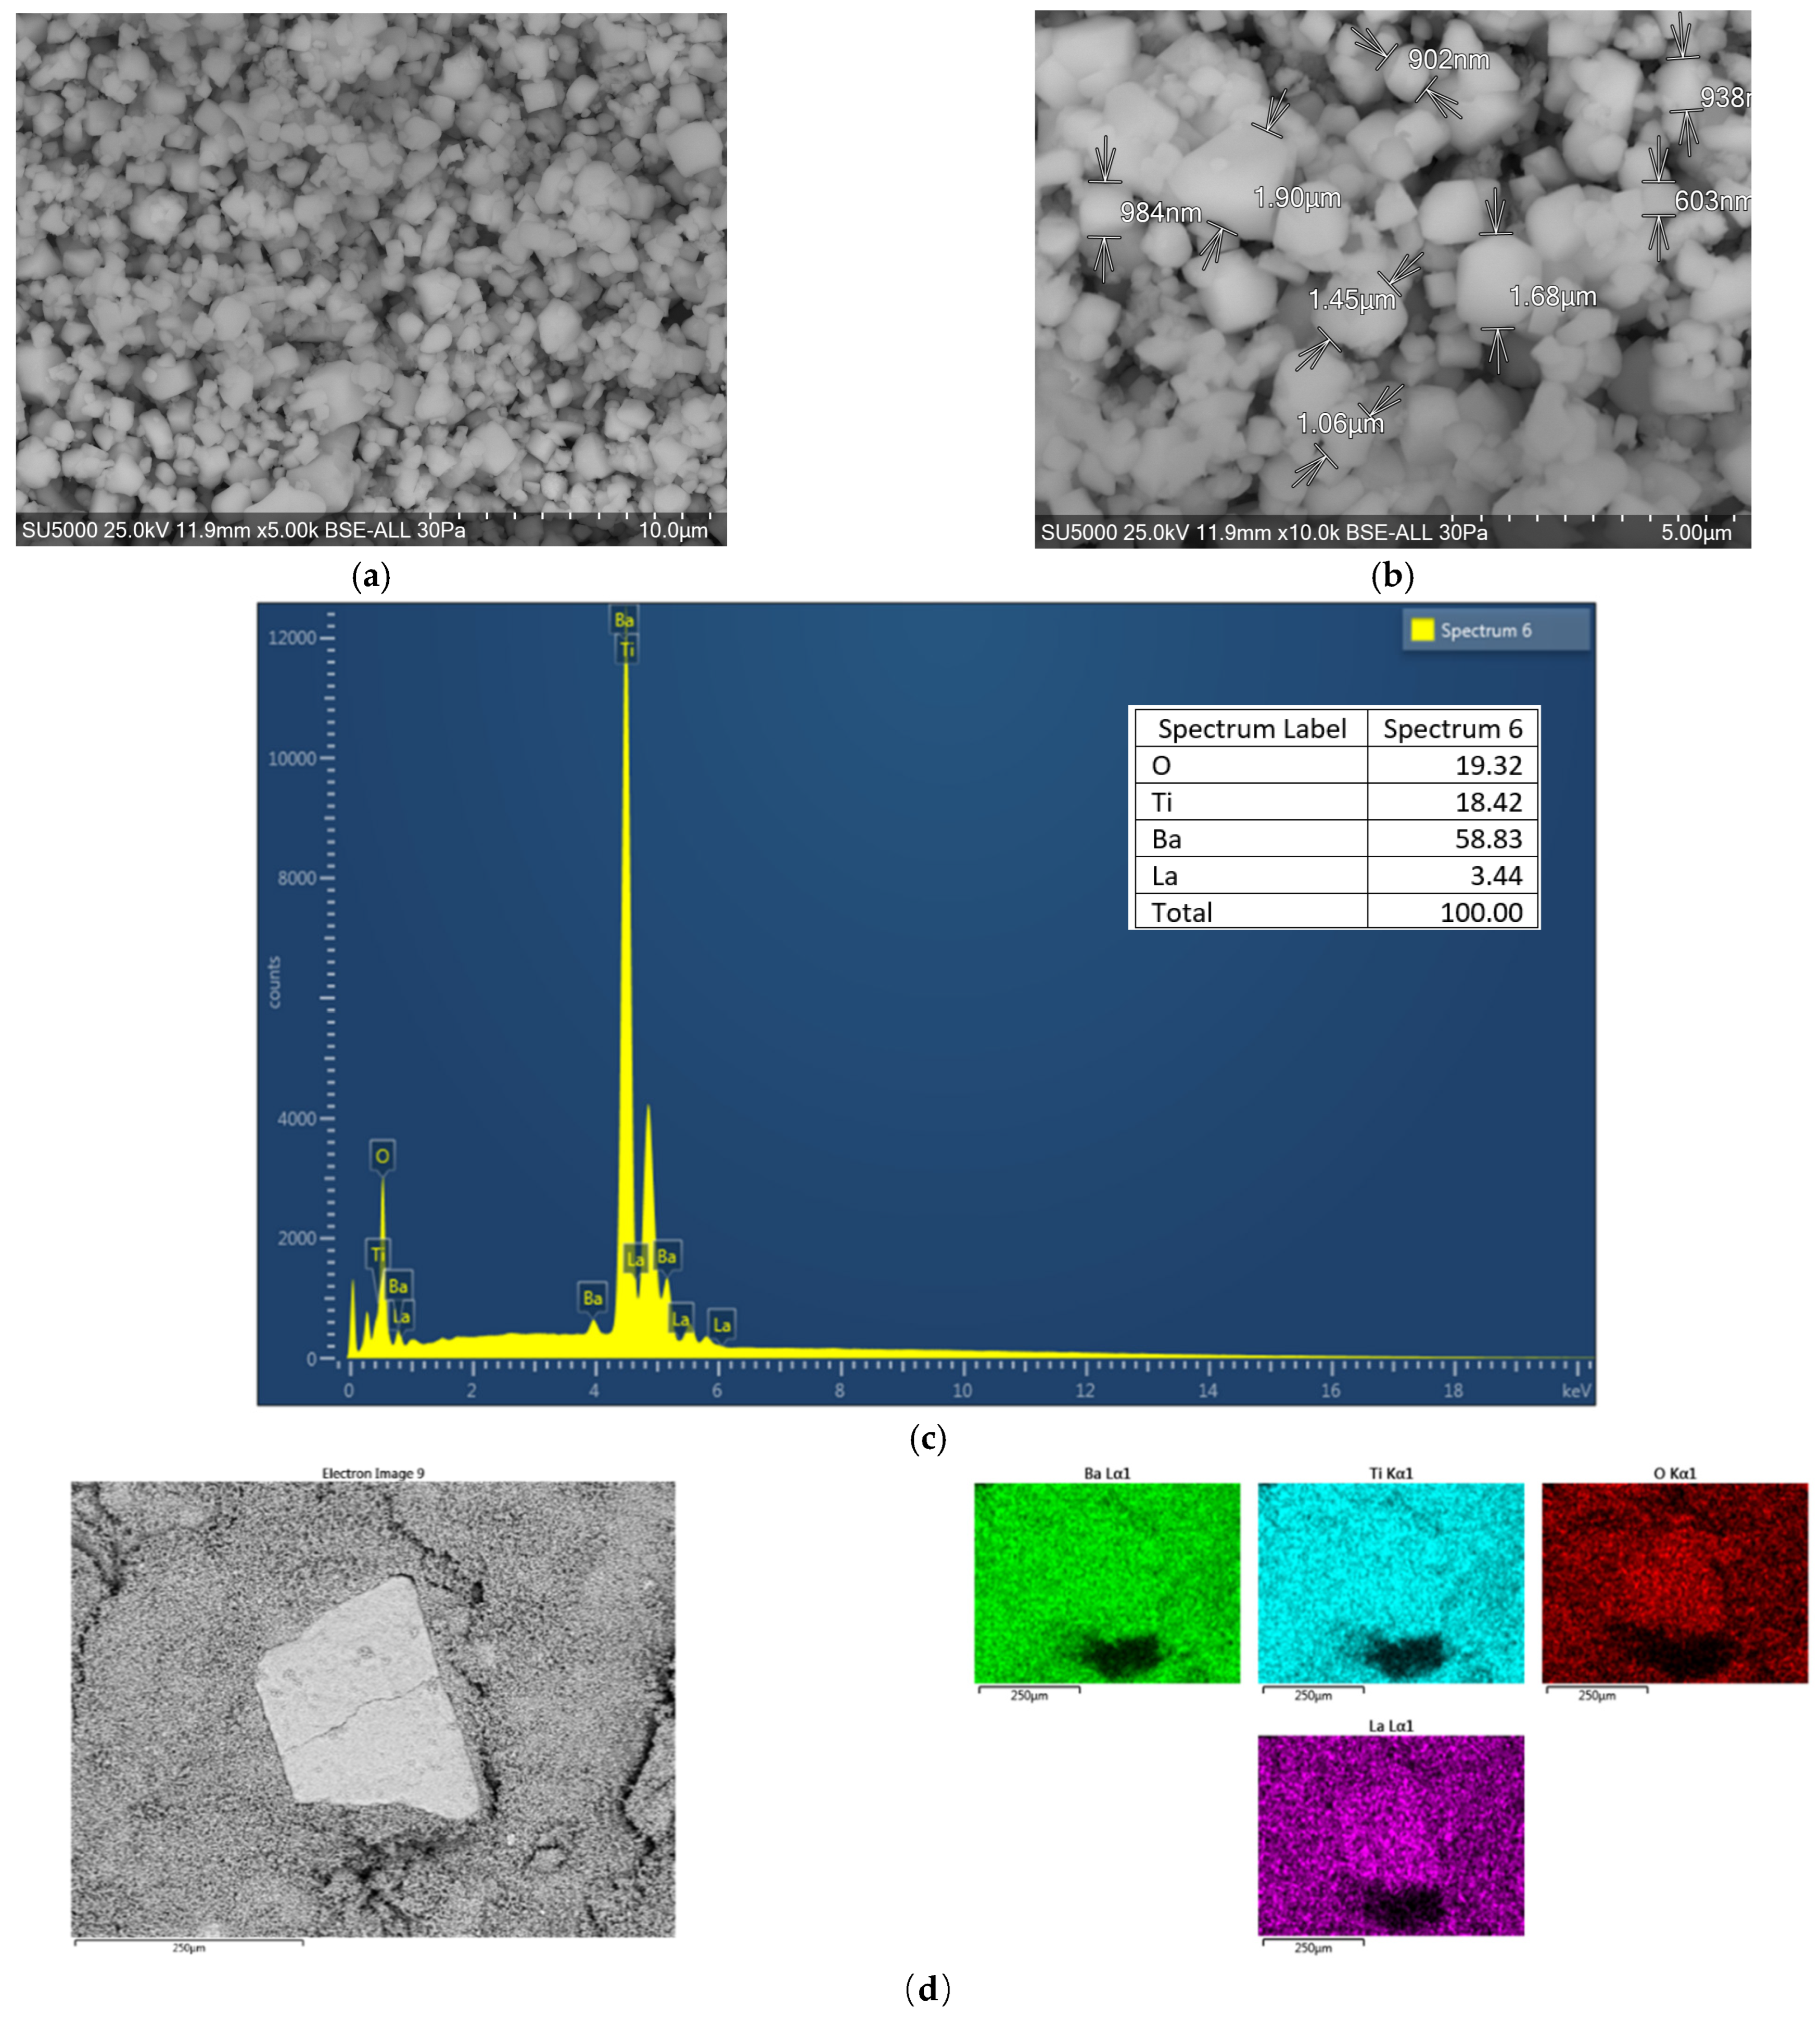
Lanthanum doping at the A-site produces distinct microstructural features. At 1000 °C, grains exhibit a polyhedral morphology with moderate agglomeration (
Figure 6a). Grain sizes range from 603 nm to 1900 μm (
Figure 6b).
EDS spectra (
Figure 6c) and elemental maps (
Figure 6d) confirm homogeneous La distribution.
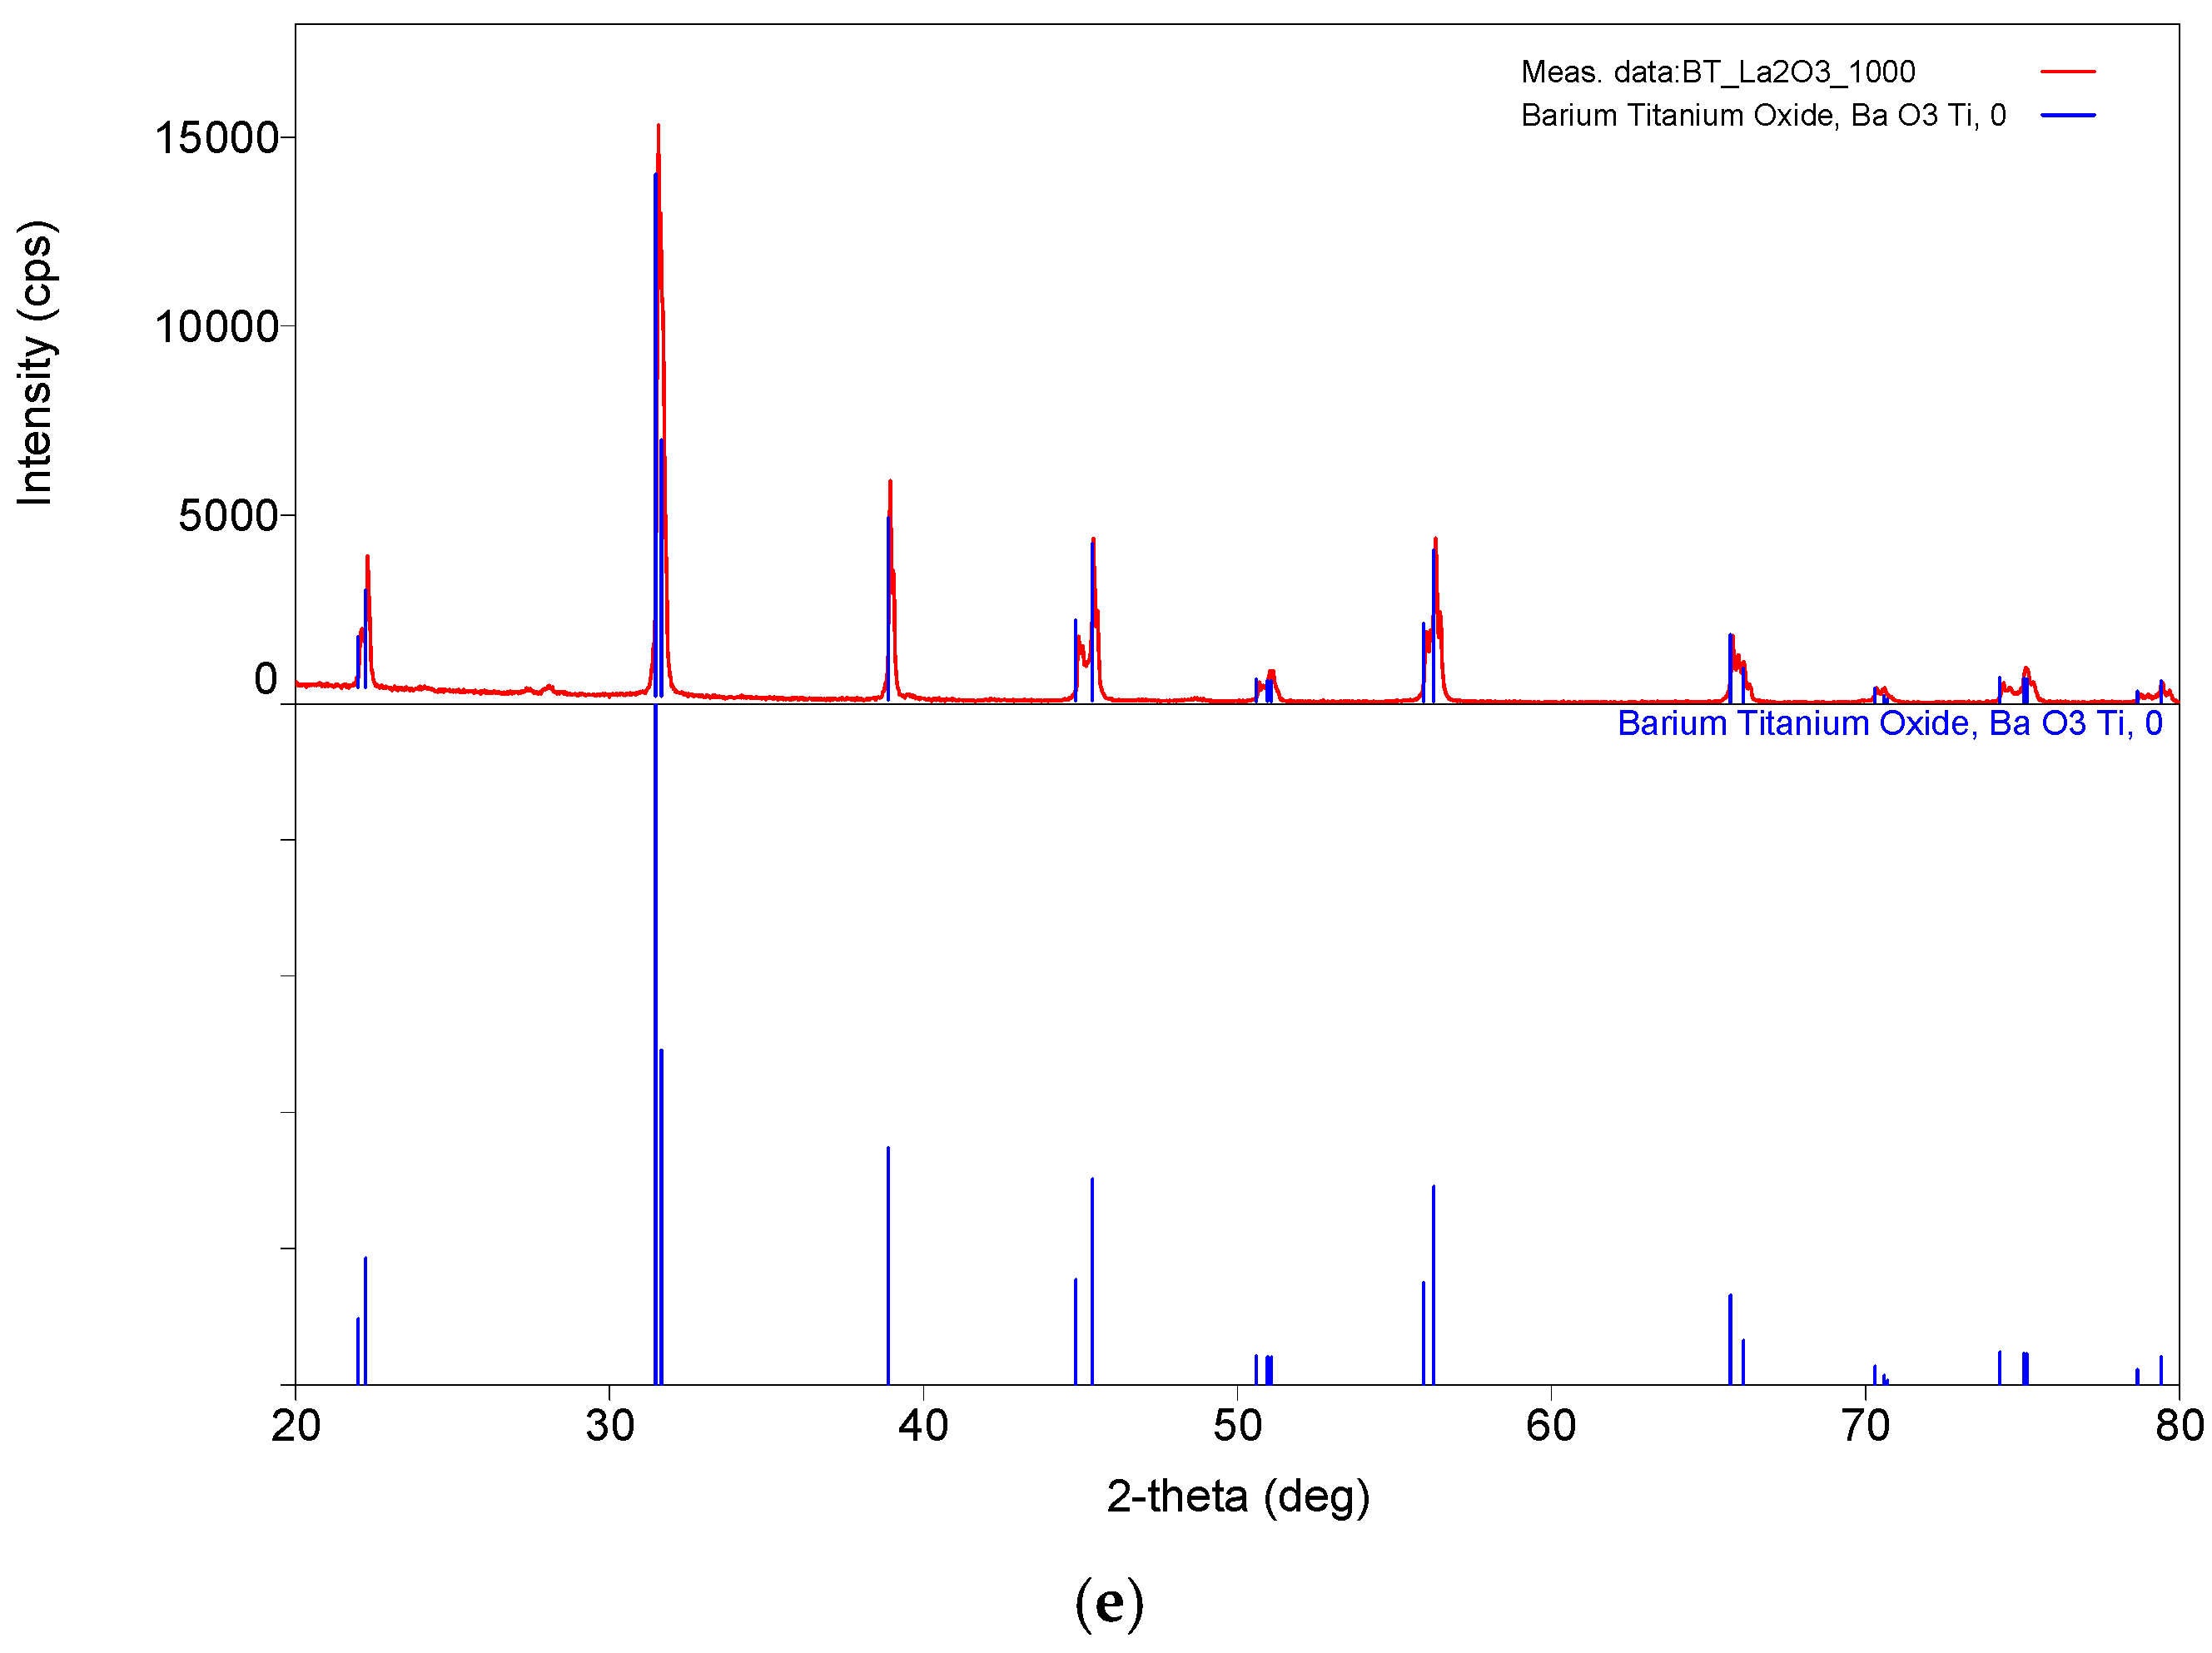
XRD analysis (
Figure 6e) indicates a tetragonal phase with lattice parameters a = 3.998 Å and c = 4.035 Å, a c/a ratio of 1.009, and a crystallite size of 85.8 nm, reflecting partial structural relaxation due to A-site substitution.
3.7. Ba0.95La0.05TiO3 Calcined at 1100 °C
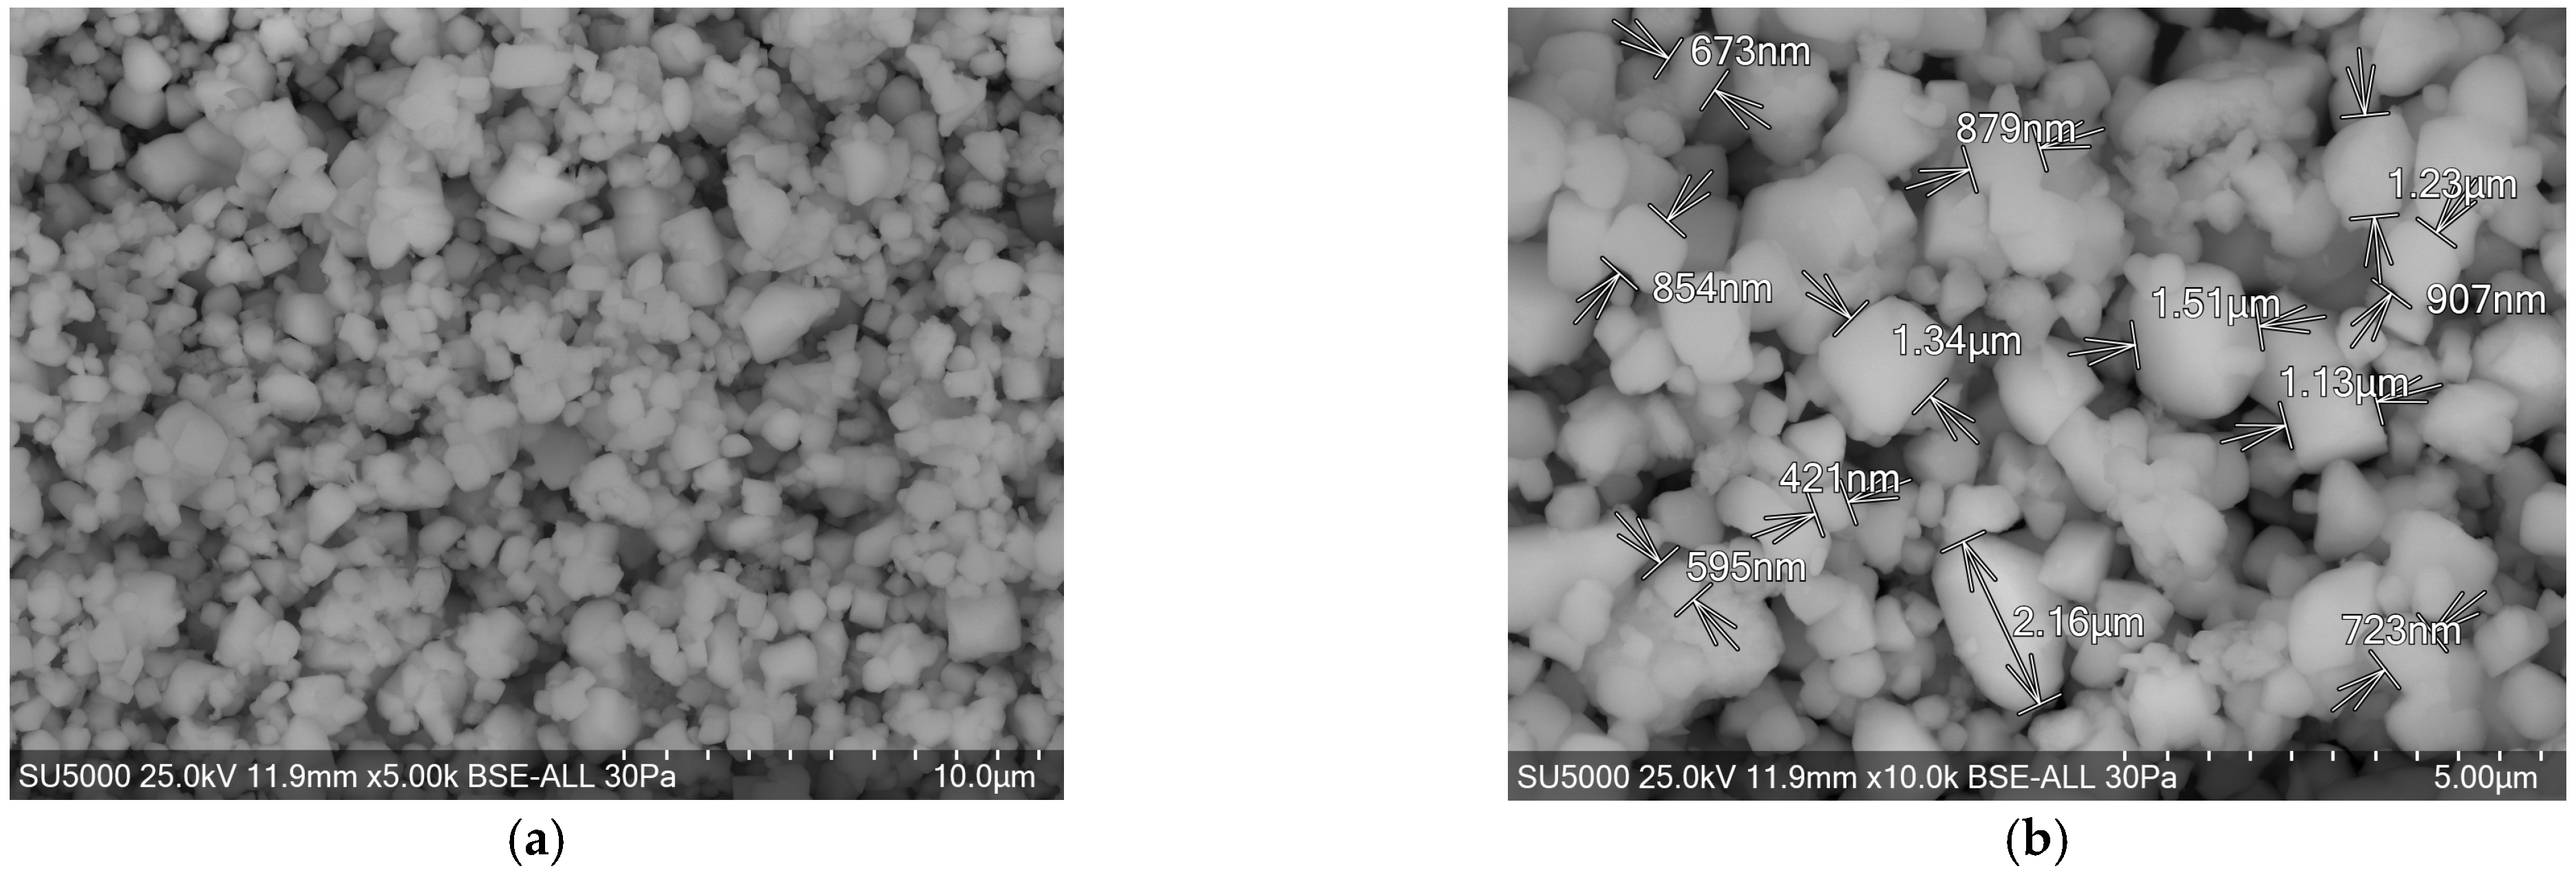
At 1100 °C, La-doped samples exhibit extensive grain fusion and reduced porosity (
Figure 7a). Grain sizes range from 421 nm to 2160 nm (
Figure 7b).
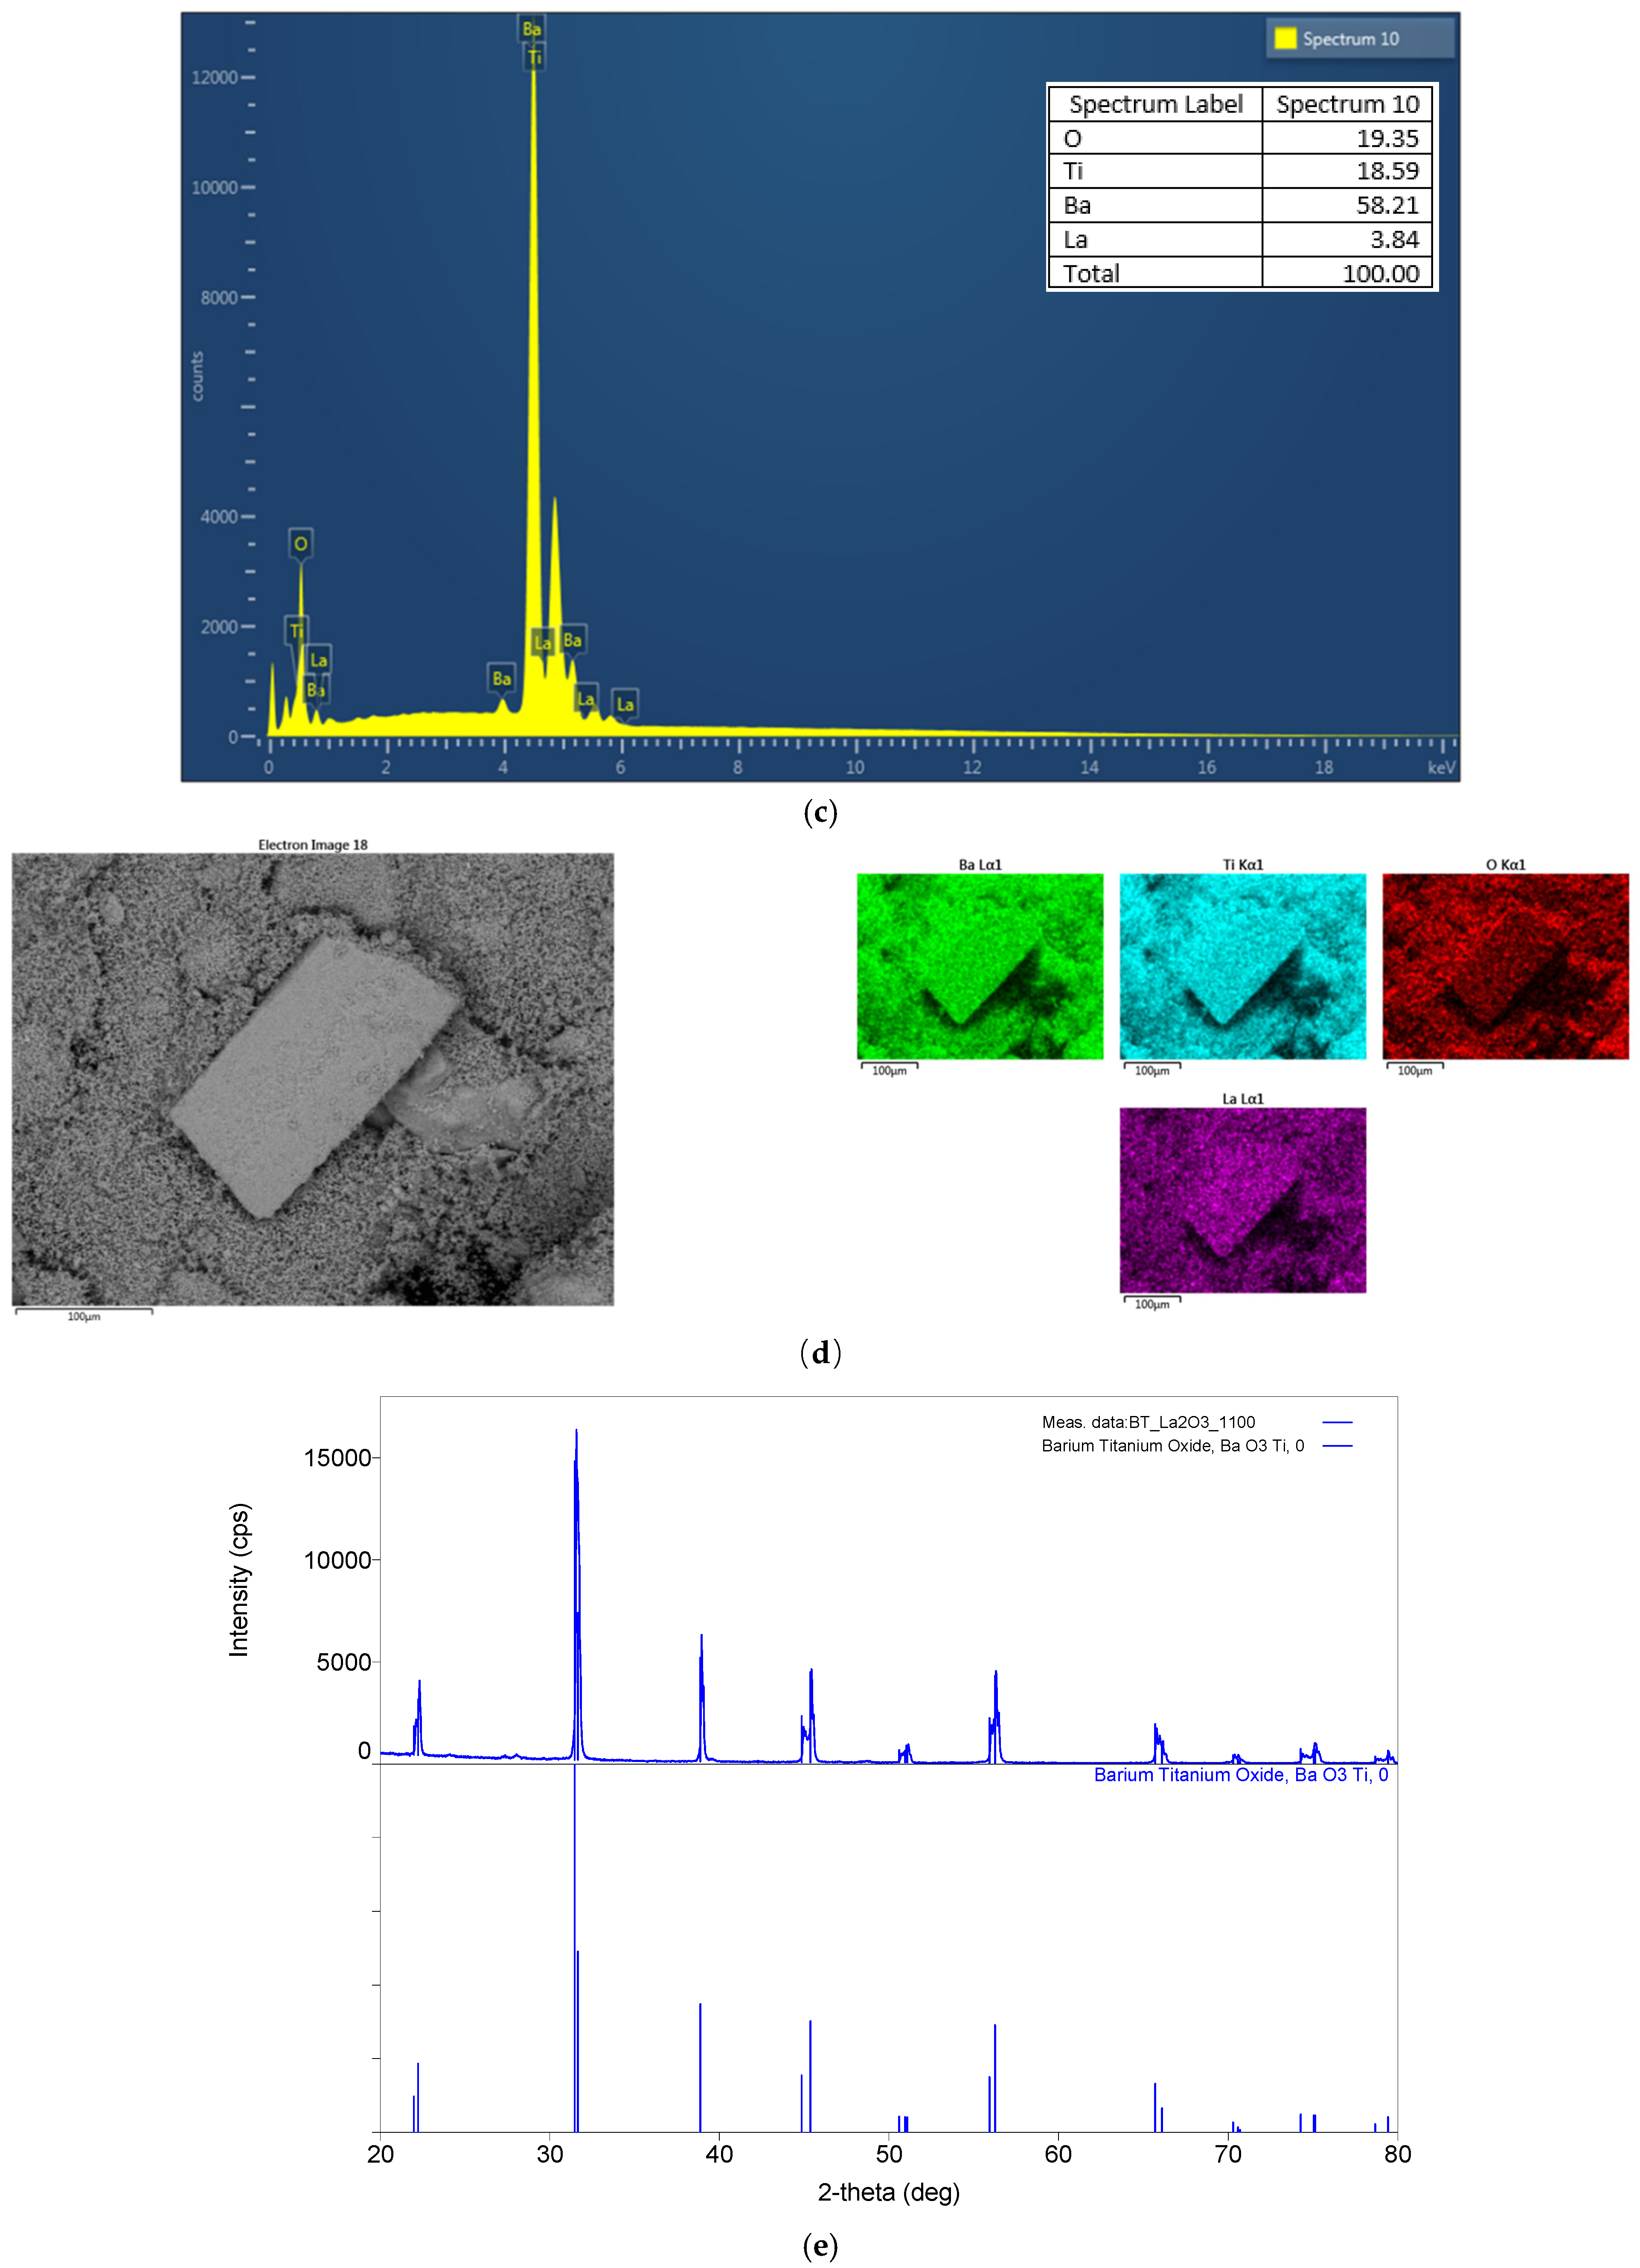
EDS analysis (
Figure 7c) and elemental mapping (
Figure 7d) confirm dopant stability and uniform distribution.
XRD results (
Figure 7e) indicate a preserved tetragonal structure with lattice parameters a = 3.998 Å and c = 4.034 Å, a c/a ratio of 1.009, and a crystallite size of 89.2 nm, suggesting improved structural integrity.
3.8. Ba0.95Ce0.05TiO3 Calcined at 1000 °C
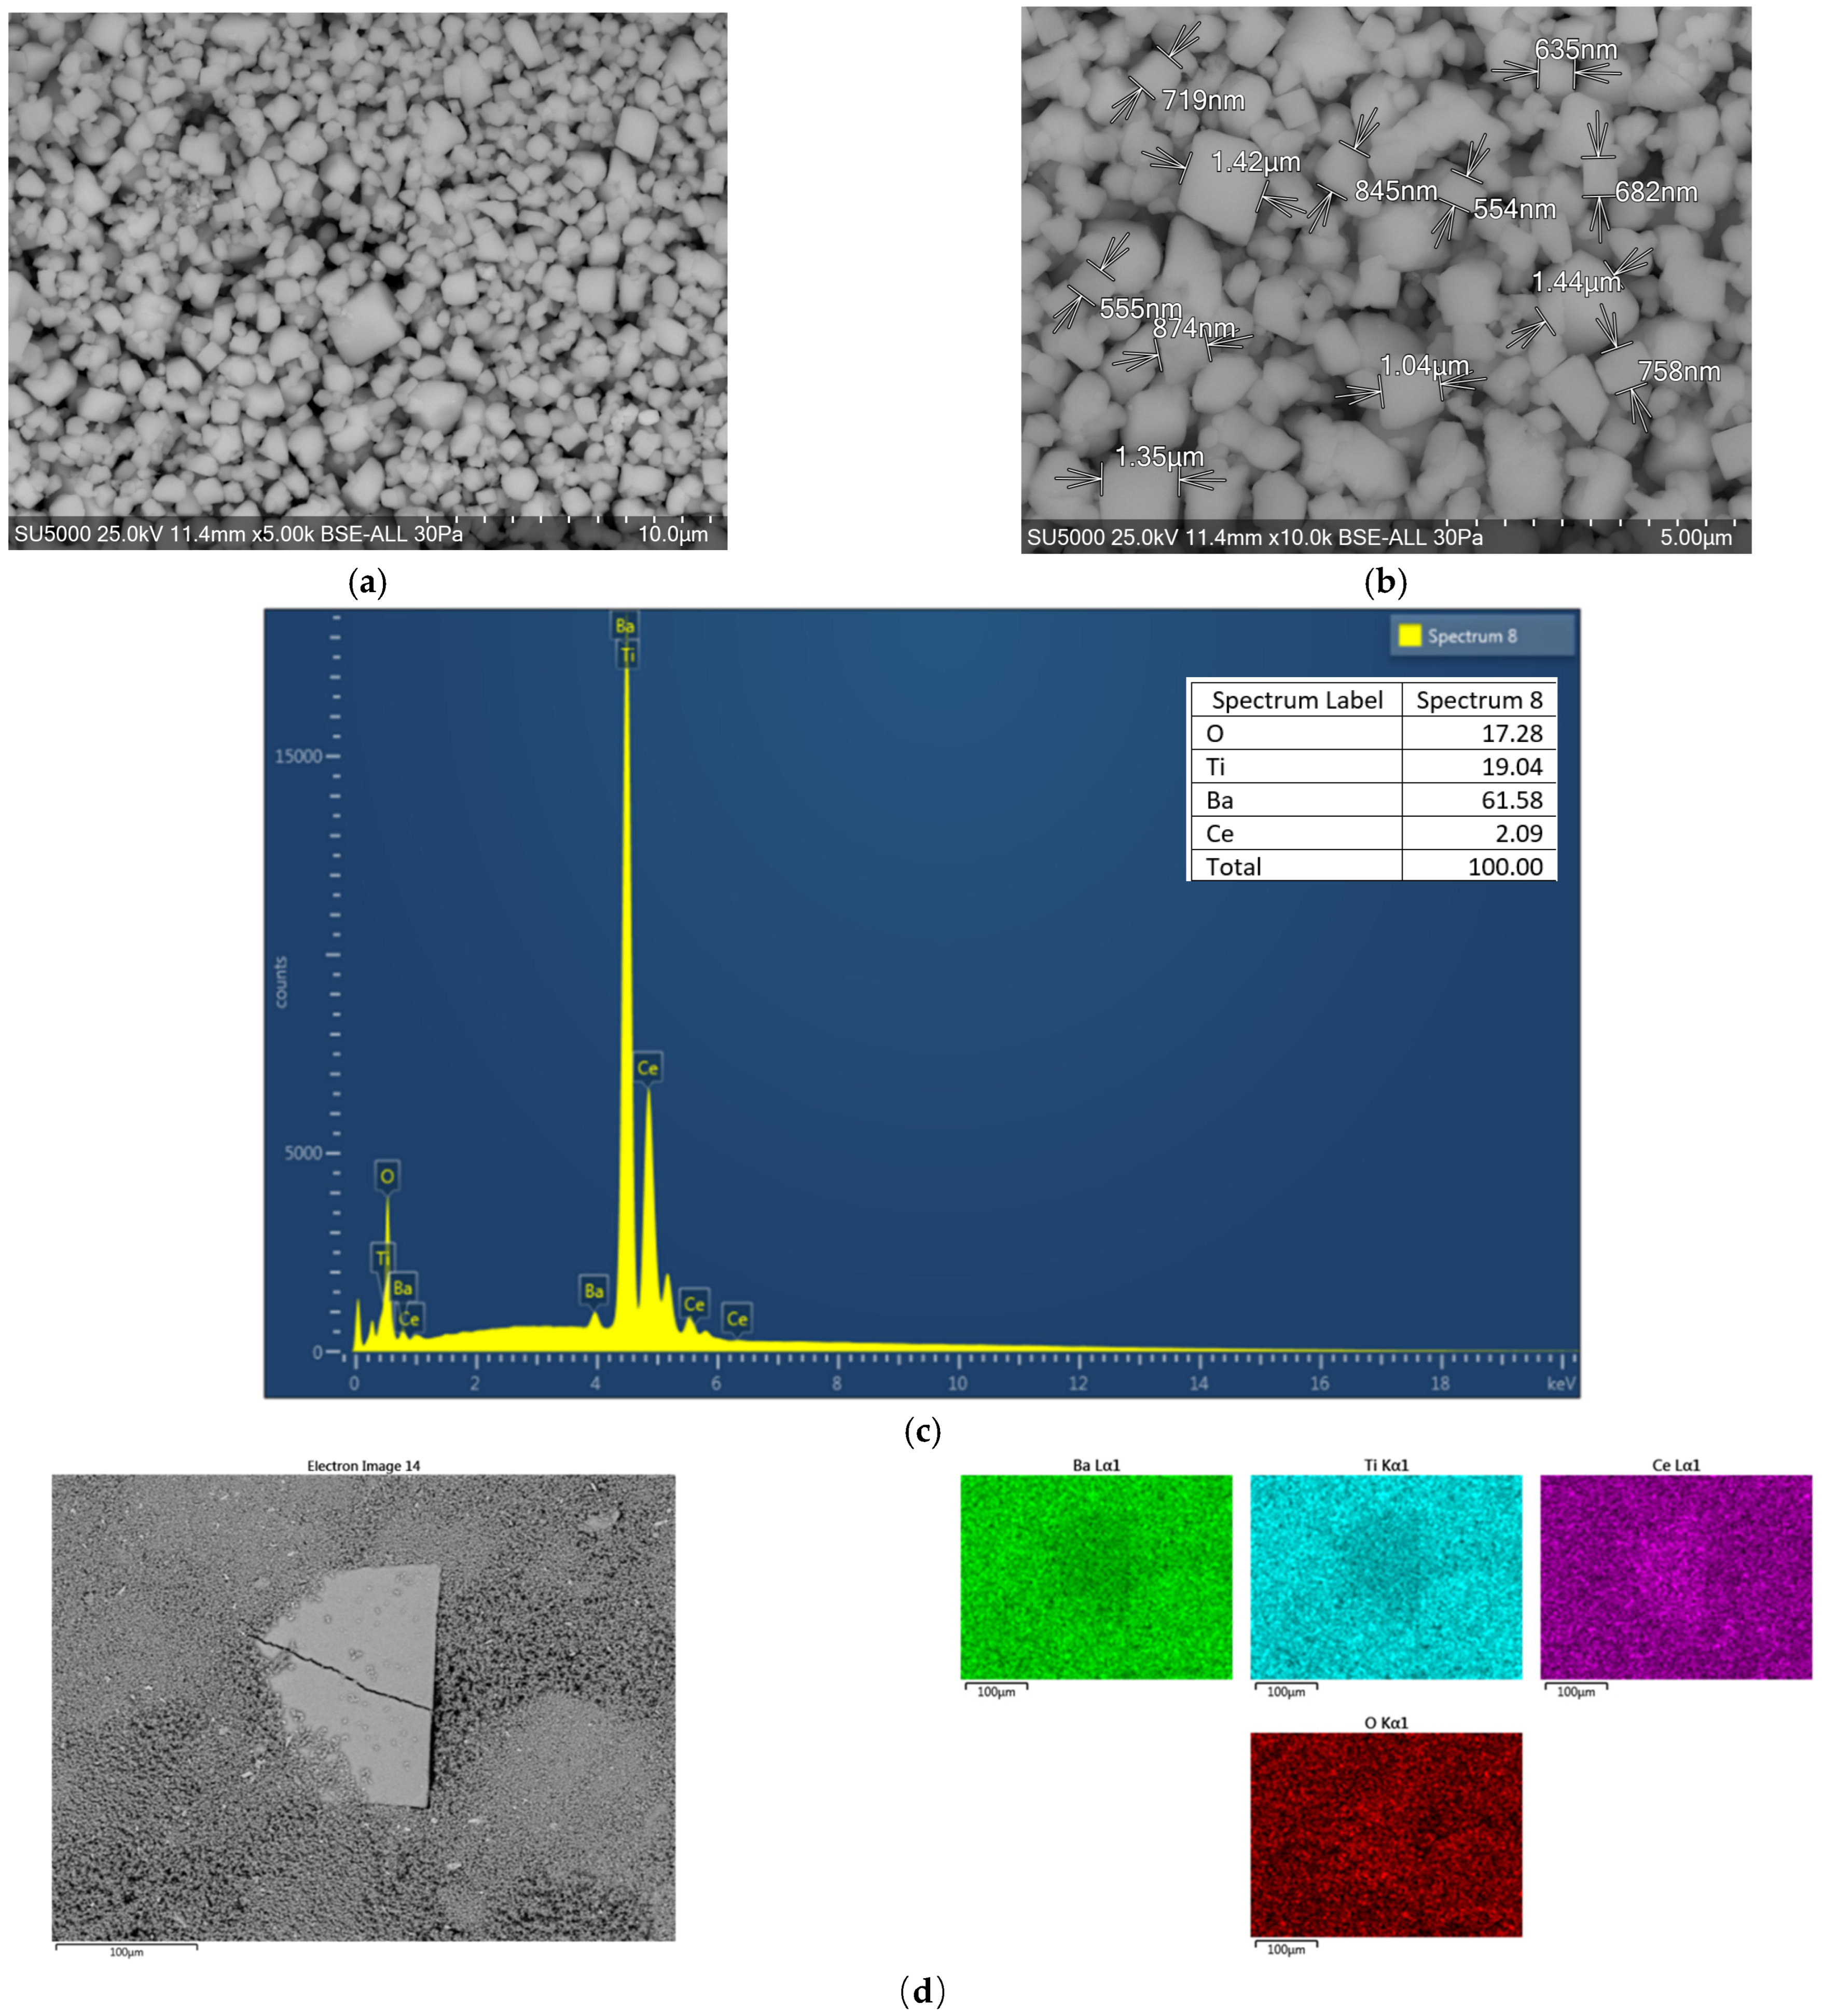
Cerium doping results in a more heterogeneous microstructure at 1000 °C (
Figure 8a), with non-uniform grain growth. Grain sizes range from 554 nm to 1440 μm (
Figure 8b), indicating secondary agglomeration.
EDS spectra (
Figure 8c) confirm Ce presence, while elemental mapping (
Figure 8d) shows homogeneous distribution.
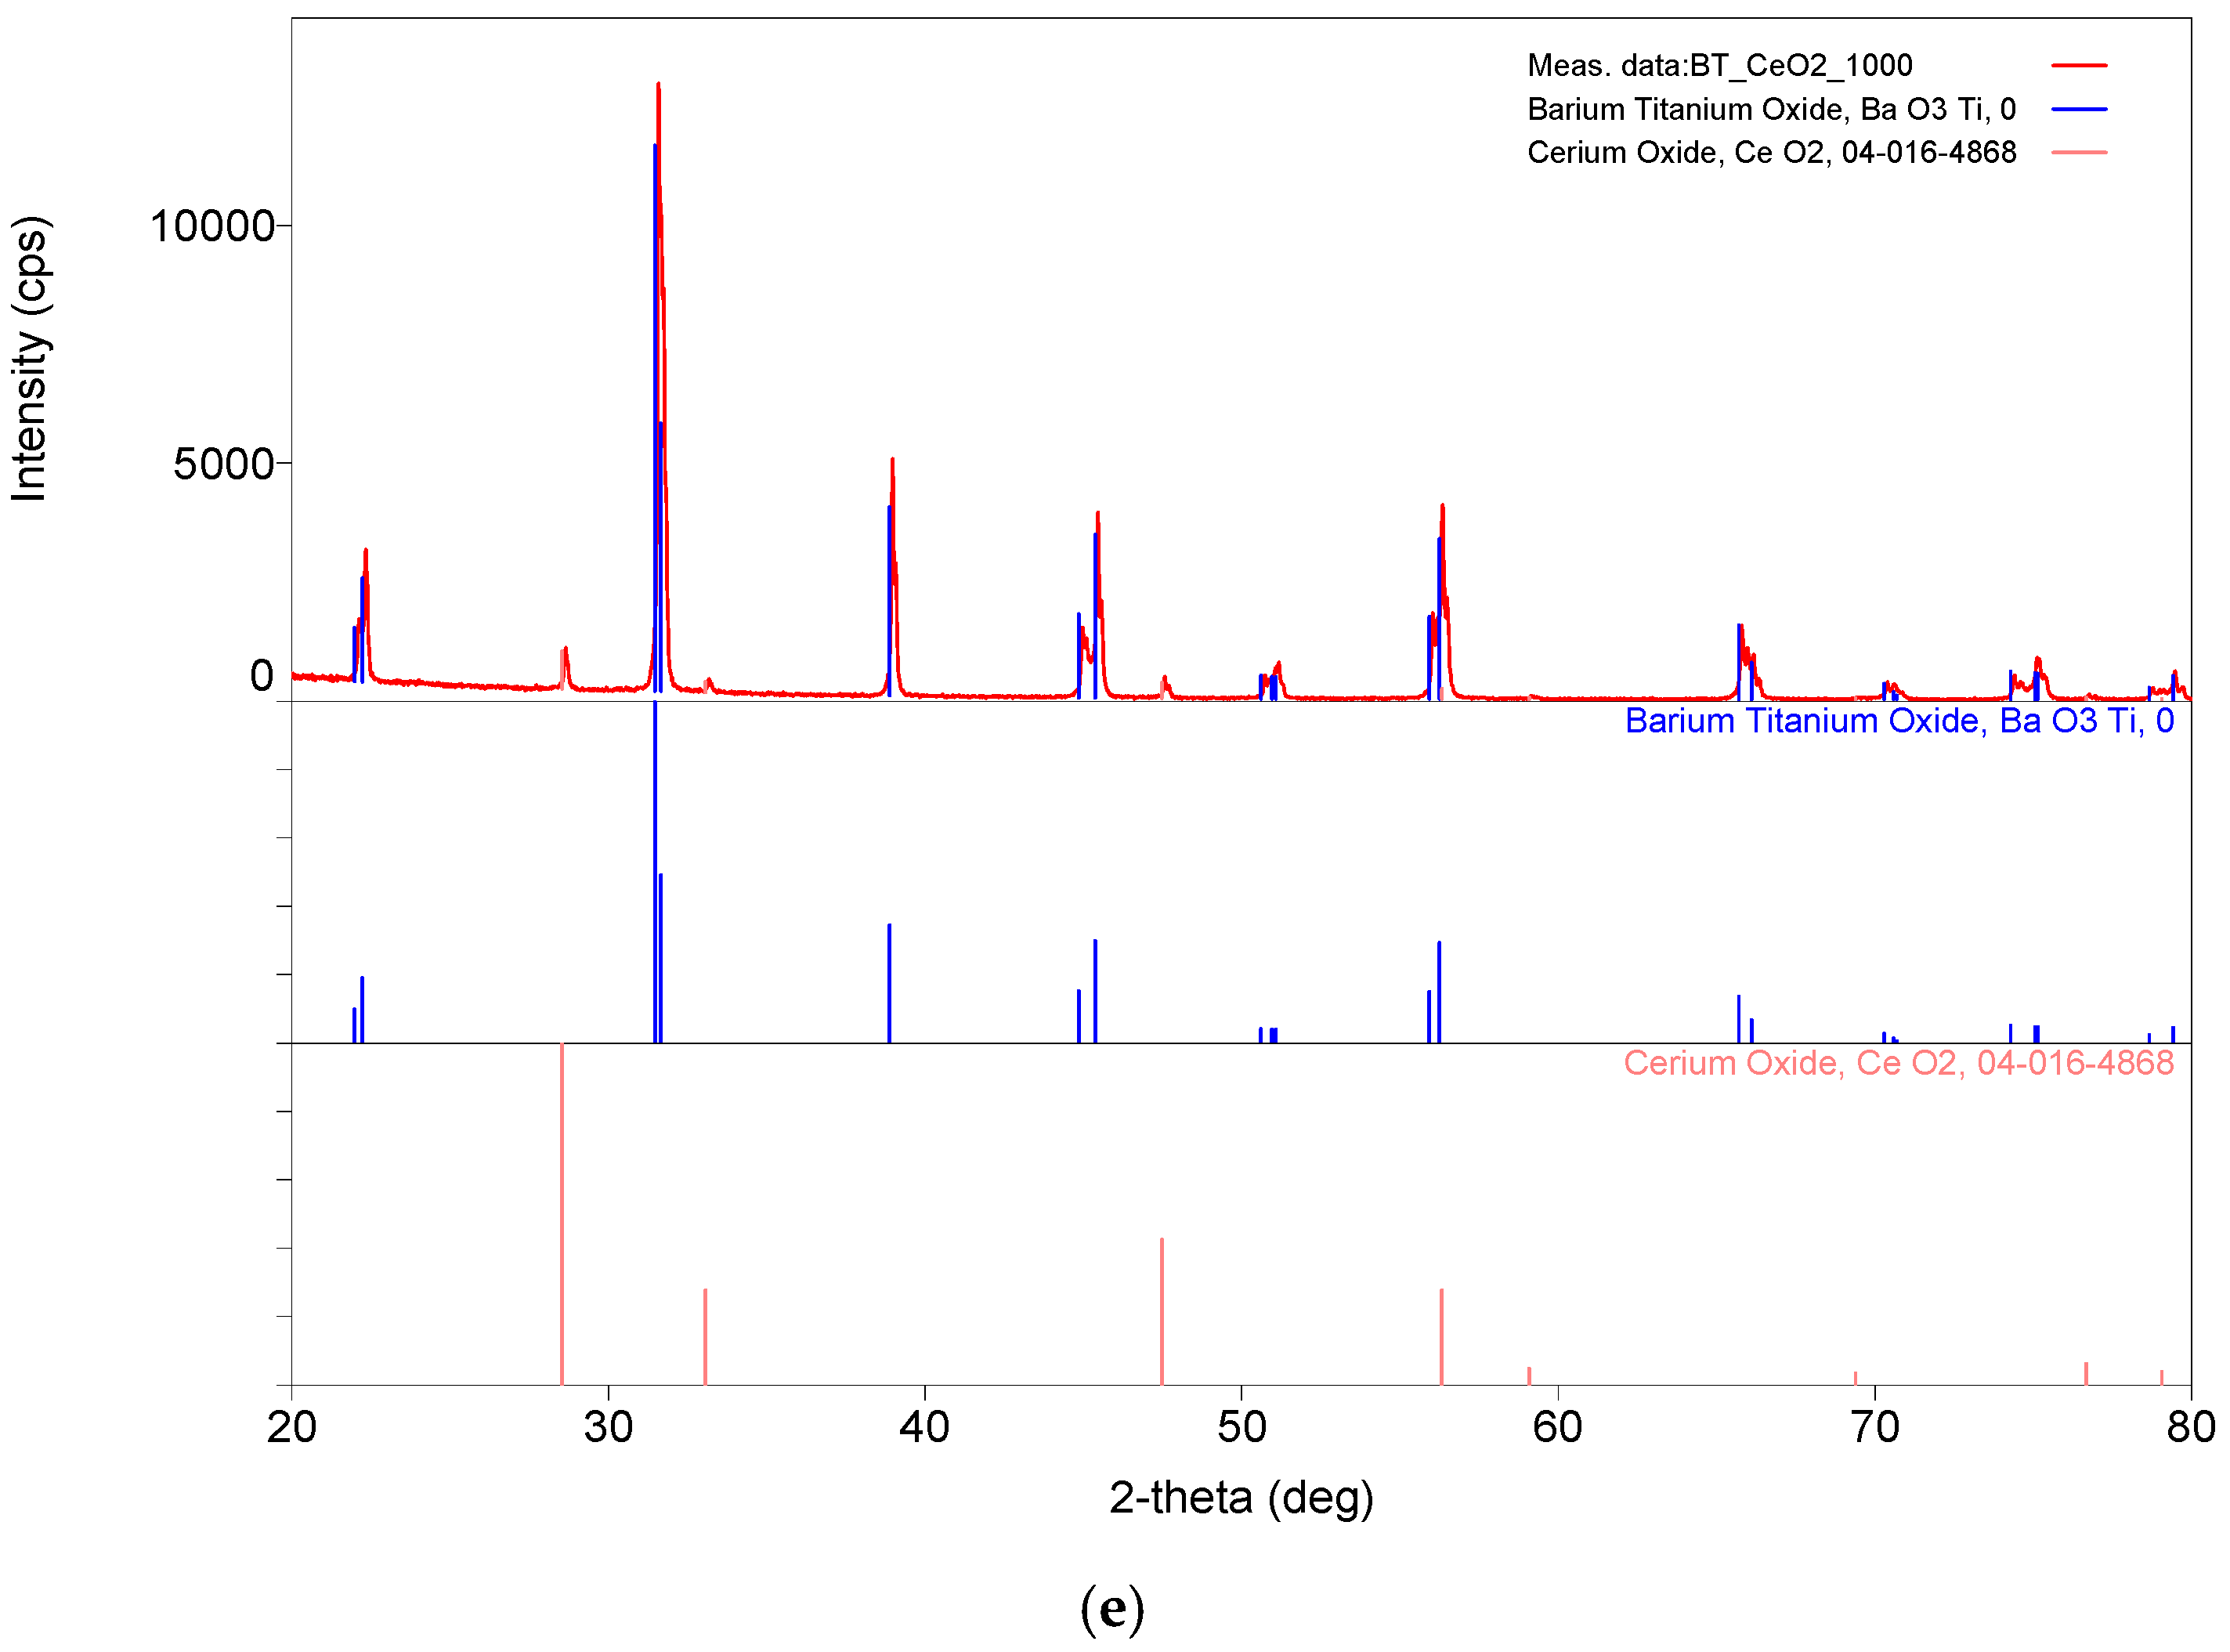
XRD analysis (
Figure 8e) reveals a dominant tetragonal BaTiO
3 phase (a = 3.997 Å, c = 4.036 Å, c/a = 1.0097) with an estimated crystallite size of 86.3 nm. Additional reflections attributed to CeO
2 are observed, suggesting partial segregation of cerium and incomplete incorporation into the perovskite lattice at the applied calcination temperature.
3.9. Ba0.95Ce0.05TiO3 Calcined at 1100 °C
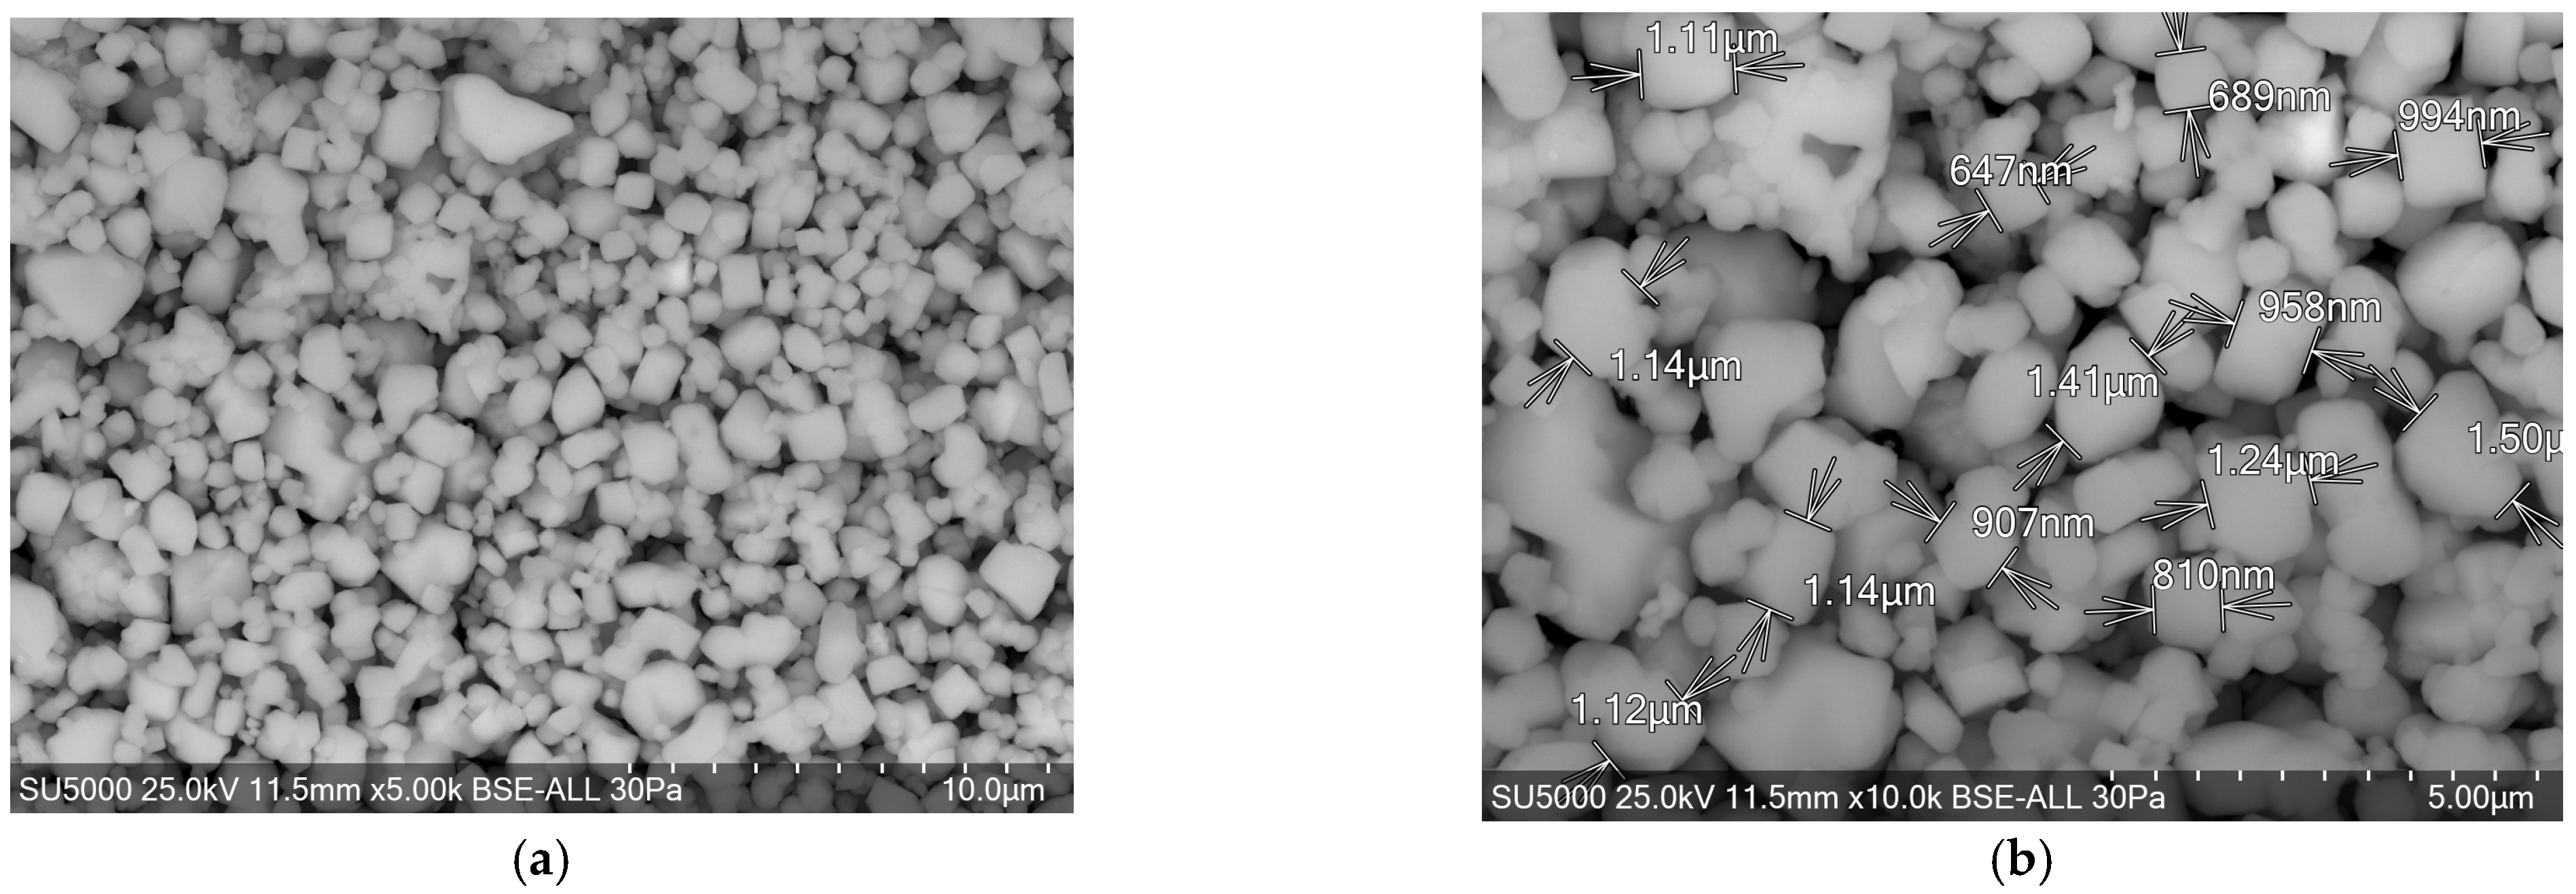
At 1100 °C, the Ce-doped sample exhibits a denser and more uniformly calcined microstructure (
Figure 9a). Grain sizes range from 647 nm to 1500 nm (
Figure 9b).
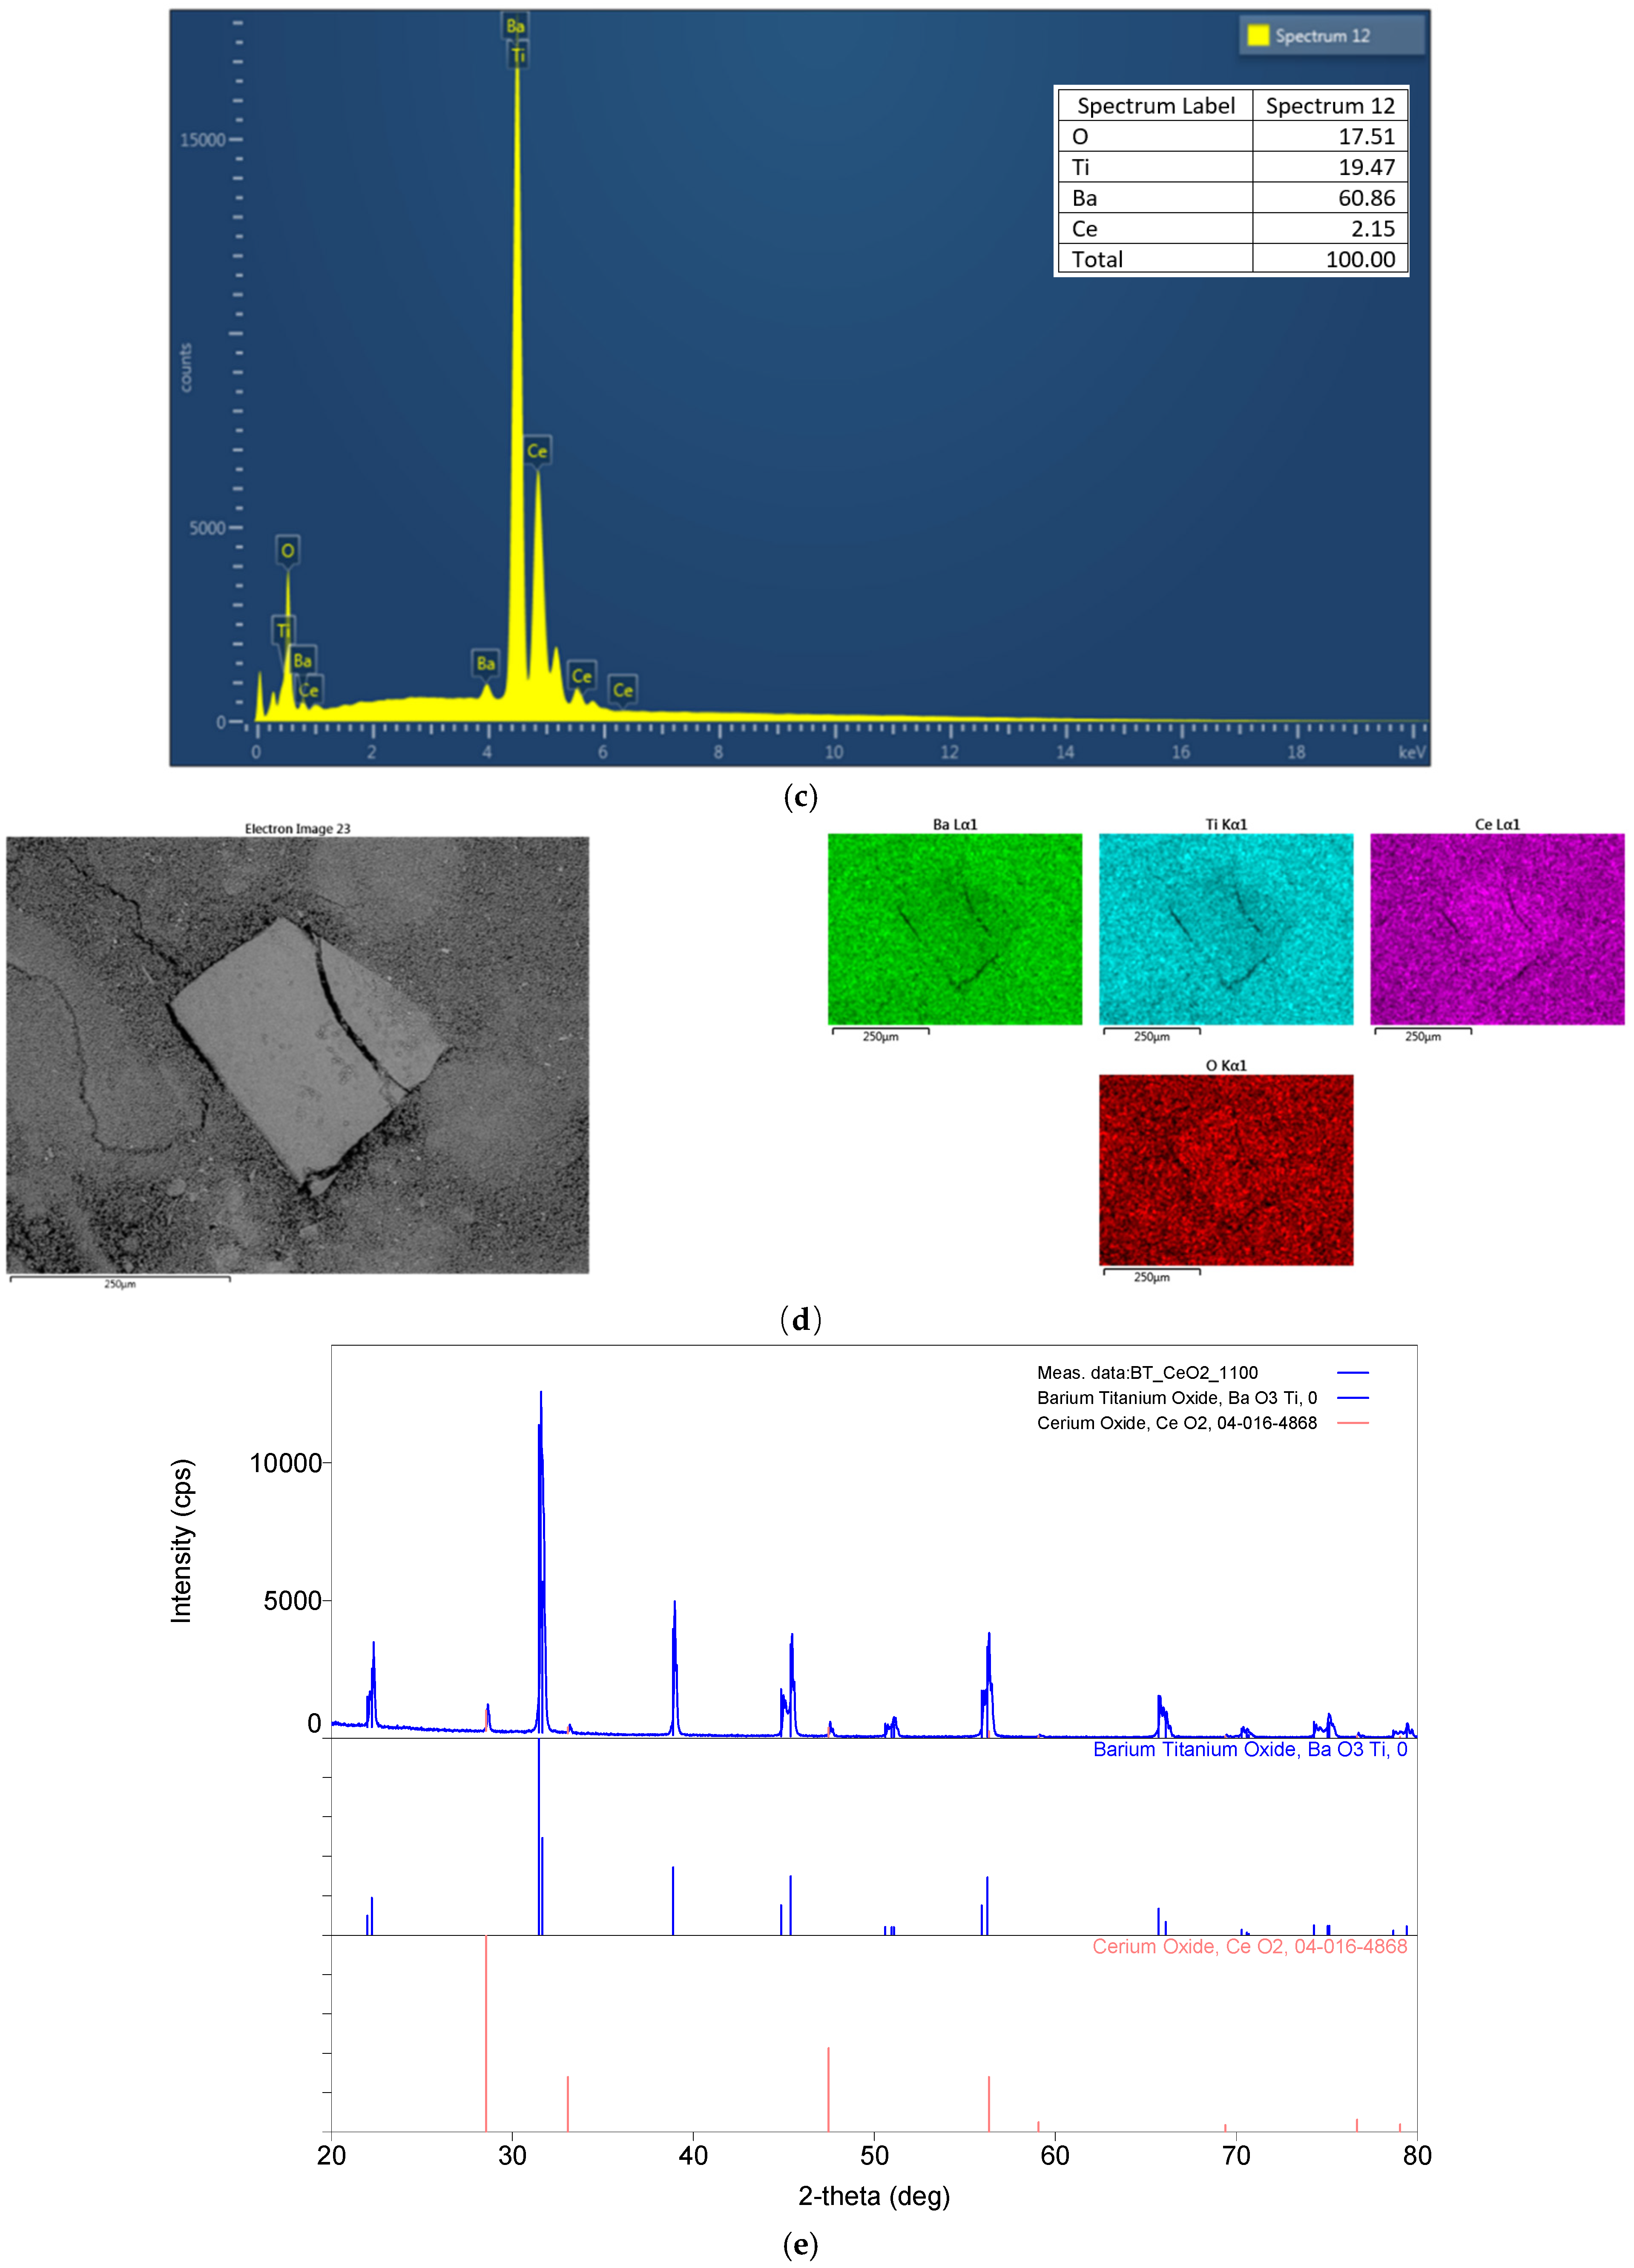
EDS spectra (
Figure 9c) and elemental maps (
Figure 9d) confirm dopant stability and homogeneous distribution.
XRD analysis (
Figure 9e) confirms the predominance of the tetragonal BaTiO
3 phase, with lattice parameters a = 3.997 Å and c = 4.037 Å, corresponding to a c/a ratio of 1.010 and an estimated crystallite size of 87.1 nm. However, diffraction peaks associated with a secondary CeO
2 phase are still detected, indicating that cerium incorporation into the BaTiO
3 lattice remains incomplete even after calcination at 1100 °C.
3.10. BaTi0.95Mn0.025Nb0.025O3 Calcinated at 1000 °C
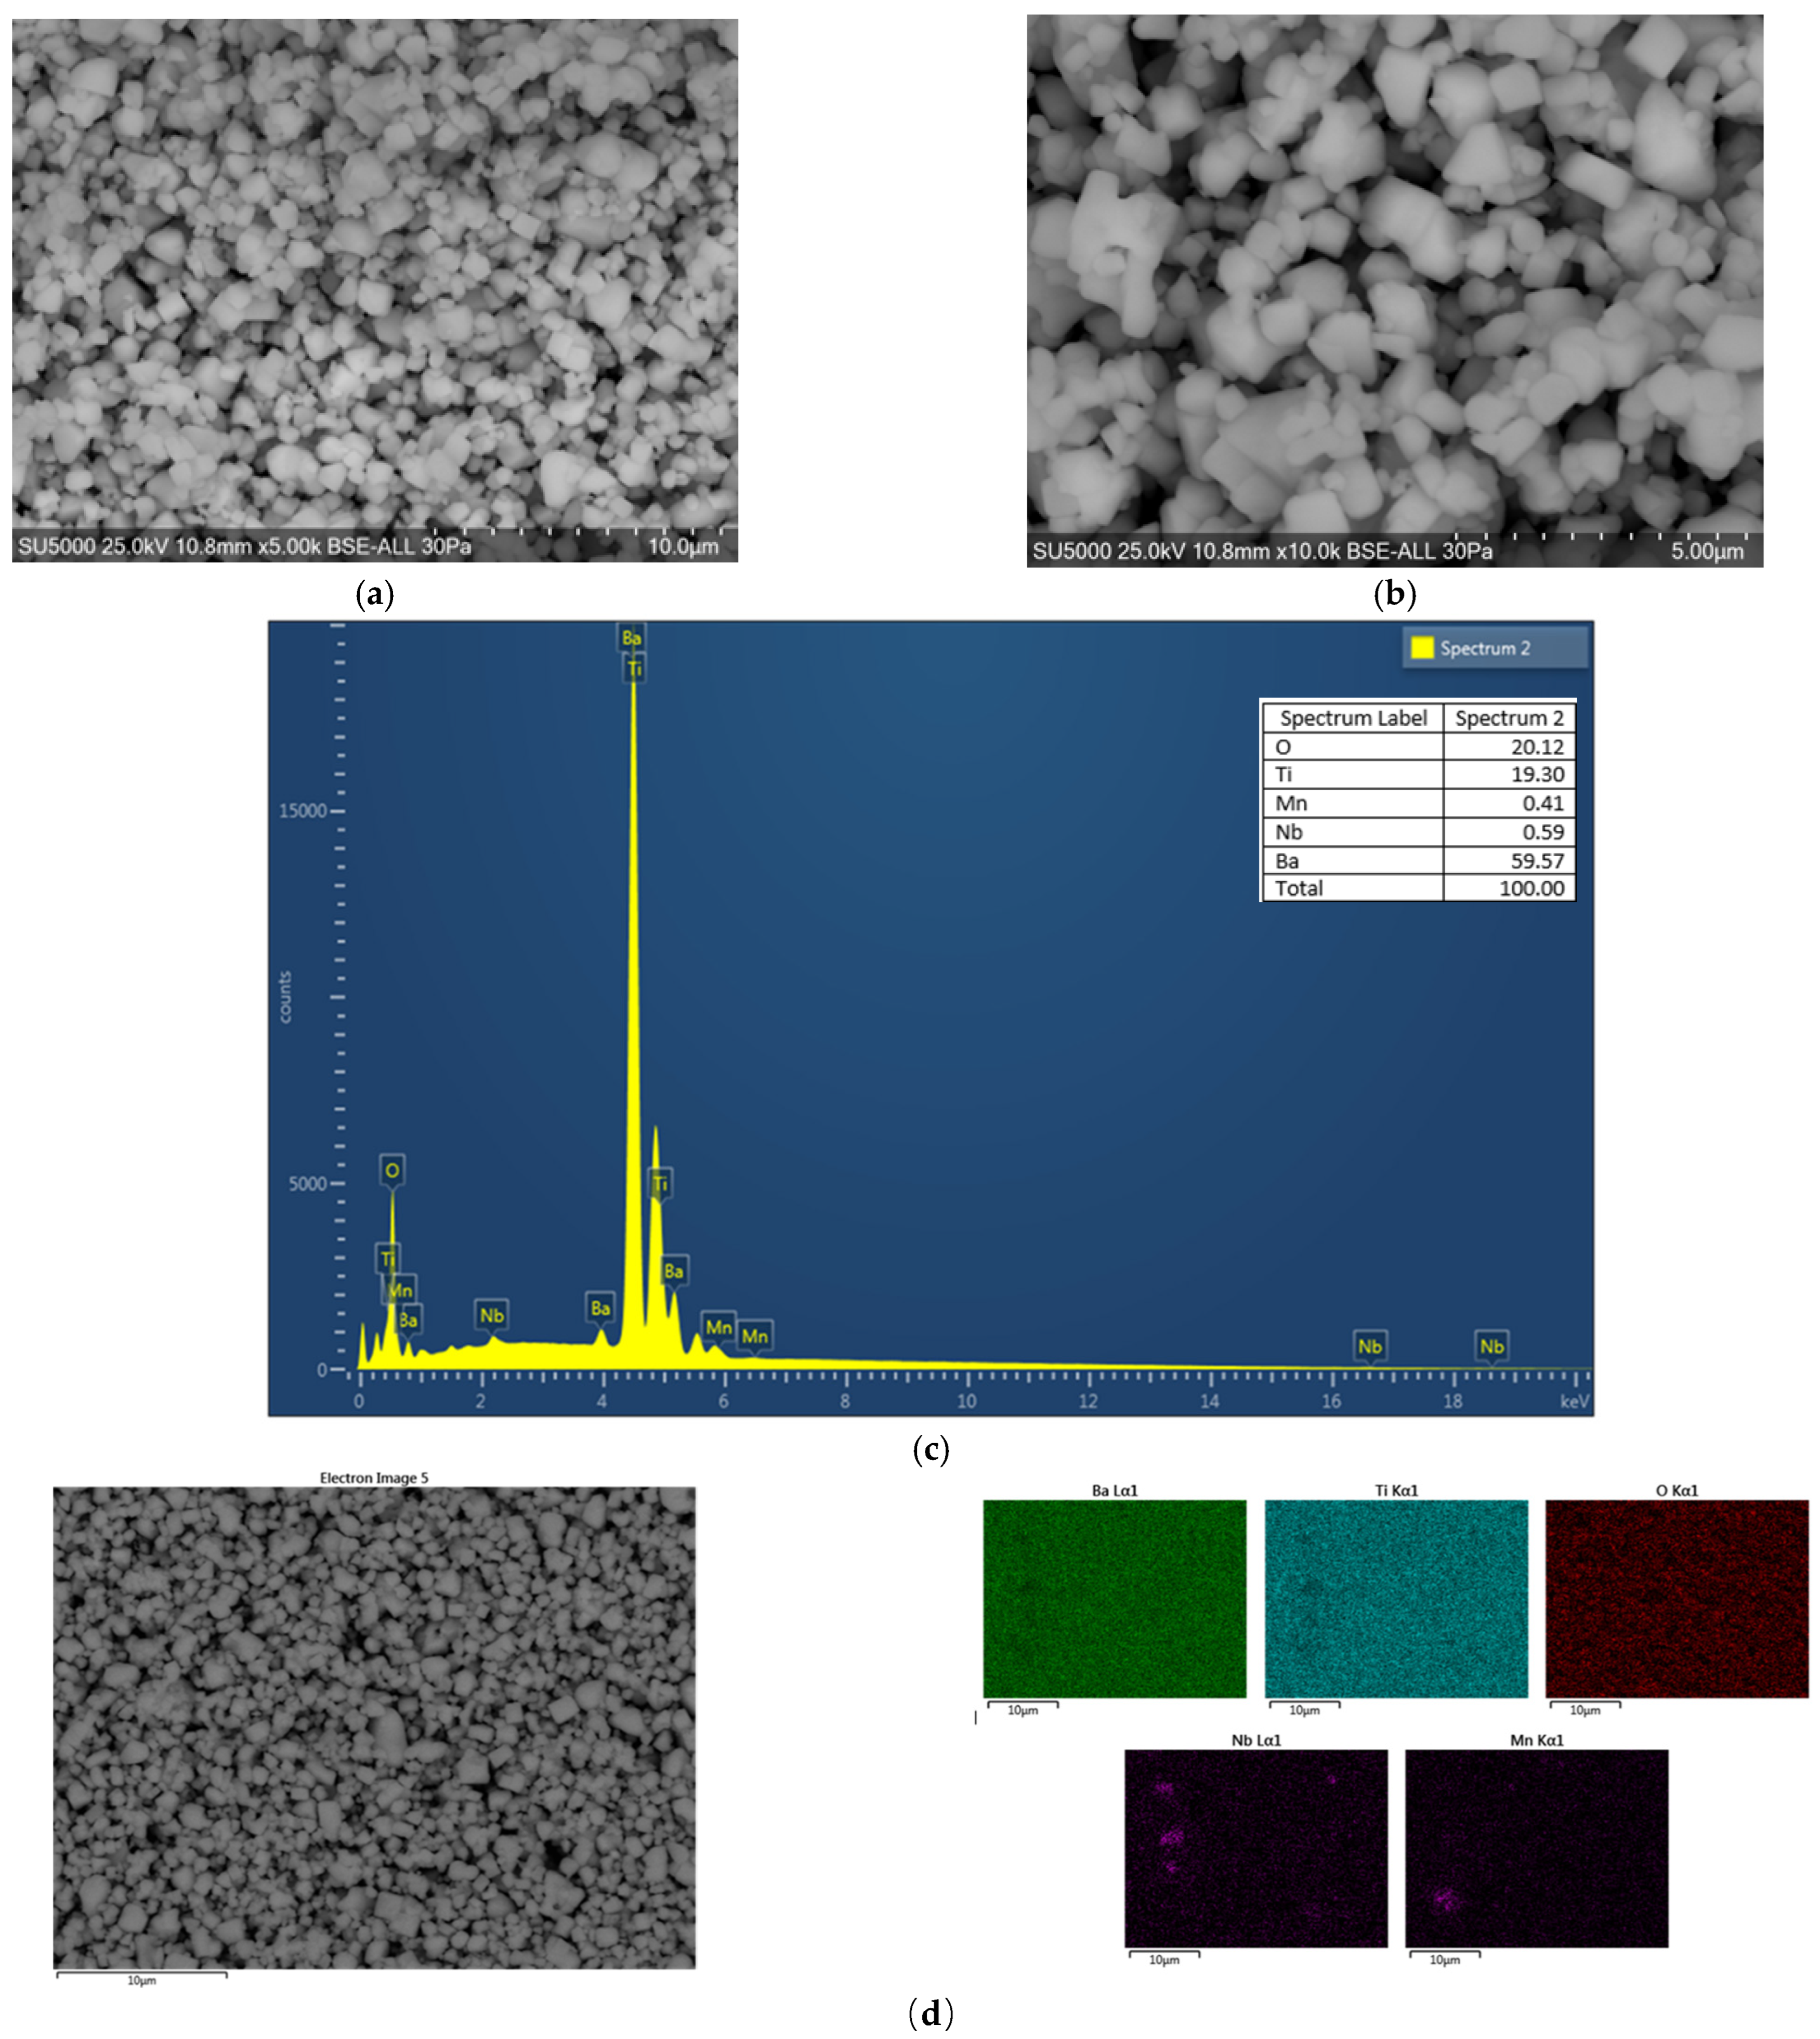
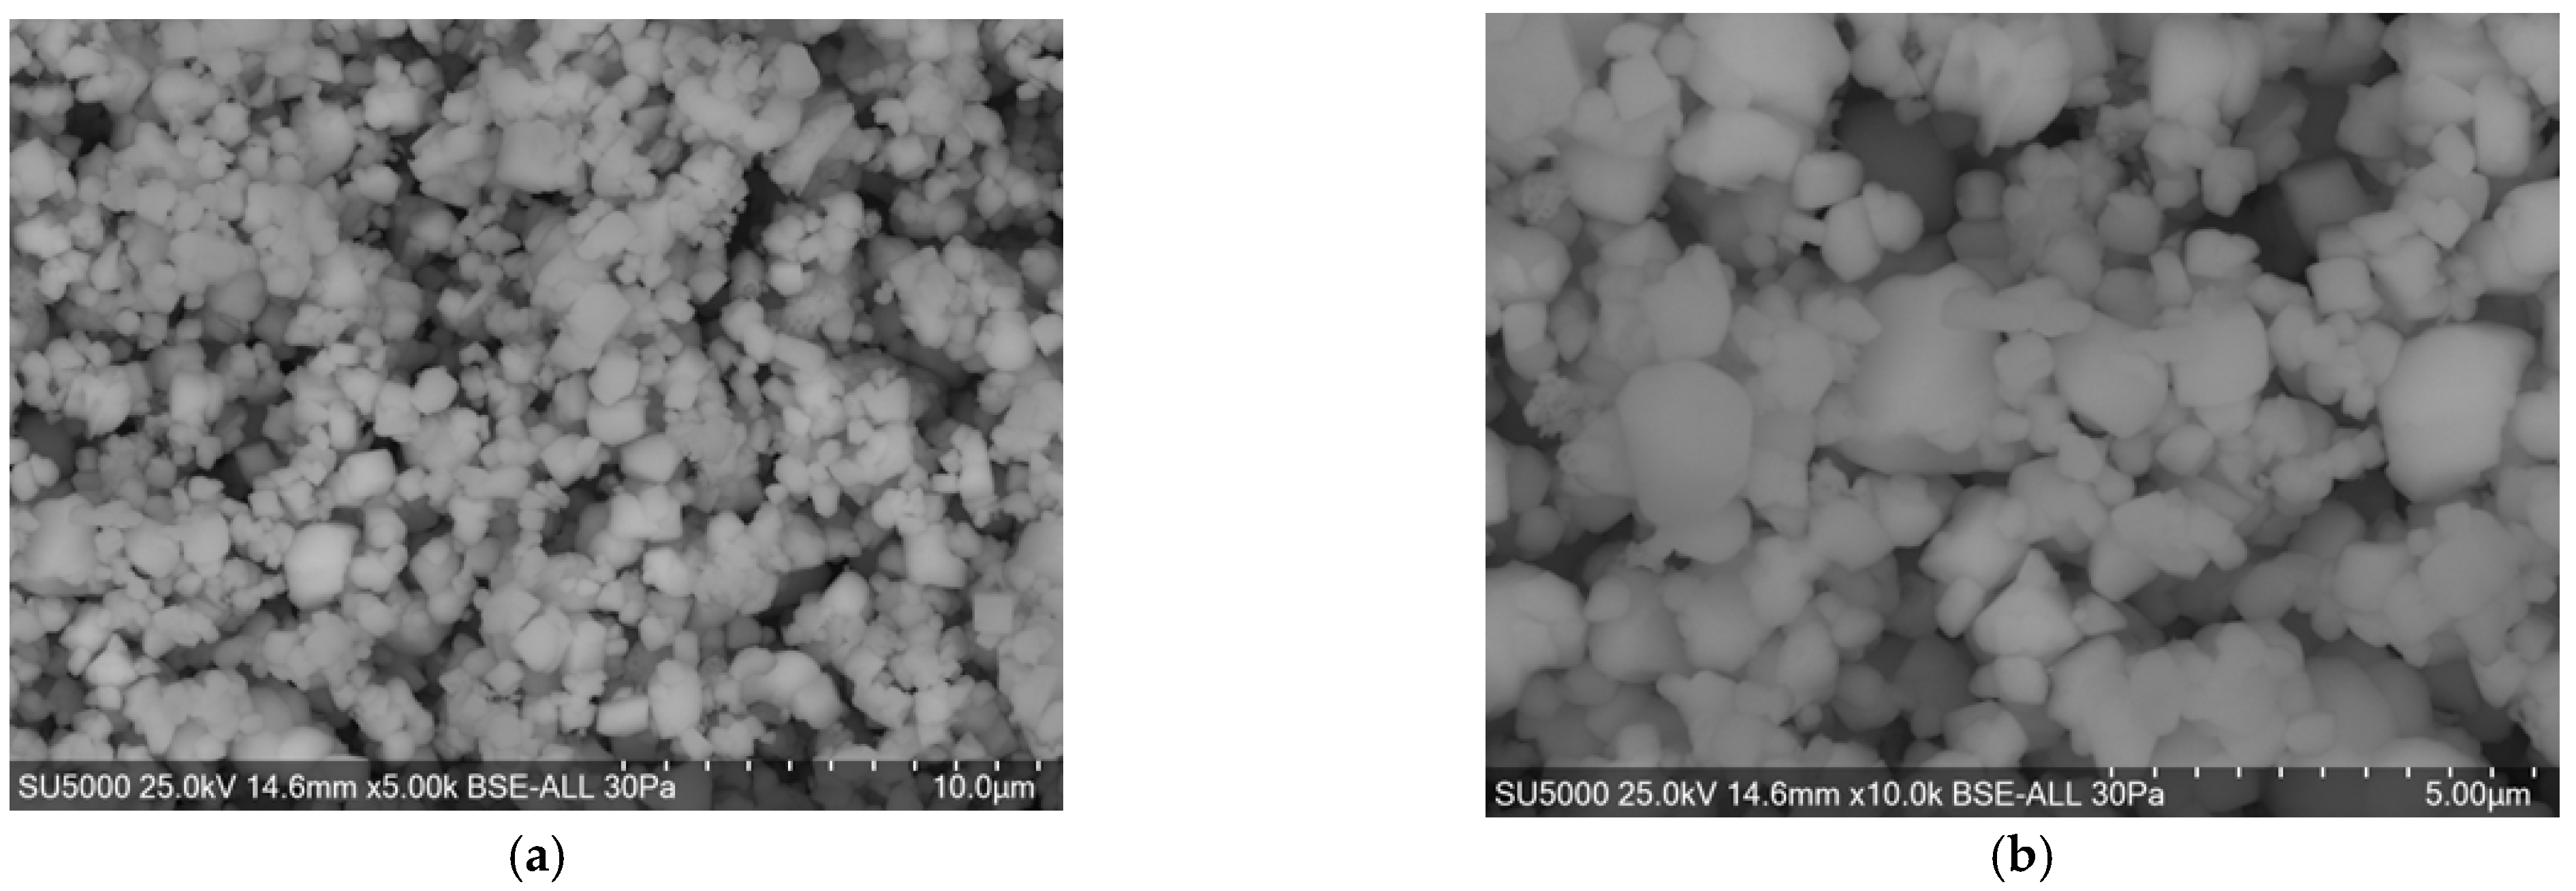
At intermediate magnification (
Figure 10a), polyhedral grains with a broad size distribution are observed, indicating non-uniform grain growth during thermal treatments. High-magnification images (
Figure 10b) reveal well-defined grains with sharp edges and relatively smooth surfaces, characteristic of a well-developed crystalline ceramic structure.
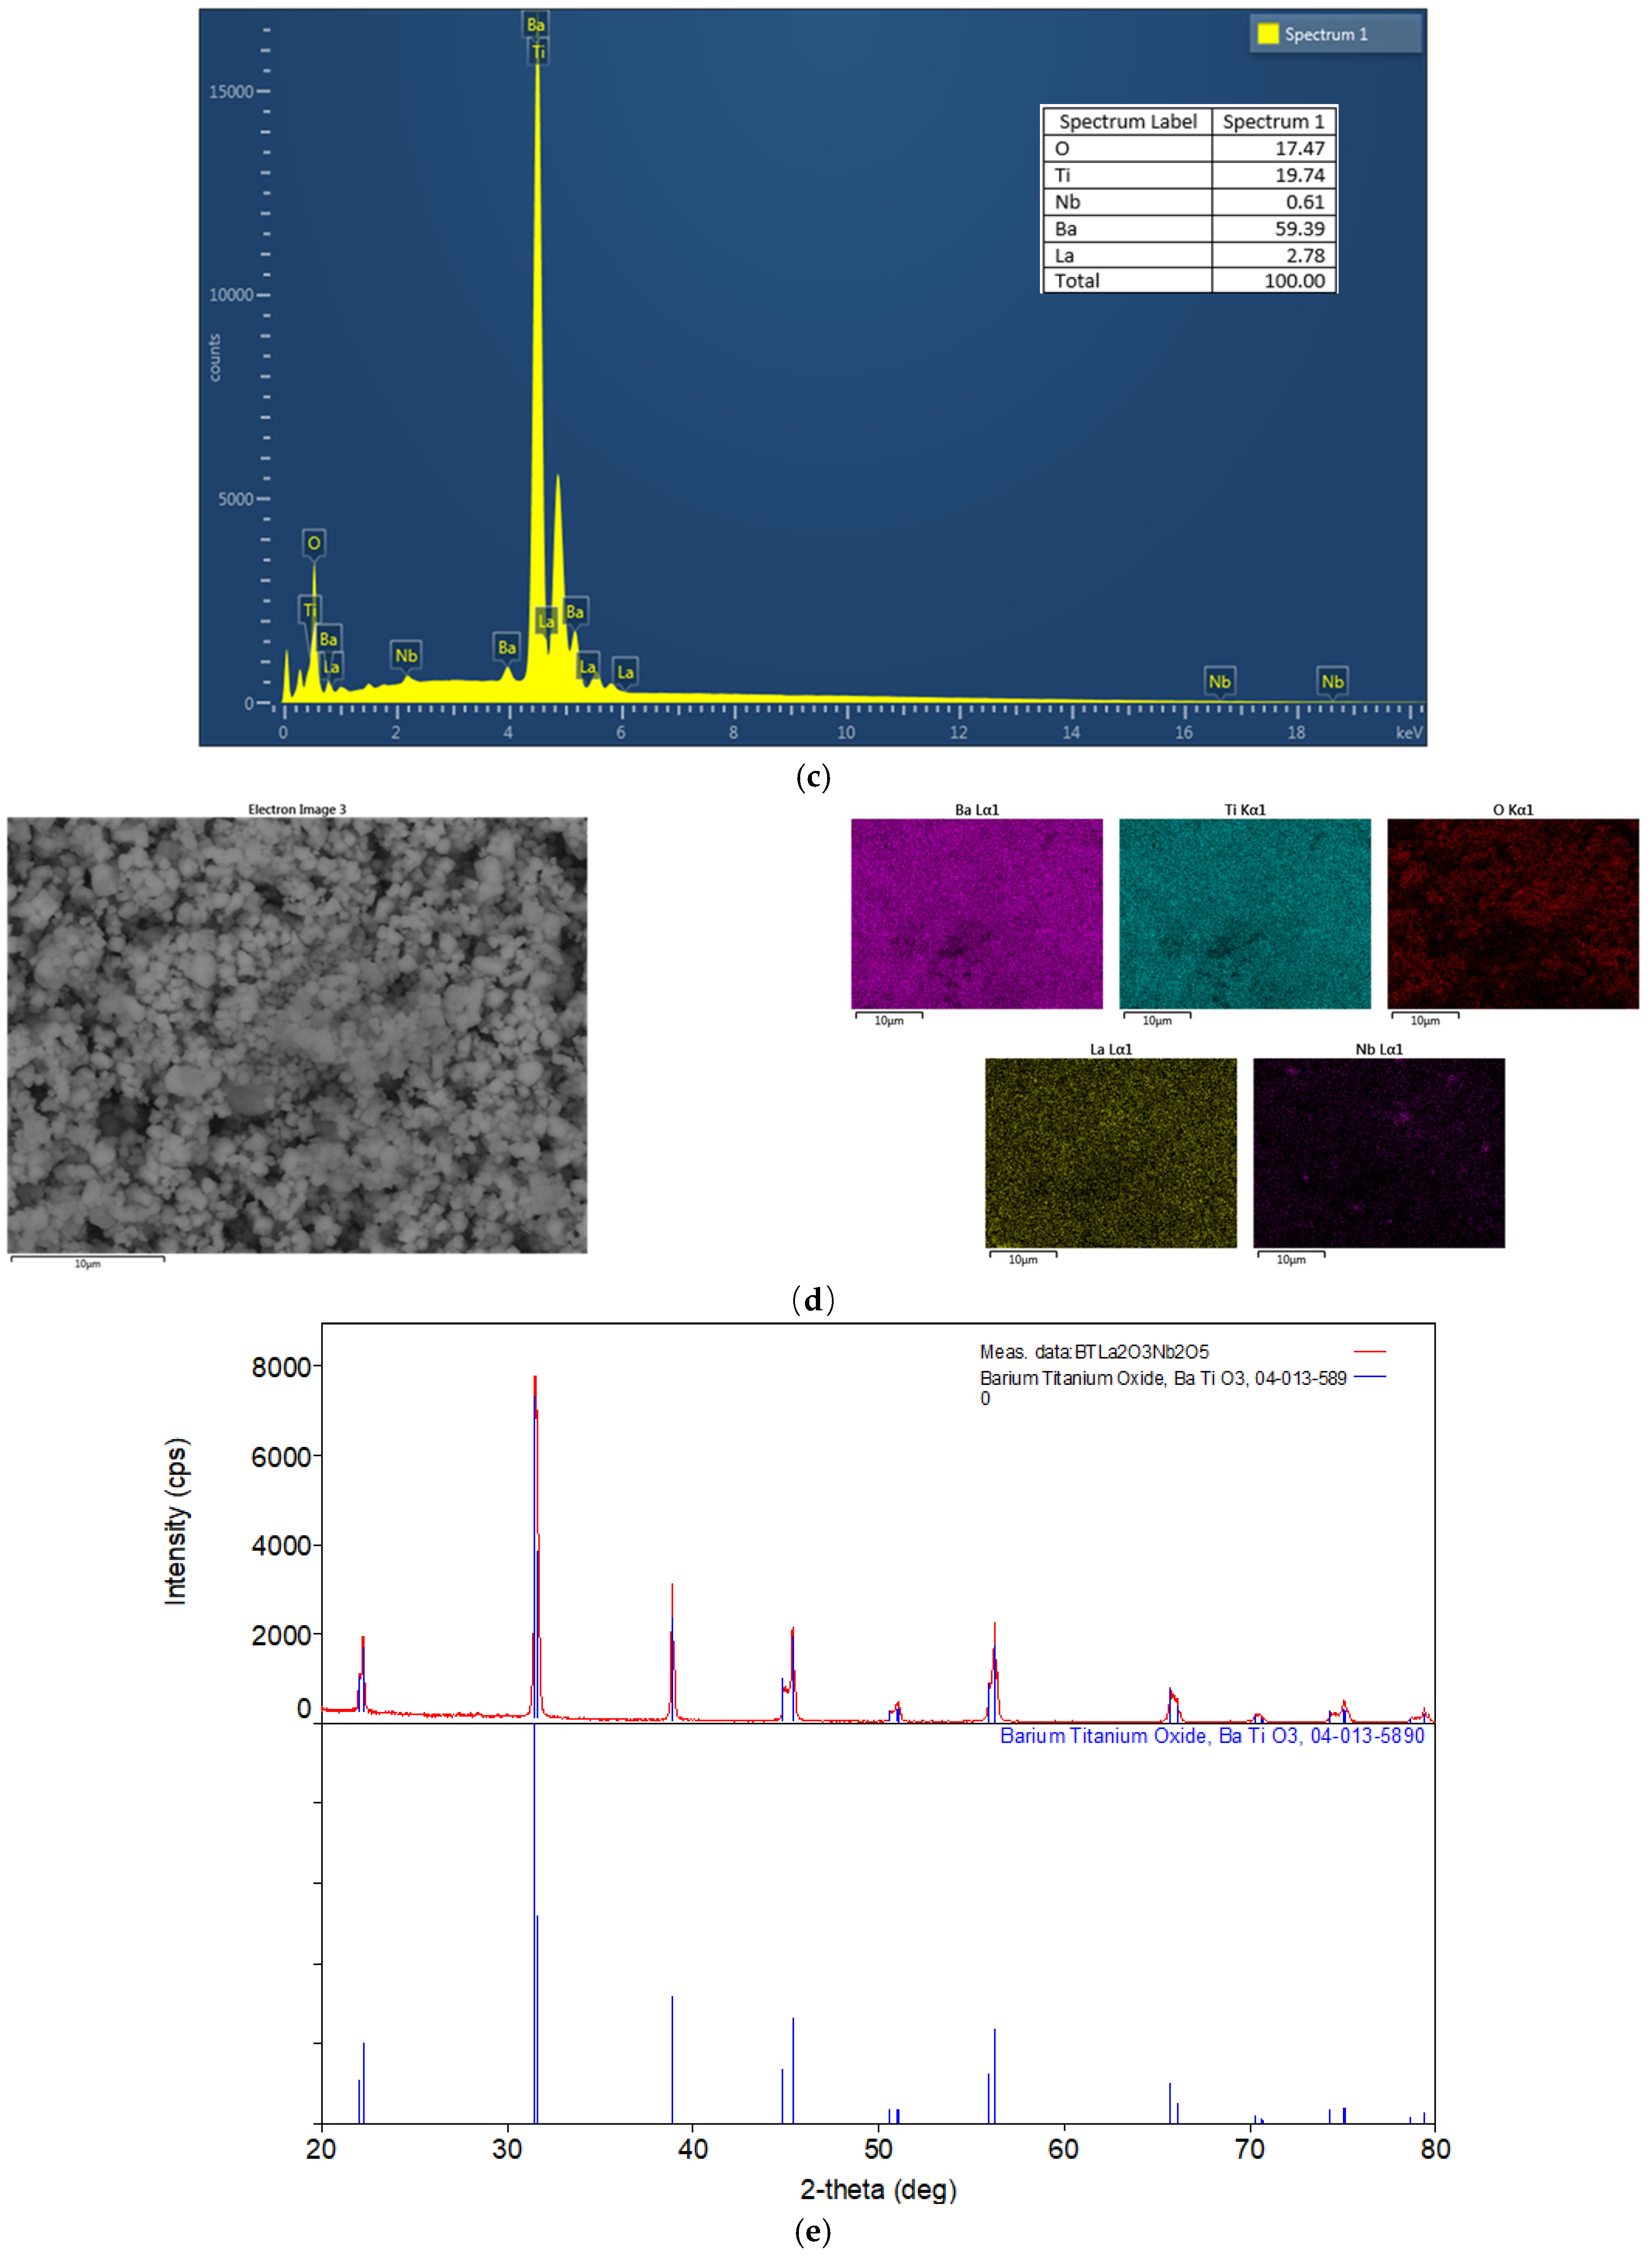
EDS spectra (
Figure 10c) and elemental mapping (
Figure 10d) confirm the presence of Ba, Ti, and O characteristic of the BaTiO
3 structure, as well as the incorporation of Mn and Nb dopants at low concentrations.
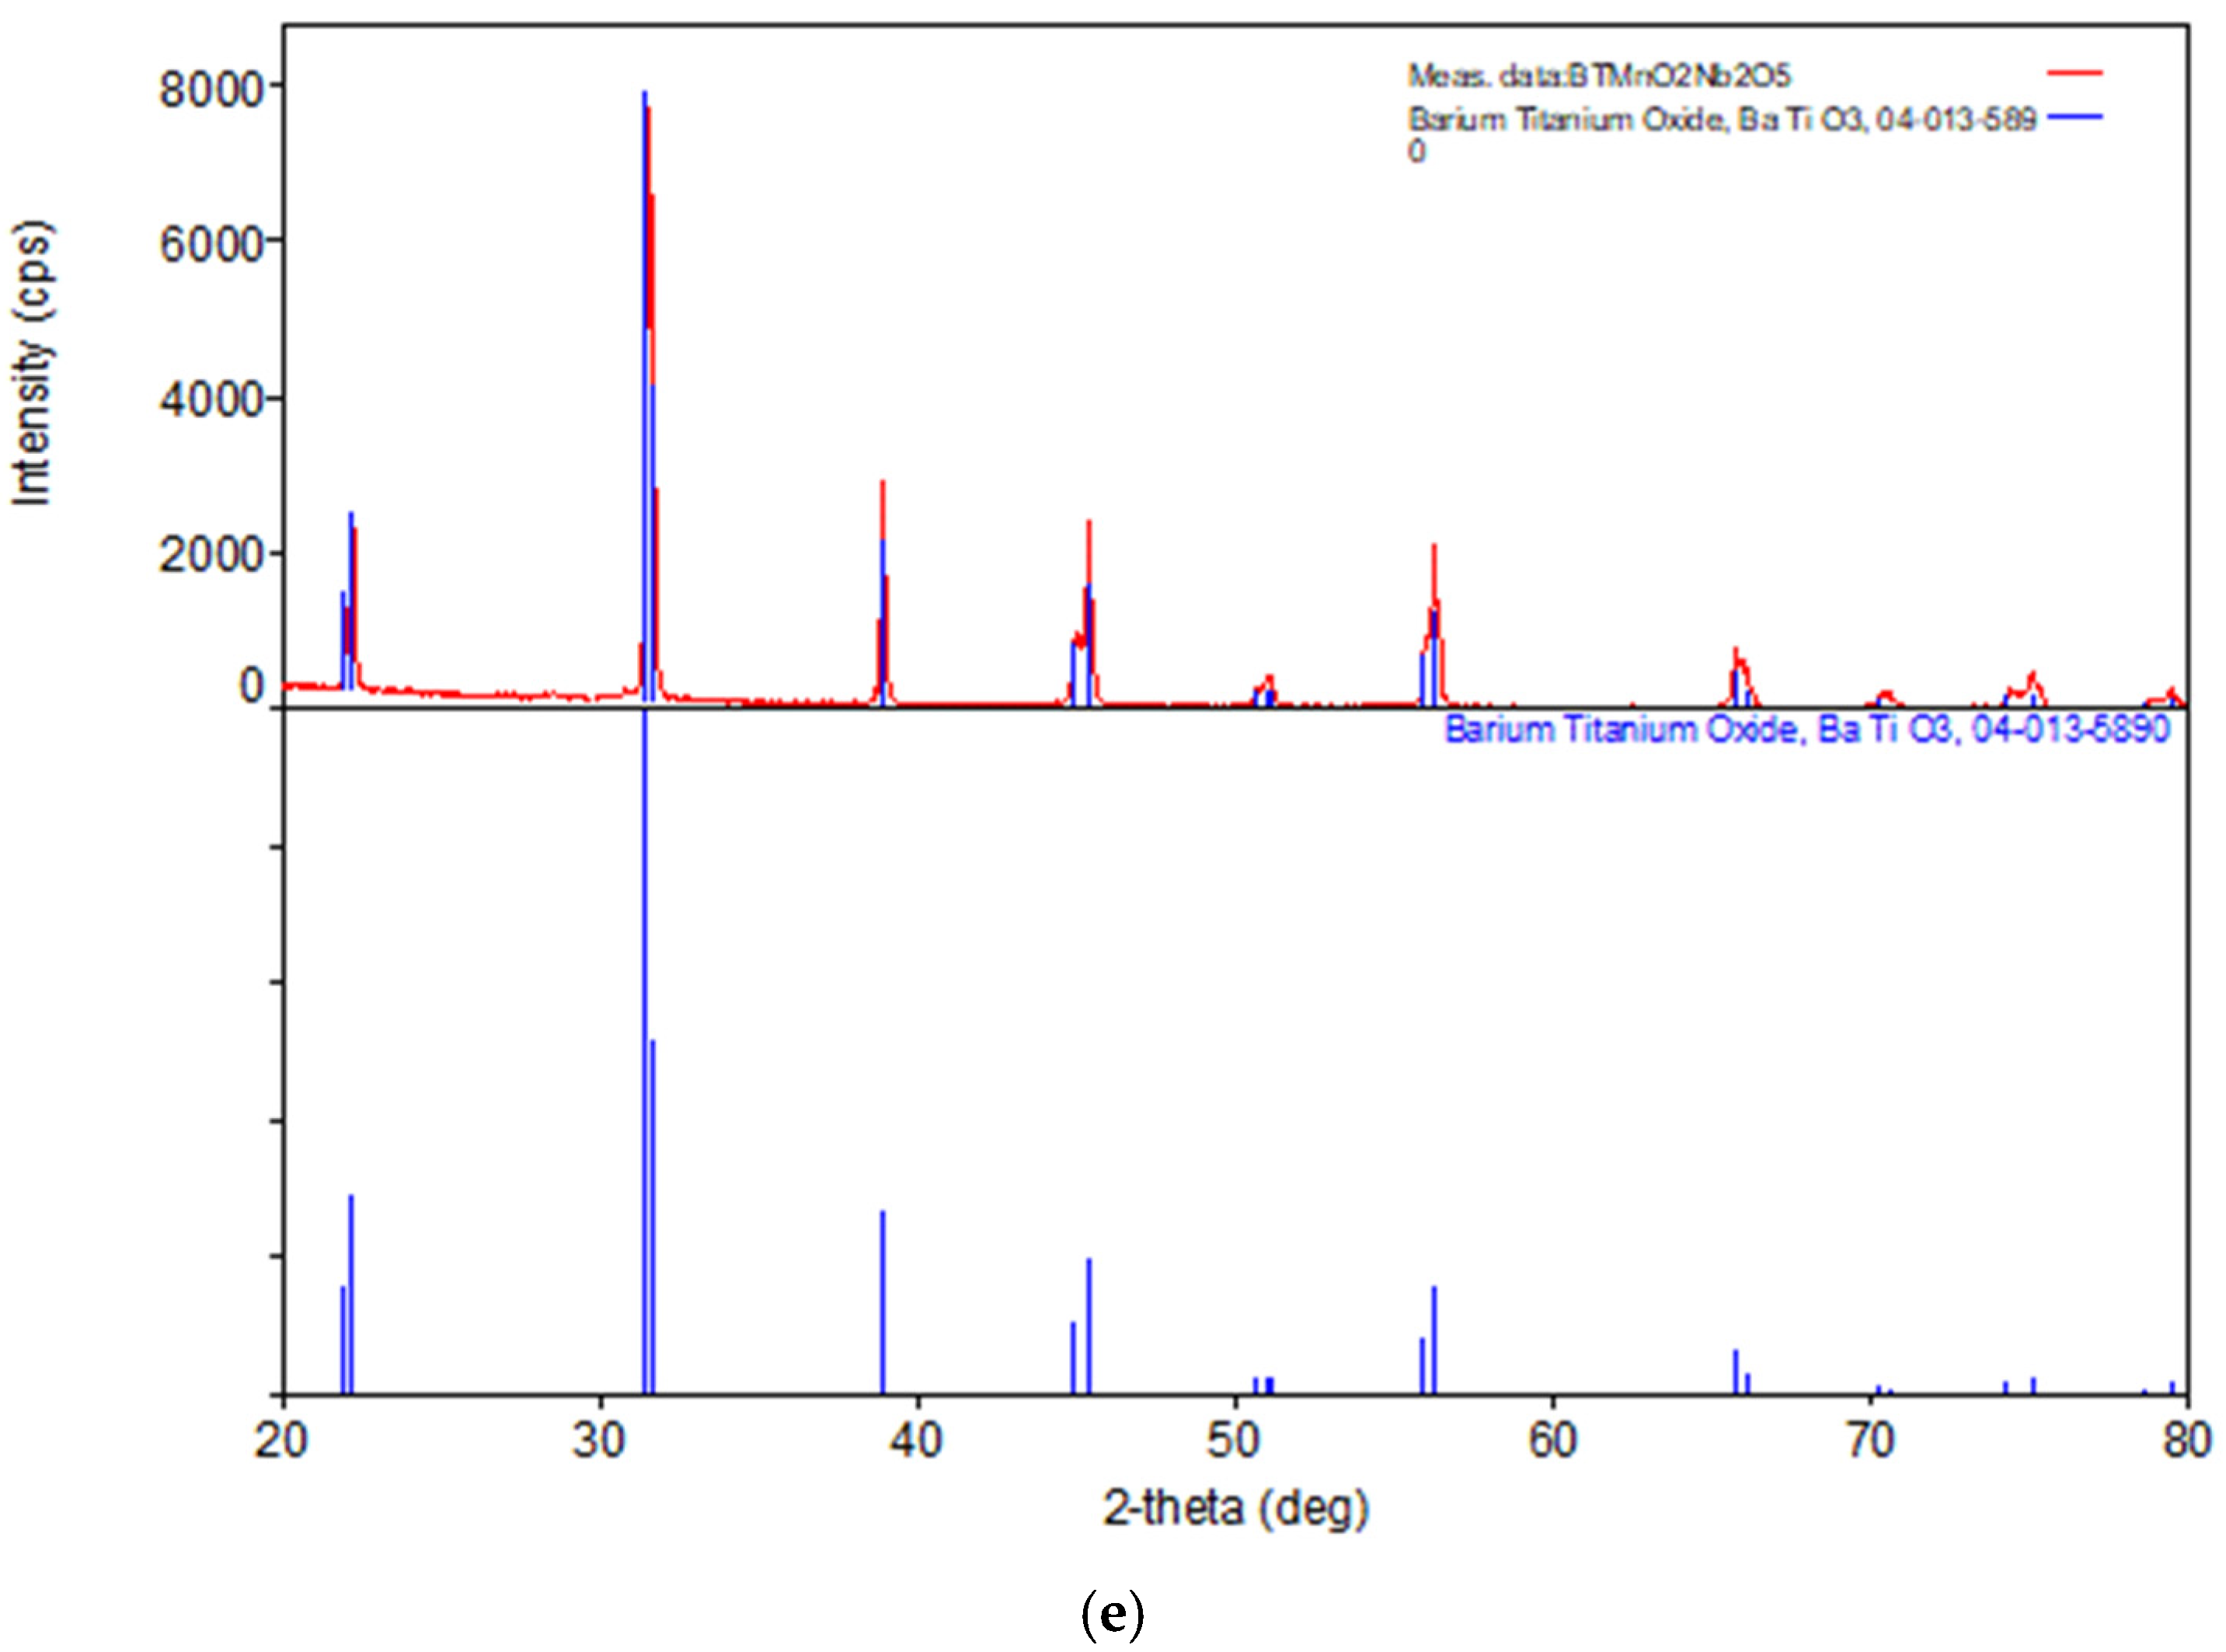
XRD analysis (
Figure 10e) reveals a tetragonal perovskite BaTiO
3 phase with lattice parameters a = 3.9978 Å and c = 4.0308 Å, corresponding to a c/a ratio of 1.008 and a crystallite size of 97.8 nm. The absence of secondary phases indicates incorporation of the dopant ions into the BaTiO
3 lattice, confirming the structural stability of the co-doped system.
3.11. Ba0.975La0.025Ti0.975Nb0.025O3 Calcinated at 1000 °C
At intermediate magnification (
Figure 11a), polyhedral grains with a relatively uniform size distribution are observed, indicating controlled grain growth during thermal treatments. High-magnification images (
Figure 11b) show well-separated grains with clearly defined boundaries and uniform BSE contrast.
EDS spectrum (
Figure 11c) and elemental distribution maps (
Figure 11d) confirm the presence of Ba, Ti, and O characteristic of the BaTiO
3 structure, as well as La and Nb dopants, suggesting a good chemical homogeneity and effective incorporation of La and Nb into the BaTiO
3 perovskite lattice.
XRD analysis (
Figure 11e) reveals a tetragonal perovskite BaTiO
3 phase with no detectable secondary phases, confirming the formation of a monophase material. The absence of La- or Nb-containing oxide reflections indicates effective incorporation of the dopant ions into the BaTiO
3 lattice. The refined lattice parameters (a = b = 3.9971 Å, c = 4.0299 Å) confirm the preservation of the tetragonal structure, with a c/a ratio of 1.0082 and a crystallite size of 101.6 nm.
3.12. Determination of the d33 Piezoelectric Coefficient
The piezoelectric coefficient d
33 was estimated using a semi-empirical scaling relationship that correlates the tetragonality of the crystal structure and crystallite size effects with the electromechanical response of the material [
39,
40,
41,
42,
43,
44,
45]. The values obtained using this approach should be regarded as comparative estimates based on structural parameters, rather than directly measured experimental values.
In tetragonal perovskite-type ferroelectrics, spontaneous polarization is directly related to the distortion of the crystal lattice, which can be expressed by the tetragonality ratio (c/a). Since the piezoelectric response is proportional to spontaneous polarization and dielectric susceptibility, the piezoelectric coefficient d33 is expected to scale with the c/a ratio.
Furthermore, a reduction in crystallite size leads to a decrease in spontaneous polarization due to surface effects and internal stresses, which become significant at submicrometric dimensions. To account for this size-dependent effect, a correction term related to crystallite size was introduced. Accordingly, the effective piezoelectric coefficient was estimated using the following semi-empirical expression:
where
represents a reference value reported for well-sintered bulk BaTiO
3,
is the tetragonality ratio of the analyzed sample determined from XRD lattice parameters, and
corresponds to the tetragonality of undoped BaTiO
3 at room temperature. The term
denotes the average crystallite size, while the parameter
Dc represents the critical crystallite size below which ferroelectric order and spontaneous polarization decrease due to size effects in nanocrystalline BaTiO
3.
The estimation model used for the piezoelectric coefficient d
33 is based on structure–property relationships reported for BaTiO
3 ferroelectrics. It is well known that ferroelectric polarization in perovskite materials originates from lattice distortion and ionic displacement within the crystal structure [
40,
41,
42,
43]. In tetragonal BaTiO
3, spontaneous polarization is related to lattice distortion and tetragonality (
c/a − 1), which can therefore be used as a structural indicator of ferroelectric behavior. Since piezoelectric response is directly related to spontaneous polarization, the piezoelectric coefficient can be correlated with tetragonality. In addition, ferroelectric and piezoelectric properties in BaTiO
3 are influenced by crystallite or grain size due to size effects and domain stability, and a critical size has been reported below which ferroelectric properties are reduced. Therefore, a size correction term is introduced to account for crystallite size effects. The resulting relationship should be considered a semi-empirical structure-based estimation model intended for comparative analysis rather than direct experimental determination of the piezoelectric coefficient.
The presence of a non-ferroelectric CeO2 phase may influence microstructural evolution and the structural parameters used for estimating the piezoelectric coefficient; therefore, the calculated d33 values for Ce-containing samples should be interpreted with caution.
This approach enables a relative comparison of the piezoelectric response among differently doped samples without replacing direct experimental measurements of the d33 coefficient.
The structural and estimated piezoelectric parameters for undoped and doped BaTiO
3 samples are summarized in
Table 1. The table includes the tetragonality ratio (
c/a), crystallite size determined from structural analysis, grain size, and the estimated
d33 values calculated both as a function of the
c/a ratio and by correlating
c/a with crystallite size.
4. Discussion
This study provides a comprehensive understanding of how dopant chemistry and thermal treatment govern the structural and microstructural evolution of BaTiO3-based piezoceramics. The comparative analysis of singly doped, co-doped, and calcination-temperature-dependent samples highlights the strong interplay between lattice distortion, defect chemistry, and microstructural development.
The introduction of co-doping strategies, as demonstrated by the Mn–Nb and La–Nb co-doped powders calcined at 1000 °C, represents a particularly relevant pathway for tailoring the functional behavior of BaTiO3. By combining acceptor–donor (Mn–Nb) and donor–donor (La–Nb) dopant pairs, co-doping enables a more controlled balance between charge compensation mechanisms, oxygen vacancy concentration, and grain growth kinetics. Such synergistic effects offer enhanced flexibility in tuning structural stability and microstructural uniformity compared to single-element doping.
Building on these results, multi-element doping approaches, including the incorporation of three dopants, may provide additional degrees of freedom for fine control of defect populations and lattice distortion. Carefully designed tri-doping strategies could allow simultaneous regulation of tetragonality, crystallite size, and grain morphology, potentially overcoming the limitations observed for specific single dopants, such as limited solubility or secondary phase formation.
Beyond compositional design, alternative thermal processing routes represent another promising research direction. Solar sintering, which employs concentrated solar energy as a sustainable heat source, offers rapid heating rates and reduced carbon emissions. Such non-conventional sintering profiles may significantly influence defect redistribution and grain boundary behavior, particularly in doped and co-doped BaTiO3 systems.
Furthermore, extending the investigated dopant concentration ranges and systematically correlating them with functional properties—such as dielectric permittivity, piezoelectric coefficients, and Curie temperature—would provide deeper insight into structure–property relationships. This approach is especially relevant for co-doped systems, where non-linear effects may arise from dopant–dopant interactions.
Finally, integrating advanced characterization techniques with device-level testing will be essential for translating these material-level insights into practical applications. The combined optimization of dopant chemistry, co-doping strategy, and thermal treatment supports the rational design of next-generation, lead-free ferroelectric materials tailored for sensors, actuators, energy-harvesting devices, and microelectromechanical systems.
Additional confirmation of crystallite size and defect structure could be obtained through transmission electron microscopy (TEM), which would provide nanoscale information regarding crystallite boundaries and defect structures. Such investigations are planned for future work.
It should be noted that doping concentration, dopant type, and calcination temperature are interrelated parameters that collectively influence defect chemistry, lattice distortion, and electrical behavior in BaTiO3-based materials. In this study, the doping concentration was kept constant in order to isolate and compare the influence of dopant chemistry and calcination temperature on structural and microstructural evolution. Optimization of doping concentration for each dopant system represents a separate research direction and was not the primary objective of the present work.
5. Conclusions
The present study highlights the significant influence of dopant chemistry, co-doping strategy, and calcination temperature on the structural and functional properties of BaTiO3-based piezoceramics synthesized by the solid-state calcination method.
Increasing the calcination temperature from 1000 °C to 1100 °C improves crystallinity and stabilizes the tetragonal BaTiO3 phase, as evidenced by intensified XRD peaks and slight lattice relaxation. Higher temperature also promotes microstructural homogenization and more effective dopant incorporation, except for Ce-doped samples, where secondary CeO2 phases persist.
All dopants preserve the tetragonal perovskite structure but influence lattice distortion and microstructure differently. Mn acts as an acceptor dopant, inducing oxygen vacancies and moderate lattice distortion, while Nb stabilizes the tetragonal phase and promotes uniform microstructural development. La substitution at the A-site slightly reduces tetragonality and favors fine-grained microstructures. The presence of CeO
2 secondary phases can be explained by the limited solubility of cerium in the BaTiO
3 lattice [
46,
47] and the mixed valence states of cerium (Ce
3+/Ce
4+), which complicate substitution mechanisms and may lead to partial segregation of cerium as CeO
2 during calcination.
The analysis of co-doped compositions (Mn–Nb and La–Nb) demonstrates the advantages of combined doping strategies, which enable improved control of defect chemistry and microstructural evolution compared to single-dopant systems.
The estimated piezoelectric coefficient d33 shows a strong dependence on both tetragonality and crystallite size. While higher c/a ratios are associated with increased estimated piezoelectric response, nanoscale crystallite dimensions reduce the effective response. The co-doped Mn–Nb and La–Nb samples calcined at 1000 °C exhibit the highest estimated d33 values, indicating a synergistic effect of co-doping. The piezoelectric coefficients discussed in this study are structurally estimated values derived from crystallographic parameters and crystallite size considerations, and should be interpreted as comparative indicators of piezoelectric potential rather than direct experimental piezoelectric measurements.
Overall, the results demonstrate that the combined optimization of dopant chemistry, co-doping strategy, and calcination temperature represents an effective pathway for tailoring the structural and functional properties of BaTiO3-based lead-free piezoelectric materials. The piezoelectric behavior discussed in this study is based on structural estimation and should be considered as a predictive analysis rather than a direct piezoelectric measurement.




 ,
,