Article

Natural Product-Oriented Reformulation of Muffins: Sourdough Fermentation with Leuconostoc citreum DSM 5577 for Sugar Reduction

1
Faculty of Food Science and Technology, University of Agricultural Sciences and Veterinary Medicine, 400372 Cluj-Napoca, Romania
2
Faculty of Horticulture and Business in Rural Development, University of Agricultural Sciences and Veterinary Medicine, 400372 Cluj-Napoca, Romania
3
Faculty of Physics, Babes-Bolyai University, 400084 Cluj-Napoca, Romania
*
Author to whom correspondence should be addressed.
Appl. Sci. 2026, 16(8), 3697; https://doi.org/10.3390/app16083697
Submission received: 18 March 2026 / Revised: 7 April 2026 / Accepted: 8 April 2026 / Published: 9 April 2026
(This article belongs to the Special Issue Advances in Natural Product Chemistry)

Abstract

This study aims to investigate the ability of sourdough fermented with Leuconostoc citreum (Lc) DSM 5577 to produce mannitol and to evaluate its impact in reduced-added-sugar muffins. Compared to a standard recipe with 100% sugar, two formulations with 50% and 0% added sugar were used. Sourdough fermented for 24 and 48 h was incorporated at different levels (30% and 50%) into muffins. The effects on the technological properties, as well as mannitol, carbohydrate, and organic acid contents, microbiological profile, and sensory characteristics, were evaluated. The optimum sourdough fermentation time was 48 h, which produced high levels of lactic acid (2.25 mg/g), acetic acid (4.61 mg/g), and mannitol (6.27 mg/g). The use of 50% sourdough fermented for 48 h in the muffin formulations produced the greatest amount of mannitol (3.57 mg/g). FTIR spectroscopy revealed compositional changes associated with fermentation in the sourdough and muffins. The baking tests demonstrated a reduction in baking losses without compromising specific volume. Muffins containing 50% added sugar and 30% sourdough fermented for 24 h were the most appreciated in terms of taste and flavor. The results suggest that sourdough fermented with Lc DSM 5577 may be an innovative approach for a natural reduction in sugar in muffins while preserving their technological quality.

1. Introduction

Growing awareness of the link between excessive sugar intake and the development of obesity and other non-communicable diseases, and also the adoption of certain diets, has led to a substantial demand for food products with decreased or no added sugar. Producing healthier baked goods that maintain quality while meeting consumers’ nutritional needs is therefore becoming increasingly important. But reducing sugar content frequently results in lower quality, since sugar is a key component that adds flavor, texture, and microbiological shelf life in addition to sweetness [1]. One innovative approach to address reduced quality in reduced-sugar pastry products is sourdough technology [2].
Leuconostoc citreum (Lc) is a Gram-positive, heterofermentative lactic acid bacterium (LAB). It produces lactic acid, acetic acid, ethanol, mannitol, aromatic compounds, and CO2 during sourdough fermentation [3]. The ability of Lc to convert fructose into mannitol in sourdough fermentation is especially significant. This property may be used to naturally produce a low-calorie sweetener and reduce total sugar, while maintaining flavor and sweetness [4]. Lc uses fructose as an external electron acceptor in a mannitol dehydrogenase-catalyzed reaction. Moreover, Leuconostoc ssp. can convert fructose to mannitol at a high rate during fermentation [4,5].
Mannitol is a polyol, a low-calorie sweetener, naturally produced by sourdough fermentation with Lc. It is a suitable alternative for reducing added sugar in muffins and is suitable for people on special low-sugar diets. Since mannitol can be digested without the need for insulin, it may be used in a variety of products to substitute sucrose, glucose, or fructose, making it a good option for diabetic products [6]. As mannitol is a low-glycemic sweetener (1.6 kcal/g) with a glycemic index (GI) of 0, it is an excellent sweetener for people with diabetes. Unlike sucrose, which has 4 kcal/g, mannitol is not insulinogenic and does not produce any glycemic response. Mannitol is approved as a nutritive sweetener by the European Union (E421) and the FDA (USA) [7]. Nevertheless, it has laxative effects in amounts over 20 g per day, so it is recommended that people consume a maximum of 10 g per day to minimize any potential health consequences [8]. The demand for functional ingredients that replicate the rheological properties typically provided by sucrose in wheat dough can be achieved with the use of mannitol, a sugar substitute [3].
Sugar is essential for muffins since it affects the final product’s taste, appearance, texture, and flavor. In addition to being an important part of volume and texture, sugar directly contributes to the Maillard reaction and caramelization, contributing to crust color. By reducing water activity and limiting the development of microorganisms, sugar also serves as a preservative, which directly extends shelf life. Therefore, reducing or substituting sugar can have significant effects on products. Thus, the microbiological stability of products decreases, especially in the case of those with high moisture content, thereby increasing the chances of spoilage. Moreover, changes occur in texture and volume; the products become denser and more compact and lose their airy structure. Additionally, the reduced sugar affects the sensory properties of the final product [2].
One creative way to counteract the detrimental effects on the quality characteristics of products with less sugar is through sourdough technology. In particular, Lc’s mannitol and exopolysaccharide (EPS) production may enhance the end product’s flavor and consistency [3]. Because they can modify rheology in food and biotechnology compositions, EPSs produced by lactic acid bacteria are being increasingly utilized as bio-based texturizers and stabilizers. Since both consumers and manufacturers value natural polymers over synthetic hydrocolloids, this development shows the growing interest in clean-label solutions [9].
In addition to these organoleptic enhancements, sourdough fermentation has been shown to have health advantages, such as lowering products’ glycemic index and boosting mineral bioavailability through enhanced phytic acid breakdown [10]. Sourdough fermentation enhances the nutritional value and functional qualities of baked foods by decomposing antinutritional components, boosting protein digestibility, and increasing physiologically active substances such as peptides and exopolysaccharides. LAB produces organic acids, hydrogen peroxide, and bacteriocins to prevent spoiling and harmful bacteria, improve shelf life, and ensure microbial safety [11]. The capability of mannitol-containing sourdough fermented with Leuconostoc citreum was previously shown in different reduced-sugar baked goods such as soft buns, cakes, and biscuits [5,12,13,14]. Furthermore, incorporating sourdough into reduced-sugar muffins could enhance food and culinary production by supporting the development of clean-label products and increasing revenue potential [2].
This study aims to investigate the ability of sourdough fermented with Leuconostoc citreum DSM 5577 to produce mannitol and to evaluate its application in reduced-added-sugar muffins. To test this hypothesis, sourdough fermented for 24 and 48 h was incorporated at different levels (30% and 50%) into muffins with reduced added sugar. Its effects on the muffins’ technological properties, as well as their mannitol, carbohydrate, and organic acid contents, microbiological profile, and sensory characteristics, were evaluated.

2. Materials and Methods

2.1. Materials

Wheat flour, grape seed oil, eggs, Greek-style yogurt (5.4% fat content), baking powder, and sugar were purchased from specialized Romanian stores. Lc DSM 5577 was acquired from the Leibniz Institute—German Collection of Microorganisms and Cell Cultures (Brunswick, Germany), while fructose and mannitol were purchased from VWR Suppliers, Avantor (Radnor, PA, USA). The analytical-grade reagents originated from Chempur (Piekary Śląskie, Poland).

2.2. Leuconostoc citreum DSM 5577—Growth Conditions and Sourdough Fermentation

A freeze-dried Lc DSM 5577 strain was cultivated in De Man–Rogosa–Sharpe (MRS) broth at 28 °C for 24 h. The biomass obtained was centrifuged at 6500 rpm for 10 min at 4 °C (Eppendorf R5804 centrifuge, Hamburg, Germany) and then washed three times with sterile distilled water before being added to the sourdough at an initial concentration of 108 cfu/mL. A Shimadzu UV-1900 spectrophotometer (Shimadzu Scientific Instruments, Kyoto, Japan) was used to determine the microbial optical density of the inoculum, with absorbance measured at a 600 nm wavelength.
The sourdough was obtained from a 1:1 ratio of flour and water to which 10% fructose was added, according to the method used by Sahin et al. [5]. This mixture was inoculated with a suspension of Lc at a concentration of 1.5 × 10⁸ cfu/g. Fermentation took place at 28 °C. For analyses, sourdough samples were taken at 0 (T0), 24 (T24), and 48 (T48) h of fermentation and were examined immediately (cell count, pH, total titratable acidity—TTA, and rheology) or were frozen for further analyses.

2.3. Batter and Muffin Preparation

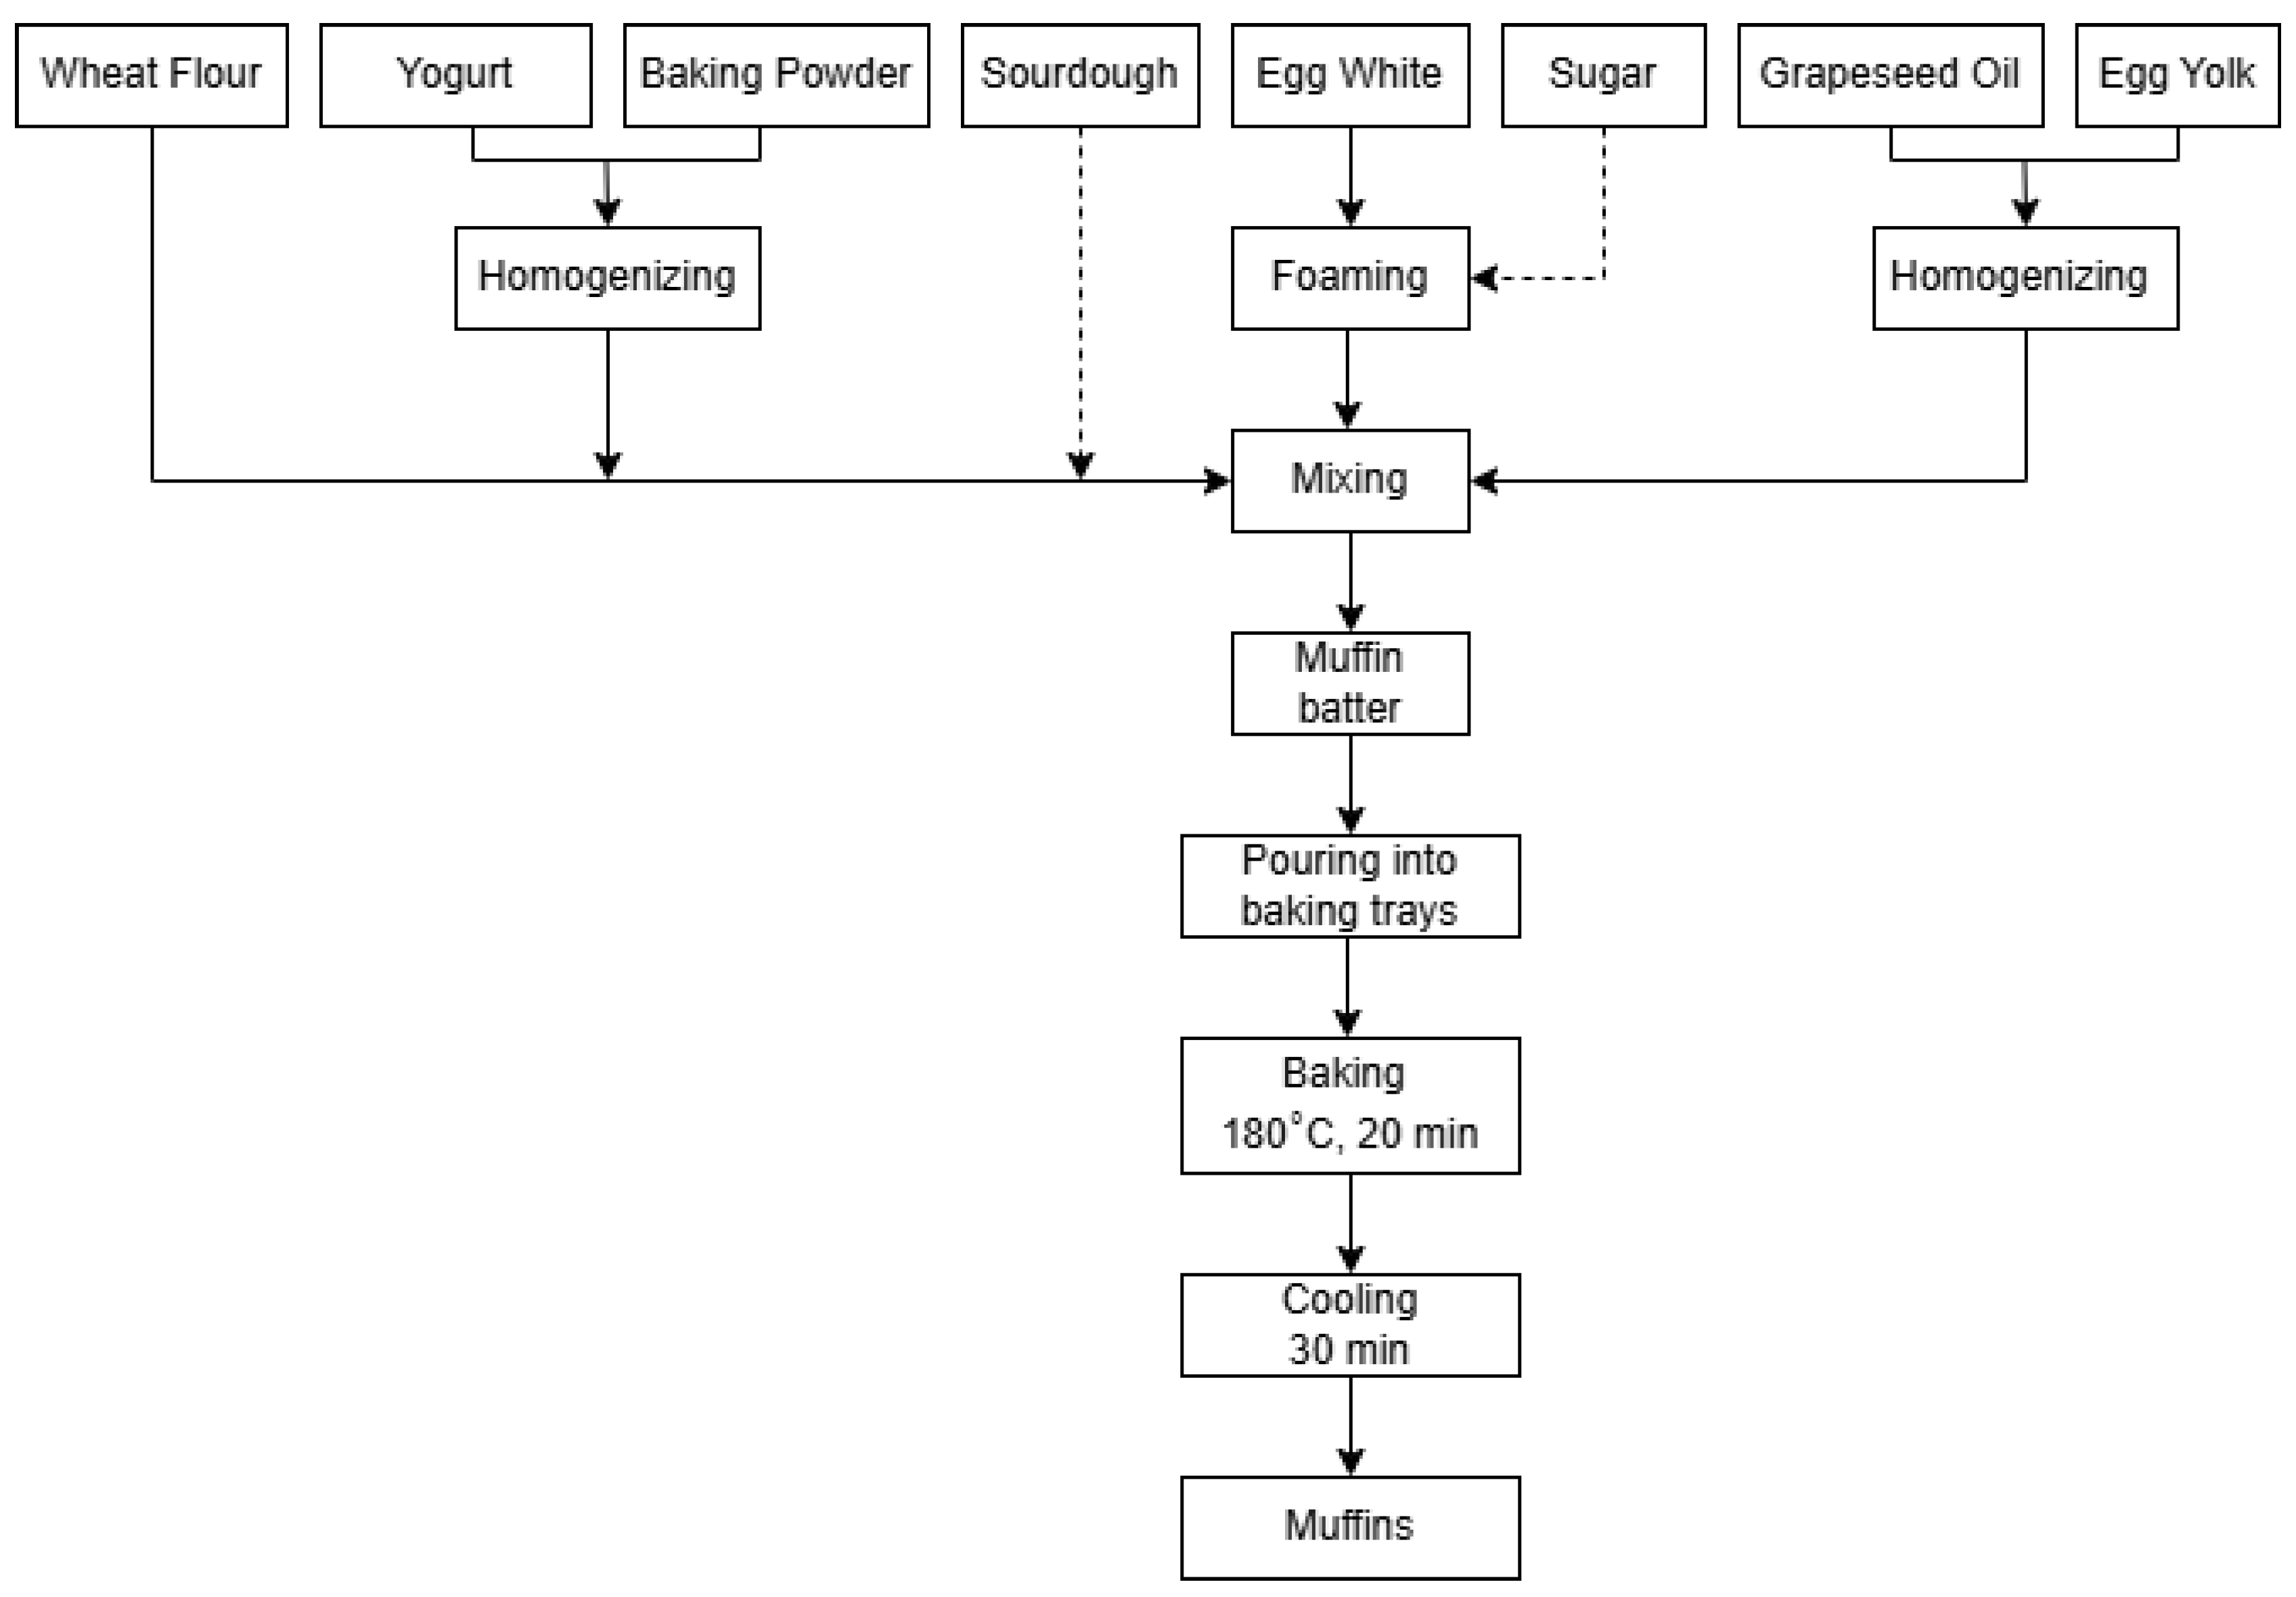
The muffin batter was made by mixing all the ingredients as shown in Figure 1.
A KitchenAid® Precise Heat Mixing Bowl (Ohio, OH, USA) was used for mixing the ingredients at medium speed, and an electric conventional Zanolli (Verona, Italy) oven was used for baking. Initially, a standard muffin recipe with 82 g of added sugar (considered 100%) and no sourdough was used to optimize the percentages of the ingredients. After this, two formulations were developed: one with half the amount of added sugar compared to the standard muffin (50% added sugar—CM50) and the second one with no added sugar (0% added sugar—CM0). Consequently, the samples with half the amount of added sugar were labeled as reduced added sugar, and the samples without sugar were labeled as no added sugar. CM50 and CM0 were considered control samples. Next, sourdough was added to the muffin batter at ratios of 30% and 50% reported for 100 g of the total amount of flour. Table 1 shows the formulations used for obtaining reduced-added-sugar (0% and 50% added sugar) muffins with sourdough fermented with Lc DSM 5577 for 24 and 48 h.
For better tracking of the samples, we will refer to them in the text using the following code, explained in Table 2.

2.4. Cell Count, pH, and Total Titratable Acidity of Sourdough

Decimal dilutions were made by vortexing 5 mL of each sourdough sample with 45 mL of sterile saline solution. To determine the number of colony-forming units/g of sample, MRS agar medium inoculations of the last two dilutions were made. For each sample, two sterile dilution Petri dishes were prepared. In each Petri dish, 1 mL of the sample corresponding to the dilution was added, and 15 to 16 mL of MRS medium was poured into each Petri dish [15]. The plates were incubated at 37 °C under anaerobic conditions for 72 h.
To determine the sourdough’s pH, a pH meter (GroLine HI1285-7, Woonsocket, RI, USA) was calibrated with a standard solution. The total titratable acidity (TTA) was determined by mixing 10 g of sourdough with 90 mL of distilled water, then neutralizing the mixture with 0.1 N NaOH using phenolphthalein as an indicator, until the pH reached 8.3. TTA measurements were expressed as ml of NaOH 0.1 N [15].

2.5. Mannitol, Carbohydrates, Organic Acids, and Ethanol Determination by HPLC-RID

The method of Șerban et al. (2023) [15], with slight changes, was used. Briefly, mannitol, carbohydrates, organic acids, and ethanol were determined by HPLC (Agilent 1200, Santa Clara, CA, USA) with a refractive index detector (RID). Extracts were obtained from 1 g of sourdough/muffin in 2 or 4 mL of bidistilled water by vortexing, sonication (30 min), and centrifugation (10,000 rpm; 10 min; 24 °C). The filtered supernatant (nylon Chromafil Xtra PA-45/13 0.45 µm) and the extract (20 µL) were injected in the HPLC system. An Agilent 1200 HPLC system equipped with a quaternary pump, solvent degasser, and manual injector, coupled with a refractive index detector, was used. The separation of the compounds was performed on a Polaris Hi-Plex H column, 300 × 7.7 mm (Agilent Technologies, Santa Clara, CA, USA), using the mobile phase H2SO4 5 mM with a flow rate of 0.6 mL/min, column temperature T = 70 °C, and RID temperature T = 35 °C. Elution of the compounds was performed for 30 min. Compound identification was performed by comparing retention times with standards.

2.6. Fourier-Transform Infrared (FTIR) Analysis

Fourier-transform infrared (FTIR) spectroscopy was performed using a JASCO FT/IR-4100 spectrometer (JASCO, Japan) that was equipped with an attenuated total reflection accessory (Jasco ATR PR0450-S, Hachioji, Tokyo, Japan). The sample is placed in direct contact with the ATR crystal, and it is pressed to ensure optimal contact between the sample and the crystal. Infrared light comes from underneath and measures only close to the crystal. The light reaches the sample and reflects [16,17]. The FTIR spectra wavelength ranged from 4000 to 500 cm−1 with 16 scans and had a resolution of 8 cm−1. FTIR spectra were made using MagicPlot 3.0.1 software.

2.7. Rheological Properties of Sourdough and Muffin Batter

The dynamic rheological properties of sourdough and muffin batter were measured using an Anton Paar MCR302 rheometer (Anton Paar, Graz, Austria) equipped with a Peltier plate–plate system (P-PTD 200/Air) with temperature control and a 50 mm diameter smooth parallel plate geometry (PP-50-67300). After adding 3 g of sample to the lower plate, the upper plate was lowered to a 1 mm gap. The excess resulting from the pressing was cleaned, and silicone oil was utilized to reduce sample moisture loss during testing. The storage modulus (G′) and loss modulus (G″) of each sample of sourdough and muffin batter were examined at an angular frequency of 0.628–628 rad/s−1 at a constant temperature of 25 °C. Shear strain was constant at 0.1% with 35 total measurement points [15].

2.8. Muffin Moisture Content

Moisture analysis of the muffins, adapted from Casas-Godoy et al. (2023) [18], was performed using an Ohaus MB23 (Ohaus Corporation, Parsippany, NJ, USA) moisture analyzer with glassless infrared heating.

2.9. Dimensional Analysis and Baking Losses of Muffins

The muffins’ height was measured using a Vernier caliper [19]. Specific volume was determined by dividing a muffin’s volume by its weight. The baking loss was established by comparing the batter of the muffin and the muffin’s weight (Wmuffin) after cooling and dividing it by the weight of the muffin batter (Wbatter) [20].
B a k i n g   l o s s = W b a t t e r W m u f f i n W b a t t e r × 100   %  

2.10. Microbiological Analysis of Muffins

For determination of the total plate count (TPC), samples were placed on Plate Count Agar (PCA) medium and were incubated for 72 ± 3 h at 30 ± 2 °C. Yeasts and molds were analyzed on DRBC agar (Dichloran Rose Bengal with Chloramphenicol) medium with incubation for 5 days at 25 °C. Total Enterobacteriaceae were determined on Violet Red Bile Glucose Agar (VRBGA, Oxoid) at 37 °C for 24 ± 2 h, and coagulase-positive Staphylococcus aureus was identified on Baird-Parker agar (BP) medium with incubation at 37 °C for 24 ± 2 h [21]. Microbiological shelf life was assessed by storing muffins in standard packaging at room temperature. Each day, one muffin of each type was frozen at −18 °C to inhibit microbiological growth for comparative analysis. This procedure continued until the initial visible signs of mold appeared, which indicated the conclusion of the stability phase [22,23].

2.11. Sensory Evaluation of Muffins

A 9-point hedonic test was used to assess appearance, smell, taste and aroma, and overall acceptability. A total of 34 trained panelists (21 women and 13 men aged between 18 and 55, who were students and staff from the Faculty of Food Science and Technology) evaluated the samples. To evaluate the entire visual characteristics of a muffin sample, such as appearance, a whole muffin of each batch was provided to evaluators.
Participants voluntarily signed informed consent forms after receiving written and verbal details about the study and product ingredients, including allergens. In accordance with GDPR, survey data remained anonymous. The sensory analysis followed the ethical guidelines of the University of Agricultural Sciences and Veterinary Medicine, Cluj-Napoca.

2.12. Statistical Analysis

All data are presented as mean ± standard deviation (SD). Each treatment was evaluated in three independent replicates (n = 3). Statistical analyses were performed using IBM SPSS Statistics 19 (IBM Corp., Armonk, NY, USA). A one-way analysis of variance (ANOVA) with a 95% confidence level was used to identify statistically significant differences between treatment means. Further, two- and three-way ANOVA tests were applied to analyze the interaction of independent variables (added-sugar level, sourdough addition, and fermentation time) and identify their individual or combined effects on dependent variables (muffin height; specific volume; weight; baking loss; moisture; and mannitol, carbohydrate, organic acid, and ethanol content). When significant differences were found, Duncan’s multiple range test was performed to separate the means. Differences were considered statistically significant at p < 0.001.
The data from the hedonic test was statistically evaluated by applying multifactorial Principal Component Analysis (PCA) using XLSTAT (Lumivero) within Microsoft Excel—a method to reduce the dimensionality of the data to detect patterns of variation among the samples tested and their sensory attributes.

3. Results and Discussion

3.1. Microbial Growth and Acidification Rate of Sourdough

At the initiation of fermentation (T0), a cell density of 5 log cfu/g was detected. Following 24 h of fermentation (T24), the cell density reached its maximum value of 7.51 log cfu/g (Table 3). A stationary phase of growth occurred after T24, followed by a decreasing phase of growth that resulted in a reduced cell count of 4.82 log cfu/g after 48 h of fermentation (T48). Significant differences in cell density (p < 0.05) between T0, T24, and T48 indicate significant changes in microbial dynamics during fermentation. According to Sahin et al. (2019) [5], the stationary growth phase of Lc TR116 was recorded between 12 and 36 h of fermentation, followed by a declining phase, with a diminished cell count after 48 h.
Significant changes (p < 0.05) in pH and TTA values with fermentation time evolution were determined. Table 3 shows that the pH decreases in the first 24 h from 5.99 to 3.52 and then remains constant, with a minor difference between the pH at T24 and T48. In contrast, the TTA value increases progressively with significant differences starting from 1.7 to 15 mL NaOH 0.1 N at T48. It is noteworthy that between 24 h and 48 h of fermentation, Lc microbial dynamics, pH, and TTA values exhibited different trends compared to those of other LABs. For example, when the pH remains unchanged, the TTA increases if weakly buffered acids are accumulated. Generally, the pH of sourdough decreases due to the accumulation of organic acids during the fermentation process. It is known that pH only measures dissociated acids, whereas weak acids, such as lactic and acetic acids, do not completely dissociate. Nevertheless, lactic acid is a stronger acid than acetic acid, and its influence on pH values is more powerful, since it is characterized by a greater dissociation. On the other hand, TTA provides information regarding the ratio of lactic acid to acetic acid [24]. Thus, both a smaller drop in pH and a significantly higher TTA value could be explained by a higher amount of acetic acid produced during sourdough fermentation (Table 4) and the buffering capacity of organic acids. However, other compounds formed during sourdough fermentation, such as peptides, free amino acids, and proteins, may also contribute to the buffering capacity [25].
Obviously, the relation between microbial cell growth and acidification is clear, since both the acidic environment and the buffering capacity can cause cell growth inhibition and extend the stationary growth phase [26]. It appears that this is typical behavior of Lc in sourdough systems, which was also found in different studies. Hence, Sahin et al. [5] reported that a sourdough inoculated with Lc TR116 had a pH of 5.5 to 4.16 and a TTA value close to 16.80 mL NaOH 0.1 N after 48 h of fermentation. Moreover, similar trends were reported for Lc TR116 in faba bean fermentates [25].

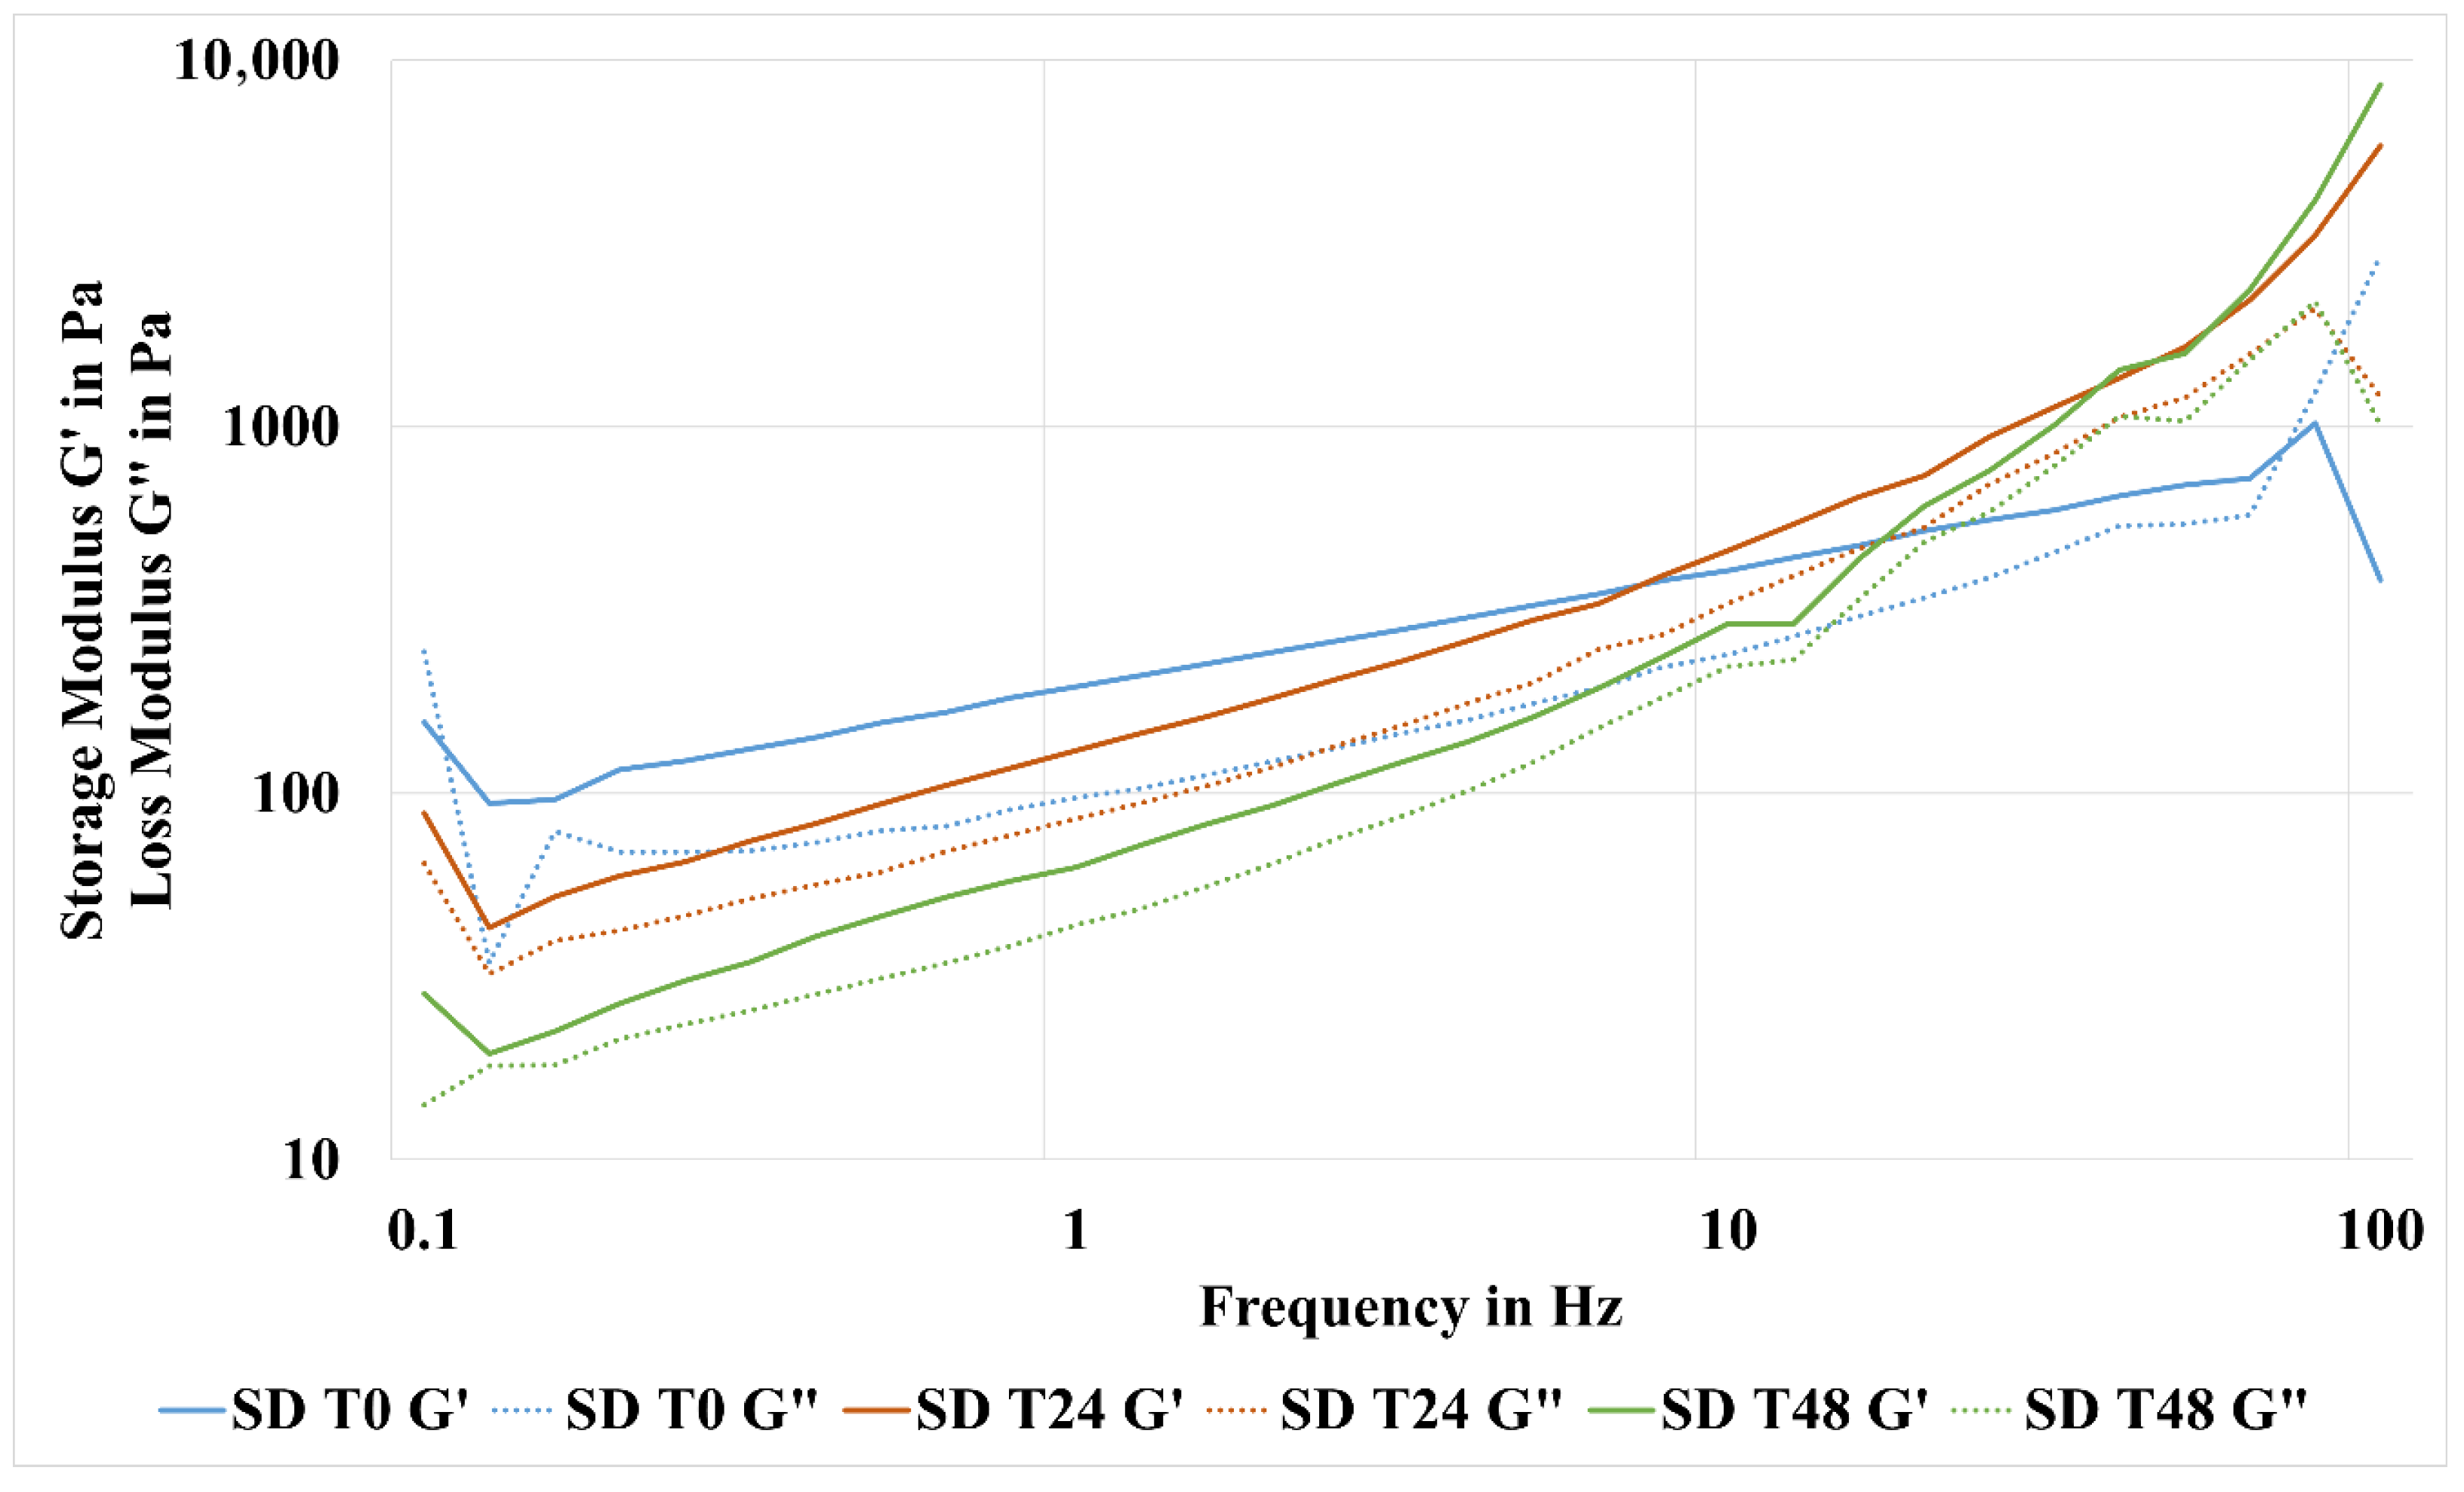
3.2. Sourdough Rheological Properties

Figure 2 shows the rheological parameters of the sourdough at T0, T24, and T48 at an angular frequency ranging from 0.628 to 628 rad/s. At a final angular frequency of 628 rad/s, the storage modulus at T0 was 382.866 Pa, decreasing sharply from 1021.83 Pa (at an angular frequency of 499 rad/s), while at T24 and T48, the storage modulus increased gradually, reaching 5841.4 Pa and 8576 Pa, respectively. The storage modulus (G′) and loss modulus (G″) are two essential moduli that are frequently used to describe the dynamic characteristics of sourdough. G′ represents the material’s ability to maintain elastic deformation energy, whereas G″ provides the viscous component of the material. Generally, storage modulus and loss modulus increased with angular frequency, which may be explained by the rise in the structure of sourdough [27]. Also, G″ was lower than G′. This confirms that the sourdough had an elastic tendency which predominated over viscous features, as previous studies also reported for LAB-fermenting sourdough [28]. The elastic behavior can be explained by sourdough acidification, where the reduced pH affects dough rheology through modifications of chemical compounds, improvement in water molecule interactions, and structural components such as starch and proteins [15]. However, a higher storage modulus (G′) was recorded with increased fermentation time and frequency (from 0.1 to 100 Hz), indicating that the sourdough became firmer in time. At low pH levels, there is a significant positive net charge, and proteins are more soluble. Increased protein solubility causes intramolecular electrostatic repulsion among gluten proteins, making them more susceptible to denaturation [29]. In addition, this behavior could be due to the ratio of lactic and acetic acids formed during sourdough fermentation. High amounts of acetic acid in relation to lactic acid, formed by Lc in this study (Table 4), might be the explanation for shorter and harder gluten formation which influences sourdough’s firmer structure. Moreover, acetic acid promotes cross-linking of gluten proteins, which, in fact, enhances the gluten network and increases its resilience [30]. Generally, acidic conditions stimulate glutenin hydrolysis and the formation of macro-peptides, but they also stimulate the ability of gluten to bind with different polymers (starch, fibers, etc.), with a strong influence on sourdough rheology. Notably, heterofermentative Lc increases the amount of SH-groups in gluten proteins, due to glutathione reductase expression [31]. When lactic acid predominates in sourdough, it becomes more elastic. Moreover, strains of Lc were found to produce exopolysaccharides (EPSs) that increase the system’s viscosity by their water-binding capacity and the ability to combine proteins [3]. In addition, by preventing the breakdown of glutenin macropolymers in acidic environments, EPS strengthens the gluten network. This behavior is associated with EPS’s capacity to interact with gluten proteins, stabilizing SS bonds [32]. Notably, low-field nuclear magnetic resonance studies indicated that EPS could reduce the mobility of water in the gluten matrix, thereby affecting its elasticity [33]. In conclusion, under the conditions of Lc-fermenting sourdough, its specific rheological properties result from the combined contributions of acidification, EPS production, gluten restructuring, and water redistribution. Also, Lc’s capacity to produce EPSs makes a large contribution to inducing gluten-matrix modifications and competing for water during sourdough fermentation.

3.3. Mannitol, Carbohydrates, Organic Acids, and Ethanol—HPLC-RID Analysis of Sourdough

The process relies on Lc’s capacity to utilize fructose as an electron acceptor and convert it to mannitol through the action of the enzyme mannitol 2-dehydrogenase. Furthermore, relative gene expression analysis demonstrated the stimulatory effect of fructose on the mdh (mannitol dehydrogenase) and manX (phosphotransferase system mannose-specific EIIAB component) genes, suggesting a role for both secondary transporters and the PTS (phosphotransferase system) in fructose metabolism in Lc [6,34].
In addition, the stimulating effect of fructose was observed in the initial tests of this study, which were carried out to determine the optimal amount of fructose, when 0%, 7%, and 10% fructose were added to the sourdough system. With the addition of less than 10% fructose, mannitol yielded 0, i.e., <1 mg/g, after 24 h of fermentation with Lc DSM 5577. In two of their studies, Sahin et al. [5,12] reported small concentrations or concentrations under detection limits for mannitol during fermentation with no added fructose.
Mannitol was totally absent at the beginning of fermentation but increased with statistically significant differences (p < 0.05) between T24, with 3.51 mg/g, and T48, with 6.27 mg/g, when the amount of mannitol was nearly doubled (Table 4). This increase is attributed to a fructose consumption of 94.06% after 48 h of fermentation. Consequently, the recorded mannitol yield was 58.11% after 24 h and 66.48% after 48 h of fermentation. For Leuconostoc ssp. the yield of mannitol is species-dependent and varies between 26 and 90%, being influenced by medium composition, pH, and temperature [12]. With respect to maltose conversion, its quantity increased significantly from 8.48 mg/g at T0 to 11.13 mg/g at T24, reaching 11.11 mg/g at T48, as a result of enzymatic hydrolysis during sourdough fermentation. A smaller maltose consumption could be putatively assumed in the presence of fructose in sourdough fermented by Lc. In sourdough fermented with Lc TR116, an increase in maltose content up to 2.62 g/100 g and a maximum of 9.69 g/100 g mannitol were recorded [5]. Müller et al. (2022) [14] obtained the highest amount of mannitol in sourdough fermented with Lc DCM65 at 24 h (9.8 mg/g).
Lactic acid bacteria produce organic acids during carbohydrate fermentation, playing an important role in the final taste, texture, and preservation of the product [28]. Lactic acid is the most common organic acid produced during lactic fermentation. According to Saeed et al. (2014) [35], the amount of generated acids is influenced by a number of parameters, including metabolic activity, technical performance, and the acidifying capabilities of sourdough. Both lactic acid and acetic acid almost doubled their amounts during fermentation, with statistically significant differences (p < 0.05) (Table 4). In relation to fructose consumption, acetic acid yields were 46.52% (T24) and 48.88% (T48). Meantime, lactic acid production yielded 18.04% (T24) and 23.86% (T48). Sahin et al. (2019b) [5] and Müller et al. (2022) [14] also reported that the amount of organic acids increased with fermentation time, reaching values of 1.70 g/100 g DM and 3.1 mg/g for lactic acid and 0.52 g/100 g DM and 2.5 mg/g for acetic acid, respectively.
Lactate and acetate production depend on the strain type and medium conditions. Acetate yield relates to the reduction of fructose to mannitol, a process catalyzed by mannitol dehydrogenase, which regenerates the co-factor NAD+. Acetyl phosphate is turned into acetate and produces an extra ATP when electron acceptors are available to renew NAD+ during the oxidation phase [6]. In aerobic or semi-aerobic environments with electron acceptors other than oxygen, converting acetyl phosphate into acetate is preferable for further ATP gain over reducing it to ethanol, which also regenerates NAD+ [25].
In the case of wheat sourdough fermentation with Lc FDR 42, a smaller molar ratio of mannitol to acetate was found without complete consumption of fructose, likely as a result of the strain’s metabolic characteristics and its ability to use oxygen as an electron acceptor under particular sourdough propagation conditions [36]. However, Lc DSM 5577 and Lc TR116 were also found to produce higher acetate relative to lactate in faba bean fermentates [25,37], probably due to the use of both fructose and glucose as carbon sources. This could explain the lack of glucose in the medium during sourdough fermentation. The amount of ethanol increased with fermentation time, with statistically significant differences from 0.24 mg/g (T24) to 1.26 mg/g (T48).

3.4. FTIR Spectroscopic Analysis of Sourdough

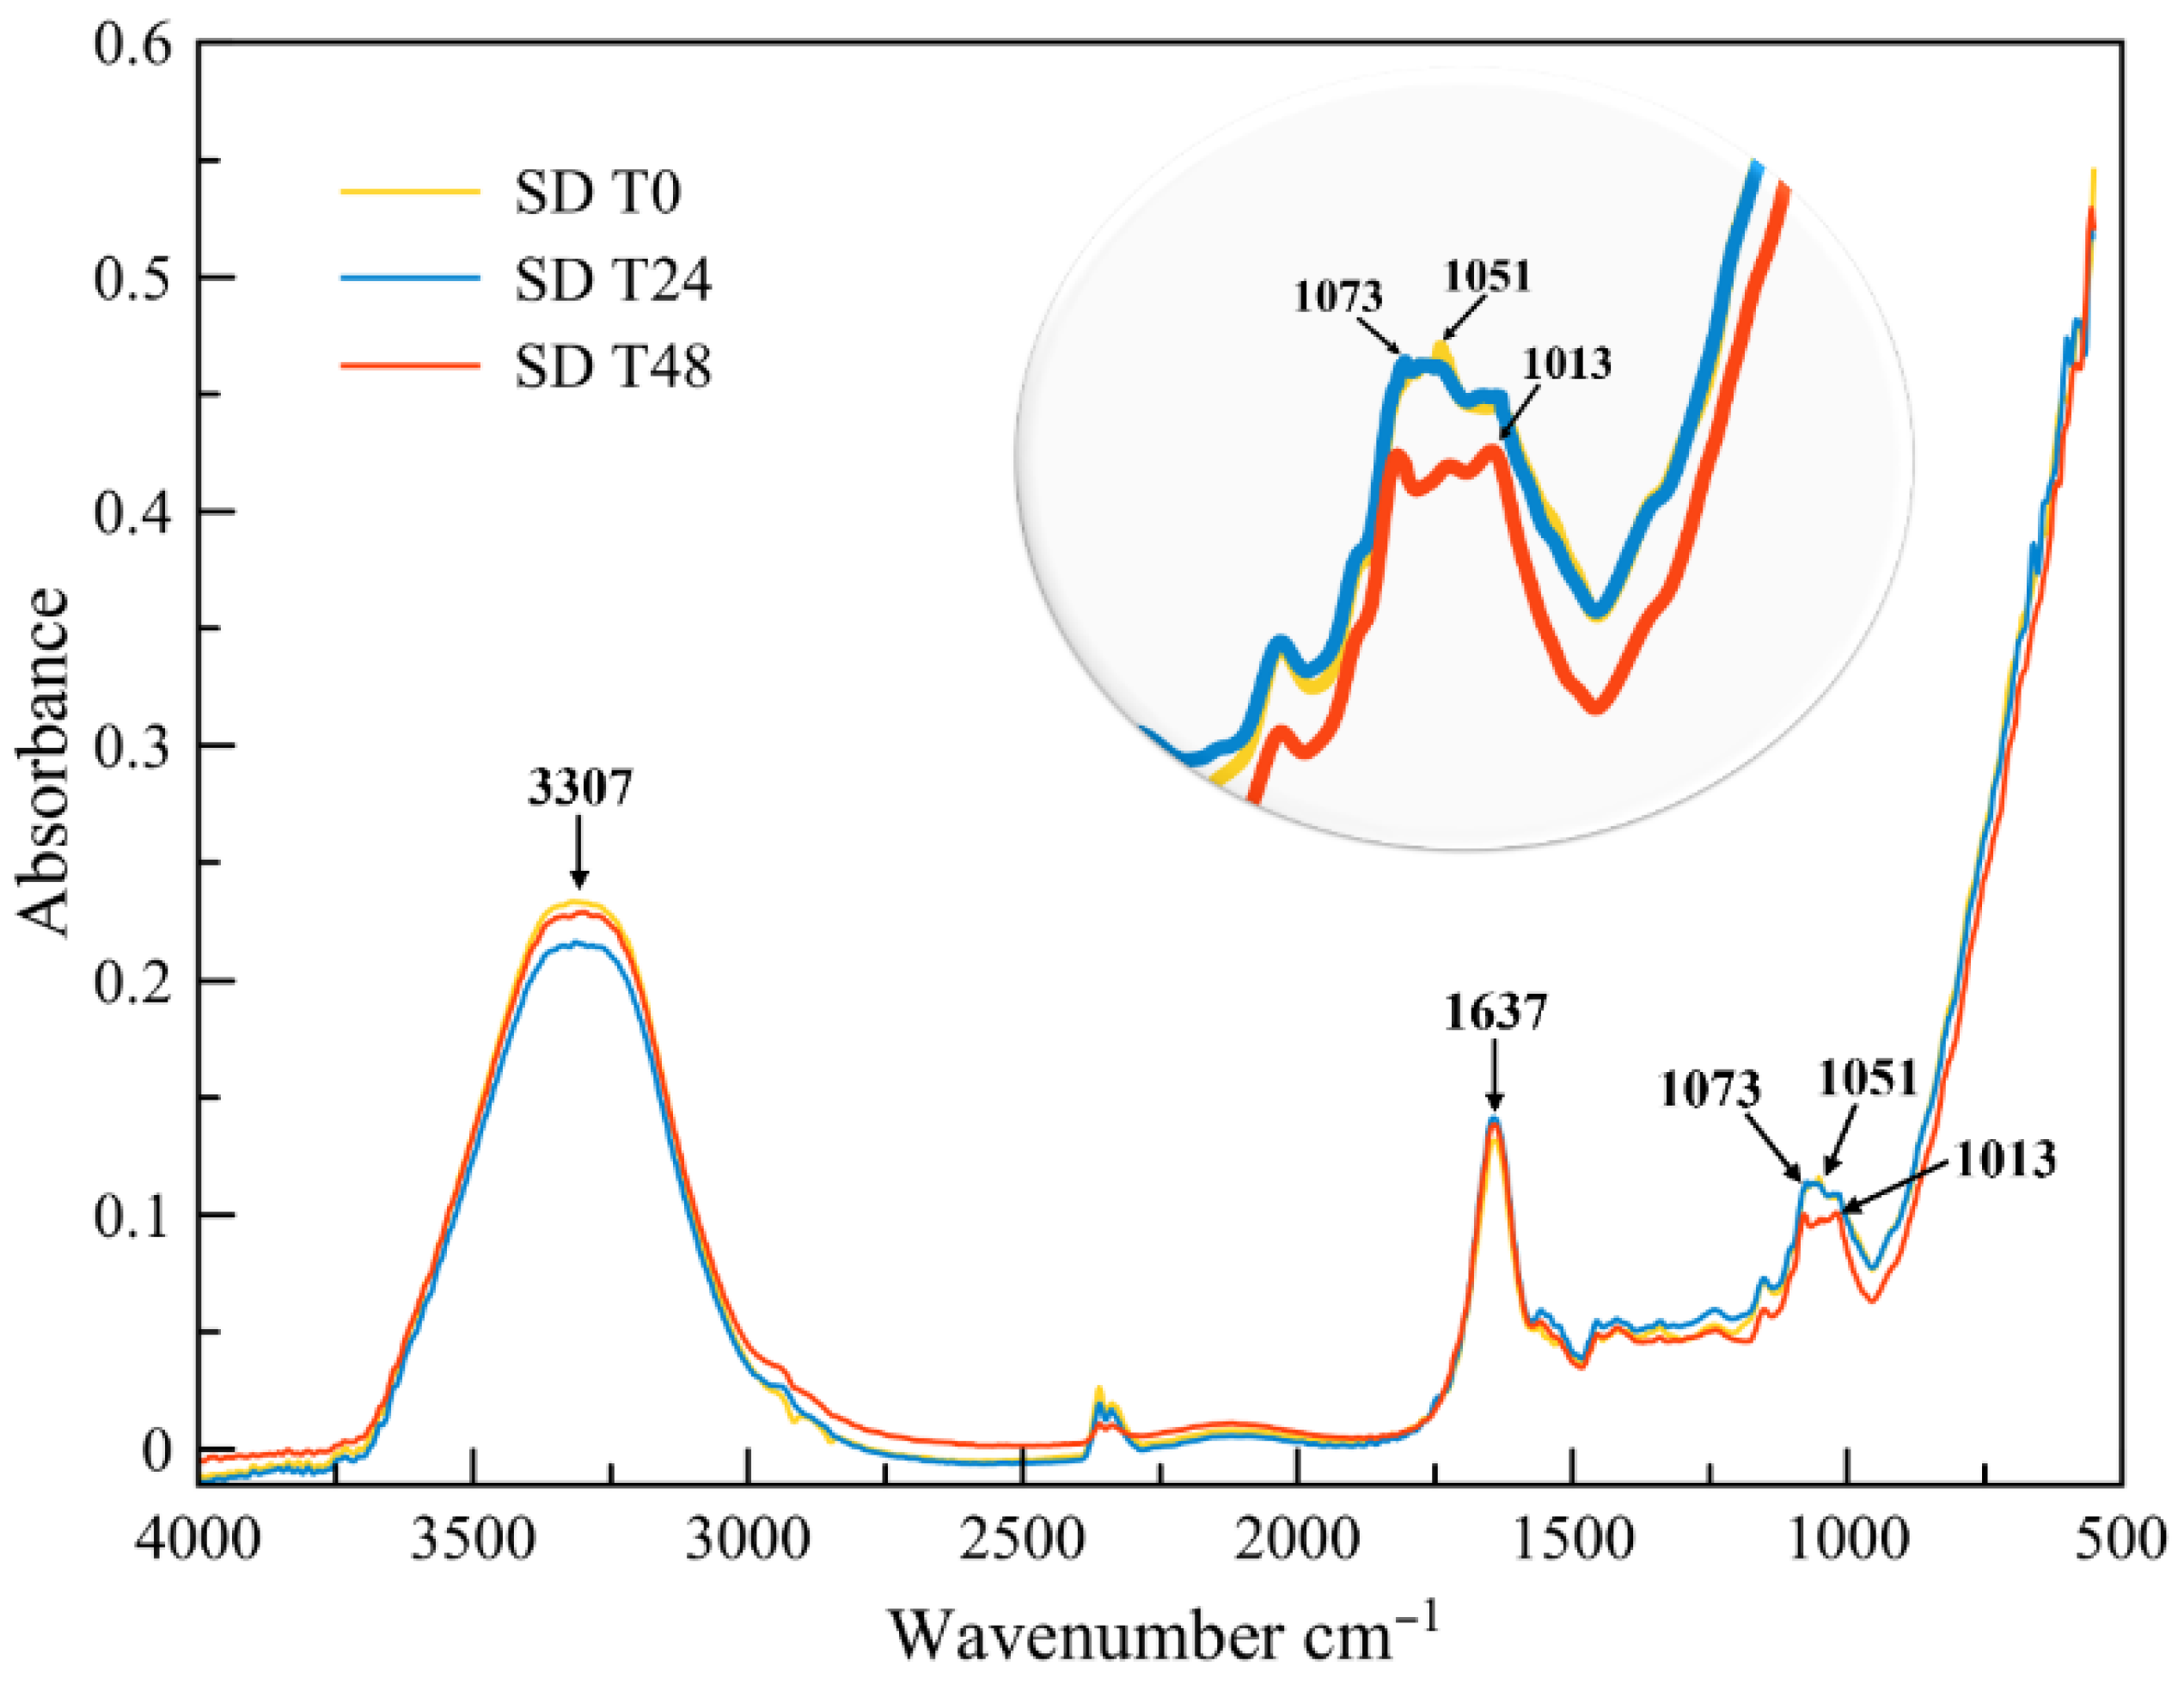
The analysis of FTIR spectra of sourdough fermented with Lc DSM 5577 during fermentation (Figure 3) provides functional group information and can qualitatively support HPLC determinations.
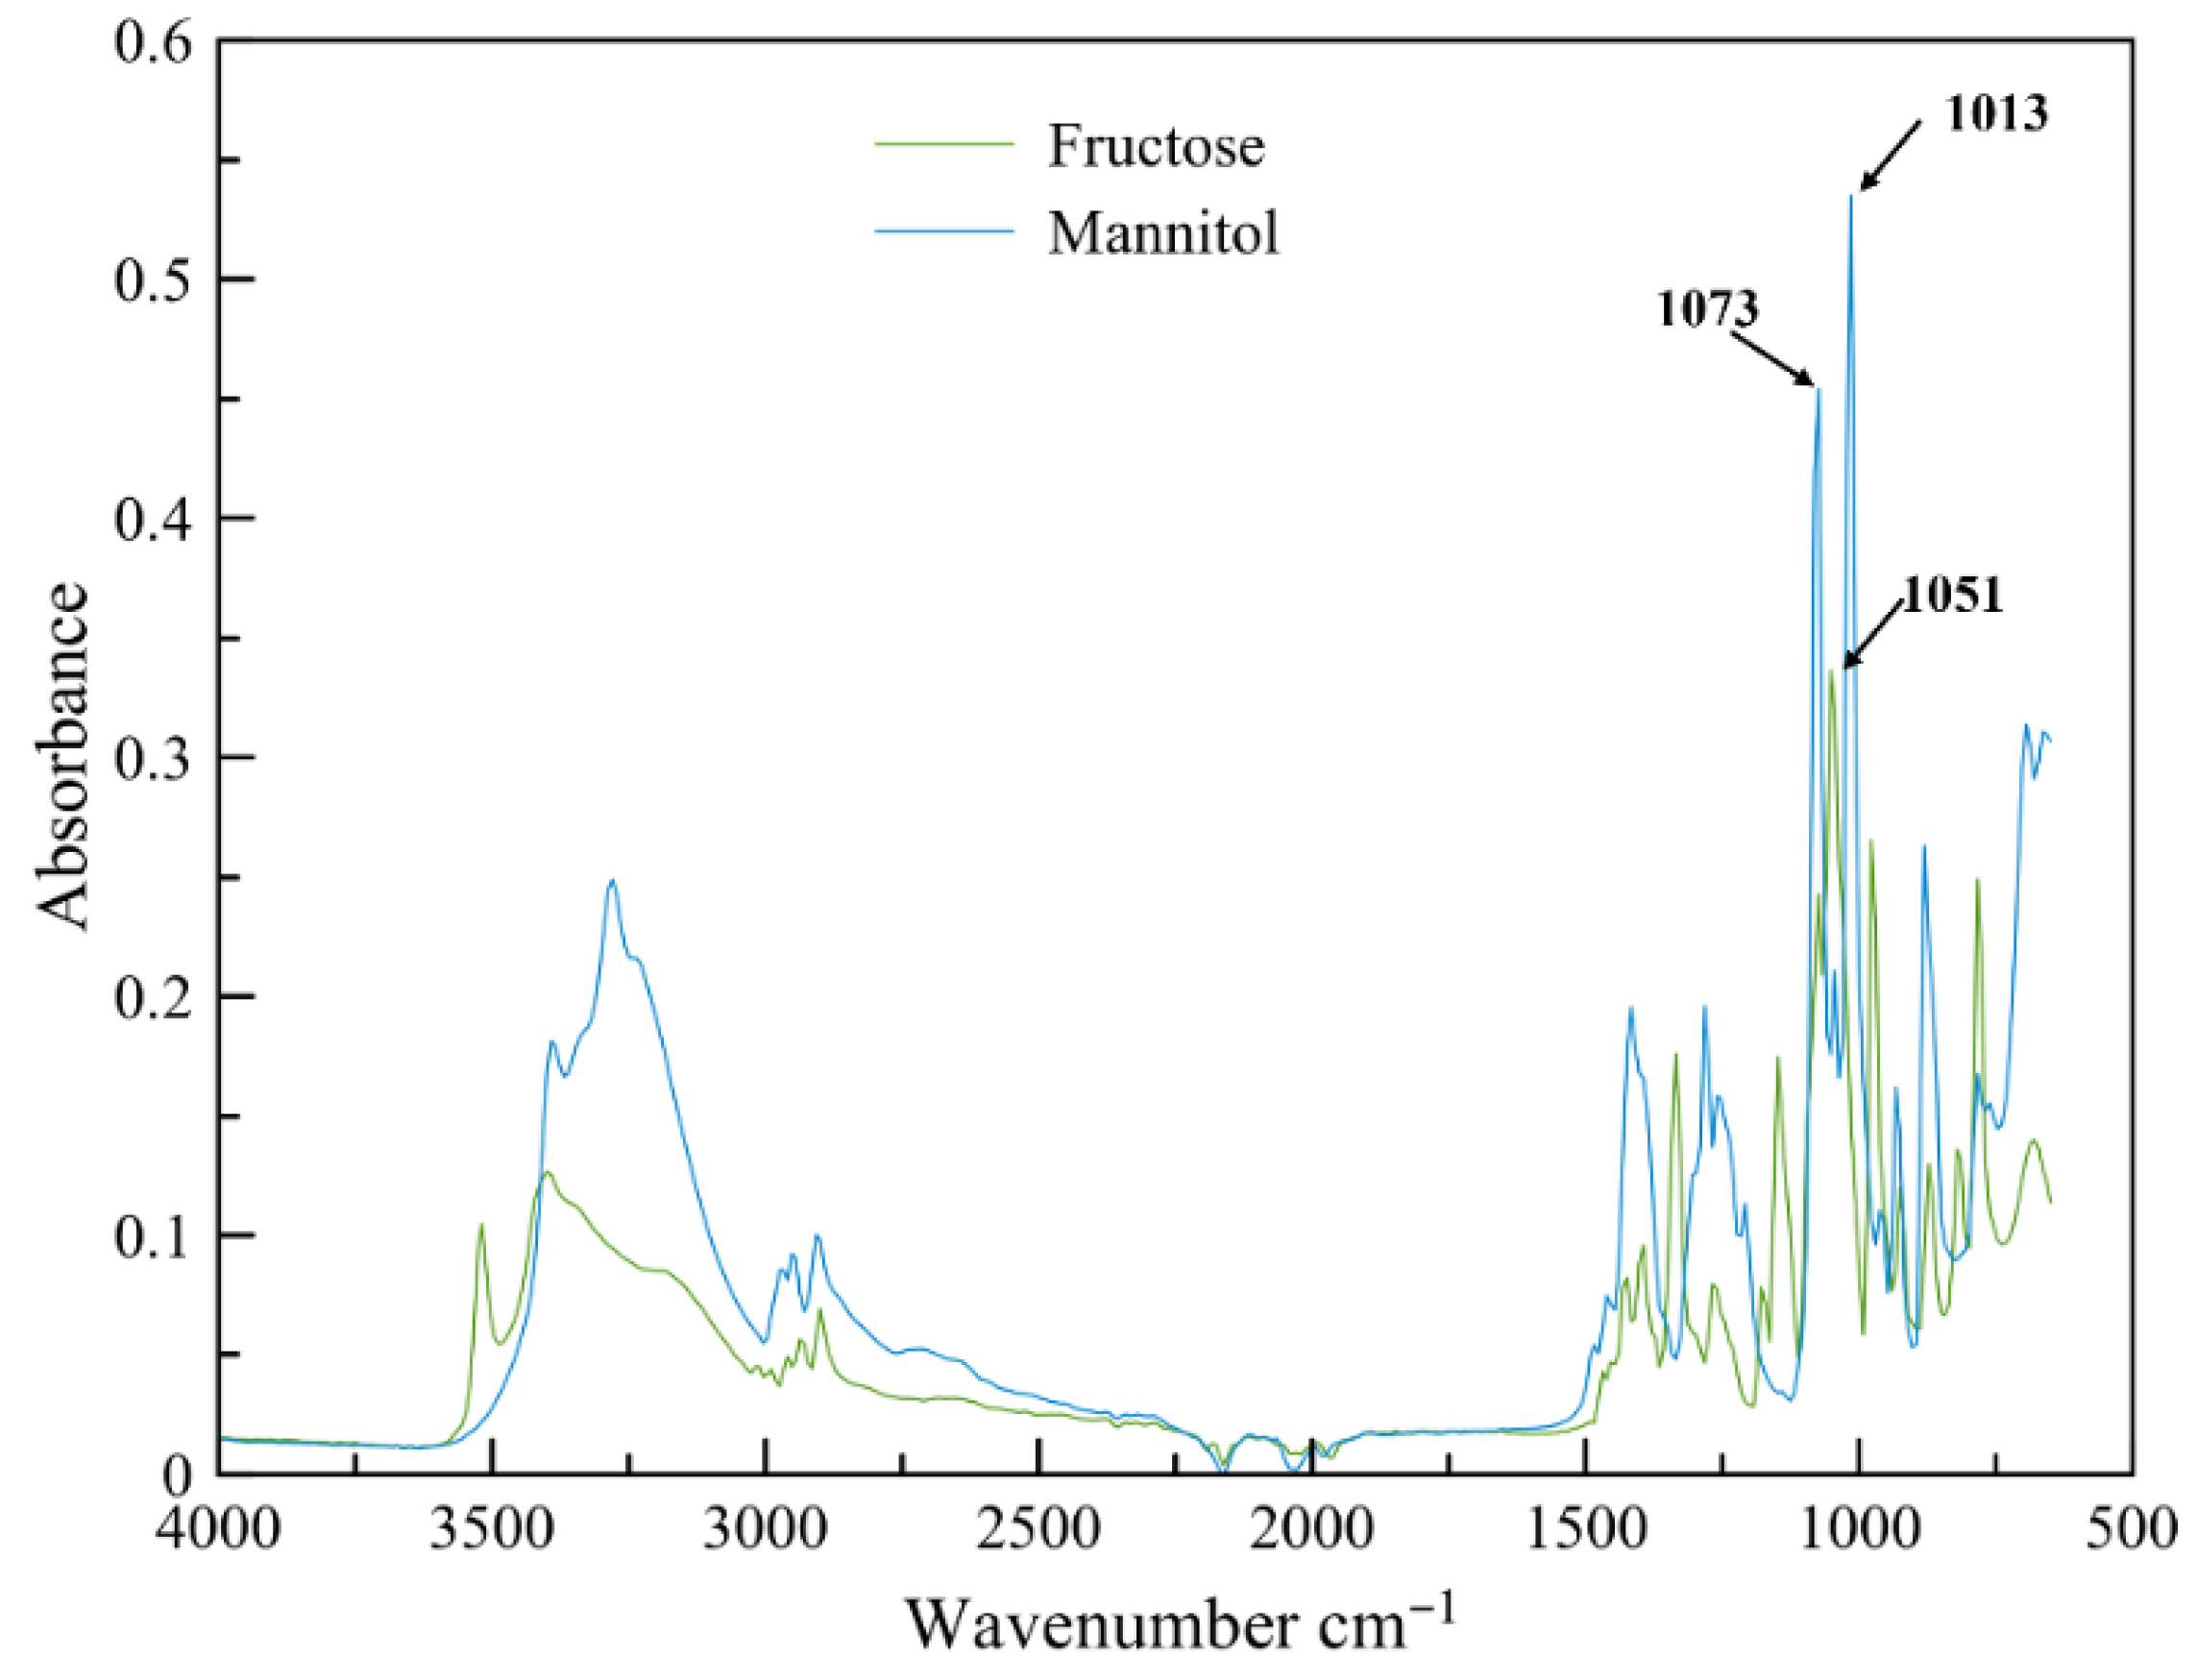
Therefore, pure fructose and mannitol FTIR spectra were recorded (Figure 4). The fingerprint region (900–1200 cm−1) includes characteristic bands for fructose at 976 and 1051 cm−1. The last one, with the highest intensity (at an absorbance of 0.33), can be considered as a representative peak [38]. In the case of mannitol, the specific peak with the highest intensity was 1013 cm−1, but 1073 cm−1 was also present.
For the sourdough samples (Figure 3), the fingerprint region (900–1200 cm−1) includes specific characteristic bands at 1013, 1051, and 1073 cm−1. Moreover, changes in specific bands for the samples might indicate the decrease in fructose and a rise in mannitol content during the fermentation time (0–48 h).

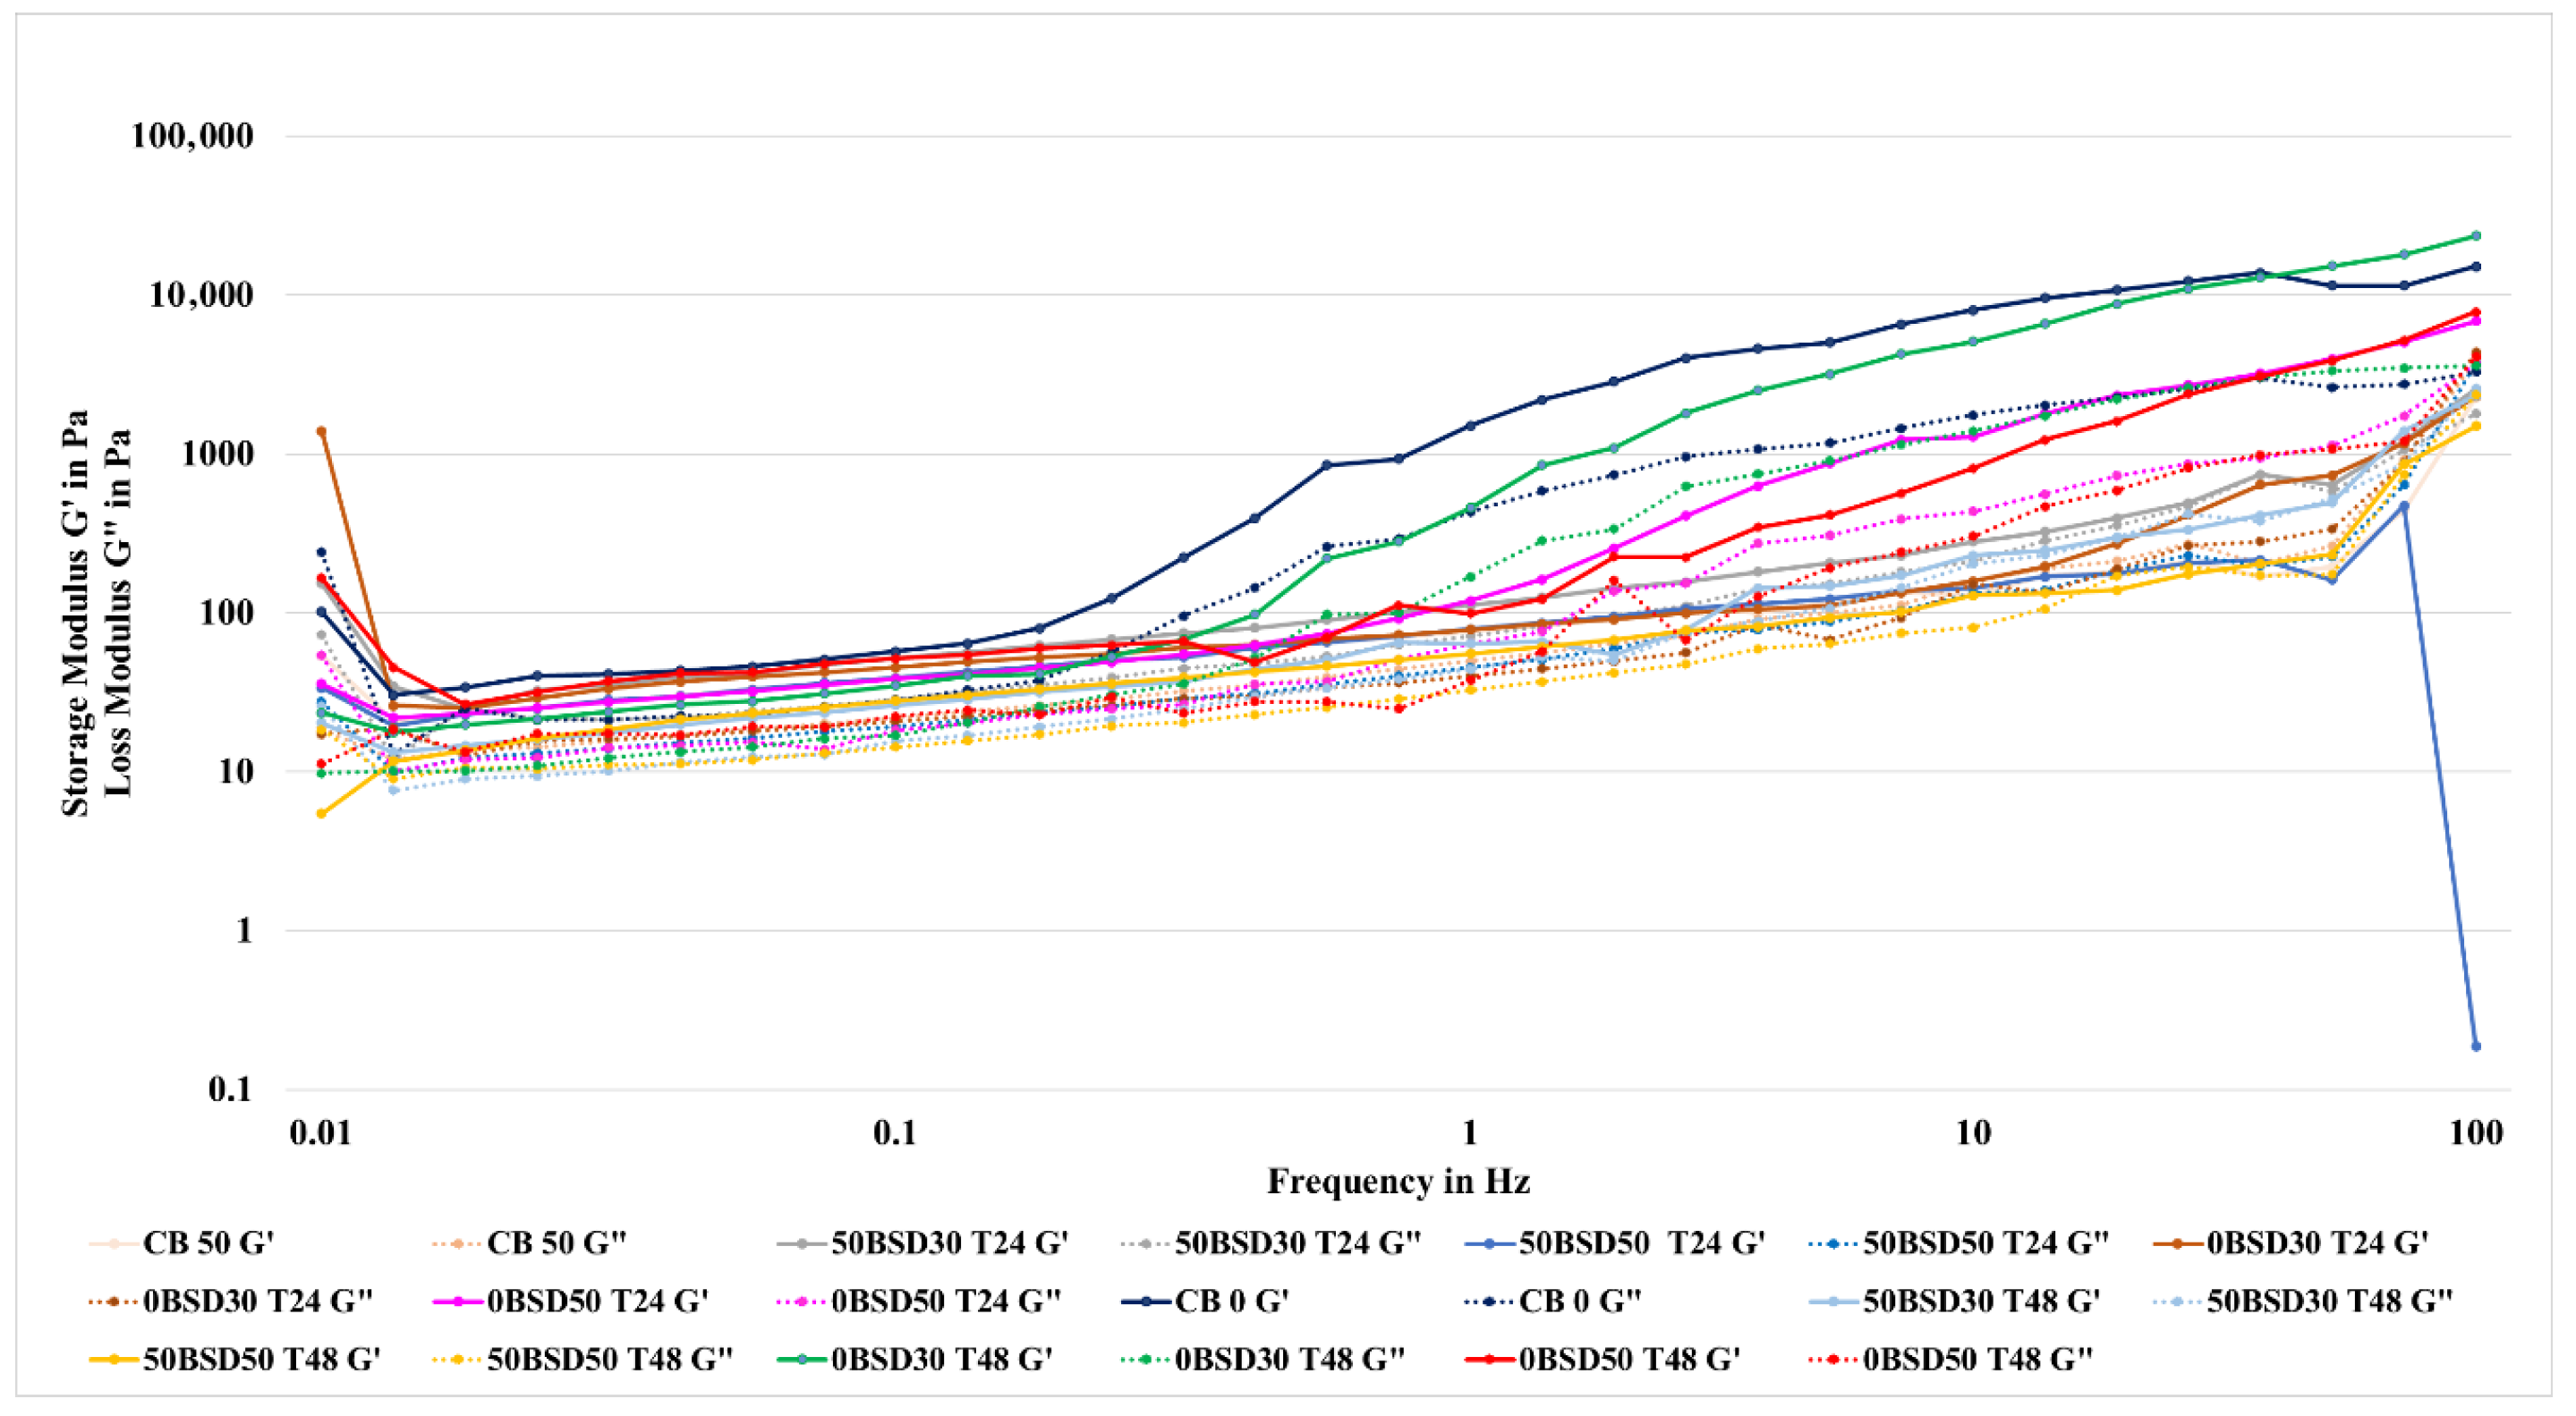
3.5. Viscoelastic Properties of Muffin Batter

Figure 5 shows the rheological characteristics of muffin batter made with sourdough fermented for 24 h and 48 h. Both G′ and G″ are commonly used to illustrate the dynamic properties of viscoelastic materials like muffin batter [15,27]. Regardless of the batter samples tested, G′ was consistently higher than G″, suggesting that the batter behaves mostly like elastic, gel-like material. Muffin batter with 0% added sugar and 30–50% sourdough had much higher G′ values overall, leading to an expected, more rigid and well-structured network. Oppositely, the samples that consisted of 50% added sugar had a lower G′, suggesting diminished structural integrity of the batter. These results reinforce that the addition of sugar delays the stabilization of the batter’s structure. Moreover, mannitol could act as a sugar and impede the entry of water molecules into the starch granules, leading to a diminished degree of starch swelling [13].
The viscoelastic properties improved during fermentation time. Specifically, 0BSD30T48 had the best rheological performance with the highest difference between G′ and G″. This suggests that during 48 h of fermentation, there was a better-structured network with longer-term consistency in structure, due to the continued microbial activity and metabolite accumulation, which improved the development of the matrix structure and consequently the batter’s structure [28]. Organic acids influence the rheological properties of the batter. Lactic acid is known for its contribution to an elastic structure, while acetic acid produces a harder gluten in dough [15]. However, as the sourdough rheological properties indicated (Section 3.2), both sourdough acidification and EPS production influenced the muffin batter’s viscoelastic properties. The addition of sourdough generated a denser and more continuous gluten network, especially due to the production of EPSs and their ability to reduce acidification effects. Moreover, it is known that in batter systems, starch particles could interact with proteins and compete for water, inducing a firmer structure [32].

3.6. Dimensional Parameters, Baking Losses, and Moisture Content of Muffins

The dimensional quality parameters (Table 5) of muffins (height, specific volume, weight, baking loss, and moisture) showed significant differences depending on the added-sugar concentration, the percentage of sourdough, and fermentation time (24 and 48 h). Muffins with higher height and specific volume are more desirable, as they are considered to have a better porosity and a softer texture. These rely on air, which is mixed into the batter, CO2 leavening from baking powder, water evaporated during baking, thermal structural changes in the muffin mix due to starch gelatinization, and heat transfer rate. On the other hand, high baking losses result in reduced moisture content, which can produce a denser, firmer texture, accelerate staling, and diminish both palatability and flavor [39].
To determine the influence of different treatments, simple effect analyses were further conducted to explore the nature of the interactions, followed by Duncan’s multiple range test to identify specific differences among treatment combinations at p < 0.05. The results of two- and three-way ANOVA tests, showing the effects of added-sugar level, sourdough addition, and fermentation time on muffin quality parameters, indicated statistically significant (p < 0.001) interactions as presented in the Supplementary Material (Table S1). The lowest value of muffin height was 3.45 cm (50MSD50T24), whereas the highest value, 3.61 cm, was recorded for the sample 50MSD50T48. During fermentation, the sourdough rheological structure revealed changes due to modifications of the gluten network produced by acidification and gas accumulation, as was shown previously (Section 3.2 and Section 3.5). In addition, sucrose contributes to delaying starch gelatinization during baking and allows for some expansion of air bubbles before the muffin batter hardens [40]. Moreover, the effect size analysis revealed a value of η2 = 0.877 for the interaction between added sugar × sourdough, indicating that the impact of sourdough addition on muffin height varied substantially between added-sugar levels. Thus, the presence of sugar in muffins’ systems creates more time for gas expansion (CO2 and water vapors) and, consequently, height increment. In the case of sourdough × time, the effect size (η2 = 0.878) could suggest that fermentation time modified the effects of both sugar and sourdough on muffin expansion.
The highest specific volume was observed in the control muffin without added sugar (CM0) and the associated samples compared to those with 50% added sugar (Table 5). A three-way analysis of variance (ANOVA) suggests a highly significant three-way interaction among sugar, sourdough, and time (F(4, 54) = 766.68, p < 0.001, η2 = 0.983), indicating that the combined effect of sourdough and fermentation time on specific volume depended strongly on the sugar level. This result demonstrates that changes in specific volume cannot be attributed to any single factor in isolation but rather to the interaction among all three factors. In addition, two-way interactions indicate that the effect of sourdough addition on specific volume varied according to sugar level. Similarly, significant interactions were found for sugar × time (F(2, 54) = 337.82, p < 0.001, η2 = 0.926) and sourdough × time (F(4, 54) = 380.03, p < 0.001, η2 = 0.966), showing that fermentation time markedly modified the effects of both sugar and sourdough on product expansion. Significant main effects were detected for sugar (F(1, 54) = 821.16, p < 0.001, η2 = 0.938), sourdough addition (F(2, 54) = 206.13, p < 0.001, η2 = 0.884), and fermentation time (F(2, 54) = 12.75, p < 0.001, η2 = 0.321), indicating that each factor independently influenced specific volume. Sahin et al. (2019) [13] also found significant influences of sourdough type and addition level on the specific volumes of reduced-sugar cakes. This could be explained by the role of organic acids from sourdough in facilitating protein denaturation, resulting in an increase in the rigidity of the muffin batter during baking.
The weight of muffins varied from 33.39 g (CM0) to 36.52 g (50MSD50T48). The added-sugar level exerted a strong influence on muffin weight (effect size η2 = 0.993), indicating a dominant role in determining product weight. Sourdough addition also showed a pronounced main effect (η2 = 0.998), while fermentation time had a significant but comparatively smaller effect. Overall, the samples with sourdough were slightly heavier than the control muffin samples, indicating that sourdough leads to greater water and gas retention in muffin batter [41].
Baking loss was lower when sourdough was present in the muffins. The lowest baking loss values were for samples 50MSD50T48 (8.7%) and 50MSD50T24 (8.98%). Because all variables and their two-way interactions are statistically significant, the factors must be interpreted collectively rather than individually. The analysis of size effect indicates that the impact of sourdough addition and fermentation time on baking losses depended substantially on added-sugar content (F(4, 54) = 55.45, p < 0.001, η2 = 0.804), and the response to fermentation time differed across sourdough levels (sugar × sourdough (F(2, 54) = 2363.29, p < 0.001, η2 = 0.988), sugar × time (F(2, 54) = 182.49, p < 0.001, η2 = 0.871), and sourdough × time (F(4, 54) = 490.92, p < 0.001, η2 = 0.973). Since baking loss represents the evaporated water during baking, the analysis must be linked with the variation in the muffins’ moisture content.
The moisture content varied between 20.6% and 23.1%, with the highest values being observed in the samples without added sugar (0MSD50T24—23.1%) and with a short sourdough fermentation time. Analysis of significance and effect size suggests that the combined effects of sourdough addition and fermentation time on moisture content varied depending on sugar level (F(4, 54) = 128.18, p < 0.001, η2 = 0.905). Moreover, significant interactions were also observed for sugar × sourdough (F(2, 54) = 150.76, p < 0.001, η2 = 0.848), sugar × time (F(2, 54) = 61.38, p < 0.001, η2 = 0.695), and sourdough × time (F(4, 54) = 18.68, p < 0.001, η2 = 0.580). These results reflect the complex interaction between added sugar, water, and structural proteins in the batter [2]. Although sugar is hygroscopic and forms hydrogen bonds with water, in high concentrations, it tends to “dry out” the batter structure, reducing the availability of water for other ingredients such as gluten and starch. Thus, samples with no added sugar allow for better hydration of the protein matrix and retention of free water. In addition, sourdough contributes to increased moisture through its hygroscopic metabolic products (acids and polysaccharides) [2,42]. Therefore, we can conclude that the lack of sugar is a key driver for higher moisture content, but the addition of Lc-fermented sourdough could reduce the baking loss.

3.7. Mannitol, Carbohydrate, Organic Acid, and Ethanol Determination in Muffins

The amount of carbohydrates (maltose, sucrose, glucose, and fructose), lactic and acetic acids, mannitol, and ethanol in muffins is reported in Table 6.
As expected, sucrose was determined only in the group with 50% added sugar. The recorded values ranged between 49 mg/g and 51 mg/g with minor differences among fermentation times. The addition of sourdough (30% and 50%) led to slight increases in maltose content, as well as in the case of glucose content, but only for the sourdough fermented for 24 h. The highest glucose concentration was around 2.8 mg/g. The addition of 48 h fermented sourdough decreased the glucose content but increased fructose content, with higher values for the group with 50% added sugar. The highest fructose concentration was 2.43 mg/g for 50% sourdough with 48 h of fermentation, while the minimum value was 1.02 mg/g for the sample with no sugar added and 30% sourdough fermented for 48 h. Mannitol concentration increased with both levels of sourdough addition and fermentation time, and the highest values were 4.53 and 4.57 mg/g for muffins with 50% sourdough fermented for 48 h. No acids or ethanol were determined in the control samples. Both lactate and acetate concentrations increased when sourdough was added, with higher values for sourdough fermented for 48 h. Low concentrations of ethanol were recorded for all samples.
Along with the addition of sourdough, enzymes, acids, partially hydrolyzed starch, and small amounts of glucose, fructose, and mannitol were included in the muffin batter. Moreover, the acidification of the muffin batter by sourdough incorporation could promote the hydrolysis of the amorphous structure of starch, which is more accessible to acids and enzymes. Thus, primarily α-1,4 glycosidic bonds break, leading to smaller fragments, like dextrins, maltodextrins, maltose, and glucose. Furthermore, it is well known that for Lc, glucansucrase is expressed intracellularly and secreted into the extracellular medium, generating the break of sucrose into glucose and fructose at the first stage [6,40]. Nevertheless, better acidification could lead to the hydrolysis of sucrose, generating glucose and fructose. This could explain the variation in carbohydrate profiles in muffins with added sourdough.
Statistical analysis further supported the hypothesis that the type of sourdough used influenced metabolite concentrations. The ANOVA test (Table S2) revealed a highly significant three-way and two-way interaction (p < 0.001), indicating that the combined effects of sourdough addition and fermentation time on glucose and fructose concentration differed depending on the added-sugar level, while fermentation time strongly modulated the effect of both factors. Furthermore, the effect size (η2 = 0.998) indicated that the effect of sourdough addition on fructose content varied considerably across added-sugar dosages. Moreover, results demonstrate that fermentation time modified the influence of both added-sugar level and sourdough addition on fructose levels. Fructose concentrations decreased, particularly for the muffins with 0% added sugar, reaching a minimum of 1.02 mg/g for 0MSD30T48, which illustrates that prolonged time in sourdough fermentation leads to a significant decrease in fructose [43]. This low amount of fructose is suitable for people with specific dietary needs, notably diabetics or individuals with insulin resistance, as fructose has a low glycemic index (19) compared to glucose (100) and sucrose (55) [44] and does not tend to cause a dramatic increase in blood sugar after being ingested. In addition, fructose is metabolized almost exclusively in the liver and does not require insulin to be absorbed or converted, making it a more desirable sweetener for low dosages. As Geidl-Flueck & Gerber (2017) [44] and Tappy & Le (2010) [45] observed, the addition of small amounts of fructose can support hepatic glucose metabolism, favoring storage as glycogen and avoiding fat accumulation in the liver. It also does not induce significant insulin secretion, which helps maintain a beneficial hormonal balance. The European Food Safety Authority (EFSA) recommends a fructose intake below 10% per day, and different studies indicate that small to moderate amounts of fructose (<30 g/day) can be digested without risk. Moreover, the WHO advises restricting added sugars to less than 10% of total energy intake and no more than 25–36 g per day [46].
Therefore, the controlled use of small amounts of fructose instead of sucrose can be a safe and even protective nutritional alternative in the diets of people with chronic metabolic disorders such as diabetes, dyslipidemia, or obesity.
The three-way interactions among added sugar, sourdough, and time were not statistically significant (Table S2), indicating that the combined influence of all three factors on mannitol concentration did not differ significantly across their levels (p = 0.156). Despite the absence of significant three-way interaction, all two-way interactions were statistically significant (p < 0.001). Strong interactions were observed for sugar × sourdough (F(1, 24) = 93.34, p < 0.001, η2 = 0.795), indicating that the effect of sourdough addition on mannitol content differed between sugar levels; sugar × time (F(1, 24) = 62.49, p < 0.001, η2 = 0.722) and sourdough × time (F(1, 24) = 806.49, p < 0.001, η2 = 0.971), demonstrating that sourdough addition significantly increased the mannitol amount in muffin samples, as expected. Sahin et al. (2019) [13] observed in their study that the addition of 10% sourdough fermented with Lc TR116 increased the mannitol content in biscuits to 4.8 mg/g and also increased the amount of lactic acid to 0.76 mg/g and acetic acid to 1.95 mg/g.

3.8. FTIR Spectroscopy of Muffins

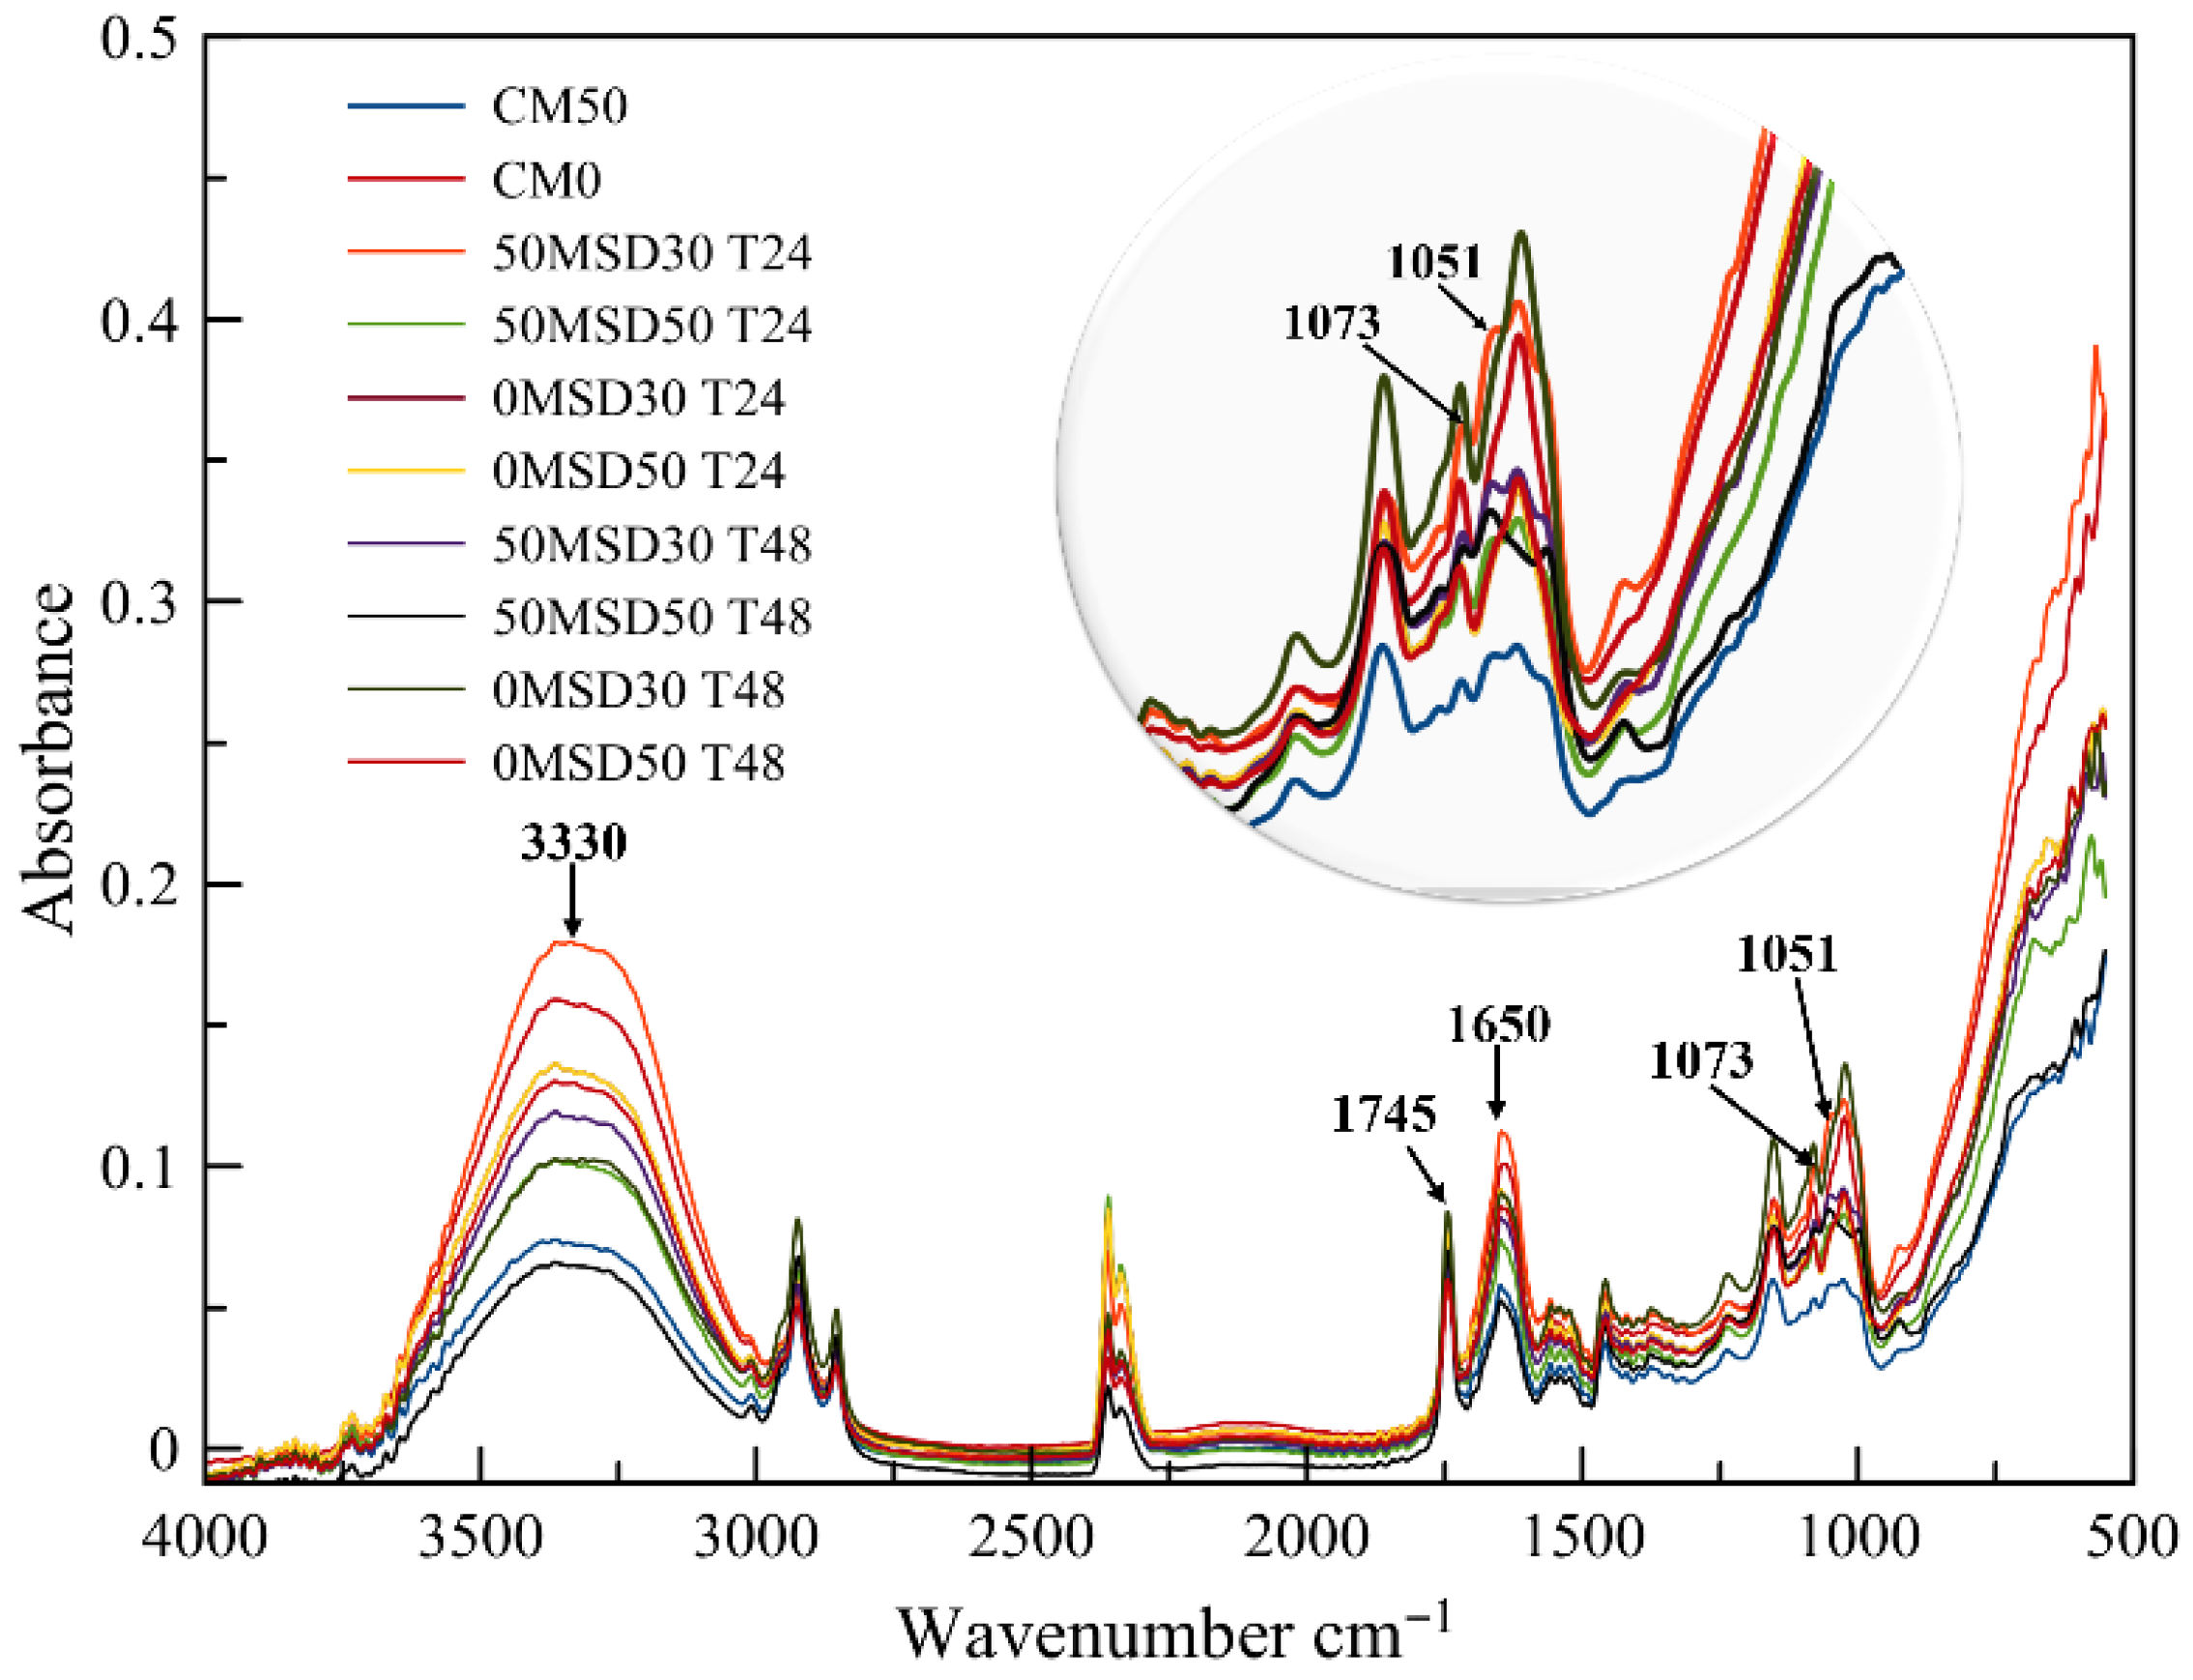
Figure 6 exhibits the FTIR spectra of control muffins and muffins with various amounts of sourdough fermented for T24 or T48. The 50MSD30T24 sample had a highly intense absorbance peak in the range of 3400–3200 cm−1 that demonstrated the quantity of hydroxyl (OH)- or amine (NH)-containing compounds was greater at 24 h, likely because those compounds were further metabolized through fermentation [47]. The absorbance region of 2950–2850 cm−1 shows C-H stretching, which is relatively stable and consistent and is probably as a reflection of very minor untouched lipid composition from grapeseed oil, eggs, and yogurt [48]. Moderate absorbance in the region of 1700–1600 cm−1 (C=O stretching) indicates proteins and organic acids may be present, and minor absorbance changes between T24 and T48 could indicate an increase in organic acids over the fermentation time, correlating with previous results reported in Section 3.3 and Section 3.7. By comparing the muffins’ spectra with those obtained for fructose, mannitol (Figure 4), and sourdough, it is possible to point out that specific spectral peaks of 1051 and 1073 cm−1 could be considered for fructose and mannitol. However, muffins are a very complex carbohydrate-based matrix, and it is difficult to uniquely assign peaks to a compound. But FTIR analysis could complete the HPLC determination and allow for correlations for a better understanding of specific modifications.

3.9. Muffins’ Microbiological Properties

The microbiological investigation of muffin samples yielded diverse outcomes for total plate count (TPC), yeasts, and molds, depending upon the day of assessment and muffin formulation (Table 7). Most muffins were determined to have their highest TPC, as well as yeast and mold count, on the third day of storage. Also, the first visible signs of mold appeared on the fourth day of storage at room temperature. All muffin samples analyzed contained no Enterobacteriaceae or coagulase-positive Staphylococcus aureus and were compliant with microbiological standards, from the perspective of these two criteria [22]. However, both TPC and yeast and mold count revealed high levels of microbial growth for a baked product. Except for two samples (50MSD30T24 and 0MSD50T24), which recorded yeasts and molds from the first day of storage, probably due to post-baking contamination, the high microbial growth in muffins could be caused by higher moisture content, reduced sugar content, lower acidity or cross-contamination.
Sugar is a rapid source of energy and enables mold growth, especially in moist products such as muffins [49]. In contrast, products with no added sugar or naturally fermented food products usually offer a less favorable environment for fungal contamination, as the sugars are consumed by LABs and the resulting lactic acid and acetic acid lower the pH and inhibit mold growth. Even though acetic acid is known for its antifungal properties and helps the bio-preservation of the muffins, its concentration is insufficient [50]. Although the sugar-free samples showed slightly higher microbial growth than those with added sugar and higher moisture content, the linear regression analysis did not reveal a significant relationship (p > 0.05) between humidity and TPC or yeast and mold count values. Similarly, no significant correlations (p > 0.05) were identified between the concentrations of lactic and acetic acids and microbial growth. However, contamination can occur from external sources such as air, packaging, equipment and humans [51].

3.10. Sensorial Analysis

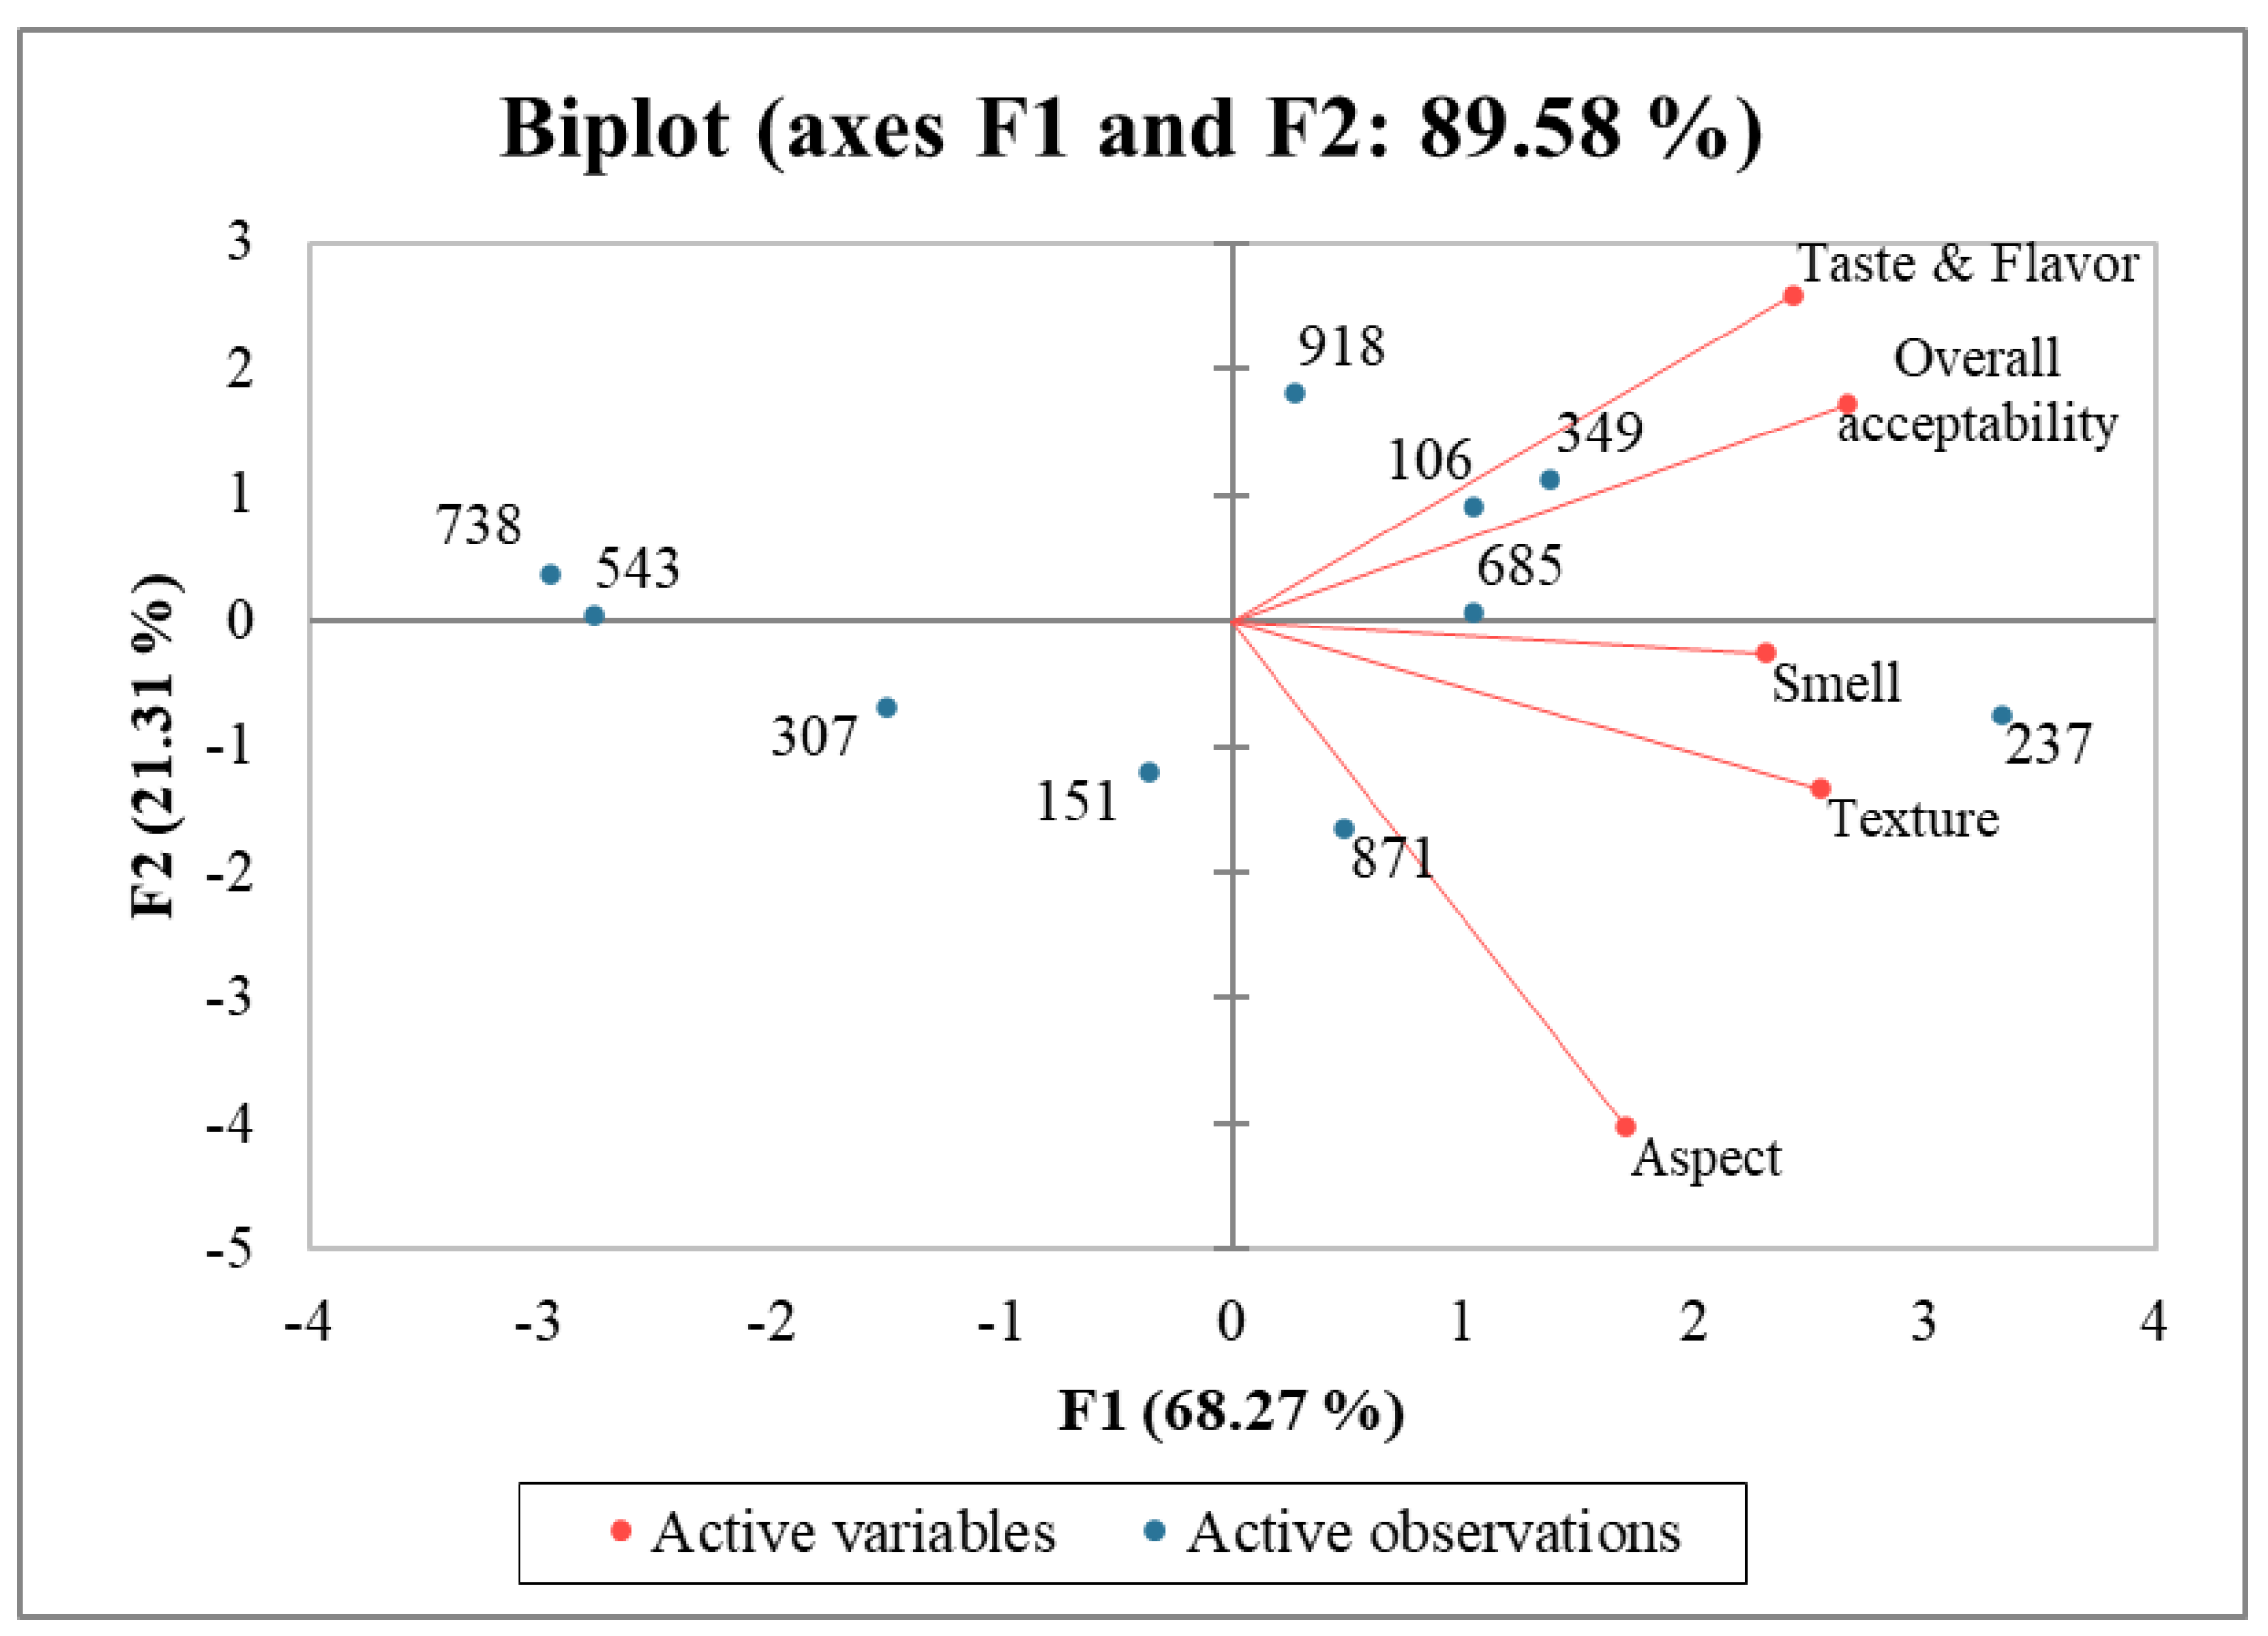
The results for the sensorial analysis of the muffin samples were analyzed using the PCA method (Figure 7) and were found to explain 89.58% of the differences between F1 (68.27%) and F2 (21.31%). F1 and F2 are the first two major axes and are significant because they explain most of the variation in the data. These axes are linear combinations of the original variables (aspect, smell, taste and flavor, texture, and overall acceptability) and represent the best account of the structure and differences between the sensory samples analyzed.
The muffins with 50% added sugar were the most appreciated samples and scored the highest for taste and flavor and overall acceptability, regardless of the sourdough addition level or fermentation time. The lack of added sugar severely impacted them from a sensory perspective, thereby putting them in a neutral position for consumers. Samples 237 (50MSD50T24) and 871 (0MSD50T24), similar regarding sourdough concentration, statistically differed from all the other samples regarding smell, texture, and aspect and had statistically higher scores than all other variants for these attributes.
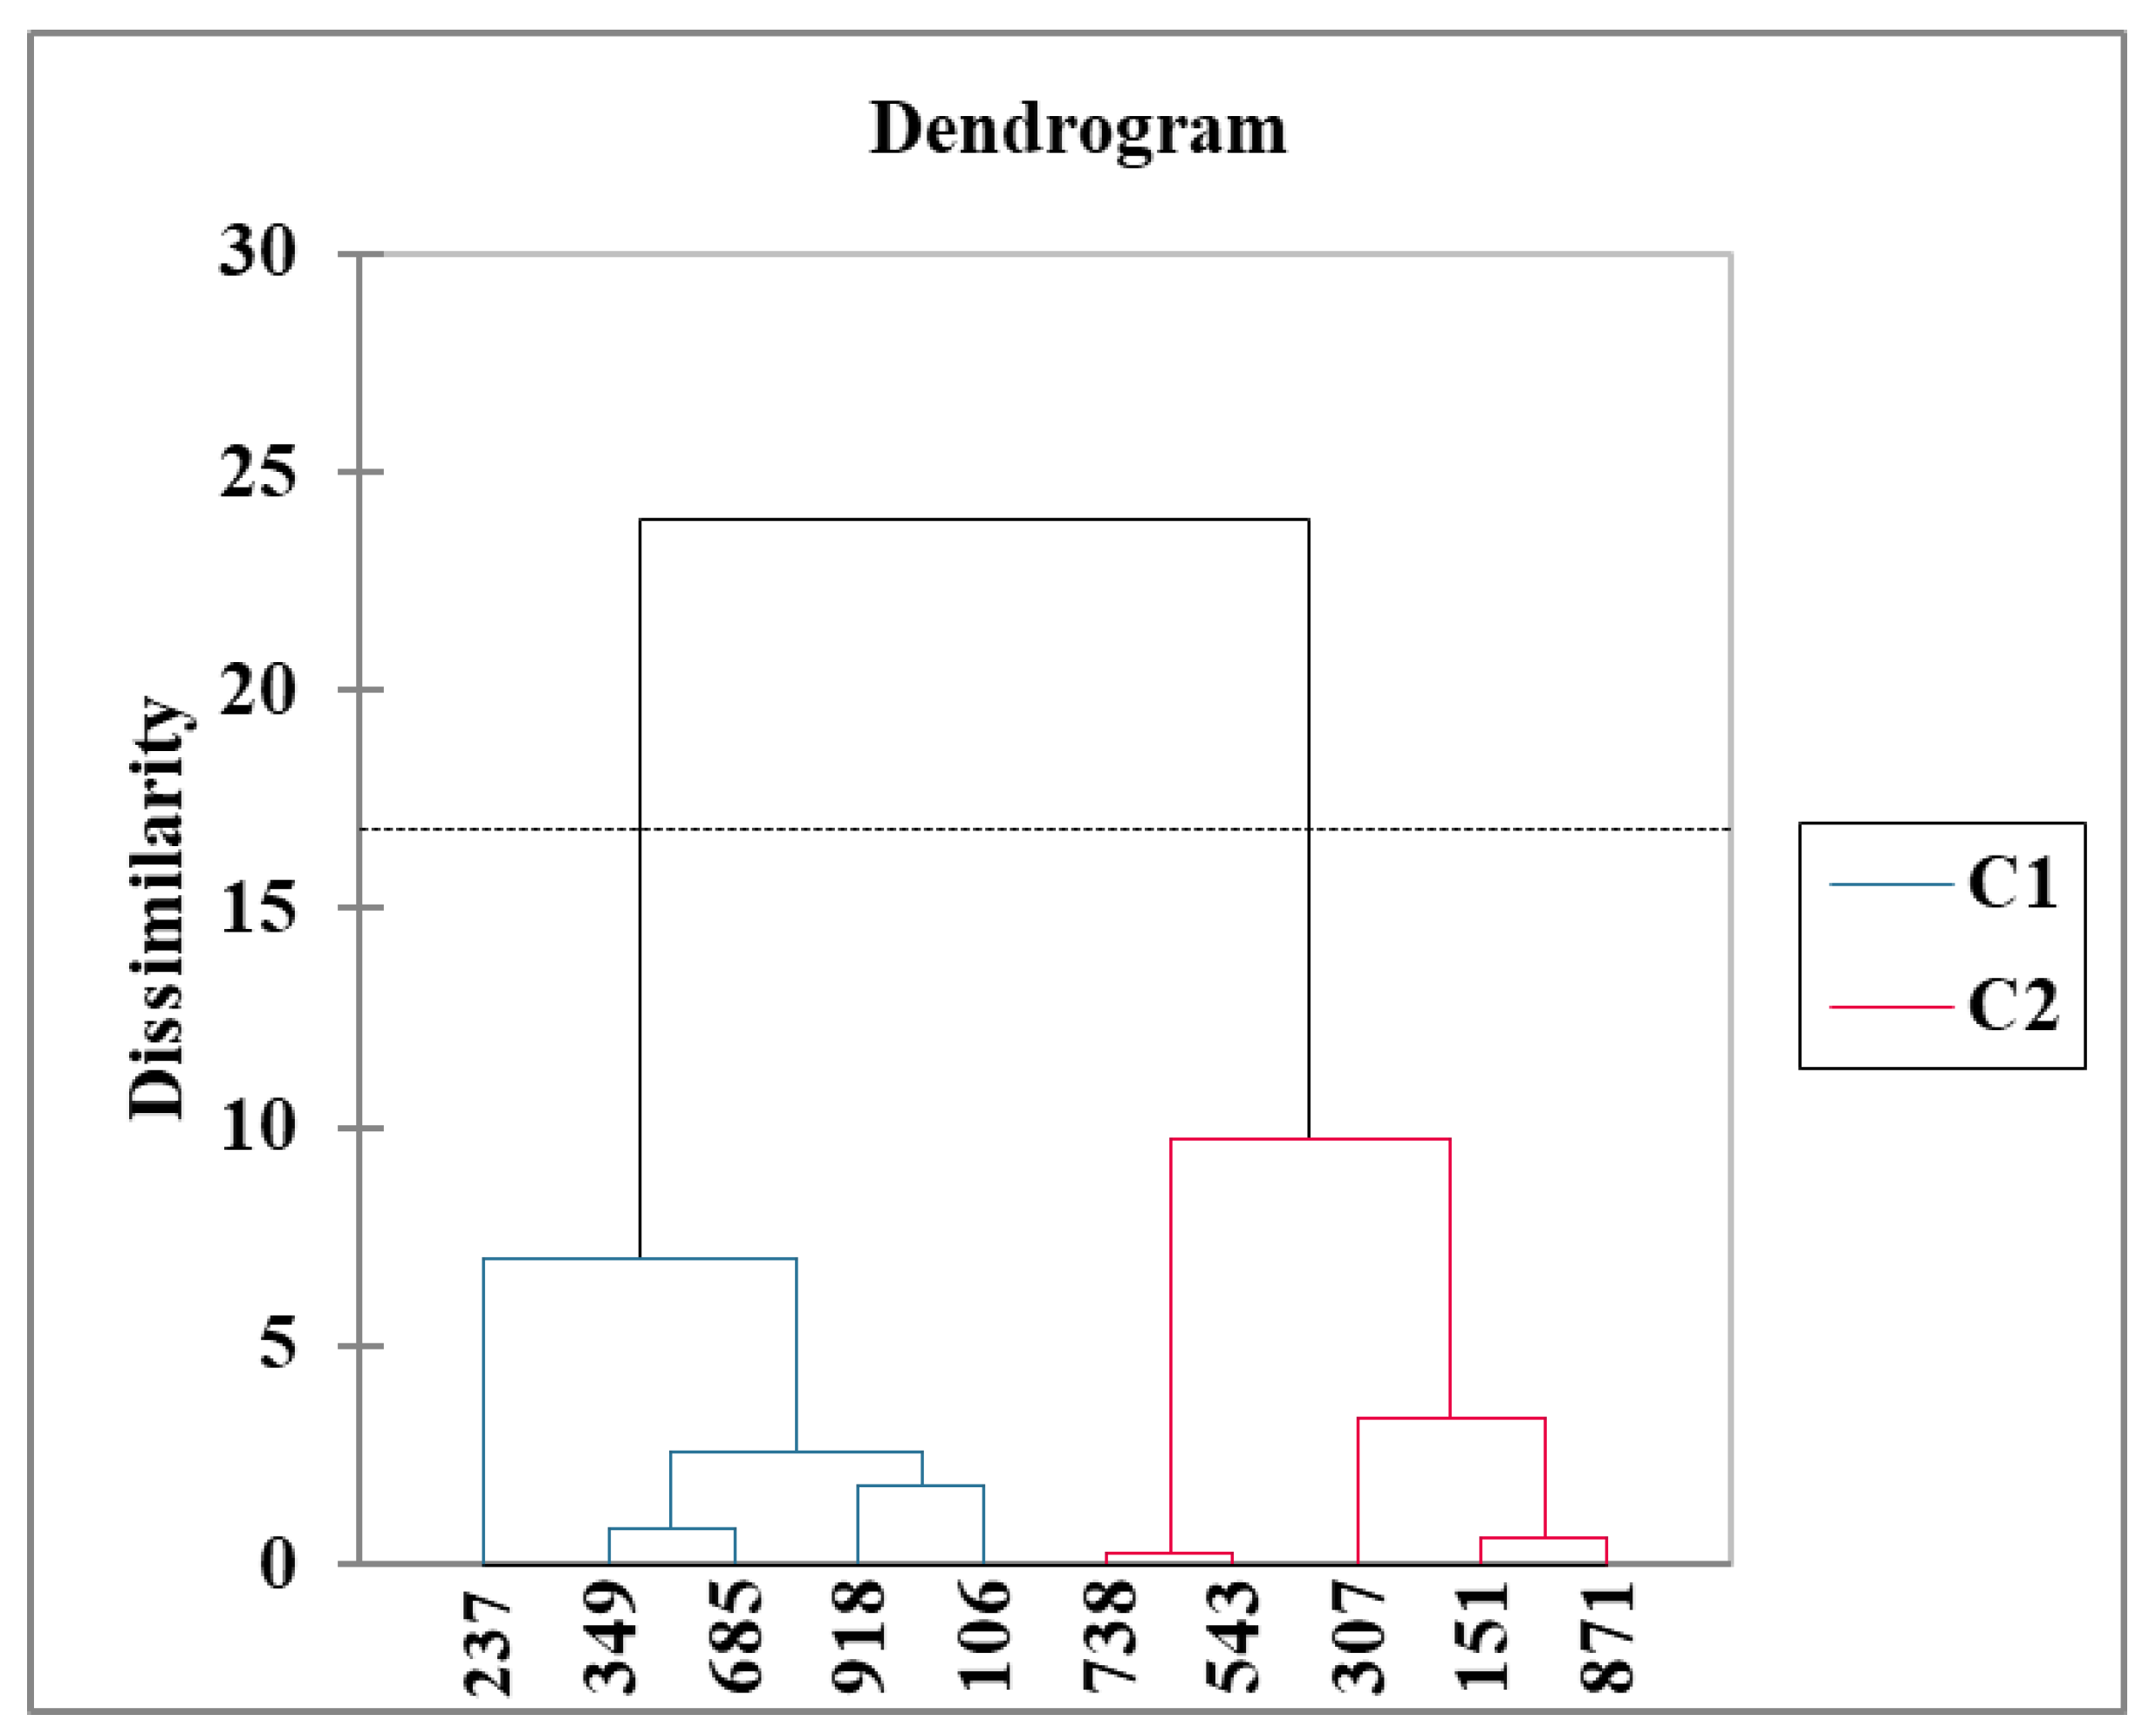
Moreover, the agglomerative hierarchical clustering (Figure 8) indicates that the larger the distance, the more dissimilar the samples were from each other. Thus, the dendrogram clearly indicates two clusters, C1 and C2, where the muffin samples were grouped according to their added-sugar content (0% or 50%). In conclusion, regarding the taste and flavor, muffins with 50% added sugar and 30% sourdough fermented for 24 h were the most appreciated.
The hedonic scores obtained for muffins’ taste indicate lower average values of 2 points for the group with no added sugar, where the sweetness was due mainly to mannitol (ranging between 3 and 4.5 mg/g), fructose (0.8–1.5 mg/g), and residual glucose (2–2.77 mg/g). Although the mannitol level is low, recent findings [52] suggest that it can be used as a valuable alternative sweetener in food products. Thus, mannitol has a relative sweetness ranging from 0.5 to 0.7 compared to sucrose, considered the standard of 1.0. Unlike fructose, which exhibits higher sweetness intensity and a more linear response, mannitol follows a sigmoidal dose–response function. This sigmoidal relationship is a direct result of the binding kinetics between the sweetener molecules and taste receptors; as concentration increases, the perceived intensity eventually plateaus because the receptors become saturated. These sensory properties are consistent with those found in other sugar alcohols, including erythritol, sorbitol, and xylitol. To match the sweetness intensity of 10% sucrose, 14.6% mannitol is necessary. Despite its lower absolute intensity, mannitol demonstrated sweetness growth rates with slopes similar to those for sucrose. So, changes in mannitol concentration produce shifts in perceived sweetness intensity comparable to those of sucrose. This characteristic is particularly relevant for achieving “moderate” sweetness (equivalent to 10% sugar) [52]. Recent findings highlight that the pH level of the medium is a critical factor in the perception of mannitol. There is a specific difference in sweet responses under varying pH conditions, demonstrating that higher acidity enhances the perceived sweetness of mannitol. This ability to amplify sweetness at low pH levels could be helpful for food formulation [53]. Thus, formulating mannitol-containing baked goods with the introduction of acidic ingredients (sourdough, fruits, etc.) could be a good strategy to improve their consumers’ acceptability. Moreover, from a nutritional perspective, the application of mannitol offers a significant reduction in the energy value, being 2.5 times lower in calories. Thus, replacing sucrose with mannitol or combining them supports current strategies and broader public health goals of calorie reduction.
Additional analyses are necessary to determine the sensory perception of sweet taste in the case of a mixture of mannitol, fructose, and glucose, as in the current study. However, it is possible that the mixture would create a “rounded” sweetness due to the different rates at which these substances are perceived. That relies on mannitol sweetness, which develops more slowly and is less intense, potentially extending the duration of the sweet sensation [54].

4. Conclusions

The use of sourdough fermented with Lc DSM 5577 in the formulation of muffins with natural reduced sugar content influences both their technological quality and carbohydrate profile, primarily due to its ability to produce mannitol, a natural sweetener. Fermentation improved the rheological structure of the sourdough and batter while positively influencing the muffins in terms of moisture retention and sensory attributes. The muffins with 50% reduced sugar and 30% sourdough fermented for 24 h were better scored for taste, flavor, and overall acceptability. The lack of sugar is a key driver of higher moisture content, but the addition of mannitol-containing sourdough could reduce baking losses and prevent specific volume reduction. However, statistical analysis showed that muffins’ mannitol content offers a multifactorial benefit through acid, aroma, and texture synergy, rather than simply replacing sweetness. Further analyses will be conducted to assess the volatile and textural profile of reduced-added-sugar muffins, along with the color and detailed sensory attributes, as the main properties that influence consumers’ perception. Moreover, additional studies will be conducted to overcome the limitations of this study, permitting generalization across industrial production. Also, studies on non-inoculated sourdough and sourdough without fructose might reveal additional insights regarding the results’ practical applicability.

Supplementary Materials

The following supporting information can be downloaded at: https://www.mdpi.com/article/10.3390/app16083697/s1, Table S1: Results of two- and three-way ANOVA test showing the effects of added-sugar level, sourdough addition, and fermentation time on muffin quality parameters; Table S2: Results of two- and three-way ANOVA test showing the effects of added-sugar level, sourdough addition, and fermentation time on glucose, fructose, and mannitol content.

Author Contributions

Conceptualization, M.-F.R. and A.P. (Adriana Păucean); methodology, M.-F.R., A.P. (Adriana Păucean), L.S., V.M., A.C.F., M.S.C., O.N. and C.L.; software, O.N.; validation, S.M.M., M.S.C., C.R.P. and A.P. (Andreea Pușcaș); formal analysis and investigation, M.-F.R., A.P. (Andreea Pușcaș), C.R.P., F.R., S.M.M. and O.M.B.; data curation, F.R., A.P. (Andreea Pușcaș) and M.-F.R.; writing—original draft preparation, M.-F.R., A.P. (Adriana Păucean) and O.N.; writing—review and editing, A.P. (Adriana Păucean); visualization, C.R.P. and A.C.F.; supervision, A.P. (Adriana Păucean); project administration, A.P. (Adriana Păucean). All authors have read and agreed to the published version of the manuscript.

Funding

This research received no external funding.

Institutional Review Board Statement

Not applicable.

Informed Consent Statement

Not applicable.

Data Availability Statement

The original contributions presented in this study are included in the article. Further inquiries can be directed to the corresponding author.

Conflicts of Interest

The authors declare no conflicts of interest.

References

  1. Gökçe, C.; Bozkurt, H.; Maskan, M. The Use of Carob Flour and Stevia as Sugar Substitutes in Sponge Cake: Optimization for Reducing Sugar and Wheat Flour in Cake Formulation. Int. J. Gastron. Food Sci. 2023, 32, 100732. [Google Scholar] [CrossRef]
  2. Sahin, A.W.; Zannini, E.; Coffey, A.; Arendt, E.K. Sugar Reduction in Bakery Products: Current Strategies and Sourdough Technology as a Potential Novel Approach. Food Res. Int. 2019, 126, 108583. [Google Scholar] [CrossRef] [PubMed]
  3. Roșca, M.F.; Păucean, A.; Man, S.M.; Chiș, M.S.; Pop, C.R.; Pop, A.; Fărcaș, A.C. Leuconostoc citreum: A Promising Sourdough Fermenting Starter for Low-Sugar-Content Baked Goods. Foods 2024, 13, 96. [Google Scholar] [CrossRef] [PubMed]
  4. Gänzle, M.G. Lactic Metabolism Revisited: Metabolism of Lactic Acid Bacteria in Food Fermentations and Food Spoilage. Curr. Opin. Food Sci. 2015, 2, 106–117. [Google Scholar] [CrossRef]
  5. Sahin, A.W.; Rice, T.; Zannini, E.; Lynch, K.M.; Coffey, A.; Arendt, E.K. The Incorporation of Sourdough in Sugar-Reduced Biscuits: A Promising Strategy to Improve Techno-Functional and Sensory Properties. Eur. Food Res. Technol. 2019, 245, 1841–1854. [Google Scholar] [CrossRef]
  6. Sahin, A.W.; Rice, T.; Coffey, A. Genomic Analysis of Leuconostoc citreum TR116 with Metabolic Reconstruction and the Effects of Fructose on Gene Expression for Mannitol Production. Int. J. Food Microbiol. 2021, 354, 109327. [Google Scholar] [CrossRef]
  7. Martínez-Miranda, J.G.; Chairez, I.; Durán-Páramo, E. Mannitol Production by Heterofermentative Lactic Acid Bacteria: A Review. Appl. Biochem. Biotechnol. 2022, 194, 2762–2795. [Google Scholar] [CrossRef]
  8. Msomi, N.Z.; Erukainure, O.L.; Islam, M.S. Suitability of Sugar Alcohols as Antidiabetic Supplements: A Review. J. Food Drug Anal. 2021, 29, 1. [Google Scholar] [CrossRef]
  9. Armendariz, N.; Ortiz-romero, L.; Giura, L.; García-Martín, A.; Fratebianchi, D.; Santos, V.E. Linking Process Variables to Exopolysaccharide Yield, Molecular Size and Viscosity in Leuconostoc citreum CNTA 860 Fermentation. Process Biochem. 2026, 165, 185–193. [Google Scholar] [CrossRef]
  10. Katina, K.; Arendt, E.; Liukkonen, K.H.; Autio, K.; Flander, L.; Poutanen, K. Potential of Sourdough for Healthier Cereal Products. Trends Food Sci. Technol. 2005, 16, 104–112. [Google Scholar] [CrossRef]
  11. Chavan, R.S.; Chavan, S.R. Sourdough Technology-A Traditional Way for Wholesome Foods: A Review. Compr. Rev. Food Sci. Food Saf. 2011, 10, 169–182. [Google Scholar] [CrossRef]
  12. Sahin, A.W.; Rice, T.; Zannini, E.; Axel, C.; Coffey, A.; Lynch, K.M.; Arendt, E.K. Leuconostoc citreum TR116: In-Situ Production of Mannitol in Sourdough and Its Application to Reduce Sugar in Burger Buns. Int. J. Food Microbiol. 2018, 302, 80–89. [Google Scholar] [CrossRef] [PubMed]
  13. Sahin, A.W.; Rice, T.; Zannini, E.; Lynch, K.M.; Coffey, A.; Arendt, E.K. Sourdough Technology as a Novel Approach to Overcome Quality Losses in Sugar-Reduced Cakes. Food Funct. 2019, 10, 4985–4997. [Google Scholar] [CrossRef] [PubMed]
  14. Müller, D.C.; Schipali, S.; Näf, P.; Kinner, M.; Schwenninger, S.M.; Schönlechner, R. Potential of a Techno-Functional Sourdough and Its Application in Sugar-Reduced Soft Buns. Fermentation 2022, 8, 42. [Google Scholar] [CrossRef]
  15. Șerban, L.R.; Păucean, A.; Chiș, M.S.; Pop, C.R.; Man, S.M.; Pușcaș, A.; Ranga, F.; Socaci, S.A.; Alexa, E.; Berbecea, A.; et al. Metabolic Profile of Einkorn, Spelt, Emmer Ancient Wheat Species Sourdough Fermented with Strain of Lactiplantibacillus plantarum ATCC 8014. Foods 2023, 12, 1096. [Google Scholar] [CrossRef]
  16. Lee, J.; Yeo, H.G.; Noh, J.H.; Kim, H.; Kim, H.; Kwak, G. Acrylamide-Based Aramid-Reinforced Soft Contact Lenses. Adv. Eng. Mater. 2024, 26, 2302244. [Google Scholar] [CrossRef]
  17. Lobo, R.E.; Figueroa, T.; Navarro, D.; Gómez, M.I.; Font de Valdez, G.; Torino, M.I. Techno-Functional Properties of HoPS from Lactic Acid Bacteria of Different Origins as Potential Food Additives. Food Chem. 2021, 356, 129627. [Google Scholar] [CrossRef]
  18. Casas-Godoy, L.; Barrera-Martínez, I.; Borrás-Enríquez, A.J.; Gonzalez-Escobar, J.L.; Sánchez-Becerril, M.; Moreno-Vilet, L.; García-Barrón, S.E. Development of a Gluten- and Lactose-Free Bakery Product with Nutritional and Functional Potential. Rev. Mex. Ing. Quim. 2023, 22, Alim2318. [Google Scholar] [CrossRef]
  19. Huțu, D.; Amariei, S. Possibility of Replacing Sugar with Apple Puree in Muffins. Appl. Sci. 2024, 14, 8511. [Google Scholar] [CrossRef]
  20. Liu, Y.; Guan, E.; Li, M.; Bian, K.; Wen, J.; Ren, C. Improvement of Cake Quality by Superheated Steam Treatment of Wheat. J. Cereal Sci. 2020, 95, 103046. [Google Scholar] [CrossRef]
  21. Dinardo, F.R.; Minervini, F.; De Angelis, M.; Gobbetti, M.; Gänzle, M.G. Dynamics of Enterobacteriaceae and Lactobacilli in Model Sourdoughs are Driven by PH and Concentrations of Sucrose and Ferulic Acid. LWT 2019, 114, 108394. [Google Scholar] [CrossRef]
  22. Commission Regulation (EC) No 2073/2005 of 15 November 2005 on Microbiological Criteria for Foodstuffs. Off. J. Eur. Union 2007, 338, 1–26. Available online: https://eur-lex.europa.eu/eli/reg/2005/2073/oj (accessed on 6 April 2026).
  23. Smith, J.P.; Daifas, D.P.; El-Khoury, W.; Koukoutsis, J.; El-Khoury, A. Shelf Life and Safety Concerns of Bakery Products—A Review. Crit. Rev. Food Sci. Nutr. 2004, 44, 19–55. [Google Scholar] [CrossRef] [PubMed]
  24. Temkov, M.; Rocha, J.M.; Rannou, C.; Ducasse, M.; Prost, C. Influence of Baking Time and Formulation of Part-Baked Wheat Sourdough Bread on the Physical Characteristics, Sensory Quality, Glycaemic Index and Appetite Sensations. Front. Nutr. 2024, 11, 1370086. [Google Scholar] [CrossRef]
  25. Hoehnel, A.; Bez, J.; Sahin, A.W.; Coffey, A.; Arendt, E.K.; Zannini, E. Leuconostoc citreum TR116 as a Microbial Cell Factory to Functionalise High-Protein Faba Bean Ingredients for Bakery Applications. Foods 2020, 9, 1706. [Google Scholar] [CrossRef]
  26. Çakır, E.; Arıcı, M.; Durak, M.Z.; Karasu, S. The Molecular and Technological Characterization of Lactic Acid Bacteria in Einkorn Sourdough: Effect on Bread Quality. J. Food Meas. Charact. 2020, 14, 1646–1655. [Google Scholar] [CrossRef]
  27. Longoria, S.; Contreras, J.; Belmares, R.; Cruz, M.; Flores, M. Effect of Short Fermentation Times with Lactobacillus paracasei in Rheological, Physical and Chemical Composition Parameters in Cassava Dough and Biscuits. Appl. Sci. 2020, 10, 1383. [Google Scholar] [CrossRef]
  28. Sakoui, S.; Derdak, R.; Jouga, F.; Dagni, A.; Pop, O.L.; Vodnar, D.C.; Teleky, B.E.; Chis, M.S.; Pop, C.R.; Stan, L.; et al. The Impact of Fermented Quinoa Sourdough with Enterococcus Strains on the Nutritional, Textural, and Sensorial Features of Gluten-Free Muffins. Fermentation 2025, 11, 26. [Google Scholar] [CrossRef]
  29. Angioloni, A.; Romani, S.; Pinnavaia, G.G.; Rosa, M.D. Characteristics of Bread Making Doughs: Influence of Sourdough Fermentation on the Fundamental Rheological Properties. Eur. Food Res. Technol. 2006, 222, 54–57. [Google Scholar] [CrossRef]
  30. Reed, N. The Influence of Organic Acids on Gluten Structure and Digestibility in Bread-making. J. Gastrointest. Dig. Syst. 2024, 14, 1000805. Available online: https://www.omicsonline.org/open-access/the-influence-of-organic-acids-on-gluten-structure-and-digestibility-in-breadmaking-2161-069X-1000805-132411.html (accessed on 6 April 2026).
  31. Koceva, D.; Slaanac, V.; Juki, M. Influence of Acidification on Dough Rheological Properties. In Rheology; IntechOpen: London, UK, 2012; pp. 265–292. [Google Scholar] [CrossRef][Green Version]
  32. Yan, C.; Zeng, F.; Du, Y.; Li, D.; Xie, C.; Yang, R.; Wang, P. The Mechanism of Enhanced Technofunctionality of Wheat Aleurone Layer Sourdough Fermentation by Interaction of Exopolysaccharides and Gluten Proteins. Food Chem. 2026, 504, 147925. [Google Scholar] [CrossRef] [PubMed]
  33. Tang, X.; Zhang, B.; Huang, W.; Ma, Z.; Zhang, F.; Wang, F.; Zou, Q.; Zheng, J. Hydration, Water Distribution and Microstructure of Gluten during Freeze Thaw Process: Role of a High Molecular Weight Dextran Produced by Weissella confusa QS813. Food Hydrocoll. 2019, 90, 377–384. [Google Scholar] [CrossRef]
  34. Saha, B.C.; Racine, F.M. Biotechnological Production of Mannitol and Its Applications. Appl. Microbiol. Biotechnol. 2011, 89, 879–891. [Google Scholar] [CrossRef]
  35. Saeed, M.; Randhawa, M.A.; Pasha, I.; Anjum Murtaza, M.; Afzal, J. Amino Acids and Organic Acids Production by Single Strain Starter Culture in Sourdough Fermentation. Br. J. Agric. Sci. 2014, 9, 121–127. [Google Scholar]
  36. Coda, R.; Xu, Y.; Moreno, D.S.; Mojzita, D.; Nionelli, L.; Rizzello, C.G.; Katina, K. Performance of Leuconostoc citreum FDR241 during Wheat Flour Sourdough Type I Propagation and Transcriptional Analysis of Exopolysaccharides Biosynthesis Genes. Food Microbiol. 2018, 76, 164–172. [Google Scholar] [CrossRef]
  37. Xu, Y.; Wang, Y.; Coda, R.; Säde, E.; Tuomainen, P.; Tenkanen, M.; Katina, K. In Situ Synthesis of Exopolysaccharides by Leuconostoc spp. and Weissella spp. and Their Rheological Impacts in Fava Bean Flour. Int. J. Food Microbiol. 2017, 248, 63–71. [Google Scholar] [CrossRef]
  38. Vodnar, D.C.; Pop, O.L.; Socaciu, C. Monitoring Lactic Acid Fermentation in Media Containing Dandelion (Taraxacum officinale) by FTIR Spectroscopy. Not. Bot. Horti Agrobot. Cluj-Napoca 2012, 40, 65–68. [Google Scholar] [CrossRef]
  39. Du, H.; Baek, I.; Jang, Y.; Said, N.S.; Lee, W.Y. Effects on Physicochemical, Nutritional, and Quality Attributes of Fortified Vegan Muffins Incorporated with Hempseed as an Alternative Protein Source. Foods 2025, 14, 601. [Google Scholar] [CrossRef]
  40. Majzoobi, M.; Mohammadi, M.; Mesbahi, G.; Farahnaky, A. Feasibility Study of Sucrose and Fat Replacement Using Inulin and Rebaudioside A in Cake Formulations. J. Texture Stud. 2018, 49, 468–475. [Google Scholar] [CrossRef]
  41. Păucean, A.; Șerban, L.R.; Chiș, M.S.; Mureșan, V.; Pușcaș, A.; Man, S.M.; Pop, C.R.; Socaci, S.A.; Igual, M.; Ranga, F.; et al. Nutritional Composition, in vitro Carbohydrates Digestibility, Textural and Sensory Characteristics of Bread as Affected by Ancient Wheat Flour Type and Sourdough Fermentation Time. Food Chem. X 2024, 22, 101298. [Google Scholar] [CrossRef] [PubMed]
  42. Pareyt, B.; Delcour, J.A. The Role of Wheat Flour Constituents, Sugar, and Fat in Low Moisture Cereal Based Products: A Review on Sugar-Snap Cookies. Crit. Rev. Food Sci. Nutr. 2008, 48, 824–839. [Google Scholar] [CrossRef] [PubMed]
  43. Khorshidian, N.; Shadnoush, M.; Zabihzadeh Khajavi, M.; Sohrabvandi, S.; Yousefi, M.; Mortazavian, A.M. Fructose and High Fructose Corn Syrup: Are They a Two-Edged Sword? Int. J. Food Sci. Nutr. 2021, 72, 592–614. [Google Scholar] [CrossRef] [PubMed]
  44. Geidl-Flueck, B.; Gerber, P.A. Insights into the Hexose Liver Metabolism—Glucose versus Fructose. Nutrients 2017, 9, 1026. [Google Scholar] [CrossRef]
  45. Tappy, L.; Le, K.A. Metabolic Effects of Fructose and the Worldwide Increase in Obesity. Physiol. Rev. 2010, 90, 23–46. [Google Scholar] [CrossRef]
  46. Baharuddin, B. The Metabolic and Molecular Mechanisms Linking Fructose Consumption to Lipogenesis and Metabolic Disorders. Clin. Nutr. ESPEN 2025, 69, 63–68. [Google Scholar] [CrossRef]
  47. Farajinejad, Z.; Mohtarami, F.; Pirouzifard, M.; Amiri, S.; Hamishehkar, H. In Situ Produced Exopolysaccharides by Bacillus coagulans IBRC-M 10807 and Its Effects on Properties of Whole Wheat Sourdough. Food Sci. Nutr. 2023, 11, 7000–7012. [Google Scholar] [CrossRef]
  48. Türker-Kaya, S.; Huck, C.W. A Review of Mid-Infrared and near-Infrared Imaging: Principles, Concepts and Applications in Plant Tissue Analysis. Molecules 2017, 22, 168. [Google Scholar] [CrossRef]
  49. Rodríguez, A.; Magan, N.; Medina, A. Evaluation of the Risk of Fungal Spoilage When Substituting Sucrose with Commercial Purified Stevia Glycosides in Sweetened Bakery Products. Int. J. Food Microbiol. 2016, 231, 42–47. [Google Scholar] [CrossRef]
  50. Debonne, E.; Vermeulen, A.; Bouboutiefski, N.; Ruyssen, T.; Van Bockstaele, F.; Eeckhout, M.; Devlieghere, F. Modelling and Validation of the Antifungal Activity of DL-3-Phenyllactic Acid and Acetic Acid on Bread Spoilage Moulds. Food Microbiol. 2020, 88, 103407. [Google Scholar] [CrossRef]
  51. Saranraj, P. Microbial Spoilage of Bakery Products and Its Control by Preservatives. Int. J. Pharm. Biol. 2010, 3, 38–48. [Google Scholar]
  52. Wee, M.; Tan, V.; Forde, C. A Comparison of Psychophysical Dose-Response Behaviour across 16 Sweeteners. Nutrients 2018, 10, 1632. [Google Scholar] [CrossRef]
  53. Eom, S.; Pyeon, M.; Moon, M.; Yeom, H.D.; Song, J.H.; Choi, E.J.; Lee, M.; Chang, J.Y.; Lee, J.H. Molecular Basis for Detection of Sweet Taste Perception of Mannitol Depending on PH Condition. Food Biosci. 2024, 62, 105520. [Google Scholar] [CrossRef]
  54. Luhn, O.; Eckert, N.; Bernard, J. Sensory Evaluation of Isomalt, Mannitol and Sucrose with Respect to the Manufacture of Organoleptically Attractive Dosage Forms. Int. J. Pharm. 2016, 2, 1149. [Google Scholar] [CrossRef]
Figure 1. Flow diagram of muffin production.
Applsci 16 03697 g001
Figure 2. Storage modulus (G′) and loss modulus (G″) for sourdough fermented for 0, 24 and 48 h with Lc DSM 5577.
Applsci 16 03697 g002
Figure 3. FTIR spectra of sourdough at 0, 24, and 48 h of fermentation.
Applsci 16 03697 g003
Figure 4. FTIR spectra for pure mannitol and fructose.
Applsci 16 03697 g004
Figure 5. Rheological properties of control muffin batter and the batter with sourdough fermented for 24 and 48 h. CB50—control muffin batter with 50% added sugar; 50BSD30T24—muffin batter with 50% added sugar and 30% sourdough at 24 h of fermentation; 50BSD50T24—muffin batter with 50% added sugar and 50% sourdough at 24 h of fermentation; 0BSD30T24—muffin batter with no added sugar and 30% sourdough at 24 h of fermentation; 0BSD50T24—muffin batter with no added sugar and 50% sourdough at 24 h of fermentation. CB0—control muffin batter with no added sugar; 50BSD30T48—muffin batter with 50% added sugar and 30% sourdough at 48 h of fermentation; 50BSD50T48—muffin batter with 50% added sugar and 50% sourdough at 48 h of fermentation; 0BSD30T48—muffin batter with no added sugar and 30% sourdough at 48 h of fermentation; 0BSD50T48—muffin batter with no added sugar and 50% sourdough at 48 h of fermentation.
Applsci 16 03697 g005
Figure 6. FTIR spectra of muffins.
Applsci 16 03697 g006
Figure 7. PCA sensory attributes (aspect, smell, texture, taste and flavor, and overall acceptability) and samples were evaluated using the hedonic test. 349: 50MSD30T24; 151: 0MSD30T24; 685: CM50; 871: 0MSD50T24; 237: 50MSD50T24; 307: 0MSD50T48; 918: 50MSD30T48; 738: 0MSD30T48; 106: 50MSD50T48; 543: CM0.
Applsci 16 03697 g007
Figure 8. Agglomerative hierarchical clustering (AHC)—cluster distribution of muffin samples. C1: Cluster 1; C2: Cluster 2. 349: 50MSD30T24; 151: 0MSD30T24; 685: CM50; 871: 0MSD50T24; 237: 50MSD50T24; 307: 0MSD50T48; 918: 50MSD30T48; 738: 0MSD30T48; 106: 50MSD50T48; 543: CM0.
Applsci 16 03697 g008
Table 1. Formulations for reduced-sugar muffins (0% and 50%), control samples and muffins with added sourdough (30% and 50%).
U.M.100% Added Sugar50% Added Sugar0% Added Sugar
Ingredients [g]gCM100CM5050MSD3050MSD50CM0 0MSD300MSD50
Wheat Flourg10010085751008575
Sourdoughg--3050-3050
Egg Whiteg122122114109122114109
Egg Yolkg81817469817469
Grapeseed Oilg25252525252525
Sugarg82414141---
Greek-style Yogurtg109109109109109109109
Baking Powderg2.52.52.52.52.52.52.5
Table 2. Explanation of the sample codification used.
Sample CodeCode Explanation
SDT0Sourdough at the beginning of fermentation
SDT24Sourdough fermented for 24 h
SDT48Sourdough fermented for 48 h
CM50Control muffin with 50% added sugar and without sourdough
CM0Control muffin without sourdough and no added sugar
50MSD30T24Muffin with 50% added sugar and 30% sourdough fermented for 24 h
50MSD50T24Muffin with 50% added sugar and 50% sourdough fermented for 24 h
50MSD30T48Muffin with 50% added sugar and 30% sourdough fermented for 48 h
50MSD50T48Muffin with 50% added sugar and 50% sourdough fermented for 48 h
0MSD30T24Muffin with 0% added sugar and 30% sourdough fermented for 24 h
0MSD50T24Muffin with 0% added sugar and 50% sourdough fermented for 24 h
0MSD30T48Muffin with 0% added sugar and 30% sourdough fermented for 48 h
0MSD50T48Muffin with 0% added sugar and 50% sourdough fermented for 48 h
Table 3. pH, TTA, and cell growth values for sourdough at three different times of fermentation.
SamplepHTTA [mL NaOH 0.1 N]Cell Growth [log cfu/g]
SDT05.99 ± 0.04 b1.7 ± 0.02 a5 ± 0.09 a
SDT243.52 ± 0.03 a10.7 ± 0.03 b7.51 ± 0.2 b
SDT483.50 ± 0.03 a15 ± 0.02 c4.82 ± 0.1 a
TTA—total titratable acidity. For codifications, see Table 2. a,b,c—Different lowercase letters indicate significant differences in pH, TTA, and cell growth between fermentation times (0, 24, and 48 h) according to Duncan’s multiple range test. All data presented are mean ± standard deviation (n = 3).
Table 4. The amount of mannitol, carbohydrates (glucose, fructose, and maltose), organic acids (lactic acid and acetic acid), and ethanol in sourdough fermented for 0, 24, and 48 h, expressed in mg/g fresh weight.
SampleMannitol
[mg/g]
Glucose [mg/g]Fructose [mg/g]Maltose [mg/g]Lactic Acid [mg/g]Acetic Acid [mg/g]Ethanol [mg/g]
SDT0n.d.0.46 ± 0.2 a9.93 ± 0.2 c8.48 ± 0.03 an.d.n.d.n.d.
SDT243.51 ± 0.05 a n.d.3.89 ± 0.2 b11.13 ± 0.05 b1.09 ± 0.04 a2.81 ± 0.04 a0.24 ± 0.04 a
SDT486.27 ± 0.03 bn.d.0.5 ± 0.15 a11.11 ± 0.03 b2.25 ± 0.03 b4.61 ± 0.05 b1.26 ± 0.04 b
n.d.—Not detected. For codifications, see Table 2. a,b,c—Different lowercase letters show significant differences between fermentation times of the sourdough (0, 24, and 48 h) according to Duncan’s multiple range test. All data presented are mean ± standard deviation (n = 3).
Table 5. Dimensional parameters, baking losses, and moisture of muffins.
Muffin SampleHeight [cm]Specific Volume [cm3/g]Muffin Weight
[g]
Baking Loss [%]Moisture [%]
CM503.60 ± 0.23 a2.78 ± 0.22 a34.08 ± 0.54 a14.80 ± 0.32 c21.20 ± 0.32 a
CM03.50 ± 0.31 a2.96 ± 0.08 a33.39 ± 0.38 a16.52 ± 0.27 c23.00 ± 0.31 a
50MSD30T243.50 ± 0.31 a2.78 ± 0.32 a36.33 ± 0.43 a9.17 ± 0.45 a20.60 ± 0.31 a
50MSD50T243.45 ± 0.21 a2.67 ± 0.13 a36.41 ± 0.48 a8.98 ± 0.34 a20.65 ± 0.45 a
0MSD30T243.60 ± 0.41 a2.81 ± 0.15 a34.93 ± 0.41 a12.67 ± 0.42 b22.60 ± 0.37 a
0MSD50T243.65 ± 0.24 a2.92 ± 0.06 a35.25 ± 0.39 a11.87 ± 0.53 b23.10 ± 0.42 a
50MSD30T483.46 ± 0.39 a2.68 ± 0.34 a36.37 ± 0.47 a9.07 ± 0.48 a20.80 ± 0.35 a
50MSD50T483.61 ± 0.23 a2.88 ± 0.23 a36.52 ± 0.56 a8.70 ± 0.39 a20.75 ± 0.42 a
0MSD30T483.52 ± 0.26 a2.83 ± 0.31 a35.03 ± 0.49 a12.42 ± 0.32 b22.05 ± 0.21 a
0MSD50T483.60 ± 0.41 a2.85 ± 0.25 a35.74 ± 0.52 a10.65 ± 0.45 ab22.30 ± 0.28 a
a,b,c—Different lowercase letters indicate significant differences between treatments within the same parameter analyzed according to Duncan’s multiple range test. All data presented are mean ± standard deviation (n = 3). For codifications, see Table 2.
Table 6. Mannitol, carbohydrate (maltose, sucrose, glucose, and fructose), organic acid (lactic and acetic acid), and ethanol content in muffins, expressed in mg/g fresh weight.
SampleMaltose
[mg/g]
Sucrose
[mg/g]
Glucose
[mg/g]
Fructose
[mg/g]
Mannitol
[mg/g]
Lactic Acid [mg/g]Acetic Acid [mg/g]Ethanol [mg/g]
CM5035.90 ± 0.02 cd50.34 ± 0.06 a2.09 ± 0.05 b0.6 ±0.3 en.d.n.d.n.d.n.d.
CM030.91 ± 0.07 an.d.2.01 ± 0.2 a0.8 ± 0.09 an.d.n.d.n.d.n.d.
50MSD30T2437.57 ± 0.09 d50.39 ± 0.06 a2.78 ± 0.07 b2.0 ± 0.3 cd3.09 ± 0.07 a2.29 ± 0.2 a0.47 ± 0.09 a0.01 ± 0.01 a
50MSD50T2438.59 ± 0.04 d49.17 ± 0.04 a2.76 ± 0.05 b2.20 ± 0.08 d3.34 ± 0.05 b2.4 ± 0.08 a0.45 ± 0.06 a0.07 ± 0.02 a
0MSD30T2431.17 ± 0.05 bcn.d.2.33 ± 0.03 a1.15 ± 0.05 ab3.06 ± 0.03 a2.18 ± 0.3 b0.87 ± 0.07 a0.11 ± 0.02 a
0MSD50T2433.54 ± 0.04 bn.d.2.77 ± 0.08 c1.50 ± 0.3 bc3.22 ± 0.06 b2.94 ± 0.08 b0.68 ± 0.04 a0.12 ± 0.02 a
50MSD30T4836.65 ± 0.04 d49.42 ± 0.07 a1.91 ± 0.08 a2.18 ± 0.3 d4.09 ± 0.05 a2.94 ± 0.3 a0.64 ± 0.04 a0.01 ± 0.02 a
50MSD50T4838.32 ± 0.06 d49.43 ± 0.06 a1.89 ± 0.3 a2.43 ± 0.04 d4.57 ± 0.05 b2.36 ± 0.2 a0.73 ± 0.2 a0.07 ± 0.04 a
0MSD30T4830.28 ± 0.05 an.d.1.99 ± 0.5 a1.02 ± 0.07 ab4.12 ± 0.07 a2.35 ± 0.08 a0.90 ± 0.02 a0.11 ± 0.05 a
0MSD50T4828.94 ± 0.06 bn.d.1.51 ± 0.06 a1.19 ± 0.08 ab4.53 ± 0.04 a2.98 ± 0.06 b0.57 ± 0.07 a0.12 ± 0.03 a
a,b,c,d,e—Different lowercase letters indicate significant differences between treatments within the same parameter analyzed according to Duncan’s multiple range test. All data presented are mean ± standard deviation (n = 3); n.d.—Not detected. For codifications, see Table 2.
Table 7. Total plate count (TPC) and yeast and mold count of muffins.
SampleTPC [cfu/g]Yeasts & Molds [cfu/g]
Day 1Day 2Day 3Day 1Day 2Day 3
CM500.36 × 1021.63 × 1021 × 104--0.06 × 10²
CM00.90 × 1021.63 × 1020.30 × 104--0.22 × 10²
50MSD30T240.27 × 1020.45 × 1021.10 × 1040.22 × 1020.69 × 1021.09 × 102
50MSD50T240.45 × 1020.54 × 1020.73 × 104--0.16 × 10²
0MSD30T240.36 × 1024.36 × 1022.95 × 104--0.70 × 10²
0MSD50T240.72 × 1021.00 × 1020.27 × 1040.03 × 1020.56 × 1021.53 × 102
50MSD30T480.98 × 1021.45 × 1020.85 × 104--0.09 × 10²
50MSD50T481.00 × 1022.90 × 1020.25 × 104---
0MSD30T480.54 × 1021.00 × 1021.33 × 104--0.09 × 10²
0MSD50T480.72 × 1023.00 × 1020.75 × 104---
For codifications, see Table 2.
Disclaimer/Publisher’s Note: The statements, opinions and data contained in all publications are solely those of the individual author(s) and contributor(s) and not of MDPI and/or the editor(s). MDPI and/or the editor(s) disclaim responsibility for any injury to people or property resulting from any ideas, methods, instructions or products referred to in the content.