Article

Vacuum Microwave Drying as an Efficient Alternative to Hot Air Drying: Optimization, Drying Kinetics, and Quality Retention of Washington Navel Orange Slices


1
Department of Food Engineering, Faculty of Engineering, Institute of Graduate School, Adana Alparslan Türkeş Science and Technology University, 01250 Adana, Türkiye
2
Department of Food Engineering, Adana Alparslan Türkeş Science and Technology University, 01250 Adana, Türkiye
3
Department of Chemistry, Dumlupınar University, 43100 Kütahya, Türkiye
*
Author to whom correspondence should be addressed.
Appl. Sci. 2026, 16(7), 3530; https://doi.org/10.3390/app16073530
Submission received: 1 March 2026 / Revised: 26 March 2026 / Accepted: 31 March 2026 / Published: 3 April 2026
(This article belongs to the Section Food Science and Technology)

Featured Application

The optimized vacuum microwave drying conditions identified in this study can be directly applied to the food industry to produce high-quality dried orange-slice products. This method enables faster drying, improved retention of bioactive compounds, reduced hydroxymethylfurfural (HMF) formation, and enhanced rehydration capacity compared to conventional hot-air drying. This technology is particularly suitable for manufacturing functional dried fruit snacks and value-added citrus-based ingredients with improved nutritional qualities.

Abstract

This study aimed to comparatively optimize and evaluate the quality characteristics of Washington Navel orange slices using vacuum microwave drying (VMD) and conventional hot air drying (HAD) systems. Response Surface Methodology based on the Box–Behnken design was applied to both systems. For the models developed in the VMD system, the coefficient of determination (R2) was found to be in the range of 0.96–0.97, and the optimum conditions were determined as 4 kW power, 60 °C temperature, and 2 mm slice thickness. For HAD, the optimum conditions were determined as 78 °C temperature, 1.57 m/s air velocity, of 2.3 mm slice thickness. VMD showed superior performance compared to hot air drying in terms of total phenolic preservation, retention of bioactive compounds, and rehydration capacity. Hydroxymethylfurfural (HMF) formation was higher during hot-air drying. The effective moisture diffusivity (Deff) was significantly higher in VMD (8.38 × 10⁻¹⁰ m2/s) than in HAD (1.49 × 10⁻¹⁰ m2/s), indicating enhanced internal moisture transport under vacuum microwave conditions. The results revealed that VMD is an efficient technology for producing high-quality dried citrus products with improved bioactive retention and reduced processing time.

1. Introduction

Ensuring sustainable production in the food industry is important [1]. In addition, the production of high-nutrient products and offering consumers high-nutrient products are closely related to the development of food processing technology [2]. The drying method has been used for food preservation since ancient times. The drying process extends the shelf life of food and reduces storage and transportation costs [2,3]. One disadvantage of drying is that high heat can reduce the nutritional value of food (bioactive compounds, antioxidant activity, etc.) [4,5]. In addition to affecting the quality of the final product, the use of high heat negatively impacts energy efficiency. The drying process must also be optimized in terms of energy efficiency. Citrus fruits (Citrus spp.) are one of the most widely produced and consumed groups of fruits worldwide. It contains high levels of phenolic compounds, other bioactive compounds, and nutritional components. Properly drying citrus peels and segments using appropriate techniques is a crucial step in preserving their phenolic content and antioxidant activity [6,7].
Drying methods are highly effective in preserving bioactive compounds in oranges. Different techniques and parameters affect these properties; therefore, the drying technique is crucial for the quality of the final product [6]. The Citrus sinensis L. Osbeck orange variety has high bioactivity and sensory acceptability. It is an important raw material for both fresh and processed products. It contains high levels of vitamin C, flavonoids, carotenoids, and phenolic compounds [8]. Citrus sinensis is a widely cultivated citrus species worldwide. Generally, products obtained from the peel and fruit parts of oranges are dried [9]. Sweet oranges, such as Washington oranges, are highly suitable as dried products because of their aromatic and consumer-friendly profiles. Oranges are particularly susceptible to spoilage immediately after harvest owing to their high moisture content (MC) and water activity (aw). Therefore, effective drying techniques are required. Water removal techniques are critical for ensuring product stability [9,10].
When food is dried, product stability increases because both microbial growth and enzymatic reactions are inhibited due to the removal of free water. Thus, the risk of contamination was reduced. In contrast, high MC and aw values provide favorable conditions for microbial growth and enzymatic activity [11]. But on the other hand, drying treatment plays completely decisive roles in product color, texture, rehydration capacity and bioactive component content. For example, different drying methods and conditions can denature proteins, disrupt the macromolecular structure of a product, and modify some of its functional properties [11,12]. Therefore, a single drying method is not expected to be the best or even good for all products; instead, process design optimization should be adopted according to the product type and target quality criteria.
Because of its simple equipment structure and low investment cost, hot air drying (HAD) is a conventional approach that is widely used in the food industry. However, convection hot-air drying, according to Onwude et al. [13], which follows the principle of transferring hot air from the outside to the inside to remove moisture, can result in long drying times and degradation of heat-sensitive components during processing. During HAD, phenolic compounds and other bioactive ingredients in agricultural products, such as vitamin C, can be drastically decreased as a result of thermal effects. Thus, product quality indicators, such as color and rehydration properties, shift into a negative plane [14]. For instance, when citrus peel was hot-air dried, its ascorbic acid content fell by 36–45% and there were changes in flavonoid content and chromatic properties [14]. As these limitations have become more evident, research attention has increasingly focused on advanced drying technologies, including vacuum drying and microwave-assisted processing, as alternatives to conventional methods, aiming to identify process conditions that offer improved drying efficiency and better preservation of product quality [15].
Vacuum drying is a modern drying technique that reduces the boiling point of water under low pressure, thereby enabling relatively low-temperature drying. The vacuum environment limits the presence of oxygen, which also retards oxidative degradation and preserves heat-sensitive ingredients. Moreover, advanced vacuum drying techniques such as pulsed vacuum drying, which are used in special circumstances, yield better product quality and nutritional value than traditional methods [16,17]. However, recent research has shown that vacuum drying offers important advantages in terms of color stability, phenolic content, and antioxidant activity in both fruits and vegetables. For example, it has been reported that the best conditions for preserving fresh color and polyphenolic compound profiles of orange slices are vacuum and conventional processing methods [10]. Therefore, vacuum drying is considered a promising alternative for producing high-quality dried products [9].
Among advanced drying technologies, vacuum freeze-drying is recognized as one of the most effective methods for preserving heat-sensitive food components due to water removal by sublimation under low temperature and reduced pressure conditions. This technique minimizes thermal degradation and preserves the structural integrity, color, phenolic compounds, carotenoids, and vitamin C more effectively than conventional thermal drying methods [18,19]. In citrus products, freeze drying has been reported to maintain a porous microstructure and improve rehydration characteristics while providing superior retention of bioactive compounds. However, despite these advantages, vacuum freeze-drying is generally associated with prolonged drying time, relatively high energy demand, and elevated operational costs, which may limit large-scale industrial applications [18]. Therefore, vacuum microwave drying (VMD) has attracted increasing attention as an alternative technique capable of providing similar quality advantages, with substantially shorter drying times and improved process efficiency [20].
However, product quality depends not only on the drying technology but also on the appropriate selection of the process parameters. Variables such as drying temperature, pressure, slice thickness, and air velocity directly affect drying kinetics, energy consumption, and final product quality [21,22]. Response Surface Methodology (RSM) is widely used to model such multivariable systems and determine the optimal processing conditions. Multivariate systems use RSM to define the relationships between the process parameters and quality responses that provide the possible conditions for optimum output [22,23]. In addition to RSM, multi-criteria decision-making (MCDM) approaches have been applied to food systems to support complex decision processes involving multiple quality and economic factors [24]. In the past five years, empirical results have shown that optimization and multi-response evaluation methods have become very popular with manufacturers of citrus products using various types of drying techniques [25,26]. Orange and orange peel were observed in later research with a vacuum concentration process (or a circumstance that involves vacuum conditions) resulted at much the same time in better retention of quality as well as far less oxidative damage [21,27]. However, few studies have simultaneously compared VMD and HAD of Washington Navel oranges under identical optimization criteria.
Although previous studies have compared drying techniques for citrus products, simultaneous evaluation of VMD and HAD through independent optimization within a comparable analytical framework, specifically for Washington Navel orange slices, has not been sufficiently explored. Moreover, studies integrating drying kinetics, effective moisture diffusivity, rehydration behavior, color characteristics, and comprehensive compositional quality parameters, including phenolic compounds, carotenoids, organic acids, sugars, antioxidant activity, and hydroxymethylfurfural (HMF) formation within an integrated framework, remain scarce. Therefore, this study proposes an integrated comparative approach in which both VMD and HAD were optimized separately using independent Box–Behnken experimental designs, the optimum conditions were determined through multi-response desirability-based numerical optimization, and the resulting products were subsequently evaluated in terms of nutritional and physicochemical quality attributes. The objective of this study was to reveal the effects of drying parameters on product quality and drying kinetics in the VMD and HAD methods of Washington Navel orange slices, and to determine the optimal drying conditions for both systems using RSM. In this context, drying time, rehydration capacity, and color parameters were considered as key response variables to establish a scientific foundation for producing high-quality dried oranges for industrial applications. Thus, this study aims to fill an important gap in the literature by contributing to the comparative evaluation of both traditional and modern drying technologies, specifically for the Washington Navel Orange variety.

2. Materials and Methods

2.1. Materials

In this study, Washington Navel, belonging to the Citrus sinensis L. Osbeck species, was selected for use in the drying process. Washington Navel oranges were obtained from a commercial production area in the Yüreğir district of Adana province, Türkiye. The fruits were stored in a cold storage facility at +4 °C during both the pre-drying preparation process and throughout the drying process to preserve post-harvest quality parameters. This practice slowed down metabolic activities within the fruit, thereby minimizing quality losses. All reagents were of analytical grade and included methanol, acetonitrile, acetic acid, Folin–Ciocalteu reagent, sodium carbonate (Na2CO3), 2,2-diphenyl-1-picrylhydrazyl (DPPH), gallic acid, Trolox, HMF, and other HPLC standards (listed in Supplementary Table S1), purchased from Sigma-Aldrich (St. Louis, MO, USA) and Merck (Darmstadt, Germany).

2.2. Sample Preparation

The storage, slicing, and drying applications for sliced dried orange production were performed at the R&D Laboratory of the Pamukova Vocational School of Sakarya University of Applied Sciences. This laboratory has an experimental infrastructure that allows for the controlled operation of cold-air conditions, VMD, and traditional HAD systems. Before the drying process, the orange fruits were sliced into pieces of homogeneous thickness and standard structure, enabling a comparative analysis of the effects of drying conditions on the product. An industrial-grade Sirman 14251628 Mirra 250 Plus (Sirman S.p.A, Padova, Italy) electric slicer was used for this purpose. The slice thicknesses were adjusted to 2, 4, and 6 mm, in accordance with the study design.

2.3. Vacuum Microwave Drying System

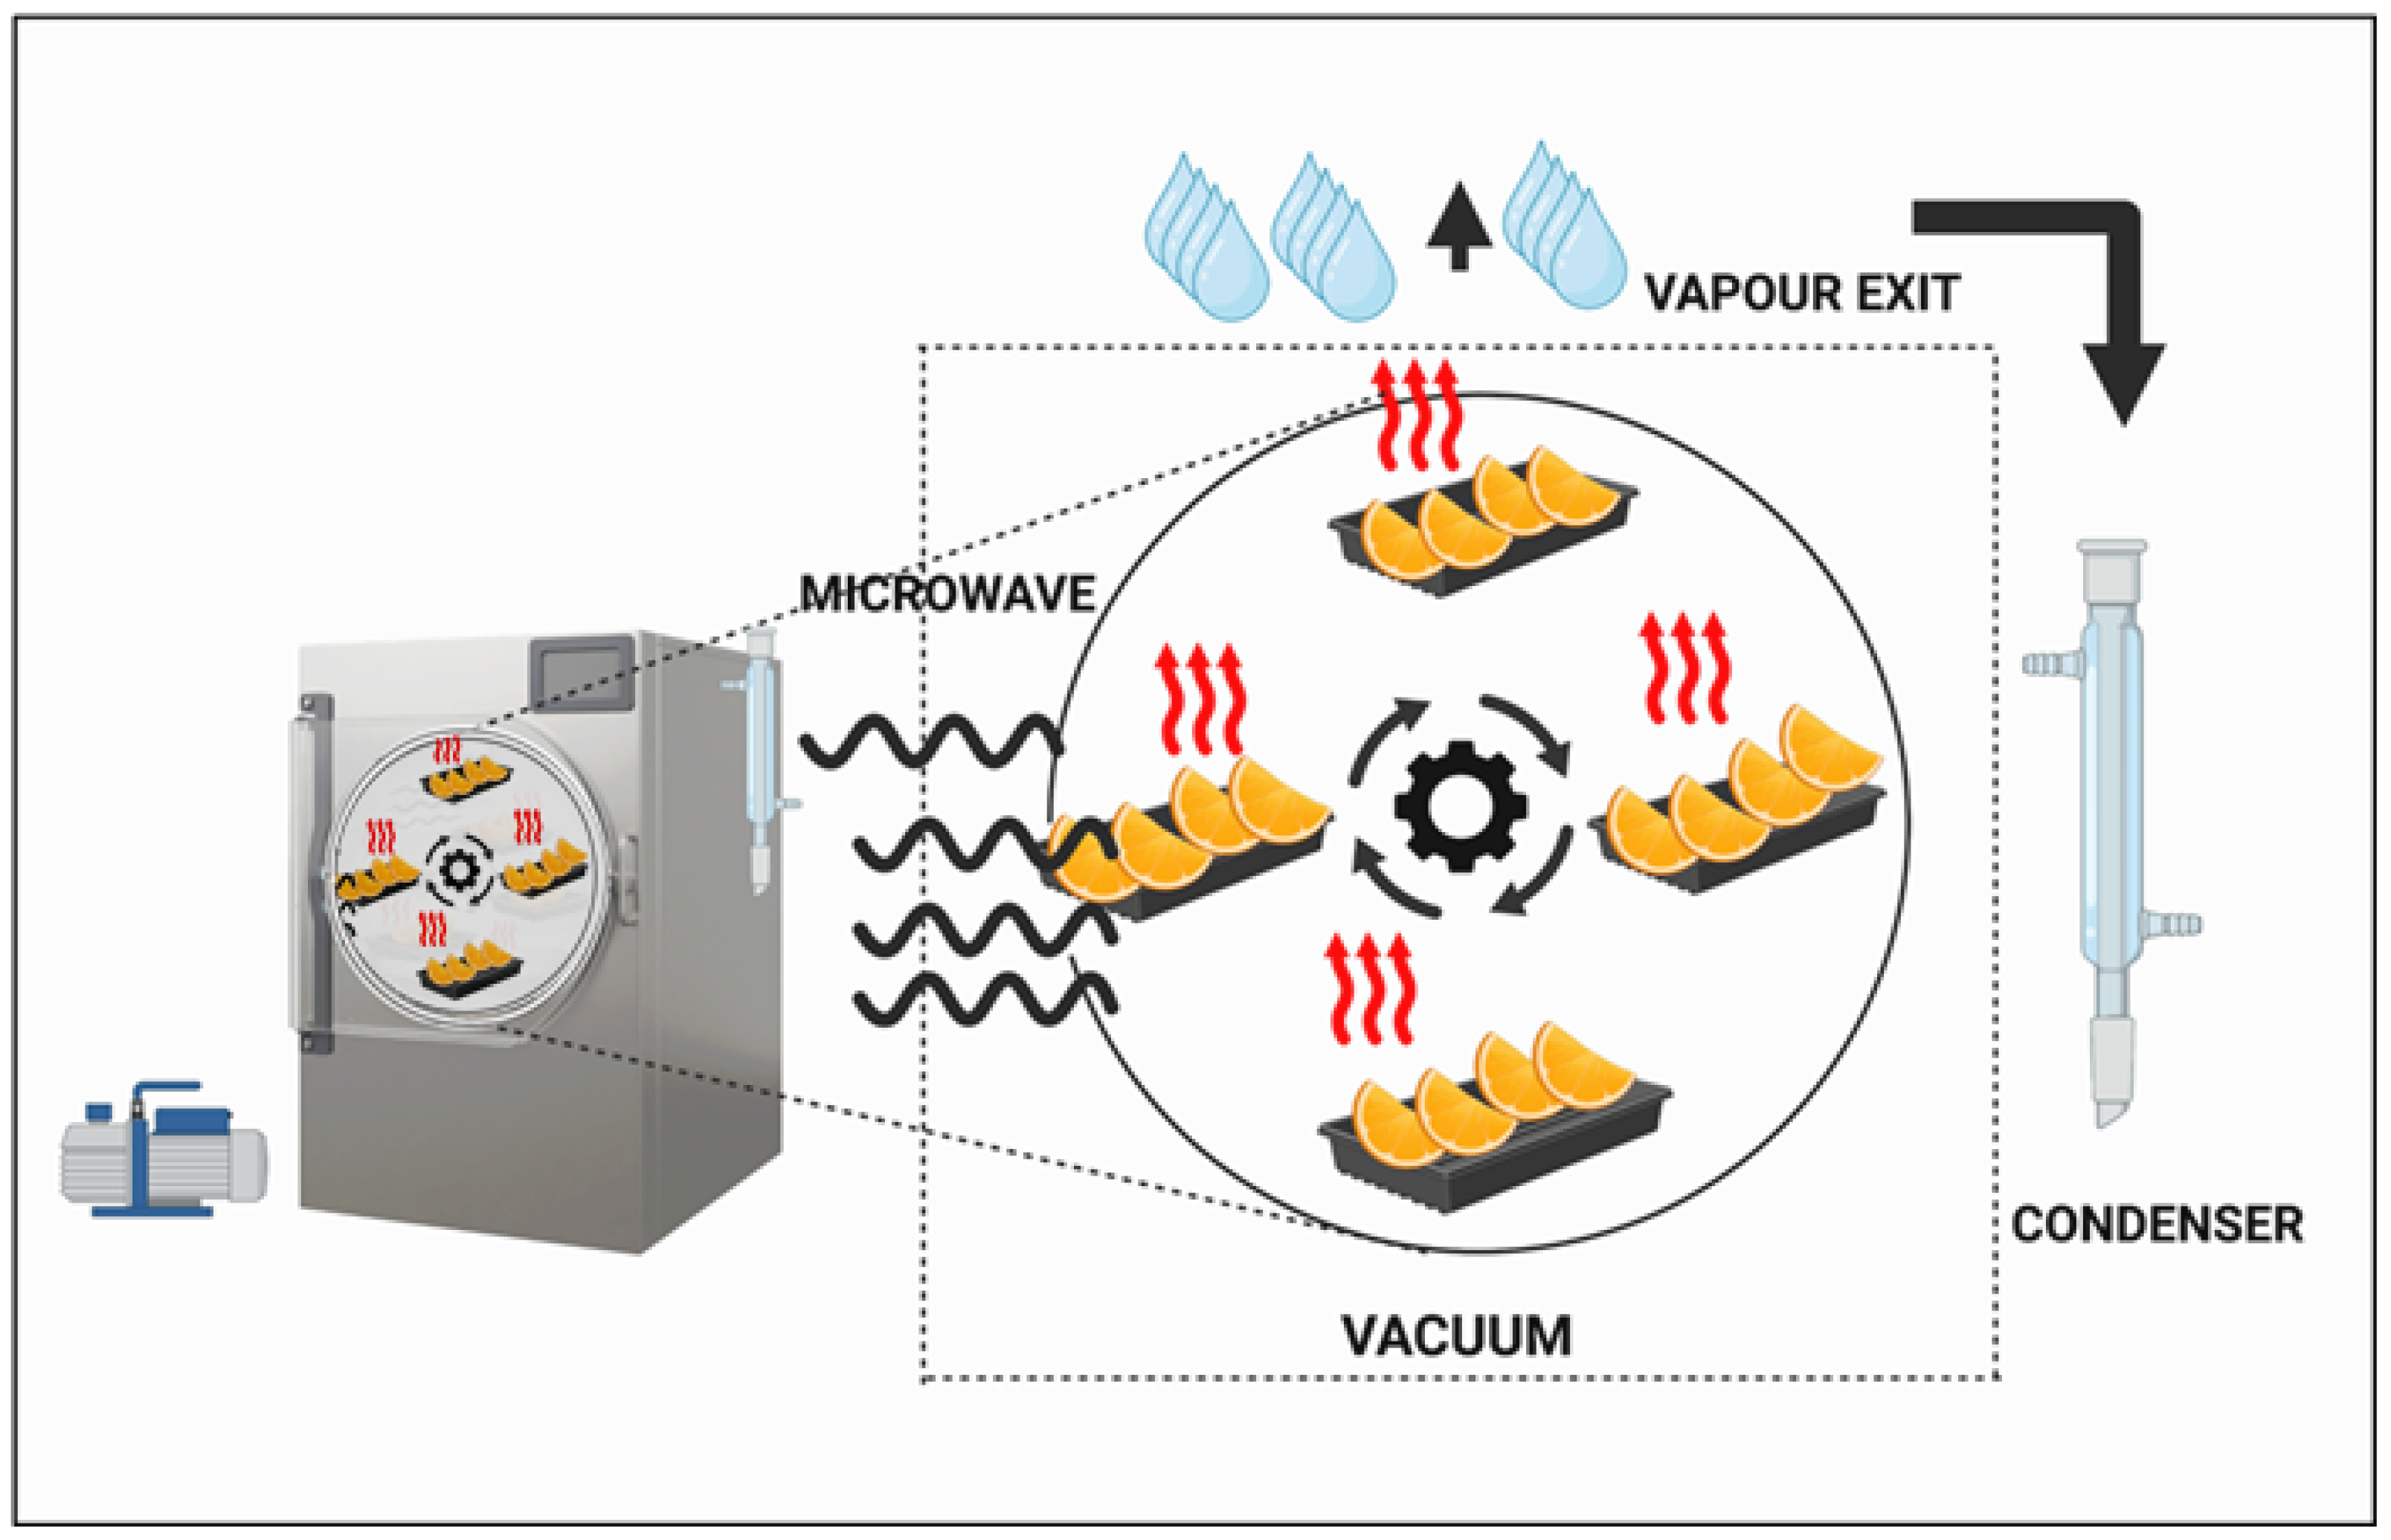
The VMD used in this study was a prototype system developed by Bozkır (2020) [28] shown in Figure 1. The device has adjustable microwave power between 1–4 kW and operates under controlled vacuum pressure conditions, adjusted according to drying temperature, approximately corresponding to 199 mbar at 60 °C, 312 mbar at 70 °C, and 474 mbar at 80 °C. The dryer contained four high-frequency magnetrons, enabling effective drying by providing a homogeneous energy distribution throughout the entire volume of the product. Orange slices were placed in a single layer in five teflon baskets of standard dimensions (25 × 65 × 5 cm) with a perforated structure and placed in a drying chamber. This basket structure was preferred for a more effective contact of microwave energy with the product and easier transfer of water vapor to the external environment. During the drying process, the mass changes in the products were measured at specific time intervals using a precision balance, and the moisture loss dynamics were monitored based on these data. The drying process was terminated when the product reached the target MC (<10%). This ensured that the product had a suitable structure in terms of both microbiological stability and shelf life.

2.4. Hot Air Drying System

To enable a comparative evaluation in this study, a conventional HAD system was used in addition to the VMD system. The drying processes were carried out using a programmable HAD apparatus with a stainless-steel body and four layers, manufactured by Adakurutma Company, Adana, Türkiye. The dryer was equipped with a horizontally directed fan system with an adjustable airflow speed, and the internal ambient temperature could be independently controlled via resistors located in the lower and upper regions. The internal temperature, relative humidity, inlet air temperature, and lower and upper zone temperatures were monitored in real time using a digital control panel. The device has four standard-sized (approximately 30 × 50 cm) drying trays made of a square-perforated plastic material. Sliced orange samples were placed in a single layer on these trays and exposed to convective hot airflow. During the drying process, the product mass was measured at specific intervals to monitor the moisture loss, and drying was terminated when the target final MC (below 10%) was reached.

2.5. Optimization of Drying Conditions Using Response Surface Methodology (RSM)

The prepared orange slices were subjected to two different drying systems: VMD and HAD. RSM was used to determine the production conditions for both drying methods, and experimental designs were generated using Design-Expert® software (Version 13.0, Stat-Ease Inc., Minneapolis, MN, USA). In VMD, the microwave power level (1–4 kW), process temperature (monitored through the integrated control system under the corresponding controlled vacuum pressure conditions during VMD operation), and slice thickness were determined as independent variables. The VMD unit was equipped with an integrated control system that continuously monitored the process temperature, chamber pressure, humidity, and drying time. Target temperatures (60, 70, and 80 °C) were achieved by adjusting microwave power under controlled vacuum conditions, and therefore represent monitored process temperatures rather than independently imposed external thermal settings. In the HAD system, the air temperature, air velocity (1.0–2.0 m/s), and slice thickness were defined as the process variables. In both systems, the drying rate (DR, kg H2O/kg dry matter·h), color parameter (b*), and rehydration capacity (g/g) were considered as response variables. Seventeen experimental runs were conducted for each drying method according to the RSM design matrix. The optimal process conditions were determined based on experimental data and predictive mathematical modeling. During drying, the sample mass was recorded at predetermined time intervals to calculate moisture loss kinetics.

2.6. Drying Kinetics and Mathematical Modeling

The data obtained from the orange samples using the HAD and VMD methods were applied to commonly used drying models to model the drying curves [13]. During the drying process, product weights were measured at 5 min intervals (t), and the MC of the orange slices was calculated using the following equation:
M t = W W s W s           ( kg   H 2 O / kg   dry   matter )
In this equation, the total weight w (kg) is represented by the dry matter weight Ws (kg).
The moisture ratio (MR) of the samples was calculated based on the dry matter using the following equation [29]:
M R = M t M e M 0 M e           ( kg   H 2 O / kg   dry   matter )
In the equation;
Mt: Moisture content of the product at time t on a dry basis (kg H2O/kg dry matter)
M0: Initial moisture content (on a dry matter basis),
Me: equilibrium moisture content (on a dry matter basis).
The DR of the samples was calculated using Equation (3):
D R = ( M t + d t M t ) d t  
Here:
DR: kg H2O/kg dry matter·h,
Mt and Mt+dt: moisture content of the product at times t and t + dt (kg H2O/kg dry matter)
T: Drying time (min).
The experimental drying data for orange slices were compared with ten different thin-layer drying models commonly used in the literature for agricultural products (Table S2). For this purpose, a nonlinear regression analysis was used to model the MR and time-dependent changes. Nonlinear regression analyses were performed using the IBM SPSS Statistics 27.0.1 software (IBM Corp., Armonk, NY, USA).
Statistical evaluation criteria, such as the coefficient of determination (R2), standard error of the mean (SEM), reduced chi-square (χ2), and root mean square error (RMSE), were used to determine the extent to which each drying model fit the experimental data [30]. As a result of the analysis, the model with the highest R2 value and the lowest χ2 and RMSE values was accepted as the model that best reflected the drying behavior of orange slices. The model that provided the best fit was determined based on the lowest RMSE and SEM values and highest R2 value. The diffusion coefficient, Ln (MR), of the samples was calculated by plotting it against the drying time. Effective moisture diffusivity (Deff) was calculated using the following equation:
M R = 8 π 2 0 1 2 n + 1 exp 2 n + 1 2 4   π 2 D e f f t x 1 2
When the equation is simplified;
l n   M R = l n 8 π 2 ( π 2 D e f f t 4 x 1 2   )  
Here:
Deff: m2/s,
x1: Represents the half-thickness (m), for example.
Linear regression analysis was used to determine the slopes of the graphs. Using SPSS software (IBM SPSS Statistics, Windows Version 27.0), the slope of the graph (K) was determined by determining whether there was a linear relationship between the experimental data and the theoretical model.
K = π 2 D e f f 4 x 1 2
Among the numerous thin-layer drying equations available in the literature, ten widely used empirical and semi-empirical models were selected after preliminary screening because these models are the most frequently applied to describe fruit drying behavior [31,32].

2.7. Physicochemical Analyses

After drying, the orange slices were ground into a powder using IKA A 10 basic (IKA-Werke GmbH & Co. KG, Staufen, Germany) prior to analysis. The moisture content was determined according to AOAC Method 934.06, and titratable acidity was determined according to AOAC Method 942.15 [33]. Measurements were conducted in triplicate, and the results are expressed as mean ± standard deviation. Total soluble solids (°Brix) were determined using a refractometer. pH values were measured at 20 ± 1 °C using a calibrated digital pH meter. Titratable acidity was determined by titration with 0.1 N NaOH to pH 8.1 and expressed as % citric acid. MC was determined by drying to constant weight at 105 °C, and total dry matter was calculated accordingly. aw was measured at 20 ± 1 °C and expressed as dimensionless values.

2.7.1. Color Analyses (CIELAB)

Color measurements were performed using a Konica Minolta CM-5 spectrophotometer in the Commission Internationale de l’Éclairage Lab* Color System (CIELAB). The device was calibrated using a black plate under a D65 light source and a 10° viewing angle. The instrument was calibrated using both white and black standard calibration plates prior to the measurement. The sample was placed in the measurement chamber, at least three measurements were taken from each sample, and the average L*, a*, and b* values were calculated. The chroma (C*) and hue angle (h°) were derived from these values, and the total color change (ΔE) was calculated according to the relevant equation relative to the fresh sample. All measurements were performed in triplicates.

2.7.2. Rehydration Capacity Analysis

Rehydration capacity analysis was performed to evaluate the water retention capacity of orange slices after the drying process. The analysis was modified according to the sample structure based on the method reported by Cui et al. (2008) [34]. Ten grams of each dried orange sample were weighed into containers, and 200 mL of pure water was added. The samples were maintained at 25 ± 1 °C in a dark environment for 24 h. At the end of this period, the samples were filtered to remove free water from the surface, and their rehydration weights (Wr) were determined using a precision balance. All measurements were performed in triplicates. The rehydration capacity was calculated using the following equation, considering the initial dry weight (Wd) and rehydration weight (Wr) of the dried product:
R e h y d r a t i o n   c a p a c i t y = W r W d  
Wr: Product weight after rehydration (g)
Wd: Initial dry weight of the dried product (g)

2.7.3. Total Phenolic Content (TPC)

Total phenolic content was determined using the Folin–Ciocalteu colorimetric method with minor modifications [35]. Dried samples (1.00 g) were extracted with 80% methanol, centrifuged, and filtered. Dried sample extract (0.5 mL) was mixed with 2.5 mL of 10% diluted Folin–Ciocalteu reagent and 2.0 mL of 7.5% Na2CO3 solution. The mixture was incubated for 30 min at room temperature in the dark, and the absorbance was measured at 760 nm using a UV–Vis spectrophotometer. Quantification was performed using a gallic acid calibration curve, and the results were expressed as mg gallic acid equivalent (GAE) per gram of dry matter. All analyses were conducted in triplicates.

2.7.4. Total Carotenoid Content

The total carotenoid content was determined spectrophotometrically according to a modified literature method [36]. Samples (2 g) were extracted with 10 mL of a hexane/acetone/methanol mixture (2:1:1, v/v/v) containing 0.1% butylated hydroxytoluene (BHT) to prevent oxidation. After centrifugation, the supernatant was collected, and absorbance was measured at 450 nm using a UV–Vis spectrophotometer. The total carotenoid content was calculated using β-carotene as a reference standard and expressed as mg/100 g dry matter. All measurements were performed in triplicates.

2.7.5. Antioxidant Activity (DPPH Assay)

Antioxidant activity was evaluated using a 2,2-Diphenyl-1-picrylhydrazyl (DPPH) radical scavenging assay [37]. Dried samples (1.00 g) were extracted with 80% methanol, centrifuged, and the supernatant was used for analysis. Antioxidant activity was determined using a 0.1 mM DPPH radical scavenging assay. Briefly, 0.1 mL extract was mixed with 3.9 mL of 0.1 a DPPH methanolic solution and incubated in the dark for 30 min at room temperature. The absorbance was measured at 515 nm. The radical scavenging activity was calculated as a percentage of inhibition. Quantitative results are expressed as mg Trolox equivalent (TE) per gram of dry matter using an external calibration curve. All analyses were performed in triplicate.

2.7.6. Phenolic Compound Profile by HPLC-PDA

Phenolic compounds in fresh and dried orange samples were analyzed using a high-performance liquid chromatography-photodiode array detector (HPLC-PDA) system (Prominence-i LC-2030C 3D Plus, Shimadzu, Kyoto, Japan) controlled using LabSolutions software (Shimadzu, Kyoto, Japan) according to a modified literature method [38]. Finely ground samples (0.50 g) were extracted with methanol (1:10, w/v) at 4 °C for 24 h and filtered through 0.45 µm membrane filters. Phenolic compounds were separated on an Inertsil ODS-3 (C18) column (5 µm, 250 × 4.6 mm, UP) using a gradient mobile phase consisting of 3% acetic acid in water (solvent A) and an acetic acid–acetonitrile–water mixture (3:25:72, v/v/v) (solvent B). The column temperature was maintained at 25 °C and the flow rate was adjusted according to the gradient program between 1.0 and 1.2 mL/min. The injection volume was 20 µL, and detection was performed at 280, 320, and 360 nm. Identification and quantification were performed by external calibration with 24 commercial phenolic standards (listed in Supplementary Table S1). The results were expressed as mg/100 g dry matter. All measurements were performed in triplicates.

2.7.7. Carotenoid Analysis by HPLC-PDA

Carotenoids were determined by HPLC-PDA, using a modified method [39]. Samples (2 g) were extracted with methanol:n-hexane containing 0.1% butylated hydroxytoluene (BHT) to prevent oxidation. After centrifugation and solvent evaporation under reduced pressure, the residues were redissolved in acetonitrile and filtered prior to analysis. Separation was achieved on an Inertsil ODS-3 (C18) column (5 µm, 250 × 4.6 mm, UP) maintained at 25 °C using a gradient mobile phase consisting of acetonitrile (A), methanol (B), and ethyl acetate (C). Detection was performed at 450 nm with an injection volume of 20 µL and flow rate of 0.7 mL/min. The carotenoids identified and quantified were α-cryptoxanthin, apo-carotenal, lutein, β-carotene, β-cryptoxanthin, α-carotene, and zeaxanthin, using external calibration with commercial standards. Absorbance was measured at 450 nm and the total carotenoid content was calculated using the corresponding extinction coefficient. The results were expressed as mg/100 g dry matter. All measurements were performed in triplicates.

2.7.8. Organic Acid Analysis by HPLC-PDA

Organic acids were analyzed using HPLC-PDA under isocratic conditions [40]. Ground samples (0.50 g) were extracted with ultrapure water, filtered (0.45 µm), and injected into the HPLC system. Chromatographic separation was performed on a Coregel ORH 801 column (300 × 6.5 mm, ICE-ORH-801) using 0.01 N H2SO4 as the mobile phase at a flow rate of 0.4 mL/min under isocratic elution at 45 °C. Detection was carried out at 210 nm, while ascorbic acid was additionally confirmed at 244 nm, and the injection volume was 20 µL. The organic acids identified and quantified in the samples were ascorbic acid, malic acid, tartaric acid, citric acid, and succinic acid based on external standards. The results were expressed as mg/100 g dry matter. All measurements were performed in triplicate.

2.7.9. Sugar Analysis by HPLC-RID

Sugars (glucose, fructose, sucrose, and sorbitol) were determined using HPLC with a refractive index detector (RID) [41]. Samples (1.00 g) were extracted with ultrapure water, centrifuged, and filtered (0.2 µm Chromatographic separation was performed on a Concise Separation CarboSep CHO-87 column under isocratic conditions using ultrapure water as mobile phase at a flow rate of 0.6 mL/min and a column temperature of 84 °C. The injection volume was 20 µL and the total run time was 30 min; quantification was based on external standard calibration, and results were expressed as mg/100 g dry matter. All measurements were performed in triplicate.

2.7.10. Determination of Hydroxymethylfurfural (HMF)

The hydroxymethylfurfural (HMF) content was quantified by HPLC-PDA following a modified literature method [42]. Ground samples (0.50 g) were extracted using ultrapure water, filtered, and subjected to chromatographic analysis on a Capcell Pack C18 MGII column using methanol:water (10:90, v/v) as the mobile phase under isocratic elution at 40 °C. The flow rate was set at 1 mL/min, the injection volume was 20 µL, and detection was performed using a photodiode array detector over a total run time of 30 min. HMF was quantified using HPLC-PDA at 285 nm, and quantification was performed using calibration curves prepared from HMF standards. The results were expressed as mg/100 g dry matter. All measurements were performed in triplicate.

2.8. Specific Energy Consumption and Power Density Calculation for Drying Systems

In the Specific Energy Consumption (SEC) calculations, the nominal energy input for VMD was based on the applied microwave power, whereas for HAD, the total nominal dryer power included both heating elements and fan operation, following previously reported approaches for VMD and HAD systems (Çelen, 2019; Mesery, 2022) [43,44]. The raw data used for the nominal SEC calculations are provided in the Supplementary Material (Table S3). SEC was calculated using the following equation:
S E C = P × t m e v
where SEC is the specific energy consumption (kWh/kg removed water), P is the nominal power input (kW), t is drying time (h), and mev is the mass of evaporated water (kg). Power density (W/g) was calculated as the ratio of applied microwave power to the initial sample mass used in each drying experiment.

2.9. Scanning Electron Microscopy (SEM) Analysis

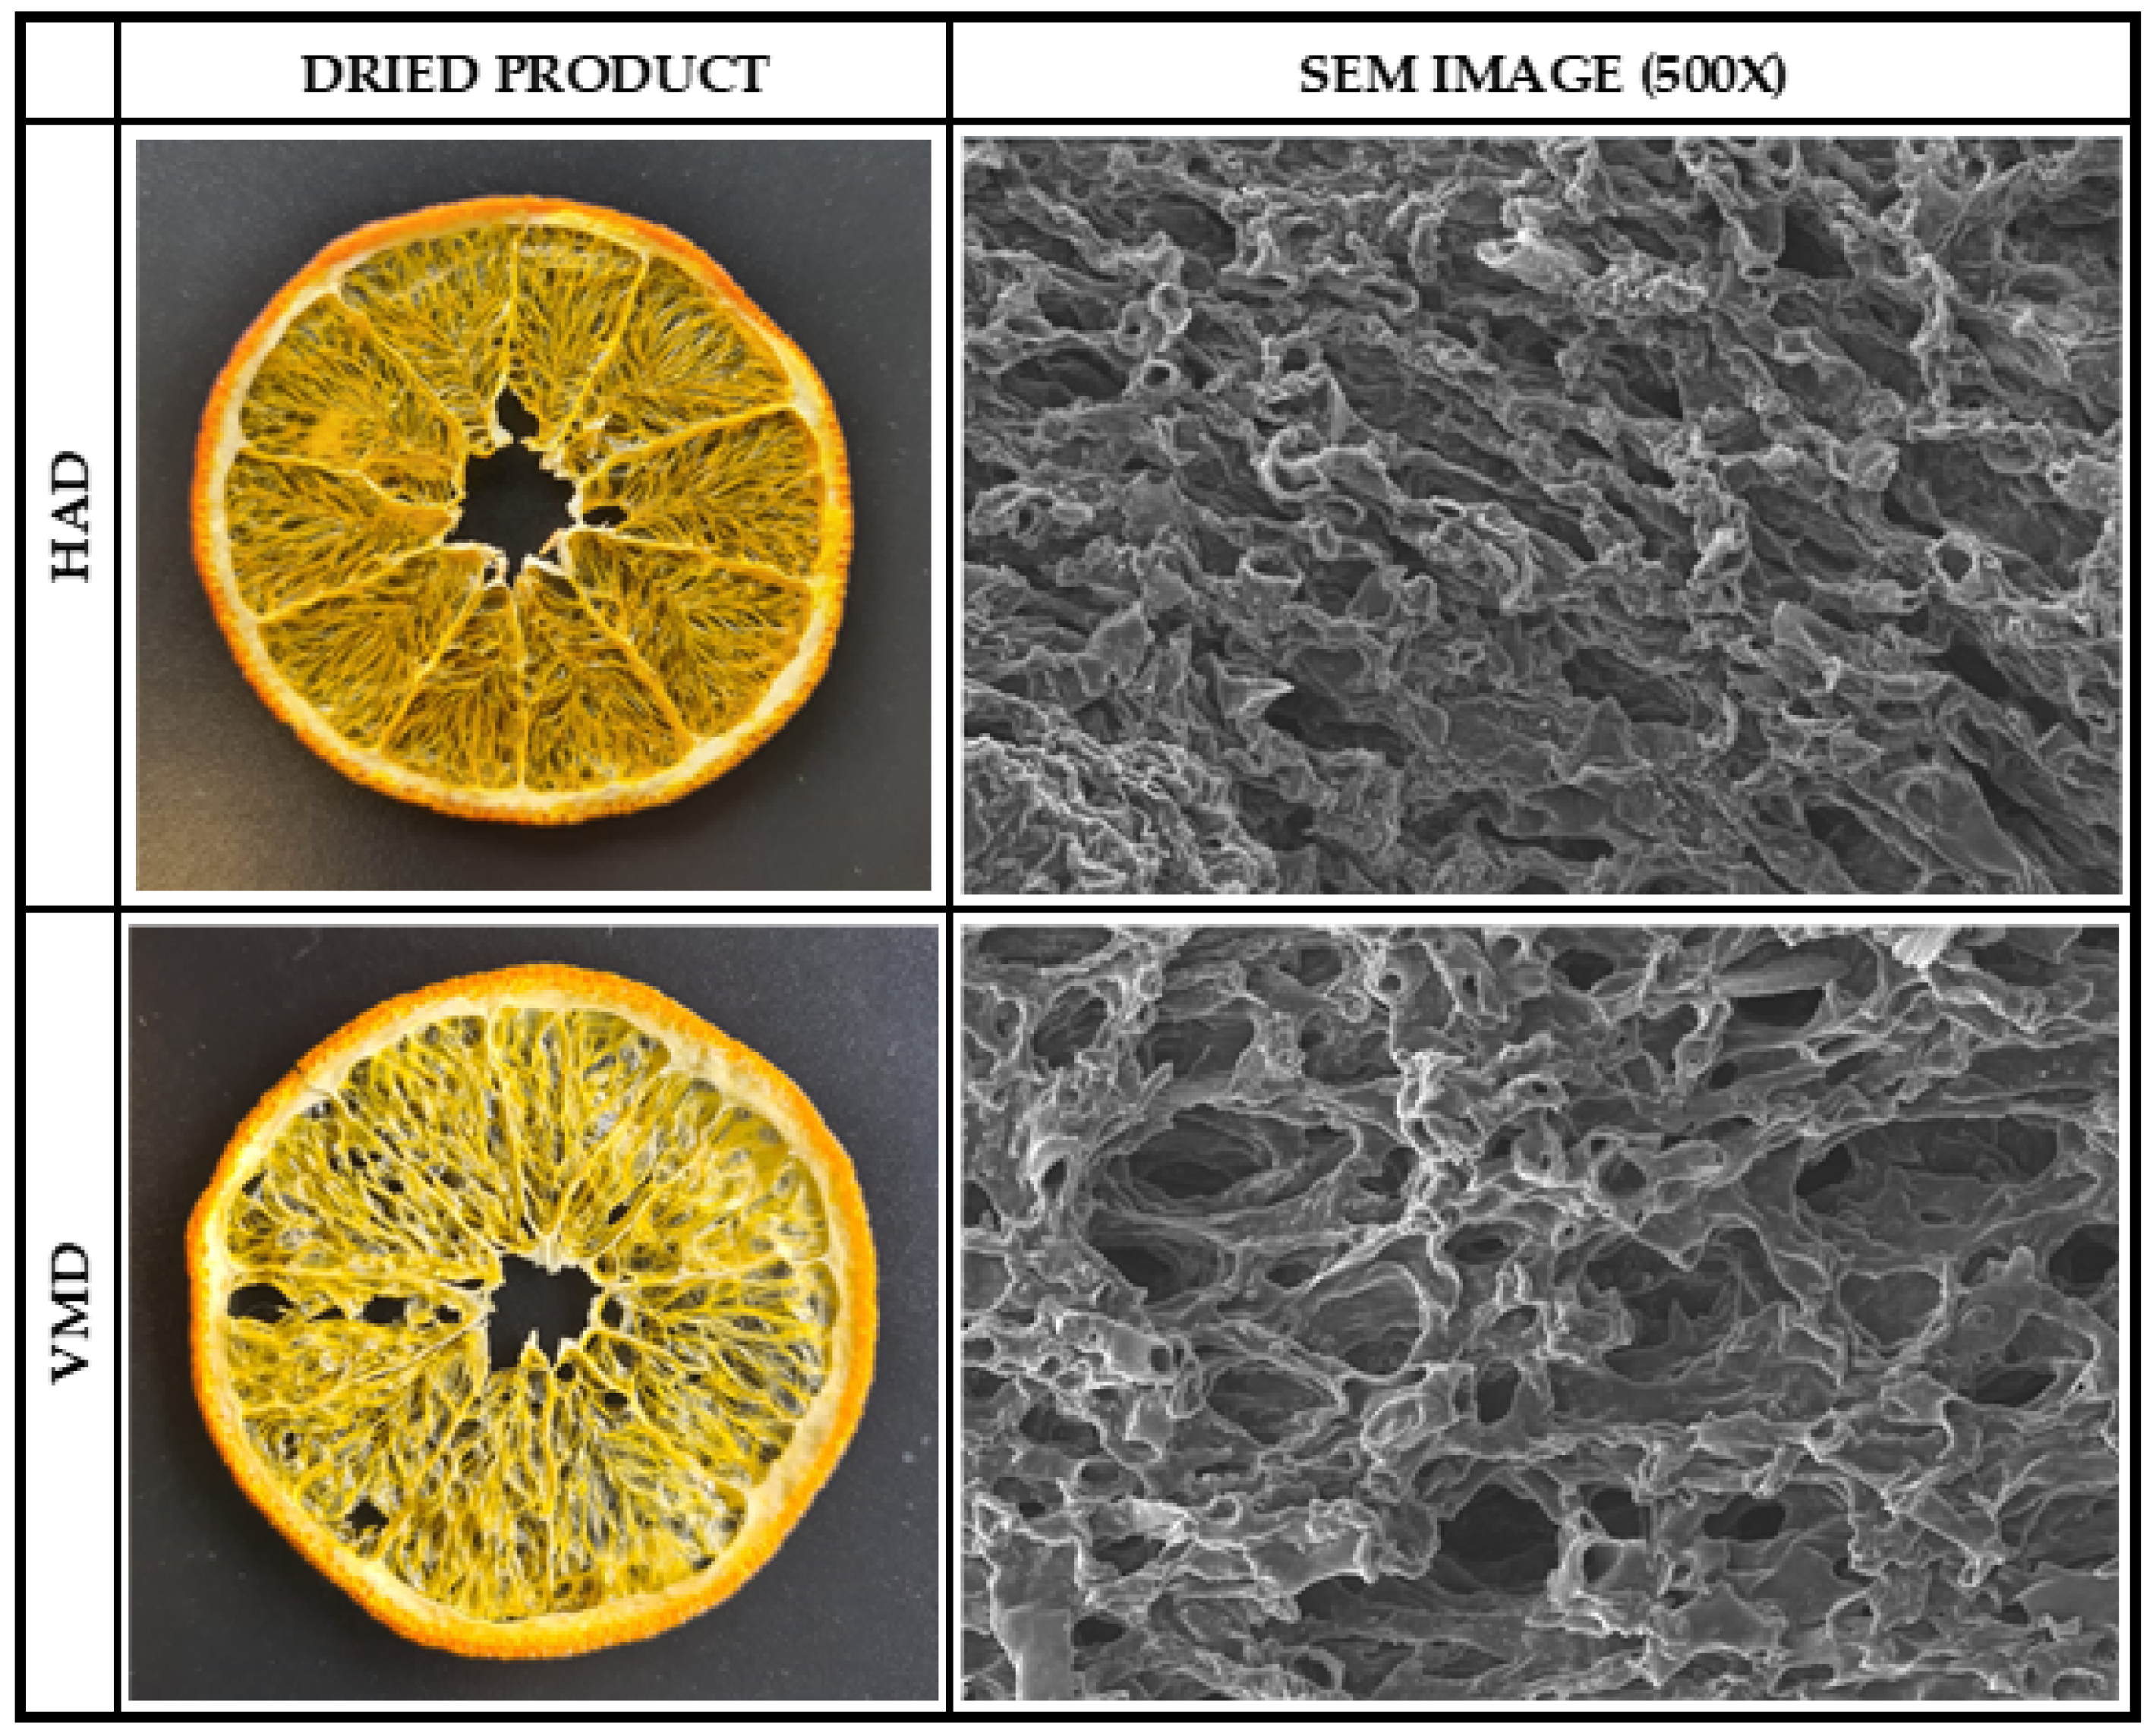
Microstructural observations of orange slices dried under optimized HAD and VMD conditions were performed using scanning electron microscopy (SEM) (Quanta 650 Field Emission SEM, Thermo Fisher Scientific, Hillsboro, OR, USA). Dried samples were mounted on aluminum stubs using double-sided conductive tape, coated with a thin gold layer prior to imaging, and examined at an accelerating voltage of 10 kV at 500× magnification, following the procedures commonly applied for dried fruit microstructure analysis [20,45].

2.10. Data Analysis

Analysis of Variance (ANOVA) results with model adequacy parameters (R2 and adjusted R2), residual analysis, and RSM plots were used to assess YYM model performance. A significance level of p < 0.05 was adopted.

3. Results & Discussion

3.1. Optimization of Drying Parameters in VMD and HAD Systems for Washington Navel Orange Slices Using the Response Surface Methodology (RSM)

The effects of three fundamental process parameters (microwave power, temperature, and slice thickness) on the drying performance during the processing of Washington Navel orange slices in a VMD system were investigated. The experimental study was conducted under 17 conditions planned based on the RSM approach and within the framework of the Box–Behnken design. Three critical quality parameters were evaluated as response variables: DR (kg H2O/kg dry matter·h), rehydration capacity (g/g), and b* color value. The experimental conditions and their corresponding responses are listed in Table 1.
Based on the obtained data, a multivariate statistical analysis and optimization study based on RSM were performed to determine the optimal drying conditions. As part of the optimization study, second-order (quadratic) polynomial models obtained from the regression analysis performed on the response variables were created using coded independent variables, and the relevant mathematical expressions are given in Equations (8)–(10). These models quantitatively define the relationship between the process parameters related to the drying process and the response variables (DR, rehydration capacity, and b* color value), and are used as statistically meaningful prediction tools.
DR = +4.83 + 1.12A + 0.7502B − 2.97C + 0.0891AB − 1.41AC + 0.1969BC + 1.13A2 − 0.2191B2 + 1.44C
Rehydration Capacity = +4.10 − 0.0050A − 0.0492B − 0.3973C − 0.0505AB + 0.1302AC − 0.0915BC + 0.1010A2 − 0.0372B2 + 0.2256C2
b* value = +41.20 − 0.5050A − 1.50B + 2.12C − 1.82AB + 2.27AC + 4.70BC
Independent Variables; A = Power (kW), B = Temperature (°C), C = Slice Thickness (mm).
The validity of the second-order models developed for each response variable was evaluated using ANOVA, and the significance of the models is shown in Table S4. The R2 values obtained for DR, rehydration capacity, and b* color parameter were 0.9601, 0.9737, and 0.8249, respectively, indicating that the models explain the data to a high degree. Furthermore, the significance of the models was statistically supported by the low p-values (0.0004, 0.0001, and 0.0025, respectively). The coefficients of variation (%CV) were 13.51%, 1.88%, and 4.72%, respectively, which were within acceptable limits. The F-values (18.70, 28.80, and 7.85) and the corresponding p-values prove that the established models are statistically significant and reliable for all three response variables. In addition, residual diagnostic plots further supported the adequacy of the fitted models, indicating the approximate normality and random distribution of residuals for the representative drying rate responses in both drying systems (Figures S1 and S2).
It is generally accepted in the literature that Adequate Precision must be above four for a regression model to be reliably used in future predictions [46,47]. It was observed that this value was quite high for each of the models developed in this study: Adequate Precision was calculated as 17.5177, 18.4004, and 10.9351 for the models for DR, rehydration capacity, and b* color parameter responses, respectively. These high values indicate that the models are statistically reliable and have a high signal-to-noise ratio. The p-value of the lack-of-fit test for the model developed for DR was 0.774, proving that the model did not show a significant difference with the residuals; therefore, the model was highly consistent with the experimental data. Furthermore, the regression graphs (Figures S3–S5), which show the relationship between the predicted values and experimental data, clearly demonstrate that the model is capable of making predictions with high accuracy.
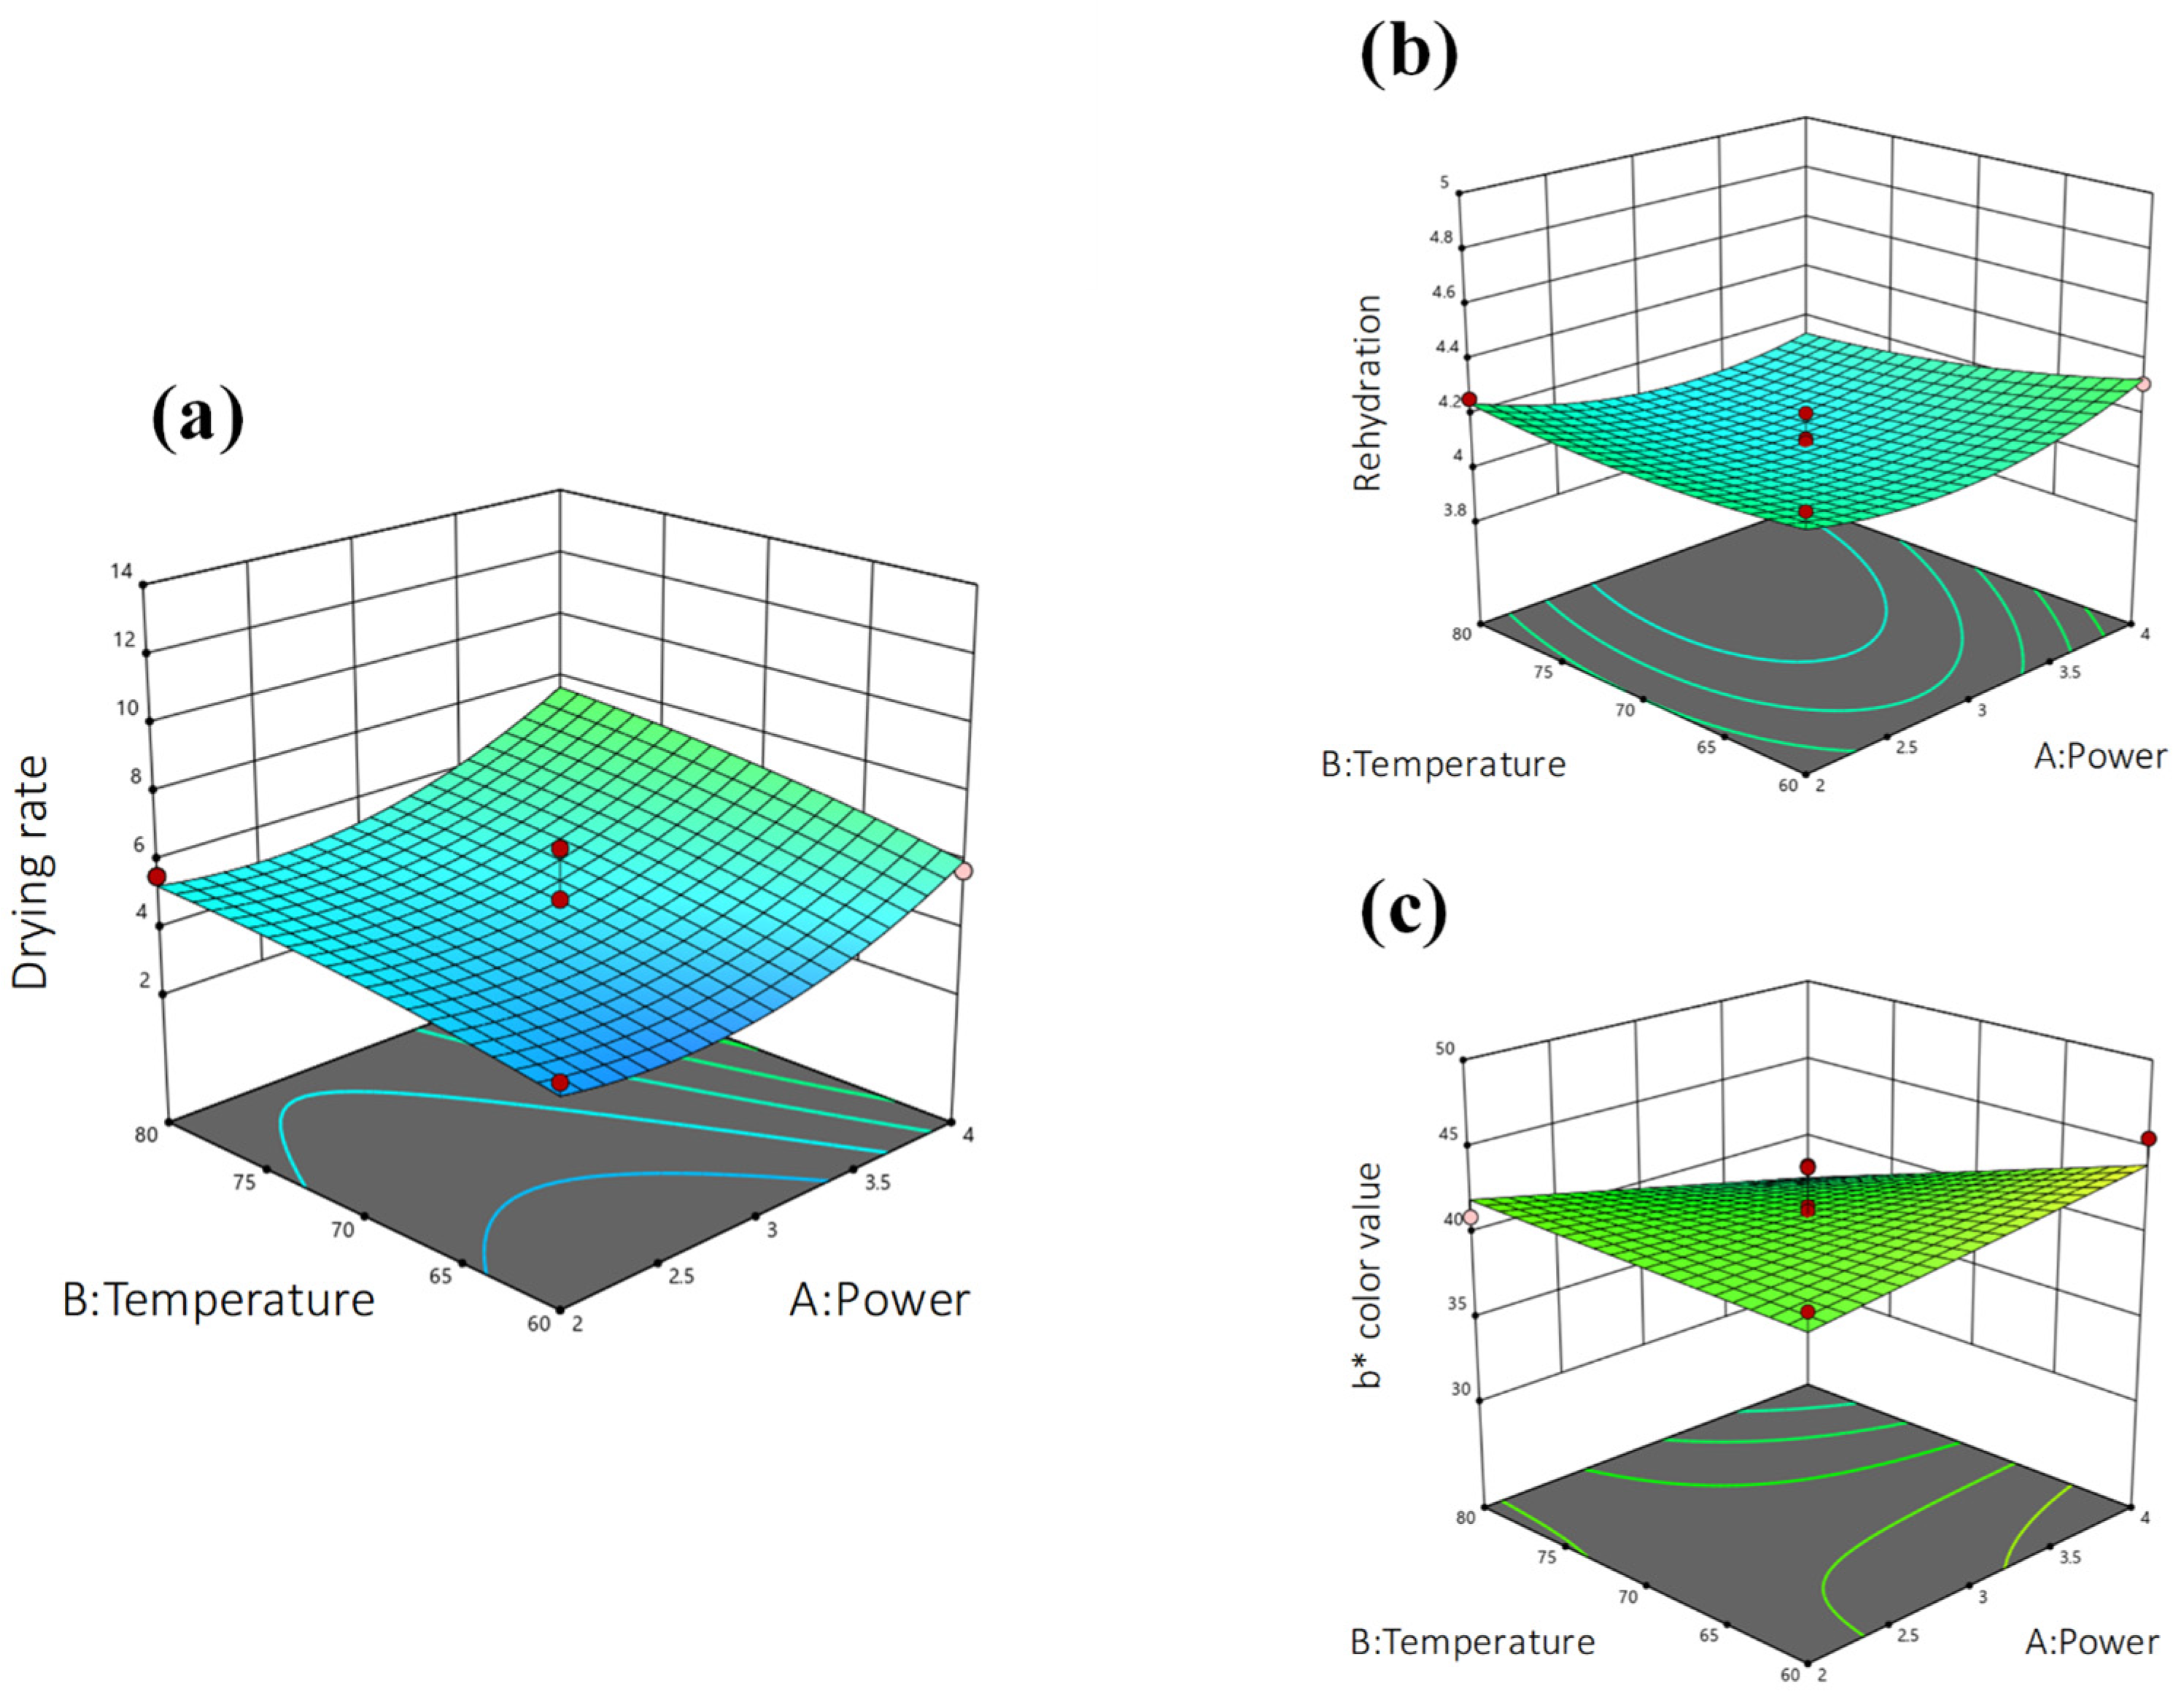
The three-dimensional response surface graph presented in Figure 2 quantitatively shows the effects of microwave power (A) and drying temperature (B) on the DR (Figure 2a). The color scale represents different drying speed levels; light blue and turquoise colors indicate low drying speed values (~2.2 m/s), green tones indicate medium values, and shades ranging from yellow to red indicate high drying speed levels (~13.4 m/s). Both the increase in microwave power and temperature had a positive effect on DR; it was observed that DR increased significantly with an increase in both parameters. The statistical analysis revealed a high R2 value (0.9601). Although the coefficient of variation for the drying rate was relatively higher than that for the other responses (CV = 13.51%), the model remained statistically reliable considering its significant model p-value, non-significant lack-of-fit, and Adeq Precision value, indicating an adequate signal-to-noise ratio (Table S4). The coefficient of variation obtained for the drying rate (13.51%) indicated moderate variability, which was consistent with the biological heterogeneity of orange tissue and the dynamic nature of moisture transfer under VMD conditions. The drying rate is directly influenced by transient internal moisture gradients, local vapor pressure generation, and volumetric microwave energy absorption, all of which may vary slightly between slices, even when the thickness is standardized. In citrus-based biological materials, moderate CV values have also been reported for physical quality attributes, such as fruit weight, where values around 16% were interpreted as normal biological variation [48,49]. Therefore, the observed variability in the drying rate reflects the expected process sensitivity rather than inadequate model performance. The high coefficient of determination and non-significant lack-of-fit further demonstrate that this variability remained within a predictable range and was successfully represented by the response surface model.
As can be seen from Figure 2b, both microwave power and temperature parameters affect rehydration capacity; however, it has been observed that this effect is not linear and points to a certain optimum region. Specifically, at moderate temperature (approximately 70 °C) and microwave power (approximately 3.0–3.5 kW), the rehydration capacity reaches its maximum value. This indicates that excessively high temperatures and power levels can reduce the water retention capacity owing to structural damage to the product. Therefore, careful optimization of these parameters is critical for maintaining the product quality. Statistical analysis revealed an R2 of 0.9737, indicating that the model explained 97.37% of the variation in the rehydration capacity (Table S4). Furthermore, the relatively low CV of 1.88% supported the reliability and consistency of the model.
The three-dimensional response surface and contour curves visually demonstrate the effect of microwave power (A) and temperature (B) on the b* color value (Figure 2c). The color scale reflects the magnitude of the b* value, which represents the yellow color intensity of the product. Examining the graph, it can be seen that the transition from blue tones to green and yellow indicates an increase in the b* value, meaning the product acquires a more yellow tone. Although the model exhibited a lower R2 value (0.8249) than the other response variables and a relatively higher CV value (4.72%) (Table S1), it remained statistically significant (p = 0.0025) and demonstrated acceptable predictive ability. However, it can be stated that the model is statistically significant (p = 0.0025) and has a sufficient level of predictive ability. The results suggest that color change is determined by more complex mechanisms and that factors other than processing parameters may also be influential. The trends observed on the model surface show that the b* value generally increases with increasing microwave power and temperature, and this increase becomes more pronounced, especially within a specific power-temperature interaction range. This suggests that color development may be associated with multiple thermal mechanisms, including pigment degradation, sugar-related non-enzymatic browning, limited Maillard-type reactions, and thermal sugar degradation under elevated drying intensity, as reported for citrus-based products, where ascorbic acid degradation and sugar-derived reactions have also been associated with browning development under acidic conditions with relatively low amino compound availability [50].
The goals of the optimization process based on the developed models were to increase the drying speed, improve the rehydration capacity, and maximize the b* color value. As a result of the applied desirability function, 59 alternative runs were generated by the software, and the details of these runs are presented in Table S5. The highest desirability value was preferred, and the process parameters at this point were determined as microwave power of 4.0 kW, temperature of 60 °C, and slice thickness of 2.0 mm. These results show that the optimum drying conditions were successfully defined in terms of both product quality and process efficiency. Three independent validation experiments were conducted under selected conditions to verify the accuracy of the determined optimum process parameters. The experimental response values obtained from these trials were compared with the theoretical values predicted by the response surface model, and the results are listed in Table 2.
According to the data presented in Table 2, the average experimental results obtained from three repeated validation trials conducted under the optimum drying conditions were compared with the theoretical values predicted by the response surface model. In the evaluation of the three main response variables (DR, rehydration capacity, and b* color value), no statistically significant difference was found between the experimental and predicted data. This evaluation was performed using a one-sample t-test for each response variable, and detailed data on the test results are provided in Table S6a–c. The close agreement between the predicted and experimental values confirmed the adequacy of the quadratic model for describing the process behavior under optimized VMD conditions. A similar optimum microwave-assisted drying behavior has been reported for citrus-based materials and related fruit matrices, where moderate thermal levels combined with high microwave intensity improved the moisture removal efficiency while preserving the structural quality. In VMD of fruit tissues, rapid internal vapor generation under reduced pressure has been reported to promote porous structure development, shorten drying time, and improve moisture transport efficiency compared with conventional thermal drying systems [20]. Likewise, vacuum drying studies on orange slices demonstrated that intermediate thermal conditions significantly affected the rehydration capacity, color preservation, and phenolic retention, with drying temperature acting as a critical determinant of structural quality [51]. Similar findings were reported for kumquat slices, where microwave- and vacuum-assisted drying at moderate temperature levels provided improved rehydration behavior and better color preservation compared with more severe thermal conditions [52]. However, in the present study, the optimum temperature remained at 60 °C despite the application of maximum microwave power, indicating that vacuum-assisted moisture removal reduced the need for higher thermal input by facilitating internal vapor generation and moisture diffusion under reduced pressure conditions.

3.2. Optimization of Drying Parameters for Washington Navel Orange Slices in a Hot Air Dryer Using the Response Surface Methodology (RSM)

The drying parameters of Washington Navel orange slices in a HAD dryer were determined using the Box–Behnken test design. The independent variables in this study were air velocity, drying temperature, and slice thickness. The experiments were carried out using RSM along with the traditional HAD process. Seventeen runs were conducted to obtain optimal parameters (Table 3). DR, rehydration capacity, and b* values were determined. All the response variables were statistically significant in the quadratic model (p < 0.0001). The R2 value of the drying model indicated that 99.22% of the variance was explained by all the factors. The results of the ANOVA test displayed a high f-test value (98.57); thus, it was concluded that there was a reasonably accurate fit to the model (Table S7). The surface plots of the DR and the b* color change of the orange slices are shown below. These findings indicate that heat and mass transfer occurred concurrently during HAD. The heat and mass transfer phenomena occurred simultaneously during HAD. The drying period and heat efficiency depend on the presence of key elements or process variables. The model generated for the rehydration capacity presented an excellent adjustment (R2 = 0.9844; CV% = 0.66).
Within the scope of the optimization study, the mathematical expressions of the second-degree (quadratic) polynomial models obtained as a result of the regression analysis performed for three basic response variables (DR, rehydration capacity, and b* color value) are given in Equations (11)–(13). These models quantitatively define the relationships between the process parameters applied in the HAD system and the response variables and are used as a statistical tool to predict the effects of these parameters on the process.
DR = +1.23 + 0.0015A + 0.2711B − 0.7681C − 0.1079AB + 0.1577AC + 0.0459*BC − 0.1216*A2 + 0.0021*B2 + 0.4529*C2
Rehydration Capacity = +4.49 + 0.0760A + 0.0147B − 0.2250C + 0.2112AB − 0.0513AC − 0.0230BC − 0.1514A2 − 0.1014B2 + 0.0048*C2
b* value = +39.99 + 0.6413A + 1.55B + 2.82C − 0.0516AB − 0.4505AC − 0.7708BC − 1.04A2 − 1.77B2 − 1.27C2
A = Air Speed (m/s), B = Temperature (°C), C = Slice Thickness (mm)
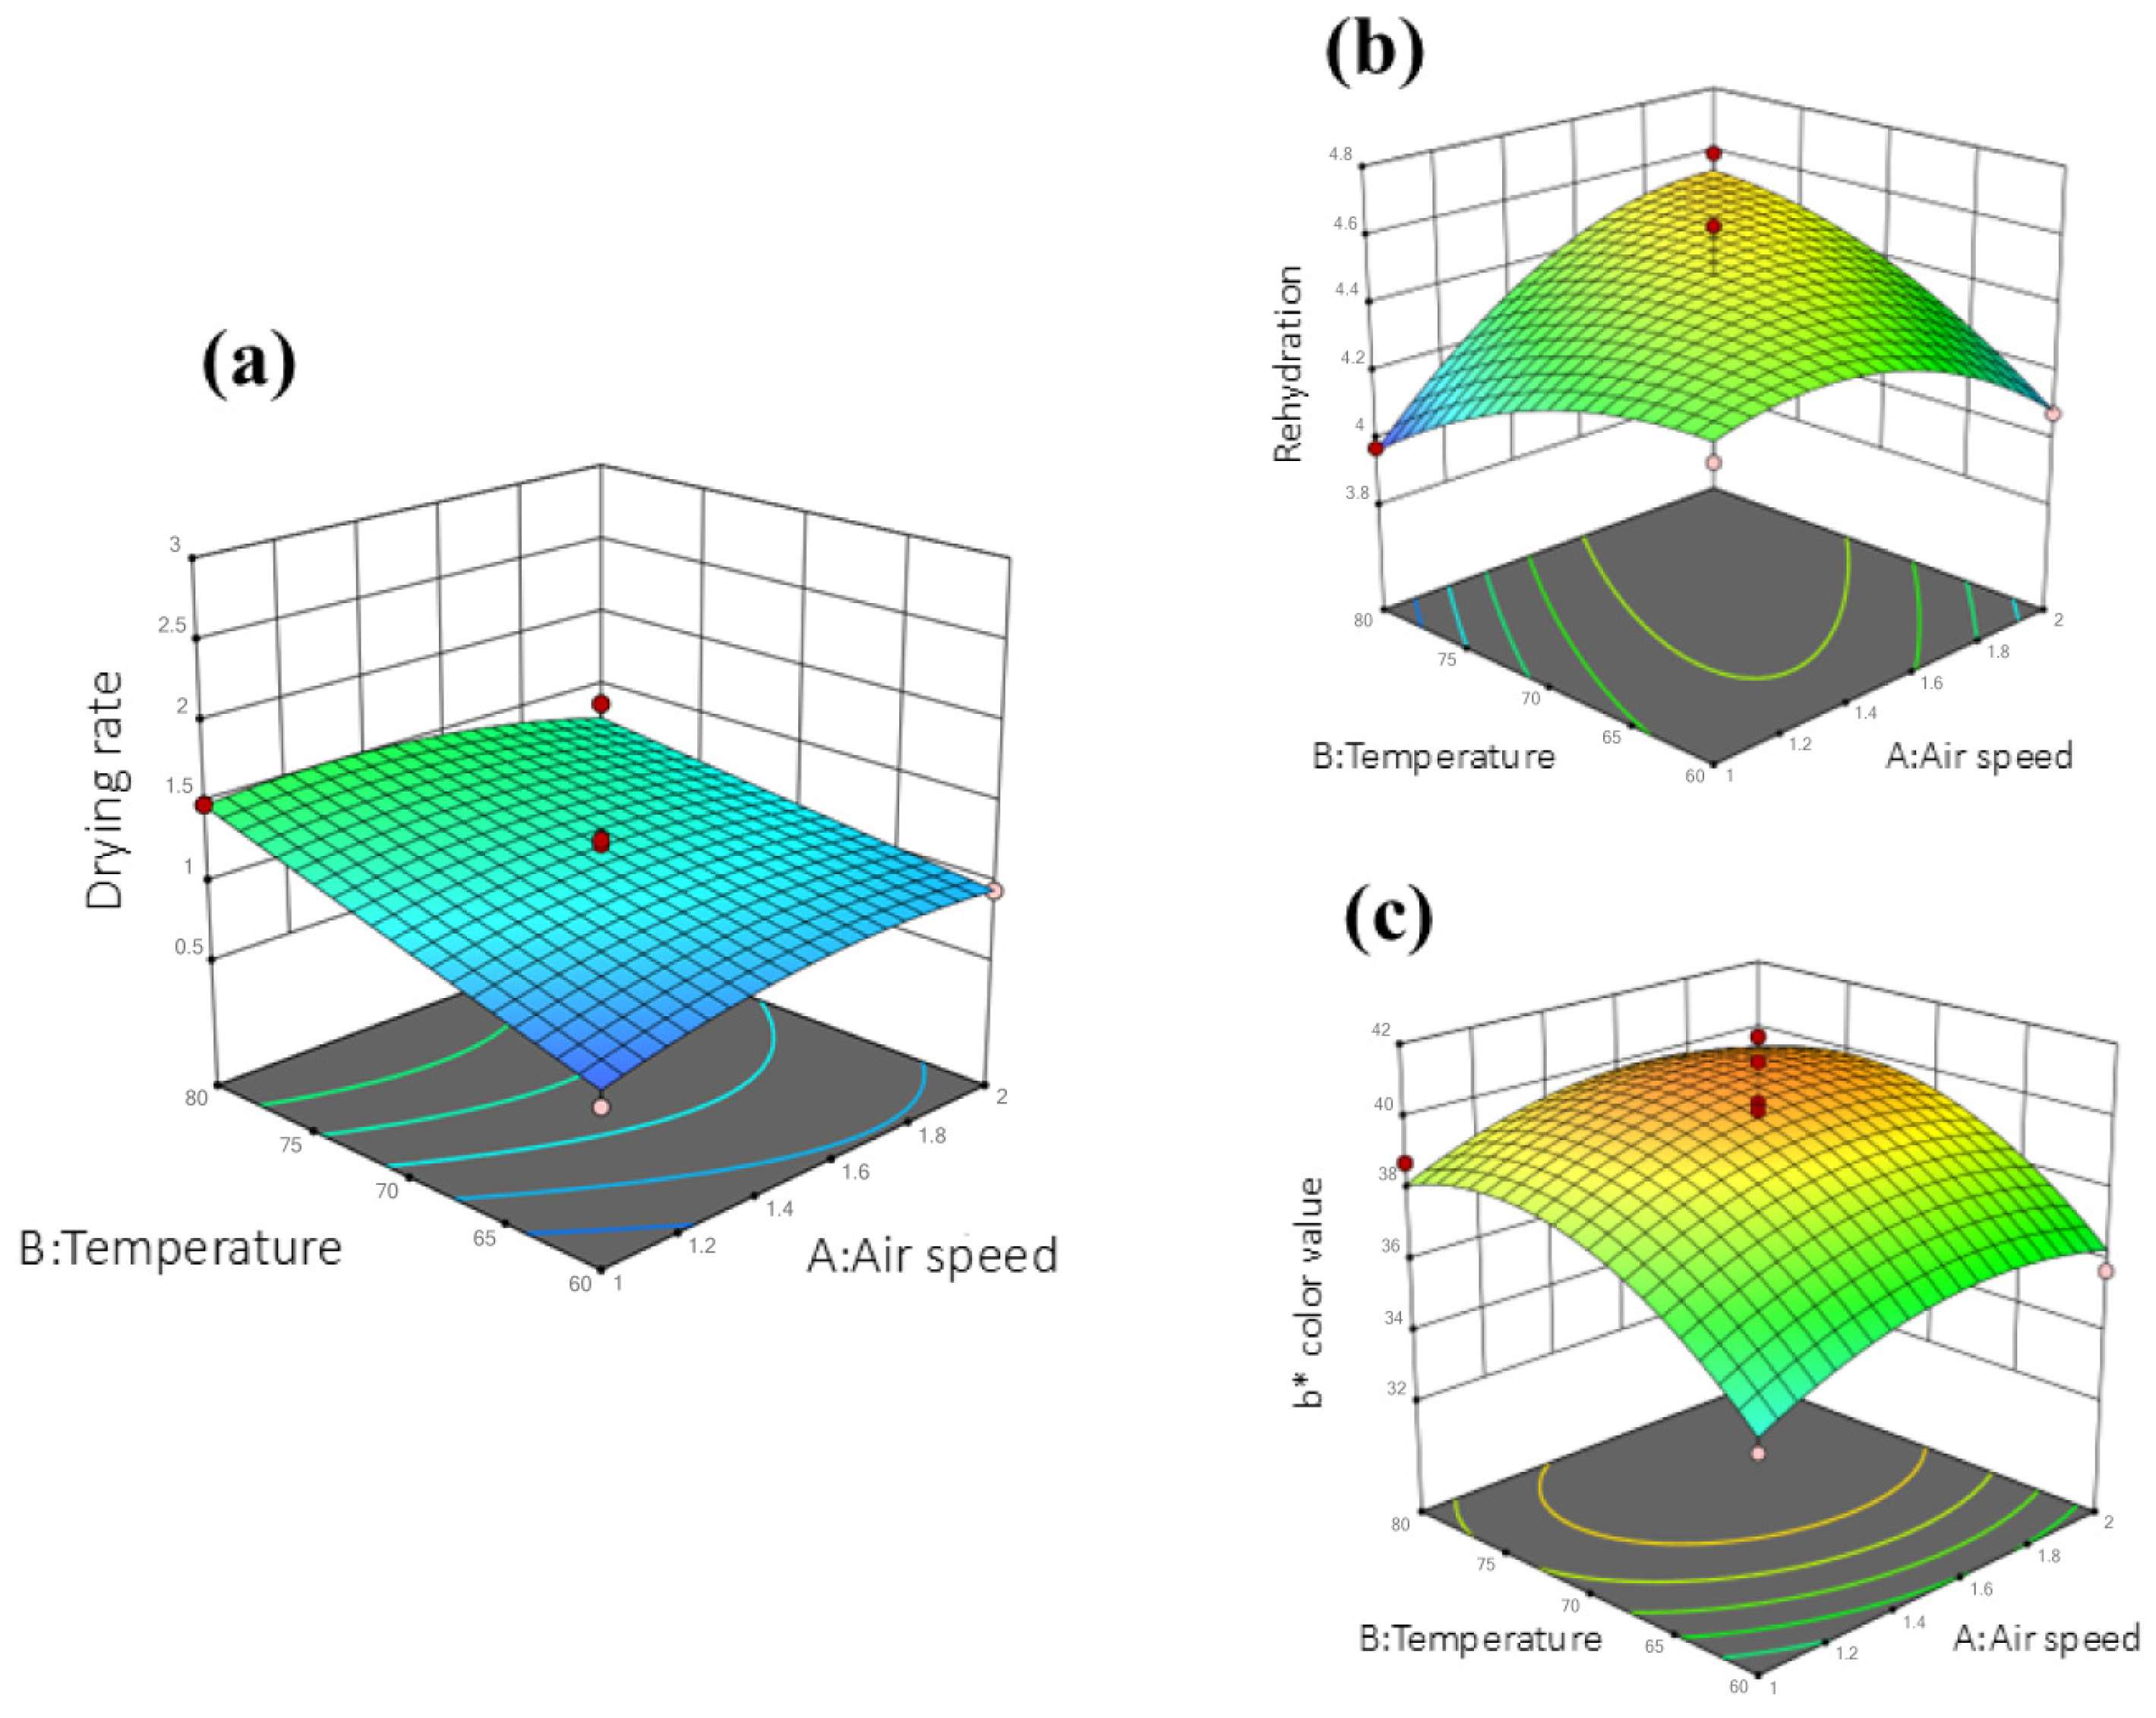
The model exhibited strong explanatory power, as shown in Figure 3. Examining the surface form (a) in the graph, it is observed that DR increases significantly with increasing temperature and air velocity parameters. It is particularly noteworthy that the DR reaches its maximum level in combinations of high temperature (80 °C) and high air velocity (2.0 m/s). This reflects the synergistic effect of thermal energy and mass transfer processes in the HAD system. Furthermore, the smooth and continuous structure of the surface indicates that the model is consistent with the experimental data and has high predictive accuracy. In the plot (b), surface and contour plots of the rehydration show that the maximum rehydration capacity of approximately 4.69 g/g is in the medium-high temperature (70–75 °C) and air velocity range (1.5–2.0 m/s). Enhanced process conditions also cause deterioration of the cellular organization, resulting in a lower rehydration capacity of the dried fruit. Therefore, the optimization of the process parameters is necessary to obtain the highest rehydration capacity.
The b* value is affected by air velocity and drying temperature. A comparison of the b* color values predicted by the RSM model with the experimental data revealed that the model has high accuracy, as the predicted and observed values showed a distribution close to the 45° reference line. The b* values varied approximately between 30.0 and 42.0, and according to the three-dimensional response surface analysis, the lowest and highest values were modeled as 32.85 and 41.51, respectively. It was determined that increasing temperature and air velocity increased the b* value, thus increasing the yellow tone intensity. The highest b* values were obtained under conditions of 80 °C temperature and 2.0 m/s air velocity. These findings demonstrate that drying parameters are decisive in color development, and that optimum processing conditions can be reliably identified using RSM. Furthermore, the regression graphs (Figures S6–S8), which show the relationship between the predicted values and experimental data, clearly demonstrate that the model is capable of making predictions with high accuracy.
The experimental data and calculated fittings were well matched using the model. Surface response analysis indicated that the b* colors over 80 °C and 2.0 m/s were most optimal. The color balance parameters need to be optimized further. The objective of this experiment is to optimize DR, increase rehydration volume, and raise the level of b* color index using a multi-response optimization approach. The desired drying parameters (temperature of 78 °C, wind speed of 1.57 m/s and slice thickness of 2.3 mm were determined based on a desired function as the optimal condition (Table S8). The optimum slice thickness value of 2.3 mm represents a predicted point generated by the numerical optimization of the fitted quadratic response surface model within the experimental range and does not necessarily correspond to one of the experimental design levels. After applying these optimal conditions in triplicate, the predictions based on the RSM model were compared with these results. The experimental and predicted data were almost identical, as shown in Table 4. These results indicate that a conventional HAD can be upscaled based on optimization principles.
There was no statistically significant difference between the experimental and predicted data for the three primary response variables (DR, rehydration capacity, and b* color value). For each response variable, a one-sample t-test was used; specific test findings are provided in Table S9a–c. The close agreement between the predicted and experimental values confirms the adequacy of the quadratic model for describing the process behavior under optimized HAD conditions. Compared to previous drying studies on citrus slices, the optimum air temperature identified here (78 °C) was within the upper range commonly applied for convective citrus drying. Compared with previous citrus drying studies, in which convective air temperatures around 60 °C were applied under combined microwave–air conditions, the optimum air temperature identified here (78 °C) reflects the greater thermal demand of pure convective drying in the absence of microwave-assisted internal heating [53]. Similar findings were reported for kumquat slices, where hot-air drying at 70–80 °C improved drying efficiency, although higher temperatures increased quality losses related to structural changes and color modification [52]. Therefore, the slightly higher optimum temperature obtained in the present study may be associated with the higher internal moisture resistance of intact orange tissue, which requires a greater thermal driving force to achieve efficient internal moisture migration while maintaining acceptable rehydration behavior and color quality.

3.3. Some Quality Characteristics of Washington Navel Orange Slices Dried Using VMD and HAD Systems

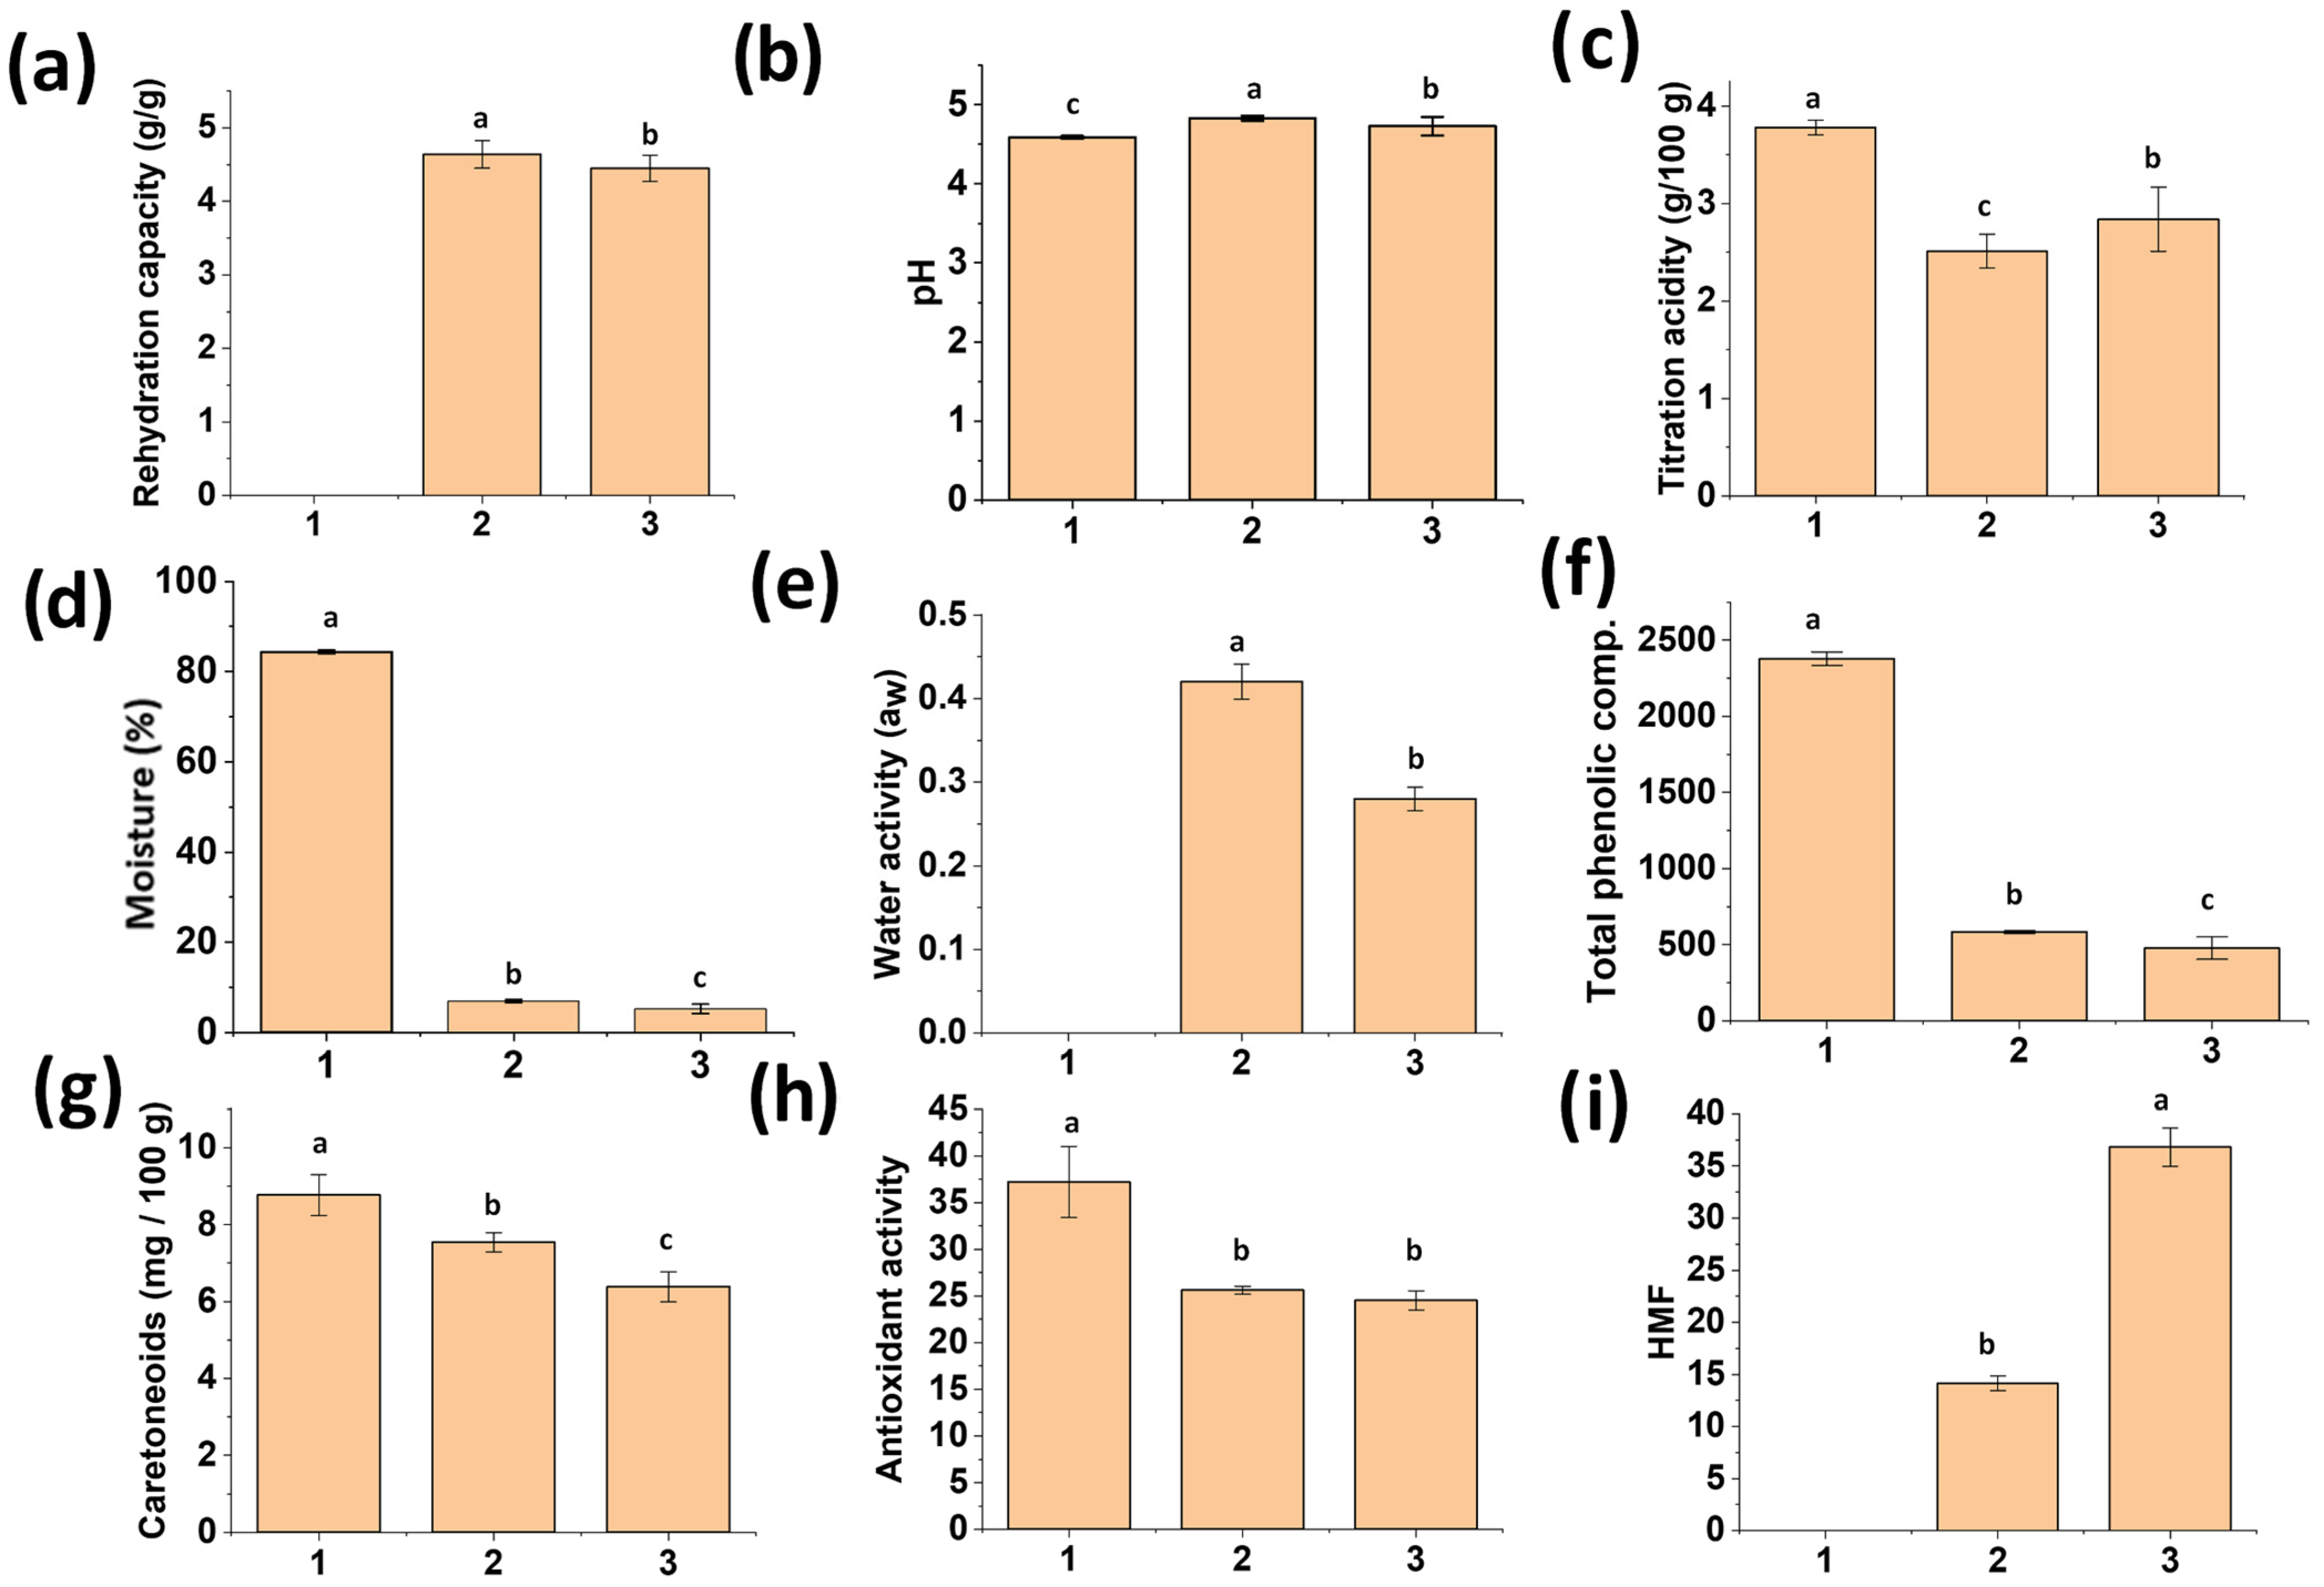
The effects of VMD and HAD on the physicochemical properties, bioactive compounds, and HMF formation of Washington Navel orange slices were investigated, including the rehydration capacity, pH, titratable acidity, MC (%), aw, total phenolic content, total carotenoid content, and antioxidant activity. The results are presented as bar charts in Figure 4.

3.3.1. Rehydration Capacity, Moisture Content (MC) and Water Activity (aw)

The rehydration capacity of Washington Navel slices exhibited a statistically significant difference between the two drying processes. This suggests that VMD better preserved cellular integrity and resulted in a more porous structure than HAD. Foods dried by VMD have porous cellular structures owing to their internal vapor pressure and vacuum. Compared to samples dried by VMD, such a porous structure is frequently linked to more thorough rehydration and increased water retention [54,55].
Various drying methods significantly reduced the MC and aw of the orange slices (p < 0.05). HAD typically results in the lowest MC and lowest aw, thus inhibiting microbial growth and enhancing product stability. While HAD effectively reduced MC and aw, VMD resulted in a more porous microstructure, which may improve product quality and storage stability. Furthermore, the aw values of the VMD samples were similar to those of HAD-dried slices (≈0.4), which is generally associated with satisfactory storage stability. VMD has been associated with improved rehydration because of the formation of a porous microstructure during drying [56]. To further verify this structural explanation, SEM analysis was performed under the optimized drying conditions for both drying systems. The SEM micrographs revealed clear microstructural differences between the samples dried using HAD and VMD. The HAD samples exhibited a relatively compact and partially collapsed structure with limited pore formation, whereas the VMD samples exhibited a more porous and expanded matrix characterized by interconnected pores and larger internal cavities. This difference can be attributed to the rapid internal vapor generation under vacuum microwave conditions, which promotes pore development and structural expansion before severe shrinkage occurs. The porous structure observed in the VMD samples also explains their higher rehydration capacity and enhanced moisture diffusivity compared to those of HAD (Figure 5).
Similar pore development under microwave-assisted vacuum drying has been reported in other fruit matrices, where rapid internal pressure generation promotes structural expansion and improves mass transfer characteristics. This microstructural preservation is also closely associated with improved water absorption during rehydration and shorter drying times [45,57].
A similar porous microstructural development has been reported in citrus peels subjected to VMD, where SEM observations revealed an expanded porous matrix generated by rapid internal vapor release under reduced-pressure conditions [57]. Comparable SEM observations were also reported for orange peel subjected to microwave-assisted hot-air drying, where microwave energy promoted cell disruption and pore formation, whereas conventional hot-air drying produced a denser and more compact structure [58]. The present SEM observations support a similar structural mechanism, as the VMD samples exhibited a porous and expanded matrix, whereas the HAD samples exhibited a compact and partially collapsed microstructure. However, most of the available literature on citrus microstructure has primarily focused on orange peel rather than fruit pulp, and studies directly addressing the internal microstructural changes in orange pulp remain limited. In a vacuum freeze-drying study reported by Liang et al., the fruit pulp surface exhibited a less porous structure than that observed in the present study under both VMD and HAD conditions [59]. This difference may indicate that VMD may promote greater pore development in the fruit pulp than other low-pressure drying techniques. Therefore, the effect of different drying technologies on the formation of porous microstructures in citrus fruit pulp requires further investigation.

3.3.2. pH and Titratable Acidity

The baseline pH values significantly increased, whereas the titratable acidity markedly decreased during drying of the oranges (p < 0.05). In the Washington Navel variety, VMD resulted in the most significant decrease in titratable acidity. The higher titratable acidity observed in the VMD samples reflects improved retention and/or concentration effects resulting from rapid moisture removal and reduced thermal degradation compared to conventional drying methods. These findings are consistent with those reported by Bozkır (2020) [28].

3.3.3. Total Phenolic Carotenoid and Antioxidant Activity

The phenolic compounds in Washington Navel orange slices were better preserved with VMD than with HAD. It is plausible to propose that a brief processing duration and low-oxygen environment limit oxidative and thermal deterioration [60]. The total carotenoid concentration decreased significantly after drying. The drying procedure significantly impacted the Washington Navel. The VMD approach proved to be superior in conserving carotenoids. The vulnerability of carotenoids to oxygen exposure and extended heat processing accounts for this result [61].
After drying, a reduction in the antioxidant activity was observed. Compared to the HAD approach, the VMD methodology significantly enhanced the retention of antioxidant activity in Washington Navel orange slices, achieving statistical significance (p < 0.05) between the two drying methods employed. This can be explained by the fact that VMD provides rapid drying and results in lower levels of oxidative stress [57]. Previous studies have demonstrated that processing and drying conditions can significantly alter the chemical composition and bioactivity of plant-derived compounds, including phenolics and essential oils [62,63].

3.3.4. Hydroxymethylfurfural (HMF) Formation

No HMF was detected in the fresh products. Significant amounts of HMF were detected in the products obtained using both the drying methods. Higher HMF levels were detected in slices obtained using the HAD method. This can be attributed to the longer duration of the thermal process, especially in the presence of oxygen, triggering a higher level of Maillard reaction and sugar breakdown [64]. In general, these data suggest that the VMD method is superior to the HAD method in terms of many parameters. VMD offers advantages in many areas, such as preserving bioactive substances, reducing HMF formation, and providing a higher rehydration capacity. In conclusion, VMD is superior to the HAD method for orange slice drying in terms of the parameters listed above. Similar increases in HMF under thermal drying conditions have been reported in citrus-derived systems, where prolonged heat exposure promotes sugar degradation and acid-catalyzed non-enzymatic browning reactions. In orange-based products containing dried citrus fractions, HMF accumulation has been associated with thermal processing intensity and progressive conversion of sugar degradation intermediates under acidic conditions [65]. A stronger drying-related effect was reported in comparative drying studies, where conventional hot-air drying generated the highest HMF levels because of prolonged exposure time, whereas alternative low-pressure methods limited HMF formation by reducing thermal load [66]. A similar trend was also observed in a recent orange slice drying work, where hot-air drying produced greater thermal quality deterioration than low-pressure drying approaches, indicating that longer residence times under atmospheric conditions intensify heat-induced chemical changes [59]. Therefore, the lower HMF values obtained under VMD in the present study confirm the protective role of shorter drying times and reduced oxygen exposure, which likely limited sugar degradation pathways and secondary browning reactions.

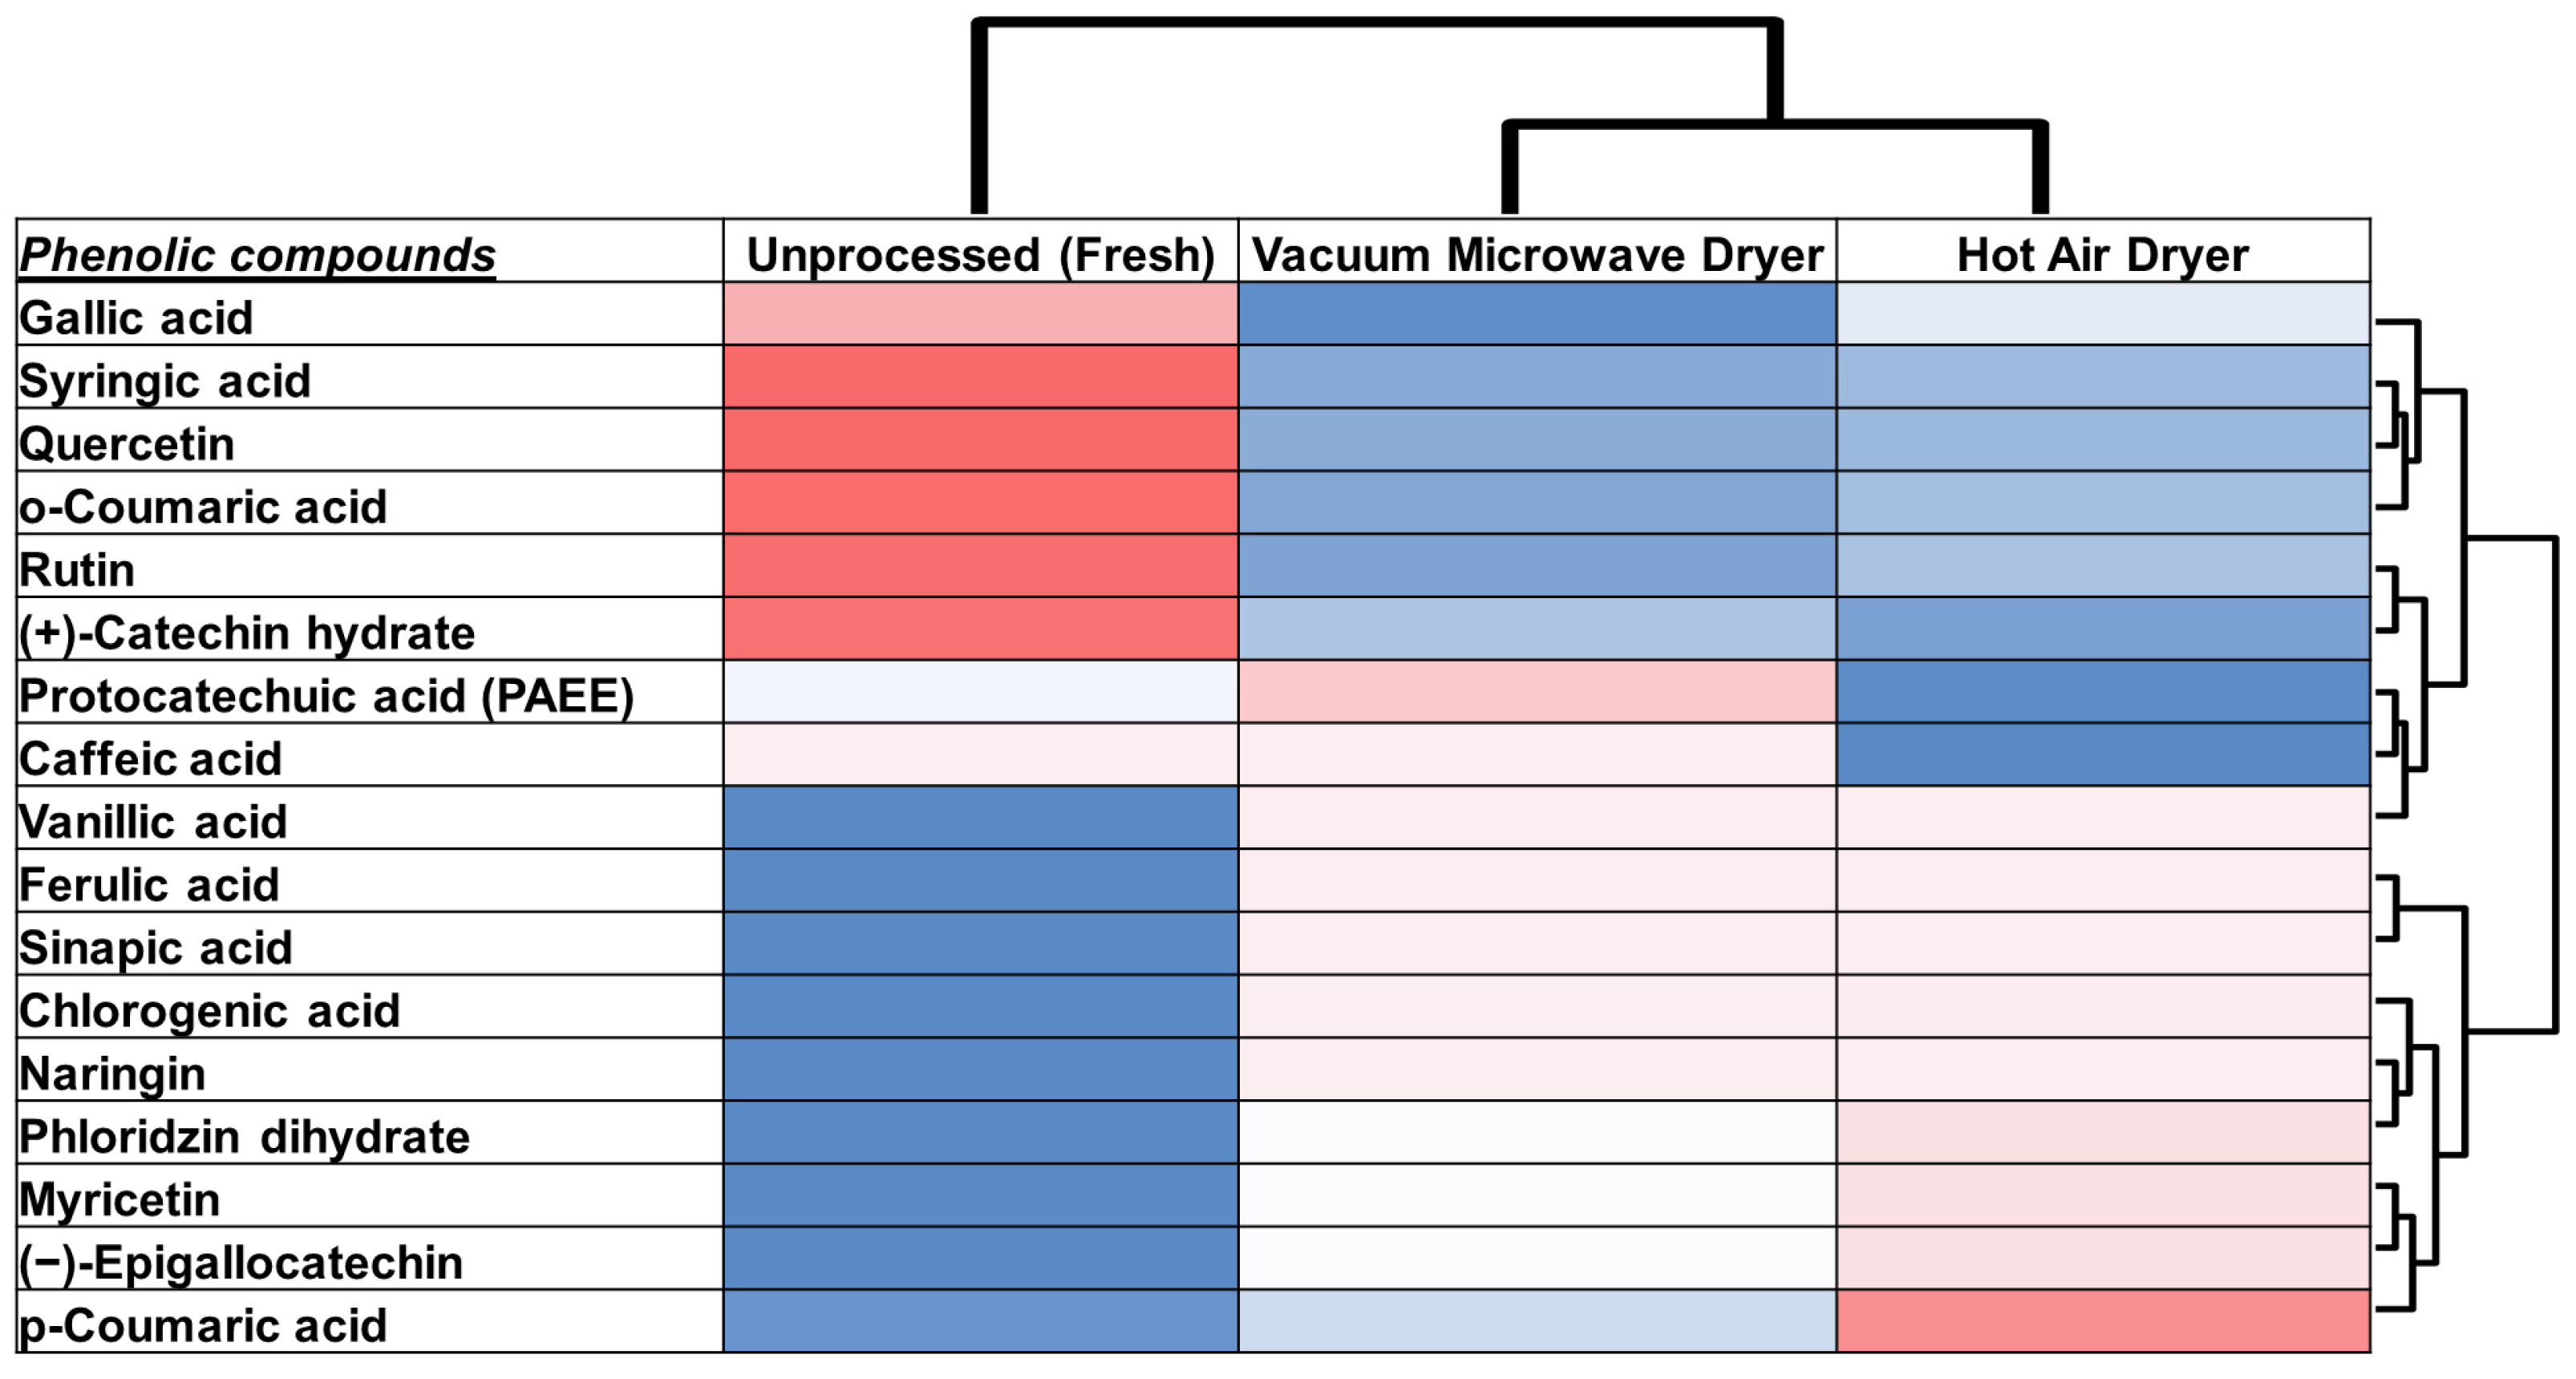
3.3.5. Phenolic Compounds Profile After Drying Processes

The antioxidant capacity of plant-based foods is largely attributed to the presence of phenolic compounds. The HPLC analysis identified 17 phenolic compounds. Among these, hydroxycinnamic acid was the most abundant phenolic subgroup (472.07 mg/100 g dry matter), followed by flavanones (216.06 mg/100 g) and hydroxybenzoic acids (141.63 mg/100 g). Hierarchical cluster analysis based on standardized (z-score) values is presented as a heatmap (Figure 6). This analysis revealed marked variations in the phenolic compound content. Hydroxycinnamic acid decreased to 31.30 mg/100 g (vacuum microwave) and 11.24 mg/100 g (HAD), while hydroxybenzoic acid showed a slight increase. This may be due to the degradation of cinnamic derivatives and possible release of bound phenolics. Epigallocatechin levels decreased from 147.66 mg/100 g in fresh samples to 27.96 mg/100 g according to the VMD results and 19.67 mg/100 g according to HAD results. Similarly, chlorogenic acid exhibited severe degradation under both drying conditions. Overall, total phenolic content decreased from 1137.68 mg/100 g in fresh samples to 347.65 mg/100 g (VMD) and 255.67 mg/100 g (HAD). Although both methods caused significant losses, vacuum microwave drying demonstrated comparatively better preservation of the phenolic compounds.

3.3.6. Carotenoid Profile

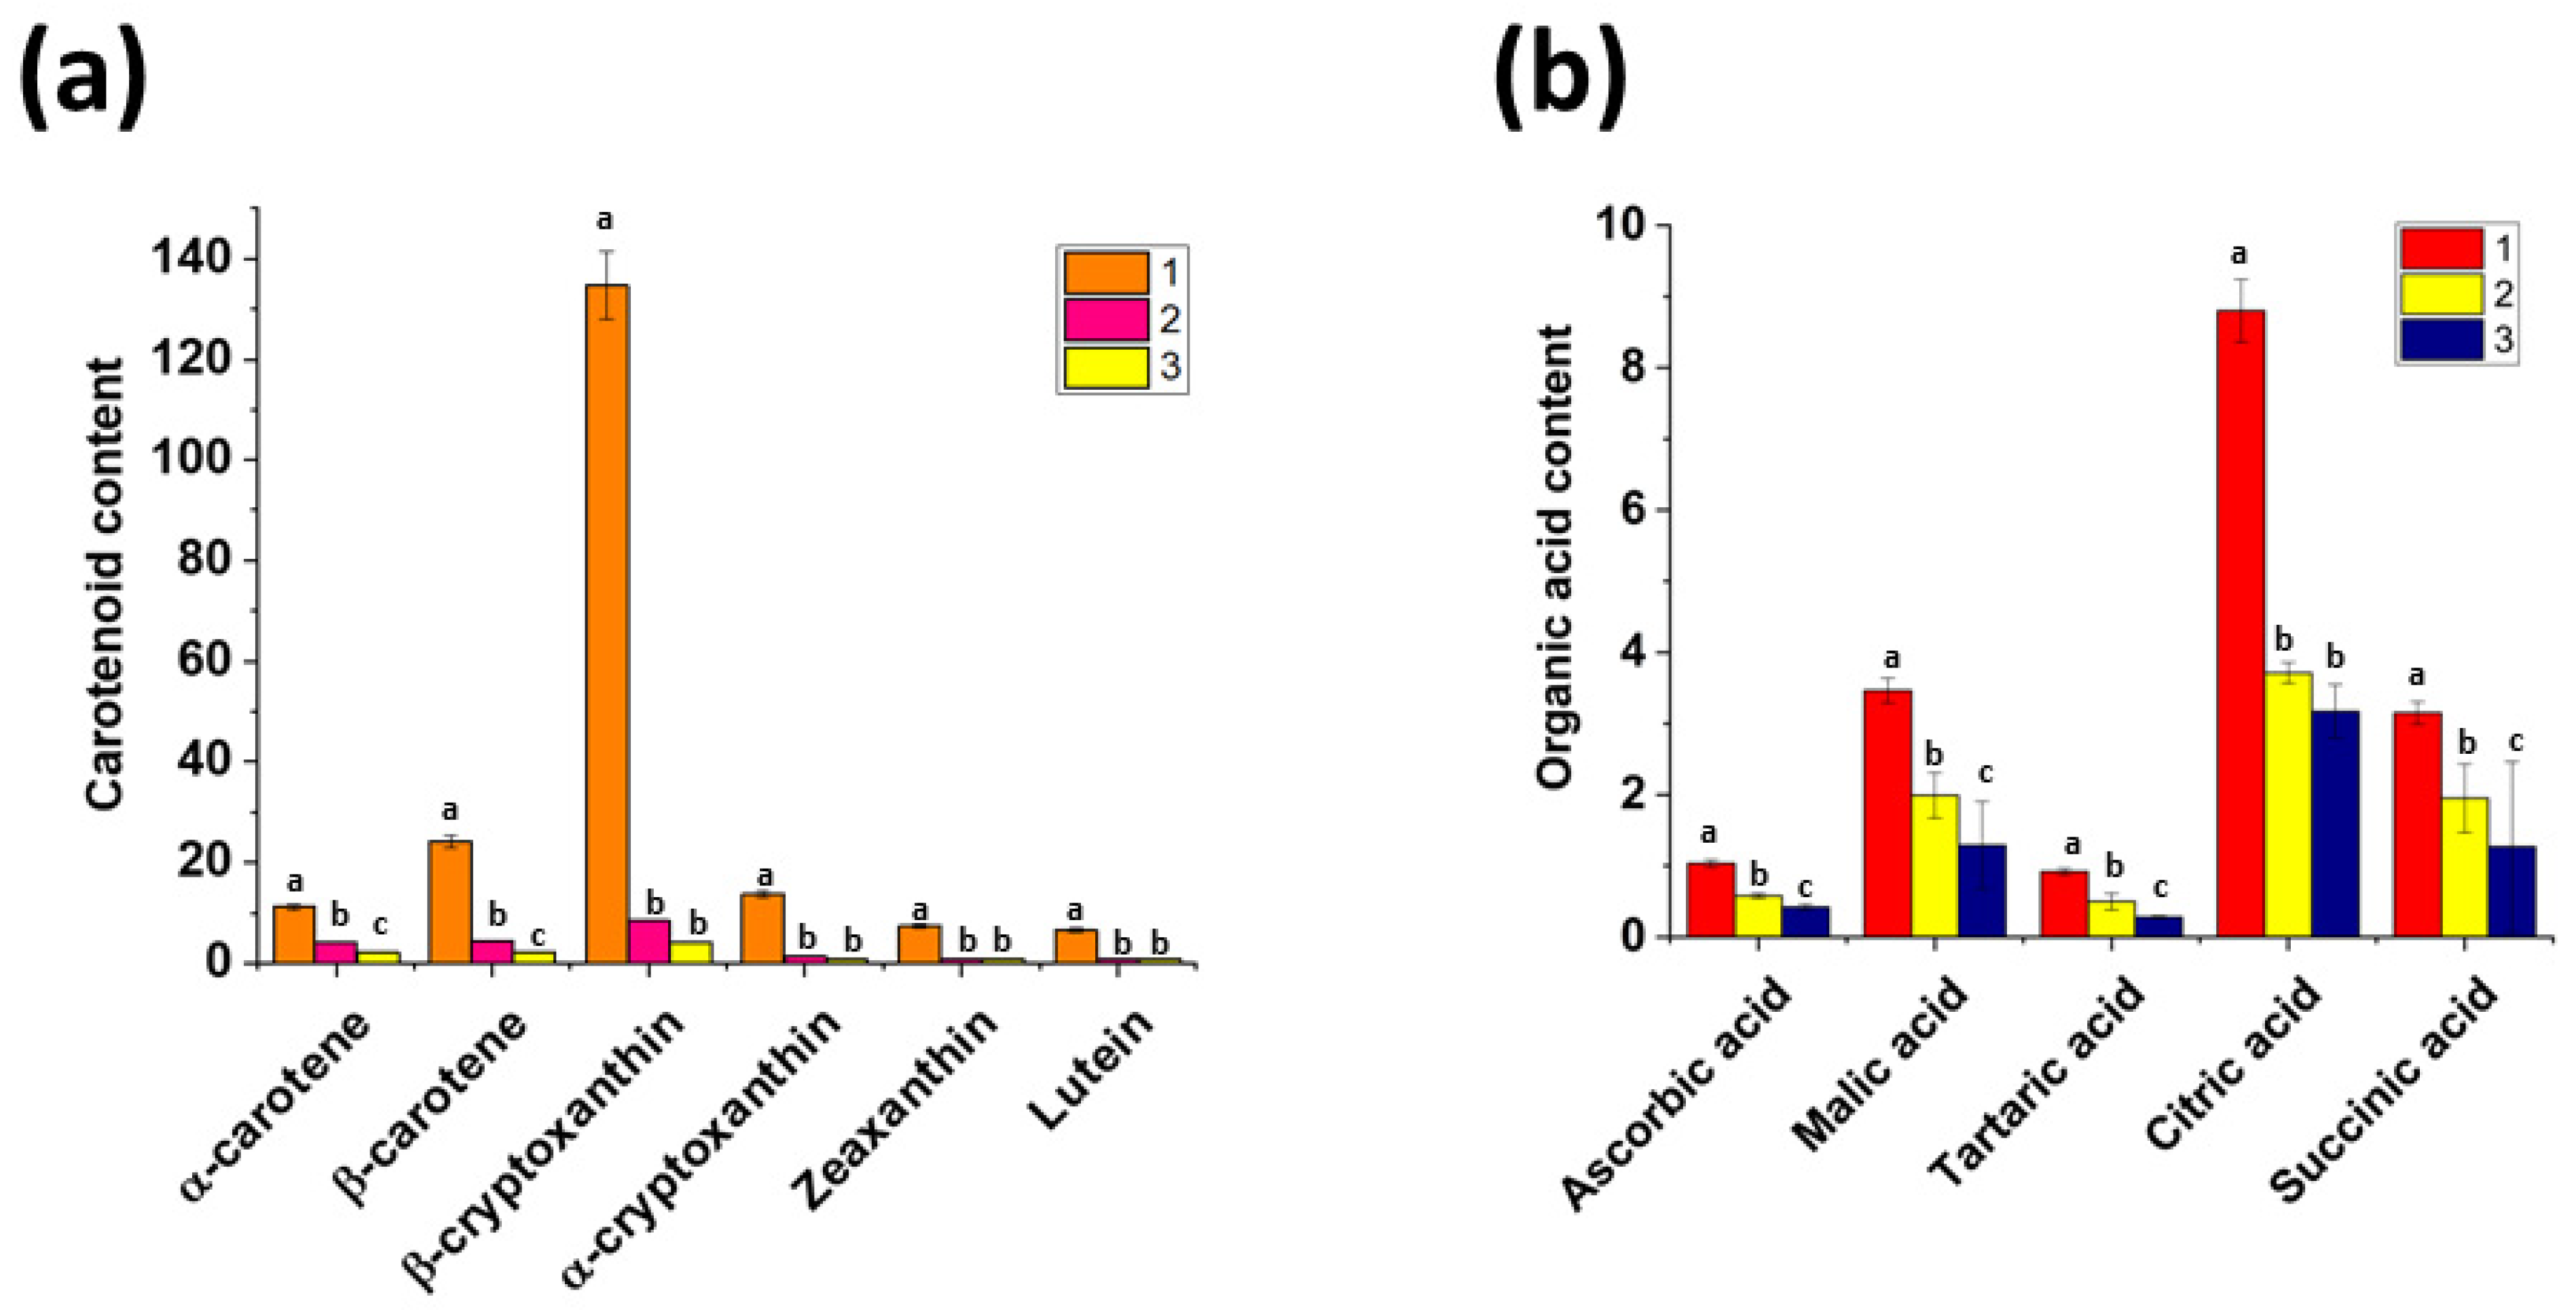
Fresh Washington Navel orange slices showed high levels of essential carotenoid components such as β-cryptoxanthin, β-carotene, α-carotene, lutein, and zeaxanthin (Figure 7). Specifically, β-cryptoxanthin content was measured at 134.60 µg/g dry matter in fresh samples. This value decreased to 8.41 µg/g dry matter after VMD and to 4.09 µg/g dry matter after HAD. This decrease was statistically significant (p < 0.05). However, the difference in β-cryptoxanthin content between the drying methods was not statistically significant (p > 0.05). Similar significant decreases were also recorded for the other carotenoid components lutein, zeaxanthin, and α-cryptoxanthin. These changes indicate that the drying process had a significant effect on carotenoid stability, but there was no statistically significant difference in terms of the drying methods used (p > 0.05). The findings revealed that carotenoid compounds generally exhibit low stability under thermal conditions and therefore suffer significant losses during drying. Furthermore, VMD provided significantly greater protection against β-carotene and α-carotene. The difference between the drying methods was statistically significant (p < 0.05).

3.3.7. Organic Acid Profile

The ascorbic acid (vitamin C) content in Washington Navel oranges was 1.034 g/100 g dry matter in fresh samples. After drying, the amount of this compound decreased to 0.58 g/100 g dry matter with the VMD method and to 0.42 g/100 g dry matter with the HAD method. The losses in ascorbic acid were statistically significant for both methods (p < 0.05) (Figure 7). Similarly, a significant decrease was observed in the malic acid, tartaric acid, and succinic acid contents after drying. The effect of drying method was statistically significant (p < 0.05). Citric acid was detected at 8.80 g/100 g of dry matter in fresh samples, and a decrease of approximately 50–60% occurred after drying. Titration acidity is an important quality indicator that reflects the general acidic characteristics of organic acids. The TA value in fresh Washington Navel oranges was measured as 3.78 g/100 g dry matter, which decreased to 2.51 g/100 g in the VMD application and to 2.84 g/100 g in HAD. These decreases were statistically significant (p < 0.05). The VMD method preserved all organic acid components, especially vitamin C, more effectively in Washington Navel orange slices than HAD. However, it was observed that both methods led to significant acid losses compared to the fresh state; VMD provided an advantage, especially in preserving the quality. In conclusion, both fruit variety and drying methods play a critical role in the preservation of organic acids and sustainability of acidic characteristics. Optimizing drying conditions is of great importance in preserving the functional quality of high-value fruits such as oranges.

3.3.8. Sugar Content of Dried Orange Slices

In fresh Washington Navel orange samples, the most abundant sugar compound was sucrose, with a value of 20.22 g/100 g dry matter, constituting approximately 40.3% of the total sugar (Table 5). This was followed by glucose (30.9%), and fructose (28.8%). No statistically significant differences were observed in any of the sugar components after drying (p > 0.05).

3.3.9. Color Value

In Table 6, the color values of fresh, VMD-treated, and HAD-treated samples of Washington Navel orange slices were evaluated according to the CIE Lab* system. The L* value (brightness) increased significantly after drying. While the lowest L* value was determined as 55.32 ± 0.914 in fresh samples, VMD (82.43 ± 0.657) and HAD (82.09 ± 0.734) caused a statistically significant increase in this value (p < 0.05). However, there was no significant difference in L* values between the drying methods (p > 0.05). The a* value (red-green axis) was found to be higher in fresh samples (4.77 ± 0.842) and decreased significantly with drying. Statistically significant decreases in a* value were detected as a result of VMD (1.90 ± 0.314) and HAD (1.66 ± 0.703) applications. However, the difference in the a* value between the drying methods was not significant (p > 0.05). In contrast, significant differences were observed in the b* values obtained using the different drying methods. While there was no significant difference between the b* value in fresh samples (42.49 ± 1.382) and VMD (40.18 ± 1.470), it was determined that this value increased significantly with HAD (54.01 ± 1.381) (p < 0.05).
The ΔE calculated as a result of the drying processes was measured as 27.42 ± 0.693 in VMD and 29.37 ± 0.520 in HAD, and a statistically significant difference was found between these two methods. Similarly, the chroma difference (ΔC) was significantly higher in HAD (11.96 ± 1.231) than in VMD (3.85 ± 1.046) (p < 0.05). When evaluated in terms of hue, the hue value of fresh samples (83.58 ± 1.119) increased significantly after drying processes, and statistically significant differences were also observed between VMD (87.30 ± 0.448) and HAD (88.24 ± 0.707) applications (p < 0.05).

3.4. Drying Kinetic Results of Washington Navel Orange Slices Dried Using VMD and HAD Systems

3.4.1. Drying Kinetics and Moisture Transfer Behavior

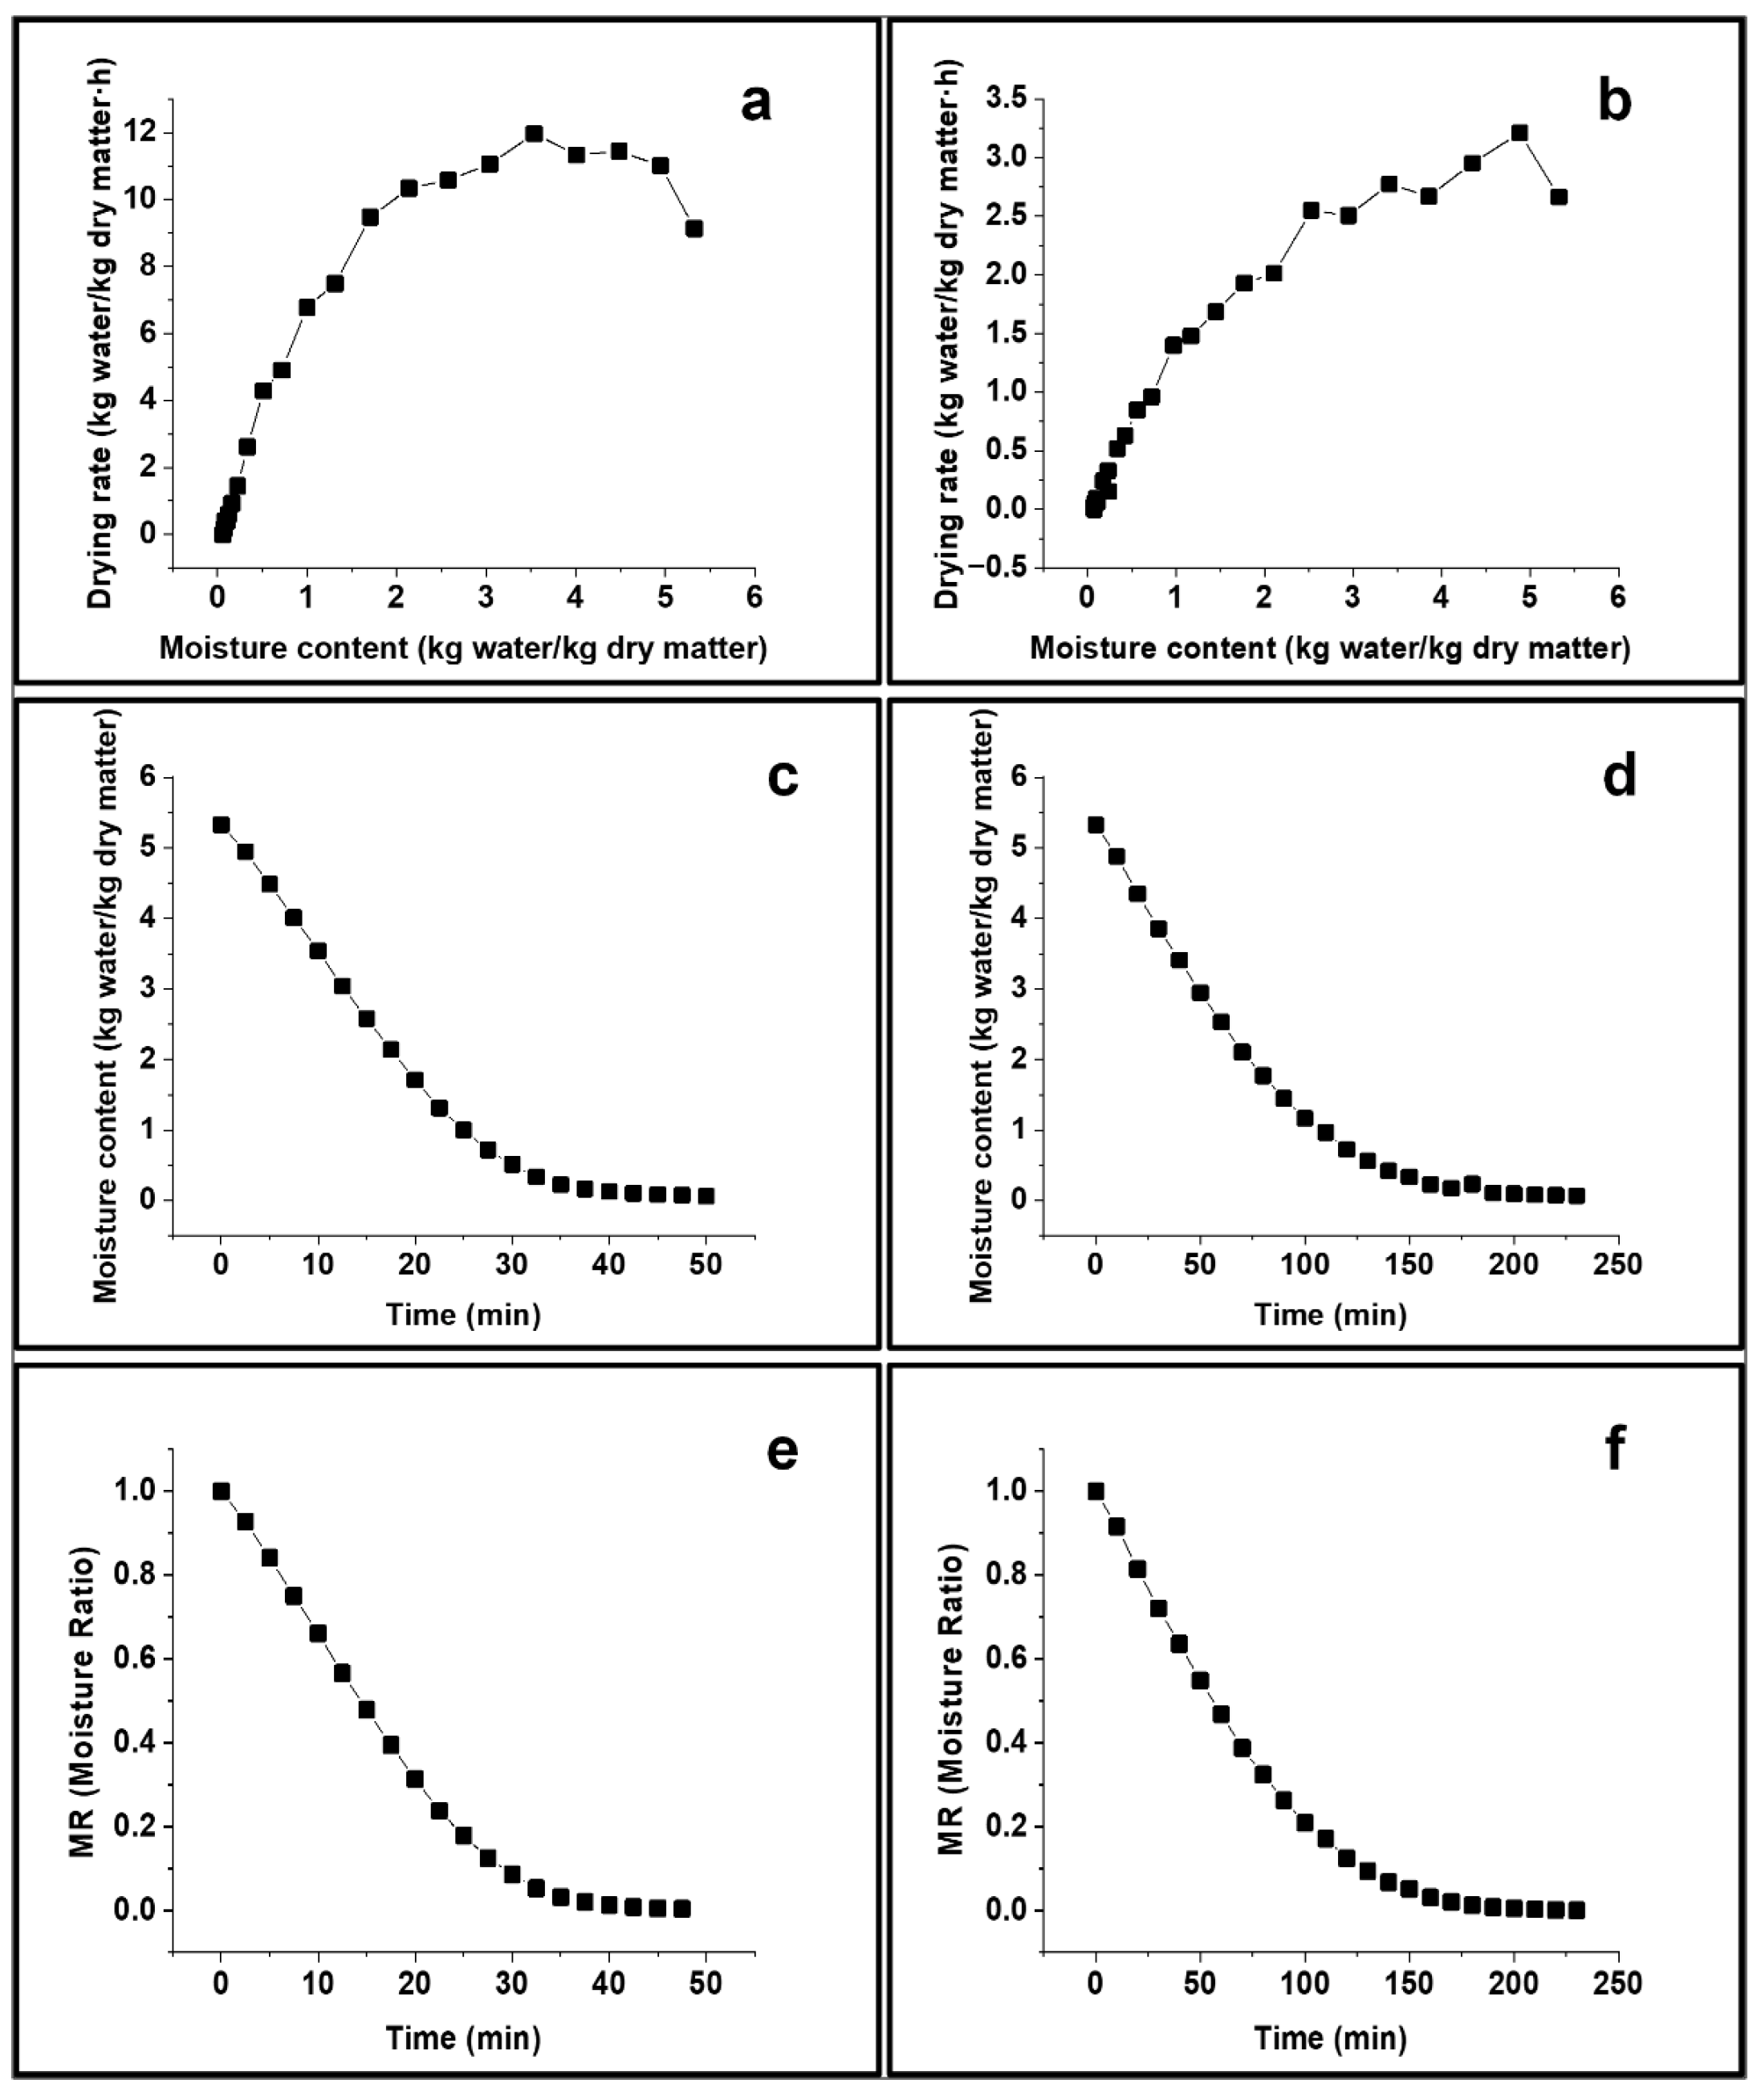
The DR, MC, and MR profiles of Washington Navel orange slices clearly demonstrated that the applied drying technique significantly influenced the moisture migration and mass transfer mechanisms. Under VMD, the DR initially increased at high MC, reaching peak values between 3.2 and 3.5 kg water/kg dry matter·h. This behavior can be attributed to the volumetric heating and rapid internal vapor generation induced by microwave energy absorption. The elevated internal vapor pressure enhances moisture transport from the core to the surface, accelerating the mass transfer during the early stages of drying. A similar behavior has been reported in microwave-assisted drying systems, where internal pressure-driven flow supplements diffusive transport mechanisms [67]. The DR gradually decreased after this initial acceleration, suggesting that the process mostly occurred during the falling rate phase. Because moisture movement in cellular food materials is primarily controlled by internal diffusion rather than surface evaporation, the lack of a clearly defined constant-rate period is consistent with their typical drying behavior. [68]. The MR dropped quickly under VMD conditions, reaching MR ≈ 0.05 in approximately 40–50 min. This indicates that the moisture levels quickly reached levels close to equilibrium. This rapid reduction in MR under VMD conditions is consistent with the enhanced internal moisture diffusion and reduced drying time reported for microwave-vacuum systems. Variations in the DR, MC, and MR of Washington Navel orange slices as a function of drying time under VMD and HAD conditions are presented in Figure 8.
In contrast, HAD removed moisture more slowly. The rate at which things dried slowly increased until it reached its highest point over a long period. After approximately 210 min, the moisture levels reached equilibrium, and the MR values reached 0.05 after approximately 200 min. The longer drying time is because convective systems do not have volumetric heating and have a lower heat-transfer coefficient. Similar kinetic trends have been observed in hot-air drying of fruit matrices [69].

3.4.2. Effective Moisture Diffusivity

Deff values were determined as:
8.38 × 10⁻¹⁰ m2/s for VMD
1.49 × 10⁻¹⁰ m2/s for HAD
The difference was statistically significant (p < 0.05).
These numbers are normal for food ingredients (10−11–10−9 m2/s) [70]. VMD enhances diffusivity six-fold because of internal vapor pressure gradients, structural expansion, and vacuum diffusion resistance. Studies indicate that microwave-assisted drying exhibits superior diffusivity compared with convective drying [71,72]. VMD speeds up moisture movement and shortens drying time owing to improved internal heat and increased moisture diffusivity. The Deff values obtained under VMD were within the commonly reported upper diffusivity range for vacuum- and microwave-assisted drying of citrus materials, whereas the HAD values were consistent with those reported for the conventional hot-air drying of orange tissues. Previous studies on orange slice drying under reduced-pressure conditions have reported effective moisture diffusivity values generally within the order of 10−9 to 10−10 m2/s, with an increase observed when internal moisture transport was enhanced by vacuum application and microwave-assisted heating [28,73]. In previous orange drying studies, Deff values as high as 6.13 × 10⁻⁹ m2/s have been reported under intensified vacuum-assisted drying conditions, whereas the value obtained in the present study (8.38 × 10⁻¹⁰ m2/s) was consistent with the higher end of values reported for vacuum-assisted drying and indicated improved moisture diffusion compared with conventional hot-air drying [51]. These values are also consistent with the commonly reported diffusivity range for food materials (10−12–10−8 m2/s) described in the literature [51,70]. Therefore, the significantly higher diffusivity observed under VMD in the present study indicates enhanced internal moisture transport under vacuum–microwave conditions, whereas the HAD value (1.49 × 10⁻¹⁰ m2/s) remained within the diffusion range commonly associated with slower moisture migration under external convective heating.

3.4.3. Mathematical Modeling of Drying Behavior

Among the ten thin-layer drying models evaluated, the selected model provided superior predictive performance for Washington Navel orange slices under VMD conditions. According to the findings, the Page model provided the best fit for modeling Washington Navel orange slices using the VMD method. The calculated R2, RMSE, and χ2 values for this model were 0.998, 0.01626, and 0.00029, respectively. These results demonstrate that the Page model exhibits a high level of fit to the experimental data. High coefficients of determination are commonly reported for empirical thin-layer models that describe diffusion-controlled drying behavior. The predominance of the falling-rate period further supports the idea that moisture transport is governed mainly by internal diffusion mechanisms rather than by external mass transfer limitations [74]. This behavior aligns with classical drying theory for porous biological materials. Furthermore, it was determined that the best fit for modeling the HAD method of Washington Navel orange slices was provided by the logarithmic model. The calculated R2 values for this model are 0.994, 0.02751, and 0.00086, respectively. The statistical values for the ten different drying models for the VMD and HAD methods of the Washington Navel oranges are shown in Table S2.
Based on the combined statistical evaluation criteria (R2, χ2, RMSE, and SEM), the Page model provided the best fit for VMD, showing the highest R2 value (0.998) together with low χ2 and RMSE values. This suggests that rapid volumetric heating and internal vapor generation under vacuum conditions produced a non-linear moisture removal pattern, effectively described by the Page equation. In contrast, the logarithmic model provided the best fit for hot air drying (HAD), with a high R2 value (0.994) and lowest χ2 (0.00086) and RMSE (0.02751) values among the tested models. Although the Page model also yielded a slightly higher R2 value under HAD conditions, its χ2 and RMSE values were considerably higher, indicating a lower predictive consistency. The difference in the best-fit models between VMD and HAD suggests that distinct dominant moisture migration mechanisms operate in the two drying systems. Under VMD, internal pressure-driven diffusion and rapid vapor escape dominated the drying process, whereas in HAD, moisture transfer was mainly governed by external convective heat transfer, followed by gradual internal diffusion.

3.5. Specific Energy Consumption and Power Density

Finally, the nominal specific energy consumption (SEC) and power density were estimated under the optimum drying conditions for both systems. Under optimum VMD conditions, approximately 641.24 g of fresh orange slices was processed per batch, and nominal SEC calculated from three independent validation runs was 5.55 ± 0.52 kWh/kg removed water, while the corresponding average microwave power density was 6.24 W/g. Under optimum HAD conditions, approximately 879.75 g fresh orange slices were processed per batch, nominal SEC was calculated as 2.69 ± 0.49 kWh/kg removed water, with an average power density of 0.61 W/g based on the total nominal dryer power. Although HAD exhibited lower nominal energy consumption, VMD provided substantially shorter drying times, together with superior preservation of phenolic compounds, carotenoids, and rehydration characteristics. This suggests that the higher energy intensity applied in the VMD contributed to more efficient moisture removal and improved product quality retention.

4. Conclusions

This study investigated the drying of Washington Navel orange slices using VMD technology, along with a conventional HAD system. The drying processes were optimized using RSM, and the optimal drying parameters were determined. The VMD technique significantly reduced the drying time compared with HAD. This also increased the effective moisture diffusion coefficient, thereby accelerating the drying process. Samples dried by VMD exhibited a higher rehydration capacity, lower color difference (ΔE and ΔC), and reduced HMF formation. VMD delivered a better product than HAD in four aspects: it exhibited a higher total phenolic content, better individual phenolic profile, greater carotenoid levels, and elevated ascorbic acid concentration. Although VMD preserved the quality parameters better than HAD, fresh Washington Navel oranges retained the highest levels of phenolic compounds, antioxidant activity, carotenoids, and ascorbic acid. These quality indicators decreased to a greater extent during HAD than under the VMD conditions. However, HAD reduces aw the most, thereby enhancing microbial stability while producing the highest HMF content due to prolonged thermal exposure. These findings indicate that VMD is a promising alternative for drying Washington Navel orange slices, as it preserves the color and bioactive compounds and achieves a high rehydration ratio. From a drying kinetics perspective, VMD drying followed the Page model, whereas HAD exhibited kinetics consistent with the logarithmic model. Based on the data obtained from this study, future studies should evaluate different orange varieties under similar drying conditions, compare the results with sensory analyses, and include specific energy consumption measurements using dedicated instrumentation for a more comprehensive techno-economic comparison of the VMD and HAD systems.

Supplementary Materials

The following supporting information can be downloaded at: https://www.mdpi.com/article/10.3390/app16073530/s1, Table S1: Commercial phenolic standards used for HPLC-PDA analysis; Table S2: Statistical comparison of ten thin-layer drying models; Table S3: Raw data for specific energy consumption calculations; Table S4: RSM-based ANOVA analysis for vacuum microwave drying; Figure S1: Residual diagnostic plots for VMD drying rate model; Figure S2: Residual diagnostic plots for HAD drying rate model; Figure S3: Experimental and predicted drying rates in VMD; Figure S4: Experimental and predicted rehydration capacity in VMD; Figure S5: Experimental and predicted b* values in VMD; Table S5: RSM-based optimal drying conditions for VMD; Tables S6a–S6c: T-test results under optimal VMD conditions; Table S7: RSM-based ANOVA analysis for hot air drying; Figures S6–S8: Experimental and predicted values in HAD; Table S8: Optimal drying conditions in HAD; Tables S9a–S9c: T-test results under optimal HAD conditions.

Author Contributions

Conceptualization, O.K., and N.K.; methodology, N.K.; software, S.L.İ.; validation, O.K., E.P., and N.K.; formal analysis, S.L.İ.; investigation, N.K., and S.L.İ., E.P.; resources, O.K.; Data curation, E.P.; writing—original draft preparation, S.L.İ., and N.K.; Writing—review and editing, S.L.İ., and O.K.; visualization, E.P.; supervision, O.K.; project administration, O.K.; funding acquisition, O.K. All authors have read and agreed to the published version of the manuscript.

Funding

This research was funded by the Adana Alparslan Türkeş Science and Technology University, Scientific Research Projects Unit, grant number 21803004.

Institutional Review Board Statement

Not applicable.

Informed Consent Statement

Not applicable.

Data Availability Statement

Data reported in this study are available in this article.

Acknowledgments

The authors gratefully acknowledge Hamza Bozkır for his valuable support during the vacuum microwave and hot–dry air drying experiments. A graphical abstract and Figure 1 were created using BioRender.com by Latif, S. (2026) and further modified by the authors.

Conflicts of Interest

The authors declare no conflicts of interest.

Abbreviations

The following abbreviations were used in this manuscript:
VMDVacuum Microwave Drying
HADHot Air Drying
RSMResponse Surface Methodology
MCDMMulti-Criteria Decision Making
TPCTotal Phenolic Content
HMFHydroxymethylfurfural
DeffEffective Moisture Diffusivity
MRMoisture Ratio
DRDrying Rate
MCMoisture Content
R2Coefficient of Determination
RMSERoot Mean Square Error
SEMStandard Error of Mean
χ2Reduced Chi-Square
CVCoefficient of Variation
ANOVAAnalysis of Variance
PDAPhotodiode Array Detector
HPLCHigh Performance Liquid Chromatography
RIDRefractive Index Detector
DPPH2,2-Diphenyl-1-picrylhydrazyl
GAEGallic Acid Equivalent
TETrolox Equivalent
BHTButylated Hydroxytoluene
AOACAssociation of Official Analytical Chemists
CIELABCommission Internationale de l’Éclairage Lab* Color System
ΔETotal Color Difference
ΔCChroma Difference
AwWater Activity
NaOHSodium Hydroxide
H2SO4Sulfuric Acid
SPSSStatistical Package for the Social Sciences

References

  1. İpek, S.L.; Göktürk, D. Industry 4.0 Approaches in Food and Bio Industry: Recent Developments and Future Trends. Adv. Artif. Intell. Res. 2021, 1, 29–42. [Google Scholar]
  2. Nowacka, M.; Matys, A.; Witrowa-Rajchert, D. Innovative Technologies for Improving the Sustainability of the Food Drying Industry. Curr. Food Sci. Technol. Rep. 2024, 2, 231–239. [Google Scholar] [CrossRef]
  3. Kilic, M.; Sahin, M.; Hassan, A.; Ullah, A. Preservation of Fruits through Drying—A Comprehensive Review of Experiments and Modeling Approaches. J. Food Process Eng. 2024, 47, e14568. [Google Scholar] [CrossRef]
  4. Huang, Y.; Sun, Y.; Lu, T.; Chen, X. Effects of Hot-Air Drying on the Bioactive Compounds, Quality Attributes, and Drying and Color Change Kinetics of Coffee Leaves. J. Food Sci. 2023, 88, 214–227. [Google Scholar] [CrossRef]
  5. Kasapoglu, M.Z. Innovative Drying Methods of Kiwi Fruit: Effects on Phenolic Content, Antioxidant Activity, and Microstructural Properties. Ital. J. Food Sci. 2025, 37, 427–436. [Google Scholar] [CrossRef]
  6. Gómez-Mejía, E.; Sacristán, I.; Rosales-Conrado, N.; León-González, M.E.; Madrid, Y. Effect of Storage and Drying Treatments on Antioxidant Activity and Phenolic Composition of Lemon and Clementine Peel Extracts. Molecules 2023, 28, 1624. [Google Scholar] [CrossRef] [PubMed]
  7. Guclu, G.; Polat, S.; Kelebek, H.; Capanoglu, E.; Selli, S. Elucidation of the Impact of Four Different Drying Methods on the Phenolics, Volatiles, and Color Properties of the Peels of Four Types of Citrus Fruits. J. Sci. Food Agric. 2022, 102, 6036–6046. [Google Scholar] [CrossRef] [PubMed]
  8. Singh, N.; Sharma, R.M.; Dubey, A.K.; Saha, S.; Awasthi, O.P.; Bharadwaj, C.; Sevanthi, A.M.; Kumar, A.; Sharma, N.; Kumar, R.; et al. Bioactive Compounds and Bitterness Properties of Newly Developed Interspecific Citrus Hybrids (Citrus maxima [Burm. f.] Osbeck × Citrus sinensis [L.] Osbeck). Horticulturae 2025, 11, 208. [Google Scholar] [CrossRef]
  9. Tan, X.; Jiang, W.; Su, J.; Yu, F. Recent Advances in Drying Technologies for Orange Products. Foods 2025, 14, 3051. [Google Scholar] [CrossRef]
  10. Çelik, B.A.; Özdal, T.; Karabacak, A.Ö.; Ömeroğlu, P.Y. Mikrodalga Ön İşlemli Vakumlu Kurutma Yönteminin Portakal Dilimlerinin Renk ve Fenolik Bileşen Profili Üzerine Etkileri: Çok Değişkenli Analiz Yaklaşımı. Turk. J. Agric.-Food Sci. Technol. 2025, 13, 719–730. [Google Scholar] [CrossRef]
  11. Panigrahi, S.S.; Mishra, G.; Kumar, V.; Panigrahi, C.; Kaur, G.; Shaikh, A.E.Y.; Kumar, S.; Panda, B.K.; Kumari, T. Next-Generation Food Drying: Specialized and Smart Approaches to Boost Efficiency and Quality. Compr. Rev. Food Sci. Food Saf. 2025, 24, e70269. [Google Scholar] [CrossRef]
  12. Siddiqui, S.A.; Ucak, İ.; Jain, S.; Elsheikh, W.; Ali Redha, A.; Kurt, A.; Toker, O.S. Impact of Drying on Techno-Functional and Nutritional Properties of Food Proteins and Carbohydrates—A Comprehensive Review. Dry. Technol. 2024, 42, 592–611. [Google Scholar] [CrossRef]
  13. Onwude, D.I.; Hashim, N.; Janius, R.B.; Nawi, N.M.; Abdan, K. Modeling the Thin-Layer Drying of Fruits and Vegetables: A Review. Compr. Rev. Food Sci. Food Saf. 2016, 15, 599–618. [Google Scholar] [CrossRef]
  14. Turgut, D.Y.; Gölükcü, M.; Bozova, B.; Tokgöz, H.; Çınar, O.; Turgutoğlu, E. Effect of Hot Air Drying Process on Color and Antioxidant Attributes of the Flavedo of Bitter Orange (Citrus aurantium L.). Harran Tarım Gıda Bilim. Derg. 2025, 29, 205–214. [Google Scholar] [CrossRef]
  15. Plabon, M.E.A.; Akhtaruzzaman, M.; Mondal, M.H.T.; Islam, M.R.; Hasan, S.M.K.; Sarker, M.S.H. Comprehensive Assessment of Drying Performance, Physical Characteristics, Bioactive Compounds, and Antioxidant Capacity of Mallow (Malva verticillata) Vegetables: A Comparative Study of a Modified Tray Dryer and Conventional Drying Methods. Appl. Food Res. 2024, 4, 100423. [Google Scholar] [CrossRef]
  16. Li, Y.; Huang, M.; Qi, Y.; Wang, X.; Wan, N.; Wu, Z. Pulsed Vacuum Drying Enhances Drying Efficiency and Preserves Lignan Compounds of Schisandra chinensis Fruit Extract. LWT 2025, 238, 118895. [Google Scholar] [CrossRef]
  17. Zhang, W.; Chen, C.; Ju, H.; Okaiyeto, S.A.; Sutar, P.P.; Yang, L.; Li, S.; Xiao, H. Pulsed Vacuum Drying of Fruits, Vegetables, and Herbs: Principles, Applications and Future Trends. Compr. Rev. Food Sci. Food Saf. 2024, 23, e13430. [Google Scholar] [CrossRef]
  18. Coşkun, N.; Sarıtaş, S.; Jaouhari, Y.; Bordiga, M.; Karav, S. The Impact of Freeze Drying on Bioactivity and Physical Properties of Food Products. Appl. Sci. 2024, 14, 9183. [Google Scholar] [CrossRef]
  19. García-Martínez, E.; Camacho, M.D.M.; Martínez-Navarrete, N. In Vitro Bioaccessibility of Bioactive Compounds of Freeze-Dried Orange Juice Co-Product Formulated with Gum Arabic and Modified Starch. Molecules 2023, 28, 810. [Google Scholar] [CrossRef] [PubMed]
  20. Monteiro, R.L.; Gomide, A.I.; Link, J.V.; Carciofi, B.A.M.; Laurindo, J.B. Microwave Vacuum Drying of Foods with Temperature Control by Power Modulation. Innov. Food Sci. Emerg. Technol. 2020, 65, 102473. [Google Scholar] [CrossRef]
  21. Homayounfar, H.; Amiri Chayjan, R.; Sarikhani, H. Orange Slice Drying Enhancement by Intervention of Control Atmosphere Coupled with Vacuum Condition—A New Design and Optimization Strategy. Dry. Technol. 2023, 41, 1498–1513. [Google Scholar] [CrossRef]
  22. Sivaji, S.; Gunasekaran, S.; Saengrayap, R.; Mahajan, P.; Trongsatitkul, T.; Wu, D.; Vadakkan, K.; Sukrong, S.; Chaiwong, S. Response Surface Methodology in Postharvest and Food Technology Research: A Bibliometric Assessment. Appl. Food Res. 2025, 5, 101461. [Google Scholar] [CrossRef]
  23. Joudi-Sarighayeh, F.; Abbaspour-Gilandeh, Y.; Kaveh, M.; Szymanek, M.; Kulig, R. Response Surface Methodology Approach for Predicting Convective/Infrared Drying, Quality, Bioactive and Vitamin C Characteristics of Pumpkin Slices. Foods 2023, 12, 1114. [Google Scholar] [CrossRef]
  24. İpek, S.L.; Göktürk, D. Application of Multi-Criteria Decision Making Methods for Menu Selection. Black Sea J. Eng. Sci. 2024, 7, 21–30. [Google Scholar] [CrossRef]
  25. Lai, C.; Liang, Y.; Zhang, L.; Huang, J.; Kaliaperumal, K.; Jiang, Y.; Zhang, J. Variations of Bioactive Phytochemicals and Antioxidant Capacity of Navel Orange Peel in Response to Different Drying Methods. Antioxidants 2022, 11, 1543. [Google Scholar] [CrossRef]
  26. Wang, Z.; Zhong, T.; Mei, X.; Chen, X.; Chen, G.; Rao, S.; Zheng, X.; Yang, Z. Comparison of Different Drying Technologies for Brocade Orange (Citrus sinensis) Peels: Changes in Color, Phytochemical Profile, Volatile, and Biological Availability and Activity of Bioactive Compounds. Food Chem. 2023, 425, 136539. [Google Scholar] [CrossRef]
  27. Yilmaz, D.; Tekin-Cakmak, Z.H.; Karasu, S. Impact of Ultrasound Pretreatment and Temperature on Drying Kinetics and Quality Characteristics of Blood Orange Slices: Comparison with Different Drying Methods. Processes 2025, 13, 1596. [Google Scholar] [CrossRef]
  28. Bozkir, H. Effects of Hot Air, Vacuum Infrared, and Vacuum Microwave Dryers on the Drying Kinetics and Quality Characteristics of Orange Slices. J. Food Process Eng. 2020, 43, e13485. [Google Scholar] [CrossRef]
  29. Tuncer, A.D.; Guler, H.O.; Usta, H. Pomelo (Citrus maxima) Kabuğu Kuruma Karakteristiğinin Modellenmesi. El-Cezeri Fen. Mühendislik Derg. 2020, 7, 198–210. [Google Scholar] [CrossRef]
  30. Çetin, N. Prediction of Moisture Ratio and Drying Rate of Orange Slices Using Machine Learning Approaches. J. Food Process. Preserv. 2022, 46, e17011. [Google Scholar] [CrossRef]
  31. Ertekin, C.; Firat, M.Z. A Comprehensive Review of Thin-Layer Drying Models Used in Agricultural Products. Crit. Rev. Food Sci. Nutr. 2017, 57, 701–717. [Google Scholar] [CrossRef]
  32. Kucuk, H.; Midilli, A.; Kilic, A.; Dincer, I. A Review on Thin-Layer Drying-Curve Equations. Dry. Technol. 2014, 32, 757–773. [Google Scholar] [CrossRef]
  33. Cunniff, P.; Washington, D. Official Methods of Analysis of AOAC International, 22nd ed.; Latimer, G.W., Ed.; Oxford University Press: New York, NY, USA, 2023; ISBN 978-0-19-761013-8. [Google Scholar]
  34. Cui, Z.-W.; Li, C.-Y.; Song, C.-F.; Song, Y. Combined Microwave-Vacuum and Freeze Drying of Carrot and Apple Chips. Dry. Technol. 2008, 26, 1517–1523. [Google Scholar] [CrossRef]
  35. Singleton, V.L.; Rossi, J.A. Colorimetry of Total Phenolics with Phosphomolybdic-Phosphotungstic Acid Reagents. Am. J. Enol. Vitic. 1965, 16, 144–158. [Google Scholar] [CrossRef]
  36. Meléndez-Martínez, A.J.; Vicario, I.M.; Heredia, F.J. Review: Analysis of Carotenoids in Orange Juice. J. Food Compos. Anal. 2007, 20, 638–649. [Google Scholar] [CrossRef]
  37. Brand-Williams, W.; Cuvelier, M.E.; Berset, C. Use of a Free Radical Method to Evaluate Antioxidant Activity. LWT-Food Sci. Technol. 1995, 28, 25–30. [Google Scholar] [CrossRef]
  38. Erdoğan, S.; Erdemoğlu, S. Evaluation of Polyphenol Contents in Differently Processed Apricots Using Accelerated Solvent Extraction Followed by High-Performance Liquid Chromatography–Diode Array Detector. Int. J. Food Sci. Nutr. 2011, 62, 729–739. [Google Scholar] [CrossRef]
  39. Gama, J.J.T.; Sylos, C.M. Major Carotenoid Composition of Brazilian Valencia Orange Juice: Identification and Quantification by HPLC. Food Res. Int. 2005, 38, 899–903. [Google Scholar] [CrossRef]
  40. Onsekizoglu, P.; Bahceci, K.S.; Acar, M.J. Clarification and the Concentration of Apple Juice Using Membrane Processes: A Comparative Quality Assessment. J. Membr. Sci. 2010, 352, 160–165. [Google Scholar] [CrossRef]
  41. Slatnar, A.; Klancar, U.; Stampar, F.; Veberic, R. Effect of Drying of Figs (Ficus carica L.) on the Contents of Sugars, Organic Acids, and Phenolic Compounds. J. Agric. Food Chem. 2011, 59, 11696–11702. [Google Scholar] [CrossRef] [PubMed]
  42. Tontul, I.; Topuz, A. Effects of Different Drying Methods on the Physicochemical Properties of Pomegranate Leather (Pestil). LWT 2017, 80, 294–303. [Google Scholar] [CrossRef]
  43. Çelen, S. Effect of Microwave Drying on the Drying Characteristics, Color, Microstructure, and Thermal Properties of Trabzon Persimmon. Foods 2019, 8, 84. [Google Scholar] [CrossRef]
  44. EL-Mesery, H.S. Improving the Thermal Efficiency and Energy Consumption of Convective Dryer Using Various Energy Sources for Tomato Drying. Alex. Eng. J. 2022, 61, 10245–10261. [Google Scholar] [CrossRef]
  45. Pankyamma, V.; Mokam, S.Y.; Debbarma, J.; Rao B, M. Effects of Microwave Vacuum Drying and Conventional Drying Methods on the Physicochemical and Microstructural Properties of Squid Shreds. J. Sci. Food Agric. 2019, 99, 5778–5783. [Google Scholar] [CrossRef] [PubMed]
  46. Draper, N.R.; Smith, H. Applied Regression Analysis; John Wiley & Sons: Hoboken, NJ, USA, 1998; ISBN 978-0-471-17082-2. [Google Scholar]
  47. Weisberg, S. Applied Linear Regression, 1st ed.; Wiley Series in Probability and Statistics; Wiley: Hoboken, NJ, USA, 2005; ISBN 978-0-471-66379-9. [Google Scholar]
  48. Yu, X.; Du, C.; Wang, X.; Gao, F.; Lu, J.; Di, X.; Zhuang, X.; Cheng, C.; Yao, F. Multivariate Analysis between Environmental Factors and Fruit Quality of Citrus at the Core Navel Orange-Producing Area in China. Front. Plant Sci. 2024, 15, 1510827. [Google Scholar] [CrossRef] [PubMed]
  49. Kernou, O.-N.; Azzouz, Z.; Belbahi, A.; Kerdouche, K.; Kaanin-Boudraa, G.; Amir, A.; Madani, K.; Rijo, P. Inactivation of Escherichia Coli in an Orange Juice Beverage by Combined Ultrasonic and Microwave Treatment. Foods 2023, 12, 666. [Google Scholar] [CrossRef] [PubMed]
  50. Bharate, S.S.; Bharate, S.B. Non-Enzymatic Browning in Citrus Juice: Chemical Markers, Their Detection and Ways to Improve Product Quality. J. Food Sci. Technol. 2014, 51, 2271–2288. [Google Scholar] [CrossRef]
  51. Özkan-Karabacak, A.; Acoğlu, B.; Yolci Ömeroğlu, P.; Çopur, Ö.U. Microwave Pre-treatment for Vacuum Drying of Orange Slices: Drying Characteristics, Rehydration Capacity and Quality Properties. J. Food Process Eng. 2020, 43, e13511. [Google Scholar] [CrossRef]
  52. Ozcan-Sinir, G.; Ozkan-Karabacak, A.; Tamer, C.E.; Copur, O.U. The Effect of Hot Air, Vacuum and Microwave Drying on Drying Characteristics, Rehydration Capacity, Color, Total Phenolic Content and Antioxidant Capacity of Kumquat (Citrus Japonica). Food Sci. Technol. 2019, 39, 475–484. [Google Scholar] [CrossRef]
  53. Dıaz, G.R.; Martınez-Monzó, J.; Fito, P.; Chiralt, A. Modelling of Dehydration-Rehydration of Orange Slices in Combined Microwave/Air Drying. Innov. Food Sci. Emerg. Technol. 2003, 4, 203–209. [Google Scholar] [CrossRef]
  54. Dong, W.; Cheng, K.; Hu, R.; Chu, Z.; Zhao, J.; Long, Y. Effect of Microwave Vacuum Drying on the Drying Characteristics, Color, Microstructure, and Antioxidant Activity of Green Coffee Beans. Molecules 2018, 23, 1146. [Google Scholar] [CrossRef] [PubMed]
  55. Tian, Y.; Zhao, Y.; Huang, J.; Zeng, H.; Zheng, B. Effects of Different Drying Methods on the Product Quality and Volatile Compounds of Whole Shiitake Mushrooms. Food Chem. 2016, 197, 714–722. [Google Scholar] [CrossRef]
  56. Nguyen, N.P.M.; Marzec, A. Effect of Microwave–Vacuum Drying and Pea Protein Fortification on Pasta Characteristics. Processes 2024, 12, 2508. [Google Scholar] [CrossRef]
  57. Shu, B.; Wu, G.; Wang, Z.; Wang, J.; Huang, F.; Dong, L.; Zhang, R.; Wang, Y.; Su, D. The Effect of Microwave Vacuum Drying Process on Citrus: Drying Kinetics, Physicochemical Composition and Antioxidant Activity of Dried Citrus (Citrus Reticulata Blanco) Peel. Food Meas. 2020, 14, 2443–2452. [Google Scholar] [CrossRef]
  58. Talens, C.; Castro-Giraldez, M.; Fito, P.J. Effect of Microwave Power Coupled with Hot Air Drying on Sorption Isotherms and Microstructure of Orange Peel. Food Bioprocess. Technol. 2018, 11, 723–734. [Google Scholar] [CrossRef]
  59. Liang, Y.; Wu, Q.; Xiong, Q.; Zhang, J. A Comparative Study of Vacuum-Freeze-Dried and Hot-Air-Dried Gannan Navel Orange Slices: Physical Characteristics, Volatile/Non-Volatile Compounds, Antioxidant Activity, and Sensory Attributes. Foods 2025, 14, 4327. [Google Scholar] [CrossRef] [PubMed]
  60. Santos, A.A.d.L.; Leal, G.F.; Marques, M.R.; Reis, L.C.C.; Junqueira, J.R.d.J.; Macedo, L.L.; Corrêa, J.L.G. Emerging Drying Technologies and Their Impact on Bioactive Compounds: A Systematic and Bibliometric Review. Appl. Sci. 2025, 15, 6653. [Google Scholar] [CrossRef]
  61. Boon, C.S.; McClements, D.J.; Weiss, J.; Decker, E.A. Factors Influencing the Chemical Stability of Carotenoids in Foods. Crit. Rev. Food Sci. Nutr. 2010, 50, 515–532. [Google Scholar] [CrossRef]
  62. Demir, D.; Ceylan, S.; İpek, S.L.; Aslan, D.; Özbolat, V. Impregnation of Melaleuca Family Essential Oil Nanoemulsions into Pectin:Polyvinyl Alcohol Patches to Provide an Antibacterial Environment for Infected Wounds. ChemistryOpen 2025, 14, e202500117. [Google Scholar] [CrossRef]
  63. Demir, D.; İpek, S.L.; Kahraman, O.; Dağlı, S.; Ceylan, S. Topical Delivery of Niaouli Essential Oil Nanoemulsion via Chitosan:Polyvinyl Alcohol Patches: A Promising Antimicrobial Strategy for Potential Biomedical Applications. J. Drug Deliv. Sci. Technol. 2026, 117, 107992. [Google Scholar] [CrossRef]
  64. Capuano, E.; Fogliano, V. Acrylamide and 5-Hydroxymethylfurfural (HMF): A Review on Metabolism, Toxicity, Occurrence in Food and Mitigation Strategies. LWT-Food Sci. Technol. 2011, 44, 793–810. [Google Scholar] [CrossRef]
  65. Sicari, V.; Pellicanò, T.M.; Laganà, V.; Poiana, M. Use of Orange By-products (Dry Peel) as an Alternative Gelling Agent for Marmalade Production: Evaluation of Antioxidant Activity and Inhibition of HMF Formation during Different Storage Temperature. J. Food Process. Preserv. 2018, 42, e13429. [Google Scholar] [CrossRef]
  66. Kayacan, S.; Karasu, S.; Akman, P.K.; Goktas, H.; Doymaz, I.; Sagdic, O. Effect of Different Drying Methods on Total Bioactive Compounds, Phenolic Profile, in Vitro Bioaccessibility of Phenolic and HMF Formation of Persimmon. LWT 2020, 118, 108830. [Google Scholar] [CrossRef]
  67. Calín-Sánchez, Á.; Lipan, L.; Cano-Lamadrid, M.; Kharaghani, A.; Masztalerz, K.; Carbonell-Barrachina, Á.A.; Figiel, A. Comparison of Traditional and Novel Drying Techniques and Its Effect on Quality of Fruits, Vegetables and Aromatic Herbs. Foods 2020, 9, 1261. [Google Scholar] [CrossRef]
  68. Ekow, E. Microwave-Vacuum Drying Effect on Drying Kinetics, Lycopene and Ascorbic Acid Content of Tomato Slices. J. Stored Prod. Postharvest Res. 2013, 4, 11–22. [Google Scholar] [CrossRef]
  69. Doymaz, İ. Air-Drying Characteristics of Tomatoes. J. Food Eng. 2007, 78, 1291–1297. [Google Scholar] [CrossRef]
  70. Zogzas, N.P.; Maroulis, Z.B.; Marinos-Kouris, D. Moisture Diffusivity Data Compilation in Foodstuffs. Dry. Technol. 1996, 14, 2225–2253. [Google Scholar] [CrossRef]
  71. Maskan, M. Microwave/Air and Microwave Finish Drying of Banana. J. Food Eng. 2000, 44, 71–78. [Google Scholar] [CrossRef]
  72. Soysal, Y.; Öztekin, S.; Eren, Ö. Microwave Drying of Parsley: Modelling, Kinetics, and Energy Aspects. Biosyst. Eng. 2006, 93, 403–413. [Google Scholar] [CrossRef]
  73. Bozkir, H.; Tekgül, Y.; Erten, E.S. Effects of Tray Drying, Vacuum Infrared Drying, and Vacuum Microwave Drying Techniques on Quality Characteristics and Aroma Profile of Orange Peels. J. Food Process Eng. 2021, 44, e13611. [Google Scholar] [CrossRef]
  74. Midilli, A.; Kucuk, H.; Yapar, Z. A New Model for Single-Layer Drying. Dry. Technol. 2002, 20, 1503–1513. [Google Scholar] [CrossRef]
Figure 1. Schematic diagram of the vacuum microwave dryer used in this study (created with BioRender.com by Latif, S. (2026), and further modified by the authors).
Applsci 16 03530 g001
Figure 2. Three-dimensional response surface plots showing the effects of temperature and microwave power on drying rate (DR) in panel (a), rehydration capacity in panel (b), and b* value in panel (c) at a constant slice thickness.
Applsci 16 03530 g002
Figure 3. Three-dimensional response surface plots showing the effects of temperature and air speed on drying rate (DR) in panel (a), rehydration capacity in panel (b), and b* value in panel (c) at a constant slice thickness.
Applsci 16 03530 g003
Figure 4. Comparison of nine different quality parameters of fresh and dried orange slices obtained by VMD and conventional HAD. In each graph, column 1 corresponds to fresh samples, column 2 to vacuum microwave-dried samples, and column 3 to HAD-dried samples. Comparison of quality parameters of fresh and dried orange slices: (a) rehydration capacity, (b) pH, (c) titration acidity, (d) moisture, (e) water activity, (f) total phenolic compounds, (g) carotenoids, (h) antioxidant activity, and (i) HMF. Different letters above bars indicate statistically significant differences among treatments within each parameter (p < 0.05).
Applsci 16 03530 g004
Figure 5. SEM micrographs of orange pulp tissue sampled from slices dried under optimized conditions by hot air drying (HAD) and vacuum microwave drying (VMD), illustrating a compact microstructure in HAD and a porous internal structure in VMD (500× magnification).
Applsci 16 03530 g005
Figure 6. Hierarchical clustering and heat map of phenolic compounds in fresh, VMD, and HAD treated orange samples.
Applsci 16 03530 g006
Figure 7. (a) Carotenoid content and (b) organic acid content in orange slices. In each graph, column 1 represents fresh samples, column 2 VMD-dried samples, and column 3 HAD-dried samples. Different letters above bars indicate statistically significant differences among treatments for each individual compound (p < 0.05).
Applsci 16 03530 g007
Figure 8. Variation of DR, MC, and MR of Washington Navel orange slices as a function of drying time under VMD and HAD conditions. Panels (a,c,e) represent VMD, whereas panels (b,d,f) represent HAD.
Applsci 16 03530 g008
Table 1. RSM-Based Drying Performance Analysis of Washington Navel Orange Slices in a Vacuum Microwave Dryer.
Sample (1)Factor 1Factor 2Factor 3Response 1Response 2Response 3
A: Power
(kW)
B: Temperature
(°C)
C: Slice Thickness
(mm)
Drying Rate (DR)
(kg H2O/kg h)
Rehydration Capacity
(g/g)
b* Value
VM137043.9684.20943.991
VM226044.3214.30042.454
VM327027.6344.88841.567
VM436062.2204.05139.315
VM547064.3324.22543.593
VM636028.2984.72943.733
VM748047.3374.07436.842
VM837044.4654.07143.887
VM937044.4344.10041.373
VM1037044.8774.11238.211
VM1127064.2623.89940.547
VM1246045.7354.31645.553
VM1328045.5674.26041.009
VM1437046.4024.00741.637
VM1538064.1913.81347.791
VM1638029.4824.85733.410
VM17470213.3594.69335.549
(1) VM = Sample code.
Table 2. Comparison of Experimental and Predicted Values Obtained Under Optimal Drying Conditions in the VMD for Washington Navel Oranges.
ResponsesExperimental DataPredicted Data
Drying Rate (DR)11.988 ± 0.37912.042
Rehydration Capacity4.736 ± 0.1054.734
b* color value43.767 ± 0.36044.326
Table 3. RSM-Based Drying Performance Analysis of Washington Navel Orange Slices in a Hot Air Dryer.
Sample (1)Factor 1Factor 2Factor 3Response 1Response 2Response 3
A: Air Speed
(m/s)
B: Temperature
(°C)
C: Slice Thickness
(mm)
Drying Rate (DR)
(kg H2O/kg dry matter h)
Rehydration Capacity (g/g)b* Value
TK12.07064.1020.89040.760
TK21.56024.5952.26332.285
TK31.58024.6062.61235.927
TK 41.57044.4371.26839.663
TK 52.06044.0770.94435.726
TK 61.06044.3000.63134.540
TK 71.57044.6281.27440.183
TK 81.07024.4782.54733.695
TK 91.07064.1000.66640.179
TK 101.08043.9711.49138.745
TK 111.57044.3851.24238.189
TK 122.07024.6852.14036.079
TK 131.57044.3601.15240.409
TK 141.56064.2220.66539.519
TK 152.08044.5931.37339.725
TK 161.57044.6301.21141.510
TK 171.58064.1411.19740.078
(1) TK = Sample code.
Table 4. Comparison of Experimental and Predicted Values Obtained Under Optimal Drying Conditions for Washington Navel Oranges in a HAD.
ResponsesExperimental DataPredicted Data
Drying Rate (DR)2.361 ± 0.0222.388
Rehydration Capacity4.566 ± 0.1594.685
b* Color Value40.117 ± 2.16737.357
Table 5. Sugar distribution in fresh and dried Washington Navel orange slices.
SugarsWashington Navel
Unprocessed
(Fresh)
VMDHAD
Glucose
(g/100 g dry matter)
15.53 ± 0.136 a16.37 ± 1.426 a16.54 ± 0.309 a
Fructose
(g/100 g dry matter)
14.47 ± 0.074 a15.62 ± 0.702 a15.29 ± 1.289 a
Sucrose
(g/100 g dry matter)
20.22 ± 0.012 a20.09 ± 1.896 a21.79 ± 1.397 a
Values with the same superscript letter are not significantly different (p > 0.05).
Table 6. Color values of fresh and dried Washington Navel orange slices using different drying methods.
Color ValuesWashington Navel
Untreated
(Fresh)
VMDHAD
L*55.32 ± 0.914 b82.43 ± 0.657 a82.09 ± 0.734 a
a*4.77 ± 0.842 a1.90 ± 0.314 b1.66 ± 0.703 b
b*42.49 ± 1.382 b40.18 ± 1.470 b54.01 ± 1.381 a
Delta e 27.42 ± 0.693 b29.37 ± 0.520 a
Delta c 3.85 ± 1.046 b11.96 ± 1.231 a
hue83.58 ± 1.119 c87.30 ± 0.448 b88.24 ± 0.707 a
The averages in the same row and indicated by different letters (a, b, and c) show statistically significant differences between values at a significance level of p < 0.05.
Disclaimer/Publisher’s Note: The statements, opinions and data contained in all publications are solely those of the individual author(s) and contributor(s) and not of MDPI and/or the editor(s). MDPI and/or the editor(s) disclaim responsibility for any injury to people or property resulting from any ideas, methods, instructions or products referred to in the content.