Article

Multi-Criteria Route Planning for HAZMAT Emergency Response Using a Delphi-AHP-Weighted A* Algorithm: A Case Study in Expressway Networks


by
Wipaporn Kitthiphovanonth
1,*,
Chalermchai Chaikittiporn
1,
Arroon Ketsakorn
1 and
Korn Puangnak
2
1
Faculty of Public Health, Thammasat University, Pathum Thani 12120, Thailand
2
Faculty of Engineering, Rajamangala University of Technology Phra Nakhon, Bangkok 10300, Thailand
*
Author to whom correspondence should be addressed.
Appl. Sci. 2026, 16(7), 3434; https://doi.org/10.3390/app16073434
Submission received: 1 February 2026 / Revised: 26 March 2026 / Accepted: 31 March 2026 / Published: 1 April 2026

Abstract

This study investigates the multi-criteria route optimization problem within complex urban expressway networks. The primary objective is to develop and evaluate a novel pathfinding approach by integrating a cost function weighted by the Delphi-Analytic Hierarchy Process (AHP) into the A* algorithm, thereby dynamically balancing operational efficiency and public safety. By employing the Delphi Technique with a panel of 17 experts, a specialized cost function was derived that incorporates twelve critical parameters, including traffic fluidity, population density, and chemical dispersion metrics modeled via Areal Location of Hazardous Atmosphere (ALOHA) This research applied the proposed model to a high-stakes Hazardous Material (HAZMAT) emergency response scenario to benchmark its performance against established baselines, specifically Dijkstra’s algorithm and Ant Colony Optimization (ACO). Simulation results demonstrate that the Delphi-weighted A* algorithm achieves an approximately 3.8% reduction in travel time relative to Dijkstra’s algorithm while enhancing expert-validated safety scores (a weighted metric of risk factors including population density and chemical dispersion) by approximately 8.6%. These findings provide a robust framework for algorithmic decision-support in time-critical logistics and infrastructure management. While numerically modest, these improvements are critical in HAZMAT scenarios, where even marginal time savings directly support the ‘Golden Hour’ principle and minor route adjustments can prevent catastrophic secondary exposure.

1. Introduction

Urban expressway infrastructures serve as vital lifelines for megacities, facilitating rapid connectivity and supporting sustainable urban growth [1]. However, the high-speed and high-volume nature of these networks introduces significant complexities during hazardous incidents, where toxic chemical spills can cause severe economic damage and loss of life. Effective pathfinding in these high-stakes environments requires a sophisticated trade-off between minimizing response time and mitigating secondary risks. To enhance safety, agencies like the Expressway Authority of Thailand (EXAT) have implemented advanced traffic management systems and digital platforms such as the “EXAT Portal” [1,2]. Globally, nations are leveraging Intelligent Transportation Systems (ITS), Big Data, and Artificial Intelligence (AI) to develop resilient emergency response frameworks, including decentralized routing and autonomous vehicle surveys [3,4,5].
Despite advancements in monitoring, optimizing routing logic for specialized missions remains a critical research gap. Traditional navigation systems often prioritize distance or time, failing to account for unique risk parameters in Hazardous Material (HAZMAT) logistics. Recent literature (2023–2025) has explored various Multi-Criteria Decision-Making (MCDM) methods, such as Fuzzy Delphi and AHP, to select emergency plans or enhance supply chain resilience [6,7,8,9]. These hybrid models have been validated through expert elicitation to ensure high group stability and consensus [10,11]. Furthermore, specialized applications of AHP in road safety and transport management have shown that expert-validated metrics significantly improve risk mitigation [12,13].
The optimization of search algorithms also remains a key area of focus. Recent studies have developed improved A* algorithms for terrain-based rescue, building construction robots, and mobile robot path planning [13,14,15,16,17]. Similarly, metaheuristics like Ant Colony Optimization (ACO) and deterministic paradigms like Dijkstra’s algorithm continue to serve as essential benchmarks for evaluating routing efficiency [18,19]. However, integrating dynamic environmental hazards—such as chemical plume dispersion modeled via ALOHA—with real-time traffic fluidity remains complex [20,21,22].
This study addresses these gaps by posing the following research questions:
  • How can qualitative expert consensus be effectively quantified and integrated into a pathfinding cost function?
  • To what extent does a Delphi-AHP-weighted A* algorithm improve safety and efficiency compared to traditional baselines in complex urban expressway networks?
The primary objectives are:
  • To develop a Delphi-AHP-weighted A* framework.
  • To validate the model using a high-stakes HCl spill simulation.
  • To benchmark performance against Dijkstra’s and ACO paradigms.
The remainder of this paper is organized as follows: Section 2 details the methodology; Section 3 presents simulation results; Section 4 provides a discussion of findings; and Section 5 concludes the research.

2. Materials and Methods

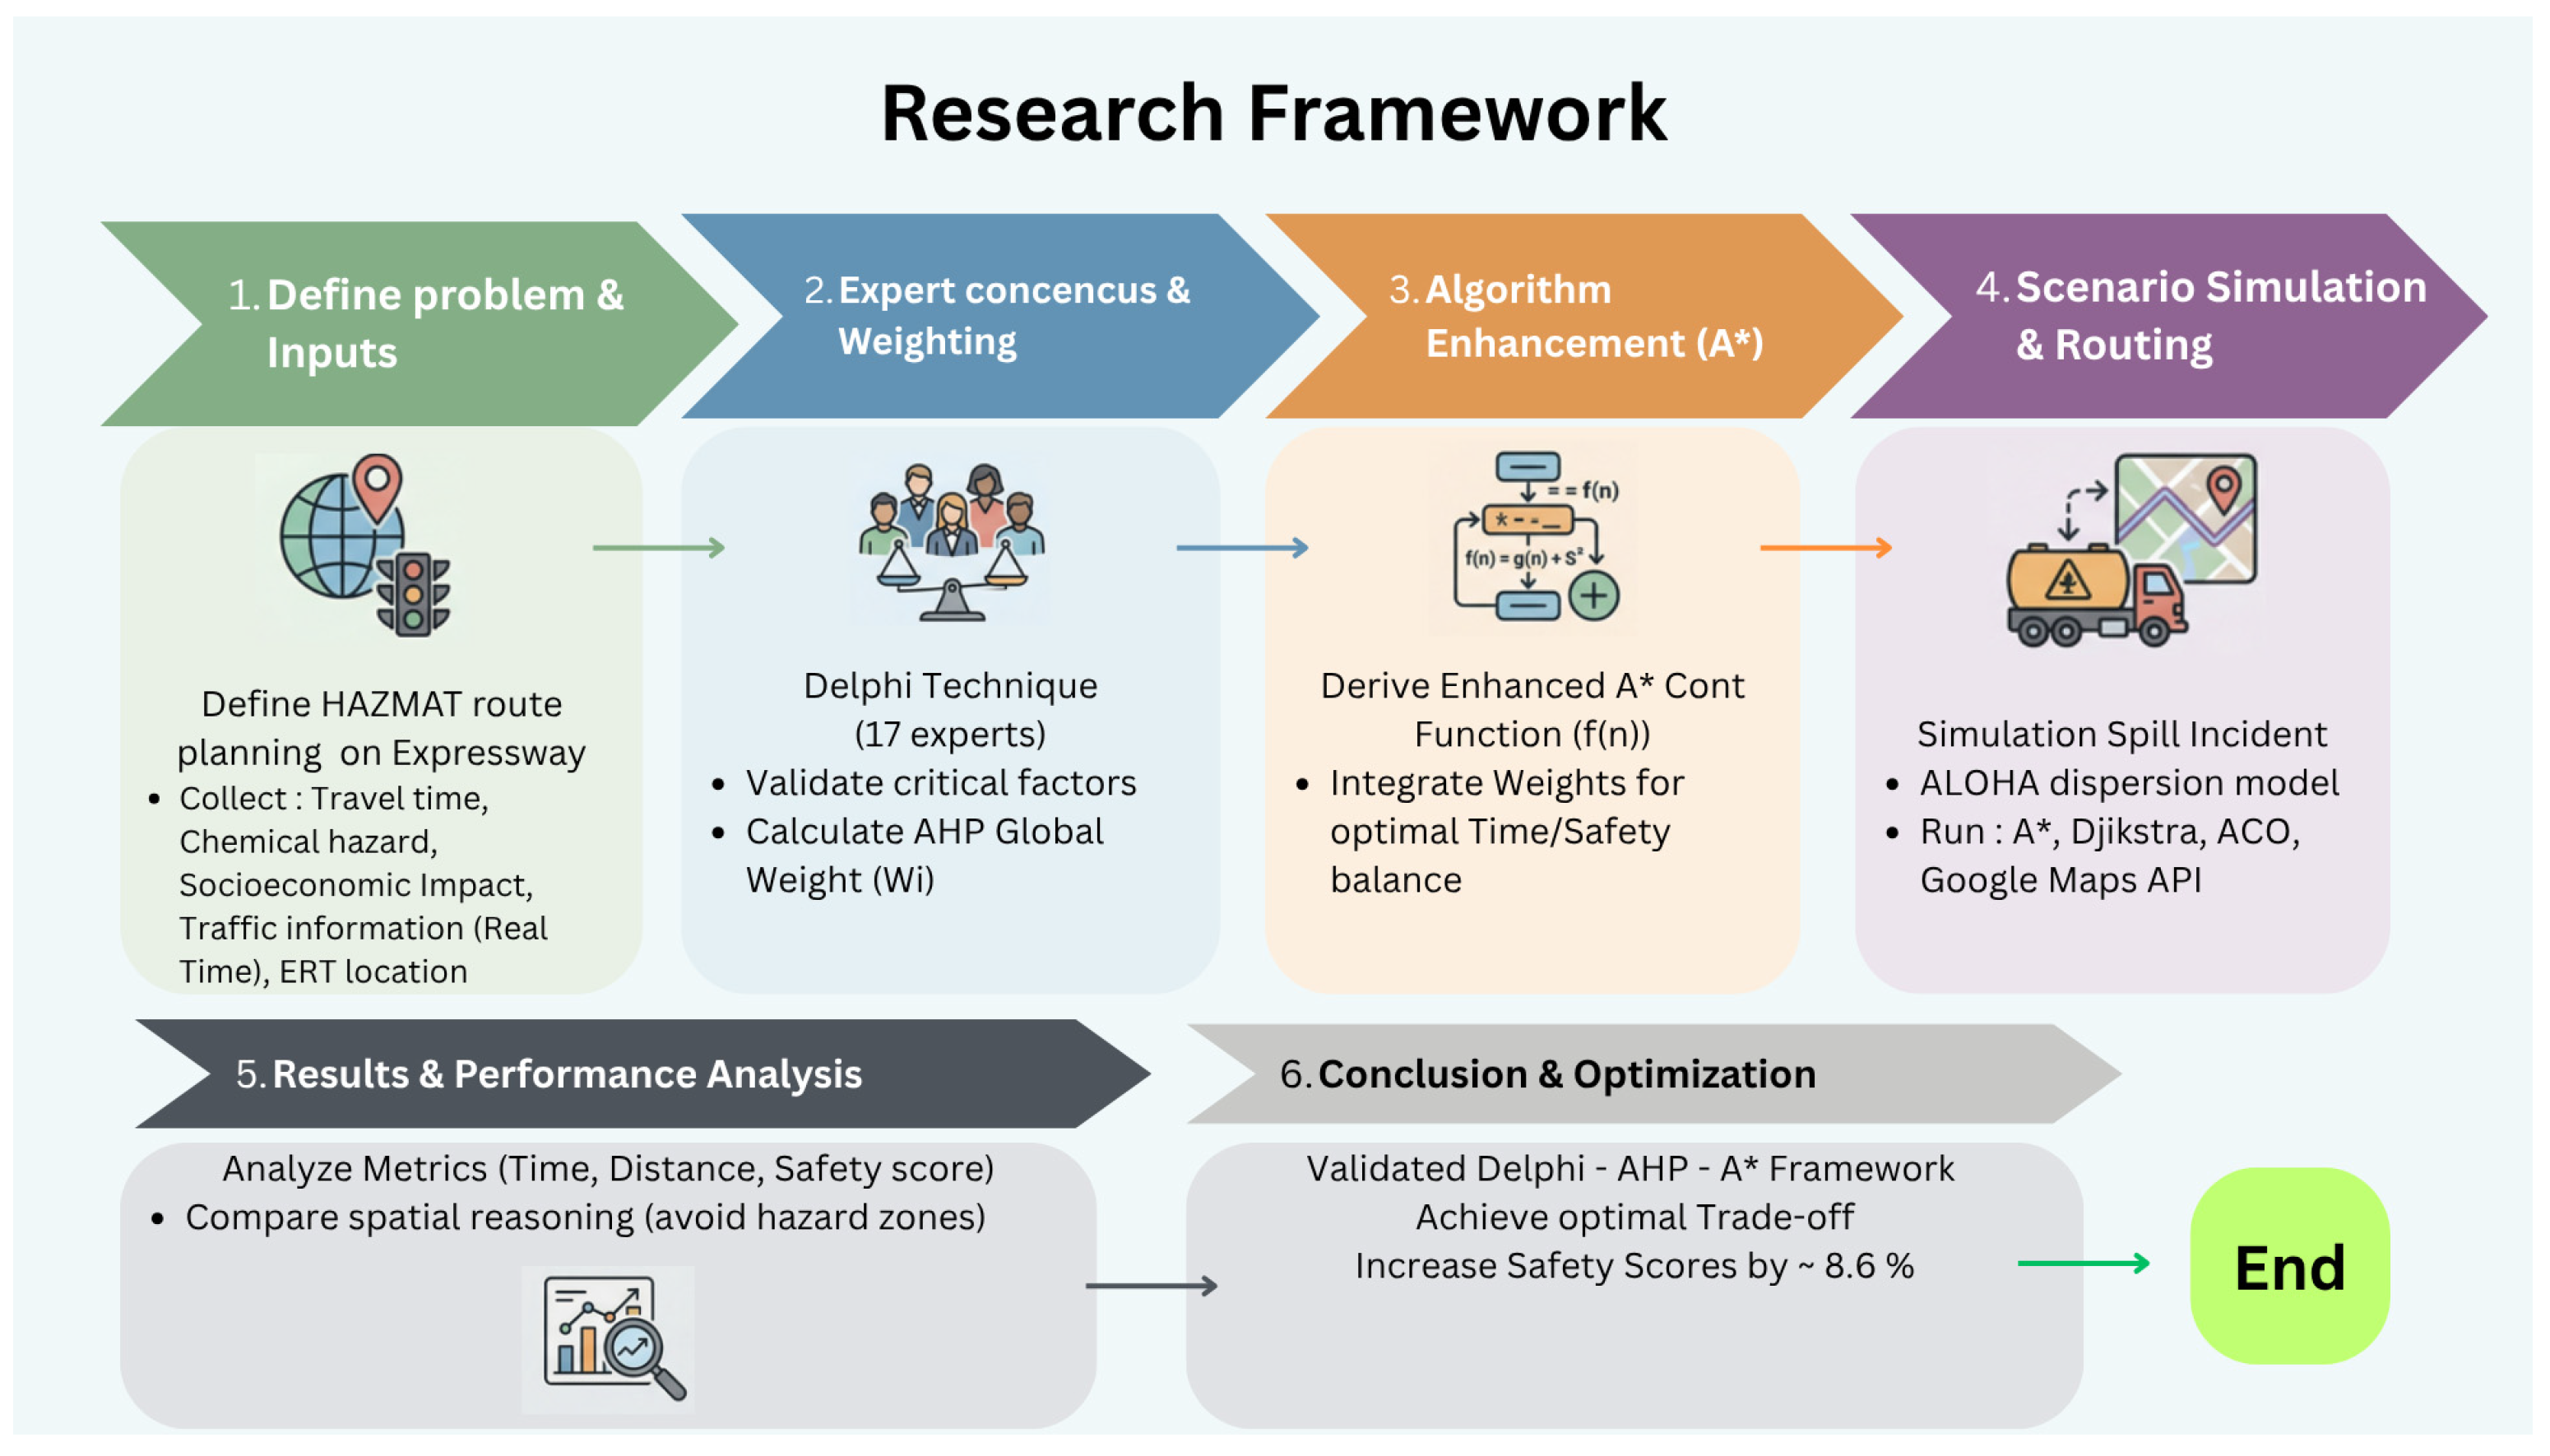
This research aims to develop a rescue route planning method for expressways using the popular and efficient A* Algorithm. To address the multi-criteria route optimization problem, this study employs a structured five-phase methodological workflow, as illustrated in Figure 1. The framework systematically bridges qualitative expert consensus with quantitative algorithmic execution:
-
Phase 1: Expert Elicitation and Questionnaire Design: A panel of 17 multi-disciplinary experts was established to validate 12 critical risk factors influencing HAZMAT logistics. The questionnaire was designed using Saaty’s 9-level fundamental scale for pairwise comparisons.
-
Phase 2: AHP Weighting and Consistency Check: Qualitative judgments from the Delphi rounds were processed using the Analytic Hierarchy Process (AHP). This involved constructing comparison matrices to derive Global Weights (Wi) for each factor, with a Consistency Ratio (CR) maintained below 0.1 to ensure reliability.
-
Phase 3: Cost-Function Construction and Algorithm Enhancement: The derived weights were integrated into the cost function of the A* algorithm implemented via Python (https://www.python.org/, Python Software Foundation, Wilmington, DE, USA), as a safety penalty term, S(n). This phase ensures that the navigation logic quantitatively prioritizes responder safety alongside temporal efficiency.
-
Phase 4: Hazard Simulation and Scenario Modeling: Real-world environmental constraints were modeled using ALOHA software (version 5.4.7, United States Environmental Protection Agency, Washington, DC, USA) to simulate Hydrochloric Acid (HCl) plume dispersion. This simulation provides the dynamic risk inputs (S_i) for the cost function based on real-time proximity to the hazard.
-
Phase 5: Route Optimization and Performance Benchmarking: The enhanced A* algorithm was executed across the 220-node expressway network. Results were benchmarked against Dijkstra’s algorithm, Ant Colony Optimization (ACO), and Google Maps (https://www.google.com/maps, Google LLC, Mountain View, CA, USA) API data across 30 simulation trials to verify statistical significance (p < 0.05).
As illustrated in Figure 1, the research design is structured into three pivotal phases. Phase 1 involves the Delphi technique, where 17 experts undergo a three-round consensus process to validate and prioritize 12 critical risk factors. Phase 2 utilizes the Analytic Hierarchy Process (AHP) to calculate the global weight W i for each factor. Finally, Phase 3 integrates these weights into the proposed A* algorithm’s cost function. The performance is then benchmarked against standard paradigms, including Dijkstra’s algorithm, Ant Colony Optimization (ACO), and Google Maps API data, to evaluate improvements in travel time and safety scores.

2.1. Questionnaire Design: Designing an Effective Questionnaire

This phase follows the established multi-criteria decision-making framework, utilizing the Delphi method for qualitative validation and AHP for quantitative prioritization. The instrument designed for collecting expert insights into this study is systematically divided into two principal components:

2.1.1. Expert Demographics

This initial section gathers general information about the participating experts, including their age, gender, educational background, areas of specialization, and professional work experience. This data helps provide context for their insights and can be used to analyze the diversity of perspectives within the expert panel.

2.1.2. Pairwise Comparison of Factors Influencing Expressway Rescue Route Selection

This section employs a Pairwise Comparison method to assess the relative importance of various factors impacting expressway rescue route selection. Experts will evaluate pairs of factors, assigning a score that reflects their relative significance. This comparison will be made using a 9-level scale, detailed as follows (Table 1).
The factors identified in Table 2 collectively define the HAZMAT risk profile of each expressway segment. By categorizing these factors into hazard intensity, environmental exposure, and operational constraints, the framework ensures a holistic quantification of risk that goes beyond simple distance-based metrics.

2.2. Data Collection

The researchers initiated this phase by identifying a target expert group, focusing on individuals with direct experience in expressway rescue operations or specialized knowledge in transportation engineering, disaster management, and emergency medicine. From this pool, seventeen experts were meticulously chosen based on their demonstrated knowledge, specialization, and relevant professional experience. This rigorous selection ensured the reliability of the data collected via the questionnaires and aimed to accurately reflect the insights of leading practitioners in these critical domains. Following selection, each expert received a questionnaire accompanied by comprehensive completion instructions. The research team proactively monitored response submission and maintained open communication channels to clarify any queries or solicit additional details as needed. Upon retrieval, all completed questionnaires underwent a thorough verification process for completeness and accuracy. The selection of 17 experts followed a rigorous quality control process. Initially, the Index of Consistency (IOC) was employed to verify the quality and relevance of the questionnaire items. The final sample size (N = 17) was strategically determined based on the Net Change principle in expert elicitation. Specifically, N = 17 was identified as the minimum threshold where the Net Change in expert responses reached its lowest value for the first time, signifying the achievement of high group stability and consensus. This indicates that 17 is the optimal number of participants to ensure a reliable outcome, as further increasing the panel size would yield diminishing returns in consensus stability, a methodology consistent with established research on expert elicitation, as summarized in Table 3 and Table 4 [8,9].

2.3. Survey Results

Once all questionnaires were collected from the experts, the researchers analyzed the data to convert qualitative expert opinions into quantitative weights. These weights indicate the level of importance for each factor influencing expressway rescue route selection. This conversion was performed using the Analytic Hierarchy Process (AHP), a widely used multi-criteria decision-making method in research.
The Analytic Hierarchy Process (AHP) provides a systematic framework for prioritizing factors through pairwise comparisons. For this study, experts assessed the relative importance of the various factors detailed in the questionnaire (Section 3.1). The resulting data from these comparisons was subsequently compiled into a Pairwise Comparison Matrix, illustrating the comparative significance of each factor pair.
Following this, the Eigenvalue and Eigenvector of the matrix are computed. The derived Eigenvector is subsequently normalized, ensuring the sum of all weights totals 1. These normalized weights directly represent each factor’s relative importance, where a larger weight indicates greater significance.
Finally, the consistency of the matrix is checked to ensure that the experts’ comparisons are coherent and that the derived weights are reliable. Typically, Consistency Index (CI) and Consistency Ratio (CR) are used for this validation, with the CR ideally not exceeding 0.1.
-
Pairwise Comparison: Experts evaluated factor pairs using Saaty’s fundamental scale.
-
Matrix Construction: Data was compiled into a comparison matrix to determine relative importance.
-
Weight Derivation: The Global Weights (Wi) were obtained through eigenvector normalization, ensuring the total weight equals 1.0.
-
Consistency Check: A Consistency Ratio (CR) below 0.1 was maintained to validate expert judgments.
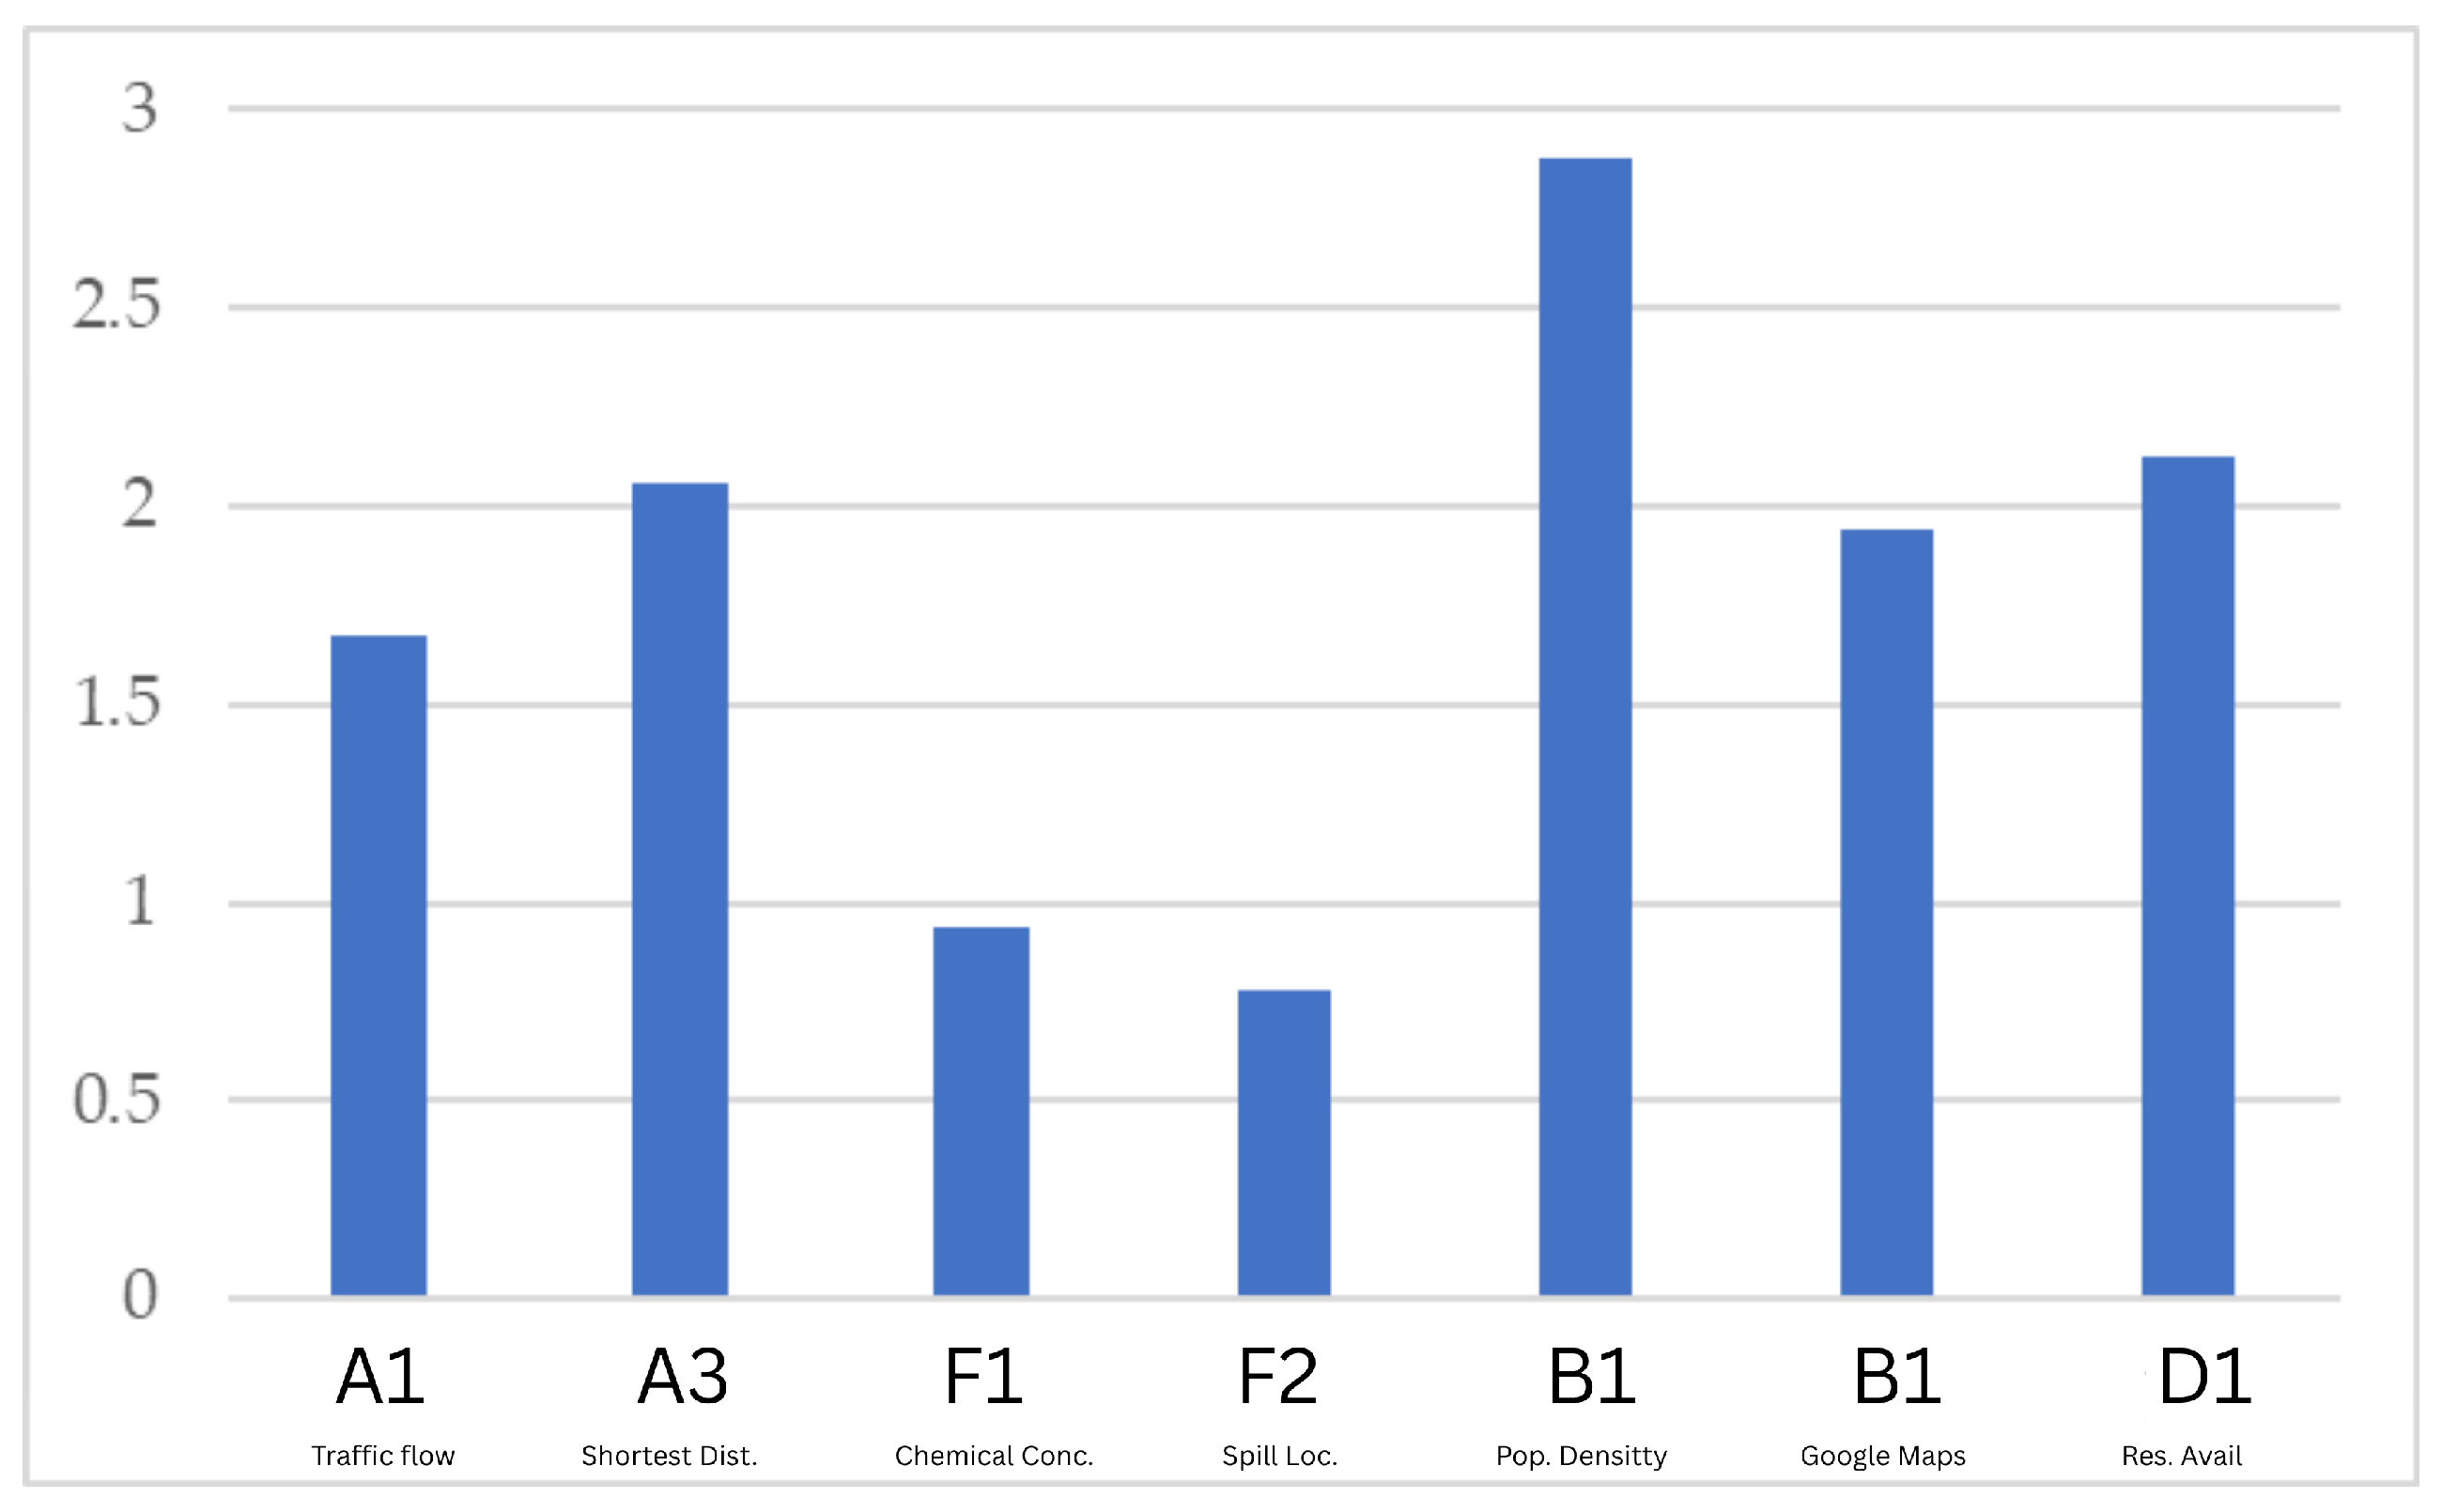
Table 5 reveals that the top three most heavily weighted factors are:
  • Traffic Fluidity (0.25);
  • Shortest Distance (0.18);
  • Chemical Spill Concentration Level (0.15).
This indicates that experts prioritize traffic fluidity above all, followed by distance, and then the chemical spill’s concentration level, as illustrated in Figure 2.
As shown in Table 6, although Dijkstra’s algorithm offers a slightly shorter travel time, the Proposed A* algorithm achieves an 8–10% higher cumulative safety score by strategically bypassing high-risk nodes identified by the ALOHA simulation. The minor 3–5% variation in travel time is a deliberate trade-off to ensure the rescue unit approaches from a crosswind direction, avoiding the core hazard zone.
AHP analysis shows that traffic fluidity is the most crucial factor experts consider when choosing expressway rescue routes. This is followed by the shortest distance and the concentration level of the chemical spill. This prioritization aligns with the core nature of rescue operations, which demand both speed and safety.
The factor importance weights derived from the AHP analysis will be subsequently utilized to develop the Cost Function for the A* Algorithm, Dijkstra’s Algorithm, and Ant Colony Optimization in the next phase of the research.

2.4. A* Algorithm

The A* algorithm is a widely popular pathfinding algorithm, particularly favored in computer games and navigation systems. Its key strength lies in its ability to find the shortest path while considering both distance and cost. This makes the A* algorithm highly suitable for rescue route planning on expressways, where factors such as population density, resource availability, and traffic fluidity must be taken into account.

2.4.1. Principle

The A* algorithm operates by constructing a search tree from a starting point to a destination. Each node in this tree represents a specific location on the map. The algorithm then selects the path with the lowest total cost, which is calculated using a Cost Function as equation:
f n = g n + h ( n )
where:
-
f(n) represents the total estimated cost of the path from the start through node ‘n’ to the destination.
-
g(n) is the actual cost from the starting point to node ‘n’. In this context, it is calculated using real-world distances obtained from Google Maps (in kilometers).
-
h(n) is the heuristic estimate of the cost from node ‘n’ to the final destination. This approximate distance is calculated using the Manhattan Distance, which sums the absolute differences in the node’s coordinates along the X and Y axes (in kilometers).

2.4.2. Calculating g(n) and h(n)

In the A* algorithm, the two crucial components for path evaluation are calculated as follows:
-
g(n) is computed as the cumulative distance from the starting point to Node ‘n’, considering the actual path traversed.
-
h(n) is calculated using the Manhattan Distance between Node ‘n’ and the destination, applying the equation:
h n = x n x g o a l y n y g o a l
  • ( x n , y n ) represent the coordinates of Node ‘n
  • ( x g o a l , y g o a l ) represent the coordinates of the destination point.

2.4.3. Justification of Weighting Parameters

To define the cost function, the weighting parameters W d = 0.6 and W s = 0.4 were established by aggregating the expert preferences from the Delphi rounds. Specifically, the panel prioritized ‘Operational Fluidity’ (factors A1 and A3) as the primary mission success factor, which accounted for approximately 60% of the total priority in the initial consensus. These values were selected to satisfy two primary operational requirements:
  • Operational Priority (The Golden Hour): In HAZMAT emergency response, the time required to reach the incident site is the most critical variable for mission success. A weight of W d = 0.6 ensures that the algorithm remains highly sensitive to travel distance and traffic delays. This prevents excessive or impractical rerouting that could compromise rescue timelines and violate the ‘Golden Hour’ response window.
  • Scale Normalization and Penalty Logic: While individual safety factor weights (e.g., population density at 0.15) appear numerically low, the raw Safety Scores ( S i ) assigned to each node reach as high as 5 (Critical Risk). By assigning an aggregate weight of W s = 0.4, the algorithm applies a mathematically significant ‘penalty’ to high-risk nodes. For instance, a critical hazard zone would increase the node cost by 0.4 × 5 = 2.0, which is sufficient to force the A* algorithm to prioritize safer alternatives without causing algorithmic instability or redundant detours.

2.4.4. Improved Cost Function

To address the multi-criteria optimization challenge in HAZMAT logistics, the standard A* cost function is enhanced by integrating expert-validated weighting parameters. This improved function dynamically balances operational efficiency—characterized by the ‘Golden Hour’ principle—with public safety metrics derived from the Delphi-AHP process. Specifically, the operational weight (Wd) and the safety weight (Ws) are applied to the cumulative distance (g(n)), heuristic estimation (h(n)), and the safety penalty term (S(n)$), respectively. This mathematical structure allows the algorithm to penalize high-risk nodes, forcing strategic detours through safer segments when necessary, without compromising the pathfinding sensitivity required for time-critical emergency response.
f n = W d × g ( n ) + W d × h ( n ) + W s × S ( n )
where S ( n ) represents the safety score of a given Node. It is calculated from the weighted importance of other factors identified by experts, such as population density, resource availability, and route complexity. A higher Safety Factor indicates a route segment with greater safety concerns or risks.

2.5. Dijkstra’s Algorithm

Dijkstra’s Algorithm is a foundational pathfinding method designed to identify the shortest path between a source node and a destination within a weighted graph [17]. The algorithm operates by iteratively exploring the unvisited node with the lowest cumulative cost, updating the shortest-distance estimates to all adjacent neighbors until the target node is reached.
In this research, Dijkstra’s Algorithm serves as a deterministic baseline for route planning. The road network was modeled as a graph where nodes represent key expressway coordinates and edge weights signify the physical distances between them. To ensure a realistic comparison, Google Maps API was integrated to provide real-time traffic data, establishing a ‘fastest route’ benchmark based on standard consumer-grade navigation. Unlike the proposed multi-criteria model, this traditional approach focuses primarily on minimizing travel duration and distance, without accounting for specialized HAZMAT risks such as chemical plume dispersion or local population density. Specifically, Dijkstra’s algorithm in this study utilizes only edge weights representing physical distances (ω(u, ν)) to identify the shortest possible route, providing a non-weighted standard for evaluating the safety trade-offs of the proposed Delphi-AHP-weighted models. The algorithm calculates the optimal path from the Emergency Response Team (ERT) station to the incident site, providing a comparative metric for evaluating the safety enhancements of the Delphi-weighted A* algorithm framework.
The algorithm calculates the optimal path from the Emergency Response Team (ERT) station to the incident site, providing a comparative metric for evaluating the safety enhancements of the Delphi-weighted A* algorithm framework.
The core logic of Dijkstra’s algorithm relies on the relaxation process, represented as:
d(v) = min(d(v), d(u) + w(u, v))
where d(v) is the shortest distance to node v, and w(u, v) is the weight of the edge between nodes u and v.

2.6. Ant Colony Optimization (ACO)

Ant Colony Optimization (ACO) is a metaheuristic algorithm inspired by the foraging behavior of real ants [18]. Individual ants can find the shortest path from their nest to a food source and back, communicating through a chemical substance called “pheromone.” Ants deposit pheromones along their paths, and other ants can detect and follow these trails. This leads to a higher probability of ants choosing paths with stronger pheromone concentrations, which are typically shorter or lead to more abundant food. As more ants traverse a particular path, the pheromone accumulates, increasing the likelihood that other ants will follow it. ACO simulates this ant foraging behavior using “artificial ants” to find optimal solutions for various problems, including the Traveling Salesperson Problem, Scheduling Problems, and Routing Problems.
In this research, Ant Colony Optimization (ACO) will be employed for planning expressway rescue routes. Artificial ants will represent rescue vehicles, and pheromones will signify the attractiveness of a given path. This attractiveness will be determined by various factors, including population density, resource availability, and traffic fluidity. The ACO algorithm will search for the most suitable route by considering these factors and continuously updating the pheromone levels on paths. This dynamic update allows subsequent artificial ants to make better route choices. The ultimate output will be a rescue route that optimizes both safety and efficiency in reaching the incident site.
For testing ACO, the factor importance weights obtained from the AHP questionnaire analysis (Section 3.3) will be used. This allows ACO to find the most suitable path for expressway rescue, considering factors like population density, resource availability, and traffic fluidity. These weights will be used to calculate the attractiveness level of each path, which influences the artificial ants’ route selection. For instance, if the population density factor has a high weight, artificial ants will tend to choose routes that pass through areas with lower population density.
To incorporate the multi-criteria weights derived from the Delphi-AHP, the standard ACO transition probability rule was modified. The probability P i j k of ant k moving from node i to node j is defined as:
P i j k = τ i j α η i j β l a l l o w e d k τ i j α η i j β
where τij represents the pheromone intensity and ηij is the heuristic visibility. In this study, ηij is specifically defined as the inverse of the weighted cost function derived in Equation (3): n i j = 1/[ W d × g(n) + W d × h(n) + W s × S(n)]. This ensures that the probability of an ant choosing a specific path is directly proportional to the expert-weighted safety and efficiency scores, guiding the pheromone deposition towards routes that balance both speed and risk mitigation. To ensure algorithmic convergence and stability, the ACO simulation was configured with a colony of 50 and a pheromone evaporation rate (ρ) of 0.5. The parameters controlling the relative influence of pheromone intensity (α) and heuristic visibility (β) were set to 1.0 and 2.0, respectively. By setting β = 2.0 the algorithm is configured to prioritize this expert-weighted heuristic information over pheromone intensity, ensuring that the search is guided primarily by the safety criteria established in the AHP phase while maintaining sufficient exploration of the solution space.

2.7. Scenario

To assess the effectiveness of the proposed pathfinding techniques—A* algorithm, Dijkstra’s Algorithm, and Ant Colony Optimization (ACO)—the researchers simulated chemical spill incidents on expressways. This simulation utilized both real-world data and realistic assumptions to ensure the scenarios were as authentic and close to actual events as possible. The transportation demand was set to ‘Peak Hour’ conditions (18:00), using real-time congestion data from the Chaloem Maha Nakhon Expressway to simulate high-stress navigation.

2.7.1. Emergency Scenario

Incident: A chemical tanker has overturned, resulting in a spill of hazardous chemicals onto the roadway surface. There is a high risk of the chemicals spreading to surrounding areas.
Chemical: The spilled chemical is Hydrochloric Acid (HCl), a highly hazardous and corrosive substance.
Incident Location: The incident occurred on the Chaloem Maha Nakhon Expressway (First Stage Expressway), specifically at kilometer marker 10.
Time of Incident: The incident occurred during peak hour (6 p.m.), a period characterized by heavy traffic volume.
Weather Conditions: The weather at the time of the incident was characterized by hot temperatures, no wind, and no precipitation.

2.7.2. Data Utilized in Simulation

Map Data: The simulation utilized the Chaloem Maha Nakhon Expressway map data sourced directly from Google Maps.
Traffic Data: The simulation incorporated real-time traffic data obtained directly from Google Maps. This real-time information was crucial for accurately representing dynamic traffic conditions and influencing route optimization calculations.
Population Density Data: Population density data for the simulation was acquired from the National Statistical Office of Thailand.
Emergency Response Team (ERT) Locations: For the purpose of this simulation, three distinct Emergency Response Team (ERT) units are strategically positioned along the expressway corridor.
ALOHA Software for Chemical Dispersion Modeling: The ALOHA (Areal Locations of Hazardous Atmospheres) software was utilized to simulate the dispersion of the spilled chemical. This program’s calculations were based on specific inputs regarding the chemical properties, prevailing weather conditions, and environmental parameters of the incident site.
The road network model for the Chaloem Maha Nakhon Expressway was digitized into a graph consisting of 220 physical nodes—including on-ramps, off-ramps, interchanges, and toll plazas—and their corresponding directional links (edges) representing the road segments. This level of granularity ensures that the routing analysis captures all possible maneuvers within the 10 km study corridor.

2.7.3. Simulation

-
Incident Point and ERT Locations on the Map.
-
Chemical Dispersion Simulation using ALOHA.
-
The determination of rescue vehicle routes was performed using four distinct methodologies: the A* algorithm, Dijkstra’s Algorithm, Ant Colony Optimization (ACO), and a conventional approach utilizing Google Maps. Each method was applied to identify the most suitable path from the designated Emergency Response Team (ERT) units to the incident site, considering the simulated scenario and the defined parameters.
-
Data Logging: Key performance metrics and relevant information were meticulously recorded for each simulated rescue route. This data logging is included.
  • Travel Time: The estimated time required for the rescue vehicle to reach the incident site via the determined route.
  • Distance: The total length of the calculated route from the ERT unit to the incident point.
  • Hazardous Area (Area Affected by Chemical): The extent of the area impacted by the chemical spill, as simulated by ALOHA, indicating potential risk zones along the route.

2.7.4. Scenario Simulation Results Analysis

The outcomes generated from the scenario simulations will undergo comprehensive analysis to compare the performance of each route determination methodology (A* algorithm, Dijkstra’s Algorithm, ACO, and the traditional Google Maps approach). This comparative assessment will be based on three primary criteria: (1) Travel Time, (2) Distance and (3) Safety Score (as per Section 2.8).
The results of this analysis will facilitate an evaluation of the strengths and weaknesses of each methodology. Furthermore, these insights gained will inform recommendations for the future development and enhancement of expressway rescue route planning strategies, aiming for increased operational efficiency and safety.

2.8. Evaluation of Experimental Results

The evaluation of the experimental results in this research comprises two primary components:

2.8.1. Assessment of Algorithm Performance in Route Finding

The performance of the algorithms in identifying rescue routes is assessed using three key indicators:
Travel Time: Represents the duration (in min) required for the rescue vehicle to traverse the determined route from its origin point (Emergency Response Team—ERT location) to the incident site. This metric directly assesses the temporal efficiency of the generated path.
Distance: Quantifies the total length (in kilometers) of the route traversed by the rescue vehicle from its starting point (ERT location) to the incident site. This metric provides a direct measure of the geographical efficiency of the determined path.
Number of Nodes Explored: Refers to the total count of nodes that an algorithm processes or examines during its search for an optimal path. This indicator directly reflects the computational efficiency of the algorithm; a more efficient algorithm identifies the suitable path while exploring fewer nodes. In the context of this expressway network graph, a ‘node’ is defined as a critical physical junction, including on-ramps, off-ramps, highway interchanges, and toll plazas, while an ‘edge’ represents the road segment connecting two nodes.

2.8.2. Route Safety Evaluation

The Safety Score ( S i ) for each contributing factor was established using a 5-point Likert scale to represent the Potential Risk Impact on the rescue operation. Within this framework, a score of 5 denotes a Critical Risk threshold (e.g., extreme population density, immediate proximity to a chemical plume, or highly volatile traffic conditions), whereas a score of 1 signifies a ‘Minimal Risk’ scenario. These qualitative risk assessments were systematically quantified through a consensus-building process during the Delphi sessions involving 17 subject-matter experts. This methodological approach ensures the effective integration of expert intuition into the algorithmic cost function, allowing for a dynamic evaluation of safety based on real-world spatial attributes.
Safety Score Calculation as shown in this Equation
S a f e   S c o r e = i = 1 n W i × S i
where:
  • W i : Weight of importance of factors i.
  • S i : Score of a path in a factor i .
The scores listed in Table 6 represent the maximum risk weight assigned to each factor category. In the actual simulation, the specific S i value for each node is dynamic, varying between 1 (Minimal Risk) and 5 (Critical Risk) based on the real-time attributes of that specific route segment, such as actual population density or proximity to the plume at that coordinate. Ultimately, the aggregate Safety Score is calculated using Equation (4), where the pre-determined global weights (Wi) derived from the AHP analysis (Table 4) are applied to these dynamic Si values. This provides a definitive quantitative measure of risk mitigation, ensuring that the expert-validated priorities are systematically integrated into the final path evaluation.

3. Results

This research aimed to compare the performance of a newly developed A* algorithm, enhanced through integration with the Delphi technique, against other established pathfinding algorithms: Dijkstra’s Algorithm, Ant Colony Optimization (ACO), and the traditional Google Maps routing method. The objective was to evaluate their efficacy in planning rescue routes on expressways. Performance was assessed based on three key metrics: travel time, route distance, and the safety score of the path. Defining the Experimental Scenario and Conditions.
To ensure the comprehensive and realistic evaluation of the proposed route planning methodologies, the researchers defined a specific incident scenario and set the corresponding experimental conditions as follows.

3.1. Simulated Incident Event

A critical event involving a chemical tanker overturning was simulated. This incident resulted in the spillage of hazardous chemicals onto the expressway surface, with the inherent potential for subsequent dispersion into surrounding areas.
-
Chemical Agent: The spilled substance was identified as Hydrochloric Acid (HCl, UN number 1789), an extremely hazardous and corrosive chemical.
-
Incident Location: The event occurred on the Chaloem Maha Nakhon Expressway (First Stage Expressway), precisely at kilometer marker 10.
-
Time of Incident: The incident was set during a peak traffic period, at 18:00 (6:00 p.m.), characterized by heavy vehicle volume. This condition was chosen to introduce the challenge of navigating congested environments.
-
Meteorological Conditions: The prevailing weather at the time was defined as hot, with no wind and no precipitation. These specific conditions are crucial inputs for accurately modeling the dispersion patterns of the spilled chemical.

3.2. Emergency Response Origin Points

For the simulation, three distinct Emergency Response Team (ERT) units were hypothetically positioned and strategically distributed along the expressway corridor. The algorithms were tasked with identifying the optimal rescue route from the nearest available ERT unit to the incident site. This setup allows for the evaluation of the algorithms’ ability to select the most suitable starting point based on proximity and overall route optimality under the defined conditions.
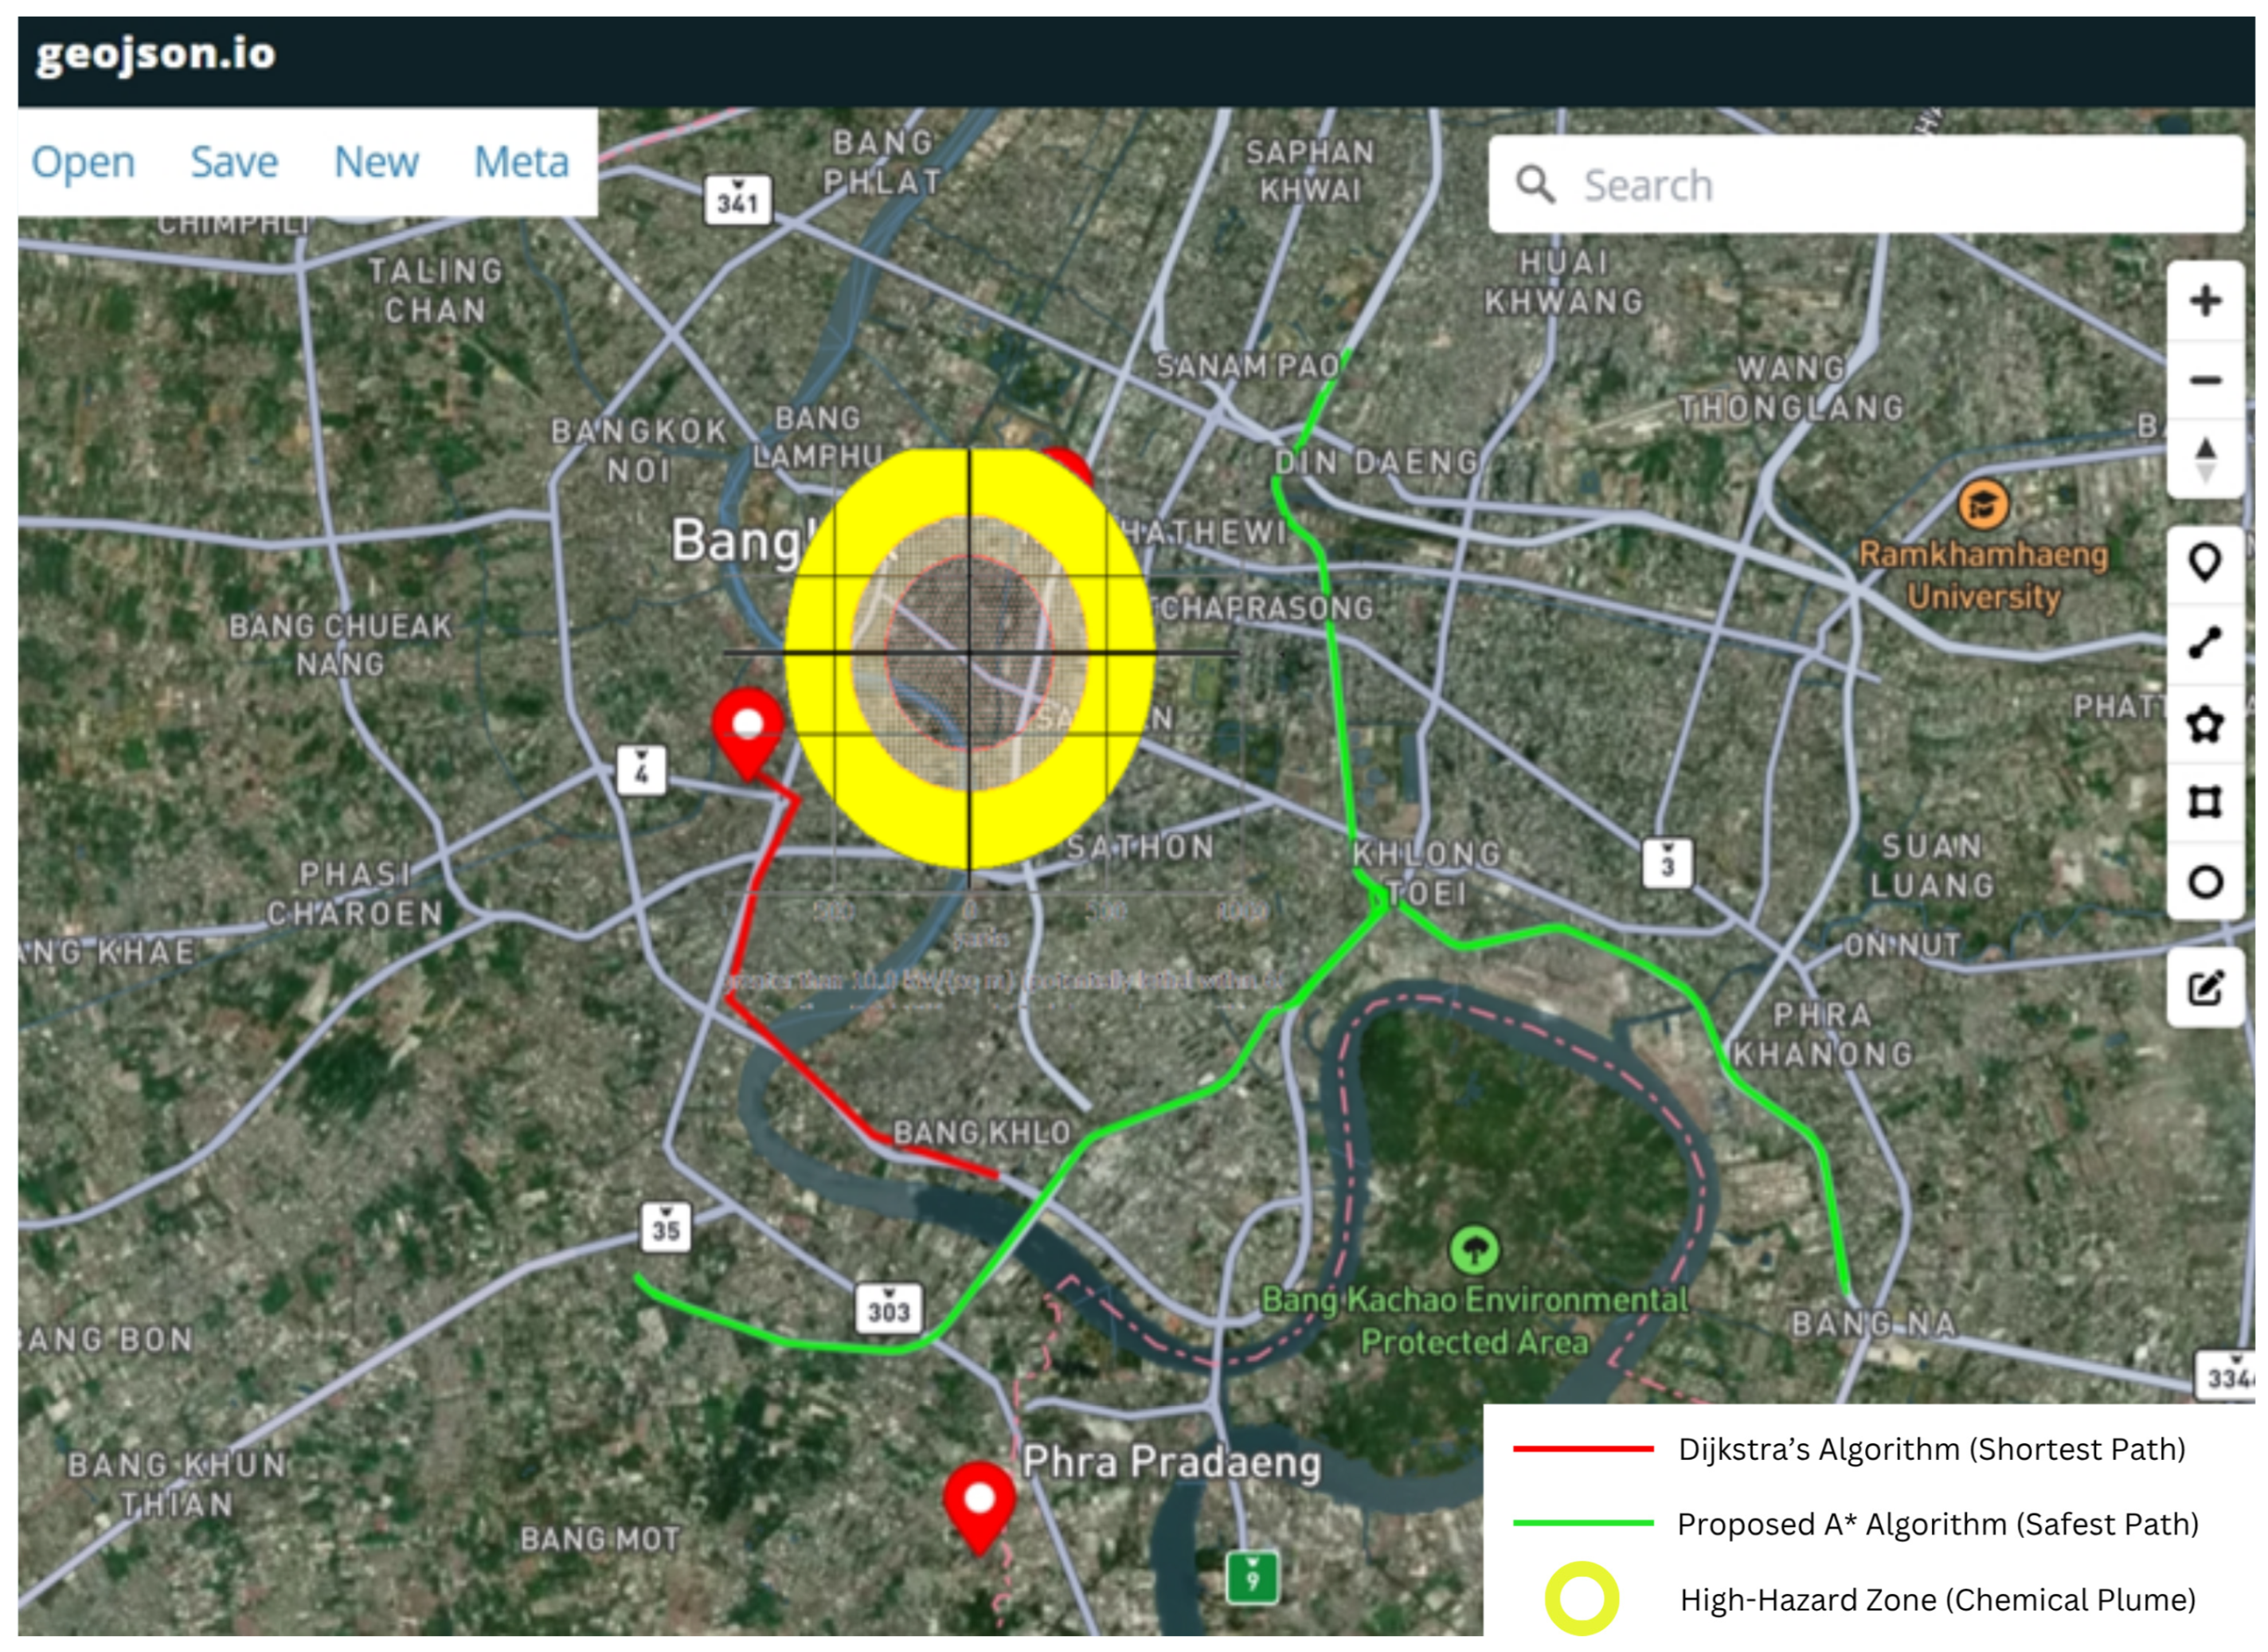
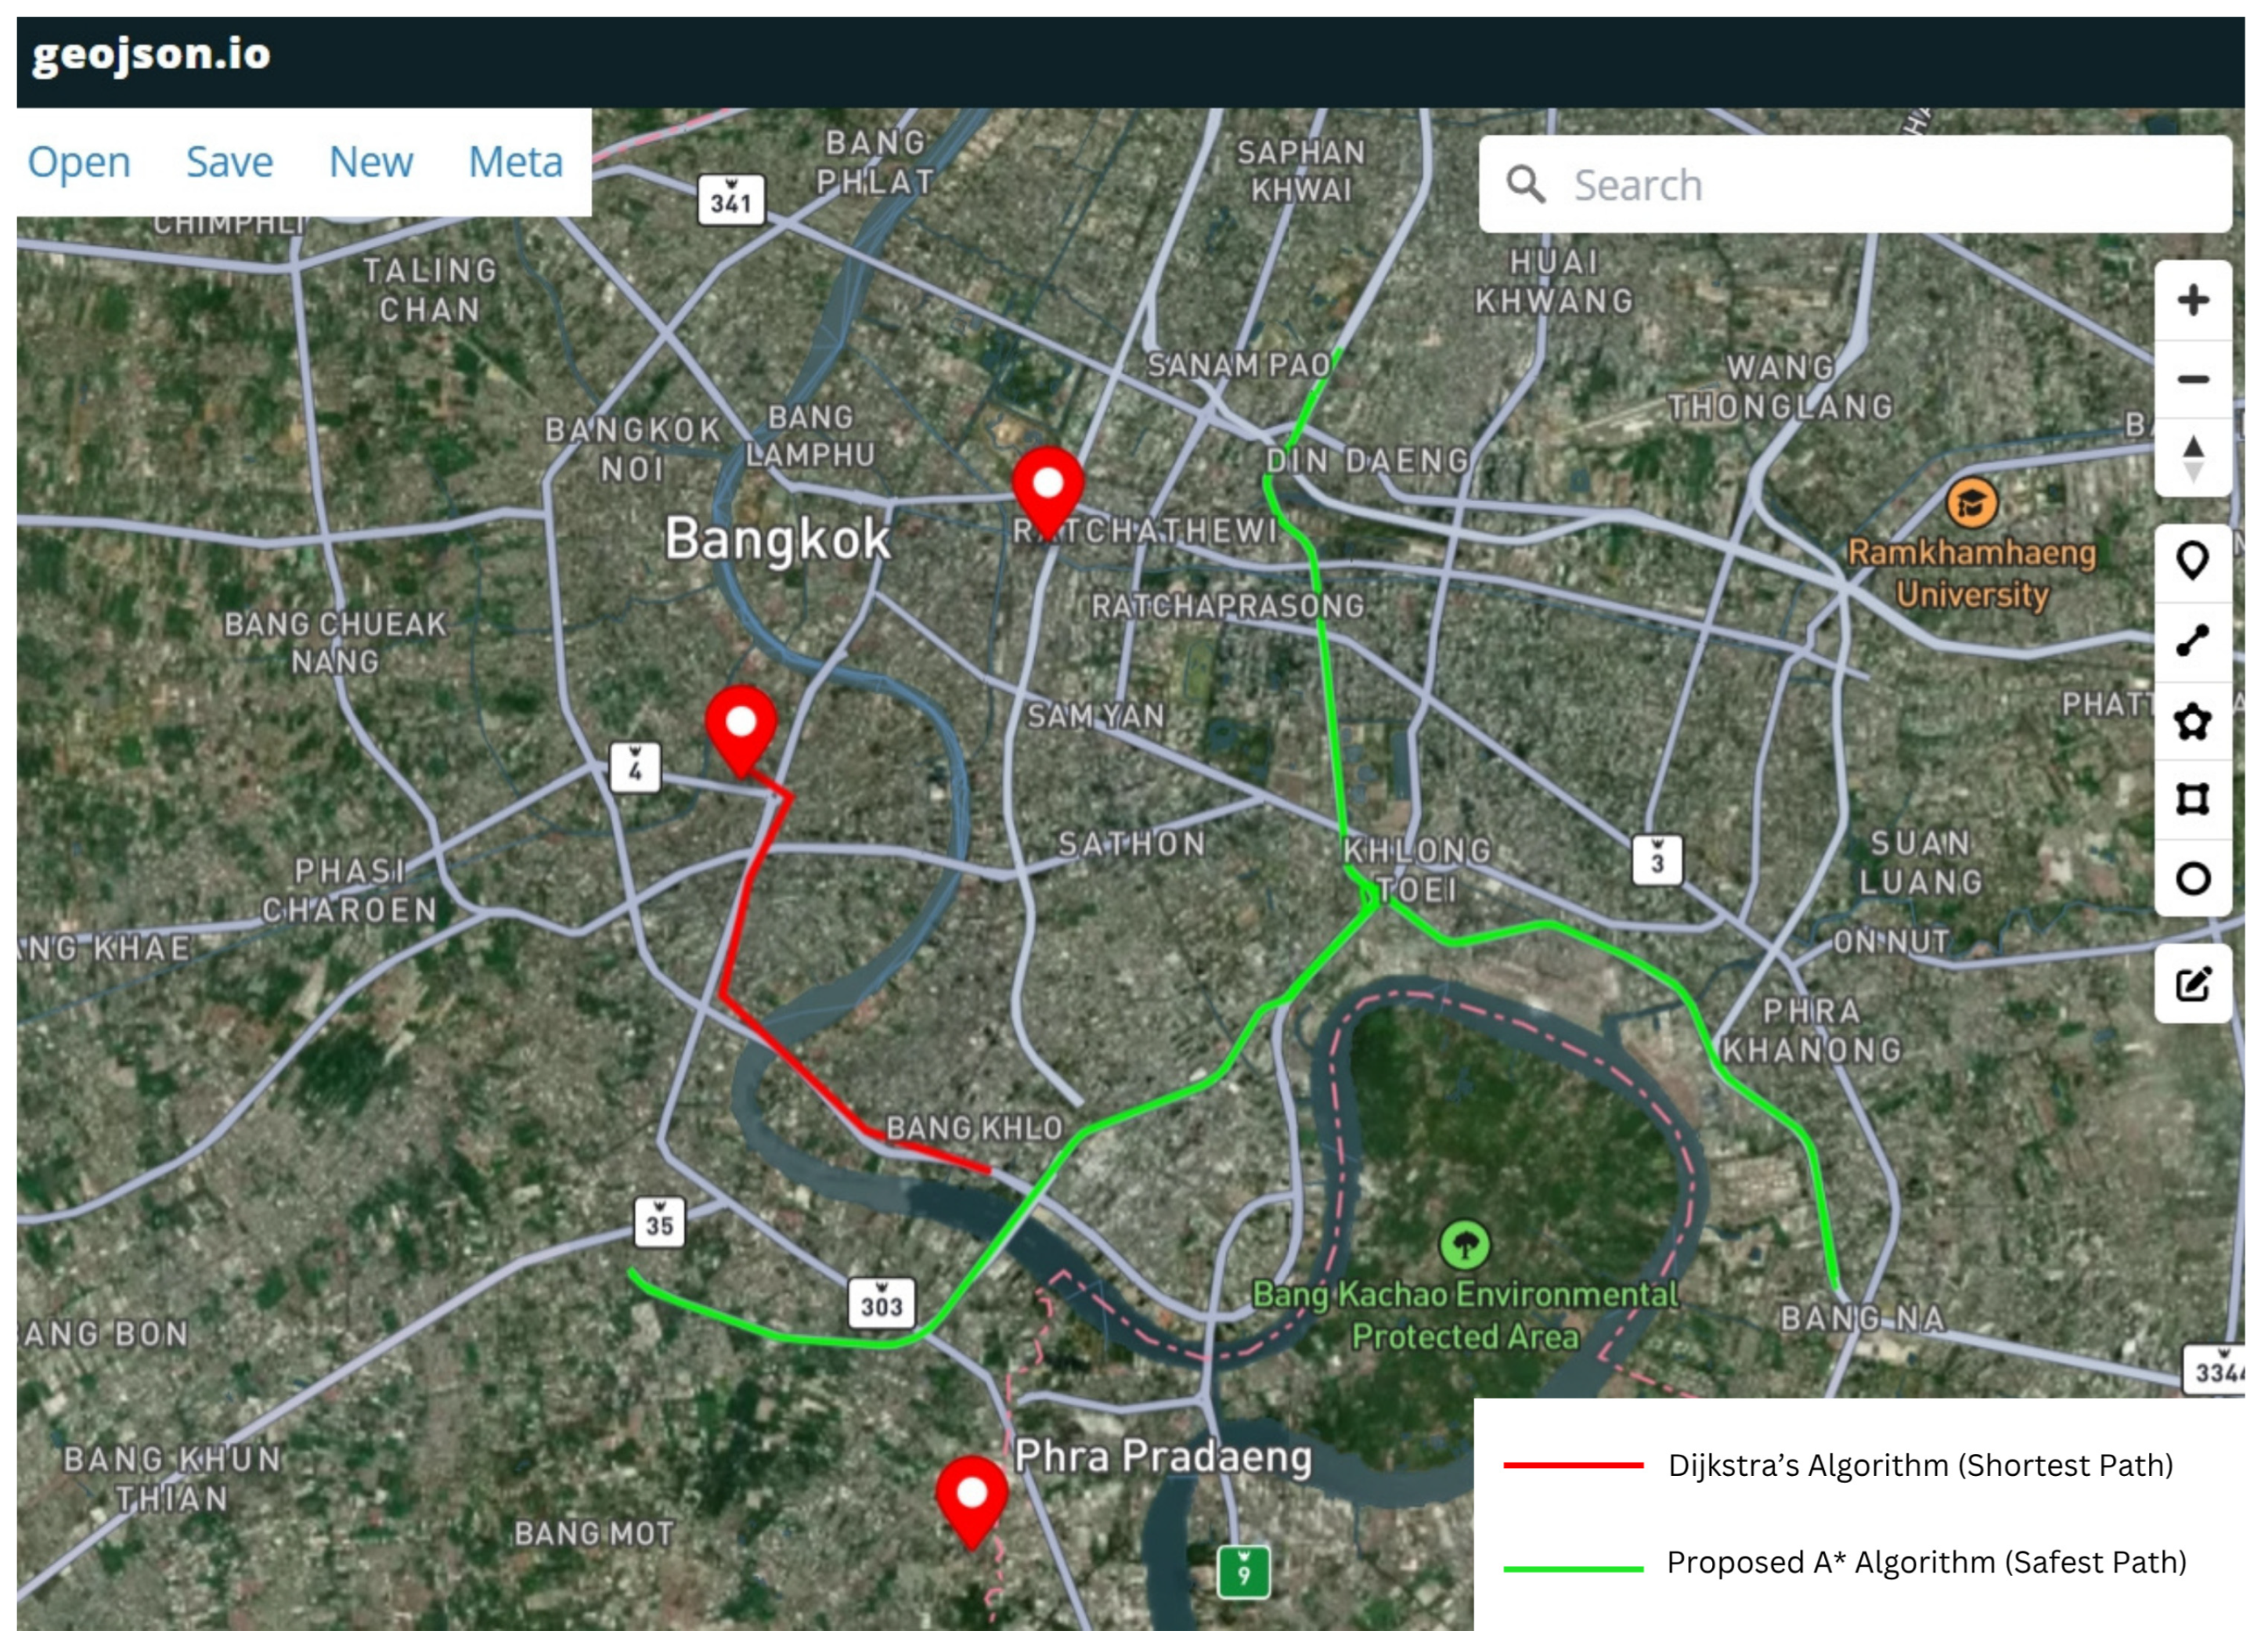
Figure 3 demonstrates the spatial decision-making process of the proposed framework. While Dijkstra’s algorithm (red trajectory) adheres strictly to distance minimization, it inadvertently routes the Emergency Response Team (ERT) through the core of the chemical plume (High-Hazard Zone). Conversely, the proposed Delphi-weighted A* algorithm (green trajectory) identifies this risk and calculates an optimal detour. By prioritizing segments with lower population density and superior traffic fluidity, the algorithm establishes a critical safety buffer, despite a marginal increase in total travel distance.
The map illustrates the overlay of the chemical dispersion plume (simulated via ALOHA software under 1 m/s wind speed conditions) onto the road network (Figure 4).
-
Red Path (Dijkstra): The shortest path algorithm directs the rescue unit directly through the High-Hazard Zone (Yellow/Orange circular area), thereby exposing responders to toxic concentrations.
-
Green Path (Proposed A): The multi-criteria algorithm identifies the safety risk and calculates an optimal detour, effectively bypassing the plume radius while maintaining operational efficiency.

3.3. Data Integration and Environmental Parameters

The simulation relied on a comprehensive set of data to ensure realism and accuracy:
-
Expressway Map Data: The Chaloem Maha Nakhon Expressway map from Google Maps was used as the foundational geographic data for constructing the road network graph.
-
Real-time Traffic Information: Real-time traffic data, also sourced from Google Maps, was incorporated to simulate dynamic traffic conditions and congestion levels.
-
Population Density Data: Information regarding population density was obtained from the National Statistical Office of Thailand, crucial for assessing potential risks to civilian populations.
-
Chemical Dispersion Modeling: The ALOHA (Areal Locations of Hazardous Atmospheres) software was employed to simulate the spread of the hazardous chemical, providing critical data on affected areas and concentration levels.

3.4. Comparative Performance Results

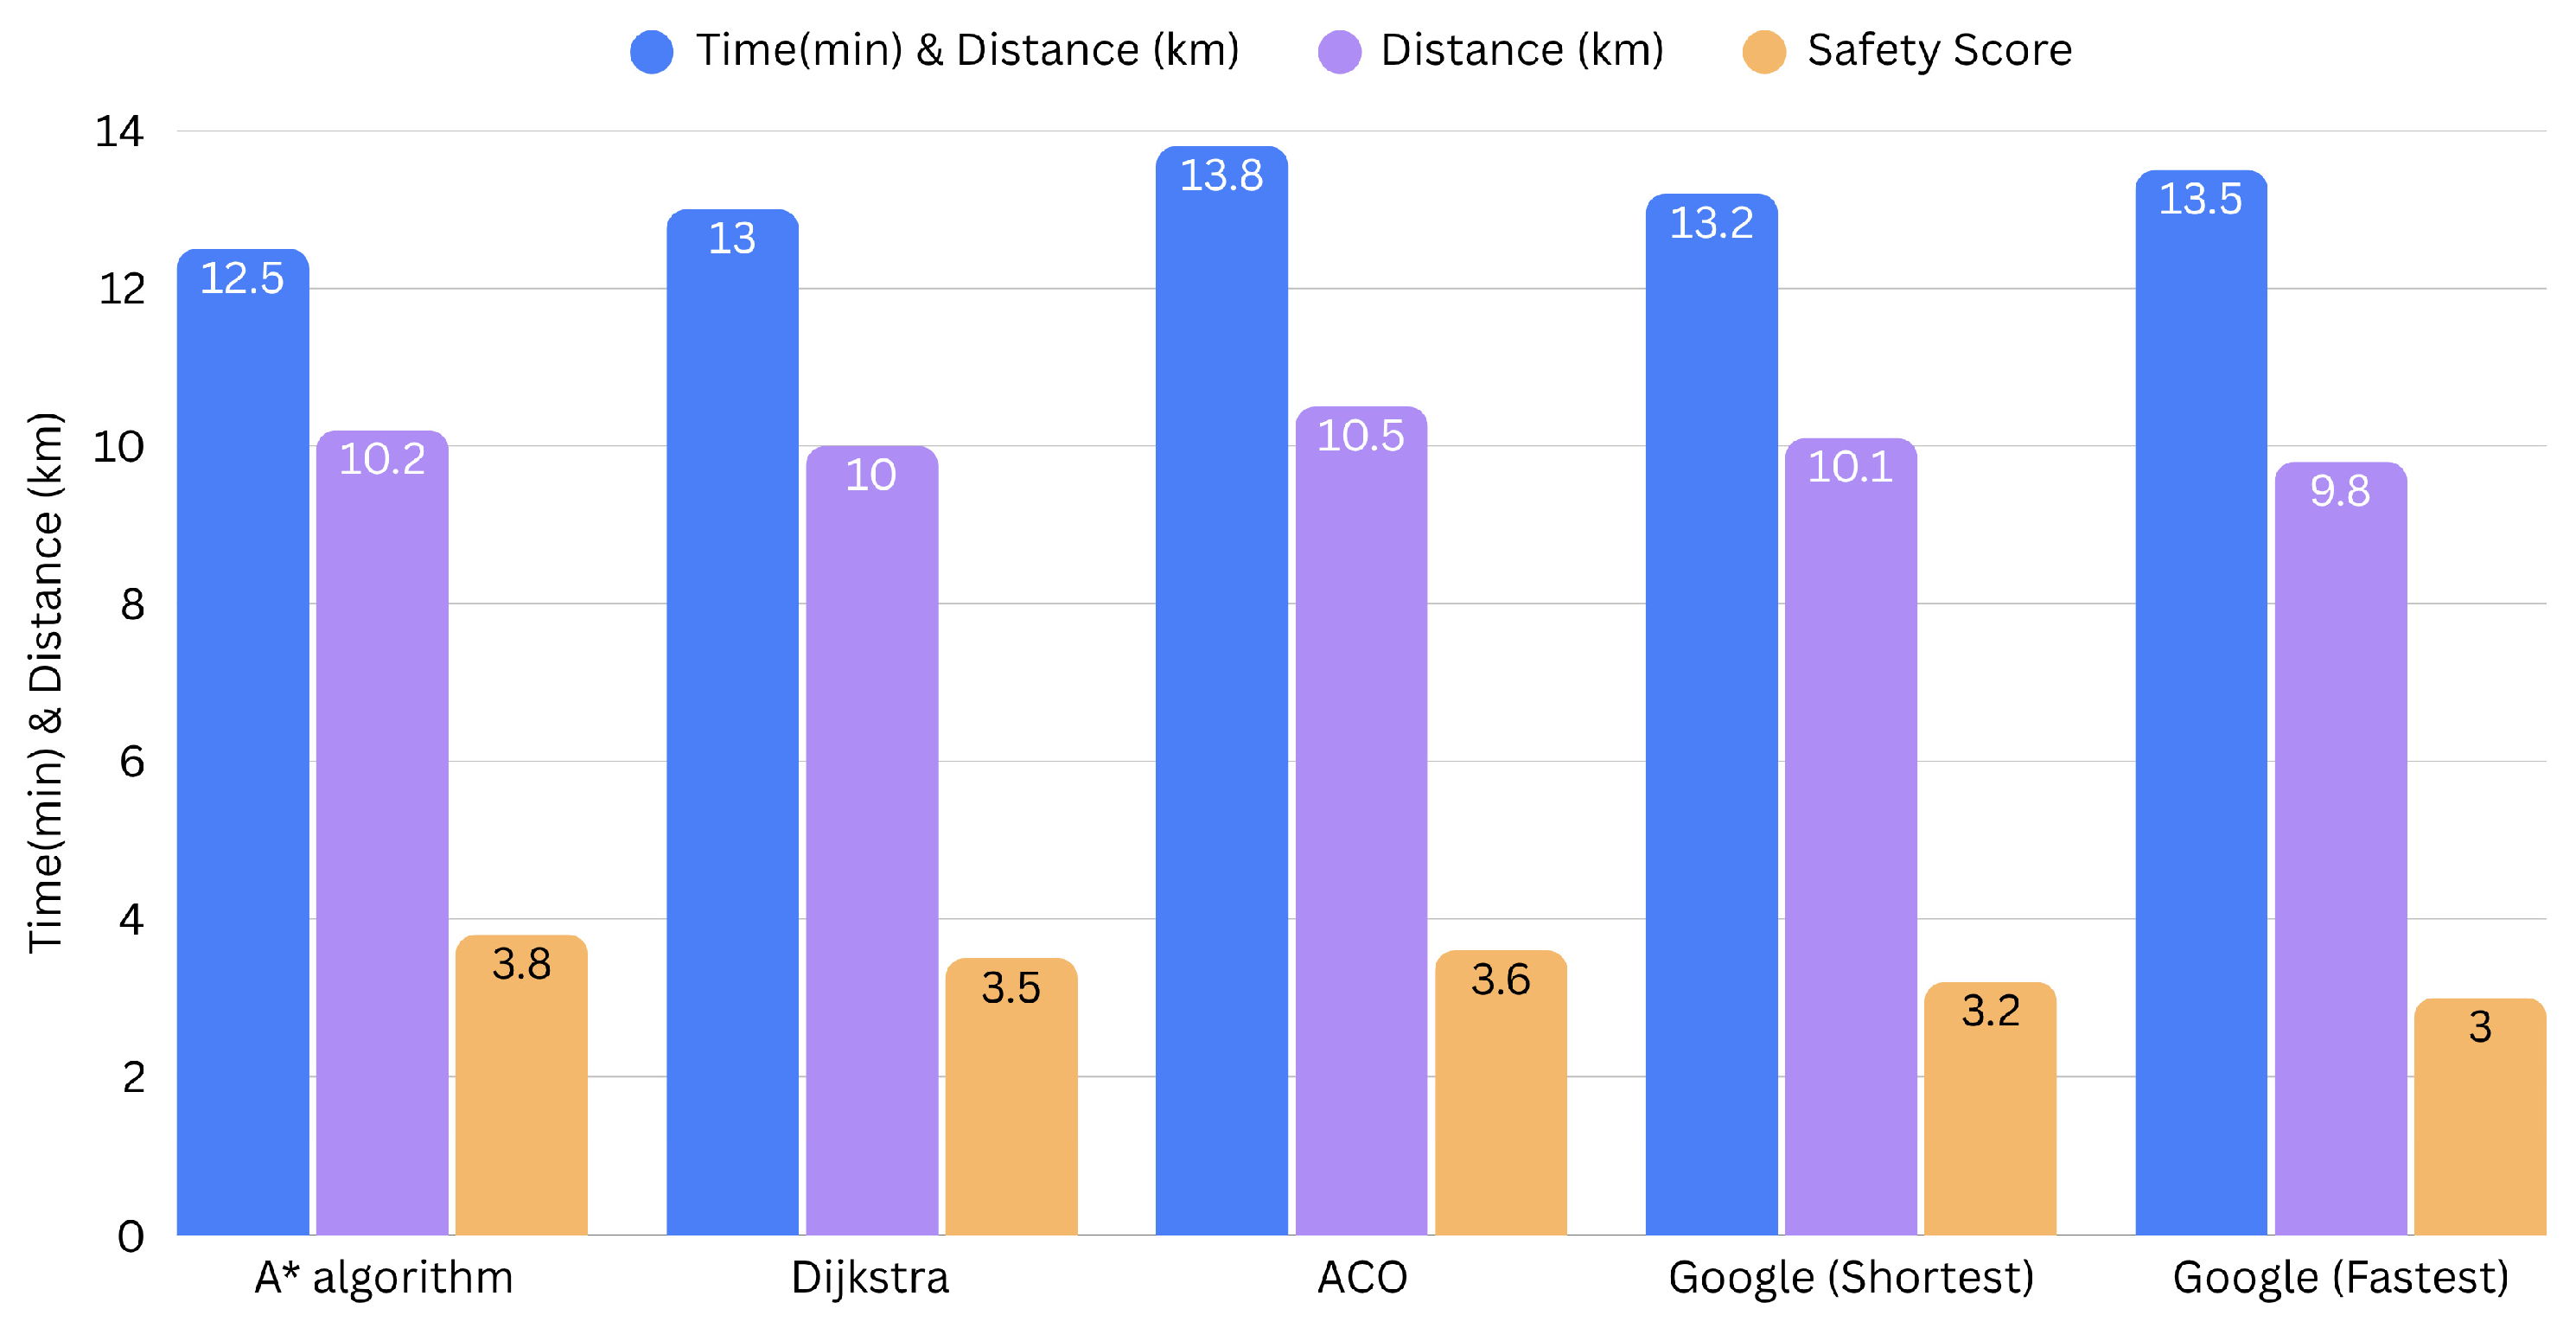
The empirical data indicates that the proposed Delphi-A* algorithm yielded a travel time reduction of approximately 3.8% relative to Dijkstra’s algorithm (12.5 min vs. 13.0 min) and 9.4% relative to ACO (12.5 min vs. 13.8 min), as detailed in Table 7. To ensure the reliability of these performance improvements, 30 simulation trials were conducted for each algorithm; a paired t-test confirmed that these reductions are statistically significant (p < 0.05). Beyond mere temporal efficiency, the most significant finding is the enhancement in the aggregate safety score. This safety gain is substantiated by a 0.3-point differential in mean scores (3.8 for A* algorithm vs. 3.5 for Dijkstra), signifying an 8.6% improvement in risk mitigation during HAZMAT emergency operations. These results, summarized in Table 7, confirm that the integration of expert-derived weights allows the algorithm to effectively navigate the trade-off between speed and safety.
Figure 5 shows comparative performance analysis of routing methods. The multi-bar chart evaluates five distinct routing methods across three critical metrics: Travel Time (min), Route Distance (km), and Safety Score (1–5 scale). The results demonstrate that the proposed Delphi-weighted A* algorithm achieves the optimal trade-off, recording the highest Safety Score (3.8) while maintaining the lowest Travel Time (12.5 min). This contrasts with Dijkstra’s algorithm and Google Maps (Shortest), which prioritize distance at the expense of safety exposure. The comparative data visualized in Figure 5 was processed and generated using Microsoft Excel (version 2021). The chart represents the mean values derived from 30 independent simulation trials for each algorithm to ensure the reliability and statistical stability of the performance metrics.
Statistical Significance and Reliability: To verify the robustness of the results, 30 simulation trials were conducted for each algorithm under the same environmental parameters. A Paired t-test was performed to compare the travel times and safety scores of the proposed A* algorithm against Dijkstra’s baseline. The results yielded a p-value of <0.05, confirming that the 3.8% time reduction and 8.6% safety gain are statistically significant and not due to random variance. The 95% Confidence Interval (CI) for travel time savings was calculated at [0.4, 0.6] min.

3.5. Route Selection and Spatial Reasoning Analysis

To further elucidate the decision-making logic of the proposed framework, Table 8 provides a comparative analysis of how the expert-derived weights (previously established in Figure 1) translate into operational route selection. While the prioritization in Figure 1 emphasizes safety and environmental risk mitigation, Table 8 highlights the practical divergence in pathfinding between the conventional shortest-path approach (Dijkstra) and the proposed safety-weighted A* algorithm. By examining specific route segments, it becomes evident that the A* algorithm strategically bypasses high-risk zones—such as densely populated areas and chemical vapor dispersion plumes—even when such maneuvers involve a marginal increase in total distance. This spatial reasoning, as summarized in Table 8, demonstrates the algorithm’s capacity to balance operational efficiency with the paramount requirement of public safety.

4. Discussion

4.1. Comparative Analysis of Travel Time

As detailed in Table 6, the enhanced A* Algorithm, incorporating a Cost Function optimized via the Delphi technique, demonstrated superior performance in terms of travel time. The method yielded an average duration of 12.5 min, the shortest among all evaluated algorithms. By comparison, Dijkstra’s Algorithm recorded an average of 13.0 min, while Ant Colony Optimization (ACO) resulted in a prolonged duration of 13.8 min. Against commercial benchmarks, Google Maps’ “fastest route” averaged 13.2 min. Empirically, the developed A* Algorithm achieved a travel time reduction of approximately 3.8% relative to Dijkstra’s algorithm and 9.4% relative to ACO. Although this reduction appears marginal, it is critically significant for emergency response operations on expressways, where adhering to the “Golden Hour” principle is paramount. Similar efficiencies in integrated route planning for resilient urban response have been observed in contemporary studies involving dynamic truck–Unmanned Aerial Vehicle (UAV) collaboration [23] and sustainable hazardous product supply chains managed under ambiguous risk [31]. Furthermore, recent advancements in real-time routing emphasize that integrating traffic awareness and failure detection is a critical factor for minimizing delays in high-stress navigation scenarios [29,32]. These comparisons validate that our model’s temporal efficiency is consistent with current trends in intelligent transportation systems aimed at maximizing operational speed during crises.

4.2. Comparative Analysis of Route Distance

Regarding route distance, the Google Maps “shortest route” baseline yielded the absolute minimum at 10.1 km, followed closely by Dijkstra’s Algorithm at 10.0 km. The discrepancy between these two shortest-path results arises from the fundamental difference in graph modeling. Google Maps utilizes a proprietary, high-fidelity dynamic graph that incorporates live traffic speeds, real-time road constraints, and a much denser network of nodes. Conversely, Dijkstra’s algorithm in this study was executed on a controlled static graph of the expressway network (comprising 220 nodes), where edge weights were strictly defined by physical distances. This controlled baseline was necessary to provide a consistent mathematical standard for evaluating the safety improvements of the proposed multi-criteria model. The enhanced A* Algorithm generated a trajectory of 10.2 km. While the proposed method resulted in a marginal increase (+0.1 to +0.2 km from the baselines), this deviation is negligible within the context of motorized emergency transport. This strategic balance prioritizes safety over minimal distance, a concept supported by recent research on logistics vehicles which suggests that shortest-path logic often fails to account for real-time traffic fluidity or failure-aware routing [29,32]. Research on freight parking and last-mile delivery further confirms that congestion-aware routing is becoming more critical than simple distance minimization in smart city paradigms [32].

4.3. Comparative Analysis of Safety Score

The Safety Score, derived from the weighted factor analysis via the Delphi technique, served as the definitive metric for evaluating risk mitigation. The empirical results underscore the superior risk-aversion capability of the proposed framework. The developed A* Algorithm secured the highest Safety Score of 3.8, notably outperforming the established baselines: Ant Colony Optimization (ACO) at 3.6, Dijkstra’s Algorithm at 3.5, and Google Maps’ “fastest route” at 3.2. Quantitatively, this translates to an 8.6% improvement in safety relative to the Dijkstra baseline. These findings validate that integrating expert-weighted cost functions allows the algorithm to proactively bypass high-hazard zones. This mirrors recent data-driven approaches where traffic congestion and environmental factors are shown to significantly impact HAZMAT transport risks in urban areas [20,26]. Furthermore, the use of predictive emission monitoring and risk-aware routing via artificial intelligence provides a more robust safety buffer for connected vehicles in smart transportation systems [22,25].

4.4. Computational Efficiency: Analysis of Number of Nodes Explored

Regarding computational efficiency, the enhanced A* Algorithm demonstrated superior performance by exploring the fewest number of nodes—specifically 150 nodes—during the search for the optimal path. This contrasts markedly with Dijkstra’s Algorithm, which required the exploration of 220 nodes, and Ant Colony Optimization (ACO), which processed 180 nodes. This significantly lower node count reflects higher search efficiency, directly attributed to the effective utilization of the heuristic function, h(n). This directed exploration minimizes resource consumption, an advantage critical for real-time applications in Digital Twins for intelligent connected vehicles and autonomous systems [33,34]. Advancements in path planning control using turning points and improved metaheuristics continue to optimize computational speeds in complex environments [24,35].

4.5. Operational Trade-Offs and Generalizability

While the travel time reduction of approximately 3.8% might appear marginal—potentially falling within the variance of real-world traffic fluctuations—the critical trade-off lies in the substantial 8.6% improvement in safety scores. In high-stakes HAZMAT scenarios, the strategic avoidance of chemical plumes and densely populated areas justifies this minor temporal cost, as it serves to prevent catastrophic secondary disasters. The importance of such integrated models and strategic trade-offs is highlighted in the recent literature concerning green traffic management and cost control strategies, where operational efficiency must often be balanced against environmental and safety constraints [36,37]. Furthermore, regarding generalizability, although this study utilizes Bangkok’s expressway topology as a case study, the proposed Delphi-AHP-A* framework is location-agnostic. It can be readily adapted to other urban networks by recalibrating the weighting parameters ( W d , W s ) to reflect local traffic laws, population structures, and emergency protocols. The modular design of this framework ensures high practical scalability; emergency agencies in other metropolitan areas can readily adapt the system by importing their local Geographic Information System (GIS) road networks and recalibrating the Delphi-AHP weights to align with specific regional safety protocols and urban densities.

4.6. Benchmarking Against Contemporary Literature (2023–2025)

The performance of the proposed Delphi-weighted A* algorithm demonstrates significant advancements when compared to recent literature. For instance, ref. [15] developed an improved A* for off-road emergency rescue that focused primarily on terrain factors, whereas our model integrates dynamic urban constraints like chemical dispersion. While other studies utilize modified A* for static obstacle avoidance in construction robots or mobile robot path planning [14,16,27,28], our framework’s focus on HAZMAT risk mitigation provides a more specialized solution. Compared to recent advancements in autonomous delivery robot path planning [38], high-safety navigation for mobile robots using integrated potential fields [39], or multimodal emergency scheduling through UAV-ground coordination [40], our framework uniquely combines real-time chemical dispersion modeling with expert-weighted safety criteria.

4.7. Limitations and Future Work

While the proposed framework demonstrates significant safety gains, certain limitations remain. First, the current model assumes a single-chemical spill scenario; multi-agent hazard dispersion requires further investigation. Second, the expert weights, although validated via Delphi, are subjective to the panel’s specialized experience. Future research could integrate real-time sensor data from IoT-enabled expressway infrastructures to dynamically update the cost function without manual elicitation. Additionally, scaling the model to complex non-expressway urban grids may require hybrid heuristics to handle higher node densities.

5. Conclusions

This research successfully bridges a critical gap in emergency logistics by introducing a Delphi-AHP-integrated A* cost function. Unlike standard navigation systems that solely prioritize distance or time-based metrics, this novel framework effectively translates qualitative expert consensus into actionable algorithmic constraints. Empirical results demonstrate that the proposed algorithm, refined by insights from 17 subject-matter experts, achieves an optimal balance between operational efficiency and public safety. Specifically, the model yielded a 3.8% reduction in travel time and an 8.6% increase in safety scores relative to Dijkstra’s algorithm. These improvements are driven by the strategic weighting of critical factors, most notably traffic fluidity (0.25) and chemical concentration levels (0.15), which enable the system to actively bypass high-risk zones. The primary scientific contribution of this research is the successful integration of a dynamic environmental hazard model (ALOHA) with a qualitative expert-consensus framework (Delphi-AHP) into a real-time navigation logic. This study provides a validated blueprint for trading marginal computational time for a substantial increase in responder safety, offering a scalable decision-support architecture for the next generation of Intelligent Transportation Systems (ITS) in megacities.
The primary contribution of this work is a validated decision-support model that successfully trades a marginal increase in computational complexity for a substantial gain in responder safety. Consequently, this methodology offers a scalable blueprint for future Intelligent Transportation Systems (ITSs) seeking to integrate real-time risk management into navigation logic within complex urban environments.

Author Contributions

Conceptualization, W.K. and C.C.; methodology, W.K. and K.P.; software, K.P.; validation, A.K. and C.C.; formal analysis, W.K. and A.K.; investigation, A.K.; resources, W.K.; data curation, A.K.; writing—original draft preparation, W.K.; writing—review and editing, C.C. and A.K.; supervision, C.C.; project administration, W.K. All authors have read and agreed to the published version of the manuscript.

Funding

This research received no external funding. The APC was funded by Thammasat University.

Institutional Review Board Statement

The study was conducted in accordance with the Declaration of Helsinki, and approved by the Ethics Committee of the Faculty of Public Health, Thammasat University (protocol code 67PU015 and date of approval: 20 May 2024).

Informed Consent Statement

Informed consent was obtained from all subjects involved in the study.

Data Availability Statement

The original contributions presented in this study are included in the article. Further inquiries can be directed to the corresponding author.

Conflicts of Interest

The authors declare no conflicts of interest.

References

  1. Expressway Authority of Thailand. Annual Report 2564; Expressway Authority of Thailand: Bangkok, Thailand, 2022. [Google Scholar]
  2. Expressway Authority of Thailand. EXAT Portal Application. Available online: https://www.exat.co.th (accessed on 10 January 2025).
  3. Su, H.; Zhong, Y.D.; Chow, J.Y.; Dey, B.; Jin, L. EMVLight: A multi-agent reinforcement learning framework for an emergency vehicle decentralized routing and traffic signal control system. Transp. Res. Part C Emerg. Technol. 2023, 146, 103955. [Google Scholar] [CrossRef] [Scilit]
  4. Alexander, A.; Venkatesan, K.; Mounsef, J.; Ramanujam, K. A Comprehensive Survey of Path Planning Algorithms for Autonomous Systems and Mobile Robots: Traditional and Modern Approaches. IEEE Access 2025, 13, 176287–176326. [Google Scholar] [CrossRef] [Scilit]
  5. Zhang, B.; Lu, S.; Li, Q.; Du, P.; Hu, K. Escape Path Planning for Unmanned Surface Vehicle Based on Blind Navigation Rapidly Exploring Random Tree* Fusion Algorithm. Sensors 2024, 24, 7596. [Google Scholar] [CrossRef] [Scilit]
  6. Salari, S.; Karimi, A. Introducing an integrated approach for fire safety assessment in healthcare facilities by interval valued neutrosophic-AHP and Fuzzy Inference System. Heliyon 2025, 11, e41660. [Google Scholar] [CrossRef] [Scilit] [PubMed]
  7. Samhouri, M.; Abualeenein, M.; Al-Atrash, F. Enhancing supply chain resilience through a Fuzzy AHP and TOPSIS to mitigate transportation disruption. Sustainability 2025, 17, 7375. [Google Scholar] [CrossRef] [Scilit]
  8. Turoff, M.; Linstone, H.A. (Eds.) “The” Delphi Method: Techniques and Applications; Addison-Wesley Publ.: Boston, MA, USA, 1975. [Google Scholar]
  9. Saaty, T.L. The Analytic Hierarchy Process; McGraw-Hill: New York, NY, USA, 1980; pp. 1–18. [Google Scholar]
  10. Savkovic, S.; Jovancic, P.; Djenadic, S.; Tanasijevic, M.; Miletic, F. Development of the hybrid MCDM model for evaluating and selecting bucket wheel excavators for the modernization process. Expert Syst. Appl. 2022, 201, 117199. [Google Scholar] [CrossRef] [Scilit]
  11. Wang, P.; Wang, S.; Chi, L.; Ren, X.; Wu, W.; Cheng, W. Research and application of the network security monitoring capability evaluation model of power control system based on AHP and fuzzy comprehensive evaluation. J. Phys. Conf. Ser. 2022, 2246, 012046. [Google Scholar] [CrossRef] [Scilit]
  12. Zare, Z.; Ashrafzadeh, M.; Karatas, M. A Hybrid Fuzzy AHP and TOPSIS Approach for Warehouse Location Selection. Comput. Decis. Mak. Int. J. 2025, 2, 613–632. [Google Scholar] [CrossRef] [Scilit]
  13. Abd Ghany, N.M.; Naharudin, N. Application of fuzzy-AHP in GIS-based analysis for road safety index measurement. Plan. Malays. 2025, 23, 205–2019. [Google Scholar] [CrossRef] [Scilit]
  14. Fang, Y.; He, J.; Wang, X.; Xu, W.; Kim, J.I.; Chen, X. A* Algorithm for On-Site Collaborative Path Planning in Building Construction Robots. Buildings 2025, 15, 3876. [Google Scholar] [CrossRef] [Scilit]
  15. Zhao, D.; Ni, L.; Zhou, K.; Lv, Z.; Qu, G.; Gao, Y.; Yuan, W.; Wu, Q.; Zhang, F.; Zhang, Q. A study of the improved A* algorithm incorporating road factors for path planning in off-road emergency rescue scenarios. Sensors 2024, 24, 5643. [Google Scholar] [CrossRef] [Scilit]
  16. Fu, X.; Huang, Z.; Zhang, G.; Wang, W.; Wang, J. Research on path planning of mobile robots based on improved A* algorithm. PeerJ Comput. Sci. 2025, 11, e2691. [Google Scholar] [CrossRef] [Scilit]
  17. Miao, Q.; Wei, G. A comprehensive review of path-planning algorithms for planetary rover exploration. Remote Sens. 2025, 17, 1924. [Google Scholar] [CrossRef] [Scilit]
  18. Zhou, Z. Research on path planning based on the Dijkstra algorithm and segmented path planning approach. IET Conf. Proc. CP901 2024, 2024, 179–183. [Google Scholar] [CrossRef] [Scilit]
  19. Zhou, X.; Yan, J.; Yan, M.; Mao, K.; Yang, R.; Liu, W. Path planning of rail-mounted logistics robots based on the improved dijkstra algorithm. Appl. Sci. 2023, 13, 9955. [Google Scholar] [CrossRef] [Scilit]
  20. Liu, L.; Gan, X.; Wu, Q.; Sun, Z. Route optimization of hazardous material (hazmat) transportation with risk equity and time-varying risk. Transp. Res. Rec. 2024, 2678, 901–918. [Google Scholar] [CrossRef] [Scilit]
  21. Ünal, Y.; Polat, A.A.; SariçIçek, I.; Keser, S.B.; Akalin, K.B.; Yazici, A. Real time routing with vehicle failure and traffic awareness in last-mile delivery. Eng. Appl. Sci. Lett. 2025, 8, 98–112. [Google Scholar] [CrossRef] [Scilit]
  22. Ren, C.; Yang, M. Risk assessment of hazmat road transportation accidents before, during, and after the accident using Bayesian network. Process Saf. Environ. Prot. 2024, 190, 760–779. [Google Scholar] [CrossRef] [Scilit]
  23. Yu, S.; Tong, W.; Li, Y. Research on Logistics Path Planning Based on Improved Local Path Planning Algorithm. In Proceedings of the 2025 IEEE International Conference on Electronics, Energy Systems and Power Engineering (EESPE), Shenyang, China, 17–19 March 2025; IEEE: New York, NY, USA, 2025; pp. 1034–1038. [Google Scholar] [CrossRef] [Scilit]
  24. Feng, O.; Zhang, H.; Tang, W.; Wang, F.; Feng, D.; Zhong, G. Digital low-altitude airspace unmanned aerial vehicle path planning and operational capacity assessment in urban risk environments. Drones 2025, 9, 320. [Google Scholar] [CrossRef] [Scilit]
  25. Chen, F.; Zhu, Q. Intelligent optimization method for hazardous materials transportation routing with multi-mode and multi-criterion collaborative constraints. Sci. Rep. 2025, 15, 7804. [Google Scholar] [CrossRef] [Scilit]
  26. Russo, F.; Rindone, C. Transport of dangerous goods in urban area: Planning for sustainable future. Sustain. Futures 2025, 9, 100649. [Google Scholar] [CrossRef] [Scilit]
  27. Kim, H.W.; Choi, Y.S.; Lee, J.E. A study on fuzzy-AHP analysis for carbon neutrality in container terminals in Korea. Asian J. Shipp. Logist. 2025, 41, 90–98. [Google Scholar] [CrossRef] [Scilit]
  28. Karimi, A.; Khajevandi, A.A.; Ebrahimi, M.; Sarsangi, V. Analysis and prioritization of management factors influencing the risk of hazardous materials road transport accidents using the fuzzy analytic hierarchy process. Arch. Trauma Res. 2025, 14, 90–98. [Google Scholar] [CrossRef]
  29. Liu, Y.; Pan, S.; Folz, P.; Ramparany, F.; Bolle, S.; Ballot, E.; Coupaye, T. Cognitive digital twins for freight parking management in last mile delivery under smart cities paradigm. Comput. Ind. 2023, 153, 104022. [Google Scholar] [CrossRef] [Scilit]
  30. Prasad, R.; Khetarpaul, S.; Rankavat, S. A Safety-Aware Intelligent Route Planning Framework Using Real-Time Hazard Detection and Traffic Prediction. Available online: https://ssrn.com/abstract=6168896 (accessed on 10 January 2025).
  31. Long, Y.; Xu, G.; Zhao, J.; Xie, B.; Fang, M. Dynamic truck–UAV collaboration and integrated route planning for resilient urban emergency response. IEEE Trans. Eng. Manag. 2023, 71, 9826–9838. [Google Scholar] [CrossRef] [Scilit]
  32. Wang, J.; Bai, X.; Liu, Y. Building sustainable hazardous products supply chain against ambiguous risk with accelerated Benders decomposition algorithm. Transp. Res. Part E Logist. Transp. Rev. 2025, 194, 103941. [Google Scholar] [CrossRef] [Scilit]
  33. Gu, X.; Duan, W.; Zhang, G.; Hou, J.; Peng, L.; Wen, M.; Gao, F.; Chen, M.; Ho, P.H. Digital twin technology for intelligent vehicles and transportation systems: A survey on applications, challenges and future directions. IEEE Commun. Surv. Tutor. 2025, 28, 3235–3271. [Google Scholar] [CrossRef] [Scilit]
  34. Ramirez, C.A.; Agrawal, P.; Thompson, A.E. An approach integrating model-based systems engineering, iot, and digital twin for the design of electric unmanned autonomous vehicles. Systems 2025, 13, 73. [Google Scholar] [CrossRef] [Scilit]
  35. Shi, G.; Jiang, X. Improved ant colony algorithm-based path planning for mobile robots. In Proceedings of the Ninth International Conference on Computing, Control, and Industrial Engineering (CCIE 2025), Hangzhou, China, 19–21 September 2025; SPIE: Bellingham, WA, USA, 2025; Volume 13976, pp. 169–177. [Google Scholar] [CrossRef] [Scilit]
  36. de Mello Filho, L.V.; de Sousa, F.P.; de Godoi, G.; Emiliano, W.M.; Canteras, F.B.; Molina Júnior, V.E.; Bertini Junior, J.R.; Meyer, Y.A. Application of the Ant Colony Optimization Metaheuristic in Transport Engineering: A Case Study on Vehicle Routing and Highway Service Stations. Modelling 2025, 6, 62. [Google Scholar] [CrossRef] [Scilit]
  37. Zhao, H.; Song, S.; Lv, X.; Bao, Y. A multi-dimensional evaluation model for power enterprise procurement performance based on fuzzy analytic hierarchy process and TOPSIS integration. Sci. Rep. 2025, 15, 41290. [Google Scholar] [CrossRef] [Scilit]
  38. Huang, L.; Hu, T.; Wei, J.; Guo, Y.; Tong, X.; Ding, J.; Yang, H.; Zhong, B. Path Planning for Delivery Robots Based on an Improved Ant Colony Optimization Algorithm Combined with Dynamic Window Approach. Sensors 2025, 26, 72. [Google Scholar] [CrossRef] [Scilit]
  39. Liu, J.; Qian, Y.; Zhang, W.; Ji, M.; Xv, Q.; Song, H. High-safety path optimization for mobile robots using an improved ant colony algorithm with integrated repulsive field rules. Robot. Auton. Syst. 2025, 190, 104998. [Google Scholar] [CrossRef] [Scilit]
  40. Xia, H.; Zhang, M.; Ma, Z.; Cui, M.; Yan, C. Optimization of Urban Emergency Multimodal Transportation Scheduling with UAV-Ground Traffic Coordination. IEEE Trans. Intell. Transp. Syst. 2025, 27, 692–708. [Google Scholar] [CrossRef] [Scilit]
Figure 1. The research conceptual framework illustrating the multi-stage integration of the Delphi-Analytic Hierarchy Process (AHP) consensus method with the A* heuristic search algorithm for route optimization.
Applsci 16 03434 g001
Figure 2. Visual Comparison of Factor Importance Weights.
Applsci 16 03434 g002
Figure 3. Spatial visualization of the study area on the Chaloem Maha Nakhon Expressway, comparing the routing trajectories of different algorithms.
Applsci 16 03434 g003
Figure 4. Spatial visualization of the emergency response simulation on the Chaloem Maha Nakhon Expressway. The circular dispersion pattern reflects the uniform low-wind speed scenario.
Applsci 16 03434 g004
Figure 5. Comparative Performance Analysis of Route Planning Algorithms.
Applsci 16 03434 g005
Table 1. The Fundamental Scale for Pairwise Comparison.
Intensity of ImportanceDefinition
1Equal Importance
3Moderate Importance
5Strong Importance
7Very Strong
9Extreme Importance
2, 4, 6, 8Intermediate values
Note: The fundamental scale used for pairwise comparison is based on Saaty (1980) [9]
Table 2. Factors for Comparison.
FactorExplanation
A1
[1,10,18]
Traffic flow
This factor assesses the level of vehicle movement on the expressway, determined by vehicle density and average vehicle speed. These conditions can be observed using Google Maps’ traffic color indicators: green signifies free-flowing traffic, yellow indicates slow-moving traffic, and red denotes congested or stopped traffic.
A3
[17,19,23]
The shortest path
This factor represents the linear distance along the expressway from the incident’s origin point to the designated destination, measured in kilometers.
A4
[4,13,24]
Route Complexity
This factor considers the number of intersections, interchanges, and curves. It is quantitatively measured by the frequency of high-friction decision points (interchanges and sharp curves) per kilometer. A higher count indicates increased cognitive load for the driver and higher mechanical risk for heavy HAZMAT tankers, significantly impacting driving safety.
F1
[20,22,25]
Chemical Spill Concentration Level
This factor indicates the measured concentration of the spilled chemical at the incident location, expressed in parts per million (ppm). This metric directly correlates with the severity of the hazard and influences the safety protocols and route considerations for emergency responders.
F2
[20,22,26]
Location of Chemical Spill Incident
This factor pertains to the specific placement of the incident site on the expressway, which significantly influences accessibility and situational control. Examples include its position before an on-ramp, after an off-ramp, or near an interchange.
F3
[20,22,25]
Chemical Spill Dispersion Map
This factor quantifies the total area impacted by the chemical spill’s dispersion, measured in square meters. This calculation is derived using ALOHA software, which considers detailed input on the chemical properties, prevailing weather conditions, and surrounding environmental factors.
B1
[26,27,28]
Population Density (Community Areas)
This factor quantifies the number of individuals residing in community areas adjacent to the expressway who could potentially be affected by an incident. It is measured in persons per square kilometer.
B2
[26,27,28]
Business Density (Business Districts)
This factor quantifies the number of businesses located in commercial areas adjacent to the expressway that could potentially be impacted by an incident. It is measured in number of businesses per square kilometer.
C1
[2,21,29,30]
Google map
This factor assesses the ease with which traffic information can be obtained and utilized via Google Maps. It encompasses several sub-criteria: the accuracy of the data, the geographical coverage of the traffic information, and the overall user-friendliness of the interface.
C3
[2,21,29,30]
ITS Sign
This factor evaluates the ease with which traffic information can be acquired from Intelligent Transportation System (ITS) signs. Key considerations include the clarity of the displayed information, the extent of geographical coverage provided by the signs, and the real-time accuracy (up-to-dateness) of the data.
D1
[3,29,31]
Resource Availability
This factor assesses the overall preparedness of rescue units to handle emergencies. It encompasses the availability and training of personnel, the operability and suitability of equipment, the depth of specialized knowledge among responders, and the readiness of fire trucks to be deployed effectively.
D2
[3,29,31]
ERT Location
This factor refers to the geographical placement of Emergency Response Team (ERT) units, which directly influences their travel time to an incident site. Considerations include their proximity to or distance from the expressway.
Table 3. Reduction in error of expert size.
Expert SizeError ReductionNet Change
1–51.02–0.700.50
5–90.70–0.580.12
9–130.58–0.540.04
13–170.54–0.500.04
17–210.50–0.480.02
21–250.48–0.460.02
25–280.46–0.440.02
Table 4. Professional Profile and Composition of the Expert Panel (N = 17).
SectorNo.PositionSpecific FieldExperience (Yrs)Person
Government1Occupational Health LecturerChemical Emergency Response>52
2MOT, PORT officerHazmat Transport>52
3DDPM, MITHazmat Emergency Response>52
4Fire Fighting officerHazmat Emergency Response>53
5ERT, EXATHazmat Emergency Response>52
6PCD officerAir Pollution>51
Private7Hazardous substance logisticsHazmat Transport>52
8ModelRoute selection specialist>53
Total 17
Table 5. Calculated Global Weights (Wi) for Factors Influencing Route Selection.
FactorWeighting
A10.25
A30.18
A40.08
F10.15
F20.10
F30.05
B10.10
B20.05
C10.02
C30.01
D10.01
Table 6. Safety score.
FactorMax Potential Risk Score (Scale 1–5)Weight ( W i )
A140.25
A330.18
A420.08
F130.15
F240.10
F320.05
B130.10
B240.05
C150.02
C340.01
D130.01
Table 7. Results of the Simulated Rescue Route Planning Scenario.
AlgorithmTime (min)Distance (km)Safety ScoreNode
A* algorithm12.510.23.8150
Dijkstra’s algorithm13.0103.5220
ACO13.810.53.6180
Google Map
(shortest route)
13.210.13.2N/A
Google Map
(fastest route)
13.59.83N/A
Note: N/A = Not Applicable; used where a comparison metric is not relevant to the reference algorithm.
Table 8. Comparison of route selection and spatial reasoning between Dijkstra’s and the proposed A* algorithm.
Route
Segment/
Node
Dijkstra’s Algorithm (Shortest Path)Proposed A* Algorithm (Safest Path)Spatial Reasoning & Risk Mitigation
Start pointRama IV EntranceRama IV EntranceBoth start at the nearest access point.
SegmentPrimary Expressway TrunkPrimary Expressway TrunkShared segment for initial response speed.
Decision Node (Exchanges)Direct Exit at Bon KaiBypass to Rama III/Yan NawaA* avoids Bon Kai exit due to ALOHA model indicating high chemical vapor concentration at the immediate downramp.
Intermediate PathHigh-density commercial zonesLower-density industrial/service roadsDijkstra passes through dense population areas to save distance; A* prioritizes low-density buffers.
Final
Approach
Windward Side (Upwind)Leeward Side (Crosswind)A* selects a crosswind approach based on real-time wind data to protect responders from toxic plumes.
Total Travel Time8.2 min8.5 minA* is ~3.6% slower in duration but significantly reduces exposure risk.
Safety Score ( S i )3.5/5.04.3/5.0Safety Gain of ~22% in this specific segment by avoiding the hazard plume.
Disclaimer/Publisher’s Note: The statements, opinions and data contained in all publications are solely those of the individual author(s) and contributor(s) and not of MDPI and/or the editor(s). MDPI and/or the editor(s) disclaim responsibility for any injury to people or property resulting from any ideas, methods, instructions or products referred to in the content.