Article

Study on the Pore Pressure Coefficient of Saturated Sandy Silt Under Frozen Conditions

School of Civil Engineering, Qingdao University of Technology, Qingdao 266520, China
*
Author to whom correspondence should be addressed.
Appl. Sci. 2026, 16(7), 3263; https://doi.org/10.3390/app16073263
Submission received: 4 March 2026 / Revised: 24 March 2026 / Accepted: 26 March 2026 / Published: 27 March 2026
(This article belongs to the Special Issue Advanced Technologies and Applications in Geotechnical Engineering)

Abstract

The pore pressure coefficient B, defined as the change in pore pressure per unit increment of confining pressure under undrained conditions, is a fundamental parameter in soil mechanics. It characterizes the coupling between soil skeleton deformation and pore water pressure and plays a critical role in establishing the effective stress framework for frozen soils. Existing studies mainly focus on unfrozen soils, while the temperature sensitivity and stress-path dependence of B in frozen soils undergoing phase transition remain insufficiently understood. To address this gap, this study conducts temperature-controlled triaxial tests and constant strain-rate loading tests to investigate the evolution of B in frozen sandy silt over a temperature range of −11 °C to −2 °C under different stress histories. The results show that: (1) post-loading B-values at −5 °C to −8 °C are significantly higher than those at −2 °C and −10 °C, by 6.5% and 8.2%, respectively; (2) within the framework of Gassmann’s equation, a theoretical model incorporating the soil freezing characteristic curve and the coupled effects of ice–water phase transition and soil skeleton deformation is developed to explain the temperature-dependent behavior of unfrozen water and B; and (3) a predictive model incorporating a temperature correction factor is proposed, which accurately captures the variation trend of B in frozen sandy silt. This study elucidates the evolution mechanism of the pore pressure coefficient under multi-field coupling conditions and provides a theoretical basis for frost heave assessment and constitutive modeling in cold-region engineering.

1. Introduction

Permafrost serves as a fundamental geological medium for engineering construction in cold regions and directly controls the long-term stability of infrastructure such as roadbeds, pile foundations, and underground structures. Within this system, the pore pressure coefficient B (hereafter referred to as the B-value) is a key parameter that characterizes the relationship between soil skeleton deformation and pore water pressure. It is defined as the change in pore pressure per unit increment of confining pressure under undrained conditions. Accurate determination of B is essential for predicting frost heave and evaluating the stability of frozen ground.
Saturated frozen soil is a complex three-phase system composed of soil particles, ice, and unfrozen water. Due to the significant stiffness contrast between ice and water, determining effective stress in frozen soils is challenging. During freezing, pore water progressively transforms into ice, altering the soil microstructure, including particle contacts, pore distribution, and unfrozen water content [1]. Ice crystals may fill or isolate pores, thereby modifying load-transfer paths within the soil skeleton. Meanwhile, unfrozen water remains in fine pores and governs pore pressure evolution. The distribution of unfrozen water and the formation of ice crystals strongly influence the pore pressure response under anisotropic stress conditions [2,3,4]. Temperature strongly controls the mechanical behavior of frozen soil by regulating ice–water phase transitions. Variations in unfrozen water content lead to temperature-dependent pore fluid properties, while the spatial distribution of ice significantly influences stiffness and pore pressure transmission [5]. When unfrozen water saturation decreases below a threshold, hydraulic continuity is lost, which challenges conventional pore pressure measurement techniques. Therefore, incorporating temperature effects and multi-phase coupling into classical pore pressure theory remains a critical issue.
The pore pressure coefficient is a key parameter for describing the evolution of pore water pressure in saturated porous media under anisotropic stress conditions. Previous studies on pore pressure coefficients have primarily focused on unfrozen soils and rocks [6,7]. Research on frozen soils remains limited. Kia [8] investigated B-value measurement in frozen saline sand and resolved key experimental challenges. Lyu [9] measured B-values in frozen clay and analyzed their variation mechanisms. Studies on freezing-induced pore pressure have shown that negative pore pressure develops during freezing, leading to increased effective stress and soil consolidation [10,11,12,13,14,15]. In addition, experimental techniques for measuring pore water pressure have been improved. Liu [16], Zhang [17], and Wang [18] investigated pore pressure evolution under different temperature and loading conditions.
A key challenge in studying the B-value of frozen soil lies in maintaining the hydraulic connection between the unfrozen water phase in the sample and the pore pressure sensor. Currently, there is no unified standard for measuring pore pressure in frozen soil. To investigate how the B-value of frozen sandy silt varies under different conditions, this study obtained B-values under various conditions through temperature-controlled triaxial tests and constant strain rate loading tests. The experimental results were analyzed in conjunction with the Gassmann equation. Furthermore, by combining the unfrozen water content estimated using the soil freezing characteristic curve equation with the KT model, a series of studies were conducted on the variation patterns of the B-value and the underlying causes of these changes.
Although this study focuses on sandy silt, previous studies have demonstrated that different soil types, such as clay and silty clay, exhibit distinct pore pressure responses due to differences in pore structure and unfrozen water retention capacity. Therefore, the findings of this study are primarily applicable to similar granular–fine mixed soils, and caution should be exercised when extending the conclusions to highly plastic clays or coarse-grained soils.

2. Test Materials and Procedures

2.1. Materials

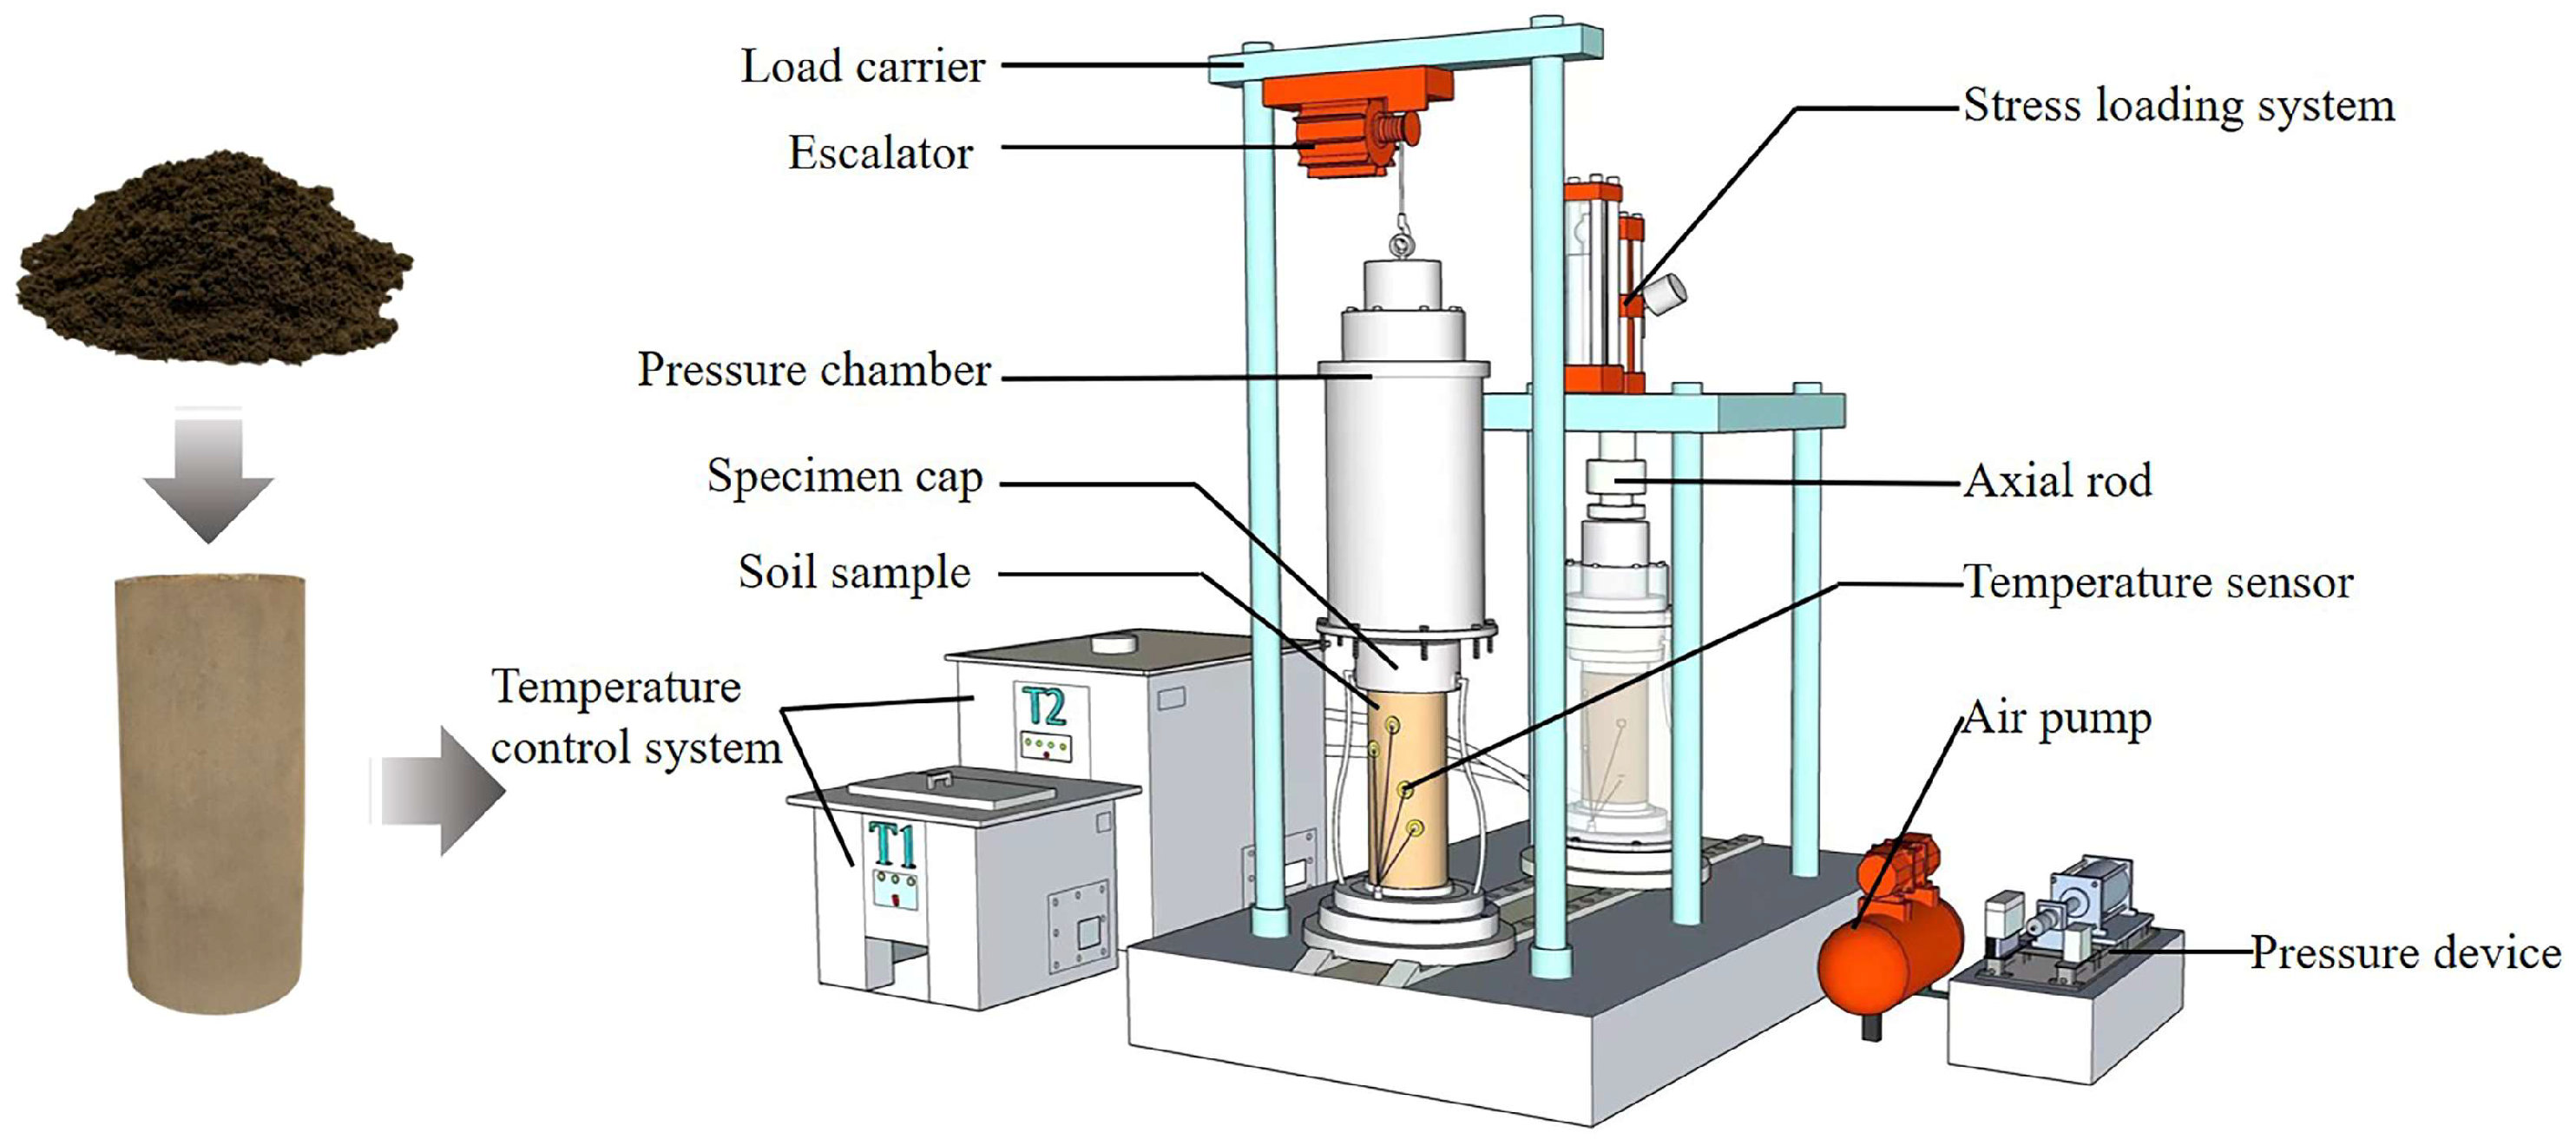
This study employed sandy silt with a plasticity index of 9.6% and a maximum dry density of 1.614%. Artificially frozen specimens were prepared and processed using a slow-freezing method. Specifically, dried soil was mixed to a 15% moisture content, and then molded and compacted to maximize specimen integrity and uniformity. The soil used and the compacted specimens are shown in the figure below. Specimens measuring 140 mm in height and 70 mm in diameter were mounted on a triaxial apparatus and saturated using water-head and back-pressure methods. Following saturation, the specimens were connected to a temperature control chamber. The temperature was first lowered from room temperature to 1 °C. After system stabilization, the temperature was progressively reduced to −2 °C, −5 °C, −8 °C, and −11 °C to meet experimental requirements. The entire freezing process was maintained for at least 8 h to minimize thermal gradients and promote water redistribution during freezing.

2.2. Test Process and Test Results

The GDS triaxial apparatus used in the experiment (as shown in Figure 1) features a maximum confining pressure of 150 MPa, with a maximum axial load of 40 kN. It supports local strain measurement and mid-plane pore pressure measurement. The volumetric controller achieves an accuracy of 0.25% of the measured value, while pressure accuracy is 0.15% of the full scale. The system features precise temperature control and B-value measurement capabilities. By connecting an external temperature control unit and adjusting the temperature of the confining pressure oil, precise control of the specimen temperature is achieved within a range of −50 to 100 °C. During measurement of the frozen soil pore pressure coefficient, the continuity of the entire system’s water phase must be ensured. Antifreeze (a mixture of ethylene glycol and water) is used to prevent the drainage system from freezing at sub-zero temperatures. To minimize impact on the frozen soil, the ethylene glycol concentration is relatively low.
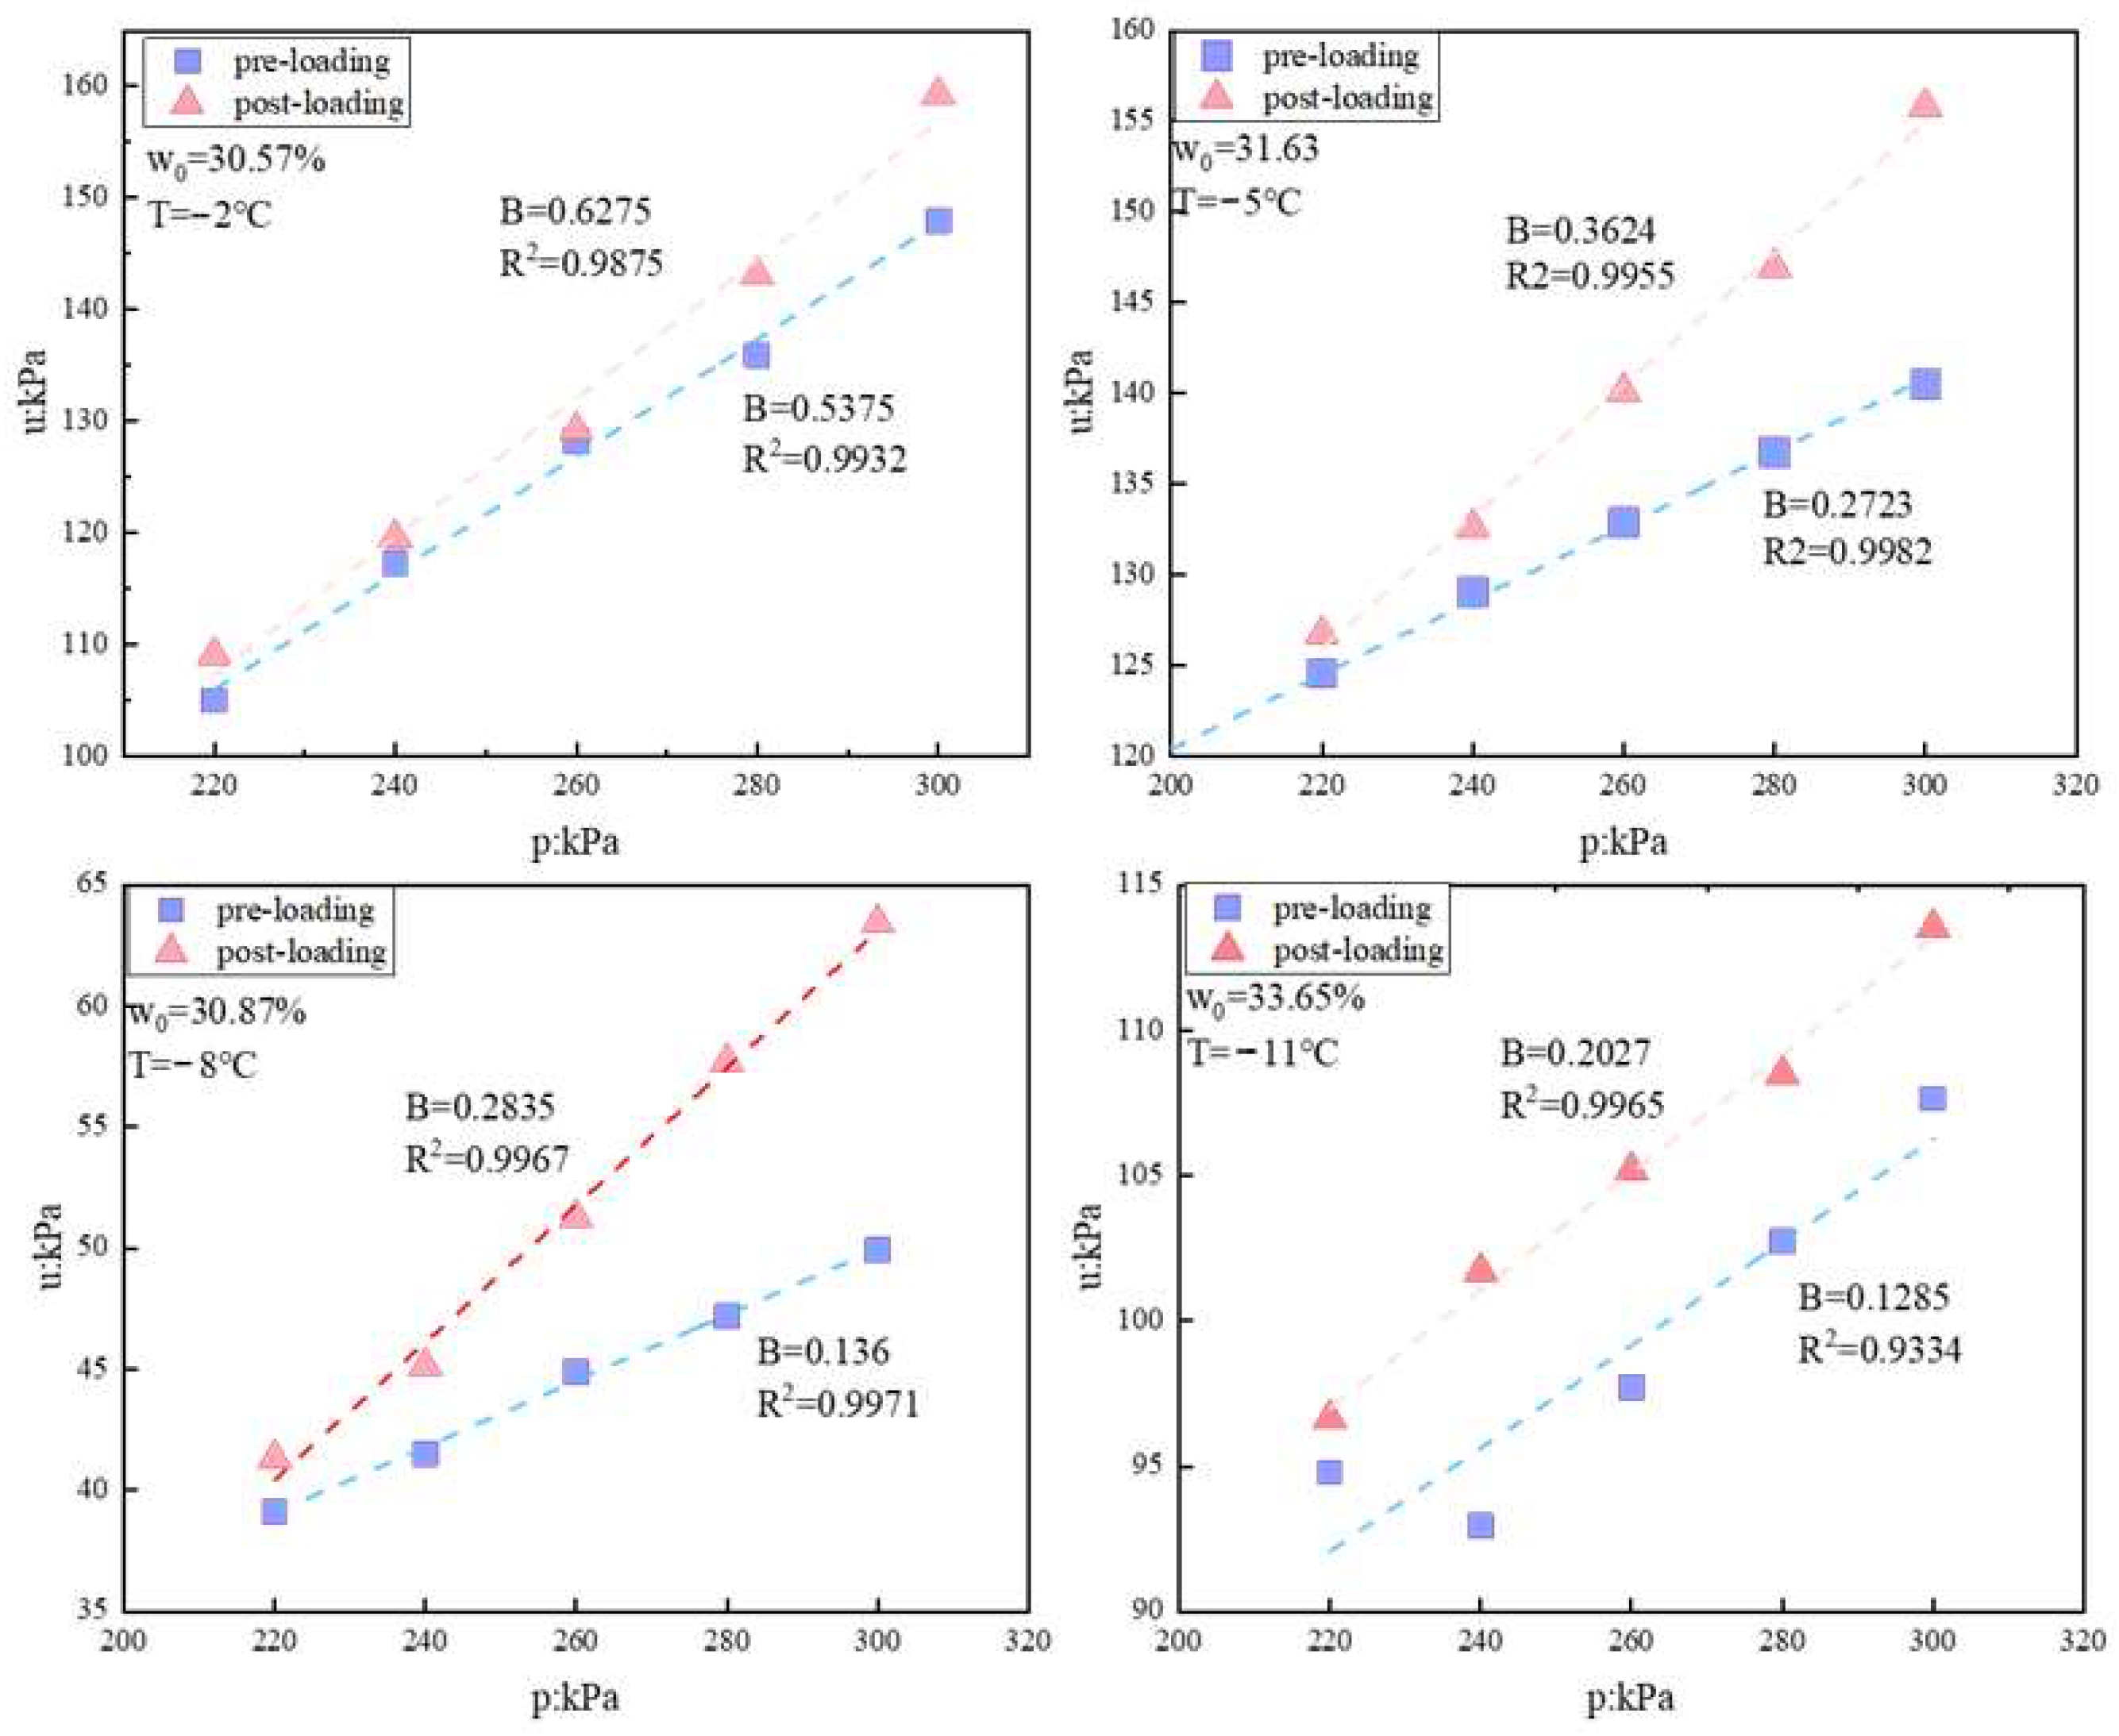
The frozen specimens undergo B-value testing on the apparatus. Prior to testing, the temperature control device is activated and adjusted to the required test temperature, allowing it to stabilize for 1–2 h. The confining pressure is incremented in 20 kPa steps from 200 kPa up to 300 kPa. The confining pressure and pore pressure data obtained at this stage are designated as preloading. Following the same path, we reduce the confining pressure back to its initial value. We conduct a strain-rate loading test under undrained conditions until 10% vertical strain is reached. Subsequently, we gradually relax the load to zero. Once pore pressure re-equilibrates, we repeat the B-value measurement procedure described above to obtain the post-loading/unloading B-value. We perform B-value tests at four different temperatures, with the results shown in Figure 2.

3. Results and Discussion

3.1. Effect of Temperature on Pore Pressure Coefficient

It should be noted that only four discrete temperature levels (−2 °C, −5 °C, −8 °C, and −11 °C) were considered in this study. Although a finer temperature resolution would allow a more detailed characterization of the continuous evolution of the pore pressure coefficient, the selected temperature points adequately capture the key stages of phase transition in frozen soils. In particular, the interval between −2 °C and −8 °C corresponds to the most active phase change region, and the observed nonlinear variation trend reflects the essential characteristics of this process.
As shown in Figure 2, the B-value decreases with decreasing temperature. During the initial stage of cooling (−2 °C to −5 °C), the B value decreases rapidly. After the temperature reaches −8 °C, the rate of decrease in the B value slows down. Overall, this study observed the characteristic nonlinear decrease in the B-value of frozen sandy silt as temperature decreased. This phenomenon fundamentally reflects the coupled mechanism between changes in unfrozen water content and the compressive properties of the soil skeleton within the frozen soil system. For specimens prior to loading, when temperature decreased from −2 °C to −5 °C, the B-value rapidly declined from an initial value of 0.53 to 0.27 (a 49% decrease), with the rate of decrease slowing below −8 °C. This temperature sensitivity difference stems from the phased characteristics of unfrozen water phase transitions during freezing: During the initial freezing stage (−2 to −5 °C), the rapid advancement of the pore solution freezing front causes a sharp decrease in unfrozen saturation (Sw). The large-scale formation of ice lenses significantly alters the soil structure, increasing the compressive modulus of the ice-skeleton system and thereby substantially reducing the soil’s pore pressure response to external loads.
At lower temperatures, unfrozen water exists mainly as thin films, and the rate of change in unfrozen water content decreases significantly. Experimental evidence also suggests that the thickness of bound water films decreases with temperature, enhancing soil stiffness [19]. At this point, the quasi-solid properties of adsorbed water significantly enhance the rigidity of the soil framework.
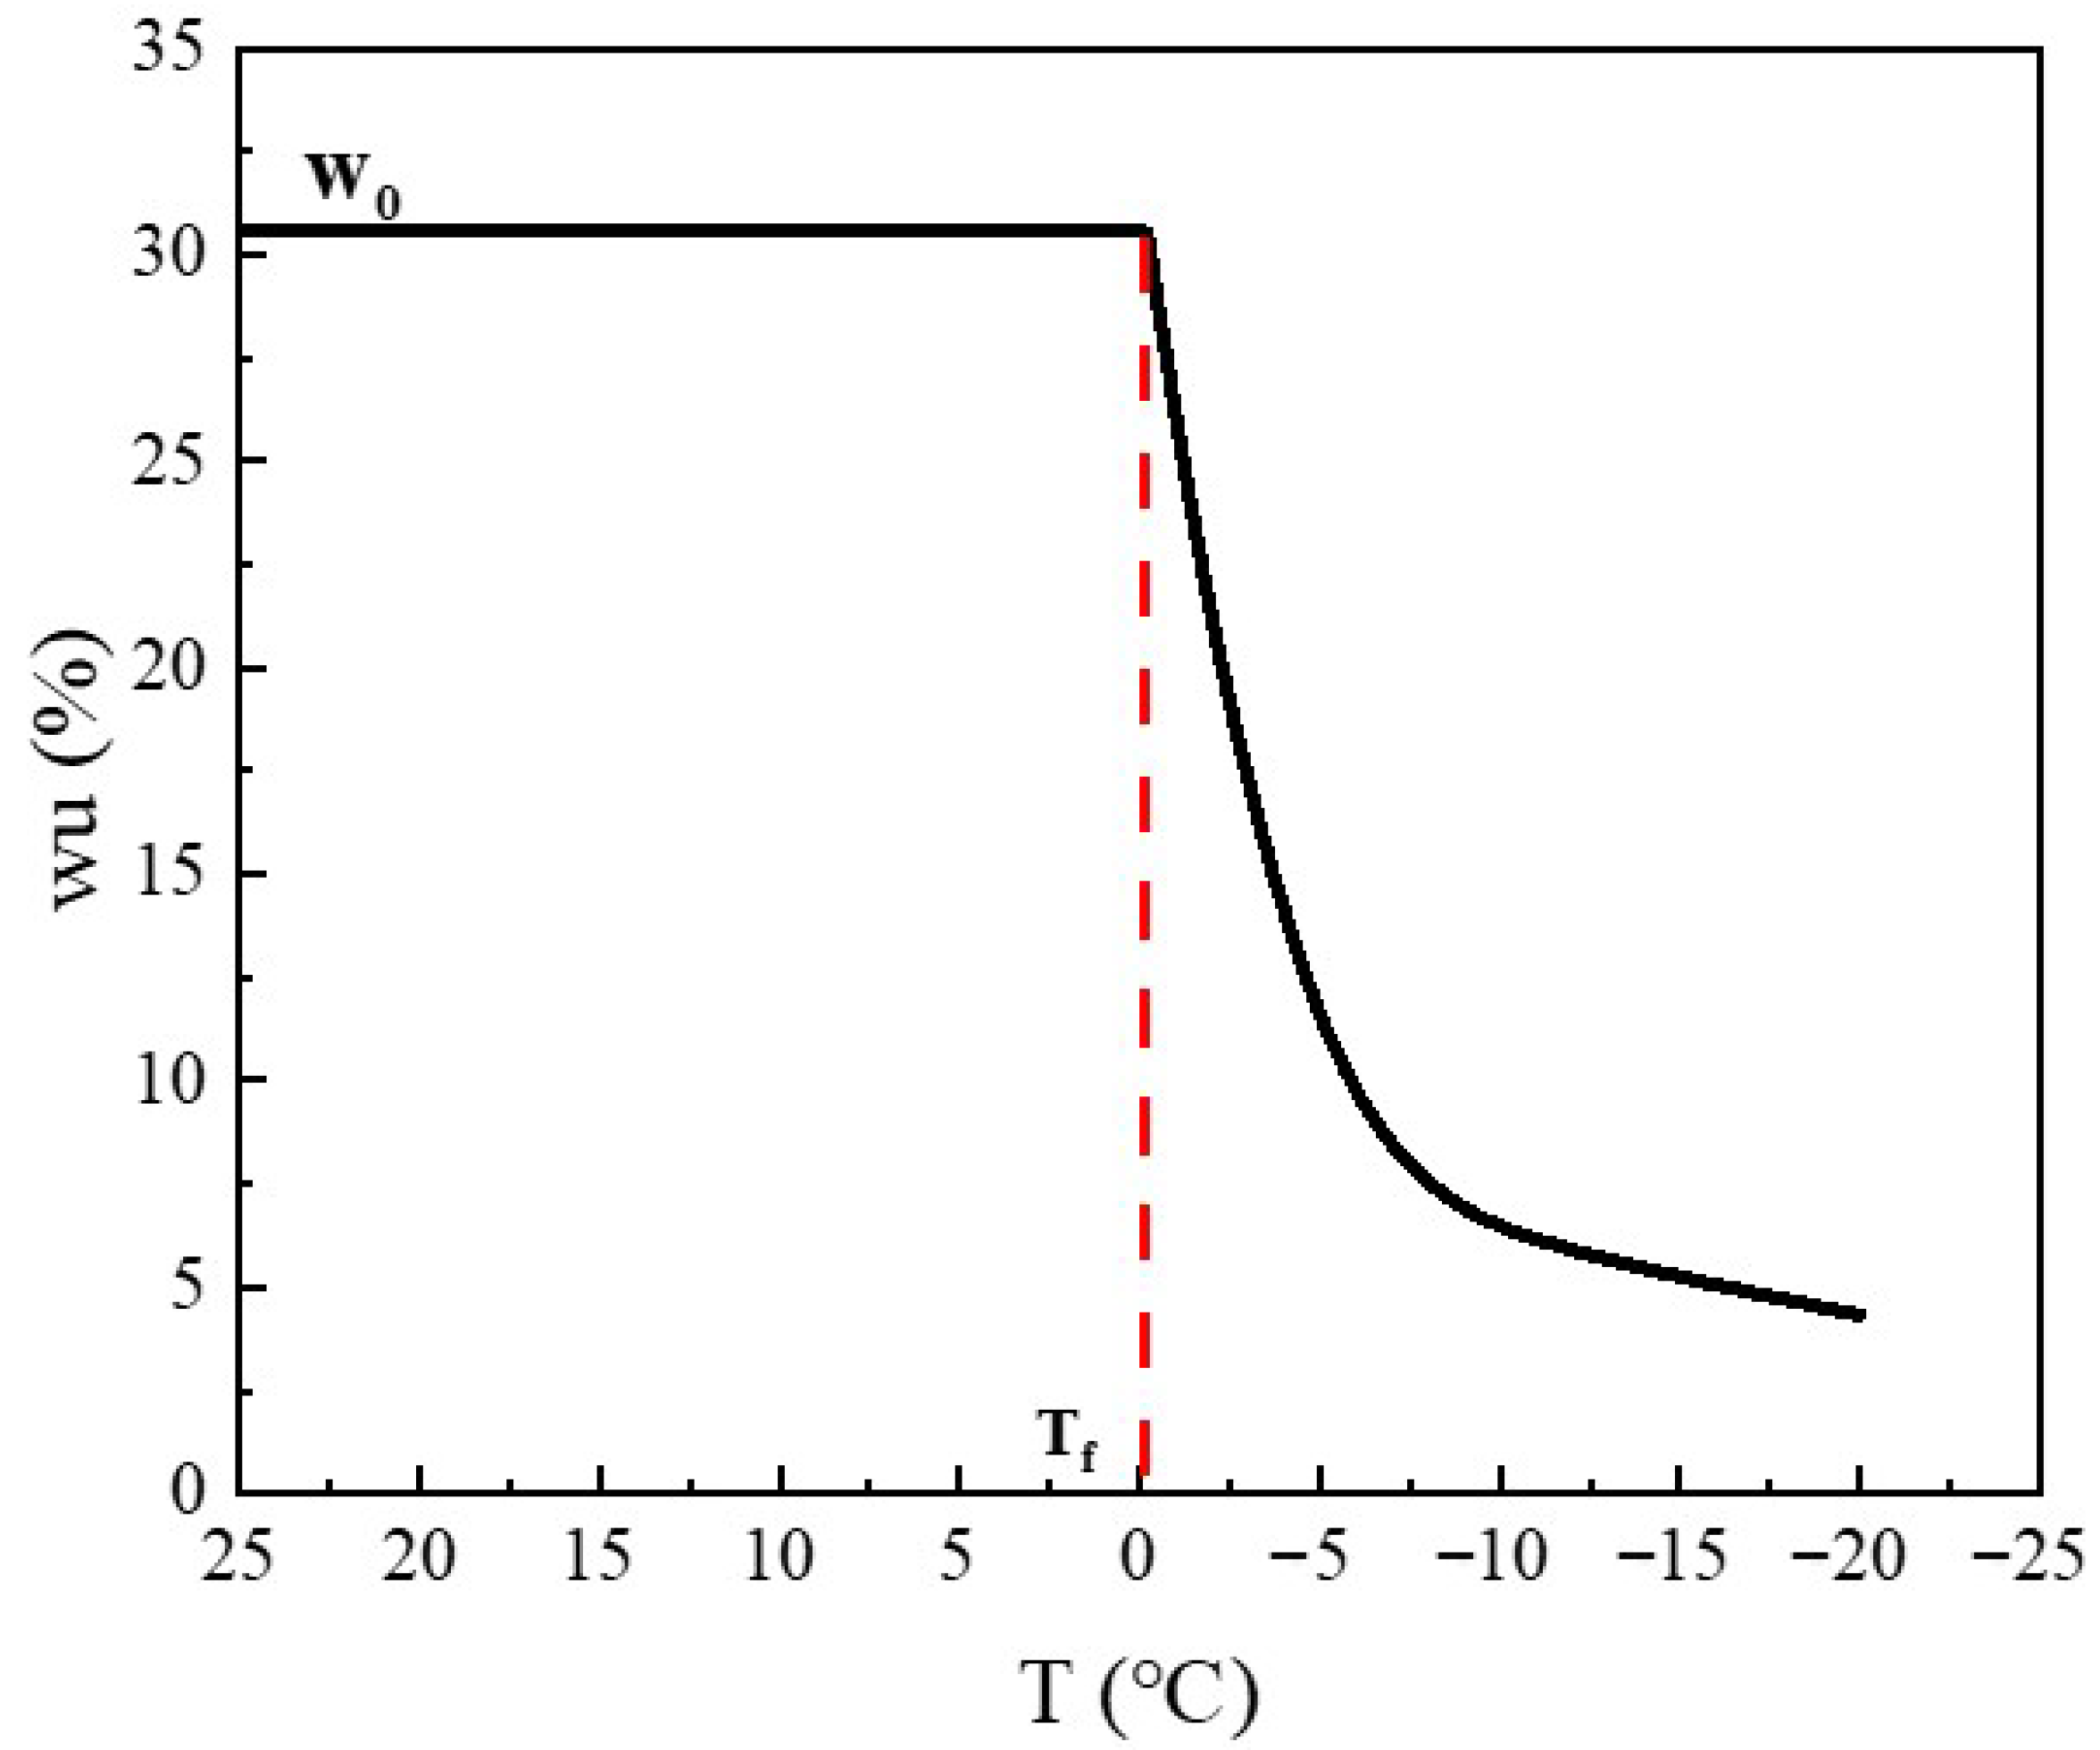
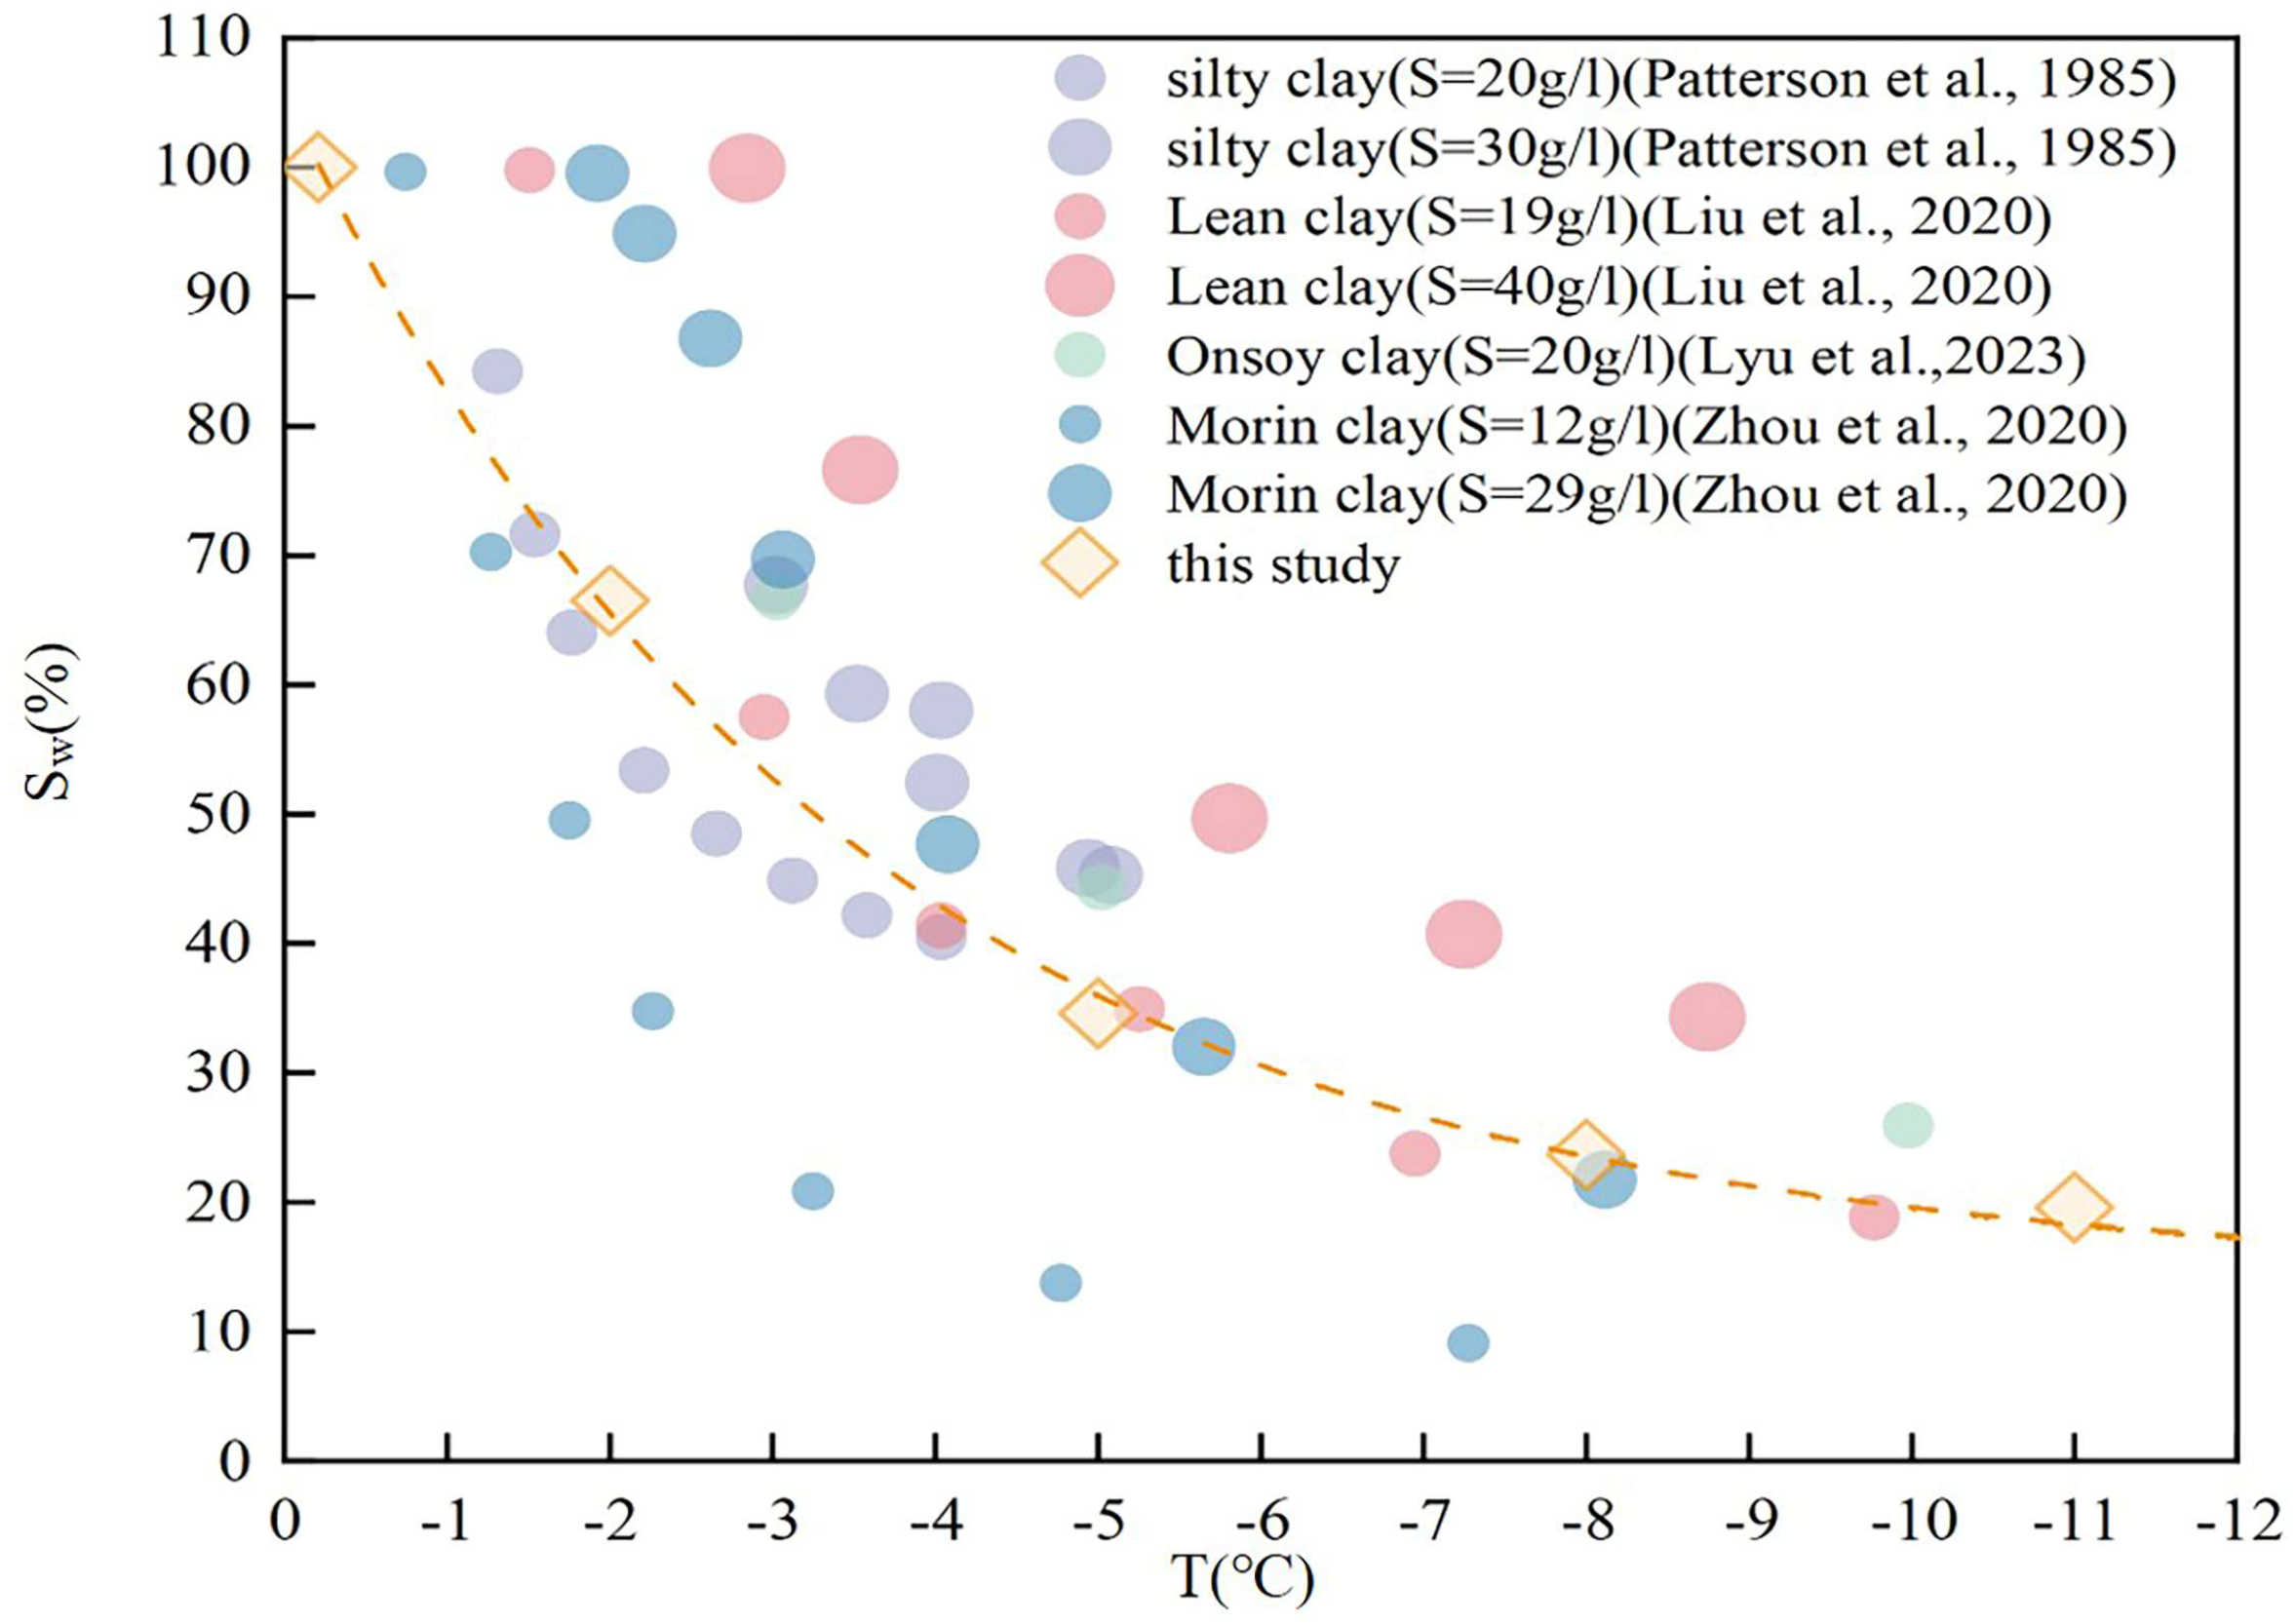
The unfrozen water content can be estimated using the soil freezing characteristic curve proposed by Kong [20], which has been widely applied to fine-grained soils [21]. This model enables estimation of unfrozen water content based on basic soil parameters and temperature. This model requires two soil physical parameters (Ip, w), which then determine the relationship between weight unfrozen water content and sub-zero temperatures. The specific calculation formula is shown in Equations (1)–(3) below. The estimated unfrozen water content wu results are presented in Figure 3 below. To facilitate representation of the porosity change in frozen soil samples, the unfrozen water content is converted to unfrozen water saturation S w = V w / V w + V i and compared with data from other tests. As shown in Figure 4, the estimated values are relatively reliable.
w u = w 0 T > T f w 0 T T f g T ≤ T f
T f = − 0.015 I p − 0.063
g = 0.300 ln I p − 2.232
where w0 denotes the initial total water content, b represents a parameter related to soil plasticity, T indicates the sample temperature, and Tf denotes the freezing temperature of the soil–water system.
Notably, the pore pressure coefficient exhibits temperature-dependent strengthening after loading. During the high-temperature stage (−2 °C), loading increased the pore pressure coefficient from 0.5375 to 0.6275 (a 16.74% increase). At this stage, most pores retained liquid-connected pathways. The constant strain rate loading induced a thawing-like drainage phenomenon. The pore pressure coefficient B, constrained by the effective stress principle, exhibited a smaller increase. This can be explained by the modified Bishop effective stress principle: under loading, the proportion of effective stress borne by the ice phase increases with decreasing temperature, leading to a redistribution of pore water pressure. To further clarify this mechanism, the modified Bishop effective stress principle is introduced to describe stress partitioning in frozen soils containing ice and unfrozen water. The effective stress can be expressed as:
σ ′ = σ − χ u w − ( 1 − χ ) u i
where σ′ is the effective stress, σ is the total stress, uw and ui represent the pressures of unfrozen water and ice, respectively, and χ is an effective stress parameter related to the degree of unfrozen water saturation. In this study, χ is assumed to be a function of unfrozen water saturation (UWS), reflecting the relative contribution of the liquid phase to stress transmission.
Under higher temperatures, the unfrozen water phase remains relatively continuous, and external loading is primarily transferred through the pore water, resulting in a stronger pore pressure response. As temperature decreases, the proportion of ice increases and gradually dominates the load-bearing structure. The discontinuity of the liquid phase reduces the efficiency of pore pressure transmission, while the ice phase increasingly participates in stress support. This transition leads to a redistribution of stress between the solid skeleton, ice, and pore water, thereby influencing the evolution of the pore pressure coefficient. It should be noted that the above formulation is used as a conceptual framework to interpret the experimental observations, rather than for direct quantitative calculation. The simplified assumption reflects the multi-phase coupling characteristics of frozen soils and helps explain the temperature-dependent behavior of the pore pressure coefficient.
The increase in the pore pressure coefficient after loading can be attributed to the combined effects of ice crystal fracture, pore structure rearrangement, and unfrozen water migration. During loading, stress concentration within ice crystals may induce brittle fracture, generating new microcracks and increasing pore connectivity. These newly formed pathways facilitate the redistribution and temporary accumulation of unfrozen water. Meanwhile, the rearrangement of the soil skeleton alters the load transfer mechanism, leading to a higher proportion of stress being carried by the pore fluid. The mismatch between the rate of loading and the migration rate of unfrozen water further contributes to excess pore pressure buildup, thereby increasing the B-value.

3.2. Effects of Skeletal Compression

For porous media, the pore pressure coefficient B can be expressed as a function of the fluid bulk modulus Kf, pore bulk modulus Kn, soil skeleton modulus K, porosity n, and Biot coefficient α [25,26].
B = 1 1 + n K / α 1 / K f − 1 / K n
K n − 1 = − 1 n V ∂ n V ∂ u
K s − 1 = − 1 V ∂ V ∂ u
V represents the specimen volume, p′ denotes the Tasaki average effective stress defined as p ′ =   p − u , and p is the average total stress, which is the mean value of the three principal stresses σ1, σ2, and σ3.
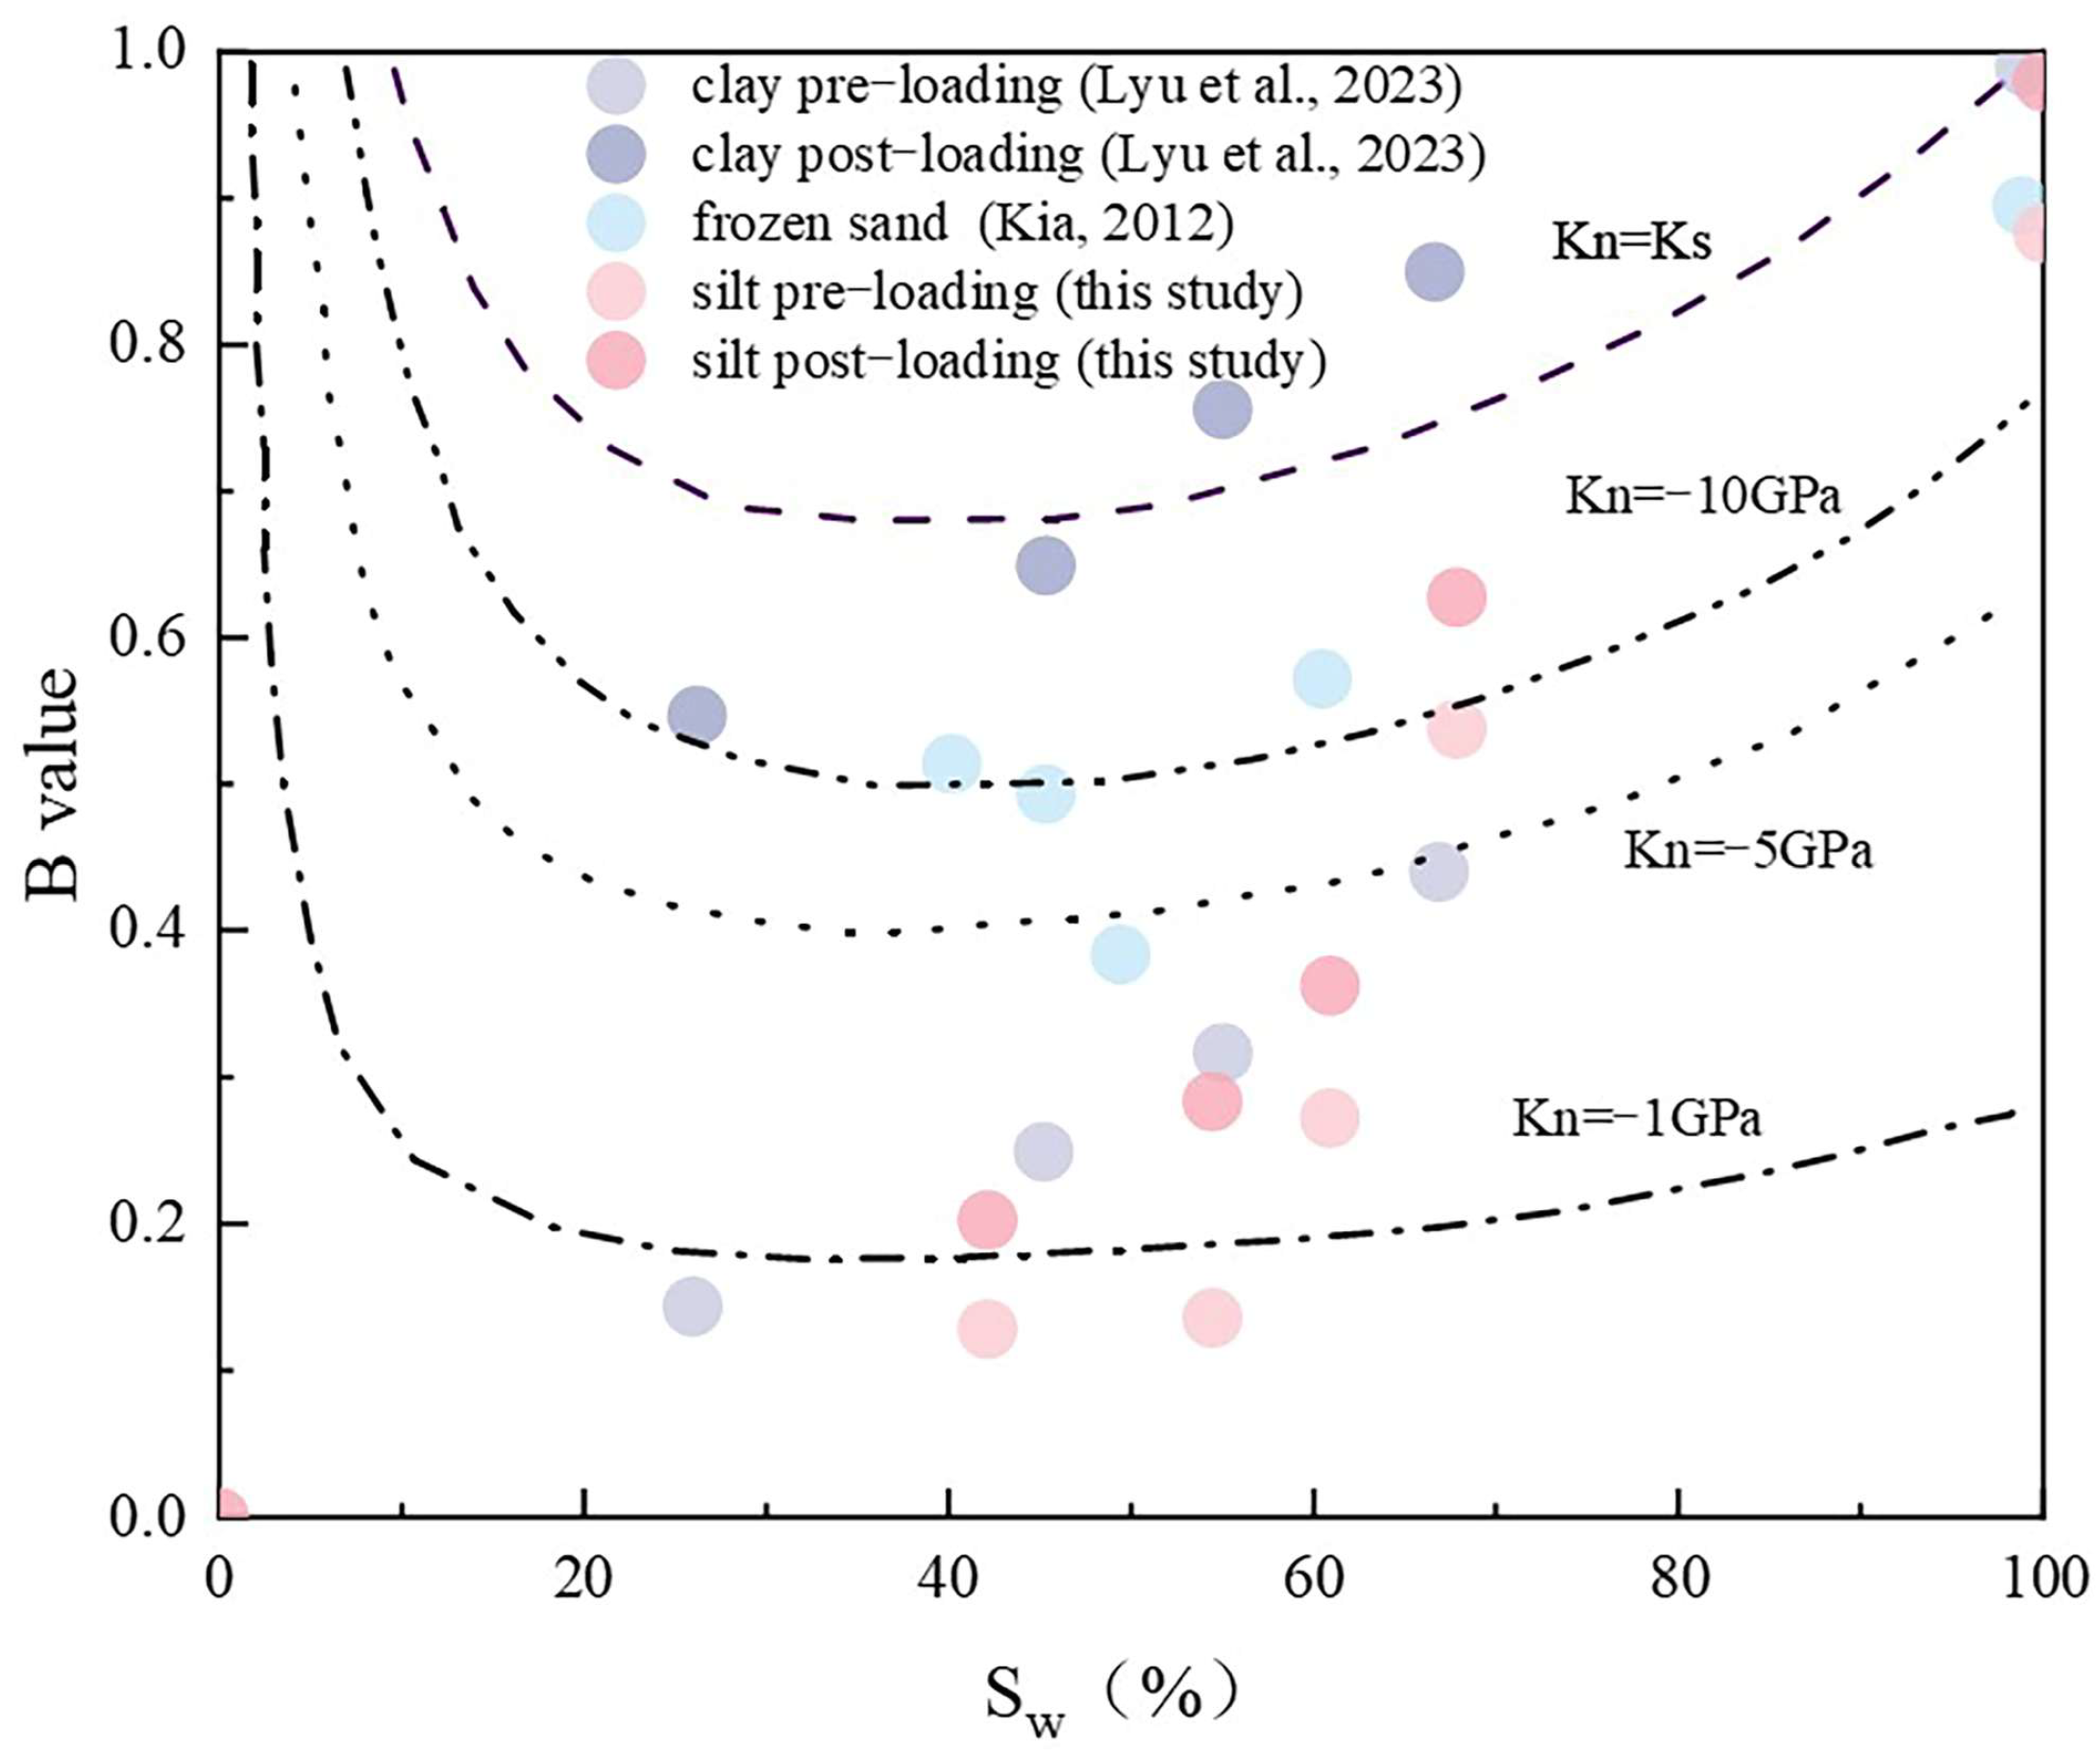
In the aforementioned Gassmann equation, for a homogeneous porous medium composed of a single solid phase, it is assumed that n remains constant to ensure Kn and Ks are equal. However, for frozen soil, which contains two solid phases—soil particles and ice crystals—n varies with changes in ice crystals, and Kn and Ks are no longer equal. Since ice has lower stiffness than soil particles, it compresses under shear stress, potentially causing Kn to become negative in frozen soil. Although this is difficult to measure, the pre- and post-loading B-value data reveal that the fitted curve assuming Kn = Ks does not align with the measured B-values.
The fitted curve after changing the assumption is shown in Figure 5. Comparing the results of this experiment with those for clay and sandy soil reveals that the model curve obtained by changing the assumption to Kn = −10 GPa aligns well with the results for frozen sandy soil. However, this alignment does not guarantee the accuracy of a negative Kn value. For clay and silty soil, the experimental results show that the model curve does not fit well. The parameter values used in the formula are shown in Table 1. The calculation results and comparison diagram are shown in Figure 5.
The apparent deviation from the Gassmann prediction can be attributed to the complex compressibility behavior of the pore structure in frozen soils. Unlike unfrozen porous media, frozen soil contains both ice and soil particles, forming a heterogeneous composite skeleton. The parameter Kn, which represents pore compressibility, is no longer constant and may exhibit apparent negative values in a macroscopic sense. This does not imply physically negative compressibility, but rather reflects the redistribution of deformation between ice, soil particles, and pore space under loading. Therefore, the classical Gassmann assumption is not applicable to frozen soils without modification.

3.3. Effect of Unfrozen Water Content and Porosity

A comparison of the B-values of frozen clay and frozen silt before and after loading (Figure 5) shows that the pore pressure coefficient of specimens with a stress history increases significantly after loading, with a more pronounced increase observed in frozen clay. Frozen clay exhibits a relatively high porosity (n = 40–50%) and a flat pore morphology, which together form a highly oriented, layered pore network [27]. During loading, ice crystal fragmentation generates microfractures that readily propagate along primary pores, forming interconnected flow pathways. These pathways facilitate the migration and accumulation of unfrozen water toward newly formed fractures. In contrast, frozen silt has a lower porosity (n = 30–35%), which restricts the development of effective drainage pathways. The fractures induced by ice crystal failure remain relatively isolated and are constrained by the surrounding primary pore structure. As a result, unfrozen water migration is more limited in frozen silt.
Porosity influences the B-value through two pathways [28,29]. First, via the water storage capacity pathway: soils with high pore volume fraction (n > 35%) can store more unfrozen water. Under loading, the prolonged drainage pathways (with permeability coefficients reduced by 1–2 orders of magnitude) cause delayed dissipation of pore water pressure, leading to an elevated B-value. Second, the structural stiffness pathway: increased porosity weakens the overall stiffness of the soil skeleton, indirectly increasing its compressibility and thereby elevating the B-value. The combined effect of these pathways results in a nonlinear relationship between porosity and B-value. When n < 30%, each 5% increase in porosity raises B by approximately 0.08. However, when n > 35%, improved pore connectivity (optimized drainage conditions) partially offsets the water storage effect, reducing the increase to 0.03–0.05. This phenomenon aligns with experimental findings showing significantly higher B values in high-porosity specimens after loading [30,31].
From the perspective of pore size distribution, as the temperature decreases, the soil’s pore size distribution exhibits a general trend of refinement, shifting from larger to smaller pores. Water in large and very large pores freezes first, while unfrozen water gradually concentrates in small and medium-sized pores, indicating that the freezing process exhibits significant pore size dependence [32]. The freezing characteristic curves of soil samples can be clearly divided into three typical stages: the supercooling stage, the rapid freezing stage, and the stable freezing stage. As the saturation of unfrozen water decreases, the pore pressure coefficient B of the freezing sandy silt exhibits a continuous downward trend. This is because the formation of ice crystals replaces liquid water, disrupting the pathways for pore pressure transmission, while the soil skeleton bears a greater load.
To further clarify the relationship between pore pressure coefficient and Sw in mixtures containing ice-water, the KT model [33,34] is introduced as a medium. The KT model can calculate the undrained bulk modulus Ku and shear modulus Gu of a two-phase medium composed of spherical inclusions (with moduli Kin and Gin) embedded in a continuous rectangular matrix (with moduli Kma and Gma):
K u K m a = 1 + 4 G m a K i n − K m a / 3 K i n + 4 G m a K m a c 1 − 3 K i n − K m a / 3 K i n + 4 G m a c
G u G m a = 6 G i n K m a + 2 G m a + 9 K m a + 8 G m a 1 − c G m a + c G i n G m a 9 K m a + 8 G m a + 6 K m a + 2 G m a 1 − c G i n + c G m a
where c represents the volume fraction of spherical inclusions, with parameter values as shown in Table 1. The KT model has been demonstrated to accurately estimate the Ku and Gu of frozen soil [35].
According to the model definition, the modulus of the ice-water mixture is first calculated using Equations (8) and (9), treating water as spherical objects embedded in continuous ice. Subsequently, the modulus of the frozen soil is further computed, where soil particles are regarded as spherical objects embedded in a continuous ice-water mixture. Based on the obtained results, the density of the frozen soil is further calculated using Equations (10)–(12) [36], and the functional relationship between the p-wave velocity and the Upper Water Saturation (UWS) is estimated. The composition and structure of frozen soil are complex. At the microscopic level, ice within pores, soil particles that may be in contact with each other or separated by ice crystals, and soil particles encapsulated by ice all exist. To simplify this complexity, the model analyzes the pore pressure coefficient of frozen silt using a crystalline filling pattern. The pore pressure coefficient obtained under this condition represents the most ideal value achievable under various particle arrangement conditions. The extreme value ranges of most models show high consistency with the theoretical predictions of the KT model. However, some empirical models exhibit significant numerical deviations within the critical parameter range. This heterogeneity may stem from differences in nonlinear coupling mechanisms or boundary condition settings.
In this study, the unfrozen water content was estimated using an empirical model rather than direct measurement techniques such as nuclear magnetic resonance (NMR). Although direct methods can provide higher accuracy, the adopted model has been widely validated and offers practical advantages due to its simplicity and minimal parameter requirements. Nevertheless, uncertainties associated with empirical estimation may affect the prediction of the pore pressure coefficient, and future work should incorporate direct measurement techniques for further validation.
V p = K u + 4 / 3 G u ρ m
ρ m = C s 1 − n ρ s + 1 − C s 1 − n ρ a + S w n ρ w + 1 − S w n ρ i
B = 1 α 1 − 3 K u 4 ρ m V p 2
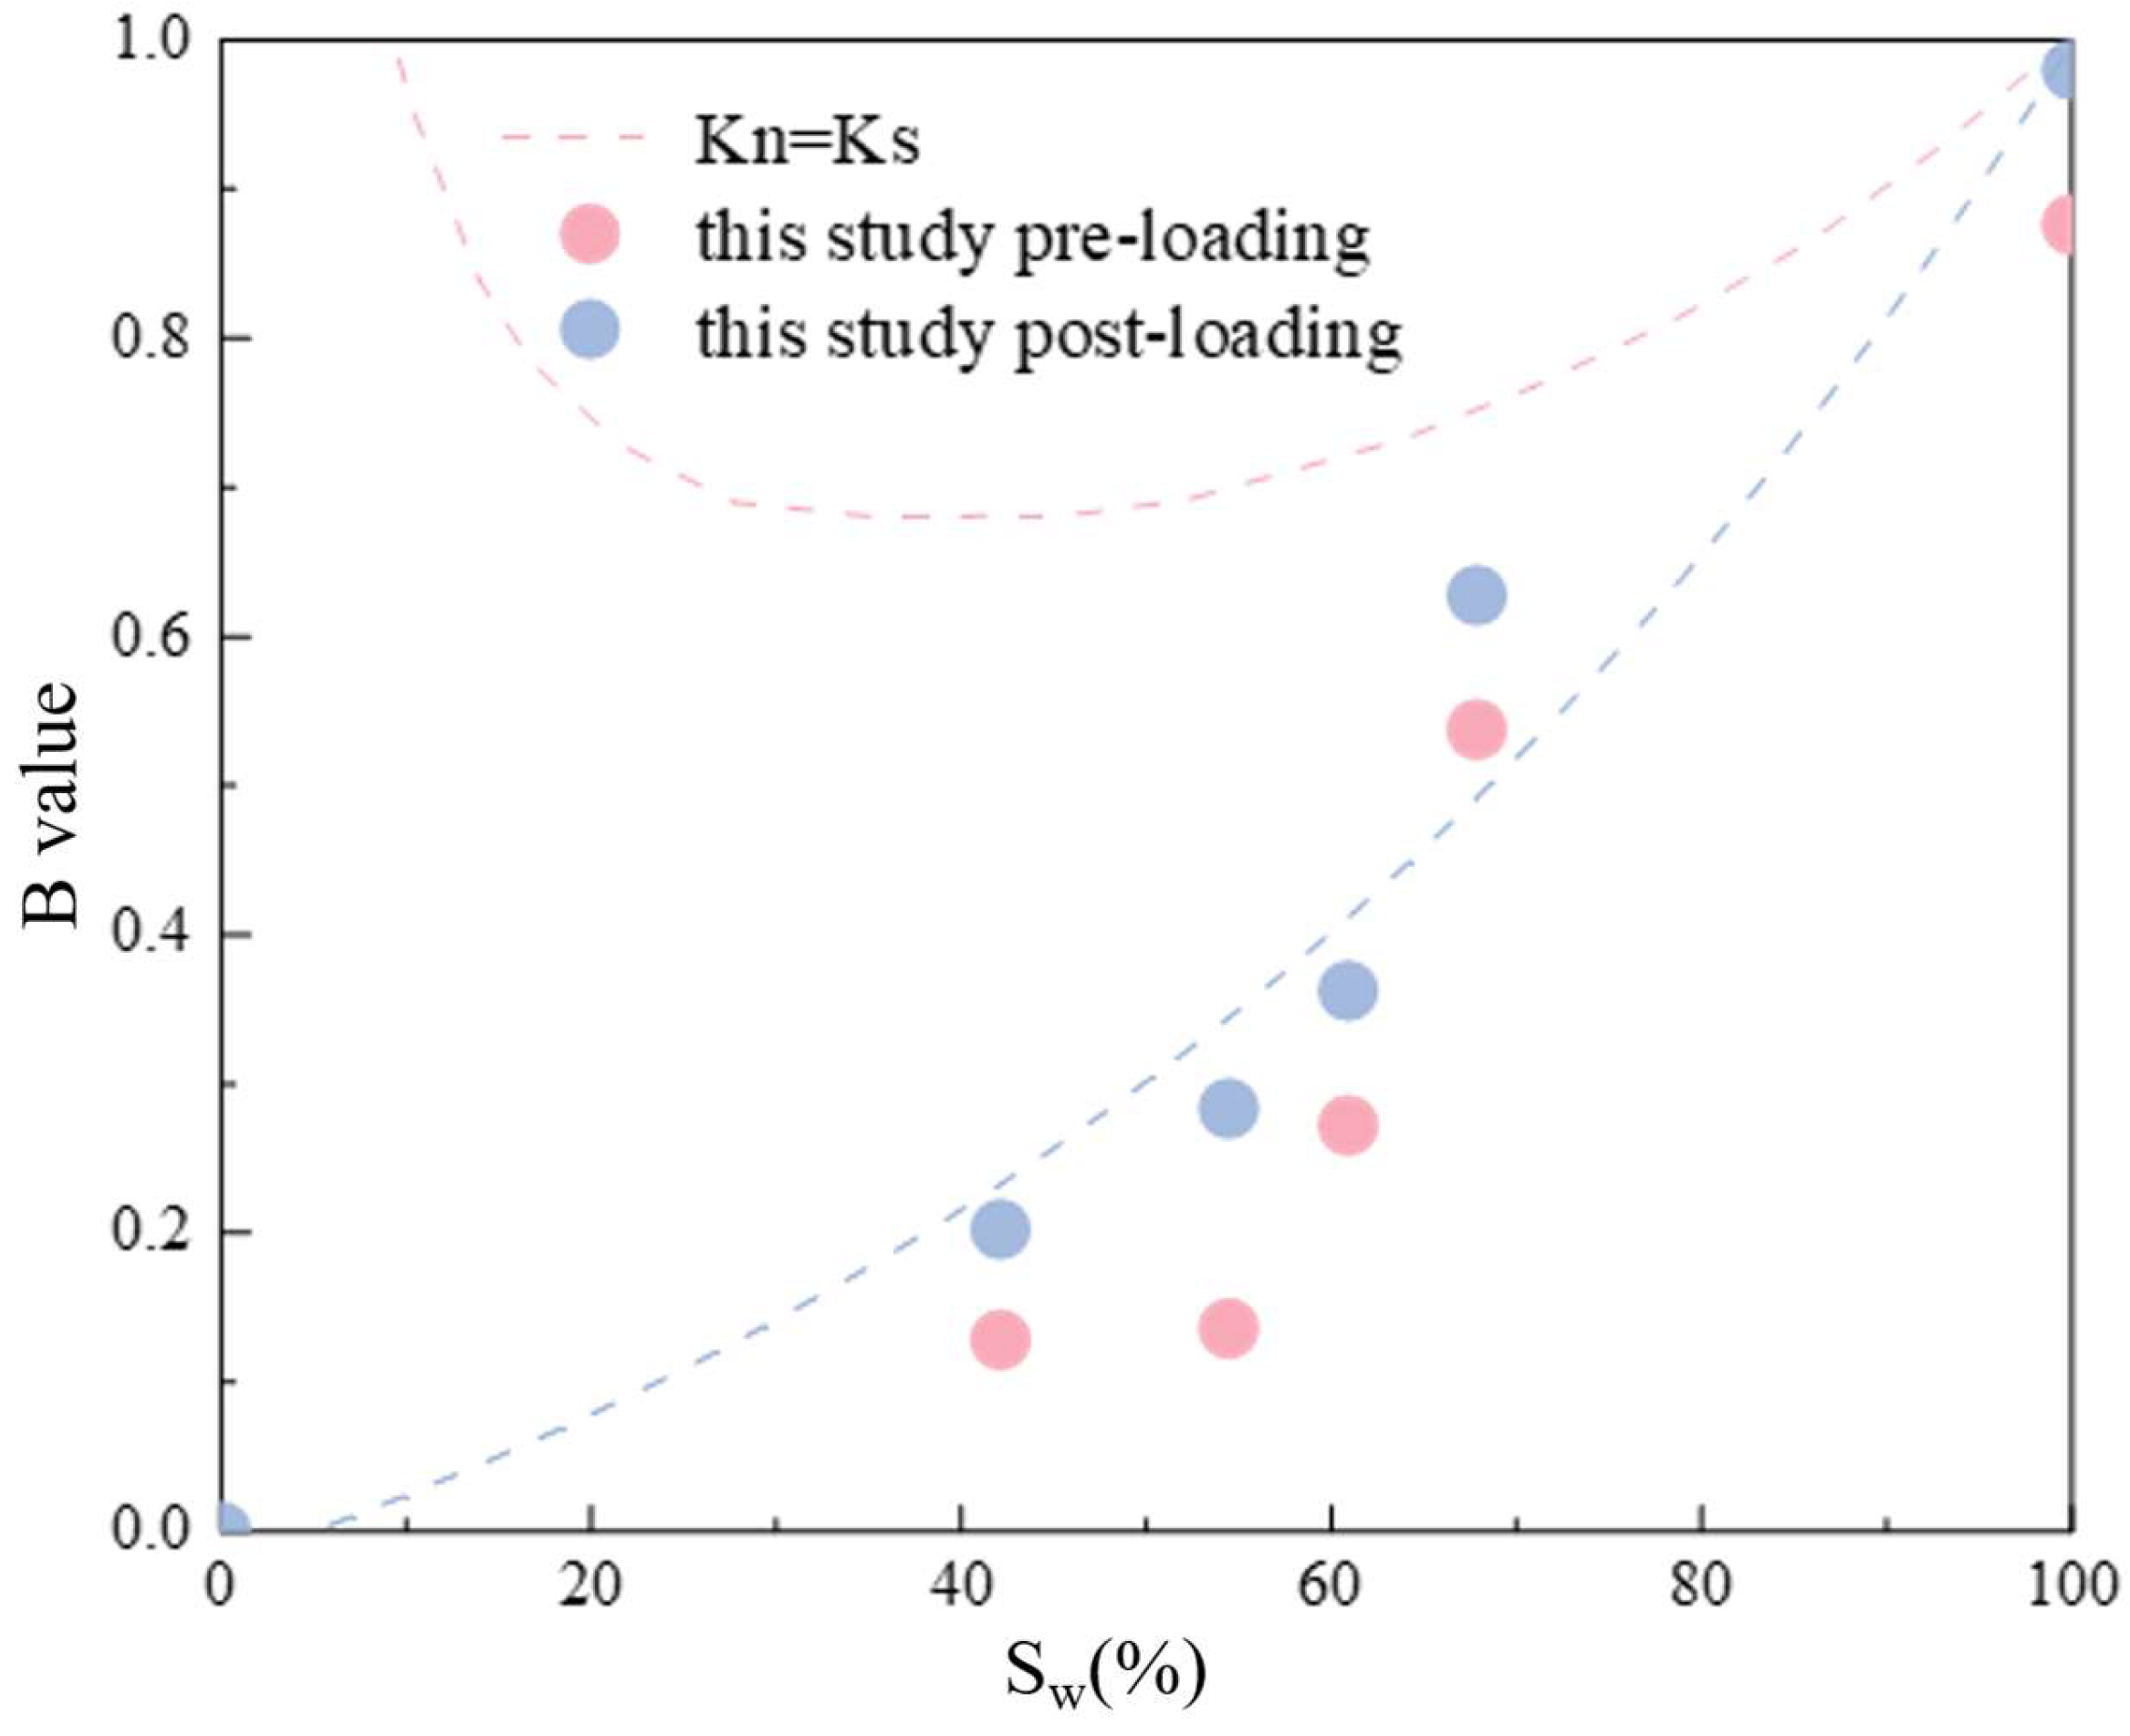
where Vp is the P-wave velocity, ρm, ρw, and ρi represent the densities of silt, water, and ice, respectively, and Cs denotes the volume fraction of silt. Once Cs and n are determined, the relationship between the UWS value and B value at the corresponding temperature can be estimated. The B value results, along with the estimated Sw values reflecting changes in the porosity of reactive frozen soil, are plotted in Figure 6 below. The figure shows that the observed trend aligns with the theoretical analysis results. However, theoretical calculations generally exceeded experimental measurements, indicating that the initial assumptions were overly idealized and could not be achieved under actual testing conditions. By fitting the experimental results, an empirical formula applicable to this study was derived, yielding a correlation coefficient of R2 = 0.95 between the predicted outcomes and experimental data. Specific values are detailed in Table 2.
B = A 1 e − S w t 1 + A 2 e − S w t 2 + y 0
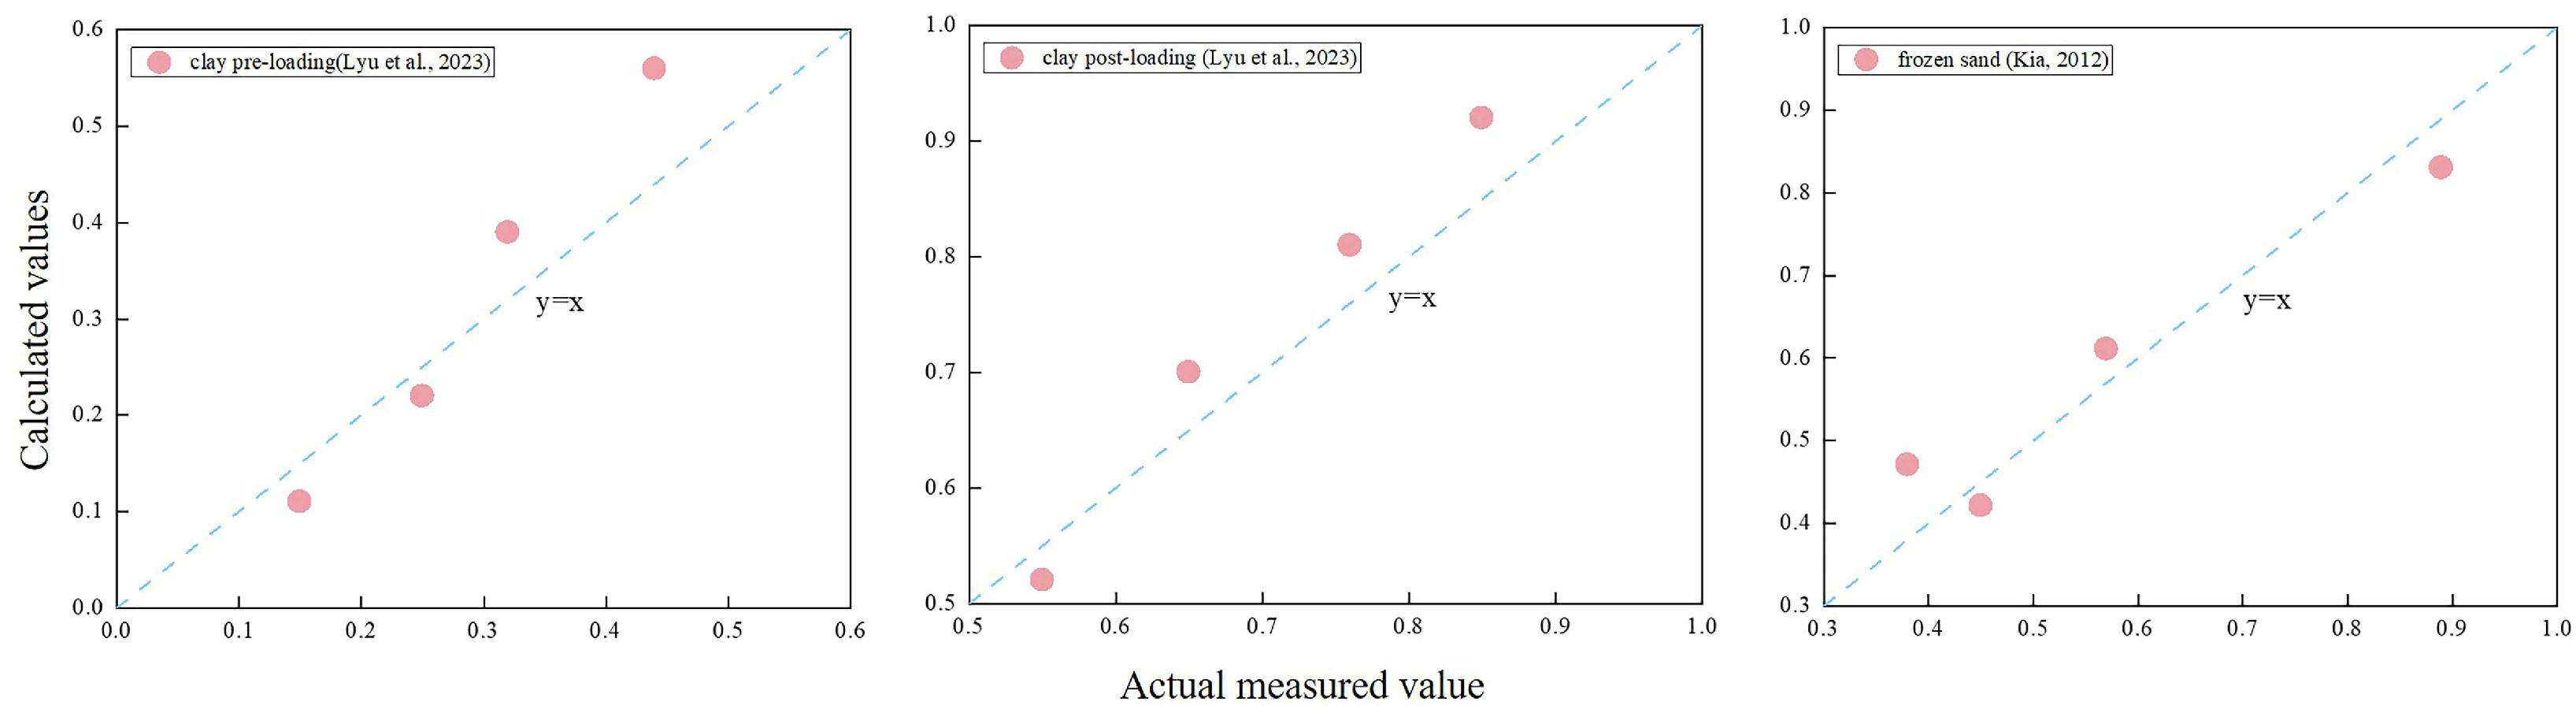
To further validate the reliability of the fitted formula, different data sets were selected for verification. The experimentally measured B values were compared with the results calculated from the fitted curve, yielding the results shown in Figure 7. As illustrated in the figure, although some dispersion exists, the fitted curve generally aligns with the trends of the selected data, demonstrating that the fitted formula possesses a certain degree of reliability.
It should be noted that the predictive accuracy of the proposed model depends on the estimation of unfrozen water saturation (UWS). Uncertainty in UWS may arise from KT model parameter calibration and variability in soil properties. A sensitivity analysis indicates that a variation of ±5% in UWS results in a moderate change in the predicted pore pressure coefficient, while the overall trend remains consistent. This suggests that the proposed model exhibits relatively stable predictive performance within practical engineering ranges. Nevertheless, further refinement of UWS estimation methods would help improve model reliability.
The proposed predictive relationship for the pore pressure coefficient has important implications for engineering applications in cold regions. It can be incorporated into numerical models for evaluating frost heave, thaw settlement, and subgrade stability under varying temperature conditions. In addition, the model provides a practical approach for estimating the pore pressure response in frozen soils without requiring extensive laboratory testing, thereby offering potential value for large-scale engineering design and risk assessment.

4. Conclusions

To address the limitations of existing studies in accurately predicting pore pressure coefficients in frozen soils, this study systematically investigates the determination of B-values. It examines the effects of temperature and stress history on the pore pressure coefficient and analyzes the underlying mechanisms using theoretical models, including the Gassmann equation. Furthermore, the study incorporates the soil freezing characteristic curve and introduces the plasticity index to estimate the variation in unfrozen water content with temperature. It then compares these results with the relationship between unfrozen water saturation (UWS) and pore pressure coefficients predicted by the KT model. The main conclusions are summarized as follows:
(1)
The B-value of frozen sandy silt, obtained from temperature-controlled triaxial tests, shows clear temperature dependence and sensitivity, with distinct stage characteristics. Both experimental results and theoretical analysis indicate that, during the initial cooling stage (−2 °C to −5 °C) prior to loading, the pore pressure coefficient decreases rapidly, followed by a more gradual decline as the temperature drops below −8 °C. After loading introduces a stress history, the pore pressure coefficient increases from 0.5375 to 0.6275 (a 23.6% increase) at the relatively high temperature (−2 °C). The increase in B-value becomes more pronounced during the intermediate temperature stage (−5 °C to −8 °C), whereas at lower temperatures (−8 °C to −11 °C), the effect of stress history on the B-value gradually diminishes.
(2)
Analysis based on the Gassmann equation and the soil freezing characteristic curve shows that decreasing temperature enhances ice crystal strength, reduces unfrozen water content, alters porosity, and consequently affects the B-value of frozen soil through the coupled influence of multiple factors, including the unfrozen water film and soil skeleton strength. Overall, the unfrozen water saturation (UWS) decreases progressively with decreasing temperature. Specifically, UWS declines from 100% (fully unfrozen) to approximately 20%, while the pore pressure coefficient B correspondingly decreases from 1 to 0.1285.
(3)
Experimental results and theoretical analysis of B-values demonstrate that the assumption Kn = Ks in the Gassmann model is invalid, rendering the model unsuitable for estimating B-values in frozen sandy silt. However, Kn varies with unfrozen water saturation (UWS) and may even take negative values. By fitting the experimental data, this study establishes a functional relationship between the pore pressure coefficient and UWS for frozen sandy silt. This relationship enables accurate prediction of the pore pressure coefficient based on UWS.

Author Contributions

Conceptualization, Z.Y.; data curation, writing—original draft, H.J.; project administration, J.H. All authors have read and agreed to the published version of the manuscript.

Funding

This research was supported by the National Natural Science Foundation of China General Program (42177153) and National Natural Science Foundation of China General Program (42372327).

Institutional Review Board Statement

Not applicable.

Informed Consent Statement

Not applicable.

Data Availability Statement

The data presented in this study are available on request from the corresponding author.

Conflicts of Interest

The authors declare no conflicts of interest.

References

  1. Wu, Z.; Li, Y.; Xu, G.; Wu, X.; Wei, H.; Ma, Y.; Tang, X. Shear characteristics of silty clay in seasonally frozen area of muling under different freeze-thaw conditions. Sci. Technol. Eng. 2025, 25, 15655–15664. [Google Scholar]
  2. Suh, H.S.; Sun, W. Multi-phase-field microporomechanics model for simulating ice-lens growth in frozen soil. Int. J. Numer. Anal. Methods Geomech. 2022, 46, 2307–2336. [Google Scholar] [CrossRef] [Scilit]
  3. Chen, Y.; Huang, Y.; Wang, S.; Mu, Y. Effects of Phase Change Materials on the Freeze-Thaw Performance of Expansive Soil. J. Mater. Civ. Eng. 2023, 35, 04023206. [Google Scholar] [CrossRef] [Scilit]
  4. Shi, Y.; Ma, W.; Zhang, L.; Yang, C.; Shang, F.; Chen, C. Change of pore water near the freezing front during soil freezing: Migration and mechanisms. Pedosphere 2024, 34, 770–782. [Google Scholar] [CrossRef] [Scilit]
  5. Wei, G.; Wang, Z.; Liu, Y.; Wang, Y.; Hu, X. Experimental Study on Soil Freezing Parameters for Subgrade Engineering Cold Regions. Subgrade Eng. 2026, 1–6. [Google Scholar] [CrossRef]
  6. Hart, D.J.; Wang, H.F. Variation of unjacketed pore compressibility using Gassmann’s equation and an overdetermined set of volumetric poroelastic measurements. Geophysics 2010, 75, N9–N18. [Google Scholar] [CrossRef] [Scilit]
  7. Makhnenko, R.Y.; Labuz, J.F. Elastic and inelastic deformation of fluid-saturated rock. Philos. Trans. R. Soc. A 2016, 374, 2078. [Google Scholar] [CrossRef] [Scilit] [PubMed]
  8. Kia, M. Measuring Pore-water Pressure in Partially Frozen Soils. Ph.D. thesis, University of Alberta Library, Edmonton, AB, Canada, 2012. [Google Scholar]
  9. Lyu, C.; Grimstad, G.; Nishimura, S. Pore pressure coefficient in frozen soils. Géotechnique 2023, 73, 521–530. [Google Scholar] [CrossRef] [Scilit]
  10. Akagawa, S.; Hiasa, S.; Kanie, S. Pore water and effective pressure in the frozen fringe during soil freezing. In Proceedings of the Ninth International Conference on Permafrost, Fairbanks, AK, USA, 28 June–3 July 2008. [Google Scholar]
  11. Eigenbrod, K.D.; Knutsson, S.; Sheng, D. Pore-Water Pressures in Freezing and Thawing Fine-Grained Soils. J. Cold Reg. Eng. 1996, 10, 77–92. [Google Scholar] [CrossRef] [Scilit]
  12. Mcroberts, E.C.; Morgenstern, N.R. Pore Water Expulsion during Freezing. Can. Geotech. J. 1975, 12, 130–141. [Google Scholar] [CrossRef] [Scilit]
  13. Seto, J.; Konrad, J.-M. Pore pressure measurements during freezing of an overconsolidated clayey silt. Cold Reg. Sci. Technol. 1994, 22, 319–338. [Google Scholar] [CrossRef] [Scilit]
  14. Taber, S. The Mechanics of Frost Heaving. J. Geol. 1930, 38, 303–317. [Google Scholar] [CrossRef] [Scilit]
  15. Williams, P.J. Pore Pressures at a Penetrating Frost line and their prediction. Géotechnique 1966, 16, 187–208. [Google Scholar] [CrossRef] [Scilit]
  16. Liu, S.W.; Zhang, J.M.; Zhang, H.; Su, K. Preliminary discussion on pressure measurement of pore water in warm frozen soil. J. Gansu Agric. Univ. 2011, 46, 155–160. [Google Scholar]
  17. Zhang, L.H.; Ma, W.; Yang, C.S. Testing Study on Pore Water Pressure in Soils During Freeze-Thaw Cycles. Rock Soil Mech. 2015, 36, 1856–1864. [Google Scholar]
  18. Wang, N.N.; Zhang, H.; Zhang, J.M.; Zhao, Z.; Zhou, P. Experimental Study on Pore Water Pressure in High-Temperature Frozen Soil under Different Temperature and Drainage Conditions. Glaciers Frozen Soil 2018, 40, 1167–1172. [Google Scholar]
  19. Gilpin, R.R. A model for the prediction of ice lensing and frost heave in soils. Water Resour. Res. 1980, 16, 918–930. [Google Scholar] [CrossRef] [Scilit]
  20. Kong, L.M.; Wang, Y.S.; Sun, W.J.; Qi, J. Influence of plasticity on unfrozen water content of frozen soils as determined by nuclear magnetic resonance. Cold Reg. Sci. Technol. 2020, 172, 102993. [Google Scholar] [CrossRef] [Scilit]
  21. Bi, J.; Wang, G.X.; Wu, Z.J.; Wen, H.; Zhang, Y.; Lin, G.; Sun, T. Investigation on unfrozen water content models of freezing soils. Front. Earth Sci. 2023, 10, 1039330. [Google Scholar] [CrossRef] [Scilit]
  22. Patterson, D.; Smith, M. Unfrozen water content in saline soils: Results using time-domain reflectometry. J. Can. Geotech. J. 1985, 22, 95–101. [Google Scholar] [CrossRef] [Scilit]
  23. Liu, J.; Yang, P.; Yang, Z.J. Electrical properties of frozen saline clay and their relationship with unfrozen water content. Cold Reg. Sci. Technol. 2020, 178, 103127. [Google Scholar] [CrossRef] [Scilit]
  24. Zhou, J.; Meng, X.; Wei, C.; Pei, W. Unified soil freezing characteristic for variably-saturated saline soils. Water Resour. Res. 2020, 56, e2019WR026648. [Google Scholar] [CrossRef] [Scilit]
  25. Berge, P.; Wang, H.; Bonner, B. Pore pressure buildup coefficient in synthetic and natural sandstones. Int. J. Rock Mech. Min. Sci. Geomech. Abstr. 1993, 30, 1135–1141. [Google Scholar] [CrossRef] [Scilit]
  26. Gassmann, F. On elasticity of porous media. In Classics of Elastic Wave Theory; SEG: Houston, TX, USA, 2007. [Google Scholar]
  27. Chen, S.J.; Ma, W.; Li, G.Y. A novel approach for characterizing frozen soil damage based on mesostructure. Int. J. Damage Mech. 2022, 31, 444–463. [Google Scholar] [CrossRef] [Scilit]
  28. Liu, B.; Fan, H.M.; Jiang, Y.Z.; Ma, R. Linking pore structure characteristics to soil strength and their relationships with detachment rate of disturbed Mollisol by concentrated flow under freeze-thaw effects. J. Hydrol. 2023, 617, 129052. [Google Scholar] [CrossRef] [Scilit]
  29. Zhang, S.R.; Xu, X.; Dong, X.Q.; Lei, H.; Sun, X. Effects of Freeze-Thaw Cycles on the Mechanical Properties and Microstructure of a Dispersed Soil. Appl. Sci. 2023, 13, 17. [Google Scholar] [CrossRef] [Scilit]
  30. Yin, X.; Lai, Y.M.; Liu, E.L. Microstructure-based effective stress for unsaturated frozen soils. Int. J. Numer. Anal. Methods Geomech. 2023, 47, 261–274. [Google Scholar] [CrossRef] [Scilit]
  31. Yin, X.; Liu, E.L.; Zhang, C. Predicting the soil freezing characteristic curve of the expansive soil with double porosity accounting for hydraulic effects. J. Hydrol. 2022, 612, 128260. [Google Scholar] [CrossRef] [Scilit]
  32. Lu, Z. A Study on the Dynamic Characteristics of Rubber-Reinforced Expansive Soil Under Freeze-Thaw Cycles. Master’s Thesis, Qingdao University of Technology, Qingdao, China, 2023. [Google Scholar]
  33. King, M. The influence of clay-sized particles on seismic velocity for Canadian Arctic permafrost. Can. J. Earth Sci. 1984, 21, 19–24. [Google Scholar] [CrossRef] [Scilit]
  34. Zimmerman, R.W.; King, M.S. The effect of the extent of freezing on seismic velocities in unconsolidated permafrost. Geophysics 1986, 51, 1285–1290. [Google Scholar] [CrossRef] [Scilit]
  35. Lyu, C.; Amiri, S.A.G.; Grimstad, G.; Høyland, K.V.; Ingeman-Nielsen, T. Comparison of geoacoustic models for unfrozen water content estimation. J. Geophys. Res. Solid Earth 2020, 125, e2020JB019766. [Google Scholar] [CrossRef] [Scilit]
  36. Yun, T.S.; Francisca, F.M.; Santamarina, J.C.; Ruppel, C. Compressional and shear wave velocities in uncemented sediment containing gas hydrate. Geophys. Res. Lett. 2005, 32, 10. [Google Scholar] [CrossRef] [Scilit]
Figure 1. Schematic Diagram of Test Specimens and Test Apparatus.
Applsci 16 03263 g001
Figure 2. Variation in pore pressure coefficient B with temperature and loading history. (u, pore pressure; p, confining pressure; w0, moisture content of unfrozen saturated specimen; T, test temperature).
Applsci 16 03263 g002
Figure 3. Model-Estimated Unfrozen Water Content Curve Diagram.
Applsci 16 03263 g003
Figure 4. Variation in Unfrozen Water Saturation of Different Soil Types with Temperature [9,22,23,24].
Applsci 16 03263 g004
Figure 5. Analysis of the B Value in Frozen Soil Using the Gassmann Equation [8,9].
Applsci 16 03263 g005
Figure 6. Comparison of KT Model Calculation Results with Experimental Results and Fitting Curves.
Applsci 16 03263 g006
Figure 7. Comparison Chart of Fitted B Values and Measured B Values [8,9].
Applsci 16 03263 g007
Table 1. Model calculation of empirical parameter values.
MaterialK: GPa G: GPaρ: g/cm3n: %
Water2.2501.000-
Ice8.43.70.920-
Sandy silt0.3450.0851.58530.93
Table 2. Parameter values in the fitting formula.
Parametersy0A1t1A2t2
Value−0.3040.158−65.3130.124−65.316
Disclaimer/Publisher’s Note: The statements, opinions and data contained in all publications are solely those of the individual author(s) and contributor(s) and not of MDPI and/or the editor(s). MDPI and/or the editor(s) disclaim responsibility for any injury to people or property resulting from any ideas, methods, instructions or products referred to in the content.