6.1. Metal Content in Water Samples
To compare the concentration values of the determined metals in water samples against established quality limits, the Ordinance on Compliance Parameters, Methods of Analysis, and Monitoring of Water Intended for Human Consumption were considered [
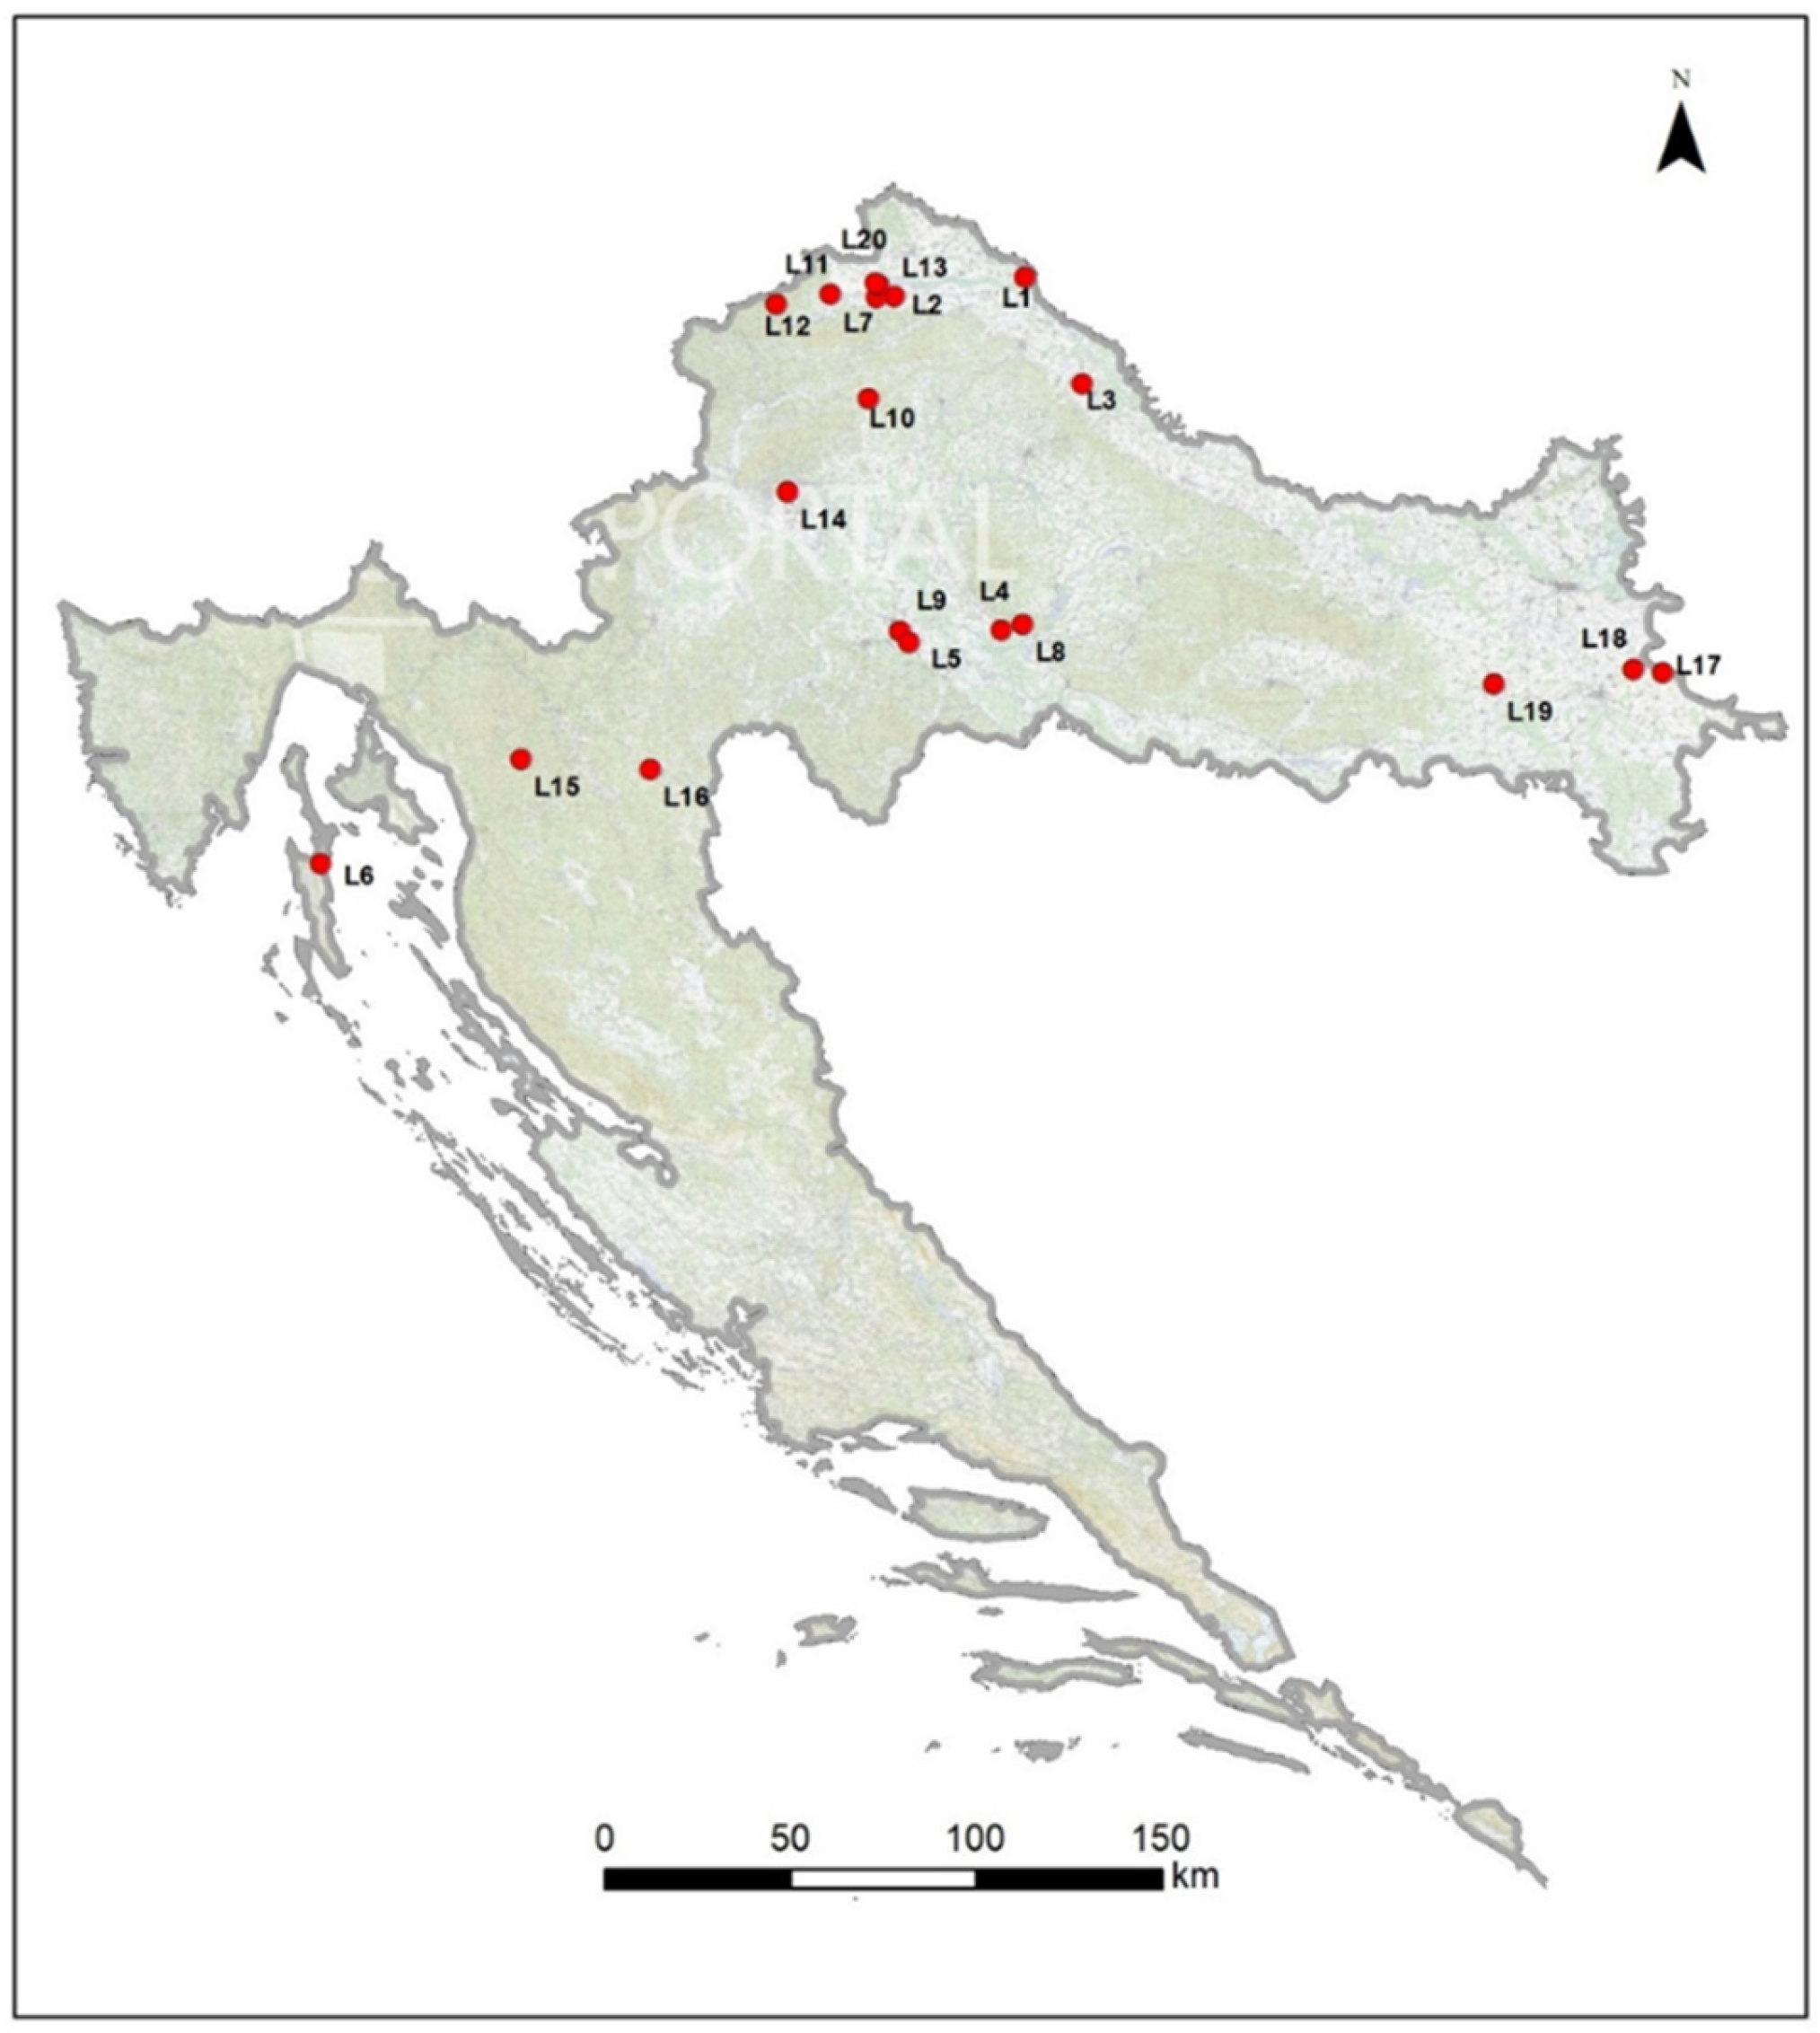
24]. According to the ordinance, the concentration of hydrogen ions (i.e., the pH value) in water intended for human consumption should be between 6.5 and 9.5, indicating that the pH values of the water samples from almost all investigated locations meet the prescribed range. Exceptions include sample L14, with the lowest measured pH value of 5.72, followed by sample L20, with a pH value of 6.00. Both water samples—L14 from Zagreb near the Faculty of Veterinary Medicine and L20 from a public orchard in Varaždin—were precipitation or rainwater samples. At the time of sampling, no natural source of water was available from location L17.
The maximum allowable concentration (MAC) for As is 10 µg/L [
24]. The As concentrations in the water samples were lower than the specified value, except for that at L19, with the highest concentration of 12.28 µg/L. The Geochemical Atlas of the Republic of Croatia [
26] reports a mean value of As in freshwater of 0.002 mg/L, which is generally consistent with the rest of the obtained results. Sample L19 likely had an elevated As concentration due to both its natural origin and the influence of surrounding intensive agriculture, which uses plant protection products and mineral fertilizers containing As [
27].
The MAC for Cd is 5 µg/L [
24]. All water samples showed Cd concentrations below the detection limit of the instrument and method; that is, less than 0.002 µg/L. The Geochemical Atlas [
26] does not provide a mean value for the concentration of this element in freshwater.
The MAC for Co is not indicated [
24]. The mean value of Co in freshwater is 0.0001 mg/L, or 0.1 µg/L [
26], which generally corresponds to the measured values.
The MAC for Cr is 25 µg/L [
24]. Analyses of water samples from all investigated locations showed Cr concentrations below the detection limit of the instrument and method; that is, less than 0.003 mg/L. The average concentration of Cr in freshwater is 0.001 mg/L [
26], and there was no deviation from this data in the measured samples.
The MAC for Cu is 2 mg/L [
24]. Analyses of water samples from all investigated locations showed Cu concentrations below the detection limit of the instrument and method; that is, less than 0.0015 mg/L. According to the data, the mean concentration of Cu in freshwater is 0.003 mg/L [
26]; the obtained data show lower concentrations of this metal in the water samples.
The MAC for Fe is 200 µg/L [
24]. All water samples, except L3, showed an Fe concentration lower than the detection limit of the instrument and method; that is, lower than 0.005 mg/L. The concentration of Fe in water sample L3 was below the prescribed limit at 0.027 mg/L. The average value of Fe in freshwater is 0.1 mg/L [
26], with the obtained results showing slightly lower values.
The MAC for Hg is 1.0 µg/L [
24]. All samples contained a certain concentration of Hg, but still below the maximum allowed concentration in each sample. The Geochemical Atlas does not provide a mean value for the Hg concentration in freshwater [
26].
The MAC for Mn is 50 µg/L [
24]. In all water samples, the concentration of Mn was below the detection limit of the instrument and method (i.e., below 0.0015 mg/L), except for sample L5 (with 0.018 mg/L). The mean value of Mn in freshwater is 0.015 mg/L [
26]; the measured value in L5 in this study coincides with the given data, while those in the other samples are lower than the average value.
The MAC for Ni is 20 µg/L [
24]. The Ni concentrations in all water samples were lower than the given value. In freshwater, the average concentration is 0.0015 mg/L [
26], and the obtained results are close to this value.
The MAC for Pb is 5 µg/L [
24]. The highest measured concentration was in L20, where it amounted to 27.75 µg/L and exceeded the MAC by five times. This can be explained by the fact that the rainwater, with an acidic pH, was sampled at L20 from a depression in a plastic slide, as Pb is used in pigments and as a stabilizer in plastic [
28]. Given the acidic pH value of the water and that the plastic mass had been exposed to constant daily heating and expansion, nightly cooling and contraction, and freezing during the colder part of the year for a long time (years), it is possible to expect higher concentrations of Pb derived from the colored plastic material. The concentration of Pb in freshwater is 0.003 mg/L [
26], with the measured values falling below the limit (except in sample L20, as explained above).
The MAC for Se is 20 µg/L [
24]. Samples from all locations showed Se concentrations lower than the detection limit of the instrument and method; that is, lower than 0.05 µg/L. In the Geochemical Atlas, there is no data for Se in soil or water [
26].
The MAC for Zn is 3 mg/L [
24]. In all samples, the concentration of Zn was below this limit. The concentration of this element in freshwater is 0.02 mg/L [
26]. This is in accordance with the water sample analysis results; with the exception of sample L13, where the Zn concentration was several times higher than the natural average, but still well below the MAC.
6.2. Metal Content in Soil Samples
Soil acidity (expressed as pH) at the studied locations varied from 3.30, which represents highly acidic soil, to 8.19, indicating alkaline soil [
29]. The humus concentration in the studied soils ranged from 1.72 to 14.10, classifying the studied soils as poorly supplied with humus to those very richly supplied according to the categorization [
29].
Arsenic (As) in the analyzed soil samples, according to the Ordinance on the Protection of Agricultural Land from Contamination [
25], must not exceed 15, 25, or 30 mg/kg of dry matter depending on the pH value of the soil. All samples contained a certain concentration of As, but it was below the MAC in each sample. Therefore, it can be considered that the analyzed soils were not contaminated with arsenic. The Geochemical Atlas of the Republic of Croatia [
26] states that the average concentration of As in soils is about 6 mg/kg. Samples such as L1 near Donja Dubrava, with 15.018 mg/kg, and L5 Prelošćica near Sisak, with 13.840 mg/kg, showed twice the average, which can be attributed to anthropogenic impacts from agricultural production due to the use of protective agents and certain mineral fertilizers containing As [
27].
Cadmium (Cd) in soil, according to the ordinance [
25], must not exceed 1, 1.5, or 2 mg/kg of dry matter. All samples contained a certain concentration of Cd, but at levels below the MAC; therefore, the analyzed soils can be considered uncontaminated by cadmium. According to data from the Geochemical Atlas [
26], the average value of Cd concentration in soils is 0.5 mg/kg. The values in the samples were lower than the average for soils in Croatia, except in sample L6, where the naturally increased concentration may be due to the composition of the soil of coastal Croatia.
Cobalt (Co) in soil must not exceed 30, 50, or 60 mg/kg of dry matter [
25]. All samples contained a certain concentration of Co, but below the MAC; therefore, the analyzed soils can be considered uncontaminated by cobalt. The Atlas [
26] reports Co concentrations in soils ranging from 1 to 40 mg/kg, with a mean value of 13 mg/kg for Croatia. All samples fell within this range.
Chromium (Cr) in soil must not exceed 40, 80, or 120 mg/kg of dry matter [
25]. All samples contained a certain concentration of Cr, but below the MAC; except in sample L12, where it amounted to 45.793 mg/kg. The rest of the analyzed soils were categorized as not contaminated with chromium. The Atlas [
26] reports Cr concentrations in soils ranging from 5 to 1000 mg/kg or even more than 1%. All analyzed samples fell within this range.
Copper (Cu) in soil samples must not exceed 60, 90, or 120 mg/kg of dry matter [
25]. All samples contained a certain concentration of Cu, but below the MAC; except for sample L8. While the other soils can be considered uncontaminated by copper, the highest concentration was in sample L8 from the Kutina area, which amounted to 186.258 mg/kg, exceeding the MAC by three times. According to data from the Geochemical Atlas [
26], the Cu concentration in soils ranges from 2 to 250 mg/kg. All analyzed samples fell within this range. The significantly elevated concentration of copper in sample L8 can attributed to its proximity to industrial facilities and their long-term activity, as well as the use of copper-based protective agents, such as copper sulfate, for plant protection in surrounding orchards and vineyards [
30].
Iron (Fe) in soil, according to the Geochemical Atlas [
26], has an average value of 2.1%, which corresponds to the average concentration of this metal in the analyzed samples. The ordinance [
26] does not set a MAC for iron.
Mercury (Hg) in soil must not exceed 0.5, 1.0, or 1.5 mg/kg of dry matter [
25]. All samples contained a certain concentration of Hg, but below the MAC; therefore, all analyzed soils can be considered uncontaminated by mercury. The average value for mercury in soils is 0.05 mg/kg [
26], which corresponds to the concentration in most of the analyzed samples. The concentration is higher in mountainous and coastal Croatia than in northern Croatia, as illustrated by the measured concentration of 0.215 mg/kg at L6 near Orlec on the island of Cres.
Manganese (Mn) in soil, according to the Atlas [
26], has an average value of 1000 mg/kg and ranges from 20 to 10,000 mg/kg. This corresponds to the average concentration of this metal in the analyzed samples. The ordinance does not set a MAC for manganese [
25].
Nickel (Ni) in soil must not exceed 30, 50, or 75 mg/kg of dry matter [
25]. All samples contained a certain concentration of Ni. Concentrations were below the MAC in all samples except those from locations L11 (with 30.409 mg/kg), L12 (with 49.968 mg/kg), and L16 (with 50.033 mg/kg), indicating that these areas are the most contaminated with nickel. Nickel is reported to be below 100 mg/kg in most soils, and its concentration is between 20 and 30 mg/kg in temperate soils [
1,
26]. All analyzed samples fell within the specified average range.
Lead (Pb) in soil must not exceed 50, 100, or 150 mg/kg of dry matter [
25]. All samples contained a certain concentration of Pb, but below the MAC; therefore, all analyzed soils can be considered uncontaminated by lead. Lead is reported to range from 2.6 to 83 mg/kg in soil, and its average concentration is around 14 mg/kg [
1,
26]. All samples fell within the specified range.
Selenium (Se) ranges from 0.1 to 1.0 mg/kg in soil [
1]. All analyzed samples fell within this range. The Atlas [
26] and the ordinance [
25] do not state an average or MAC for selenium.
Zinc (Zn) in soil must not exceed 60, 150, or 200 mg/kg of dry matter [
25]. According to the data [
26], the average value for zinc in soils is between 10 and 300 mg/kg, which corresponds to the concentrations in all analyzed samples. Comparing the obtained values in individual samples with the ordinance [
25] and the MAC, the following samples were considered to be contaminated: L2 with a value of 80.906 mg/kg, L3 with 177.500 mg/kg, L4 with 133.663 mg/kg, L6 with 248.131 mg/kg, L8 with 126.821 mg/kg, L12 with 107.767 mg/kg, and L19 with 161.794 mg/kg. The soil from location L3 had a concentration almost three times higher than that specified. This location is related to intensive agricultural production, and the contamination can be associated with the use of mineral phosphate fertilizers [
31,
32].
6.3. Metal Content in Melliferous Plant Samples
The maximum allowable concentrations of heavy and toxic metals in honey plants are not regulated by any ordinance. The analysis results for metals in the flowers of melliferous plants are presented in order from the lowest determined concentration to the highest concentration of each element. The samples of melliferous plant flowers contained the lowest concentration of Hg, with its concentration remaining below the detection limit of the instrument and method (i.e., <0.01 mg/kg) in 13 samples. The As concentration was <0.03 mg/kg in most of the soil samples, with the highest measured concentration occurring in sample L18 (0.12 mg/kg). The Cd concentration was <0.01 mg/kg in samples L6 and L10 to L12, while the highest cadmium concentrations were measured in samples L8 and L19 (0.15 mg/kg). Co was below the detection limit (i.e., <0.05 mg/kg) in sample L13, while the highest concentration of this metal was measured in sample L8 (with 0.87 mg/kg). Pb was present in samples from all locations and was highest in sample L18 (at 0.39 mg/kg). Cr was present in all samples, and its highest concentration was also in sample L18 (at 0.93 mg/kg). Se was not present in all plant samples and was below 0.05 mg/kg in samples L6, L13, L16, L17, L19, and L20; meanwhile, it was most abundant in sample L3 (at 2.82 mg/kg). Cu was also found in the plant materials from all locations, with the highest concentration observed in sample L18 (at 22.75 mg/kg). All samples also contained Ni, with the highest concentration in sample L4 (at 30.80 mg/kg). Mn was present in all 20 analyzed samples, with the highest concentration observed in sample L16 (at 414.70 mg/kg). All samples contained Zn, with the highest concentration in sample L11 (at 87.40 mg/kg). None of the plant flower samples contained Zn in a concentration considered toxic to plants, i.e., within the range from 150 to 200 mg/kg. Fe was present in the highest concentrations in the analyzed samples—especially in L18, where it amounted to 183.33 mg/kg.
Kumar et al. have provided a detailed table showing heavy metal concentrations in different plant species, depending on the part of the plant analyzed [
18]. For brown mustard (
Brassica juncea) from the area of Victoria in Australia and Amritsar, concentrations of 1.30 mg/kg Cu and 62 mg/kg Ni were determined in young leaves. In mature seeds of
B. napus (Konya, Turkey), Cu was found at a concentration of 2.17 mg/kg and Mn was found at a concentration of 22.8 mg/kg. In the leaves of
B. oleracea (Amritsar), the measured concentrations were as follows: Co (8.10 mg/kg), Cr (5.0 mg/kg), Cu (3.00 mg/kg), Mn (2.50 mg/kg), Ni (6.10 mg/kg) and Zn (33.6 mg/kg). The leaves of
B. nigra (Amritsar) contained Co (2.80 mg/kg), Cr (5.10 mg/kg), Cu (7.50 mg/kg), Mn (2.70 mg/kg), Ni (4.60 mg/kg), and Zn (39.0 mg/kg). The results obtained from rapeseed flower samples from locations in the Republic of Croatia can be compared with those for mature rapeseed from Turkey as seeds are formed from fertilized flowers, thus providing a basis for comparison. There was a difference in the concentration of Cu, with that in samples L1 to L5 being up to five times lower than the quoted values. The case of Mn is the opposite, as its concentration in the mentioned samples was up to five times higher compared to those from Turkey. Furthermore, the pollen of broad-leaved linden (
Tilia platyphyllos) from the area in Romania contained Cd (0.07 mg/kg), Cr (1.50 mg/kg), Cu (9.22 mg/kg), Mn (71.9 mg/kg), Ni (0.63 mg/kg), Pb (0.44 mg/kg), and Zn (18.8 mg/kg) [
18]. In common linden (
T. vulgaris) from the area of Katowice in Poland, the measured concentrations in the leaves were Cu (1.58 mg/kg), Mn (6.36 mg/kg), and Zn (55.1 mg/kg) [
18]. Pollen analyses are similar to analyses of linden flowers, so it is interesting to compare the obtained data. The concentration of Cd in flowers compared to the concentration in pollen was almost identical in samples L13 and L17, while it was somewhat lower in sample L14. The Cr concentration was up to seven times lower than that in linden flowers. The concentration of Cu was lower in L13 and L14, and higher in L17, and the same pattern was observed for the concentration of Mn. The value for Ni was almost identical in sample L14, slightly lower in L13, and higher in L17. Pb showed significantly lower concentrations in flower samples than in pollen. Zn was present in the same concentration in pollen samples and L17, while it was somewhat increased in L13 and L14. The largest deviations in concentrations were observed for the metals Cr and Pb, which were many times lower in linden flowers. In samples of the whole sweet chestnut plant (
C. sativa) from the area of Bozdag Izmir in Turkey, the following concentrations were measured: Mn (1.12 mg/kg), Ni (0.05 mg/kg), Pb (0.38 mg/kg), and Zn (0.40 mg/kg). Sunflower (
H. annuus) from the area of Konya in Turkey was reported to contain Cu (18.1 mg/kg) and Mn (6.95 mg/kg) in mature seeds [
18]. Comparing the concentrations of Mn, Ni, Pb, and Zn in the chestnut samples from Turkey with those obtained in this research, it is evident that Mn was about 370 times higher in the L16 chestnut flower sample from Slunj, Ni was 40 times higher, Pb was almost 5 times lower, and Zn was over 50 times higher than in the chestnut plant from Izmir. Regarding the contents of Cu and Mn in mature sunflower seeds from Turkey—which were compared with the contents of the same metals in sunflower flowers from locations L18, L19, and L20—it can be seen that the Cu concentration was almost the same as in the cited data; meanwhile, the Mn concentration was three to six times higher, depending on the individual sample.
6.4. Cluster Analysis
Hierarchical cluster analyses are increasingly used in environmental studies, including those involving heavy metal determination and monitoring [
2,
11,
33]. The results of this research are presented through cluster analysis performed using the DATAtab program [
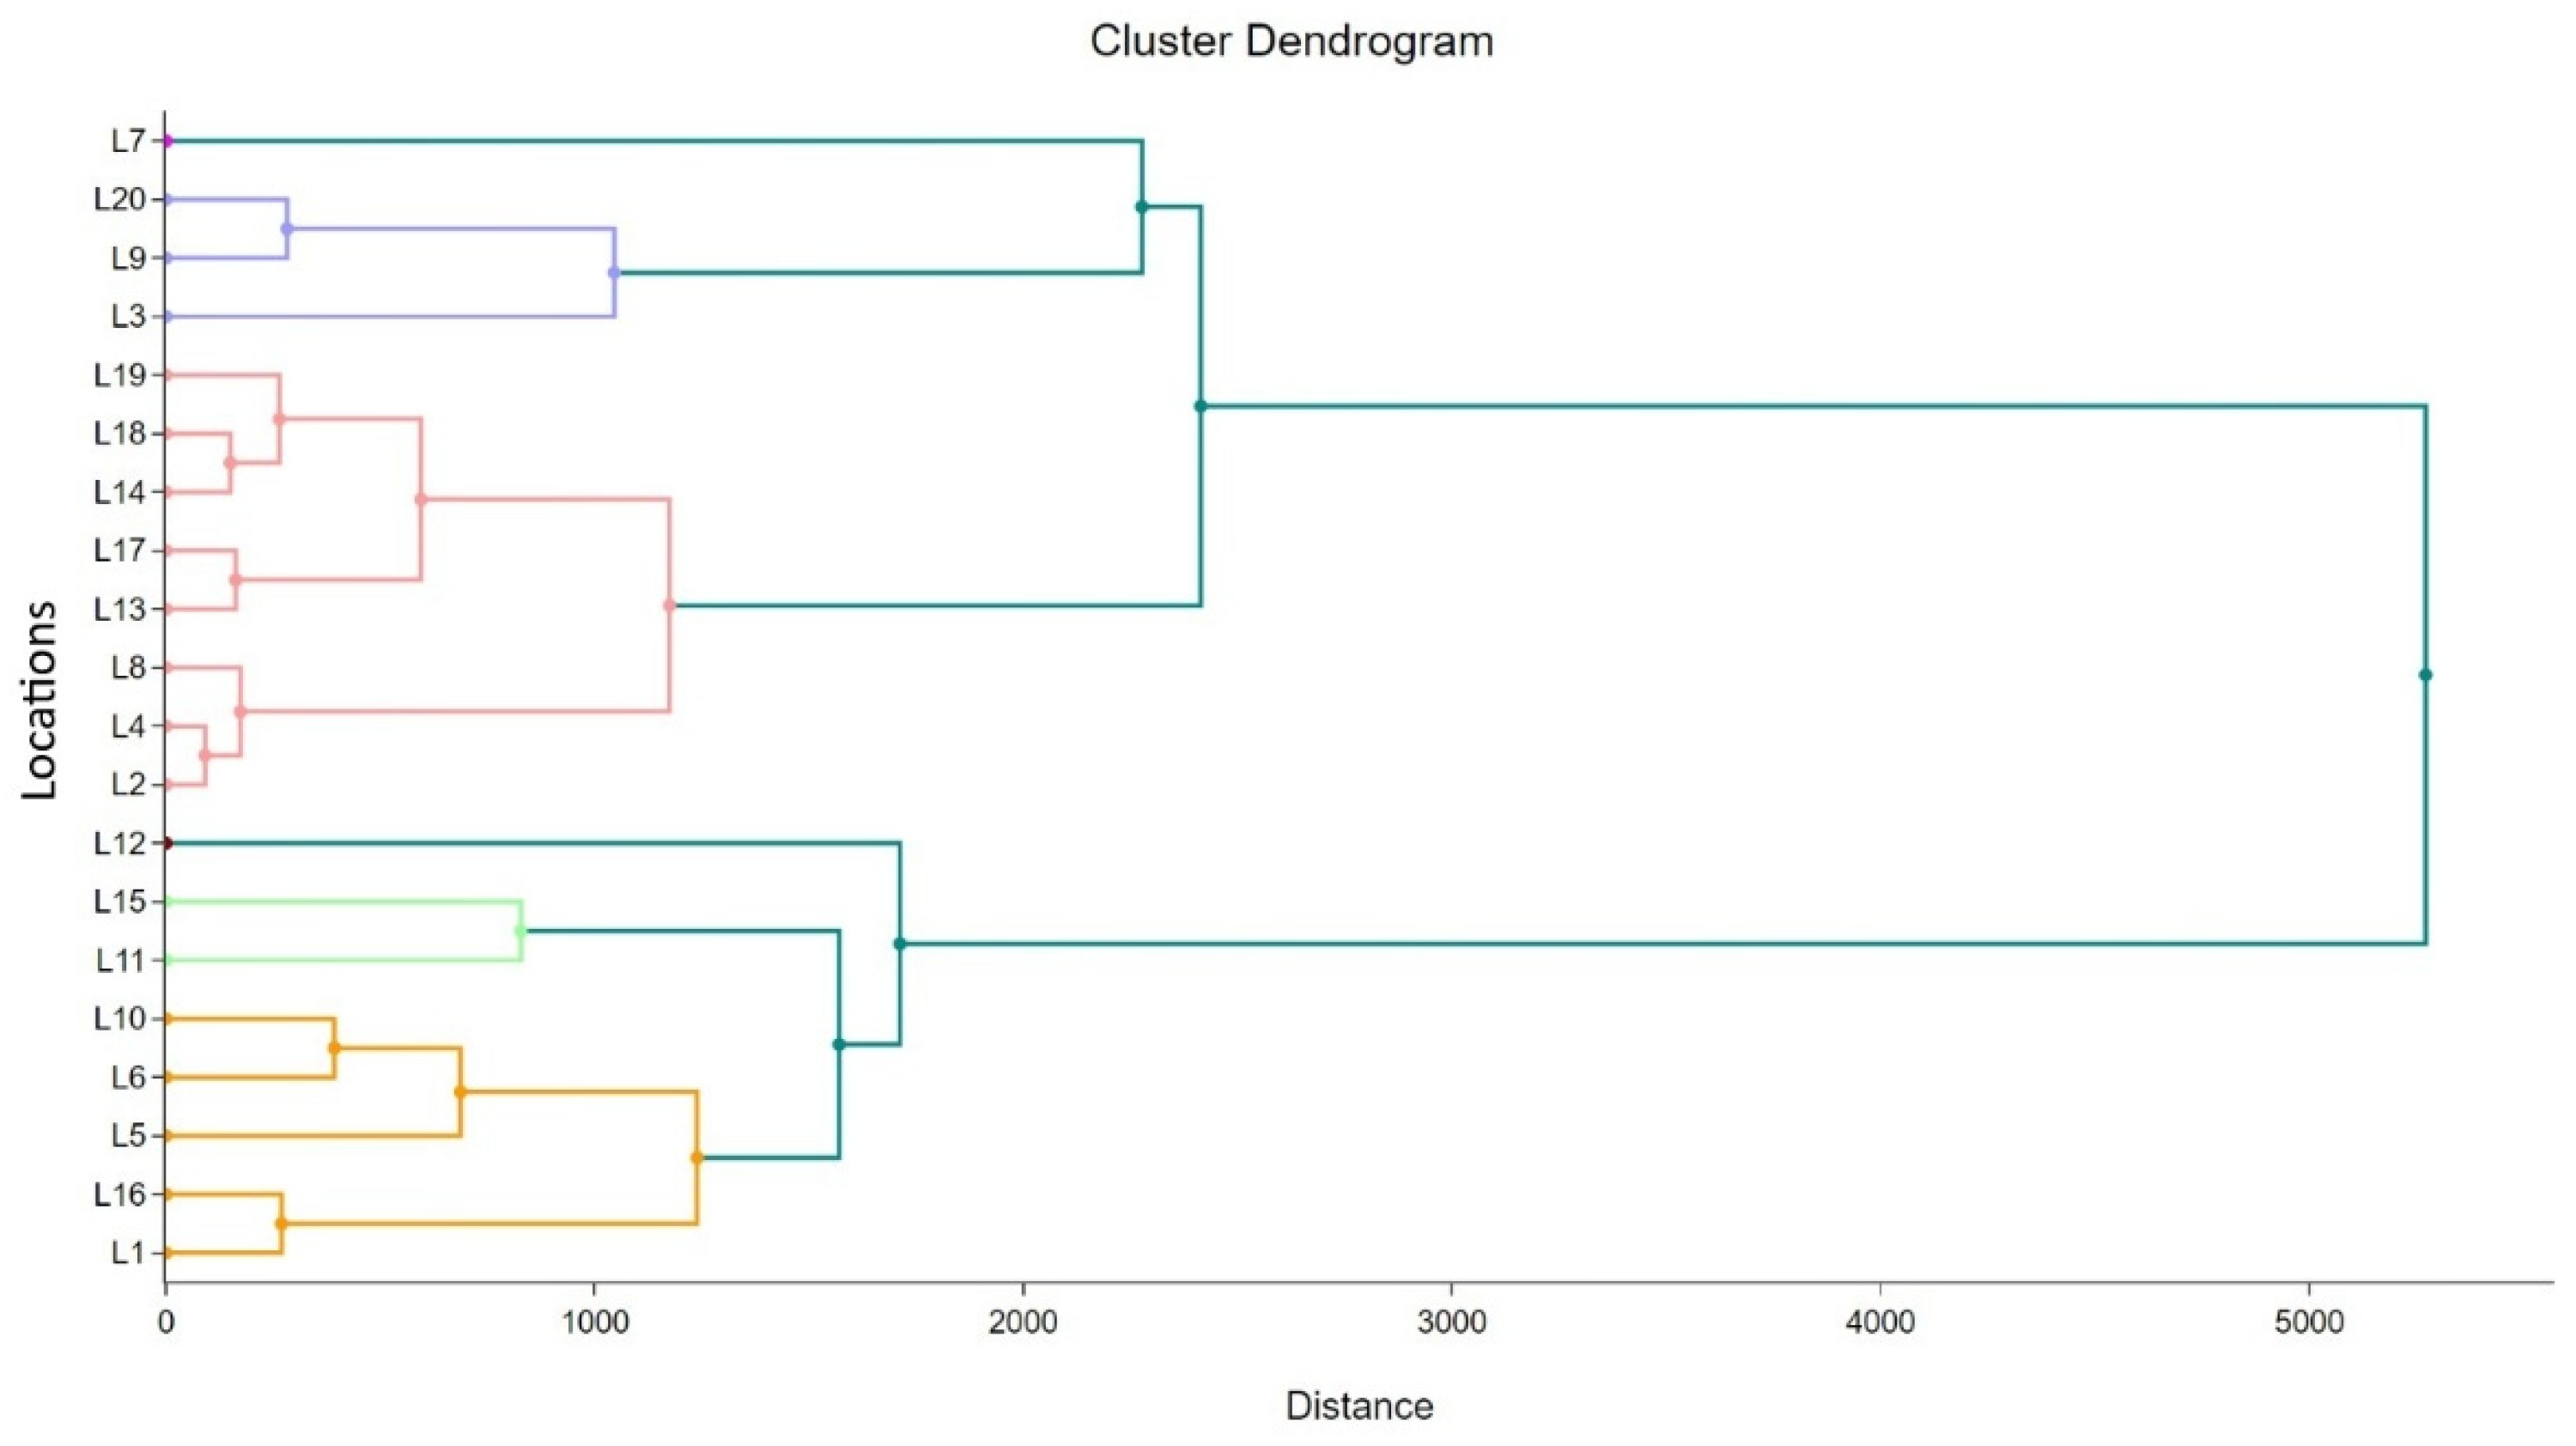
34]. Cluster analysis was performed to identify clusters of sampling locations based on similar contamination characteristics, in order to reveal the similarity in contamination between each group at certain sampling locations. The cluster analysis results are presented with regard to the measured values of the soil quality indicators (
Figure 2) because, in other matrices (water and melliferous plants), the concentrations of determined metals and metalloids were very low and uneven and were not present in all analyzed samples.
Hierarchical cluster analysis resulted in the grouping of indicators by location into six classes (distinguished by color in
Figure 2). The distance between classes (or clusters) is inversely proportional to the similarities between them, which means that a greater distance indicates lower mutual similarity. In general, the division into two basic groups, recognizable by the level of anthropogenic impact, is evident. In the top group (dark green, purple, and red), most locations are related to urban areas (such as L7, L20, L9, L14, L17, L13, L8, L4, and L2) and some are related to intensive agricultural production (namely, L7, L3, L19, and L18). This cluster is characterized by anthropogenic influence in urban areas and intensive agriculture. The lower group (dark green, light green, and yellow) includes locations that are also characterized by agricultural production, possibly of lower intensity (such as L5 and L1), as well as an agricultural wooded area with a transit road (location L10). This group also includes locations from areas of presumed lower impact (such as L12, L15, L11, and L16), as well as the island location (L6). A more detailed analysis indicates that anthropogenic influence is not the only condition determining similarity, with the type of melliferous plant and natural differences in soil composition also affecting the groupings.
6.5. Correlation Analysis
Soils contaminated with heavy metals can pose a potential ecological risk and, consequently, plants contaminated with heavy metals can pose a risk to human health. To investigate these risks, research and correlation analyses have been conducted [
4,
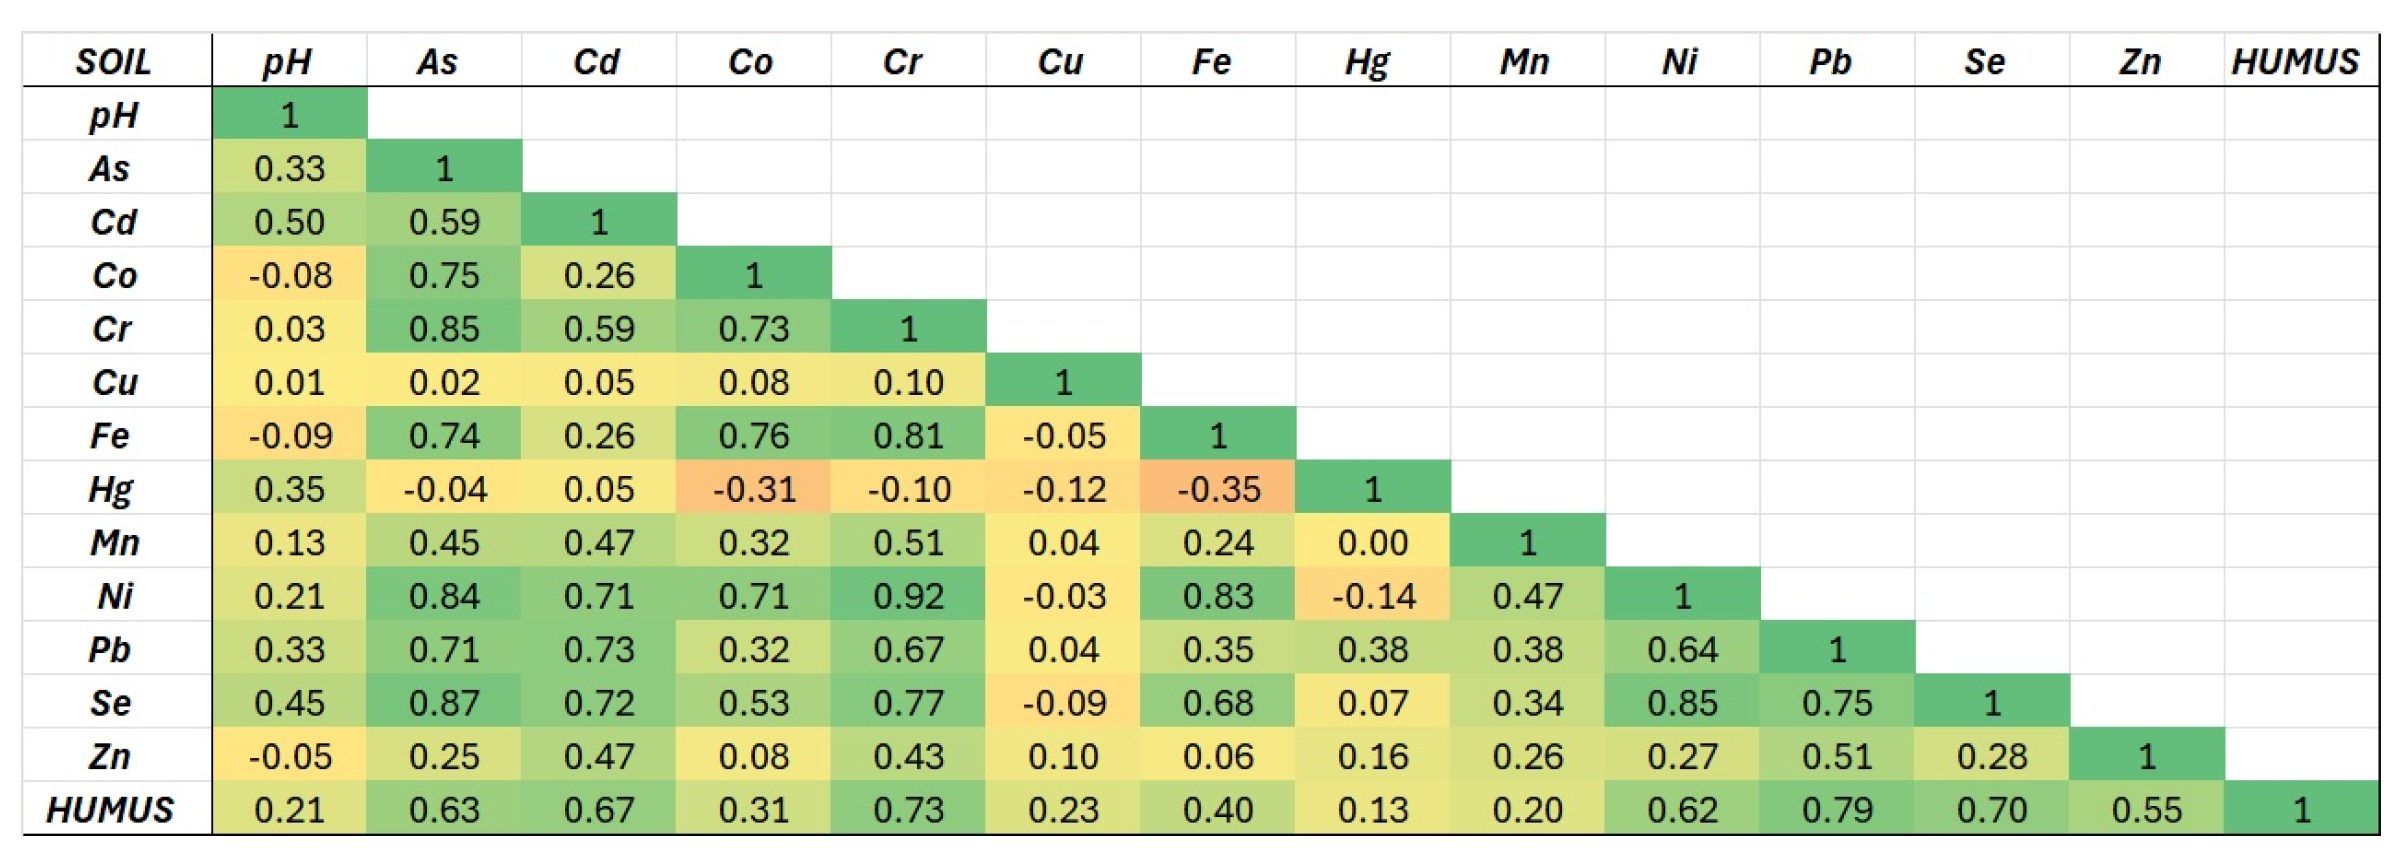
35]. Thus, the results of this research are also presented from a correlational perspective to provide insight into the possible connections between the examined indicators. The results of the correlation analysis are shown in
Figure 3, which were obtained using Excel.
There is no complete correlation (|r| = 1) between the determined heavy and toxic metals in the soil. The strongest positive correlation is between Cr and Ni, which amounts to 0.91. The analysis also determined strong correlations (0.8 ≤ |r| < 1) between As and Se (0.87), Ni and Se, As and Cr, and As and Ni (0.84). There is also a strong correlation between Fe and Ni (0.82), as well as between Cr and Fe (0.81). Pb shows a borderline strong correlation (0.79) with the humus in the soil, falling close to the line between a medium (0.5 ≤ |r| < 0.8) and strong correlation. Most of the remaining correlations between the metals, humus, and pH values are weak (0.2 ≤ |r| < 0.5) or insignificant (0 < |r| < 0.2), with 13 values indicating a complete absence of correlation between metals (|r| = 0).
6.7. Water and Soil Quality Index
The results for each heavy metal and toxic element show that the water quality index was greater than 1 for As at location L19 (at 1.228). Elevated water quality index values were also observed for Pb at location L13 (4.182) and at location L20 (where it amounted to 5.55). However, the overall water quality index for all metals at each location did not exceed 1, indicating satisfactory water quality.
Based on the obtained results for each heavy metal and toxic element, the soil quality index was greater than 1 for Cr at location L12 (at 1.195). Elevated soil quality index values were also observed for Cu at location L8 (where it amounted to 3.104) and for Ni at locations L11 (1.014), L12 (1.666), and L16 (1.001). The index value was also higher for Zn at locations L2 (where it amounted to 1.348), L3 (2.958), L4 (2.228), L6 (1.241), L8 (2.114), L12 (1.796), and L19 (1.079). Despite these values, the overall soil quality index for all metals collectively at each location did not exceed a value of 1, indicating satisfactory soil quality.



 ,
,