Article

Geophysical Characterization of Archaeological Sites in Active Seismic Zones: The Case of the “Basilica Bath” at Hierapolis (Turkey)


1
Department of Cultural Heritage, University of Padova, Piazza Capitaniato 7, 35139 Padova, Italy
2
Department of Cultural Heritage, University of Salento, Via D.Birago 64, 73100 Lecce, Italy
3
Department of Geosciences, University of Padova, Via Gradenigo 6, 35129 Padova, Italy
*
Author to whom correspondence should be addressed.
Appl. Sci. 2026, 16(6), 2795; https://doi.org/10.3390/app16062795
Submission received: 1 February 2026 / Revised: 5 March 2026 / Accepted: 11 March 2026 / Published: 14 March 2026

Abstract

Since 1988, the Hierapolis-Pamukkale site has been included in the UNESCO list for the uniqueness of its archaeological ruins and thermal installations within an extraordinary natural setting. The site is located in the active seismic area of the Denizli basin, which has been affected over the centuries by recurrent strong earthquakes that destroyed numerous ancient cities, some of which were later abandoned due to heavy damage. Hierapolis to this day exhibits faulted architectural relics distributed throughout the site, crossed by natural petrified water channels, and generally related to the largely exposed main faults visible in the SSE-NNW direction. The Basilica Bath is a partially collapsed monumental building located outside the northern part of the Hierapolis walls, where the primary faults are supposed to run, but have not been clearly identified. In this paper, we present the results of electrical resistivity tomography (ERT) carried out to detect archaeological features and, in a selected line, coupled with seismic refraction tomography (SRT) to identify possible fault directions related to the partial collapse of the Basilica Bath. Geophysical measurements provide new data on supposed buried remains, and a likely fault configuration that may have caused the partial collapse of the building, supporting further studies on its reconstruction and reuse in ancient times.

1. Introduction

The use of geophysical prospecting for archaeological studies has largely evolved over the decades, giving rise to a new, specific sector of applied geophysics known today as archaeogeophysics [1,2,3,4,5,6,7,8,9].
Depending on the site type and archaeological remains, magnetic methods [10,11,12,13,14,15,16,17], ground-penetrating radar (GPR) [18,19,20,21], and electrical resistivity tomography (ERT) [22,23,24,25] are generally used. More recently, in particular contexts, FDEM (frequency-domain electromagnetics) or EMI (electromagnetic induction) supports preliminary mapping of large sites, providing areal and qualitative information about the distribution, orientation, and extent of buried structures [26,27,28,29,30,31]. Seismic methods, widely used for geological and engineering characterisation of the subsoil [32,33,34,35,36], are less used in archaeological contexts [37,38,39], mainly considering the acquisition and processing times, as well as the limited resolution compared to other faster and more efficient geophysical measurements, such as GPR and ERT. However, promising new applications of seismic measurements have recently been tested for archaeological purposes, also thanks to the development and availability of smart wireless sensors, which are particularly useful for passive measurements in urban archaeological contexts [40,41].
Generally, for archaeological prospecting, the identification of buried structures is not dependent on the collection of detailed geological characterization of the system in which these structures are hosted. This information is considered only of interest for correctly defining the preliminary choice of geophysical method, which is based precisely on the physical characteristics of the system and determines the success of the investigation. On the contrary, understanding the geology of active seismic areas is fundamental to interpreting the evolution, reconstruction, and abandonment of specific archaeological sites. In this case, the field strategies and the choice of geophysical methods must also be reevaluated, considering the importance of both archaeological and geological information.
Hierapolis was a Roman city in the Denizli region of Turkey, devastated by violent earthquakes over the centuries. Nowadays, the archaeological site shows the visible traces of seismic activity and reconstruction in its monuments, which are not completely destroyed [42,43,44,45].
In this context, a deep analysis of the subsoil is essential not only for interpreting archaeological data but also for understanding the mechanisms that may have led to the partial collapse of the structures. In particular, we focus on the Basilica Bath, a monumental building in Hierapolis that has partially collapsed over the centuries. We will therefore see how the use of electrical resistivity tomography (ERT) to identify possible archaeological remains around this building, supported by seismic refraction tomography (SRT), produced significant results and information on the presence of supposed archaeological structures and previously unknown faults that may have caused the partial collapse of this monumental relic.

2. Geological and Archaeological Setting

The archaeological site of Hierapolis is located in Turkey (Figure 1), in the modern Pamukkale area, on the eastern system of the Denizli Graben, in the Aegean extensional region, part of an active geodynamic zone characterized by normal-faulting seismic activity [46,47,48,49]. The site is situated on a limestone plateau at an altitude of 360–370 m above sea level (Figure 1), with thick travertine deposits [50,51,52].
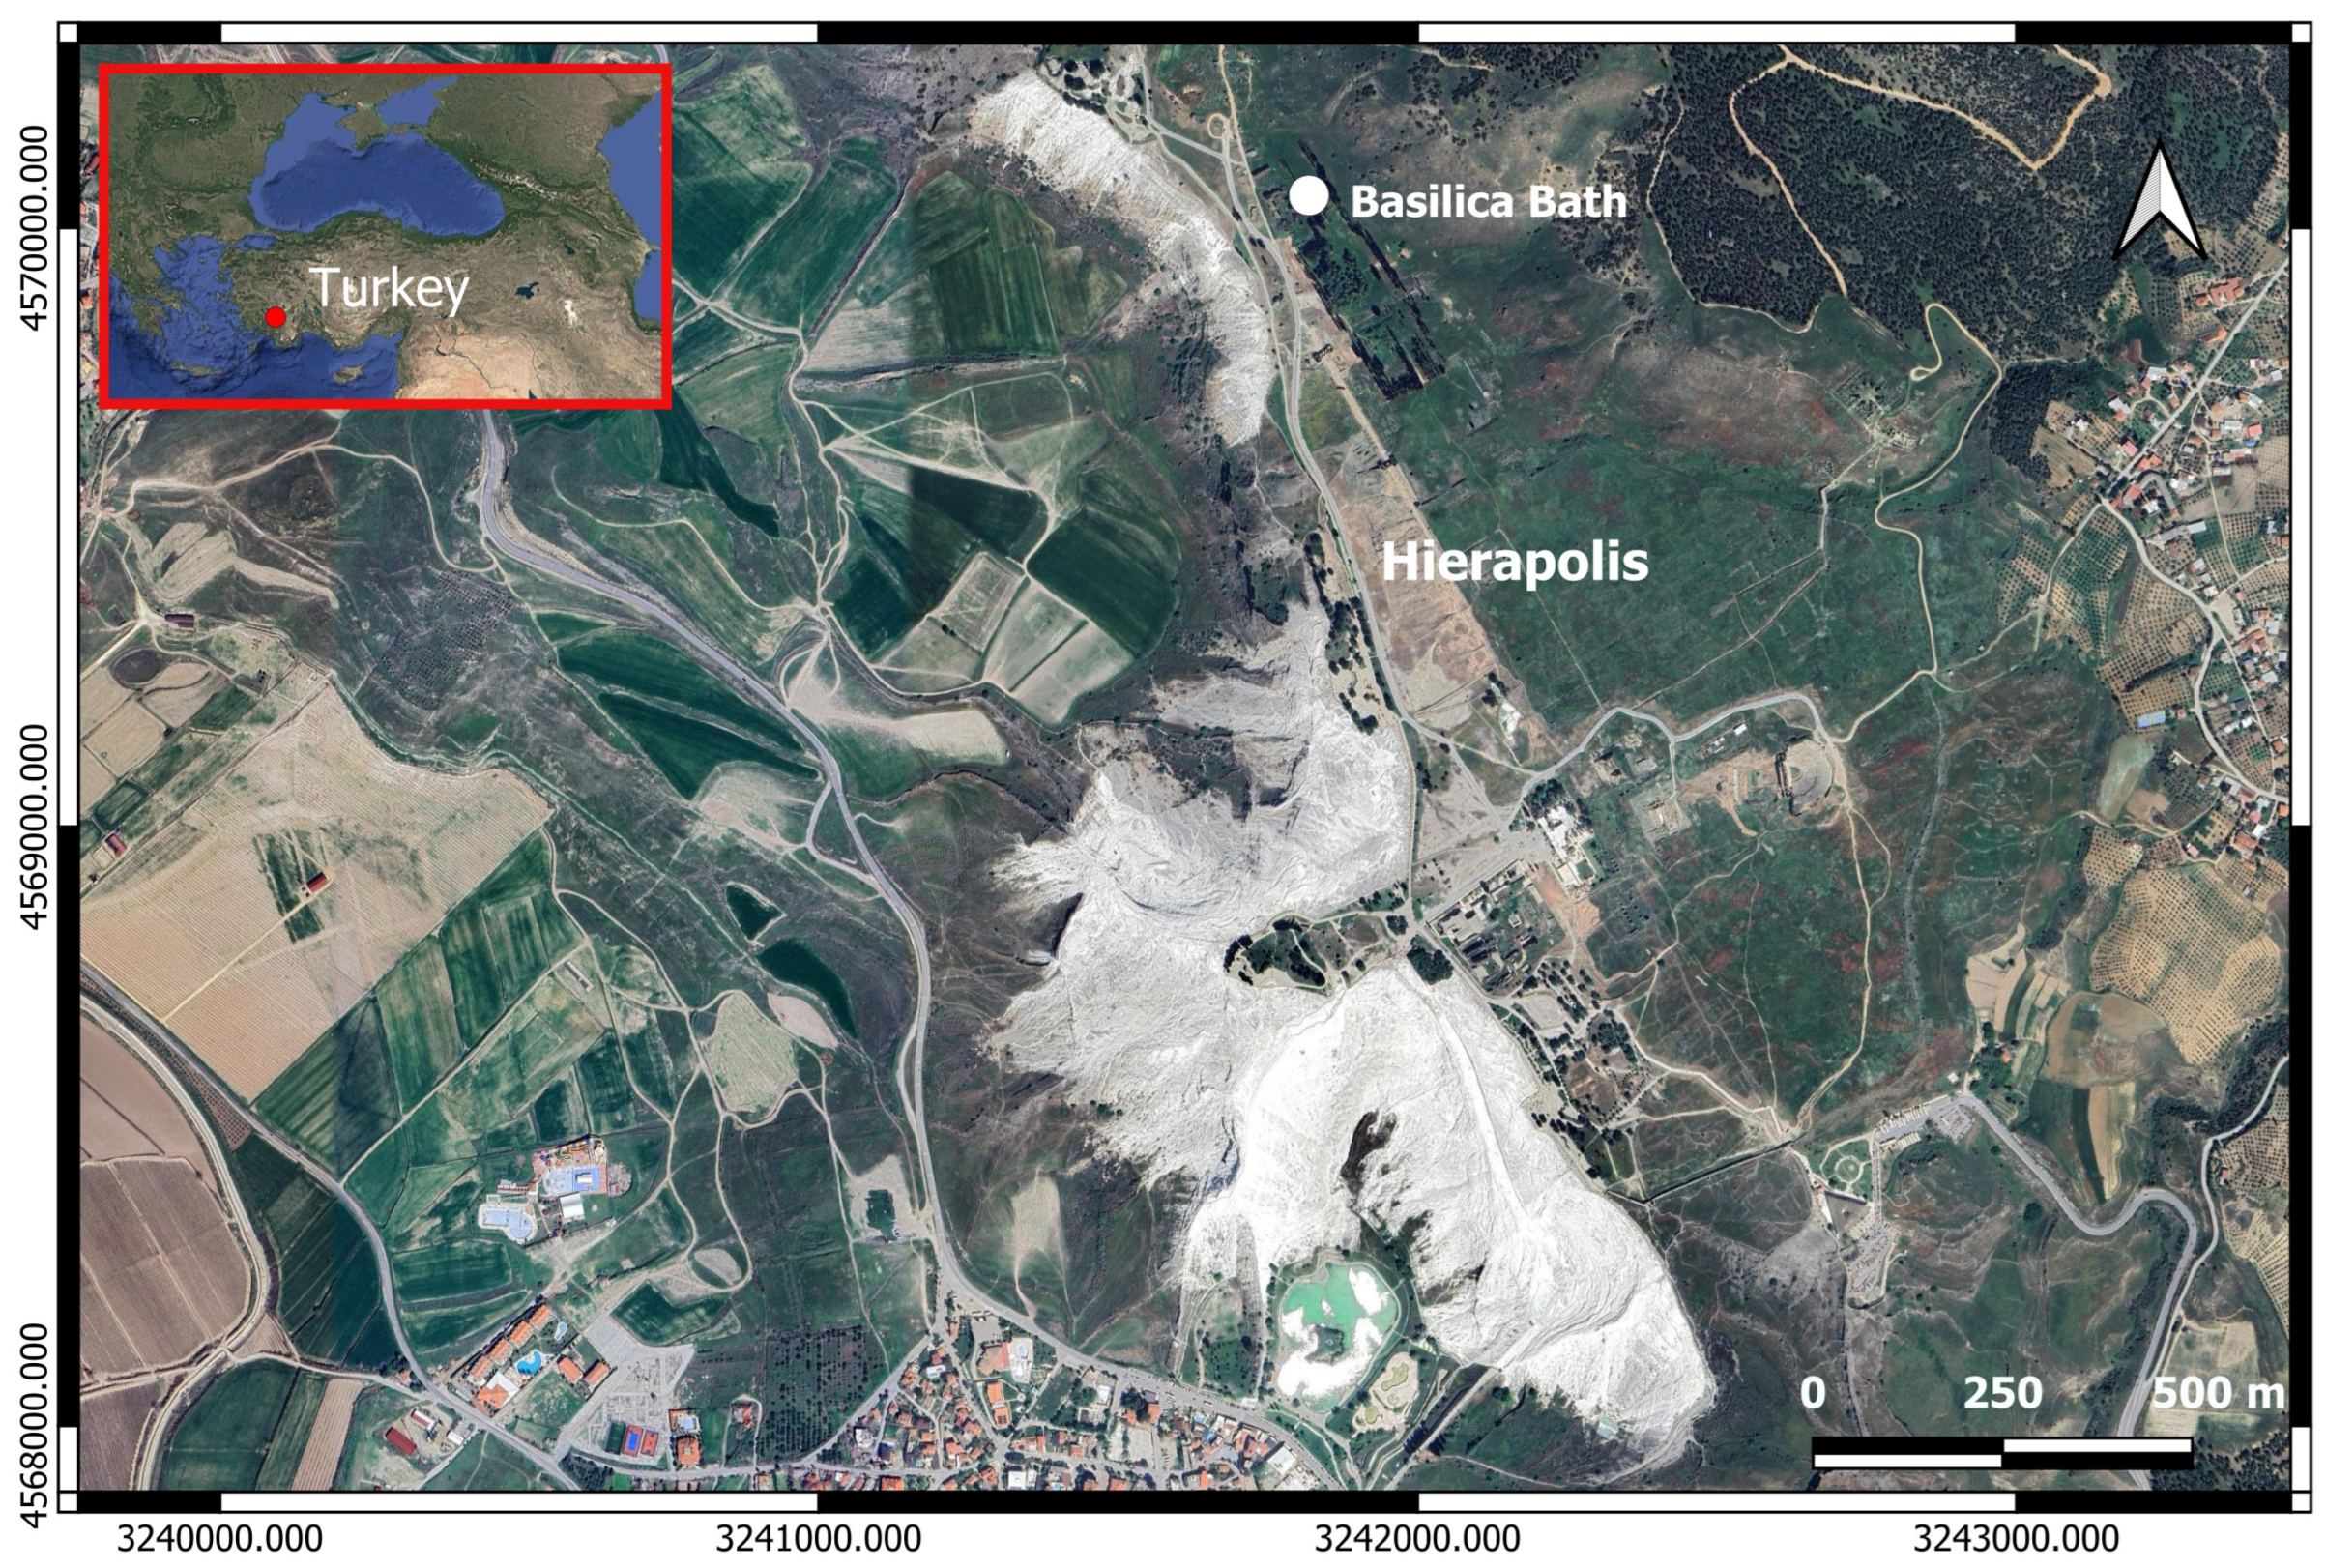
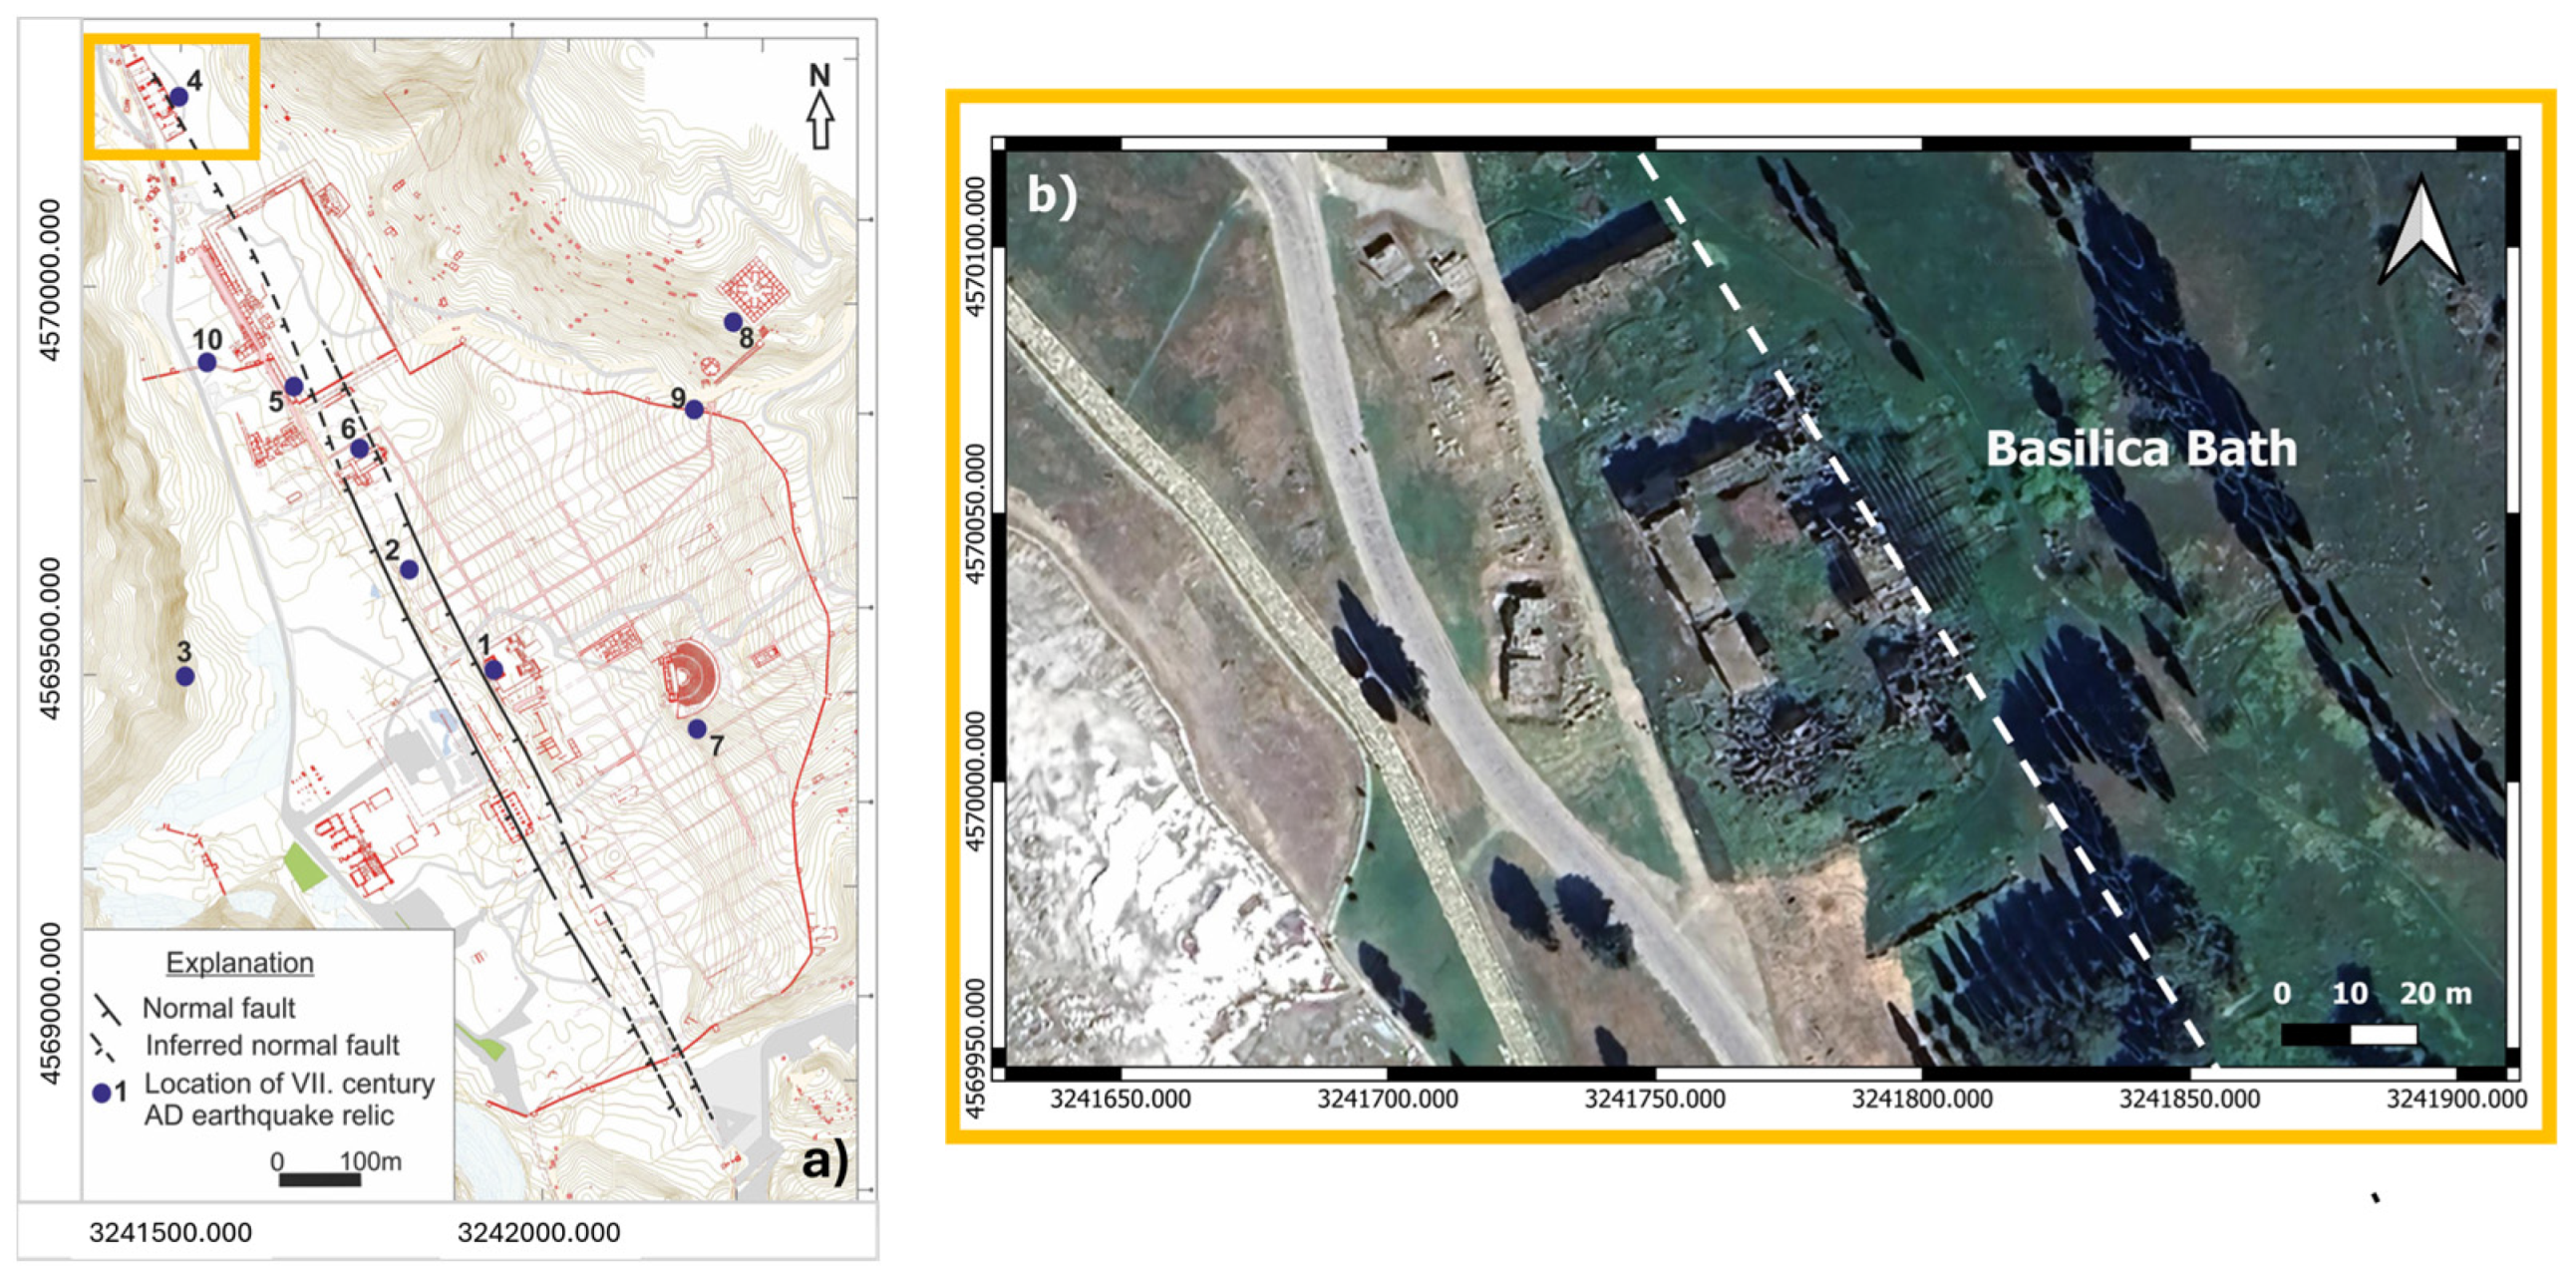
The deep normal fault system of the Graben allows the natural emergence of saline hot water (up to 60 °C) [53,54,55,56], making the city of Hierapolis historically famous for its extensive network of travertine channels and thermal waters. This geothermal activity, related to the high seismicity of the area, played a fundamental role in the development of Hierapolis, as reflected in the name (translated “Holy city”) associated with the ‘holy’ natural evidence, represented by hot carbonated water, that produced, during the times, the deposition of thick layers of travertine, particularly in the eastern part of the Graben [57,58,59]. The history of Hierapolis is closely linked to earthquakes, as evidenced by the visible damage to its monuments, the reconstruction efforts, and subsequent differences in construction phases [42,43,44,45]. Hierapolis today is a famous archaeological site that exhibits faulted architectural relics, crossed by natural water channels, primarily associated with the largely exposed main faults, which are visible in the SSE-NNW direction [57,58]. Since 1988, the Hierapolis-Pamukkale site has been included in the UNESCO list for the uniqueness of its archaeological ruins and thermal installations within an extraordinary natural setting. The Italian Archaeological Mission at Hierapolis of Phrygia (MAIER) has contributed since 2012 to studies aimed at creating a seismic-archaeological park [60,61,62]. The Basilica Bath is a partially collapsed monumental building [63,64] located outside the northern part of the Hierapolis walls (Figure 1), where the direction of the primary faults is supposed to lie but has not been clearly identified (Figure 2).
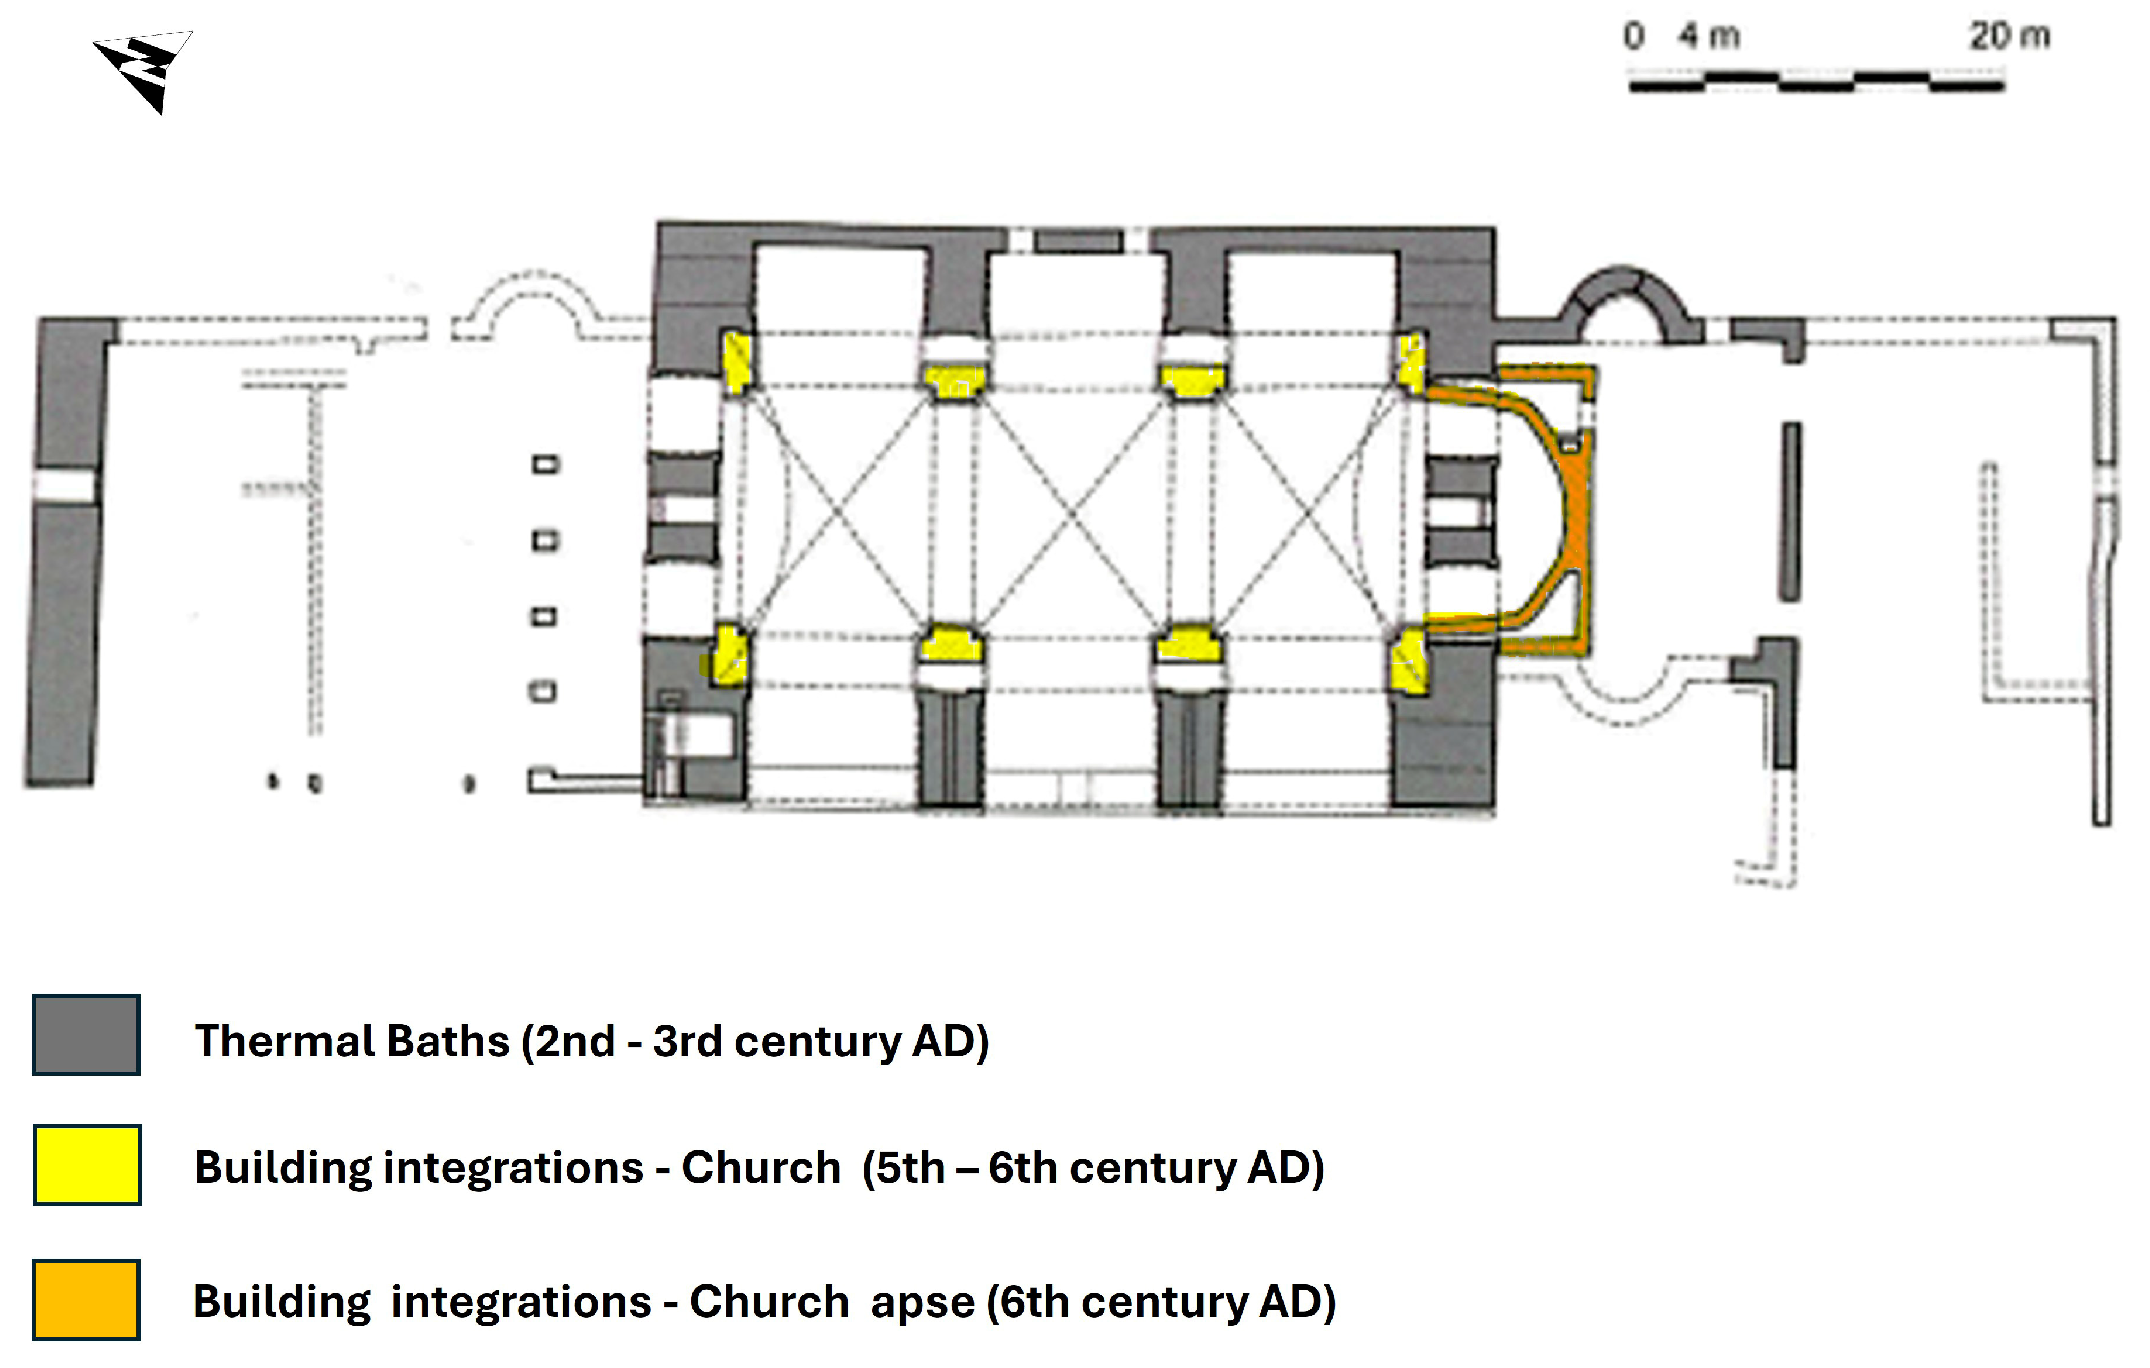
Although there is no exact dating, the complex was certainly built in several phases (Figure 3). In the first phase, during the Roman age (2nd century AD–3rd century AD), the building served as a public bath, built during a significant urban restructuring of the city [43,63,64]. Characterized by large blocks of travertine, in the first phase, it must have had a central hall covered by a barrel vault of considerable size (approximately 19 m wide), set along the eastern and western sides, with a sequence of three smaller barrel vaults (9 m wide each).
The smaller vaults were supported by imposing pillars measuring approximately 5 m × 3 m, and at the corners of the hall. The northwest corner included a vaulted room measuring 11 m2. Smaller rooms were probably located to the south of the complex, while in the northern area, a rectangular open space ended against a massive northwest wall. The construction of the second phase was prompted by an earthquake dating to the second half of the 4th century. The building underwent collapses and subsequent architectural and structural modifications, and during the 5th century AD, it was transformed into a Christian church. The level of the original structure was retained. Instead, new piers were built using recycled material (perhaps from the dismantling or collapse of the central vault) adjacent to the pre-existing, damaged but still-usable walls. Inside them, vaulted passages were included, of which only the first two courses were inserted (and structurally connected) to the first phase pillars.
These modifications created a central hall, reduced in width from the original to approximately 12 m, divided into three barrel-vaulted or ribbed bays. On either side, two smaller naves were created, characterized by a succession of three chapels connected by barrel-vaulted corridors. The northern wall became part of an open quadriportico, while the southern rooms were converted into a presbytery. The complex was then restored, with the damaged structures repaired using irregular mortar joints. During the building’s third major phase (6th century AD), a narthex was built to the north of the hall, and, to the south, an apse was constructed by demolishing part of a wall (Figure 3) [43,63].
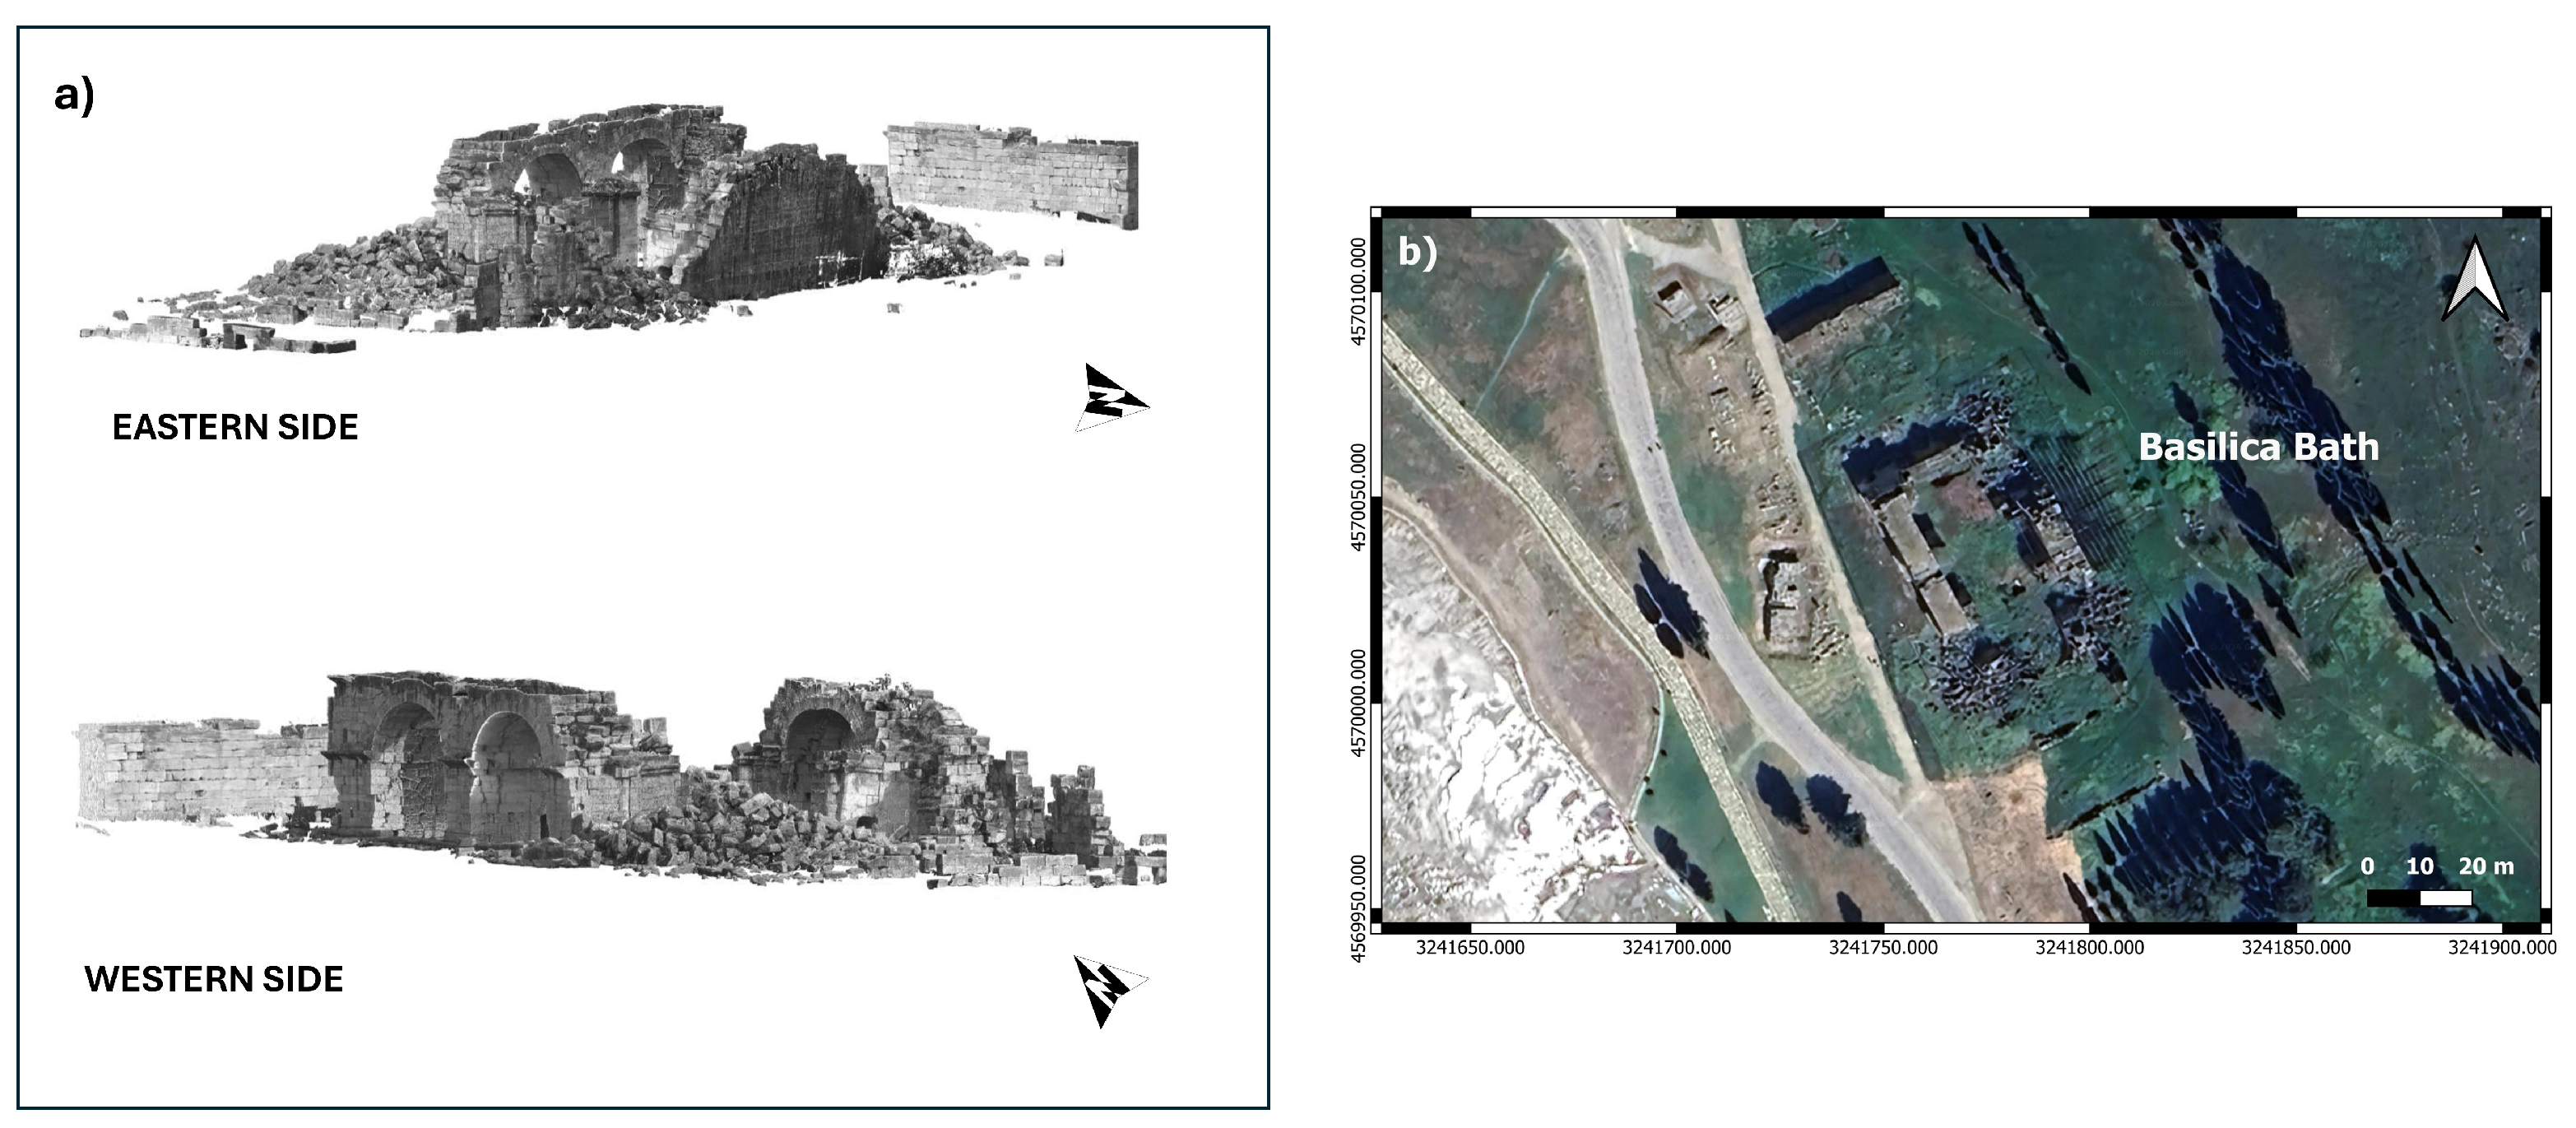
Other seismic events struck the archaeological site, leading to the Basilica Bath assuming its current configuration (Figure 4). In particular, significant damage can be traced to earthquakes in the 7th century and between the 10th and 11th centuries AD. Finally, the 1358 strong earthquake led to the site’s abandonment [45].
Currently, a good part of the walls of the central main body of the building are preserved [62,65,66,67], although heavily damaged, while the north-east, south-east and south-west corners of the central structure have collapsed (Figure 4a), and in their place are visible the accumulations of gigantic blocks, which are also recognizable from satellite images (Figure 4b).
Figure 4. Evidence of collapsed parts of the Basilica Bath by laser scanning acquisition (a) ([66] modified by authors) and (b) from satellite image.
Applsci 16 02795 g004

3. Materials and Methods

3.1. Electrical Resistivity Tomography (ERT) Acquisition and Processing

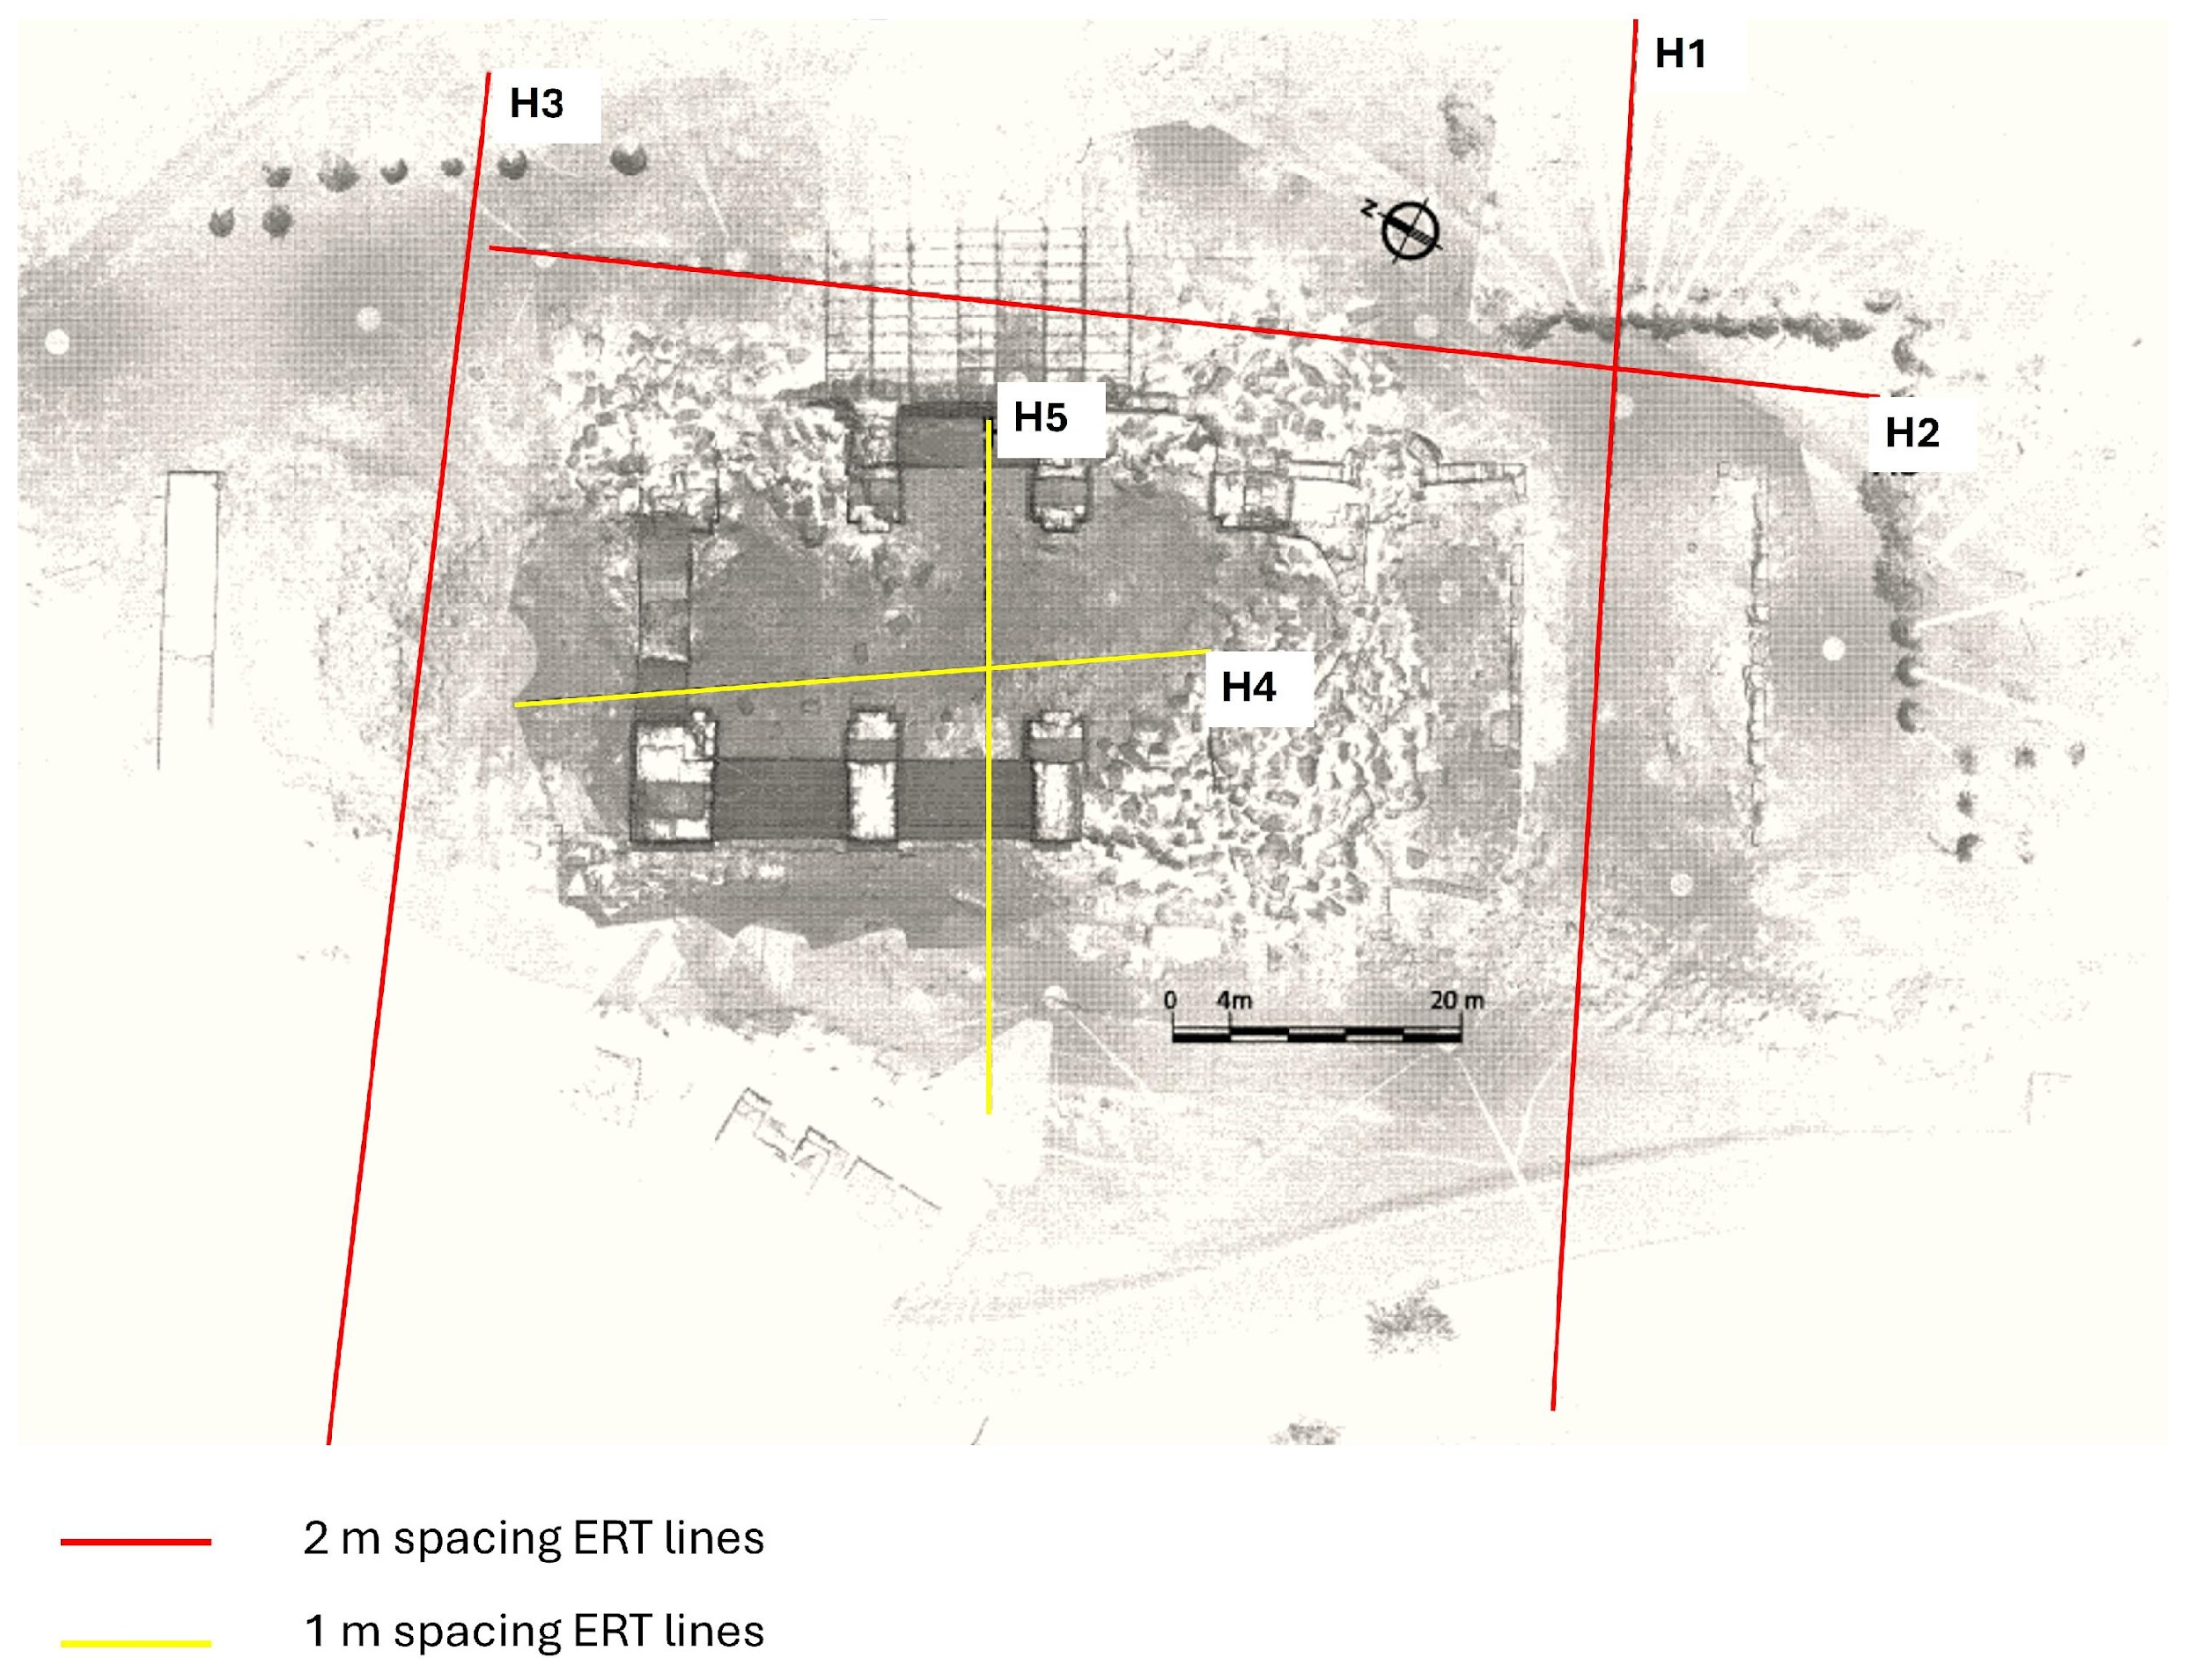
For the investigations beneath and around the Basilica Bath, five electrical resistivity tomography (ERT) were acquired using 48 electrodes and a dipole–dipole skip-4 measuring scheme. We adopted this dipole–dipole scheme, which, in our previous work [28,29,31], has provided good resolution and sufficient signal-to-noise ratio in archaeological contexts. To estimate the measurement error, the data were acquired in both direct and reciprocal modes, by reversing the potential and current electrodes for each measurement [68]. The check of data quality is fundamental in the regularized least squares inversion, as the Occam inversion here used [69], where the model prediction depends on the quantitative estimation of the error level [68]. In this case, we adopted a 5% threshold for rejecting data (Q = 5%), and the corresponding error level was set as the inversion target. All ERT lines were acquired using an Iris Syscal Pro 72 ch resistivity meter from Iris Instruments (Orléans, France), with a time window of 250 ms, stacks of 3–6, and variable current injection to target VMN = 50 mV. These parameters were imposed solely on the basis of our field experience and are not mandatory. The inversion of the data was performed using the ProfileR 2D freeware software (version 2.5 October 2003) by A. Binley. The inverse program computes a 3D current distribution using a quadrilateral finite-element mesh and is based on a regularized objective function combined with weighted least squares. The mesh is generated with two finite elements between electrodes in the horizontal direction, where, in the vertical direction, elements increase in size with depth. The region is parameterized in terms of resistivity blocks by grouping patches of elements. In this case, for each line, 85–90% of the dataset’s measurements were preserved after the inversion process. To match, on the one hand, geological-structural and, on the other hand, archaeological purposes, ERT lines (H1-H5 in Figure 5) were acquired using two different resolutions. The first three lines (H1, H2, H3 in Figure 5) were collected outside the building, parallel to the southern, eastern, and northern sides, in S-N and E-W directions, to identify possible faults. These lines were therefore acquired with a 2 m electrode spacing, yielding a total length of 94 m per ERT line and ensuring a survey depth of approximately 18 m. Line H1 crosses, 15 m from its origin (between electrodes e7 and e8), the electrode e14 of the line H2 (22 m from the origin). The end of the line H2 crosses the line H3 between the electrodes e5 and e6. Two other lines, perpendicular to each other (H4 and H5 in Figure 5), were acquired in S-N and E-W directions within the structure, using a spacing of 1 m, a total length of 47 m, and a maximum investigation depth of just over 9 m, thus sectioning the main hall of the Basilica Bath, which is still visible. The electrode e18 on the H5 line crosses the H4 line between electrodes e14 and e15. The end of the line H4 ideally crosses the line H3 between the electrodes e27 and e28.
H4 and H5 were collected at 1 m spacing inside the actual hall of the building, given the higher resolution needed to identify any possible buried archaeological structure associated with the calidarium of the thermal baths [43,63]. The second purpose of the H4 and H5 ERT lines was to verify the presence of any additional small, shallow fractures related to the main, deeper faults [70,71,72], supposed to run in the eastern, external part of the building, and to be detected with H1–H3, 2 m spacing lines. Given the high local variability observed in the ERT lines, the results are presented on different resistivity scales to highlight the most relevant information.

3.2. Seismic Surveys Acquisition and Processing

To reconstruct the main tectonic lineaments on the eastern side of the Basilica Bath, creating a 2D image of a suspected, unknown buried fault, we performed Seismic Refraction Tomography (SRT) using the same alignment H2 firstly used for ERT acquisition (Figure 5). SRT is based on the use of an elastic wave source on the surface to retrieve the compressive wave velocities of the subsoil media by picking the first arrival times in the recorded seismograms, which are collected through an array of geophones. These propagated elastic waves are governed by Snell’s law and are subject to refraction and reflection at interfaces between materials with contrasting propagation velocities and densities [73,74]. In refraction tomography, only the refracted waves are considered.
The tomographic approach in seismic refraction requires recording several shot gathers from different source positions. An iterative tomographic inversion procedure based on ray tracing is then used to obtain a 2D velocity model of the subsurface [75,76,77,78]. For compressional P-wave studies, vertical geophones and vertically impacting sources are used. In this specific context, seismic data were recorded using two Geode seismographs (Geometrics, San Jose, CA, USA; http://www.geometrics.com) with 48 vertical low-frequency geophones at 4.5 Hz, and a 5 kg sledgehammer was used as the seismic source. The correct timing of the source trigger was guaranteed by an electrical closing circuit. We adopted the same origin, resolution, and direction (S-N) as the H2 ERT line (Figure 5).
The spacing between geophones was 2 m, giving a nominal total array length of 94 m. However, the last three channels exhibited malfunctions and were excluded from the analysis. The final total length of the seismic line is then 88 m. At each source position, the shot was repeated twice to stack the seismograms and enhance the signal-to-noise ratio. Data analysis was performed using the Geogiga Technology Corp. package (Calgary, AB, Canada) (https://geogiga.com/products/frontend/, Frontend Express vs. 10.0, accessed on 1 February 2026), including the picking and inversion of the first arrivals. The first arrivals were picked multiple times for the same shot to estimate the picking error (0.5 ms) assumed in the inversion process [79].

4. Results and Discussion

4.1. Electrical Resistivity Tomography (ERT)

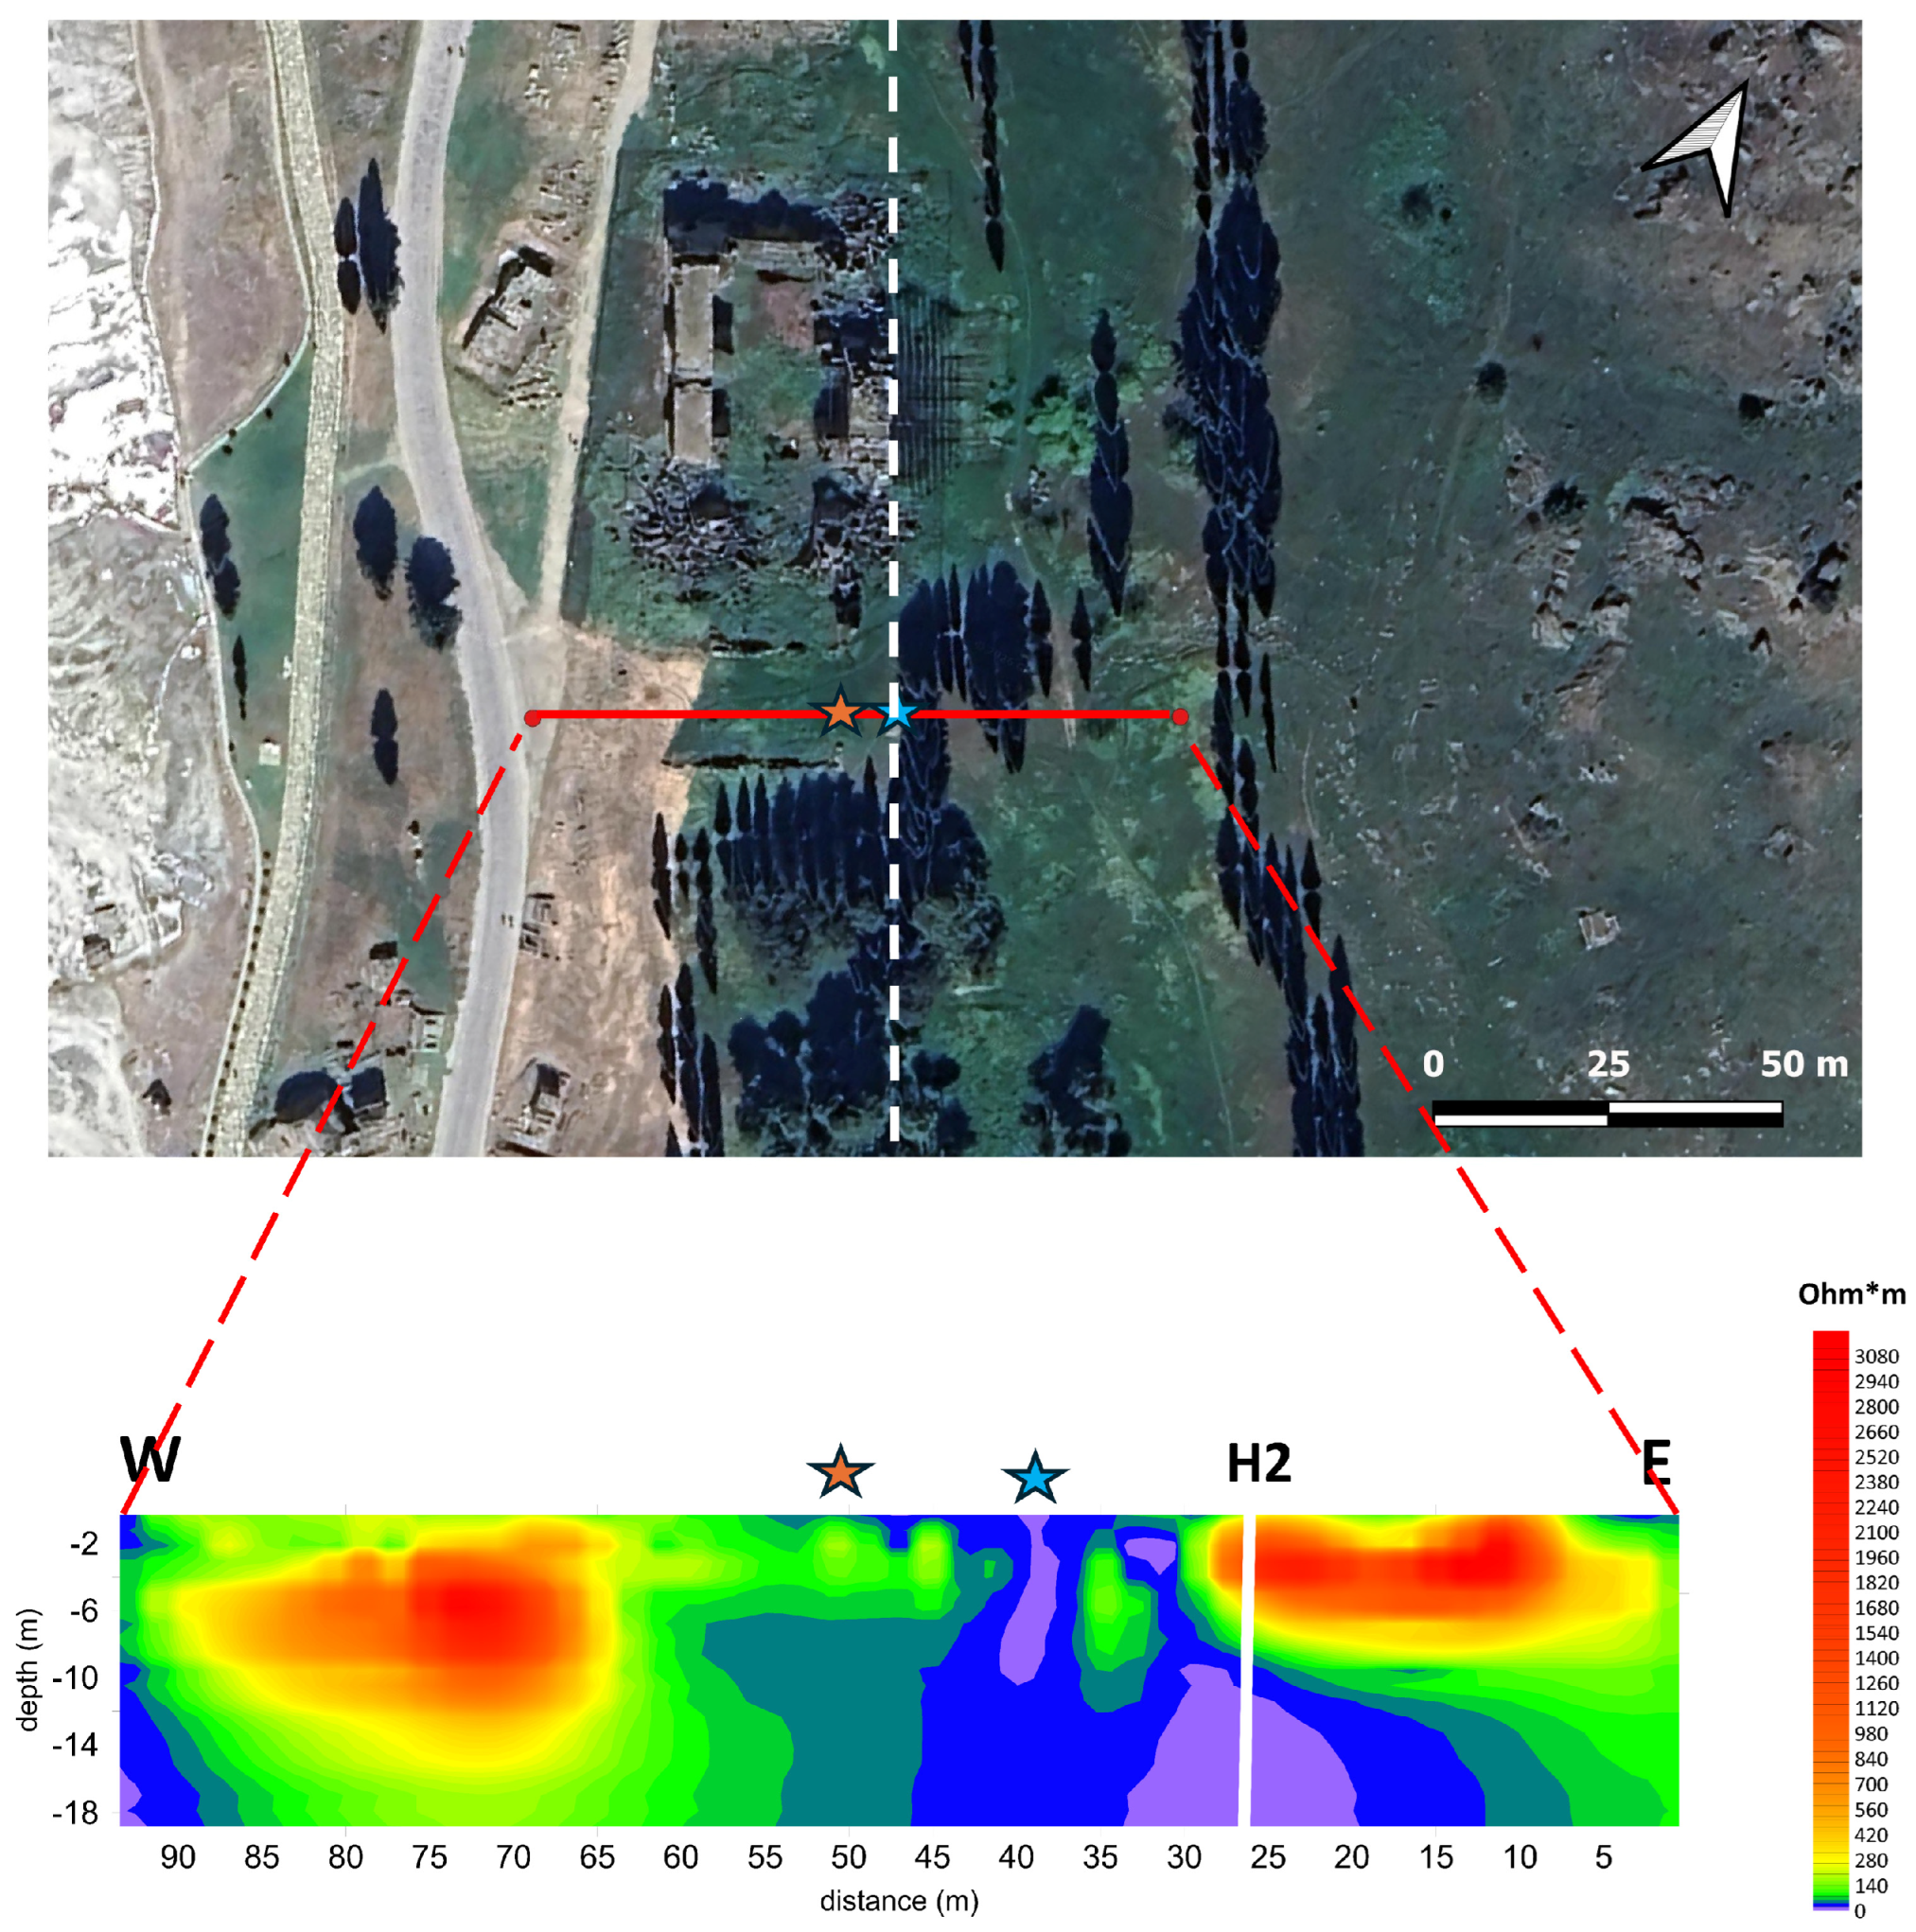
The result of the ERT line H1 is shown in Figure 6. The proper position of the line is in the same figure, where the orange star indicates the anomaly perpendicular to the wall, visible in the field, a few meters south of the ERT line, assuming the wall extends to the north. This target allows us to assume that similar resistivity anomalies detected by ERT measurements can be related to other buried walls (i.e., 35 m and 45 m along the x-axis), parallel to this one. The blue star indicates the position of a conductive vertical anomaly consistent with the supposed main fault expected in this area, as indicated by the white dashed line in the figure (see also Figure 2). The resistivity of this conductive zone also appears consistent with suspected faults in previous geophysical studies in the area of the Temple of Apollo in Hierapolis [80,81].
The large, high-resistivity anomalies in the western and eastern parts of the ERT line probably refer to archaeological remains associated with the Basilica Bath or to possible tombs connected to the northern cemetery, particularly on the western side. The final interpretation of these anomalies appears difficult, given the line’s position, very close to the collapsed structures, possibly buried ancient phases, and large tombs near the building.
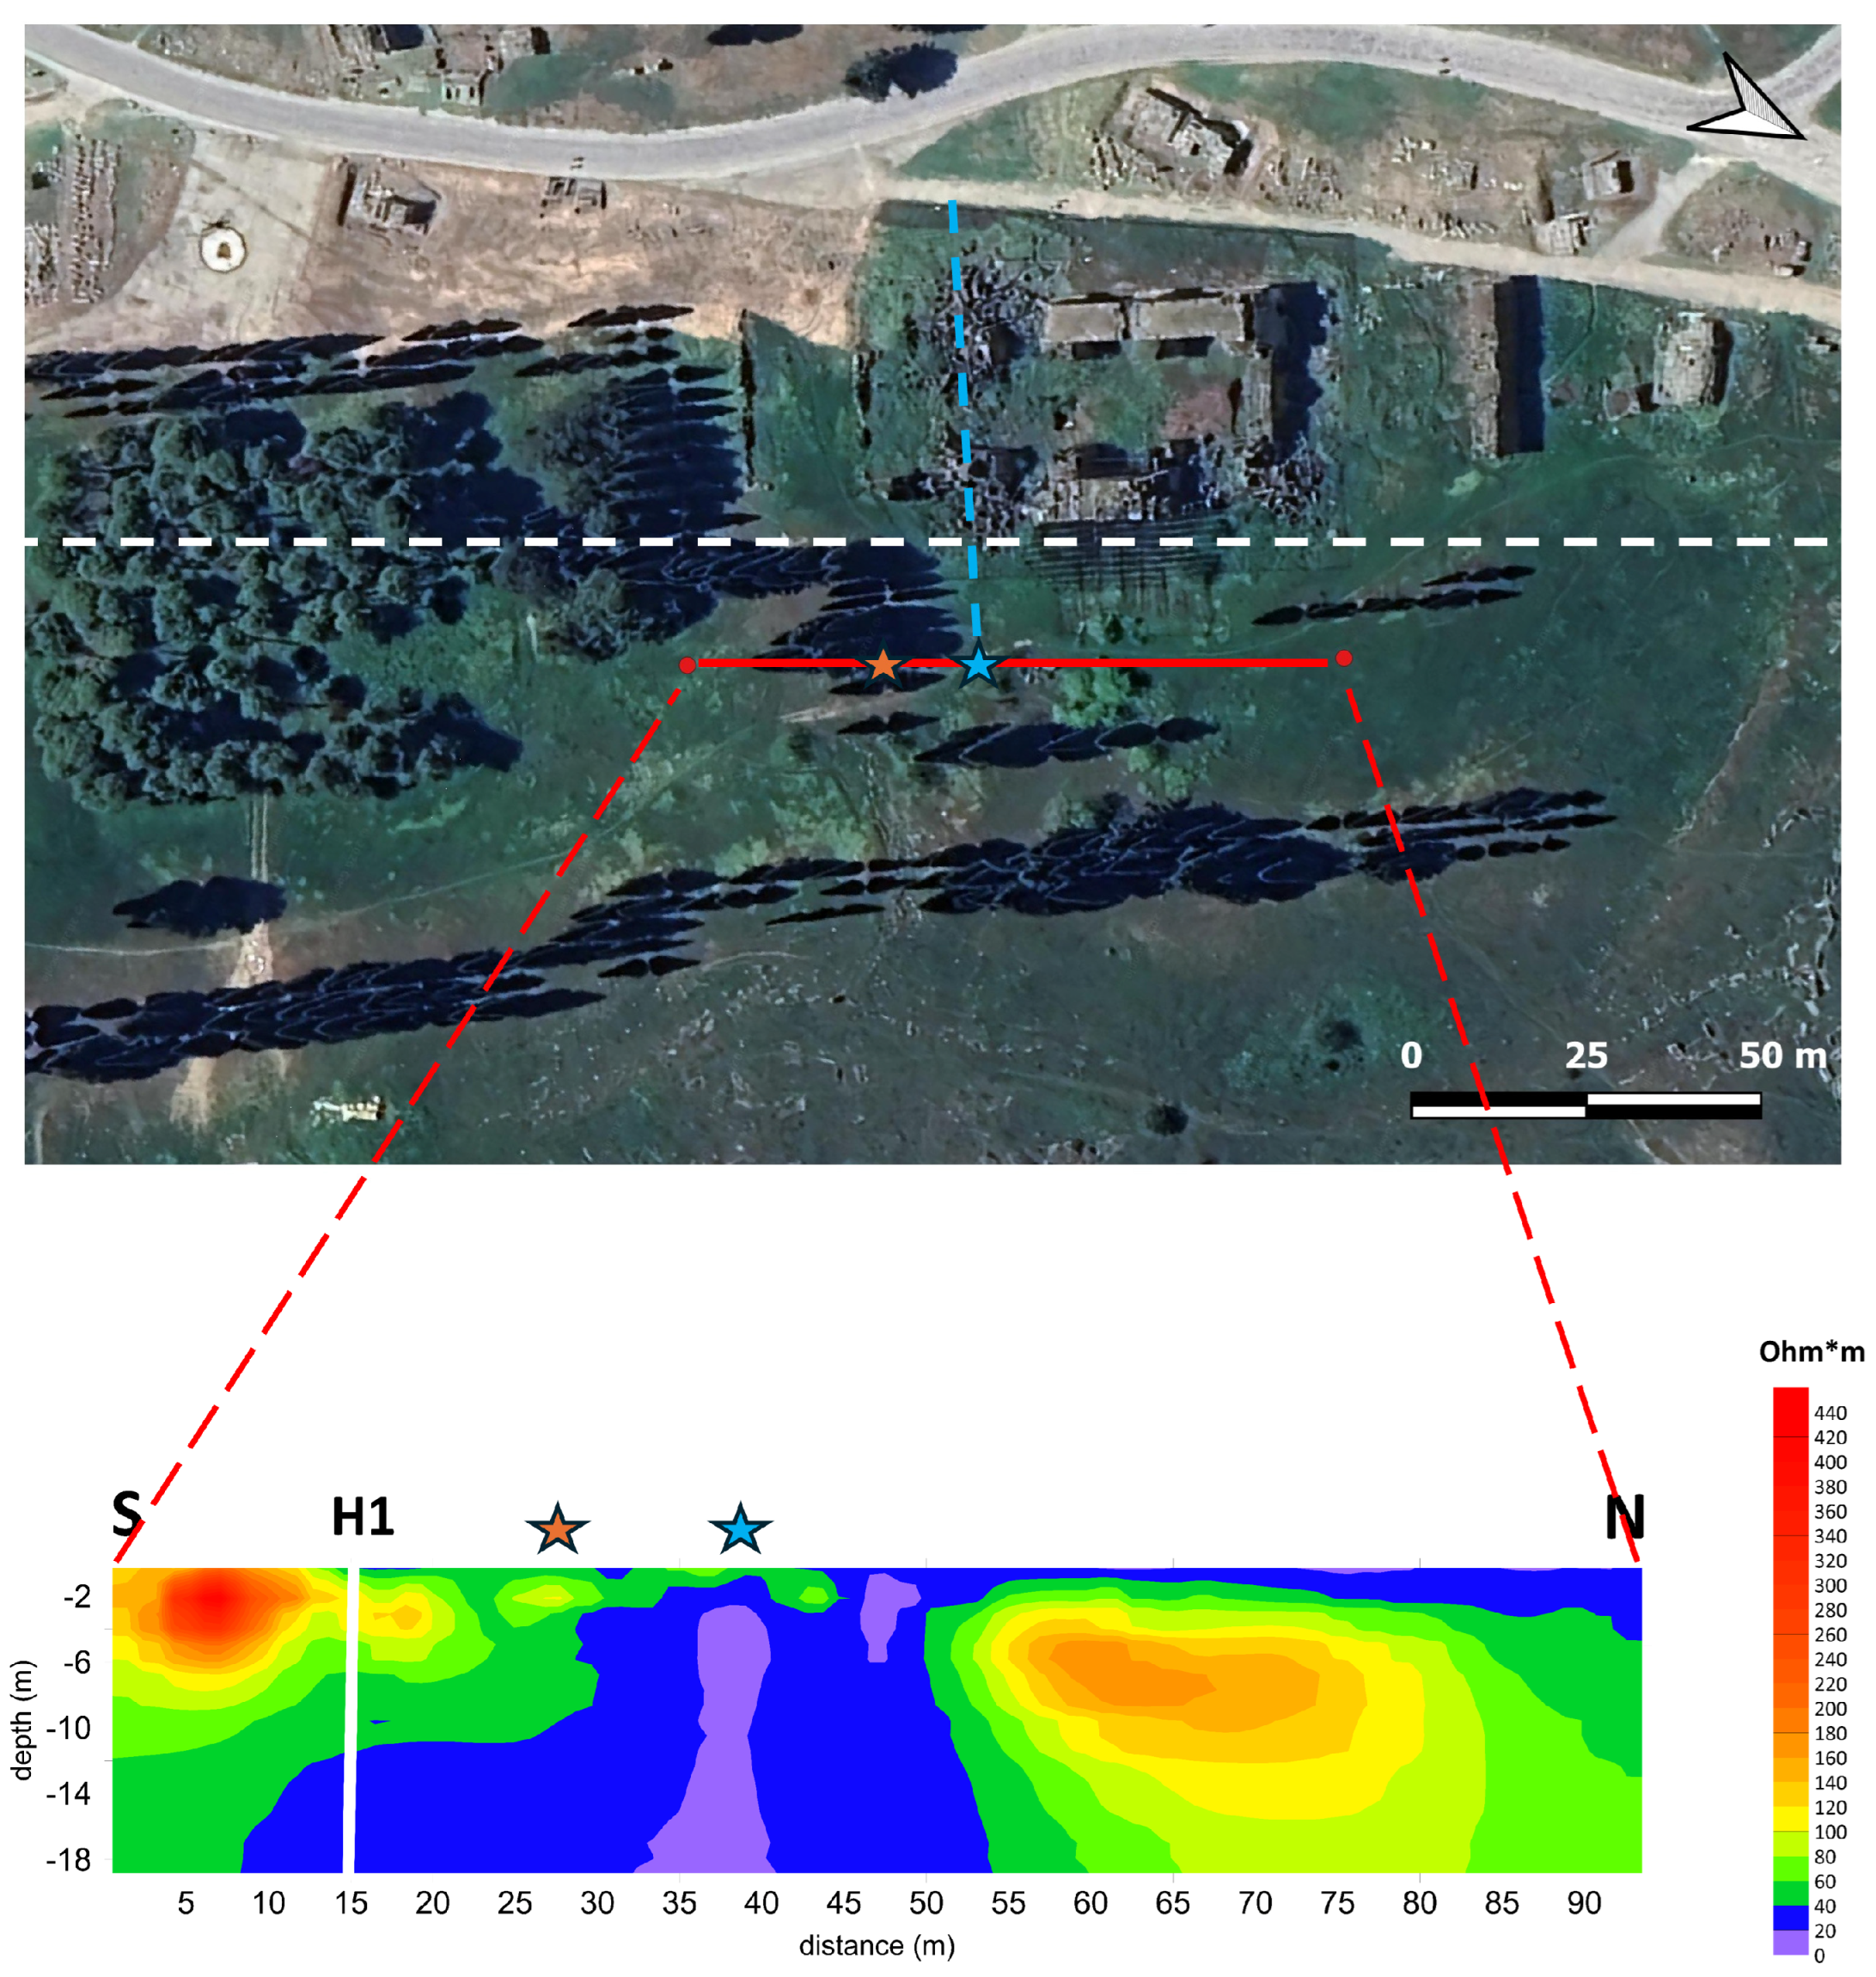
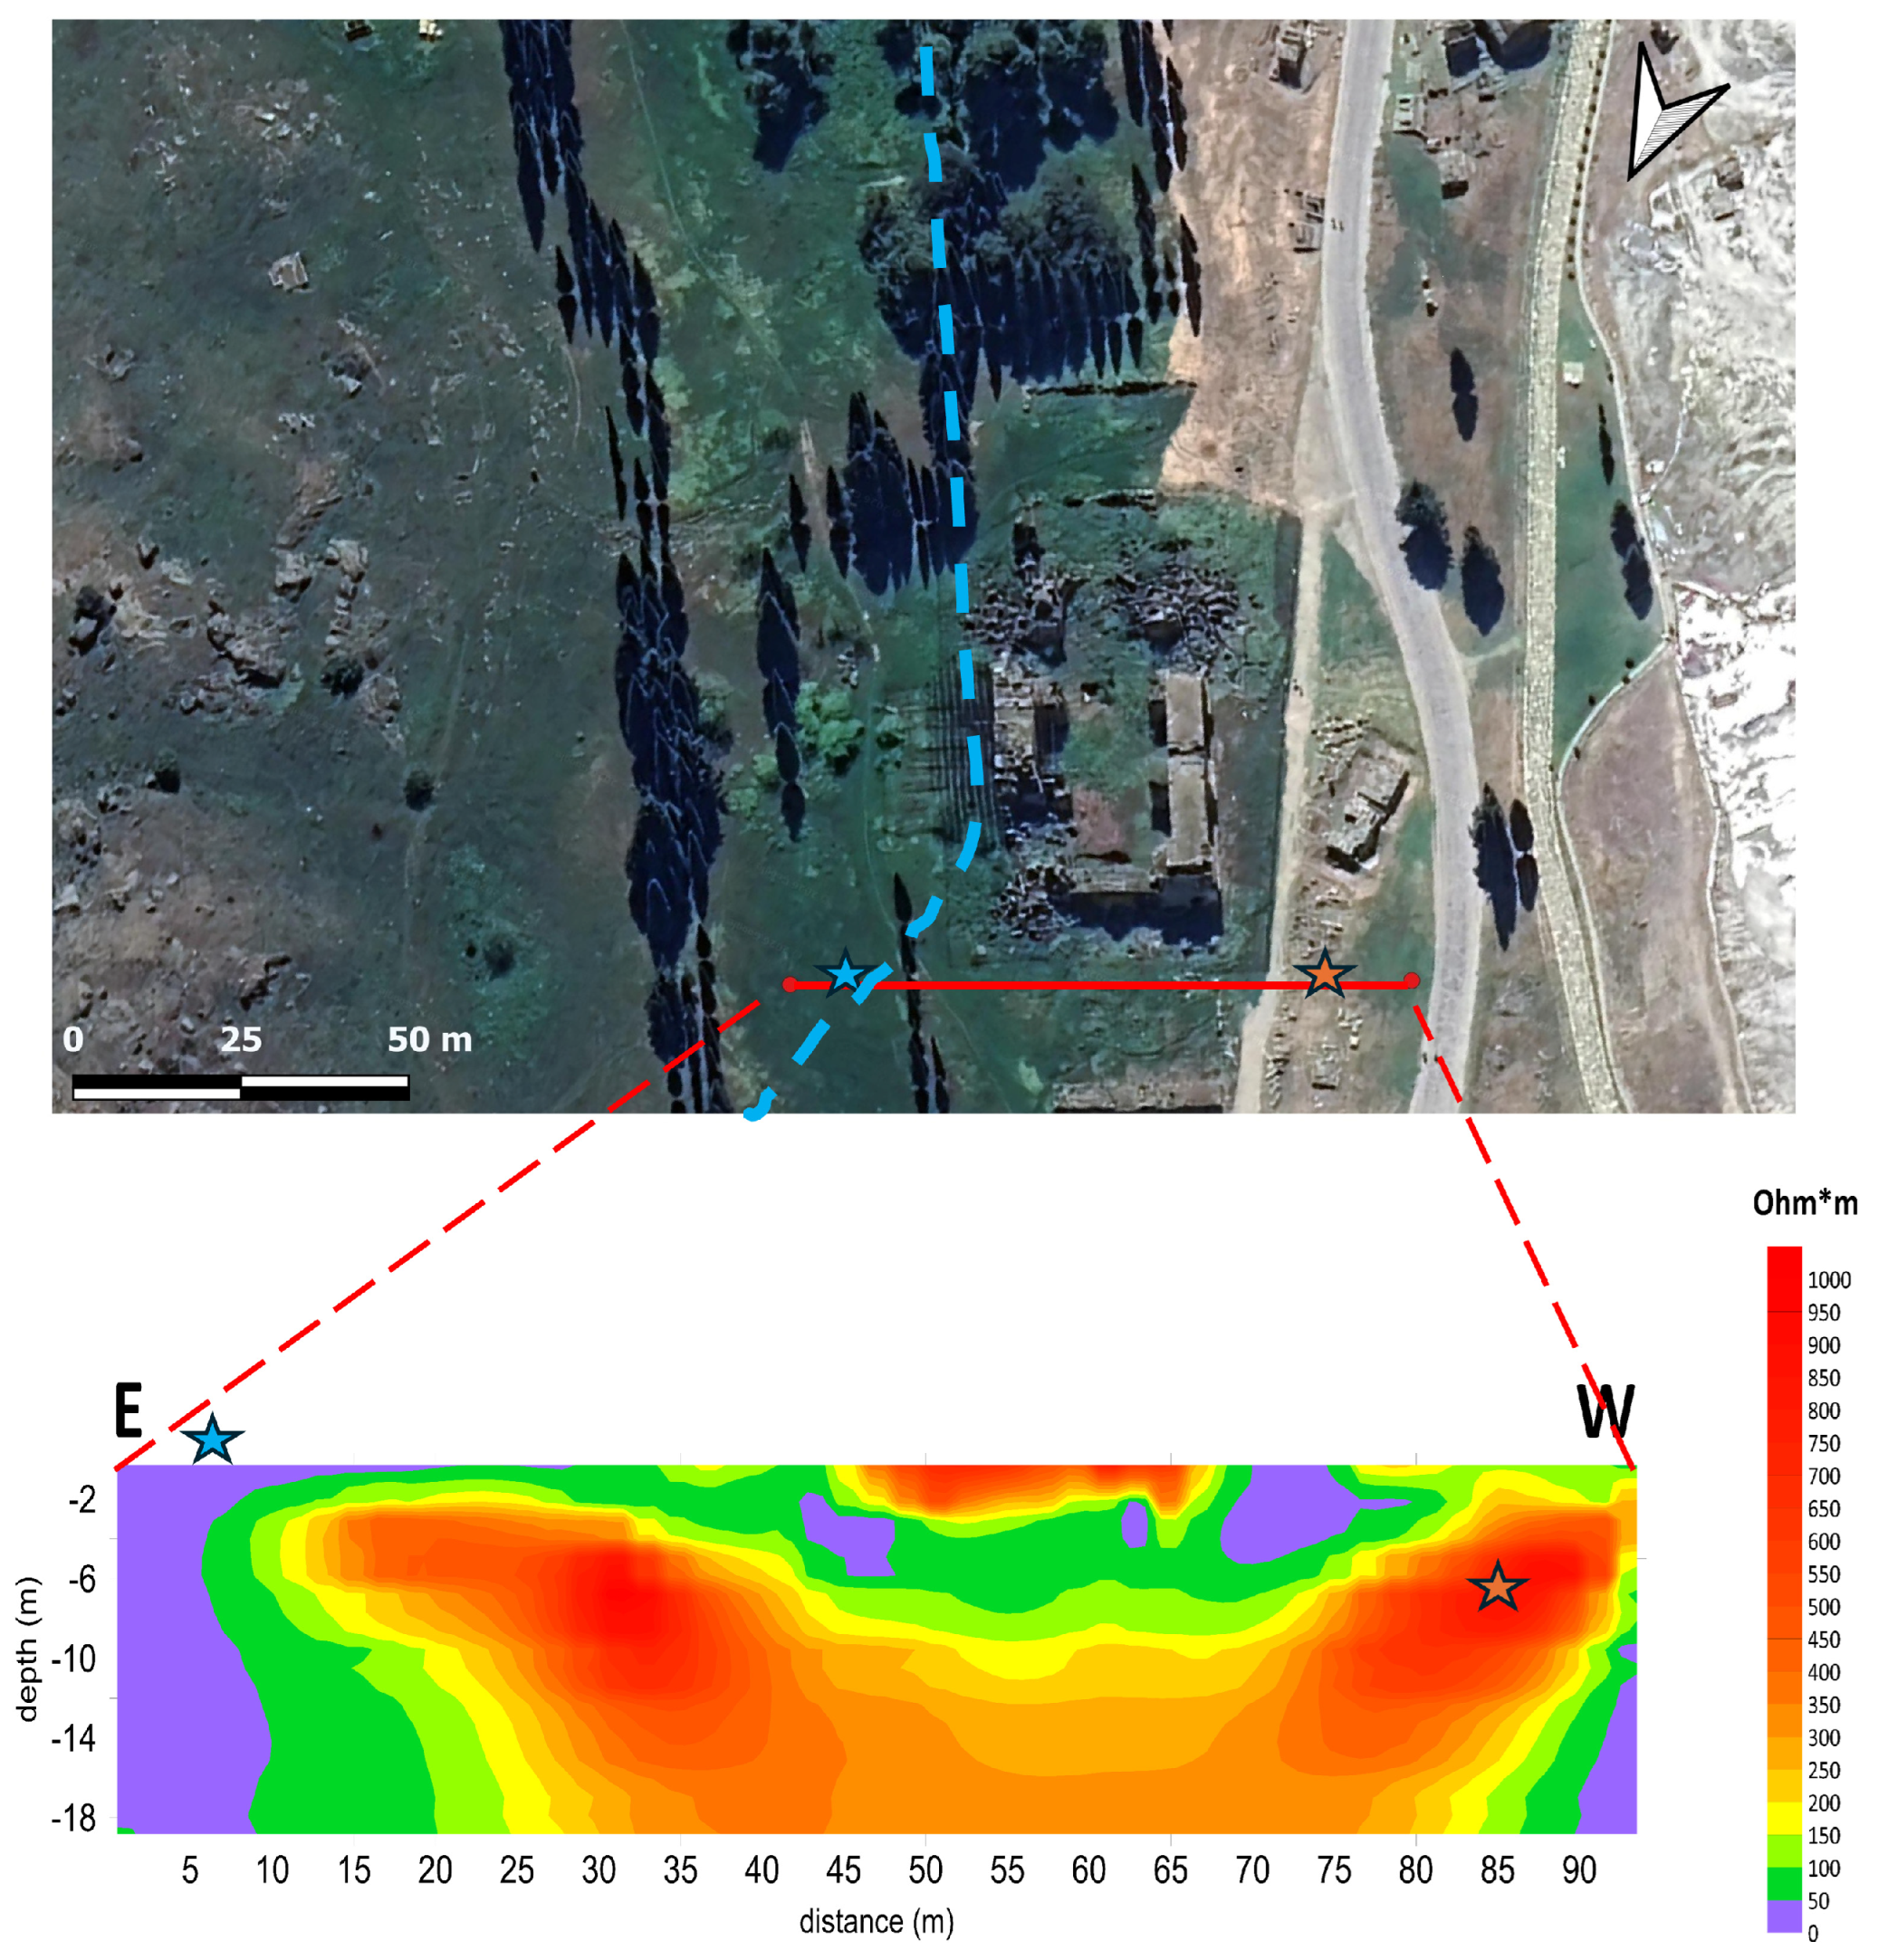
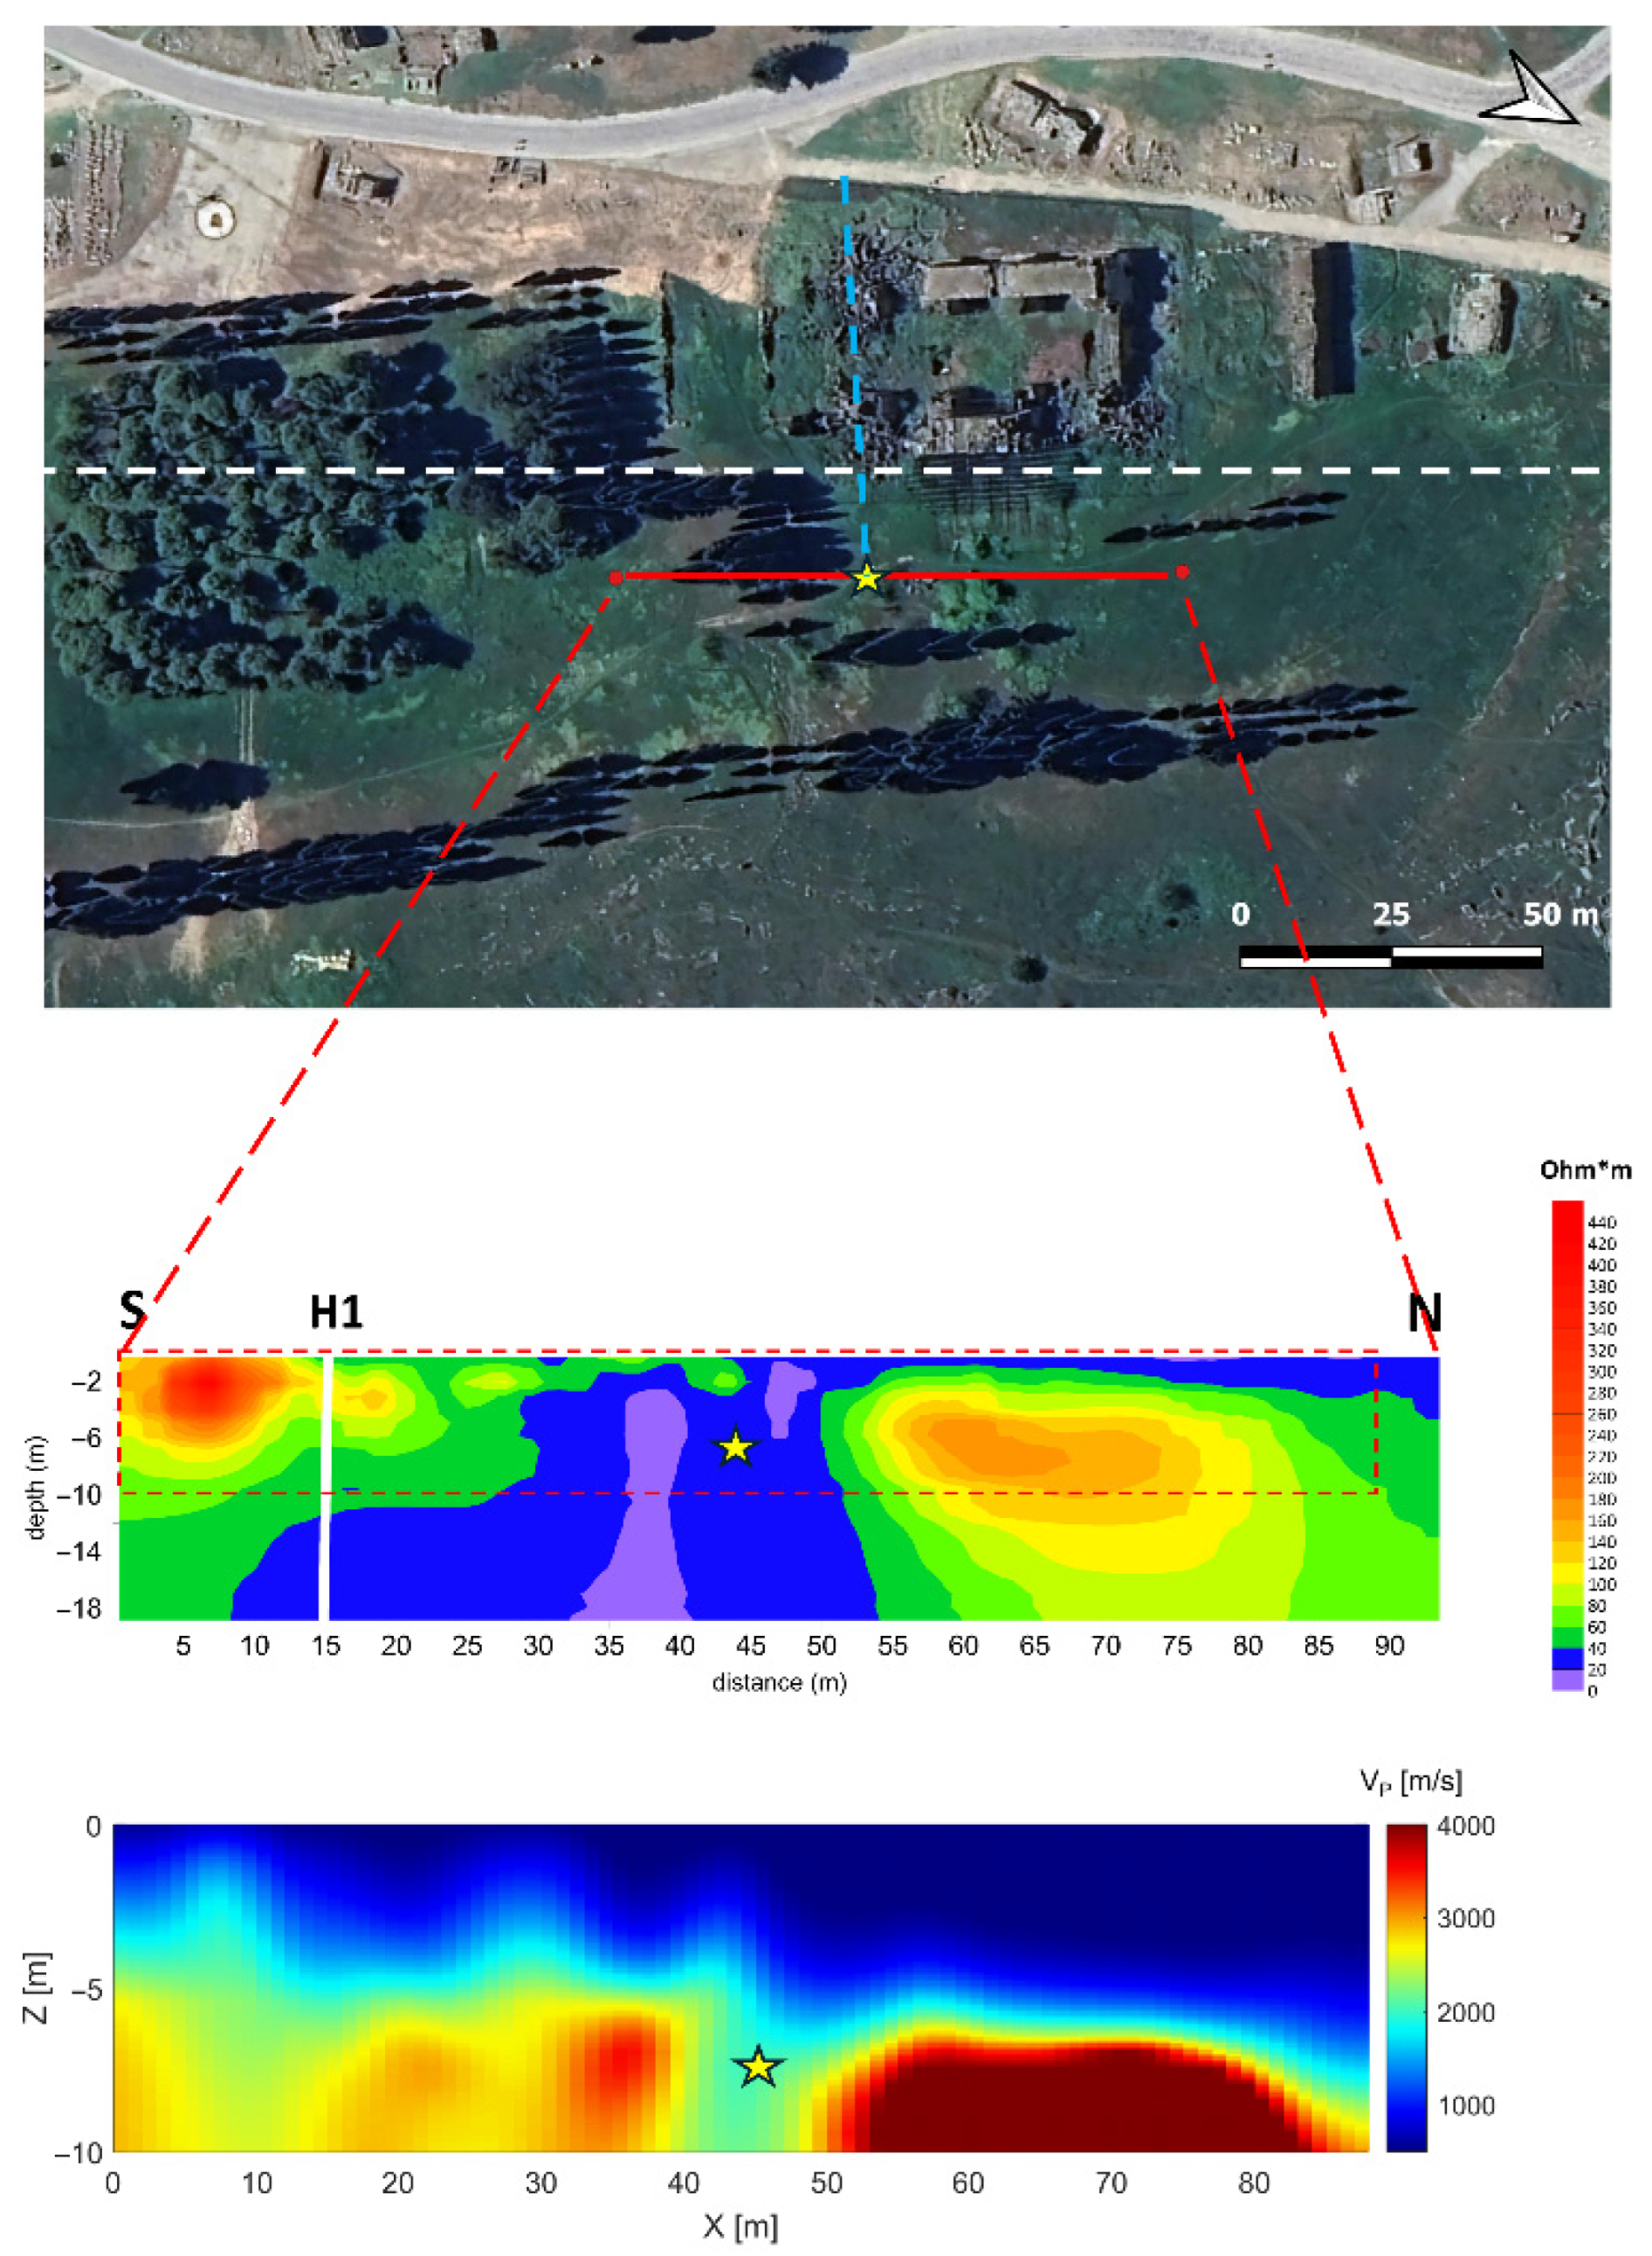
The result of the H2 ERT line and its position are shown in Figure 7. The orange star, as in line H1, highlights the position of a visible wall that is perpendicular to the line in the western part. Other similar anomalies along the line can be interpreted as buried walls. The presence of a more resistive shallow anomaly in the southern part is confirmed by the overlapping of H1 and H2. A second resistive area (between 55 m and 75 m along the x-axis), less than the southern one, is probably related to the geology. The most interesting anomaly is represented by the central conductive area, pointed by the blue star, interpreted as a possible fault, clearly in line with the collapsed southern corners of the building, as highlighted with the dashed blue line. The low resistivity of the supposed faults, like in the line H1 and in the previous similar studies [79,80], appears consistent with the presence of geothermal fluids in these fractures. Given the geology, other hypotheses for this conductive zone, e.g., the presence of paleochannels, must be ruled out. Figure 8 shows the result of the H3 ERT line, collected parallel to the external northern side of the Basilica Bath. A wide, irregular, resistive area, probably related to the shape of the travertine bedrock, covers the central part of the section. A shallow, central, thin, resistive area can correspond to collapsed material. On the western side, the effect of the geology may be mixed with the possible presence of tombs (orange star), aligned with those in front of the building. Most interesting is the conductive zone external to the resistive one (blue star) in the eastern part, which can be interpreted as the position of the main fault here (blue dashed line). No evidence about the presence of low resistive areas in the proper position in the ERT line, assuming the main fault to be perpendicular to this, as assumed before this measurement, to verify this hypothesis.
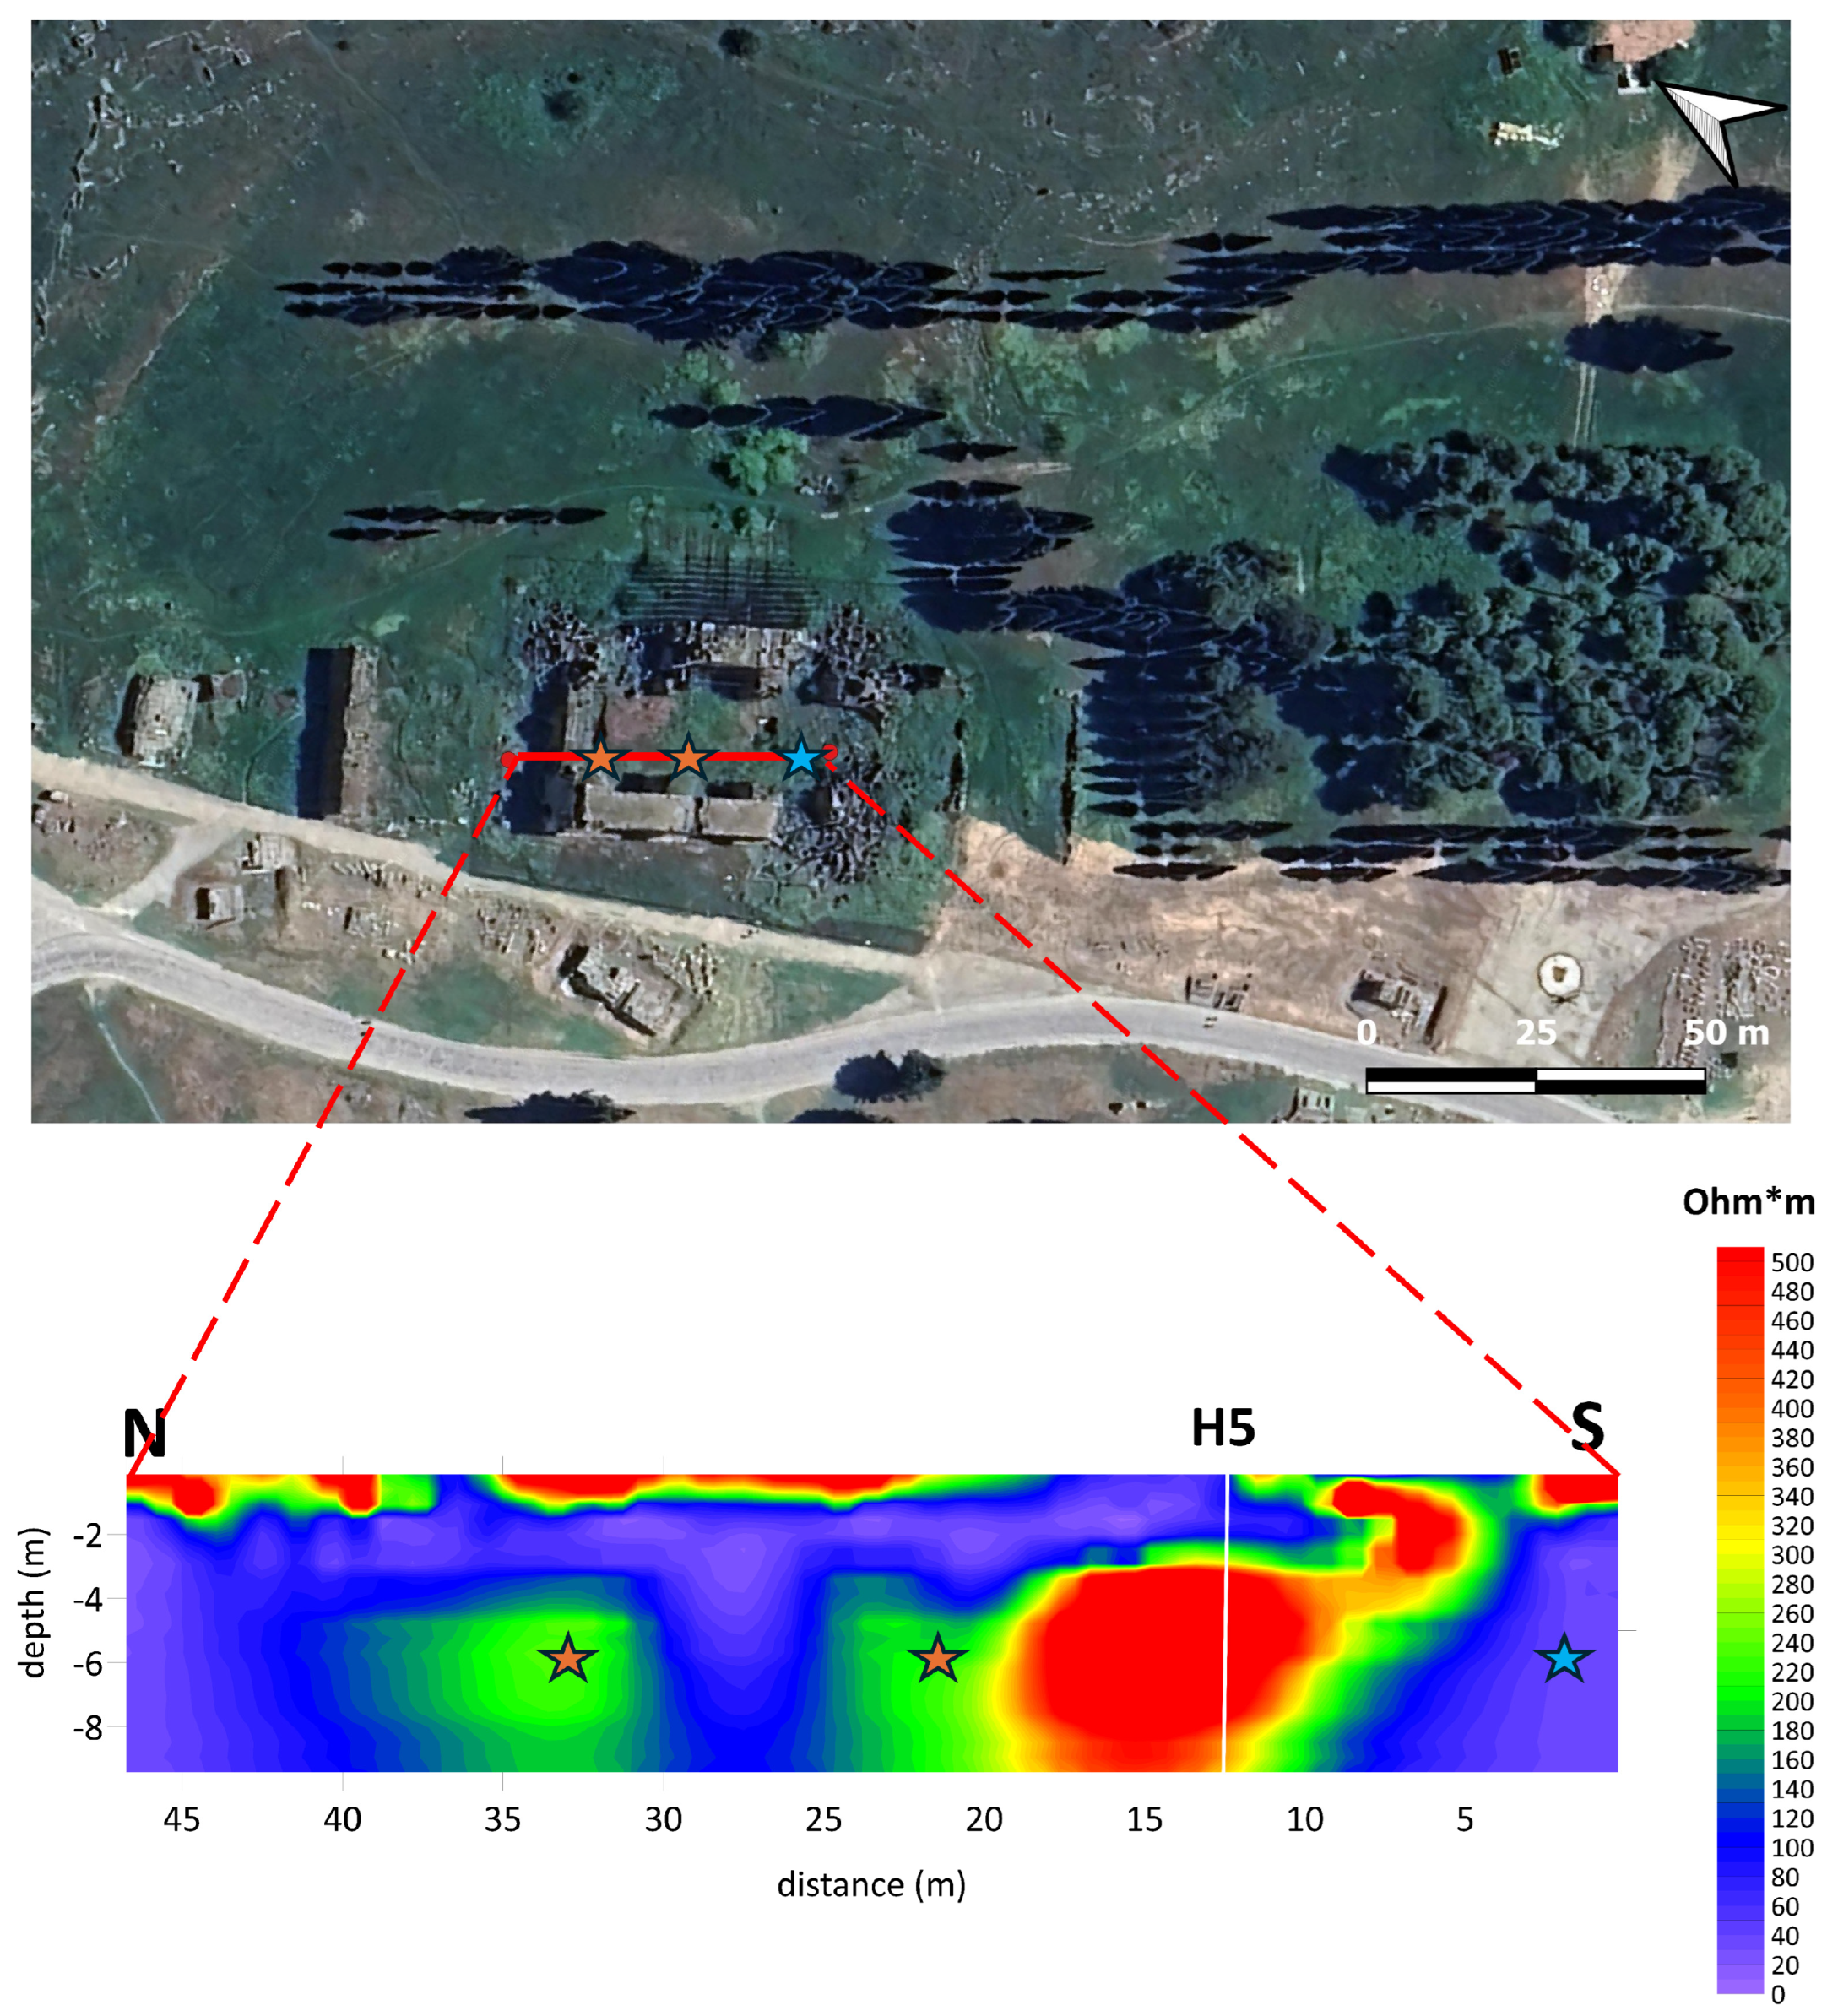
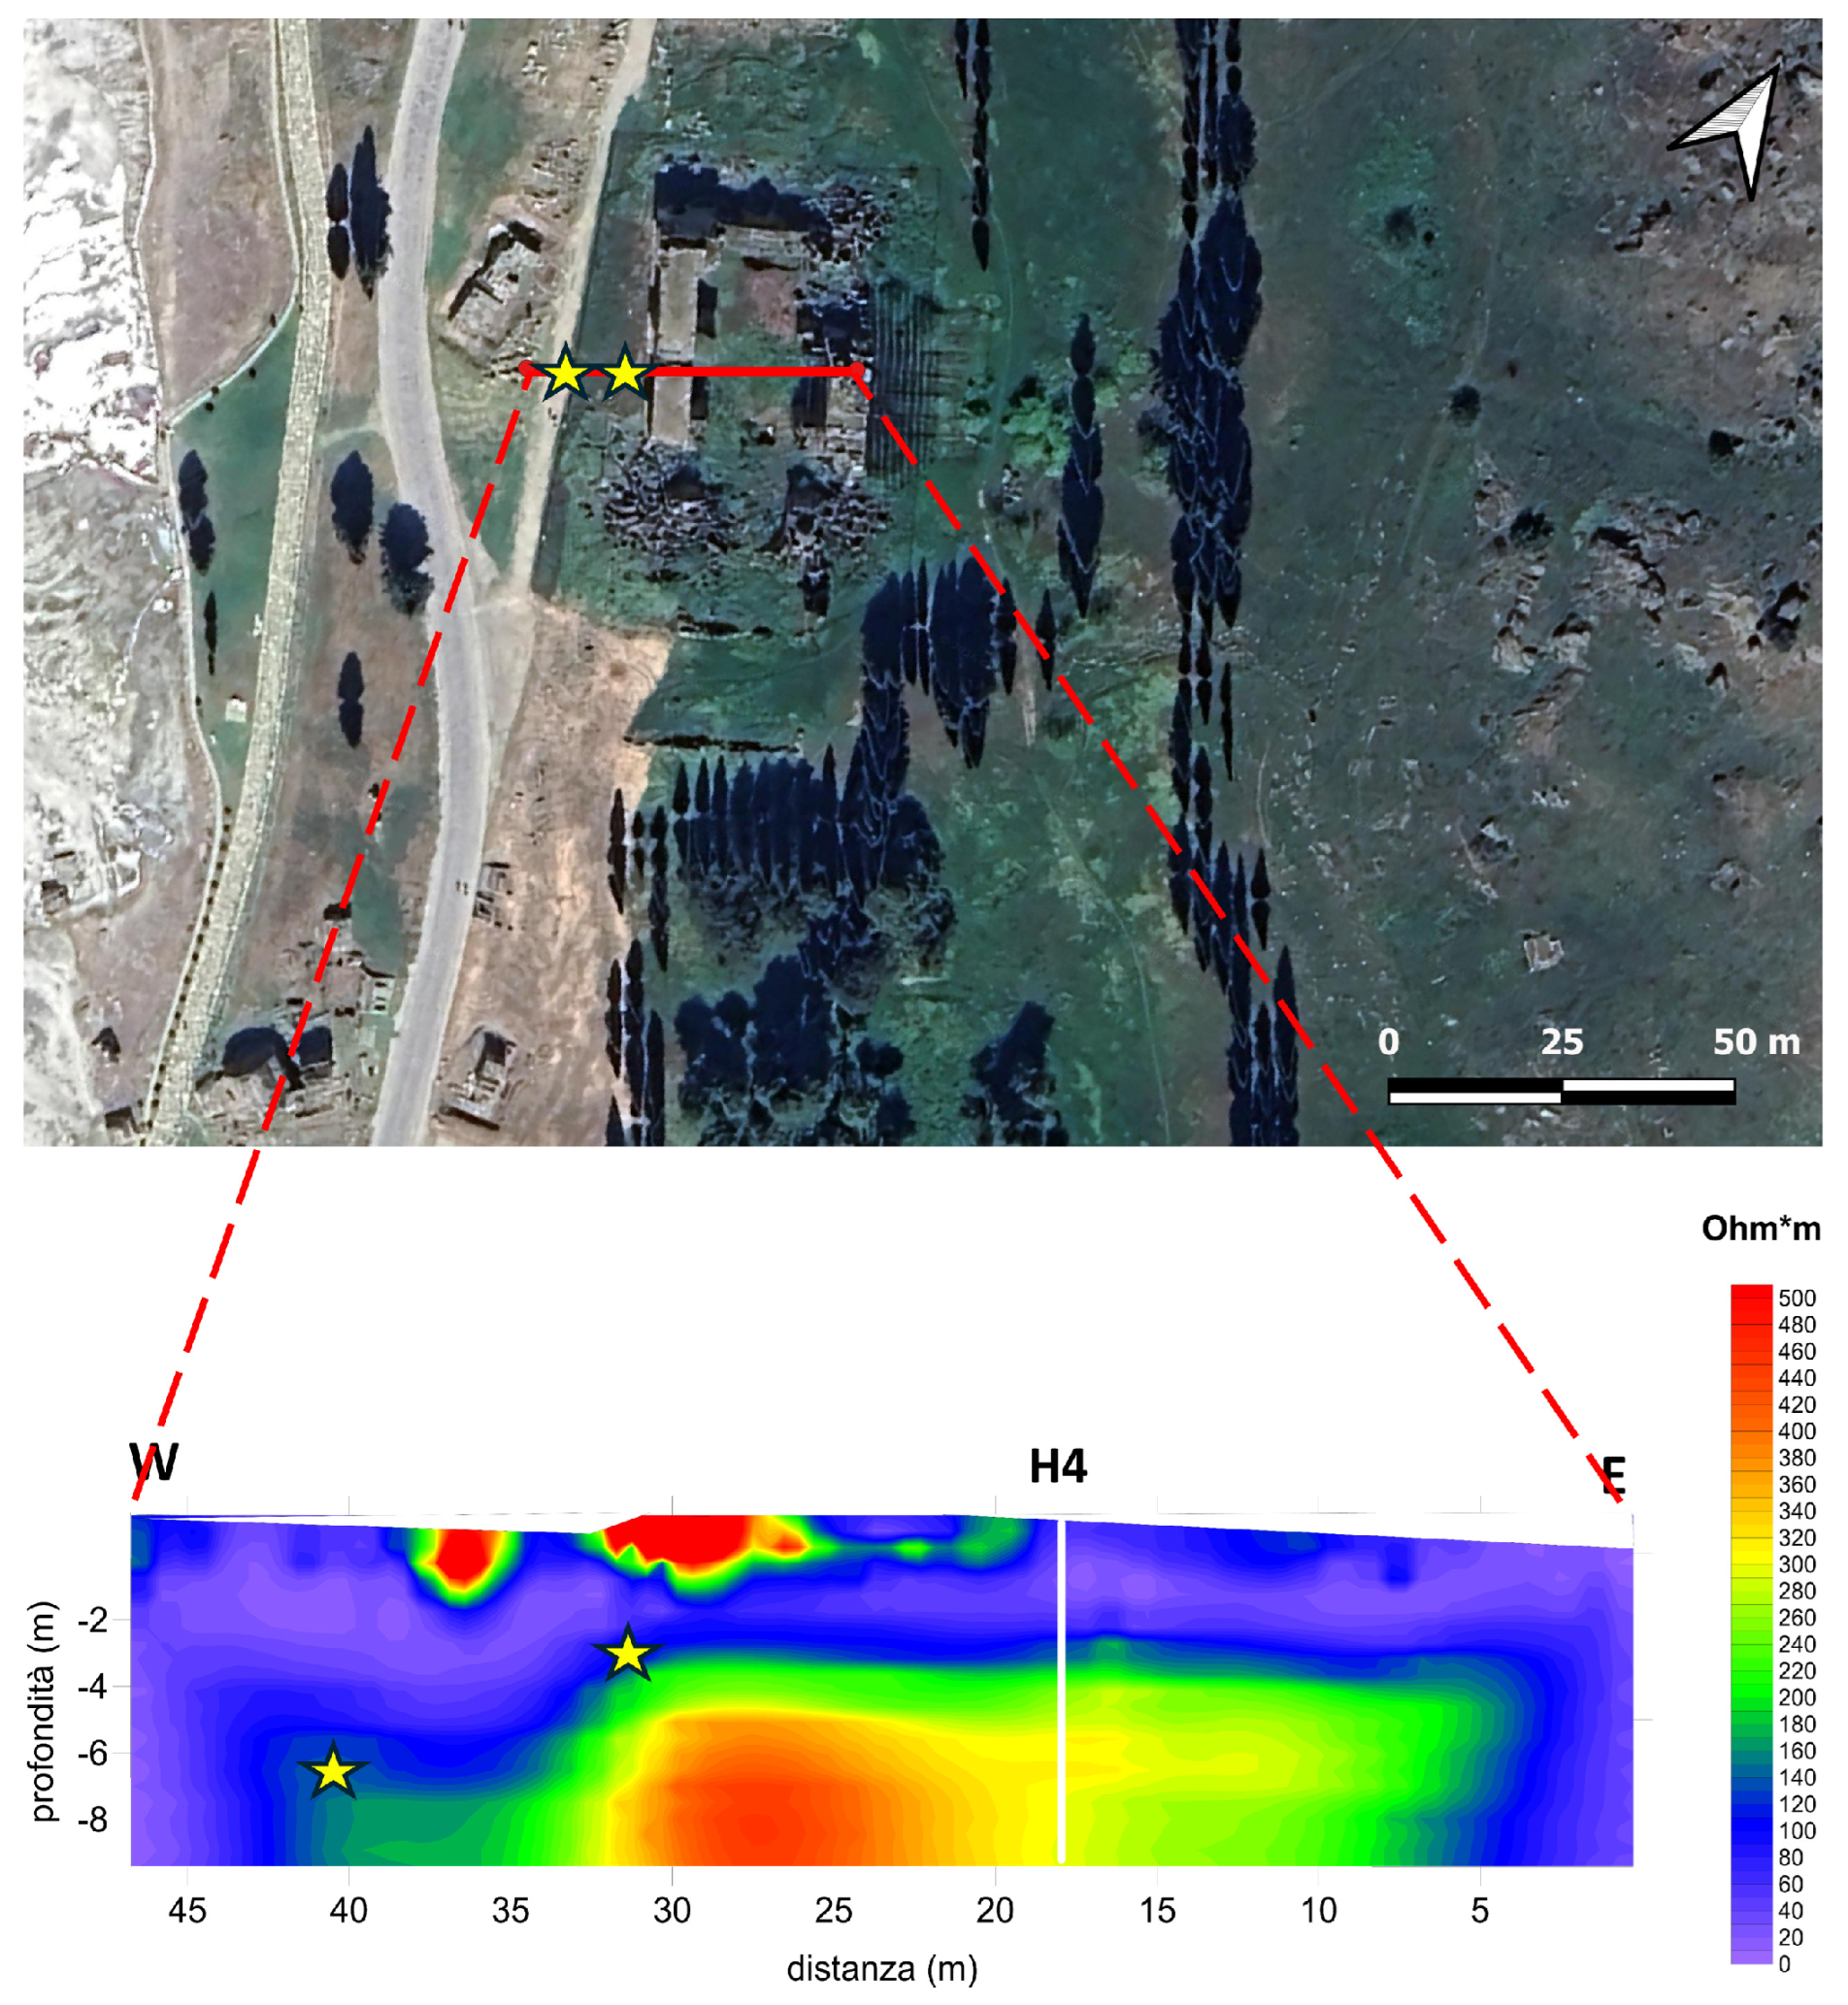
The result for line H4 is shown in Figure 9. This line, as the ERT-like line H5, was collected with 1 m spacing between electrodes, reaching half the depth of investigation and offering higher resolution than lines H1, H2, and H3 discussed earlier, to identify possible shallow cracks and archaeological remains of the ancient, original thermal building. The most interesting anomalies are highlighted by orange stars and appear to be related to the foundations of the arches’ pillars. It is also interesting to note the presence of a low resistive zone in the southern part of the line (blue star), which confirms the anomaly detected by the H2 line, considered as a fault.
Finally, Figure 10 shows the result for the ERT line H5. A large resistive area covers the central part of the section, confirming a depth consistent anomaly with the green ones in the line ERT H4, discussed earlier. An interesting point is the slope and the flat zone, marked by yellow stars, between 30 m and 40 m in a western direction, outside the building, which appears to be an external part of the same structure.

4.2. Seismic Surveys

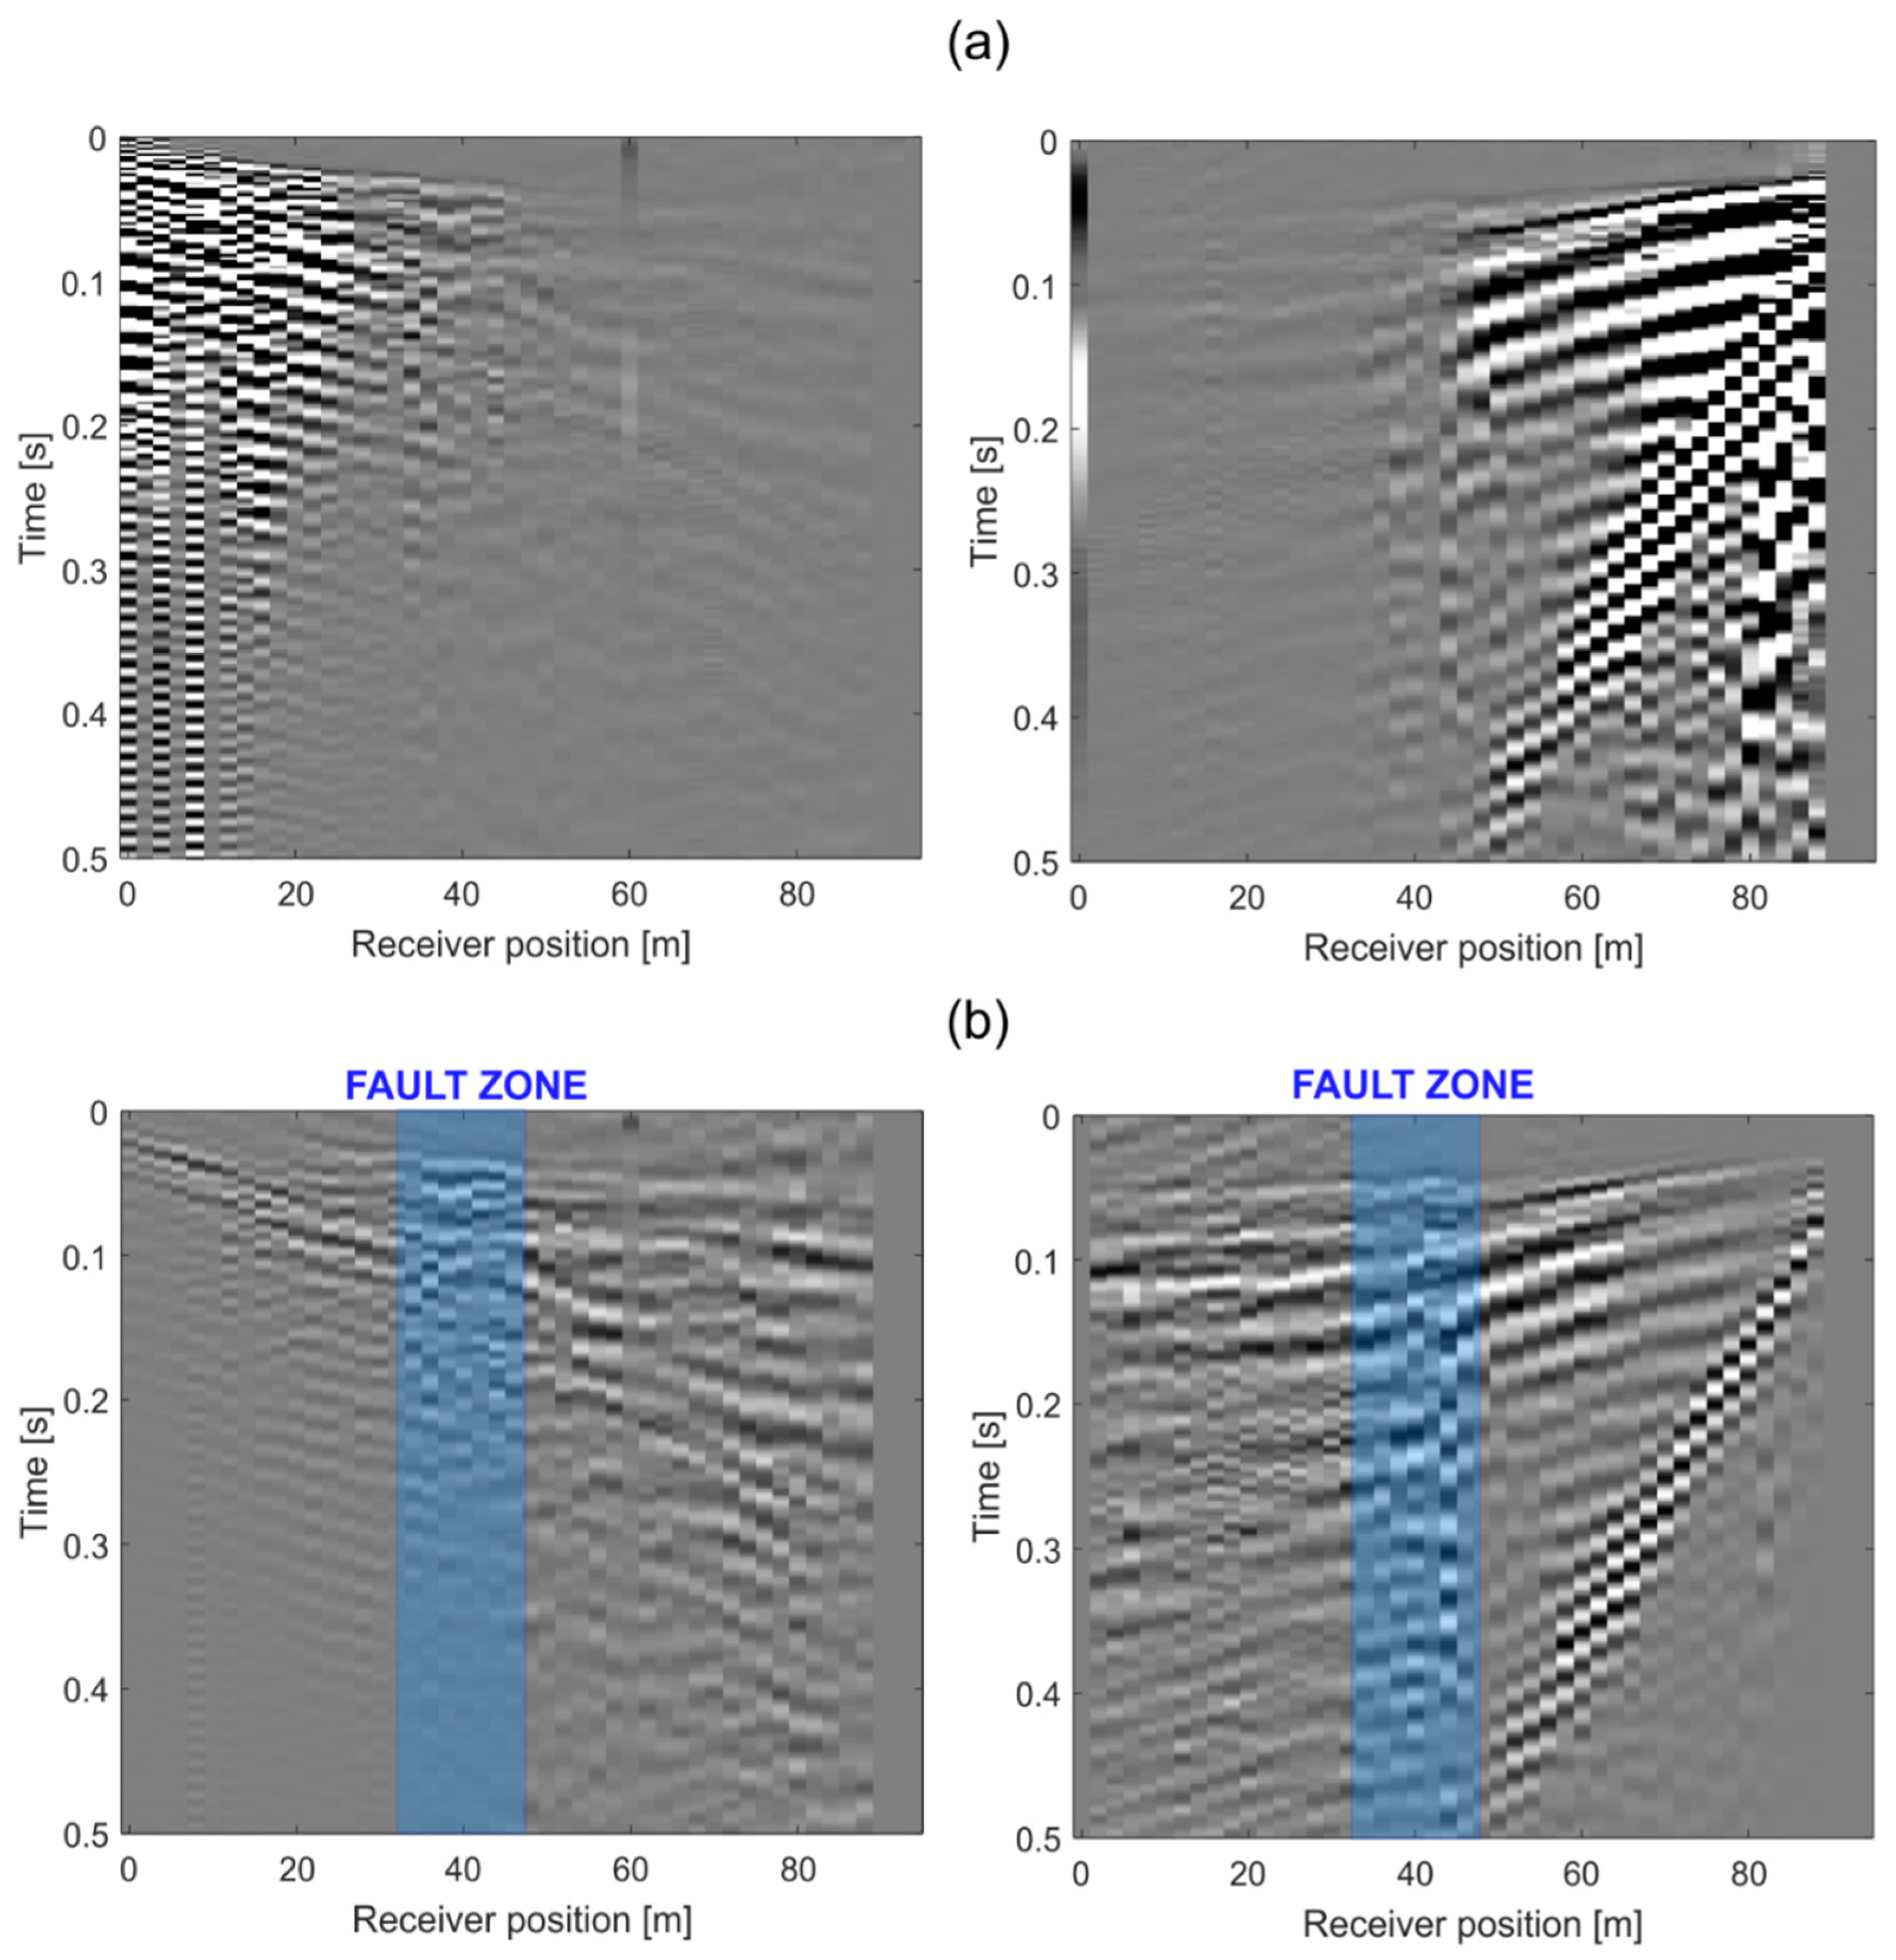
Examples of the raw shot gathers are shown in Figure 11, where a clear discontinuity is observed near the middle of the survey line, both in terms of the first arrivals (P-waves) and the slower and more powerful surface waves. In the raw data (Figure 11a), it is apparent how the energy is suddenly attenuated around 35 m from the first geophone. Accordingly, the normalized seismograms (Figure 11b) present anomalous traces around 40 m, suggesting a clear lateral discontinuity, likely a fault zone.
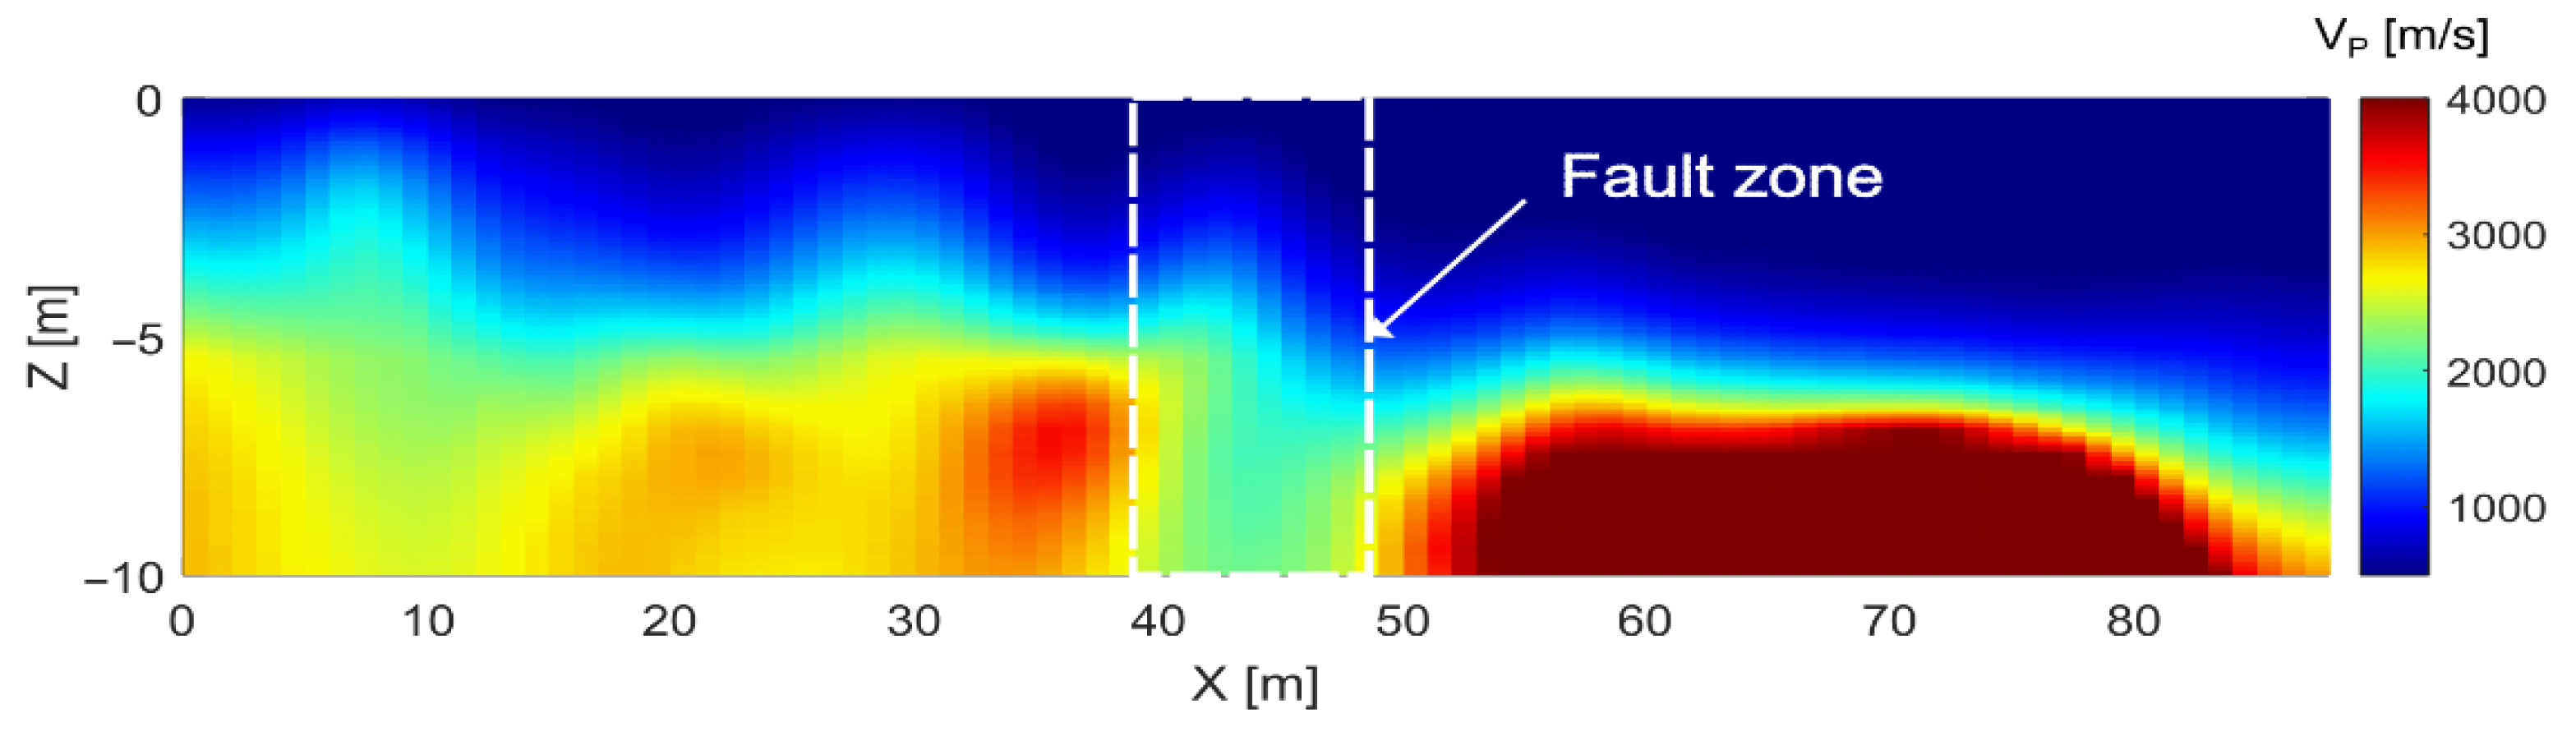
The inverted P-wave velocity (VP) model (Figure 12) was obtained after 10 iterations, with a final chi-square misfit of 3.2 ms. The 1D starting model was computed by fitting all arrival-time curves and yielded a two-layer model with a 5.5 m-thick first layer with VP = 600 m/s and a deeper layer with VP = 3200 m/s. Figure 12 shows the inversion results section. The reconstructed VP tomography clearly shows a fault between 37.5 m and 47.5 m from the first geophone, with the fractured bedrock buried beneath about 5 m of sediments (sloping from left to right). The velocities in the shallowest layers (0–3 m depth) are typical of unconsolidated coarse sediments such as sand and gravel. At depths between 3 and 5 m, a slight increase in VP suggests the presence of weathered rock. Below, the faster VP velocities are attributable to the travertine rock, typical of the Hierapolis geological formation.
The SRT survey clearly identifies a buried fault zone aligned with other tectonic lineaments that emerge at the surface in the surroundings of the studied area. Given its width, the detected buried fault zone is suspected to be one of the main faults affecting the Basilica Bath complex, most likely responsible for the major structural collapses.
Figure 13 shows a comparison of SRT and ERT sections acquired along the same H2 line and highlights the excellent match between the results of both methods, although with different spatial resolutions. The yellow stars, in the proper positions in the figure and supported by the blue dashed line, highlight the location of this unknown fault, aligned with the southern collapsed corners of the building. The SRT section, properly overlapping with the ERT thanks to the red-dashed rectangle, shows the differences in the results more clearly.
The SRT provides better horizontal resolution, while the ERT complements the information of the deeper part of the investigated system. Finally, considering the apparent displacement amplitude measured by ERT and SRT, approximately 2 m, using Nikonov’s formula [82], we can estimate the magnitude of the ancient earthquakes that generated this effect. The result, considering our geophysical data, is M = 7.2, not far from the largest magnitude measured in the Denizli basin, M = 7.1 [45].

5. Conclusions

Geophysical measurements acquired at Basilica Bath in the archaeological site of Hierapolis, in the active seismic area of Pamukkale (Turkey), demonstrate the potential of coupling ERT and SRT techniques, even in such a complex archaeological context.
ERT measurements collected at different electrode spacings, both inside and outside the Basilica Bath, enabled the identification of possible unknown buried archaeological remains, shallow cracks, and evidence of an unknown fault related to the building’s partial collapse.
SRT results are consistent with the ERT results along the same survey line (H2), although with different horizontal and vertical spatial resolutions, provided by these methods in this case study. The comparison of these results, supported by visible evidence on site, provides new data on possibly interesting buried archaeological features and geological information useful for future studies and research at this very complex site located in an active seismic area.

Author Contributions

Conceptualisation, R.D. and G.C.; methodology, R.D., G.C. and J.B.; software, R.D., J.B. and I.B.; validation, R.D., G.C. and G.S.; investigation, R.D., J.B. and I.B.; data curation, R.D., J.B., G.C. and I.B.; writing—original draft preparation R.D., J.B., G.C., G.S. and I.B.; writing—review and editing, R.D., J.B., G.C., G.S. and I.B.; supervision R.D., J.B., G.C., G.S. and I.B.; project administration, G.S. and R.D.; funding acquisition, G.S. and R.D. All authors have read and agreed to the published version of the manuscript.

Funding

This research was funded by the Italian Ministry of University and Research (MIUR) programme PRIN 2015 “Archeology of urban landscapes in Asia Minor between late Hellenism and Byzantine age. Multidisciplinary approaches to the study of Hierapolis in Phrygia” and by PNRR—Missione 4, Componente 2, Investimento 1.1—Prin 2022 PNRR Project: Living on active seismic faults: an archaeological approach. The case study of Hierapolis of Phrygia (CUP J53D23017720001).

Institutional Review Board Statement

Not applicable.

Informed Consent Statement

Not applicable.

Data Availability Statement

The raw data supporting the conclusions of this article will be made available by the authors on request.

Acknowledgments

This research was supported by the Italian Archaeological Mission- MAIER at Hierapolis of Phrygia (Turkey) and by the University of Padova. The authors are particularly grateful to the reviewers for their suggestions, which have definitely improved the manuscript.

Conflicts of Interest

The authors declare no conflicts of interest. The funders had no role in the design of the study; in the collection, analyses, or interpretation of data; in the writing of the manuscript; or in the decision to publish the results.

References

  1. Batayneh, A. Archaeogeophysics–archaeological prospection—A mini review. J. King Saud Univ.—Sci. 2011, 23, 83–89. [Google Scholar] [CrossRef]
  2. Schmidt, A.; Ernenwein, E.G. Geophysical Data in Archaeology: A Guide to Good Practice, 2nd ed.; ADS: York, UK, 2011; Available online: https://archaeologydataservice.ac.uk/library/browse/issue.xhtml?recordId=1188511 (accessed on 1 February 2026).
  3. Sala, R.; Garcia-Garcia, E.; Tamba, R. Archaeological Geophysics—From Basics to New Perspectives. In Archaeology, New Approaches in Theory and Techniques; InTech: London, UK, 2012. [Google Scholar] [CrossRef]
  4. Schmidt, A.R.; Linford, P.; Linford, N.; David, A.; Gaffney, C.F.; Sarris, A.; Fassbinder, J. EAC Guidelines for the Use of Geophysics in Archaeology: Questions to Ask and Points to Consider. EAC Guidelines 2; Europae Archaeologia Consilium (EAC): Namur, Belgium; Association Internationale sans But Lucratif (AISBL): Namur, Belgium, 2015; 135p. [Google Scholar]
  5. Deiana, R.; Leucci, G.; Martorana, R. New Perspectives on Geophysics for Archaeology: A Special Issue. Surv. Geophys. 2018, 39, 1035–1038. [Google Scholar] [CrossRef]
  6. Metwaly, M. Archaeogeophysics State of the Art and Case Studies; El-Qady, G., Metwaly, M., Eds.; Springer: Cham, Switzerland, 2019. [Google Scholar] [CrossRef]
  7. Martorana, R.; Capizzi, P.; Pisciotta, A.; Scudero, S.; Bottari, C. An Overview of Geophysical Techniques and Their Potential Suitability for Archaeological Studies. Heritage 2023, 6, 2886–2927. [Google Scholar] [CrossRef]
  8. Cuenca-Garcia, C.; Asăndulesei, A.; Lowe, K.M. World Archaeo-Geophysics: Integrated Minimally Invasive Approaches Using Country-Based Examples; Springer: Cham, Switzerland, 2024. [Google Scholar] [CrossRef]
  9. Tencer, T.; Milo, P.; Prišťáková, M.; Havelka, J.; Rekemová, A.-M. Archaeogeophysics in Development-Led Excavations. ArcheoSciences 2025, 49-1, 611–612. Available online: https://shs.cairn.info/revue-archeosciences-2025-1-page-611?lang=en (accessed on 1 February 2026). [CrossRef]
  10. Kvamme, K.L. Magnetometry: Nature’s gift to archaeology. In Remote Sensing in Archaeology: An Explicitly North American Perspective; The University of Alabama Press: Tuscaloosa, AL, USA, 2006; pp. 205–233. [Google Scholar]
  11. Schmidt, A. Archaeology, magnetic methods. In Encyclopedia of Geomagnetism and Paleomagnetism; Springer: Dordrecht, The Netherlands, 2007. [Google Scholar] [CrossRef]
  12. Smekalova, T.N.; Smekalov, S.L.; Voss, O.; Bevan, B.W. Magnetic Surveying in Archaeology: More than 10 Years of Using the Overhauser GSM-19 Gradiometer; Wormianum: Højbjerg, Denmark, 2008. [Google Scholar]
  13. Aspinall, A.; Gaffney, C.F.; Schmidt, A. Magnetometry for Archaeologists; AltaMira Press: Lanham, MD, USA, 2008. [Google Scholar]
  14. Fassbinder, J.W.E. Magnetometry for Archaeology. In Encyclopedia of Geoarchaeology; Encyclopedia of Earth Sciences Series; Springer: Dordrecht, The Netherlands, 2017; pp. 499–514. [Google Scholar] [CrossRef]
  15. Fedi, M.; Cella, F.; Florio, G.; La Manna, M.; Paoletti, V. Geomagnetometry for Archaeology. In Sensing the Past—From Artifact to Historical Site; Masini, N., Soldovieri, F., Eds.; Springer International Publishing: Cham, Switzerland, 2017; pp. 203–230. [Google Scholar]
  16. von der Osten-Woldenburg, H. Magnetic Gradiometry in Archaeo-geophysics. In Encyclopedia of Solid Earth Geophysics; Gupta, H.K., Ed.; Encyclopedia of Earth Sciences Series; Springer: Cham, Switzerland, 2021. [Google Scholar] [CrossRef]
  17. Accomando, F.; Florio, G. Drone-Borne Magnetic Gradiometry in Archaeological Applications. Sensors 2024, 24, 4270. [Google Scholar] [CrossRef]
  18. Conyers, L.B. Ground-penetrating radar for archaeological mapping. In Remote Sensing in Archaeology; Springer: Berlin/Heidelberg, Germany, 2006; pp. 329–344. [Google Scholar]
  19. Conyers, L.B. Ground-Penetrating Radar and Magnetometry for Buried Landscape Analysis, 1st ed.; Springer Nature: Cham, Switzerland, 2018. [Google Scholar] [CrossRef]
  20. Conyers, L.B. Ground-Penetrating Radar for Archaeology, 4th ed.; Rowman and Littlefield: Lanham, MD, USA, 2023. [Google Scholar]
  21. Oliveira, R.J.; Caldeira, B.; Teixidó, T.; Borges, J.F. Advanced Geophysical Processing of Ground-Penetrating Radar and Magnetic Datasets. In Recent Research on Geotechnical Engineering, Remote Sensing, Geophysics and Earthquake Seismology (MedGU 2022); Bezzeghoud, M., Ergüler, Z.A., Rodrigo-Comino, J., Jat, M.K., Kalatehjari, R., Bisht, D.S., Biswas, A., Chaminé, H.I., Shah, A.A., Radwan, A.E., et al., Eds.; Advances in Science, Technology & Innovation; Springer: Cham, Switzerland, 2024. [Google Scholar] [CrossRef]
  22. Noel, M.; Xu, B. Archaeological investigation by electrical resistivity tomography: A preliminary study. Geophys. J. Int. 1991, 107, 95–102. [Google Scholar] [CrossRef]
  23. Ulrich, B.; Günther, T.; Rücker, C. Electrical Resistivity Tomography Methods for Archaeological Prospection. In Layers of Perception, Proceedings of the 35th International Conference on Computer Applications and Quantitative Methods in Archaeology (CAA), Berlin, Germany, 2–6 April 2007; Posluschny, A., Lambers, K., Herzog, I., Eds.; Dr. Rudolf Habelt GmbH: Bonn, Germany, 2007. [Google Scholar]
  24. Berge, M.A.; Drahor, M.G. Electrical resistivity tomography investigations of multilayered archaeological settlements: Part I–modelling. Archaeol. Prospect. 2011, 18, 159–171. [Google Scholar] [CrossRef]
  25. Schmidt, A. Earth Resistance for Archaeologists; AltaMira Press: Lanham, MD, USA; New York, NY, USA; Toronto, ON, Canada; Plymouth, UK, 2013. [Google Scholar]
  26. De Smedt, P.; Saey, T.; Lehouck, A.; Stichelbaut, B.; Meerschman, E.; Islam, M.M.; Van De Vijver, E.; Van Meirvenne, M. Exploring the potential of multi-receiver EMI survey for geoarchaeological prospection: A 90 ha dataset. Geoderma 2013, 199, 30–36. [Google Scholar] [CrossRef]
  27. Christiansen, A.V.; Pedersen, J.B.; Auken, E.; Søe, N.E.; Holst, M.K.; Kristiansen, S.M. Improved Geoarchaeological Mapping with Electromagnetic Induction Instruments from Dedicated Processing and Inversion. Remote Sens. 2016, 8, 1022. [Google Scholar] [CrossRef]
  28. Vacilotto, A.; Deiana, R.; Mozzi, P. Understanding Ancient Landscapes in the Venetian Plain through an Integrated Geoarchaeological and Geophysical Approach. Remote Sens. 2020, 12, 2973. [Google Scholar] [CrossRef]
  29. Deiana, R.; Deidda, G.P.; Cusí, E.D.; van Dommelen, P.; Stiglitz, A. FDEM and ERT measurements for archaeological prospections at Nuraghe S’Urachi (West-Central Sardinia). Archaeol. Prospect. 2021, 29, 69–86. [Google Scholar] [CrossRef]
  30. De Smedt, P.; Simon, F.-X.; Verhegge, J. Electromagnetic Induction in Archaeological Prospection: Potential, Pitfals, and Perspectives for Applications in Dry- and Wetland Environments. In Proceedings of the AGU Fall Meeting Abstracts, Chicago, IL, USA, 12–16 December 2022. [Google Scholar]
  31. Rossi, C.; Deiana, R.; Garosi, G.A.; de Leo, A.; Di Stefano, S.; Primon, S.; Peruzzo, L.; Barone, I.; Rampin, S.; Maniero, P.; et al. A New Bronze Age Productive Site on the Margin of the Venice Lagoon: Preliminary Data and Considerations. Land 2025, 14, 1452. [Google Scholar] [CrossRef]
  32. Steeples, D.W.; Miller, R.D. Seismic reflection methods applied to engineering, environmental, and groundwater problems. In Geotechnical and Environmental Geophysics; Ward, S.H., Ed.; Society of Exploration Geophysicists: Tulsa, OK, USA, 1990; Volume 1, pp. 1–30. [Google Scholar]
  33. Johora, F.T.; Hickey, C.J.; Yasarer, H. Predicting Geotechnical Parameters from Seismic Wave Velocity Using Artificial Neural Networks. Appl. Sci. 2022, 12, 12815. [Google Scholar] [CrossRef]
  34. El Hameedy, M.A.; Mabrouk, W.M.; Dahroug, S.; Youssef, M.S.; Metwally, A.M. Role of Seismic Refraction Tomography (SRT) in bedrock mapping; case study from industrial zone, Ain-Sokhna area, Egypt. Contrib. Geophys. Geod. 2023, 53, 111–128. [Google Scholar] [CrossRef]
  35. Chan, R.; Eng, C.; Oy, K.; Heng, M.; Yos, P.; Por, P. Using Near-surface seismic refraction tomography and multichannel analysis of surface waves for geotechnical evaluation of soil properties compared with bore-hole data. Techno-Sci. Res. J. 2024, 12, 215–222. [Google Scholar]
  36. Arvanitis, M. Estimation of Geotechnical Parameters Using Seismic Measurements. IJRESM 2024, 7, 108–111. [Google Scholar]
  37. Ovenden, S.M. Application of seismic refraction to archaeological prospecting. Archaeol. Prospect. 1994, 1, 53–63. [Google Scholar] [CrossRef]
  38. Toushmalani, R. Application and limitation of geophysical techniques in archaeology. J. Appl. Sci. Res. 2010, 6, 6440–6449. [Google Scholar]
  39. Soupios, P. Seismic Geophysical Methods in Archaeological Prospection. In Best Practices of GeoInformatic Technologies for the Mapping of Archaeolandscapes; Sarris, A., Ed.; Archaeopress: Oxfordshire, UK, 2015; pp. 35–44. [Google Scholar] [CrossRef]
  40. Barone, I.; Cassiani, G.; Ourabah, A.; Boaga, J.; Pavoni, M.; Deiana, R. Integrating controlled-source and ambient noise seismic measures for archaeological prospection: The Scrovegni Chapel case. Geophys. J. Int. 2023, 232, 1944–1956. [Google Scholar] [CrossRef]
  41. Barone, I.; Cassiani, G.; Ourabah, A.; Boaga, J.; Pavoni, M.; Deiana, R. Surface wave tomography using dense 3D data around the Scrovegni Chapel in Padua, Italy. Sci. Rep. 2022, 12, 11806. [Google Scholar] [CrossRef]
  42. Badri, M.A.; Mortagy, A.; Davis, D.; Hancock, P.L.; Altunel, E. Faulted archaeological relics at Hierapolis (Pamukkale), Turkey. J. Geodyn. 1997, 24, 21–36. [Google Scholar] [CrossRef]
  43. D’Andria, F. Hierapolis of Phrygia: Its Evolution in Hellenistic and Roman Times. J. Rom. Archaeol. 2001, 45, 96–115. [Google Scholar]
  44. Aydan, O.; Kumsar, H. Some observations of the seismic damage to antique cities and structures in Denizli region. In Proceedings of the 1st International Symposium on Travertine, Denizli, Turkey, 21–25 September 2005; pp. 211–216. [Google Scholar]
  45. Kumsar, H.; Aydan, O.; Simsek, C.; D’Andria, F. Historical earthquakes that damaged Hierapolis and Laodikeia antique cities and their implications for earthquake potential of Denizli basin in western Turkey. Bull. Eng. Geol. Environ. 2015, 75, 519–536. [Google Scholar] [CrossRef]
  46. Altunel, E.; Hancock, P.L. Active fissuring and faulting in Quaternary travertines at Pamukkale, western Turkey. Z. Geomorphol. 1993, 94, 285–302. [Google Scholar]
  47. Koçyigit, A. The Denizli graben-horst system and the eastern limit of western Anatolian continental extension: Basin-fill, structure, deformational mode, throw amount and episodic evolutionary history. SW Turkey. Geodin. Acta 2005, 18, 167–208. [Google Scholar] [CrossRef]
  48. Akyol, N.; Zhu, L.P.; Mitchel, B.J.; Sözbilir, H.; Kekovalı, K. Crustal structure and local seismicity in western Anatolia. Geophys. J. Int. 2006, 166, 1259–1269. [Google Scholar] [CrossRef]
  49. Alçiçek, H.; Varol, B.; Özkul, M. Sedimentary facies, depositional environments and palaeogeographic evolution of the Neogene Denizli Basin, SW Anatolia, Turkey. Sed Geol. 2007, 202, 596–637. [Google Scholar] [CrossRef]
  50. Özkul, M.; Varol, B.; Alçiçek, M.C. Depositional environments and petrography of Denizli travertines. Bull. Miner. Res. Explor. 2002, 125, 13–29. [Google Scholar]
  51. Özkul, M. Travertine deposits of Denizli Extensional Basin in Western Turkey: A general review. In Proceedings of the 1st International Symposium on TRAVERTINE, Denizli, Turkey, 21–25 September 2005; Pamukkale University: Denizli, Turkey, 2005; pp. 18–24. [Google Scholar]
  52. Altunel, E.; Karabacak, V. Determination of horizontal extension from fissure-ridge travertines: A case study from the Denizli Basin, southwestern Turkey. Geodin. Acta 2005, 18, 333–342. [Google Scholar] [CrossRef]
  53. Ozkul, M.; Kele, S.; Gokgoz, A.; Shen, C.; Jones, B.; Baykara, M.O.; Frizs, I.; Nemeth, T.; Chang, Y.W.; Alçiçek, M.C. Comparison of the Quaternary travertine sites in the Denizli extensional basin based on their depositional and geochemical data. Sediment. Geol. 2013, 294, 179–204. [Google Scholar] [CrossRef]
  54. Kele, S.; Özkul, M.; Fórizs, I.; Gökgöz, A.; Baykara, M.O.; Alçiçek, M.C.; Németh, T. Stable isotope geochemical study of Pamukkale travertines: New evidences of low-temperature non-equilibrium calcite-water fractionation. Sediment. Geol. 2011, 238, 191–212. [Google Scholar] [CrossRef]
  55. De Filippis, L.; Faccenna, C.; Billi, A.; Anzalone, E.; Brilli, M.; Ozkul, M.; Soligo, M.; Tuccimei, P.; Villa, I.M. Growth of fissure ridge travertines from geothermal springs of Denizli Basin, western Turkey. Geol. Soc. Am. Bull. 2012, 124, 1629–1645. [Google Scholar] [CrossRef]
  56. Brogi, A.; Capezzuoli, E.; Alçiçek, M.; Gandin, A. Evolution of a fault-controlled fissure-ridge type travertine deposit in the western Anatolia extensional province: The Çukurbaǧ fissure-ridge (Pamukkale, Turkey). J. Geol. Soc. 2014, 171, 425–441. [Google Scholar] [CrossRef]
  57. Hancock, P.L.; Chalmers, R.; Altunel, E.; Çakir, Z.; Becher-Hancock, A. Creation and destruction of travertine monumental stone by earthquake faulting at Hierapolis, Turkey. In The Archaeology of Geological Catastrophes Special Publications; McGuire, W., Griffiths, D., Hancock, P., Stewart, I., Eds.; The Geological Society: London, UK, 2000. [Google Scholar]
  58. Scardozzi, G. La faglia sismica di Hierapolis. In Nuovo Atlante di Hierapolis di Frigia. Cartografia Archeologica Della Città e Delle Necropoli (Hierapolis di Frigia VII); Scardozzi, G., Ed.; Ege Yayinlari: Istanbul, Turkey, 2015; pp. 207–211. [Google Scholar]
  59. Marabini, S. La ricerca geo-archeologica a Hierapolis. In Nuovo Atlante di Hierapolis di Frigia. Cartografia Archeologica Della Città e Delle Necropoli (Hierapolis di Frigia VII); Scardozzi, G., Ed.; Ege Yayinlari: Istanbul, Turkey, 2015; pp. 227–268. [Google Scholar]
  60. Semeraro, G. Hierapolis of Phrygia 2017–2019: Recent works and new perspectives. In The Archaeology of Anatolia, Volume IV: Recent Discoveries (2018–2020); Steadman, S.R., McMahon, G., Eds.; Cambridge Scholars Publishing: Newcastle upon Tyne, UK, 2021; pp. 210–228. [Google Scholar]
  61. Semeraro, G. Hierapolis di Frigia. Progetti di restauro e valorizzazione nella storia della Missione Archeologica, fra bilanci e prospettive. In Proceedings of the Atti del XIII Convegno sul Contributo Italiano a scavi, ricerche e studi nelle missioni archeologiche in Turchia, Istanbul, Turkey, 17–18 November 2022; pp. 138–157. [Google Scholar]
  62. Valluzzi, M.R.; Marson, C.; Taffarel, S.; Salvalaggio, M.; Deiana, R.; Boaga, J. Structural Investigations and Modelling of Seismic Behaviour on Ruins in the Monumental Area of Hierapolis of Phrygia. In Structural Analysis of Historical Constructions. An Interdisciplinary Approach; Aguilar, R., Torrealva, D., Moreira, S., Pando, M.A., Ramos, L.F., Eds.; RILEM Bookseries; Springer: Cham, Switzerland, 2019; Volume 18, pp. 1849–1857. [Google Scholar]
  63. Mighetto, P. Terme-Chiesa. In Atlante di Hierapolis di Frigia; D’Andria, F., Scardozzi, G., Spanò, A., Eds.; Ege Yayinlari: Istanbul, Turkey, 2008; p. 73. [Google Scholar]
  64. Mighetto, P.; Galvagno, F. Le Terme-Chiesa e la sfida della conservazione dei segni dell’attività sismica: I primi interventi di messa in sicurezza e di consolidamento del complesso monumentale. In HIERAPOLIS DI FRIGIA V Le Attività Delle Campagne di Scavo e Restauro 2004–2006; D’Andria, F., Caggia, M.P., Ismaelli, T., Eds.; Ege Yayinlari: Istanbul, Turkey, 2012. [Google Scholar]
  65. Mighetto, P. Gli interventi di primo consolidamento e di messa in sicurezza del complesso monumentale delle Terme-Chiesa a Hierapolis di Frigia: La tutela dei segni dell’attività sismica quale tema del progetto di conservazione. In Quale Sicurezza per il Patrimonio Architettonico? Centroni, A., Ed.; Nuova Argos: Rome, Italy, 2007; pp. 788–799. [Google Scholar]
  66. Marson, C. L’ingegneria Strutturale Applicata alla Conservazione di Monumenti Archeologici in Area Sismica. Il Caso Studio Delle Terme-Chiesa di Hierapolis di Frigia. PhD. Thesis, University of Padova, Padua, Italy, 2016. [Google Scholar]
  67. Marson, C.; Valluzzi, M.R.; Lorenzoni, F.; Deiana, R.; Boaga, J.; Modena, C. Indagini sperimentali e valutazioni strutturali per la conservazione delle cd. Terme-Chiesa. In HIERAPOLIS DI FRIGIA XV, 1, Le Attività Delle Campagne di Scavo e Restauro 2012–2015; D’Andria, F., Caggia, M.P., Ismaelli, T., Eds.; Ege Yayinlari: Istanbul, Turkey, 2022; pp. 89–100. [Google Scholar]
  68. Daily, W.; Ramirez, A.; Binley, A.M.; LaBrecque, D. Electrical resistivity tomography. Lead. Edge 2004, 23, 438–442. [Google Scholar] [CrossRef]
  69. LaBrecque, D.J.; Miletto, M.; Daily, W.; Ramirez, A.; Owen, E. The effects of noise on Occam’s inversion of resistivity tomography data. Geophysics 1996, 61, 538–548. [Google Scholar] [CrossRef]
  70. Pola, M.; Gandin, A.; Tuccimei, P.; Soligo, M.; Deiana, R.; Fabbri, P.; Zampieri, D. A multidisciplinary approach to understanding carbonate deposition under tectonically controlled hydrothermal circulation: A case study from a recent travertine mound in the Euganean hydrothermal system, northern Italy. Sedimentology 2013, 61, 172–199. [Google Scholar] [CrossRef]
  71. Torgashov, E.; Anderson, N.; Kovin, O. Fault Detection Using Electrical Resistivity Tomography. In Proceedings of the 23rd EEGS Symposium on the Application of Geophysics to Engineering and Environmental Problems, Keystone, CO, USA, 11–15 April 2010. [Google Scholar] [CrossRef]
  72. Alp, H.; Tezel, O.; Avcı, K.; Vardar, D.; Alp, Y.İ. Detecting Active Faults Using Electrical Resistivity Tomography: A Case Study in Istanbul, Türkiye. Dokl. Earth Sci. 2024, 519, 2257–2270. [Google Scholar] [CrossRef]
  73. Palmer, D. Refraction Seismics: The Lateral Resolution of Structure and Seismic Velocity; Geophysical Press: London, UK, 1986. [Google Scholar]
  74. Bauer, K.; Moeck, I.; Norden, B.; Schulze, A.; Weber, M.; Wirth, H. Tomographic P wave velocity and vertical velocity gradient structure across the geothermal site Groß Schonebeck (NE German Basin): Relationship to lithology, salt tectonics, and thermal regime. J. Geophys. Res. Solid Earth 2010, 115, B08312. [Google Scholar] [CrossRef]
  75. White, D.J. Two-dimensional seismic refraction tomography. Geophys. J. 1989, 97, 223–245. [Google Scholar] [CrossRef]
  76. Moser, T.J. Shortest path calculation of seismic rays. Geophysics 1991, 56, 59–67. [Google Scholar] [CrossRef]
  77. Moser, T.J.; Nolet, G.; Snieder, R. Ray bending revisited. Bull. Seismol. Soc. Am. 1992, 82, 259–288. [Google Scholar]
  78. Woodward, M.J. Wave-equation tomography. Geophysics 1992, 57, 15–26. [Google Scholar] [CrossRef]
  79. Lehmann, B. Seismic Traveltime Tomography for Engineering and Exploration Applications; European Association of Geoscientists & Engineers: Utrecht, The Netherlands, 2007. [Google Scholar] [CrossRef]
  80. Negri, S.; Leucci, G. Geophysical investigation of the Temple of Apollo (Hierapolis, Turkey). J. Archaeol. Sci. 2006, 33, 1505–1513. [Google Scholar] [CrossRef]
  81. Leucci, G.; Ismaelli, T.; Scardozzi, G. Integration of archaeological and geophysical Surveys in Hierapolis of Phrygia (Turkey). In Proceedings of the IMEKO TC4 International Conference on Metrology for Archaeology and Cultural Heritage, Consenca, Italy, 19–21 October 2022; pp. 329–333. [Google Scholar] [CrossRef]
  82. Kovachev, S.A.; Libina, N.V. Assessment of Initial Seismicity for Offshore Platforms: A Case Study of the Pechora Sea. Oceanology 2024, 64, 139–148. [Google Scholar] [CrossRef]
Figure 1. Geographical localization of Hierapolis (red dot in small figure) and of Basilica Bath in the archaeological site.
Applsci 16 02795 g001
Figure 2. Identification of the known main fault system in Hierapolis (a) ([45] modified by authors) and the supposed main fault direction outside the Basilica Bath (b).
Applsci 16 02795 g002
Figure 3. Evolution of the Basilica Bath ([64] modified by authors).
Applsci 16 02795 g003
Figure 5. Localization of ERT lines ([41] modified by authors).
Applsci 16 02795 g005
Figure 6. Result and localization of H1 ERT line, with main anomalies (stars) and crossing point with H2 line.
Applsci 16 02795 g006
Figure 7. Result and localization of H2 ERT line with main anomalies (stars) and crossing point with H1 line.
Applsci 16 02795 g007
Figure 8. Result and position of H3 ERT line, with main anomalies (stars).
Applsci 16 02795 g008
Figure 9. Result and localization of H4 ERT line, with main anomalies (stars) and crossing point with H5 line.
Applsci 16 02795 g009
Figure 10. Result and localization of H5 ERT line, with main anomalies (stars) and crossing point with H4 line.
Applsci 16 02795 g010
Figure 11. (a) Raw seismograms collected from the left and right side of the seismic line at the Basilica Bath complex; (b) normalized seismograms showing the anomalous zone (vertical blue band) induced by the presence of the buried fault.
Applsci 16 02795 g011
Figure 12. P-wave tomographic inversion section at the Basilica Bath complex in Hierapolis. The buried fault zone in the middle of the section has been highlighted by the dashed black line rectangle.
Applsci 16 02795 g012
Figure 13. Comparison between SRT and ERT results along the H2 line, the yellow star indicates the position of the fault.
Applsci 16 02795 g013
Disclaimer/Publisher’s Note: The statements, opinions and data contained in all publications are solely those of the individual author(s) and contributor(s) and not of MDPI and/or the editor(s). MDPI and/or the editor(s) disclaim responsibility for any injury to people or property resulting from any ideas, methods, instructions or products referred to in the content.