Article

Feasibility Study of Plate Inhomogeneities Estimation Using Lamb Wave A0 Mode Signals Time-of-Flight


Ultrasound Research Institute, Kaunas University of Technology, LT-51423 Kaunas, Lithuania
Appl. Sci. 2026, 16(5), 2623; https://doi.org/10.3390/app16052623
Submission received: 2 February 2026 / Revised: 26 February 2026 / Accepted: 3 March 2026 / Published: 9 March 2026
(This article belongs to the Special Issue Advances in and Research on Ultrasonic Non-Destructive Testing)

Abstract

Structural health monitoring (SHM) technology enables the monitoring and assessment of the condition of various materials and structures. Lamb-guided waves (LW) are widely used to detect damage in large-scale plate structures. One of the parameters used for these purposes is the time-of-flight (ToF) of ultrasonic LW signals. In the presented feasibility study, the ToF was determined based on the idea that the zero-crossings of this signal, filtered by several filters, are concentrated around the maximum of the signal envelope. This ToF detection method, unlike threshold- and peak-based methods, avoids uncertainties in signal and noise levels and does not require a signal detection threshold. Compared to the correlation method, no reference signal is required. It has been established that the curves of signal propagation times with varying distance depend on the group and phase velocities of signal propagation and have phase jumps. The proposed methodology for assessing plate inhomogeneities involves comparing signal propagation time curves with and without damage. This methodology has been verified both through theoretical modeling and experimental research. The experimental studies used a 6 mm thick steel specimen with artificial defects of various diameters (10–35 mm). The A0 mode of Lamb waves with a central frequency of 150 kHz was excited in the steel plate. For experimentally obtained B-scans, the ToF distributions of signals along the scan trajectories were calculated. By comparing the defective and defect-free ToF curves, critical points of the experimental curves were determined, which were used to estimate the dimensions of the defects. Both in the case of theoretical modeling and in the result of experimental measurements, it was determined that the proposed methodology can be used to determine the inhomogeneities of plates.

1. Introduction

During the production and operation of various materials and structures, it is important to monitor their condition and assess their homogeneity. Such tasks are addressed by structural health monitoring technology [1]. Advanced ultrasound technology is currently becoming one of the most widely used methods for monitoring structural health [2,3,4]. One of the used methods for monitoring structural health is the use of Lamb-guided waves for rapid damage detection in large-scale structures [5,6,7,8]. The advantages of these waves—long-range propagation with low attenuation—are increasingly being applied to studies of inhomogeneities in plate materials. To achieve these goals, new measurement systems and advanced signal processing technologies are being developed. Various imaging methods are used to extract useful information from Lamb wave signals and to assess the features of damaged regions, such as location, shape and size [9].
Extracting useful information from complex nonlinear ultrasonic signals is supported by advanced signal processing methods. Several main methods can be distinguished: time-domain, frequency-domain, time–frequency-domain and wavenumber-domain methods [8]. The listed digital signal processing methods are used in combination with different guided wave recording methods [10]. This can be linear scanning [11,12,13], spatial scanning [14,15,16,17,18], recording of signals reflected from defects [19,20], ultrasonic tomography [21,22], etc.
Many damage detection and localization methods are based on Lamb wave time-of-flight (ToF) measurements. Scientists proposed a variety of methods for determining the propagation times of Lamb wave signals. The simplest method is to determine the signal propagation time to the point where a predetermined fixed signal amplitude value (threshold) was exceeded [23]. However, its reliability was affected by acoustic noise or other phenomena. A popular ToF extraction method uses the Hilbert Transform (HT) with additional signal processing methods [24]. The use of the HT envelope method was problematic for the ToF analysis of strongly dispersive Lamb modes (e.g., A0). In the case of multimodal and dispersive Lamb waves, the cross-correlation method become widespread for time-of-flight estimation [25]. However, the correlation method is only effective in simulations, but was quite inefficient in processing experimental signals.
The simplest ToF detection methods are currently being modernized and new signal processing methods are being developed. In [26], a Lamb wave-based damage detection algorithm is proposed, using the matching pursuit decomposition (MPD) and statistical methods to locate and quantify damage. The MPD algorithm is used to extract the accurate ToF. The algorithm is tested by conducting damage studies of holes in composite panels of various locations and sizes.
In [27], a fast semi-analytic algorithm is presented based on the relationship between multimodal ToF differences and damage parameters. The movement of the transmitter and receiver pair is used to scan the entire detection area, and damage is detected at the intersection of the paths. However, the accuracy of damage identification is not high because only transmitted wave fields are used.
The sideband peak counting (SPC) method is also used to detect defects in plate structures [28]. This algorithm requires only a limited number of sensor responses, which simplifies the detection process. The technology used is called acoustic source localization (ASL), which uses time-of-arrival (ToA) or time-difference-of-arrival (TDoA) information from signals recorded by pre-installed sensors. However, for the effective application of the proposed method in practical measurements, it is necessary to create experimental setups that simulate real conditions.
The presented article [29] focuses on impact damage detection using ToF as a sensitive parameter for this type of damage. Relative propagation time delays are used to determine damages, and correlation coefficients for damage indices used in the RAPID (Reconstruction Algorithm for Probabilistic Inspection of Damage) visualization algorithm are used to localize them. The method is implemented into LaWaI GUI (Lamb Waves Inspection Graphical User Interface) to automate the processing.
After evaluating the methods for processing Lamb wave signals and detecting defects, another important question remains—the appropriate choice of Lamb wave mode. Since ultrasonic methods can usually detect damage larger than half a wavelength, the fundamental antisymmetric mode (A0) is usually chosen. A six-step damage size characterization algorithm using the A0 mode of Lamb waves and time-of-flight information of signal propagation is described in [30]. A0 mode signals are generated and recorded by a network of transducers with pulse-echo and pitch-catch configurations. Satisfactory experimental results enable this method to be used for corrosion studies of aluminum plates.
The A0 mode of Lamb waves is used in a damage detection method [16] that relies on the overlap of the incident and reflected waves in the near field of a defect. The defect image is reconstructed using a matrix composed of pairs of shear strains calculated at a surface point from time series signals. A Lamb wave with a center frequency of 30 kHz and an A0 mode is used to detect the defects.
A previously published article [31] proposed a method for determining the time-of-flight (ToF) of signals, based on using the concentrated zero-crossing times of filtered signals to calculate this parameter. Compared to other methods, the effectiveness and advantages of the proposed method were highlighted. Unlike threshold- and peak-based methods, uncertainties due to the signal-to-noise level are avoided and a signal detection threshold is not required. Compared to the correlation method, no reference signal is required.
The aim of this article is to use a newly developed signal ToF method to assess the inhomogeneity of plate structures. Lamb wave A0 mode signals were used to assess the inhomogeneity of the plates. The rest of the article is divided as follows. Section 2 describes the methodology for estimating inhomogeneities using signal time-of-flight. Experimental studies of the influence of inhomogeneities on the distribution of ToF are described in Section 3. Section 4 discusses the possibilities, advantages, disadvantages, and prospects for further research of assessing the inhomogeneity of plates using Lamb wave A0 mode signals.

2. Methodology for Estimating Inhomogeneities Using Signal Time-of-Flight

2.1. Signal Time-of-Flight Estimation Procedure

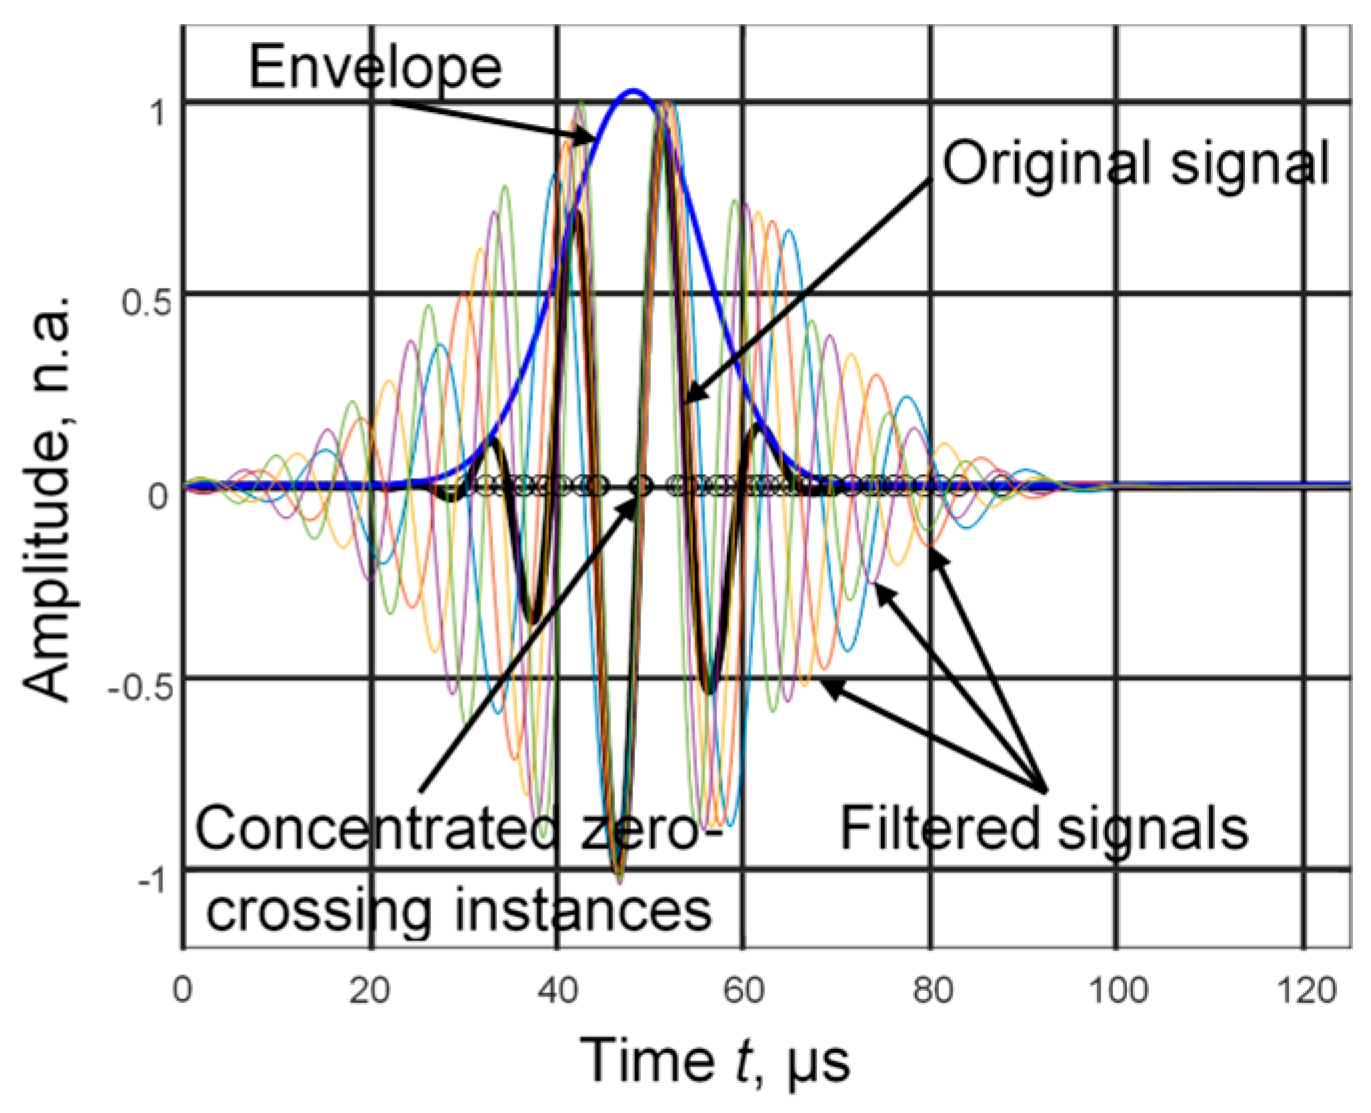
Ultrasonic systems based on various digital signal processing methodologies have become widespread in various fields of measurement and diagnostics. The algorithm for the digital processing of ultrasonic signals for determining their propagation times, discussed in previous works [31,32], provided the prerequisites for using this method for studies of inhomogeneities in plate materials. The signal propagation time (time-of-flight) in this algorithm was determined using the idea that the zero-crossing instances of this signal filtered by several filters are concentrated around the maximum of the signal envelope (Figure 1).
First, the signal under study was filtered by N number of filters [31]. After that, K zero-crossing instances were determined in each filtered signal. The concentration of these zero-crossing instances was determined on the time axis according to the minimum time difference between adjacent zero-crossings [32]:
t i M 0 = a r g m i n i = 1 N 1 min 1 < k < K t i k 0 t ( i + 1 ) k 0 ,
where i = 1,2, …, N is the number of filter, t i k 0 is the zero-crossing instances of i-th filter, k = 1,2, …, K, t i M 0 is concentrated zero-crossing instances, and M is the number of zero-crossing instances in the i-th filter.
The propagation time of the analyzed signal (ToF) was determined by calculating the average of the concentrated zero-crossing times:
t f = 1 N i = 1 N t i M 0 .

2.2. The Variation in the Signal Propagation Time with Distance

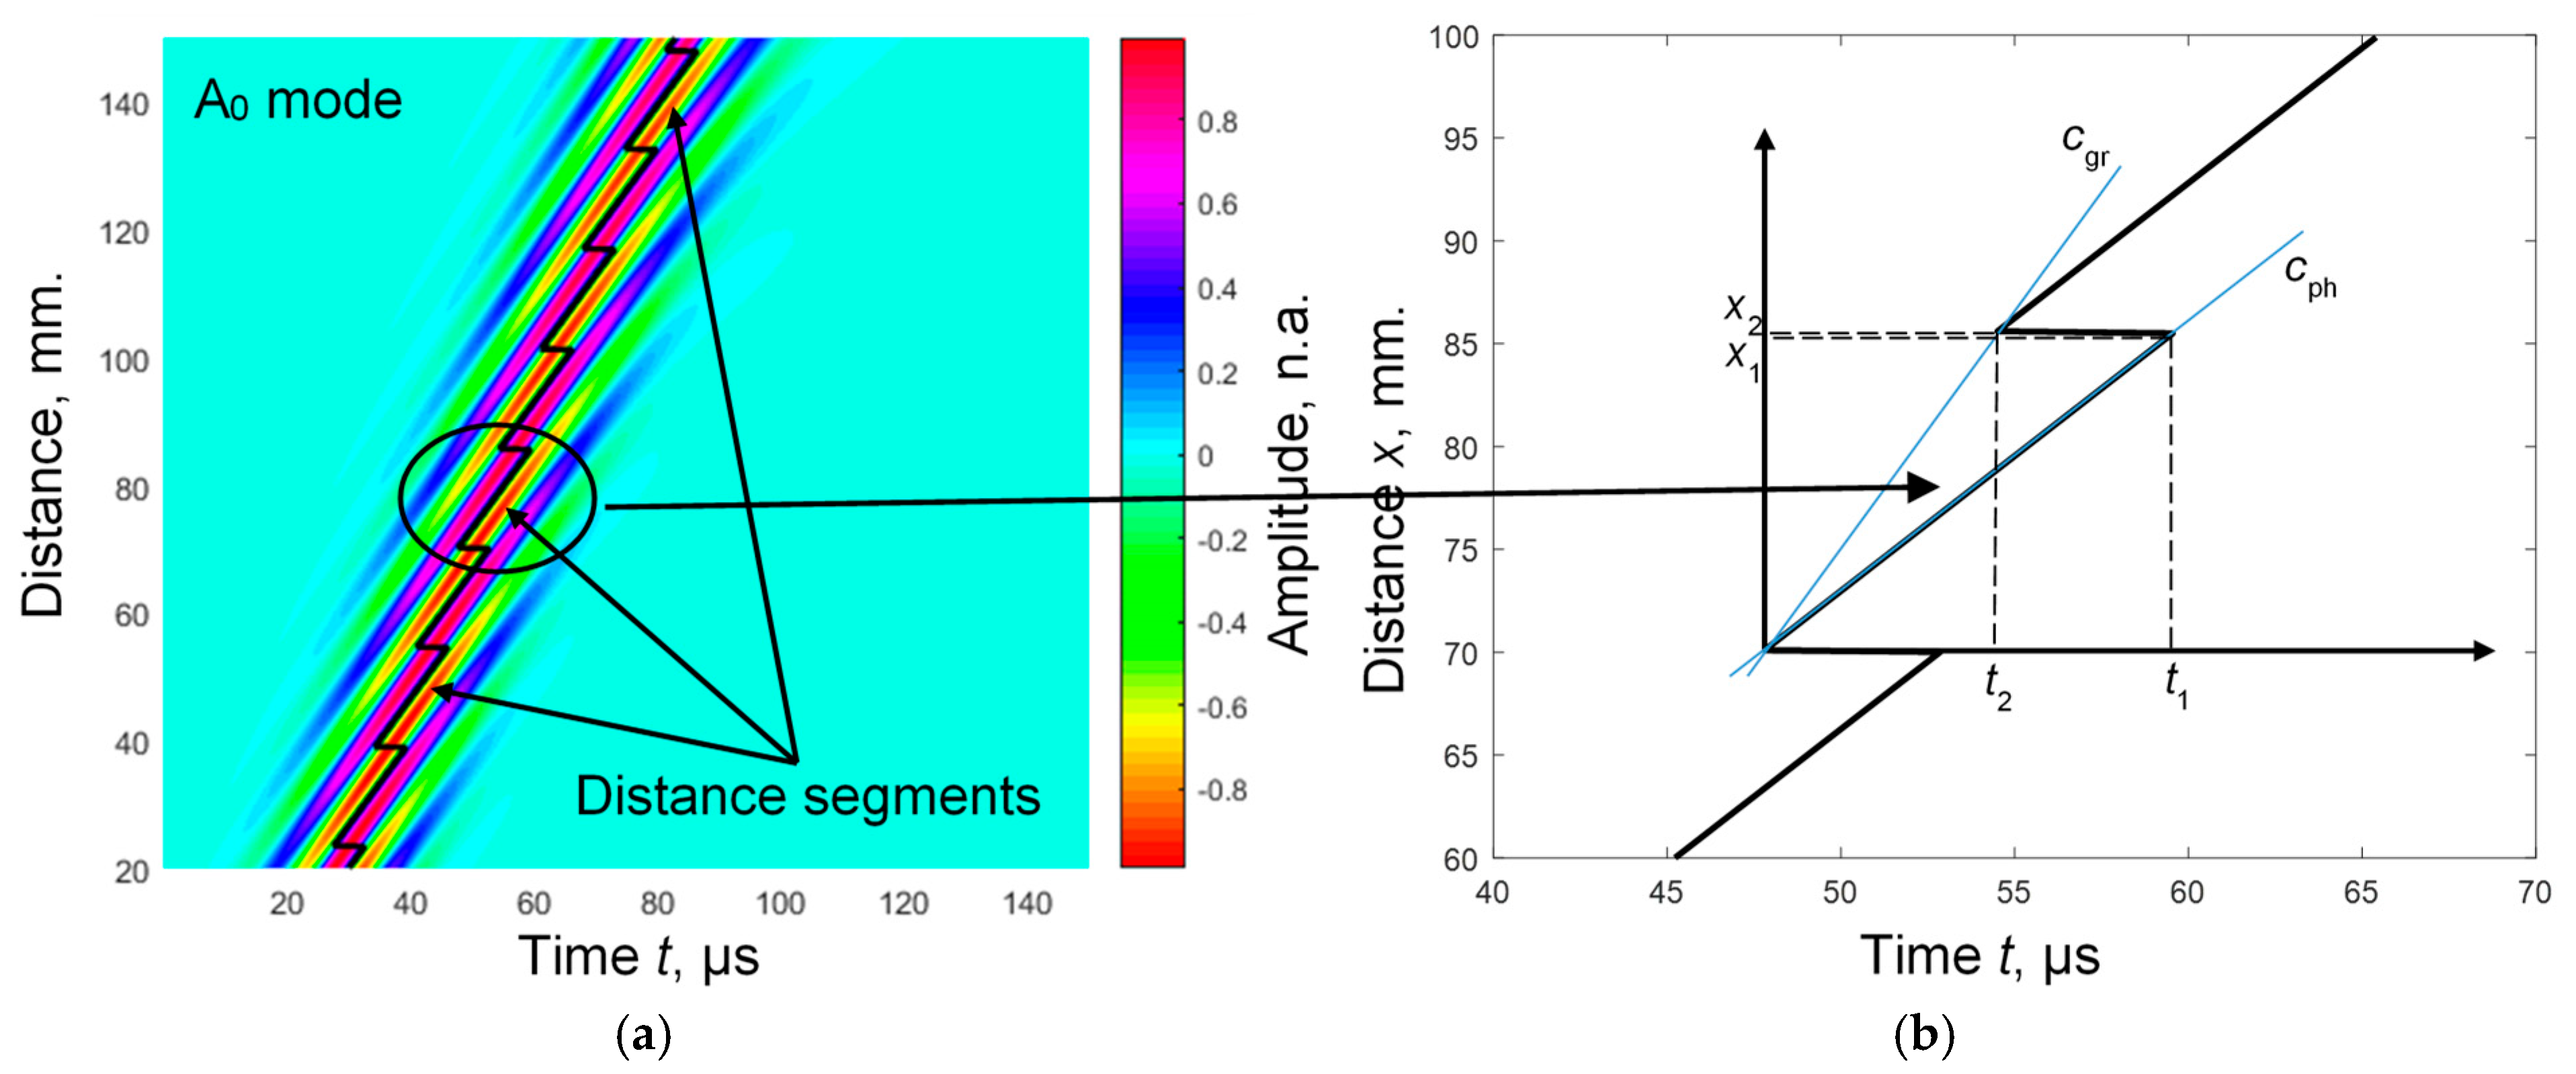
The signal propagation time determined by Equation (2) was not constant as the distance between the sending and receiving ultrasonic transducers changes. The nature of its variation also depends on the signal parameters. If the signal shape does not change with distance, then the propagation time changes linearly. Meanwhile, if the signal propagates with dispersion, the variation in its propagation time takes on a more complex dependence. We will examine this dependence using a theoretically simulated B-scan of the propagation of the Lamb wave A0 mode in an aluminum plate (Figure 2a). B-scan simulation was performed for a 2 mm thick 7075_T6 aluminum plate, when the transmitting signal was a three-period Gaussian shape and a center frequency of 100 kHz. The propagating signals were calculated at a distance of 20–150 mm, with a calculation step of 0.1 mm.
As can be seen from the obtained simulation results, there are sharp jumps in the propagation time lines at certain distances. These jumps repeat the already observed jumps of zero-crossings of individual periods of signals, described in [33].
Let us examine one of the isolated distance segments (Figure 2a) between two jumps (Figure 2b). For a more detailed analysis, we will use a new coordinate system, the beginning of which was the end of one jump. As was analyzed in [32], the dependence of the propagation time on the distance in the range between two jumps was linear and corresponded to the phase velocity of the signal propagation (Figure 2b, line cph). Meanwhile, the tangent of the jump curve describes the group velocity of signal propagation (Figure 2b, line cgr). In the chosen coordinate system, these dependencies can be written as
c g r = x 2 t 2 ,   c p h = x 1 t 1 .
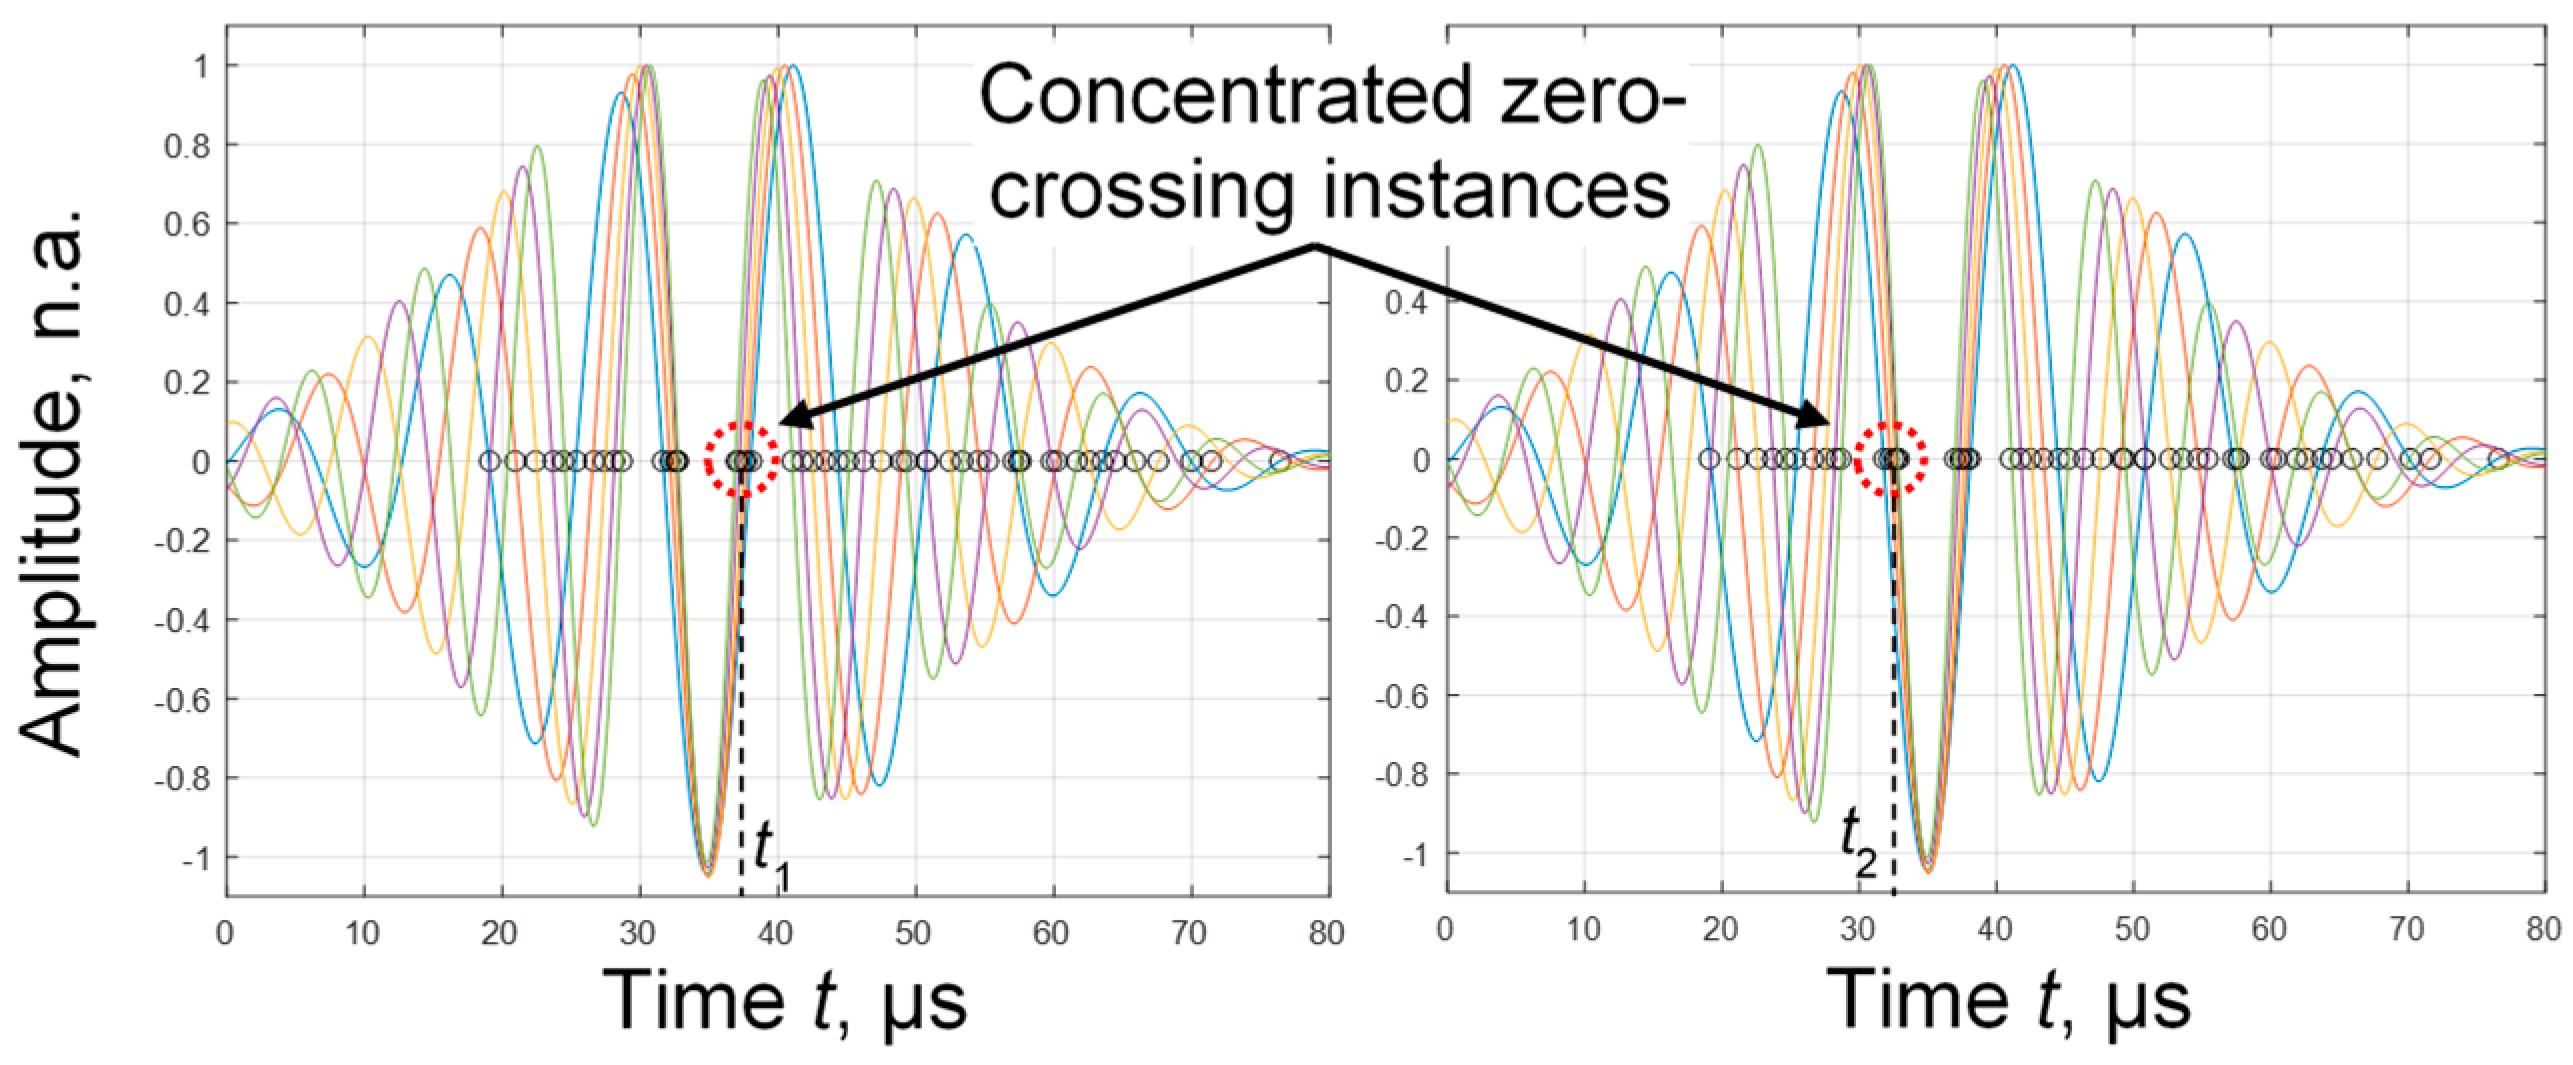
After analyzing the behavior of concentrated zero-crossing instances in a jump environment, it was found that these instances jump within one half-period of the signal (Figure 3):
t 1 t 2 = T 2 .
Combining Equations (3) and (4), we get
t 1 t 2 = x 1 c p h x 2 c g r = x 1 c g r x 2 c p h c p h c g r = T 2 = 1 2 f t r ,
where ftr is the center frequency of the transmitting signal.
Since we can assume x 1 x 2 at the jump location, the total jump length x can be calculated as
x x 2 c p h c g r 2 f t r c g r c p h .
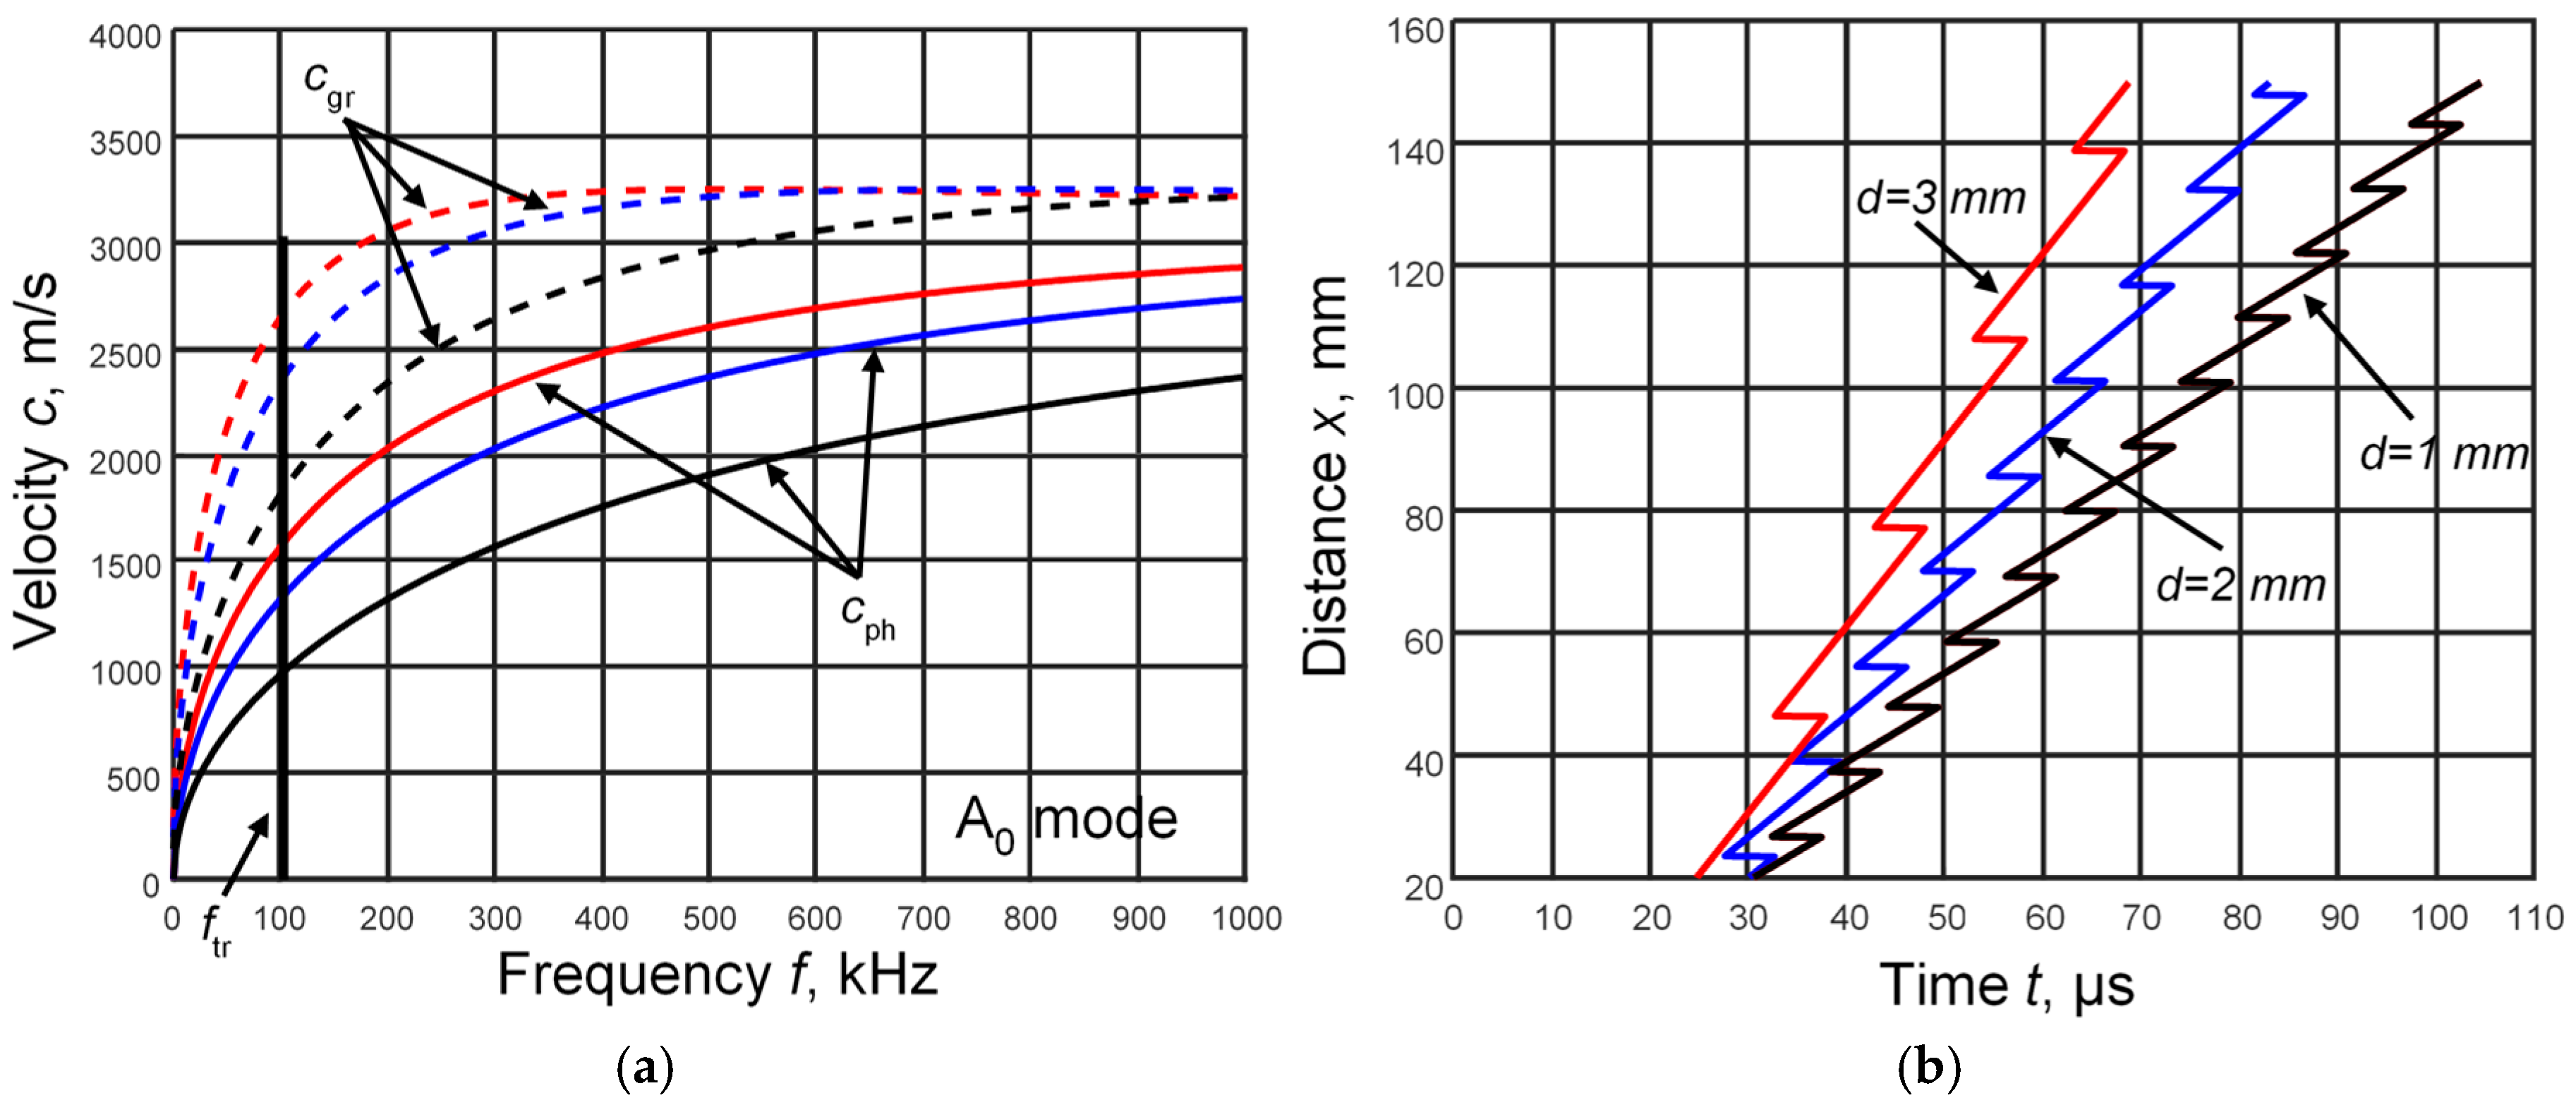
The given Equation (6) describes the variation in signal propagation time jumps over distance, depending on the group cgr and phase cph velocities of the signal propagation. To confirm these conclusions, we performed simulations of the A0 mode of Lamb waves in aluminum plates of different thicknesses with the wave excitation parameters presented above. The dispersion curves of these waves for 1, 2 and 3 mm thick aluminum plates calculated using the one-dimensional SAFE method are presented in Figure 4a. The distribution graphs of the calculated time-of-flight (ToF) values in the plates of the corresponding thickness are presented in Figure 4b. As we can see from Figure 4a, at the same transmitted signal frequency (in our case ftr = 100 kHz), the values of group and phase velocities differ significantly for different plate thicknesses. Therefore, the ToF graph shows different distances between phase jumps, described by Equation (6).
Ideally, these jumps should be distributed over equal distances and have equal group and phase velocities. Any deviation from the ideal signal time-of-flight distribution can be treated as inhomogeneities in the plate material. We will analyze the influence of inhomogeneities on the signal propagation time distribution in the following subsection.

2.3. The Influence of Inhomogeneities on the Signal Propagation Time

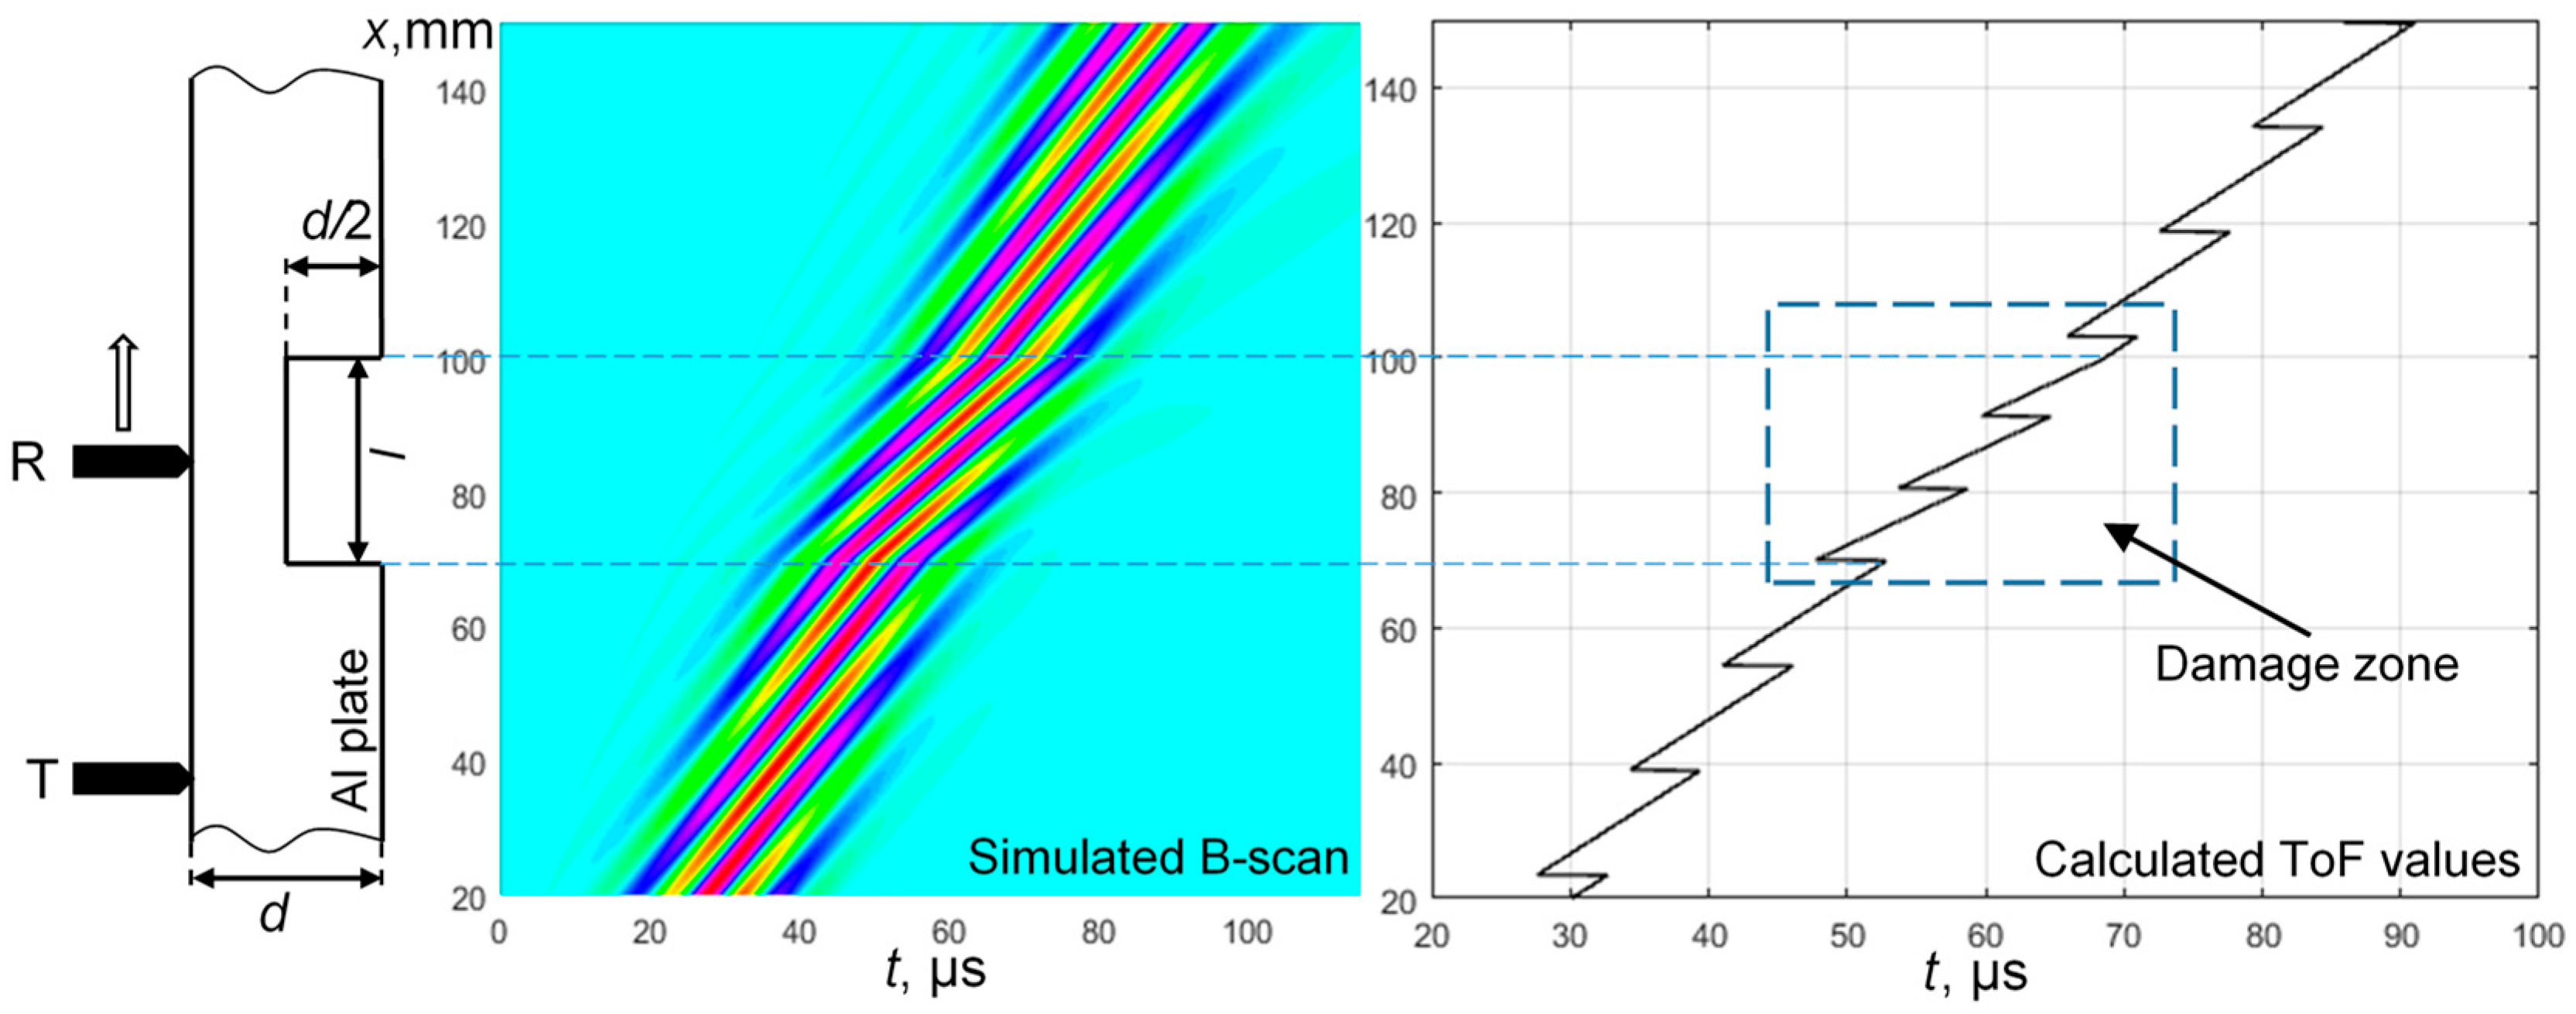
Theoretical modeling was performed to determine the changes in signal time-of-flight distribution due to inhomogeneities in the tested aluminum 7075-T6 plate with thickness d = 2 mm. A damage was modeled in the middle of this plate, which reduces the thickness of the plate by half (Figure 5). The width of this damage was l = 30 mm. By selecting a transmitter (T) and a receiver (R) for generating and receiving Lamb waves, a B-scan was formed along the surface of the plate moving linearly. The center frequency of the signal used was the same as described above (ftr = 100 kHz). As we can see in Figure 5, the B-scan shows a change in the signal propagation configuration at the damage location, with changes in group cgr and phase cph velocities. This was clearly due to the change in plate thickness. The distribution of calculated signal ToF along the scan trajectory was also shown next to the simulated B-scan. At first glance, the visible changes in signal ToF are difficult to notice.
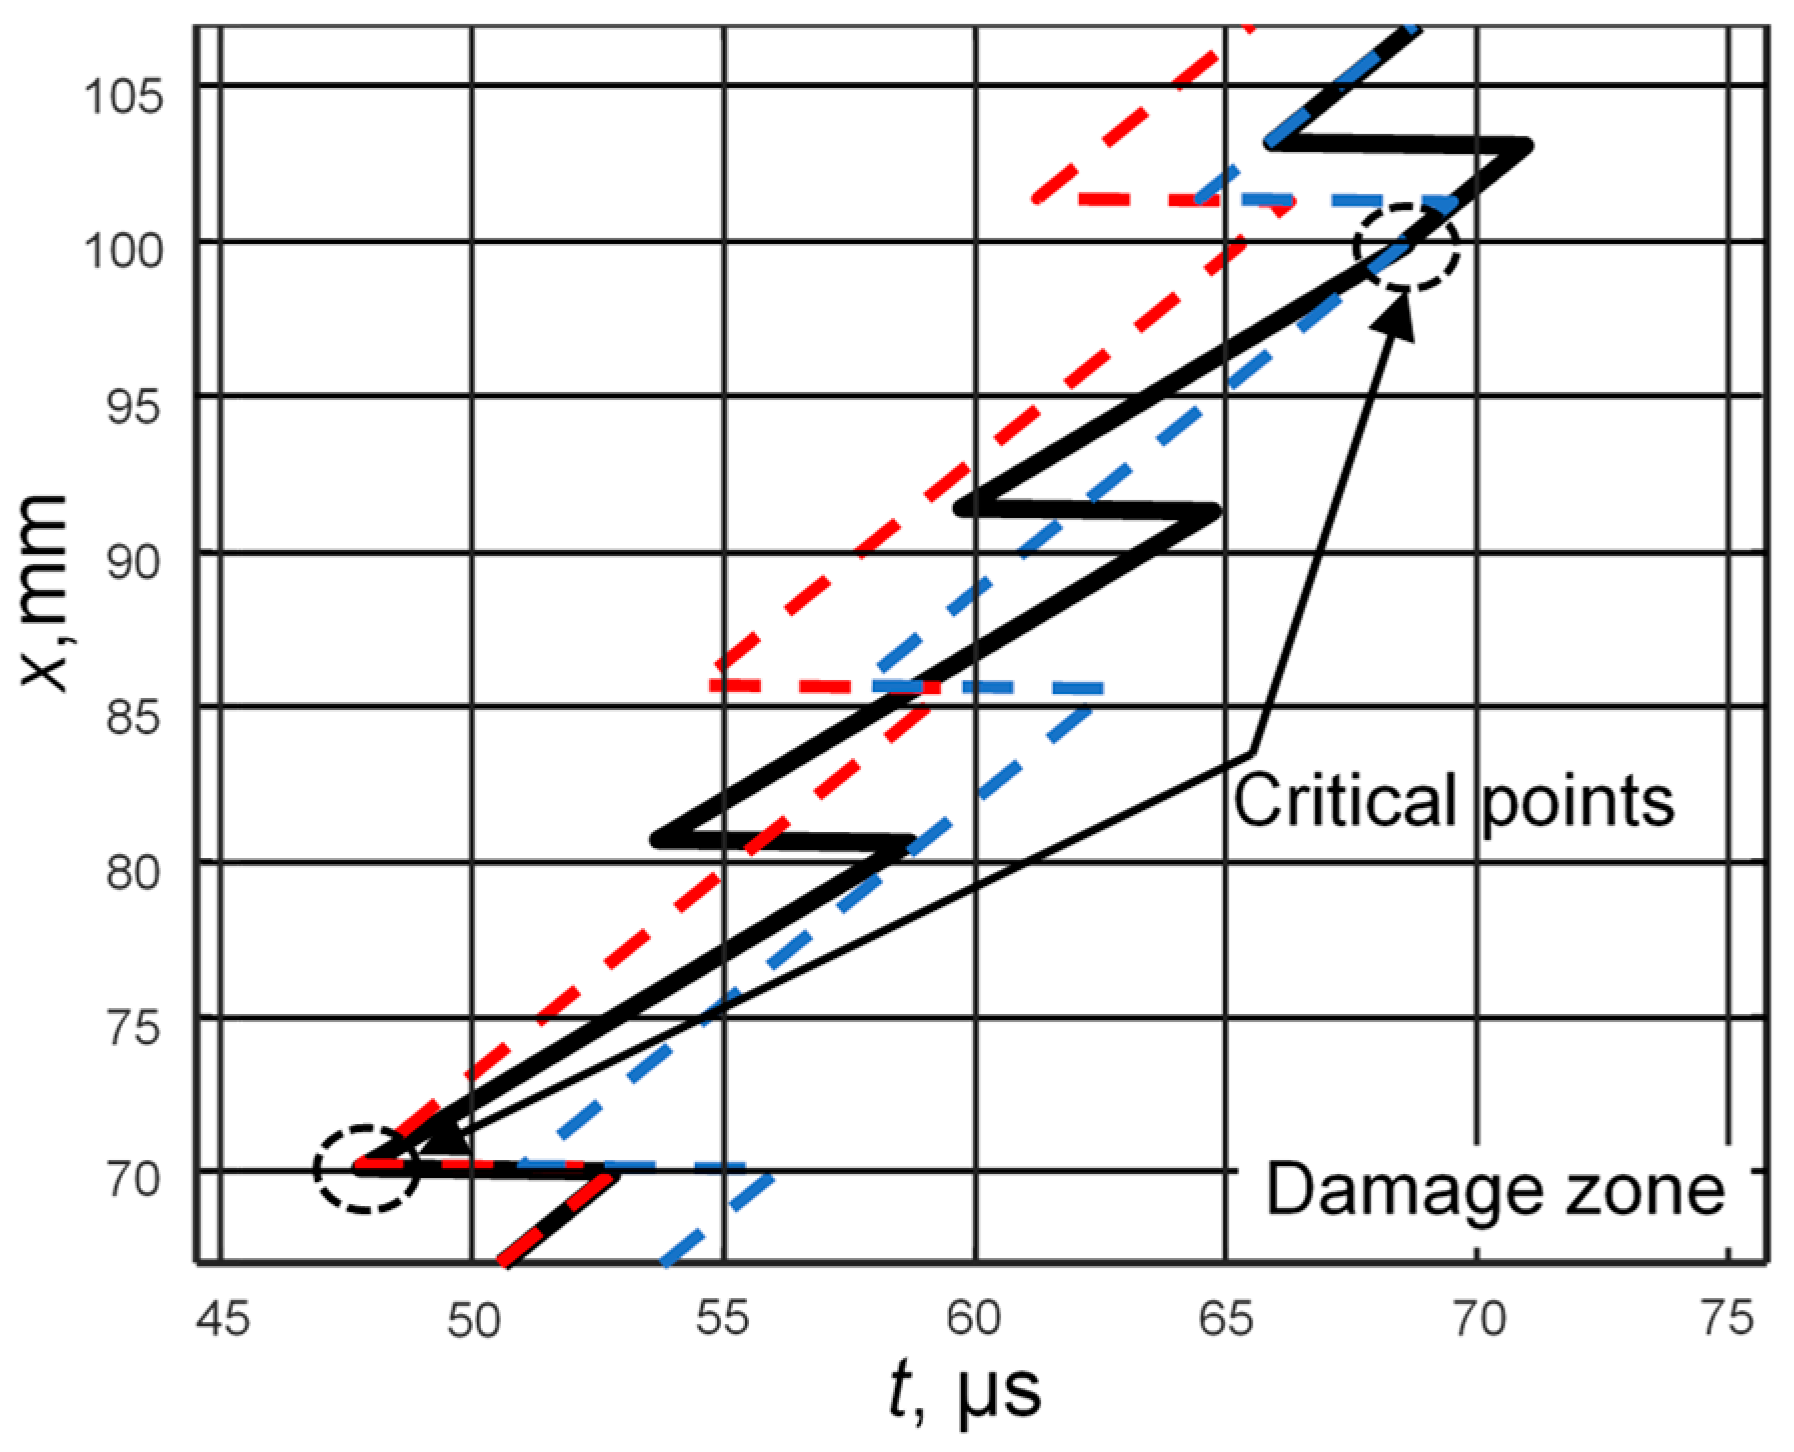
Therefore, we have isolated the damage environment zone in a separate Figure 6. In this figure, the signal propagation time curves for the undamaged plate (red and blue dashed lines) are also shown next to the signal propagation time curves for the damaged plate (black line).
The assessment of inhomogeneities in a plate comes down to comparing the signal propagation time curves with and without damage. In Figure 6, the ToF curves of the undamaged plate are shown by the red and blue dotted lines. Both of these curves are shifted differently on the time axis so that one curve coincides with the damage curve at its beginning, and the other at its end. Since the phase velocity of signal propagation in the damage zone changes, the angle of inclination of the ToF curve also changes. Therefore, in a plate without damage and with damage, the signal propagation curves diverge at the ends of the damage (critical points, Figure 6). In the case under consideration, these critical points are 70 and 100 mm apart, which corresponds to the size of the modeled damage (Figure 5).
As we can see from the theoretical modeling results, knowing the time-of-flight curves of Lamb wave A0 mode signals in plates without damage, it is possible to identify certain damages in it by comparing the curves. To confirm this assumption, the experimental studies described below were performed.

3. Experimental Studies of the Influence of Inhomogeneities on the Distribution of ToF

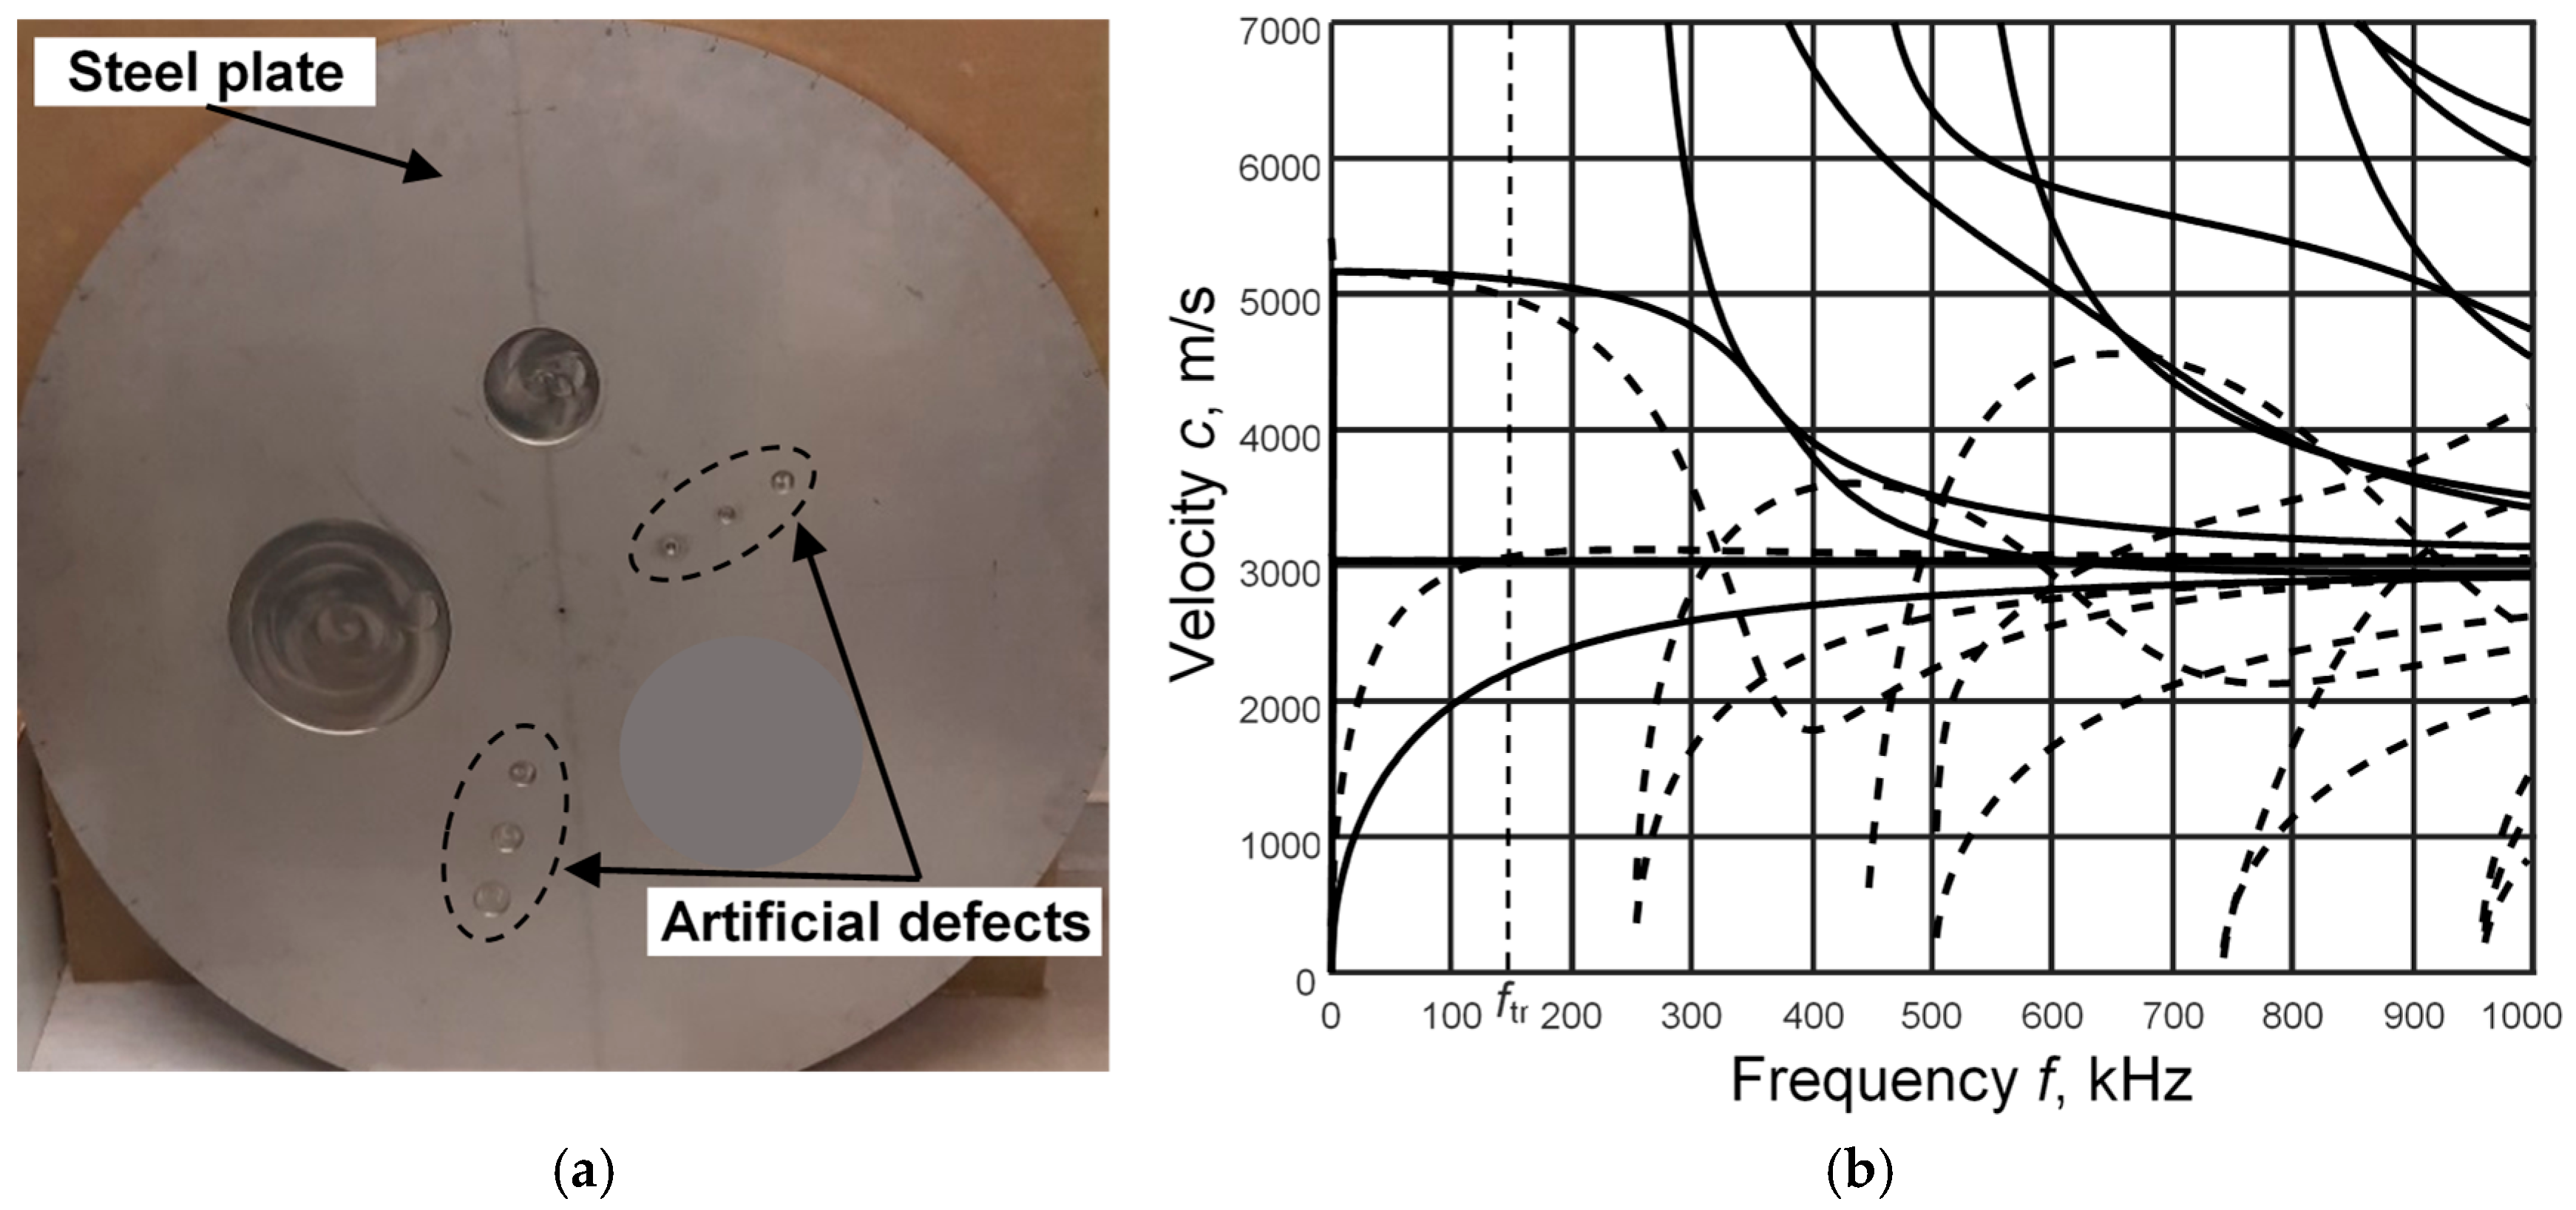
We also verified the influence of inhomogeneities on the time-of-flight distribution of Lamb wave signals by performing experimental measurements. For these studies, we selected a 6 mm thick steel specimen with various types of artificial defects already formed (Figure 7a). The marked artificial defects with diameters of 10, 15, 20, 25, 30 and 35 mm were used for the studies. These are round milled recesses up to the middle of the steel plate. Each defect under study was scanned separately, perpendicular to the line of location of these defects.
Based on the known elastic constants of the steel plate (Young’s modulus E = 193 GPa, Poisson’s ratio ν = 0.31, density ρ = 8000 kg/m3), the dispersion curves of Lamb wave propagation in this plate were calculated using the one-dimensional SAFE method. These curves are presented in Figure 7b. Taking into account the nature of the A0 mode curve of Lamb waves and searching for similarities with the nature of the dispersion curve of the A0 mode propagation in an aluminum plate (Figure 4a), the excitation frequency of the transmitting transducer ftr = 150 kHz was selected. The excitation signal was a two-period harmonic signal with a Gaussian envelope and 200 V amplitude.
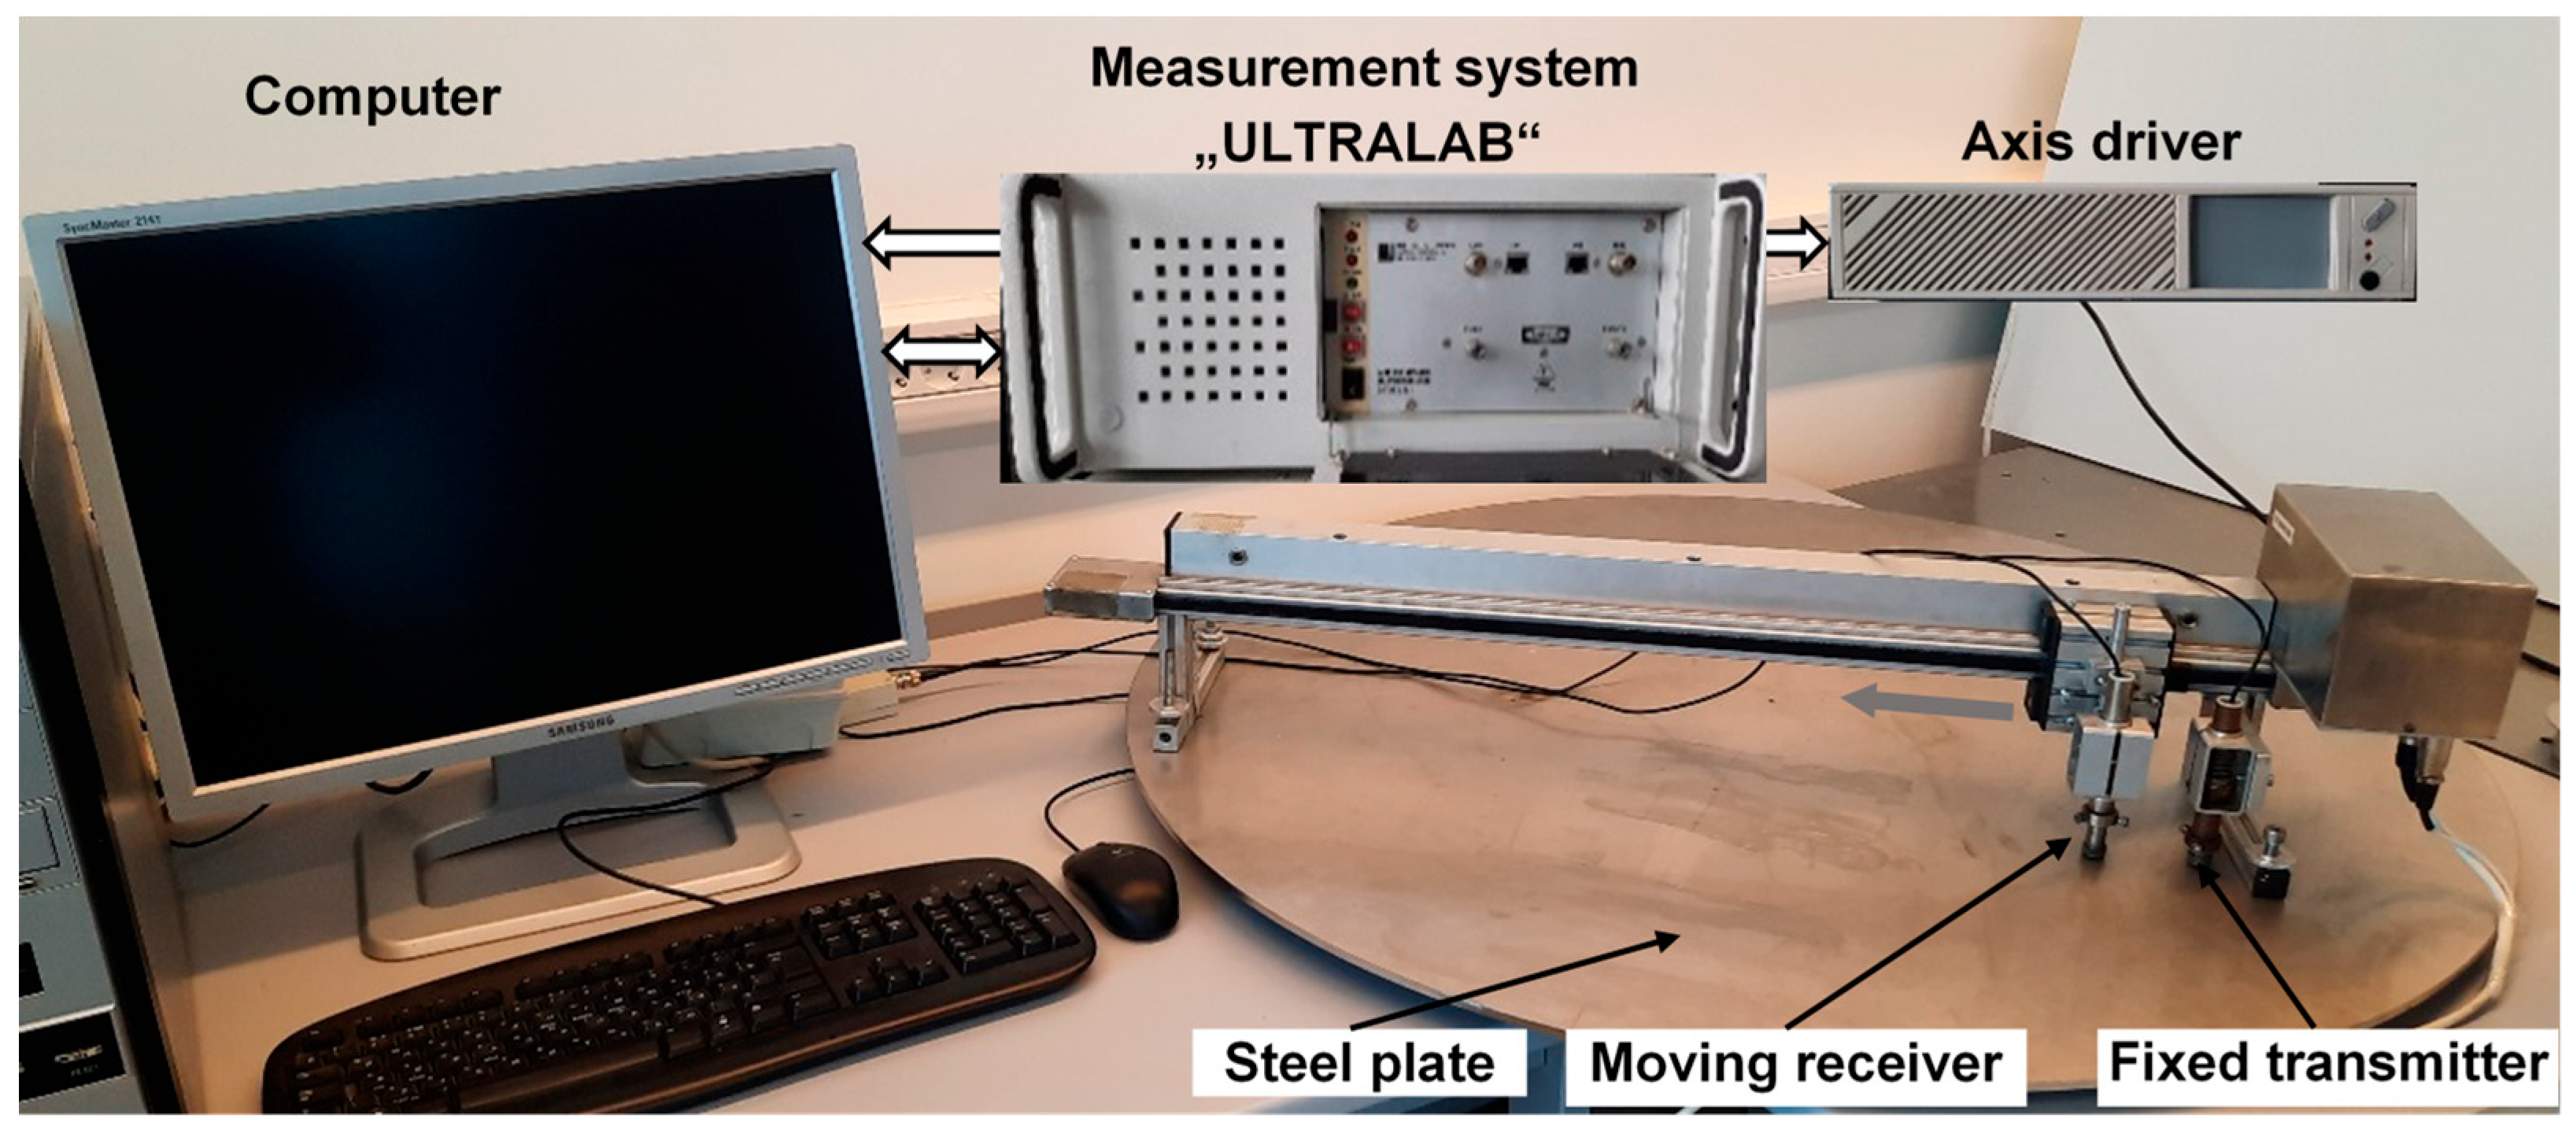
The structural diagram of the excitation and reception of Lamb wave A0 mode signals in a steel plate was presented in Figure 8. Most of the measurement equipment (receiver, transmitter, measurement system “ULTRALAB”, axis driver) was developed at the Ultrasound Research Institute of Kaunas University of Technology. The receiver position was changed using a “Standa 8MTF-75LS05” scanner (Standa Ltd., Vilnius, Lithuania). The receiver was moved at a distance of 60–130 mm with a step of 0.1 mm.
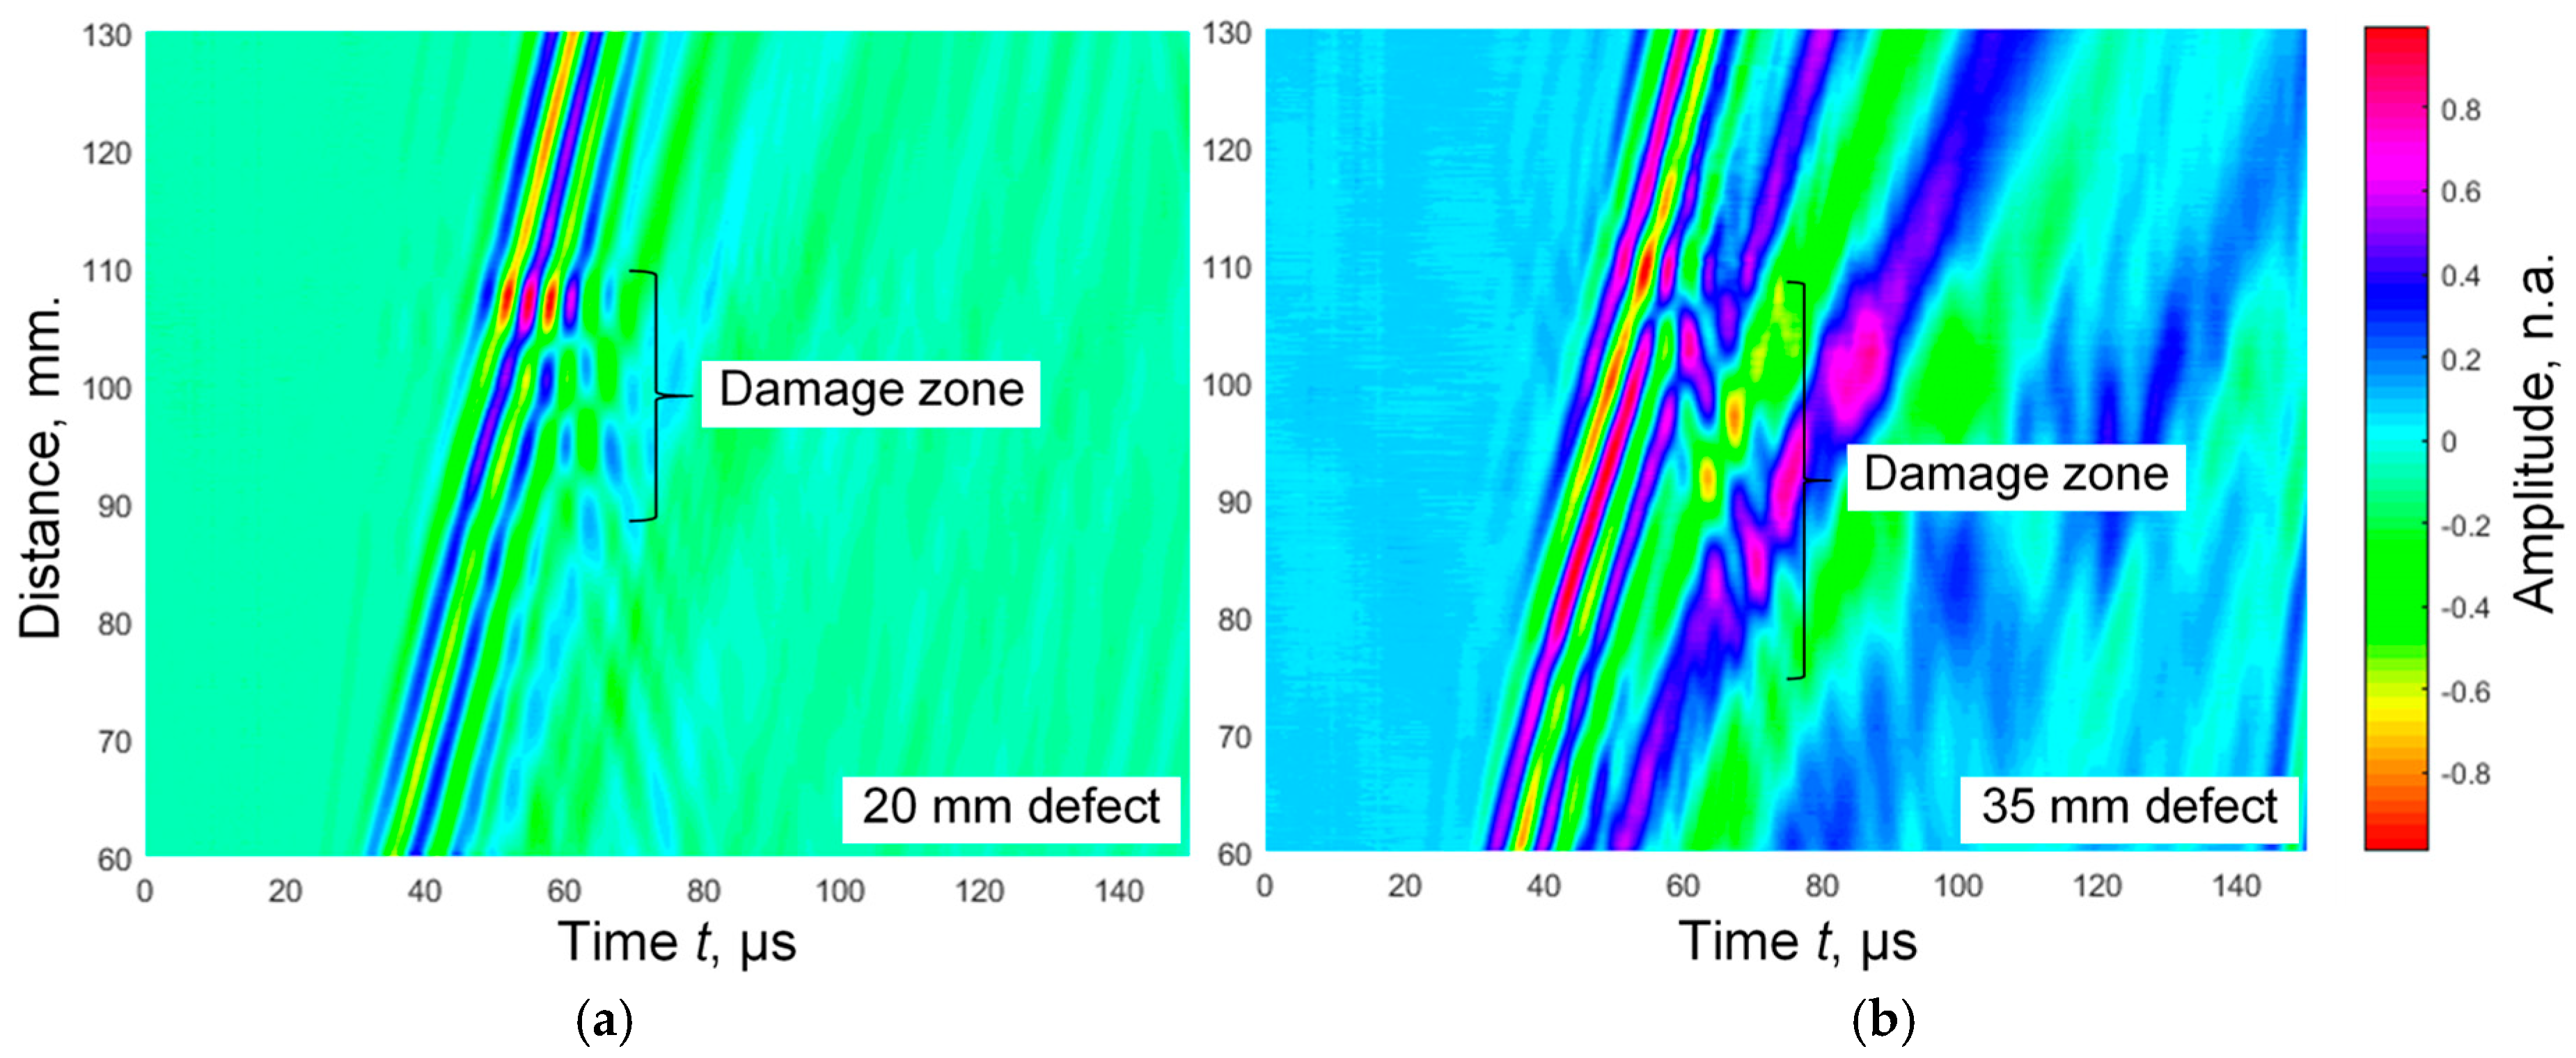
Examples of experimental B-scans obtained with two contact transducers for different defects (20 and 35 mm diameters) are presented in Figure 9a,b. During experimental measurements, a B-scan was also obtained at a location on the plate where there were no defects. This B-scan was not displayed, but was used to calculate the reference ToF curve.
During experimental studies, it was determined that the equipment used was unable to clearly identify a defect with a diameter of 10 mm. Meanwhile, B-scans of larger diameter defects were analyzed in further studies.
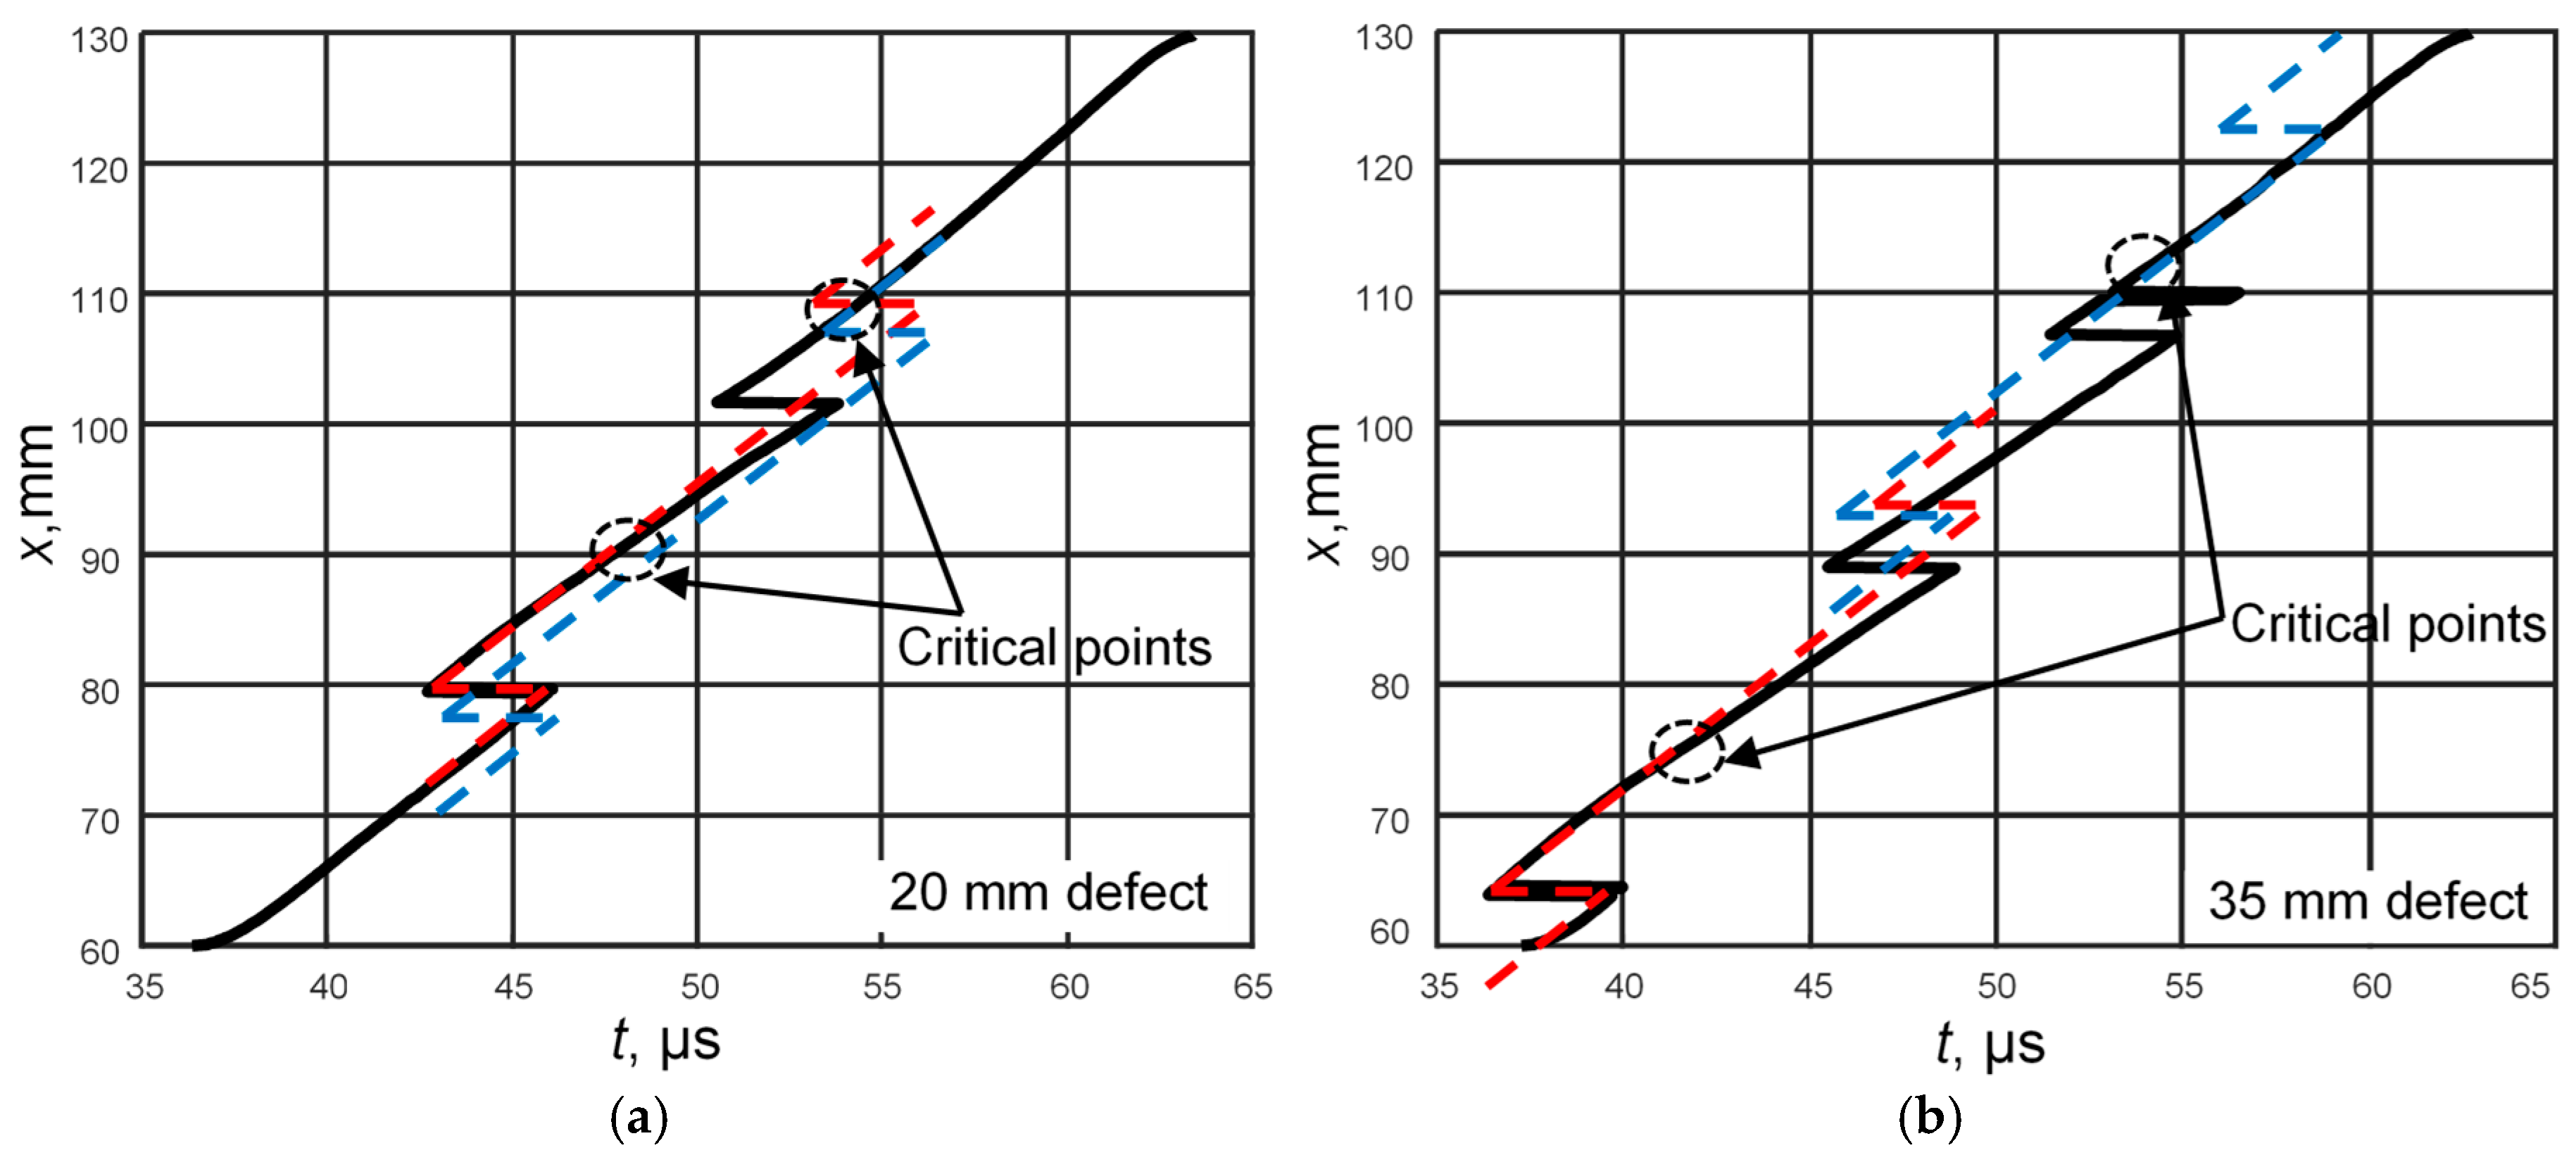
In the first stage of B-scan processing, we used a two-dimensional fast Fourier transform (2D FFT) [34] to eliminate reflected signals. Next, the ToF distributions of signals along the scan trajectories were calculated for the experimentally obtained B-scans. The ToF distributions for the selected defects are presented in Figure 10.
After performing the ToF curves fitting steps described in the theoretical simulation, the critical points of the experimental curves were determined (Figure 10a,b). Using the coordinates of these points, the sizes of the studied defects were estimated to be 18 and 37 mm, respectively. Since these studies were conducted only to evaluate the feasibility of the method, the accuracy of the method cannot be assessed. This requires more detailed theoretical and experimental studies with calibrated measurement procedures.

4. Discussion and Conclusions

The presented feasibility study analyzes the use of Lamb wave A0 mode signals time-of-flight for damage detection in large plate structures. In the proposed case, the ToF was determined based on the idea that the zero-crossings of this signal, filtered by several filters, are concentrated around the maximum of the signal envelope. The advantages of the ToF method were exploited by avoiding uncertainties due to the signal-to-noise ratio, the unnecessary need for a signal detection threshold, and the absence of the need for a reference signal.
The signal propagation time curves, when the distance between the transmitter and the receiver changes, depend on the group and phase velocities of the signal propagation and have phase jumps. In an ideal plate without damage, the signal propagation time curves can be described mathematically and have a constant nature. If inhomogeneity occurs in the plate, the nature of the curve changes. The proposed methodology for assessing plate inhomogeneities includes a comparison of signal time-of-flight curves with and without damage.
The methodology has been verified both through theoretical modeling and experimental research. The theoretical simulation analyzed the propagation of Lamb wave A0 mode signals in a 2 mm thick aluminum plate. A B-scan of 100 kHz center frequency signal propagation was simulated, when the distance between the transmitter and receiver varied within the range of 20–150 mm. The simulation was performed both on an ideal plate and with a 30 mm diameter defect. In both cases, the signal time-of-flight distribution curves were obtained. By comparing the signal time-of-flight distribution curves, the defect size of the tested plate was estimated. The measured size matched the modeled defect size.
In order to use a different type of specimen than in theoretical calculations, a 6 mm thick steel plate was selected for experimental studies. Artificial defects with a diameter of 10–35 mm and their detection capabilities were investigated. During experimental studies, it was found that the equipment used could not clearly identify a defect with a diameter of 10 mm, while all larger defects were detected with greater or lesser accuracy. Since these studies were conducted only to evaluate the feasibility of the method, the accuracy of the method cannot be assessed.
The results obtained during these studies confirmed the assumption that this method can identify inhomogeneities in thin homogeneous plates. The advantages of the method are noted: (1) it was not necessary to know the plate parameters in advance, it was enough to scan a small area of the plate in a defect-free area; (2) no threshold for signal capture was required; (3) it was suitable for signals with a reasonably low signal-to-noise ratio; and (4) compared to the correlation method, there was no need to have a reference signal.
However, the method was sensitive not only to large defects, but also to various surface irregularities. This affects sudden phase jumps, an example of which can be seen in Figure 10b. In a real plate, this corresponded to surface scratches.
This article is intended only for a feasibility study of the proposed method, therefore experimental measurements were performed only for experimental confirmation of theoretical studies. It is too early to talk about the practical applicability of the method, as an algorithm for comparing defective and defect-free curves still needs to be developed. The possibilities of using this method will be evaluated in further studies. This requires more detailed theoretical and experimental studies.

Funding

This research received no external funding.

Institutional Review Board Statement

Not applicable.

Informed Consent Statement

Not applicable.

Data Availability Statement

The original contributions presented in this study are included in the article. Further inquiries can be directed to the corresponding author.

Conflicts of Interest

The author declares no conflicts of interest.

Abbreviations

The following abbreviations are used in this manuscript:
SHMStructural health monitoring
LWLamb wave
ToFTime-of-flight
HTHilbert Transform
MPDMatching pursuit decomposition method
SPCSideband peak counting method
ASLAcoustic source localization
ToATime-of-arrival
TDoATime-difference-of-arrival
RAPIDReconstruction Algorithm for Probabilistic Inspection of Damage
LaWaI GUI Lamb Waves Inspection Graphical User Interface
2D FFTTwo-dimensional fast Fourier Transform

References

  1. Huston, D. Structural Sensing, Health Monitoring, and Performance Evaluation, 1st ed.; CRC Press: Boca Raton, FL, USA, 2010; p. 662. [Google Scholar] [CrossRef]
  2. Blitz, J. Electrical and Magnetic Methods of Non-Destructive Testing; Springer: Dordrecht, The Netherlands, 1997; p. 261. [Google Scholar]
  3. Hellier, C.J. Handbook of Nondestructive Evaluation, 2nd ed.; McGraw-Hill Companies: New York, NY, USA, 2013; p. 720. [Google Scholar]
  4. Staszewski, W.J.; Boller, C.; Tomlinson, G.R. Health Monitoring of Aerospace Structures: Smart Sensor Technologies and Signal Processing; John Wiley & Sons: Padstow, UK, 2004; p. 266. [Google Scholar]
  5. Rose, J.L. Ultrasonic Guided Waves in Solid Media; Pennsylvania State University: State College, PA, USA, 2014; pp. 1–512. [Google Scholar]
  6. Raghavan, A.; Cesnik, C. Review of guided-wave structural health monitoring. Shock Vib. Dig. 2007, 39, 91–114. [Google Scholar] [CrossRef]
  7. Mitra, M.; Gopalakrishnan, S. Guided wave based structural health monitoring: A review. Smart Mater. Struct. 2016, 25, 053001. [Google Scholar] [CrossRef]
  8. Yang, Z.; Yang, H.; Tian, T.; Deng, D.; Hu, M.; Ma, J.; Gao, D.; Zhang, J.; Ma, S.; Yang, L.; et al. A review on guided-ultrasonic-wave-based structural health monitoring: From fundamental theory to machine learning techniques. Ultrasonics 2023, 133, 107014. [Google Scholar] [CrossRef] [PubMed]
  9. Tibaduiza Burgos, D.A.; Gomez Vargas, R.C.; Pedraza, C.; Agis, D.; Pozo, F. Damage identification in Structural Health Monitoring: A brief review from its implementation to the use of data-driven applications. Sensors 2020, 20, 733. [Google Scholar] [CrossRef]
  10. Philibert, M.; Yao, K.; Gresil, M.; Soutis, C. Lamb waves-based technologies for structural health monitoring of composite structures for aircraft applications. Eur. J. Mater. 2022, 2, 436–474. [Google Scholar] [CrossRef]
  11. Hinrichs, J.; Sachsenweger, M.; Rutsch, M.; Allevato, G.; Wright, W.M.D.; Kupnik, M. Lamb waves excited by an air-coupled ultrasonic phased array for non-contact, non-destructive detection of discontinuities in sheet materials. In Proceedings of the 2021 IEEE International Ultrasonics Symposium (IUS), Xi’an, China, 11–16 September 2021; pp. 1–4. [Google Scholar] [CrossRef]
  12. Krolik, A.; Drelich, R.; Pakuła, M.; Mikołajewski, D.; Rojek, I. Detection of defects in polyethylene and polyamide flat panels using airborne ultrasound-traditional and machine learning approach. Appl. Sci. 2024, 14, 10638. [Google Scholar] [CrossRef]
  13. Li, S.; Wang, L.; Chen, H.; Liang, X.; Wang, Z.; Wang, G. Second harmonic ultrasonic signal detection of mechanical structural defects using VMD combined with wavelet threshold. Adv. Mech. Eng. 2025, 17, 16878132251385032. [Google Scholar] [CrossRef]
  14. Cho, H.; Lissenden, C.J. Structural health monitoring of fatigue crack growth in plate structures with ultrasonic guided waves. Struct. Health Monit. 2012, 11, 393–404. [Google Scholar] [CrossRef]
  15. De Luca, A.; Sharif-Khodaei, Z.; Aliabadi, M.H.; Caputo, F. Numerical Simulation of the Lamb Wave Propagation in Impacted CFRP Laminate. Procedia Eng. 2016, 167, 109–115. [Google Scholar] [CrossRef]
  16. Rabbi, M.S.; Teramoto, K.; Ishibashi, H.; Roshid, M.M. Imaging of sub-surface defect in CFRP laminate using A0-mode Lamb wave: Analytical, numerical and experimental studies. Ultrasonics 2023, 127, 106849. [Google Scholar] [CrossRef] [PubMed]
  17. Pasadas, D.J.; Barzegar, M.; Ribeiro, A.L.; Ramos, H.G. Crack depth evaluation and imaging using Lamb wavefield measurements by a movable PZT sensor. IEEE Sens. J. 2024, 24, 37514–37523. [Google Scholar] [CrossRef]
  18. Irtiza, C.M.; Silwal, B.; Kardel, K.; Taheri, H. Implementing phased array ultrasonic testing and lean principles towards efficiency and quality improvement in manufacturing welding processes. Appl. Sci. 2025, 15, 11271. [Google Scholar] [CrossRef]
  19. Xu, B.; Wang, M.; Li, P.; Cheng, Q.; Sheng, Y. Application of instantaneous parameter characteristic in active Lamb wave based monitoring of plate structural health. Appl. Sci. 2020, 10, 5664. [Google Scholar] [CrossRef]
  20. Lints, M.; Ratassepp, M. Accuracy of the Mindlin model in A0 Lamb mode scattering from partial through-thickness damage. Appl. Sci. 2024, 14, 9351. [Google Scholar] [CrossRef]
  21. Zhao, X.; Royer, R.L.; Owens, S.E.; Rose, J.L. Ultrasonic Lamb wave tomography in structural health monitoring. Smart Mater. Struct. 2011, 20, 105002. [Google Scholar] [CrossRef]
  22. Zhang, G.; Kundu, T.; Deymier, P.A.; Runge, K. Defect localization in plate structures using the geometric phase of Lamb waves. Ultrasonics 2025, 145, 107492. [Google Scholar] [CrossRef]
  23. Parrilla, M.; Anaya, J.; Fritsch, C. Digital signal processing techniques for high accuracy ultrasonic range measurements. IEEE Trans. Instrum. Meas. 1991, 40, 759–763. [Google Scholar] [CrossRef]
  24. Ochoa, P.; Groves, R.M.; Benedictus, R. Lamb wave dispersion time-domain study using a combined signal processing approach. In Proceedings of the 6th International Conference on Emerging Technologies in Non-Destructive Testing, Brussels, Belgium, 27–29 May 2015; Available online: https://resolver.tudelft.nl/uuid:9a1e402f-af91-429b-92dd-a631e9da56ca (accessed on 19 January 2026).
  25. Xu, B.; Yu, L.; Giurgiutiu, V. Advanced methods for time-of-flight estimation with application to Lamb wave Structural Health Monitoring. In Proceedings of the 7th International Workshop on Structural Health Monitoring, Stanford University, Palo Alto, CA, USA, 9–11 September 2009; Available online: https://www.researchgate.net/publication/242098770 (accessed on 19 January 2026).
  26. Guo, J.; Zeng, X.; Liu, Q.; Qing, X. Lamb wave-based damage localization and quantification in composites using probabilistic imaging algorithm and statistical method. Sensors 2022, 22, 4810. [Google Scholar] [CrossRef]
  27. Dai, Z.; Liu, J.; Zhang, J.; Cui, Z.; Kundu, T. A semi-analytical multimodal Lamb wave imaging algorithm for damage identification in structural health monitoring. Ultrasonics 2026, 159, 107874. [Google Scholar] [CrossRef]
  28. Hu, B.; Kundu, T. Damage detection and localization in plate-like structures using sideband peak count (SPC) technique. Ultrasonics 2025, 145, 107485. [Google Scholar] [CrossRef]
  29. Šedek, J.; Šedková, L.; Vích, O. Frequency-integral method for impact damage detection in carbon fibre reinforced thermoplastic composites by Lamb waves. Ultrasonics 2025, 154, 107697. [Google Scholar] [CrossRef] [PubMed]
  30. Gorgin, R.; Wu, Z.; Gao, D.; Wang, Y. Damage size characterization algorithm for active structural health monitoring using the A0 mode of Lamb waves. Smart Mater. Struct. 2014, 23, 035015. [Google Scholar] [CrossRef]
  31. Tumšys, O. A new signal processing method for time-of-flight and center frequency estimation. Appl. Sci. 2025, 15, 5721. [Google Scholar] [CrossRef]
  32. Tumšys, O. Experimental method for simultaneous determination of the Lamb wave A0 modes group and phase velocities. Materials 2022, 15, 2976. [Google Scholar] [CrossRef]
  33. Mažeika, L.; Draudvilienė, L.; Žukauskas, E. Influence of the dispersion on measurement of phase and group velocities of Lamb waves. Ultrasound 2009, 64, 18–21. Available online: https://www.ultragarsas.ktu.lt/index.php/USnd/article/view/17122 (accessed on 19 January 2026).
  34. Michaels, T.E.; Michaels, J.E.; Ruzzene, M. Frequency-wavenumber domain analysis of guided wavefields. Ultrasonics 2011, 51, 452–466. [Google Scholar] [CrossRef]
Figure 1. The original ultrasonic signal (black line), its envelope (blue line) and the signals filtered by a five-filter package (colored line).
Applsci 16 02623 g001
Figure 2. (a) Simulated B-scan Lamb wave A0 mode signals (color coded) with calculated time-of-flight values (line). (b) Time-of-flight values in the narrow range.
Applsci 16 02623 g002
Figure 3. The jump of concentrated zero-crossing instances at adjacent reference points during the half-period of the signals. Signals filtered by the filter package are represented by colored lines and zero-crossings are represented by black circles.
Applsci 16 02623 g003
Figure 4. (a) Group (dashed lines) and phase (solid lines) velocity dispersion curves of the A0 mode of Lamb waves in aluminum 7075-T6 plates with thicknesses d: black—d = 1 mm, blue—d = 2 mm, red—d = 3 mm. (b) Calculated time-of-flight (ToF) values in plates of appropriate thickness.
Applsci 16 02623 g004
Figure 5. Modeled damage in the middle of the aluminum plate, longitudinal B-scan of this damage and calculated ToF distribution of signals along the scan trajectory.
Applsci 16 02623 g005
Figure 6. The signal propagation time curve of the damaged plate (black line) and the signal propagation time curves of the undamaged plate (red and blue dotted lines).
Applsci 16 02623 g006
Figure 7. (a) Steel plate (d = 6 mm) with various artificial defects. (b) Dispersion curves of Lamb wave propagation in this plate. The solid lines represent the phase velocity, and the dotted lines represent the group velocity.
Applsci 16 02623 g007
Figure 8. Structural diagram of excitation and reception of Lamb wave A0 mode signals in a steel plate.
Applsci 16 02623 g008
Figure 9. B-scan images of A0 modes of Lamb waves propagating through a steel plate with artificial defects: (a)—20 mm diameter; (b)—35 mm diameter.
Applsci 16 02623 g009
Figure 10. The time-of-flight distributions for the artificial defects: (a)—20 mm diameter; (b)—35 mm diameter. The black lines correspond to the experimental curves, and the red and blue lines correspond to the theoretical curves without damage.
Applsci 16 02623 g010
Disclaimer/Publisher’s Note: The statements, opinions and data contained in all publications are solely those of the individual author(s) and contributor(s) and not of MDPI and/or the editor(s). MDPI and/or the editor(s) disclaim responsibility for any injury to people or property resulting from any ideas, methods, instructions or products referred to in the content.