Article

MTA-Dataset: Multiple-Tilt-Angle Dataset for UAV–Satellite Image Matching

1
Aerospace Times FeiHong Technology Corporation, Beijing 100094, China
2
The 9th Academy, China Aerospace Science and Technology Corporation, Beijing 100094, China
3
School of Mechatronical Engineering, Beijing Institute of Technology, Beijing 100081, China
4
Intelligent Unmanned System Overall Technology Research and Development Center, China Aerospace Science and Technology Corporation, Beijing 100094, China
5
The 9th Academy Unmanned System Center, China Aerospace Science and Technology Corporation, Beijing 100094, China
*
Author to whom correspondence should be addressed.
Appl. Sci. 2026, 16(5), 2488; https://doi.org/10.3390/app16052488
Submission received: 13 January 2026 / Revised: 19 February 2026 / Accepted: 2 March 2026 / Published: 4 March 2026

Abstract

Accurate target localization via matching real-time UAV images with reference satellite imagery is essential for autonomous environmental perception. Nonetheless, operational constraints and weather conditions often necessitate oblique photography. This large-tilt mode causes significant perspective and radiometric distortions, resulting in a substantial domain gap between UAV and vertical satellite imagery. The scarcity of datasets featuring extreme viewpoint shifts and fine-grained ground-truth labels hinders the validation of image matching algorithms in multi-tilt-angle environments. To address this issue, we introduce the multiple-tilt-angle dataset (MTA-Dataset), containing 1892 UAV images with tilt angles spanning 0 ° , 90 ° and flight altitudes up to 300 m, supported by high-precision five-point manual annotations. Based on this benchmark, we evaluate state-of-the-art matching algorithms and propose a spatial-resolution-based cropping strategy. Experimental results demonstrate that, as the UAV tilt angle increases within the range of 0 ° , 90 ° , although the expanding field of view provides richer contextual information, the localization errors of all methods increase significantly and matching precision drops sharply due to severe geometric distortions in far-field regions and interference from redundant background information, with performance deteriorating most drastically in the 50 ° , 90 ° range. With the integration of our strategy, the average matching localization errors of SuperPoint + SuperGlue baseline for UAV images within the tilt-angle ranges of 50 ° , 60 ° , 60 ° , 70 ° , 70 ° , 80 ° , and 80 ° , 90 ° are reduced by 33.49 m, 37.86 m, 98.3 m, and 109.95 m, respectively. Our study provides a more comprehensive evaluation framework for robust UAV–satellite image matching algorithms in multi-tilt-angle scenarios.

1. Introduction

Cross-view image matching [1], which establishes correspondences [2] between UAV and geo-tagged satellite images, is a cornerstone for precise UAV vision. This technique supports various applications, ranging from precision agriculture [3], disaster relief [4], smart city [5], and industrial inspection [6]. Despite its significance, practical UAV deployments often grapple with dynamic flight conditions that prevent precise payload orientation. This frequently results in images with pronounced tilt angles [7], which significantly degrades matching performance.
While several public datasets [8,9] have been released to improve algorithmic robustness, existing benchmarks exhibit two critical limitations that hinder further progress. First, there is a notable scarcity of UAV images captured at extreme tilt angles (e.g., 70 ° , 90 ° ), leaving the efficacy of matching methods in such scenarios largely unverified. Second, current datasets lack comprehensive geometric annotations. For instance, while UAV-VisLoc [10] provides geographic coordinates for image centers, this single-point annotation is insufficient for evaluating the registration accuracy and robustness of the entire image field.
To bridge these gaps [11], we present the multiple-tilt-angle dataset (MTA-Dataset), a comprehensive benchmark specifically designed for UAV–satellite matching across diverse perspectives. Our primary contributions are as follows:
  • Dataset Construction: We introduce the MTA-Dataset, covering a wide range of tilt angles spanning 0 ° ,   90 ° . It comprises 1892 UAV images captured at various altitudes, paired with a high-resolution (0.3 m) reference satellite map. Notably, each UAV image is annotated with the precise geographic coordinates of five keypoints. This scheme enables a more granular evaluation of matching efficacy across different local regions of oblique-view images [12,13].
  • Systematic Benchmarking: We conduct a comprehensive comparative analysis of ten representative image matching algorithms. This evaluation provides deep insights into how varying perspective distortions impact performance across different technical frameworks.
  • Spatial-Resolution-Based Cropping: We propose an innovative UAV–satellite image cropping strategy based on horizontal spatial resolution analysis. By establishing a UAV field-of-view (FOV) model, this strategy effectively preprocesses image pairs across diverse tilt angles, ensuring a high-quality input and improved matching robustness.

2. Related Research

2.1. UAV–Satellite Image Datasets

In 2021, Zheng et al. [14] introduced the University-1652 dataset, which was the first to incorporate UAV-perspective images. To circumvent the high costs associated with real-world data collection, University-1652 utilized a 3D engine to simulate UAV views of 1652 university campuses worldwide. While simulation facilitates the generation of multi-view UAV images, a significant domain gap remains between synthetic and real-world images, often resulting in models that lack generalization robustness in practical scenarios. The subsequent SUES-200 [15] dataset addressed this by employing authentic UAV images. However, it was designed primarily for image retrieval and lacks the metrics required for localization tasks. More recent benchmarks, such as VPAIR [16], DenseUAV [17], GTA-UAV [18], and AnyVisLoc [19], have successfully extended their tasks from retrieval to localization. Nevertheless, these datasets fail to provide explicit point-to-point correspondences or geometric transformation relationships between UAV and satellite images, precluding a rigorous evaluation of matching accuracy. Although the recently proposed UAV-VisLoc dataset provides geographic coordinates for the center point of nadir-view UAV images, it lacks oblique-view data. Furthermore, relying exclusively on center-point ground truth is insufficient for a comprehensive assessment of registration accuracy across the diverse spatial regions inherent in oblique UAV images.

2.2. Image Matching Methods

Early image matching methods were predominantly based on handcrafted features, such as SIFT [20] and ORB [21], which necessitated significant domain expertise and often struggled under fluctuating operational conditions [22]. For a long time, SIFT-based enhancements remained a cornerstone of image matching research. However, the advent of deep learning has catalyzed the development of frameworks that directly detect and describe image features [23], yielding substantial improvements in feature robustness, matching accuracy, and adaptability to complex scenes. Currently, mainstream approaches typically adopt a joint detection-and-description paradigm to facilitate sparse matching. A notable example is the integration of SuperPoint [24] and SuperGlue [25] (hereafter referred to as SP + SuperGlue), which achieves an optimal trade-off between computational efficiency and accuracy. For the PhotoTourism [26] dataset (a dataset focused on tourist landmarks), SP+ SuperGlue achieved an impressive 84.9% accuracy for pose estimation within a 20° error threshold, establishing it as a preeminent baseline in the field. To address scenarios characterized by low feature repeatability, recent research has pivoted toward dense matching methods. By modeling global pixel-wise relationships, these methods enhance feature representations in challenging image pairs. Specifically, ASpanFormer [27], which incorporates an adaptive attention mechanism, has significantly advanced matching precision. When evaluated on the MegaDepth [28] dataset (a dataset consisting of internet photos), it reached a pose estimation accuracy of 85.1% within the 20° error range.

3. MTA-Dataset for UAV–Satellite Image Matching

3.1. Data Characteristics

For this study, a total of 1892 UAV images were collected in Laixi, Shandong Province, encompassing diverse land cover types such as cropland, residential areas, undeveloped land, industrial zones, and water bodies. The UAV flight altitudes ranged from 30 m to 300 m, with flight attitude parameters maintained within the following ranges: roll angle ϕ 1 10 ° , 10 ° , pitch angle θ 1 10 ° , 10 ° , and yaw angle ψ 1 180 ° , 180 ° . Additionally, the gimbal payload was controlled within the following ranges: roll angle ϕ 2 10 ° , 10 ° , pitch angle θ 2 90 ° , 0 ° , and yaw angle ψ 2 10 ° , 10 ° . The images were acquired using two types of quadrotor UAVs, with resolutions of 1920 × 1440 and 1280 × 960 pixels, respectively. The reference satellite map, sourced from Google Earth, covers the entire study area with a resolution of 17,610 × 14,410 pixels and a spatial resolution of approximately 0.3 m, providing a high-precision baseline for matching. The composition of the MTA-Dataset is shown in Table 1.
Each UAV image is accompanied by a metadata file documenting the latitude, longitude, flight altitude, focal length, tilt angle, and heading angle at the moment of capture. Furthermore, the dataset includes manual annotations of the precise geographic coordinates for five distributive keypoints per image. A comparative overview of the MTA-Dataset and existing UAV–satellite matching benchmarks is presented in Table 2.
When compared with existing datasets, the MTA-Dataset offers the following distinct advantages:
  • Enhanced Ground-Truth Annotations: The MTA-Dataset provides precise geographic coordinates for five distributive keypoints per image, moving beyond the single-point or image-level labels common in existing benchmarks. This multi-point annotation provides richer supervisory signals for both training and validating high-precision matching and localization algorithms, particularly in assessing geometric consistency across the entire image frame.
  • Extended Tilt-Angle Range: Our dataset covers an extensive range of tilt angles spanning 0 ° , 90 ° , with a specific emphasis on oblique perspectives exceeding 70°. Every image is meticulously labeled with its corresponding tilt-angle metadata. By incorporating these extreme view angles, the MTA-Dataset effectively fills the current data void, providing indispensable support for advancing the robustness of cross-view UAV–satellite image matching.

3.2. Ground-Truth Annotation

To comprehensively evaluate the registration performance across various regions of oblique-view UAV images, we implemented a multi-region ground-truth annotation scheme. Specifically, five keypoints were selected for each UAV image: one from the center and one from each of the four corner quadrants. By annotating the precise geographic coordinates of these five points, we established a robust benchmark for assessing matching and localization accuracy, as illustrated in Figure 1.
The selection of the five keypoints adhered to the following systematic criteria:
  • Geometric Salience: Priority was given to salient edges and corner features within the scene, as they exhibit strong geometric correspondence between UAV and satellite perspectives.
  • Identifiability: Selected keypoints must possess clear, unambiguous counterparts in the reference satellite map to ensure the accuracy of manual annotation.
  • Spatial Flexibility: If a region lacked suitable features, a substitute keypoint was selected from the immediate adjacent area to maintain spatial coverage.
  • Fallback Coordinate Calculation: In cases where recognizable features were entirely absent, keypoints were instead assigned to the four image corners and the ground projection of the optical center’s line of sight. Their ground-truth geographic coordinates were subsequently derived via geometric projection, utilizing the UAV’s logged position and tilt-angle metadata.
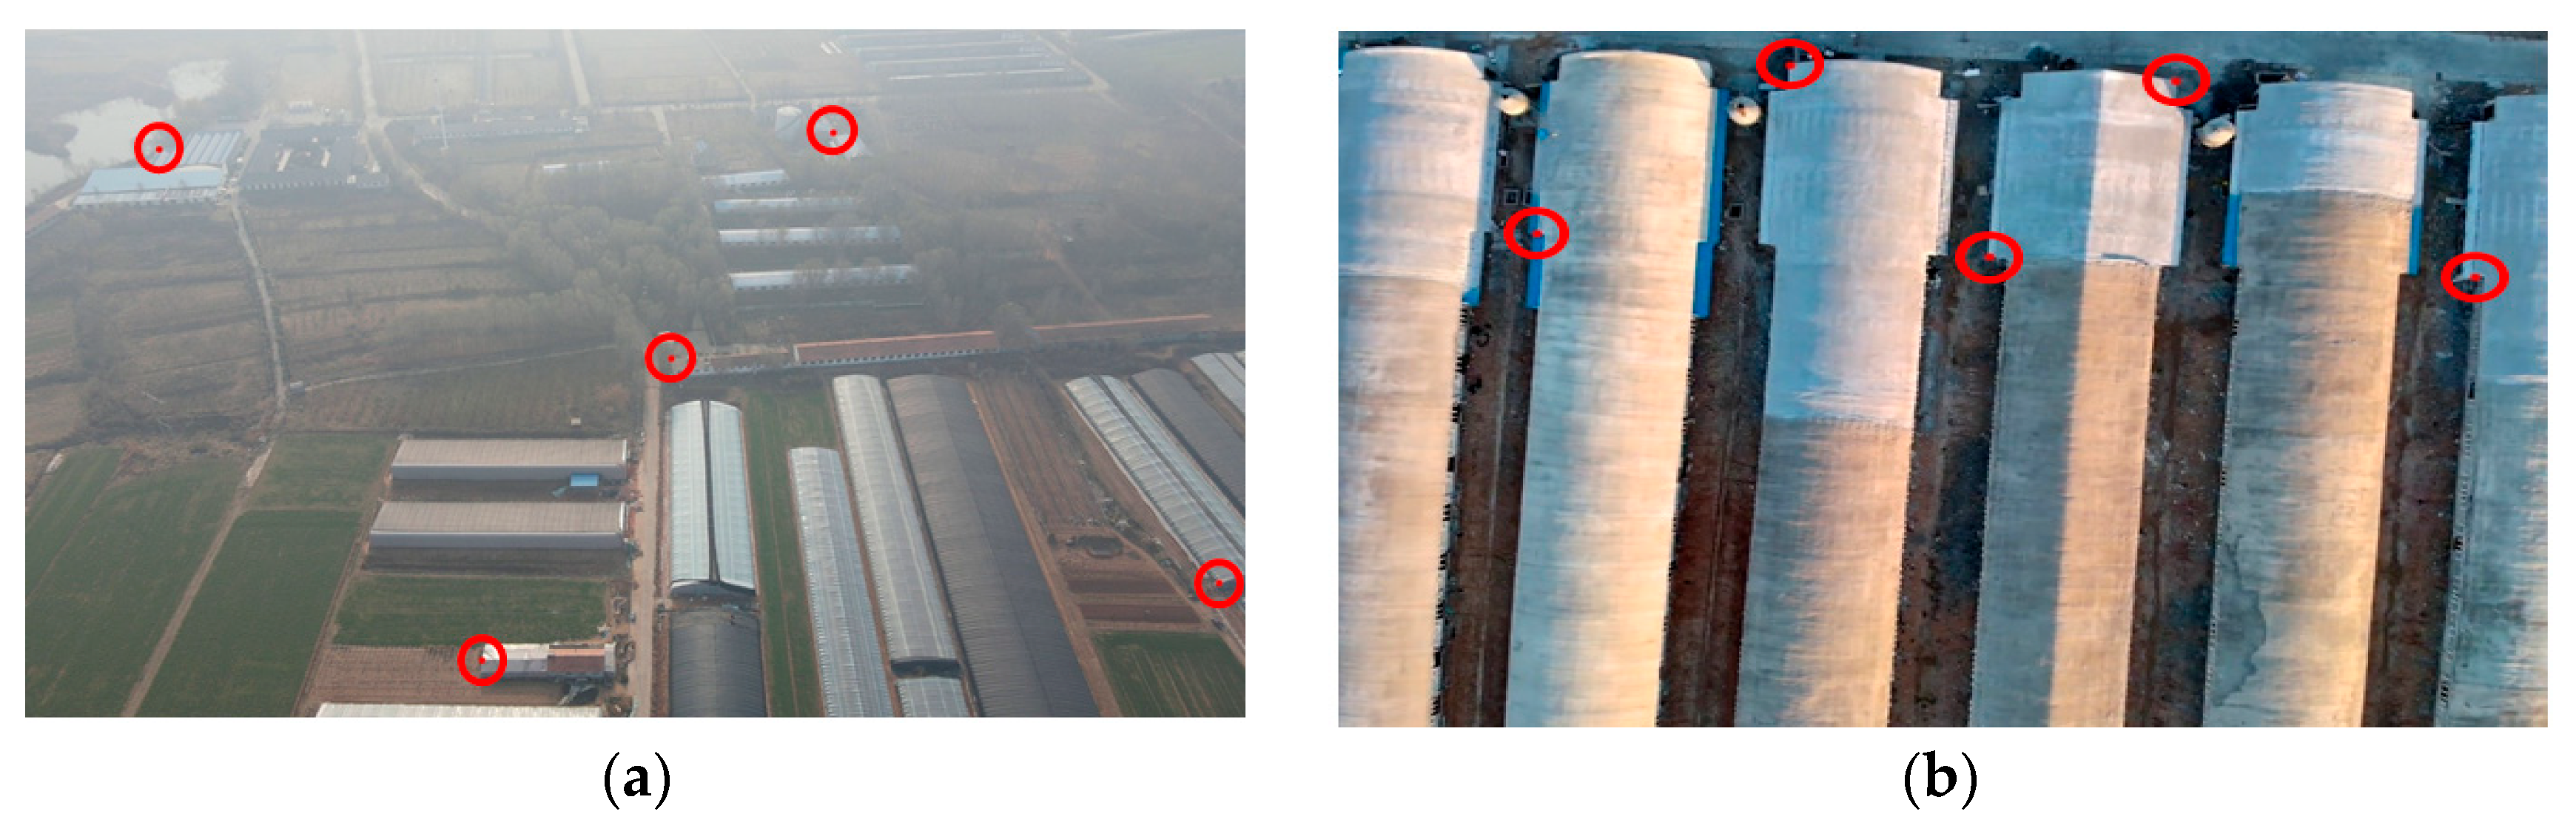
Compared to more extensive or dense annotations, having five keypoints provides a stable and sufficient geometric constraint to define the homography while effectively minimizing ambiguity caused by perspective distortions and seasonal variations. In challenging regions—such as those with repetitive textures or low visual saliency—manually identifying reliable correspondences is exceedingly difficult, rendering dense annotation impractical for such scenarios. The representative examples of keypoint selection are presented in Figure 2.
Following the annotation, both the pixel coordinates and the corresponding precise geographic coordinates for keypoints were recorded in the metadata labels. The annotation process was conducted by three professionals following systematic criteria and supplemented by a verification procedure to minimize potential uncertainty.

3.3. Evaluation Metrics

The evaluation metrics employed by existing UAV–satellite image matching datasets are summarized in Table 3. For the sake of brevity, the detailed definitions of these metrics are omitted here; please refer to the original publications for further technical details.
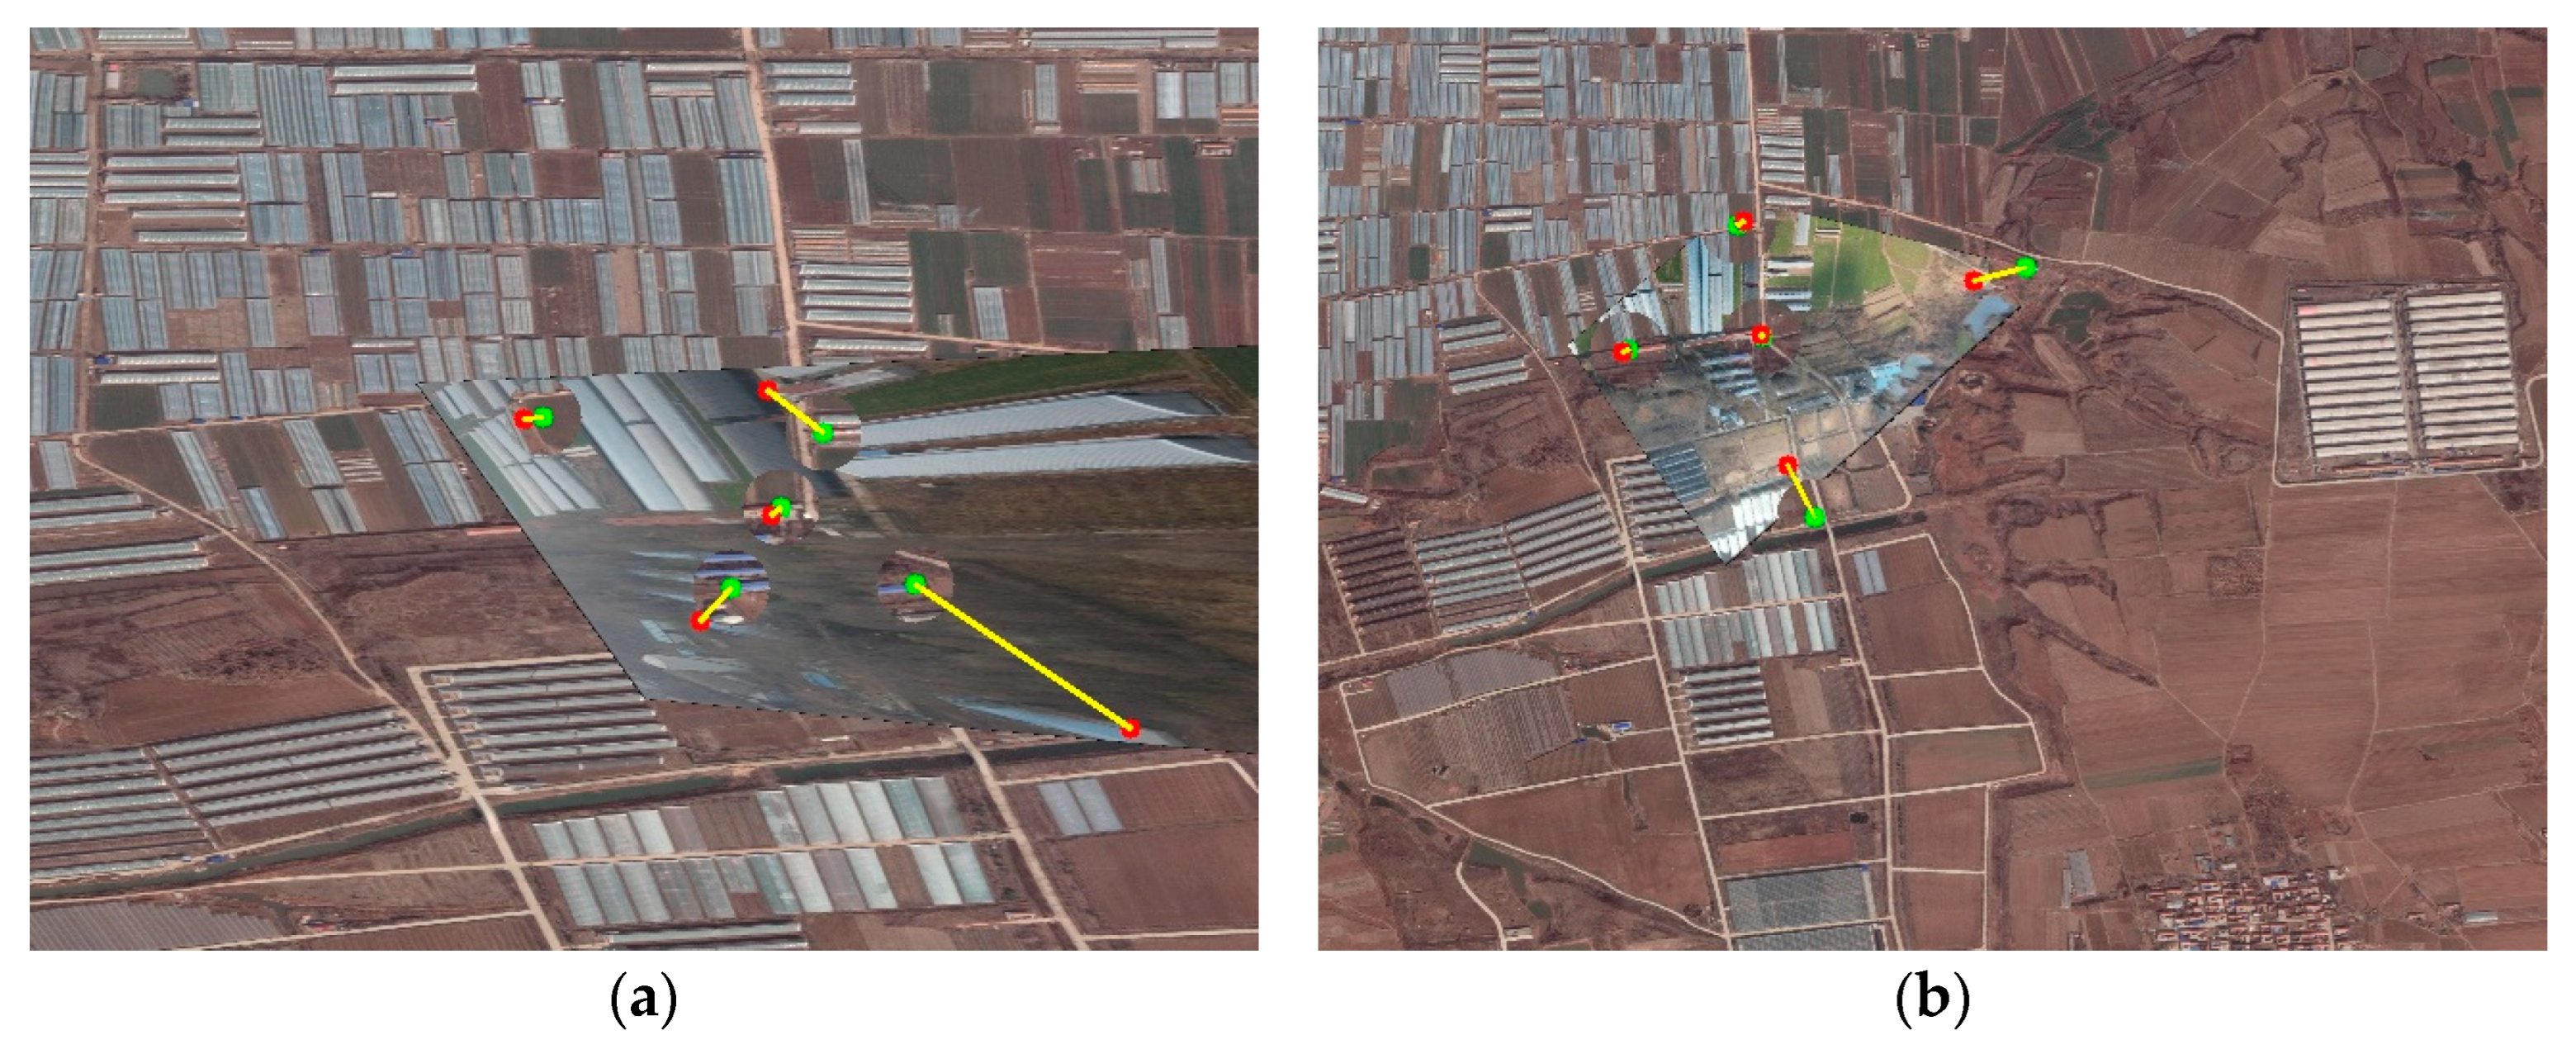
Among the evaluation metrics, R e c a l l @ K [14] and A P [14] are standard metrics for evaluating model retrieval performance, while R B [15] and P F [15] focus on altitude-based generalization and inference efficiency, respectively. To assess localization precision within the retrieval framework, several distance-based metrics have been proposed, i.e., S D M @ K [17] and P D M @ K [19] employ spatial distance weighting mechanisms—with the latter normalizing for image size and spatial resolution—whereas D i s @ 1 [18] and A @ T [19] measure the absolute spatial error and the localization success rate under a predefined distance threshold, respectively. Despite their utility, none of these metrics adequately capture the intra-image matching efficacy across the diverse spatial regions inherent in oblique-view UAV images. As illustrated in Figure 3, a matching method may achieve precise center-point localization, yet it may exhibit catastrophic matching failures in corner regions due to severe perspective distortions. Such regional imbalances are often masked by existing center-point-based metrics, leading to an over-optimistic performance assessment.
To overcome this limitation and provide a more granular evaluation, we propose a comprehensive assessment framework utilizing three key metrics: the localization success ratio A @ T , the average localization error E [ a ° , b ° ) , and the matching success ratio P [ a ° , b ° ) | n .
The metric A @ T represents the localization success rate, defined as the proportion of images where the average positioning error across the five keypoints falls within a specified threshold. The mathematical definition of A @ T is as follows:
A @ T = i = 1 N N R T i N × 100 %
N R T i = 1 , e m r i < K 0 , e m r i K
e m r i = j = 1 5 x p r j x g r j 2 + y p r j y g r j 2 5
where e m r i denotes the average localization error of the five keypoints for the i -th UAV image with tilt angles in the range of [ a ° , b ° ) , N [ a ° , b ° ) represents the total number of images in this range, and coordinates x p r j , y p r j and x g r j , y g r j correspond to the estimated and ground-truth coordinates of the j -th keypoint in the i -th image, respectively. These values are derived through homography-based projections and subsequent coordinate transformations.
The metric E [ a ° , b ° ) | n represents the average localization error for UAV images captured within the tilt-angle range of [ a ° , b ° ) . The mathematical definition of E [ a ° , b ° ) | n is as follows:
E [ a ° , b ° ) | n = i = 1 N [ a ° , b ° ) e m r i N [ a ° , b ° )
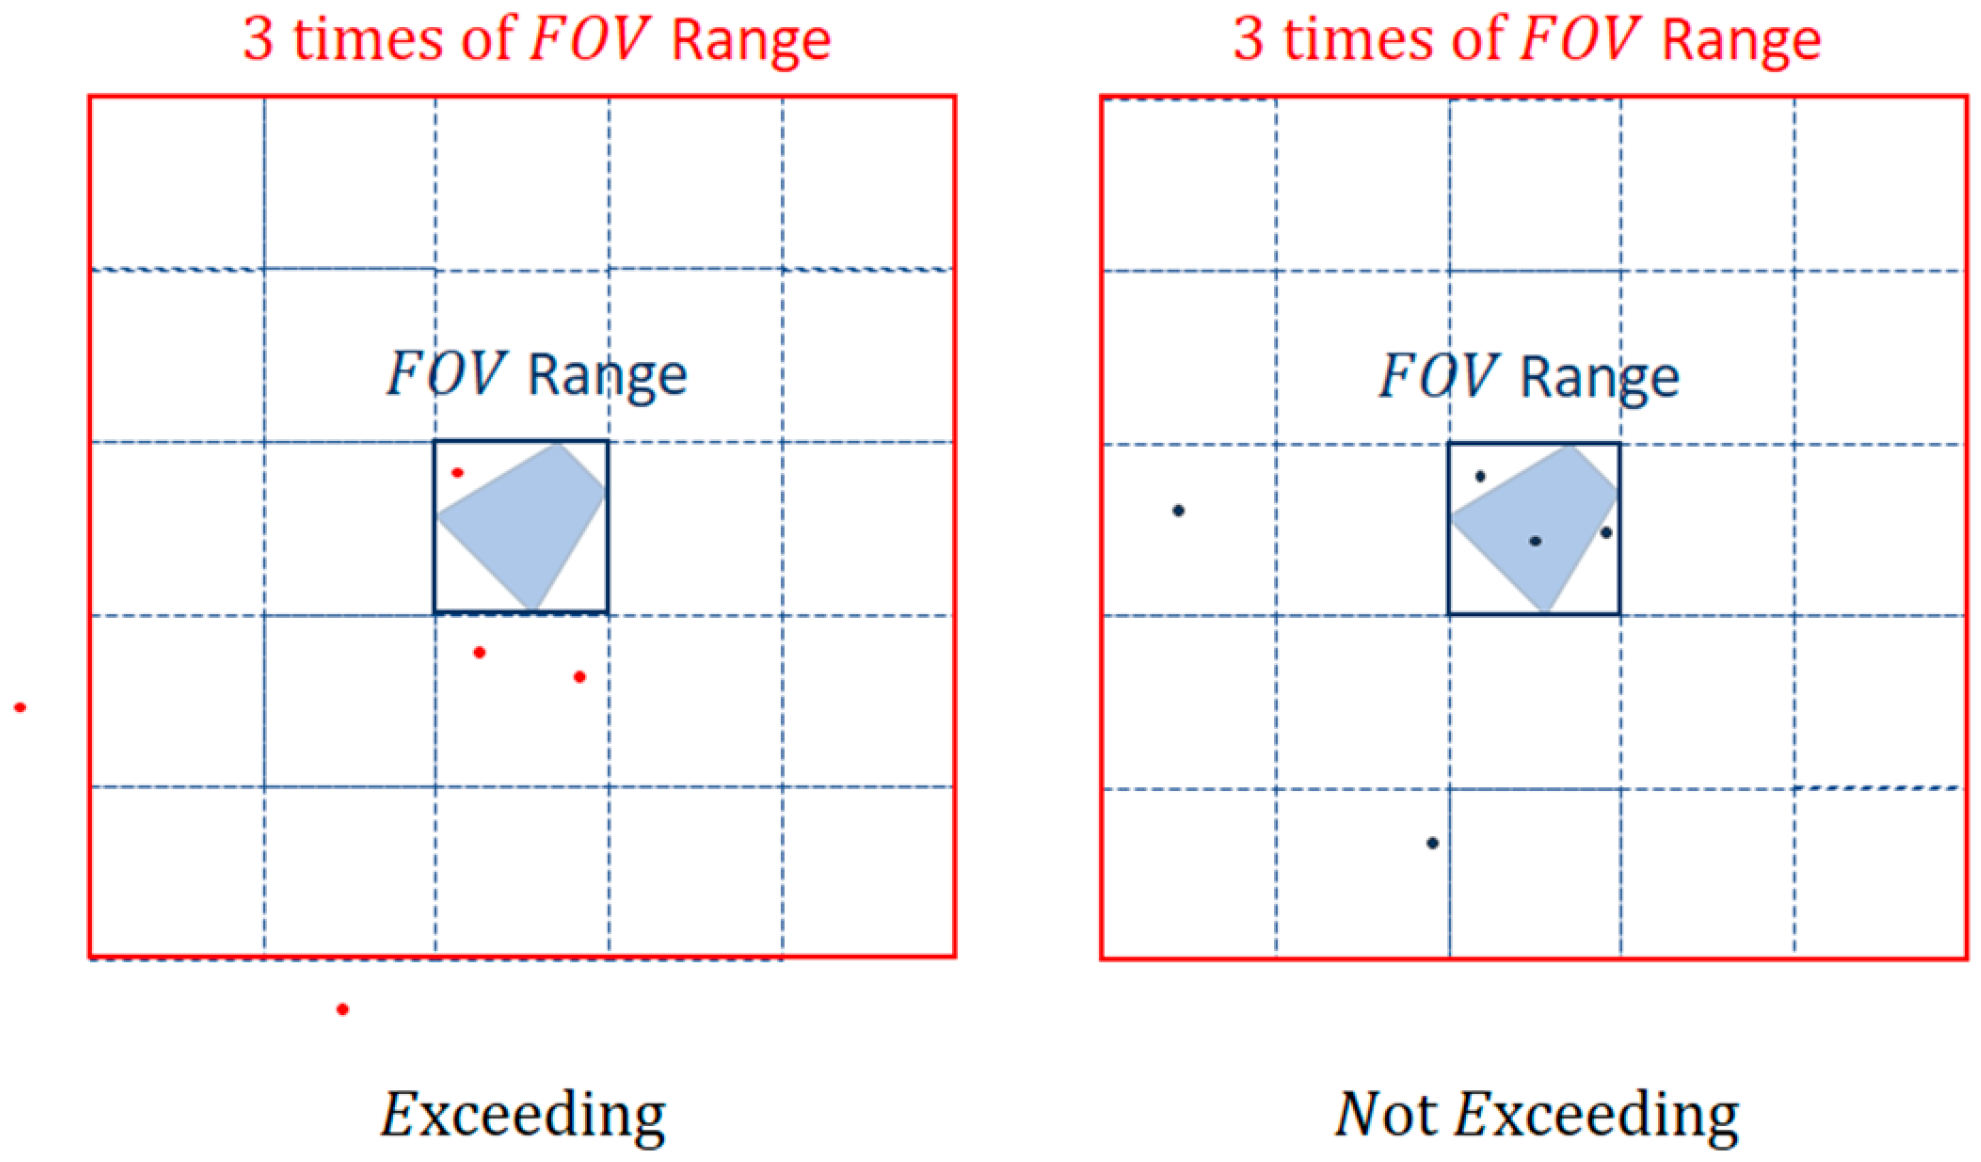
where n denotes a preset threshold for the minimum number of matching points required. A lower E [ a ° , b ° ) | n value signifies superior matching efficacy across the diverse spatial regions of oblique-view UAV images. In certain cases, the paucity of matched feature points may preclude the reliable estimation of a homography matrix. Alternatively, the projection error derived from a feature-based homography may be unrealistically large (e.g., exceeding three times the field of view), as illustrated in Figure 4. To maintain a robust evaluation in such instances, a theoretical homography matrix, derived from the UAV’s pose metadata and foundational imaging principles, is employed to infer geographic coordinates as a surrogate for the failed matching relationship.
The metric P [ a ° , b ° ) | n denotes the success rate for UAV images captured within the tilt-angle range of [ a ° , b ° ) . The mathematical definition of P [ a ° , b ° ) | n is as follows:
P [ a ° , b ° ) | n = i = 1 N [ a ° , b ° ) N n T i N [ a ° , b ° ) × 100 %
N n T i = 1 , M K P S i n 0 , M K P S i < n
where M K P S i represents the count of valid matching keypoints for the i -th UAV image, and n represents the predefined minimum threshold for a successful match. A higher P [ a ° , b ° ) | n value signifies that a greater proportion of images satisfy the matching requirement, thereby indicating superior model robustness and adaptability to various perspective distortions.

4. Oblique-View Image Matching Experiments

4.1. Implementation Details

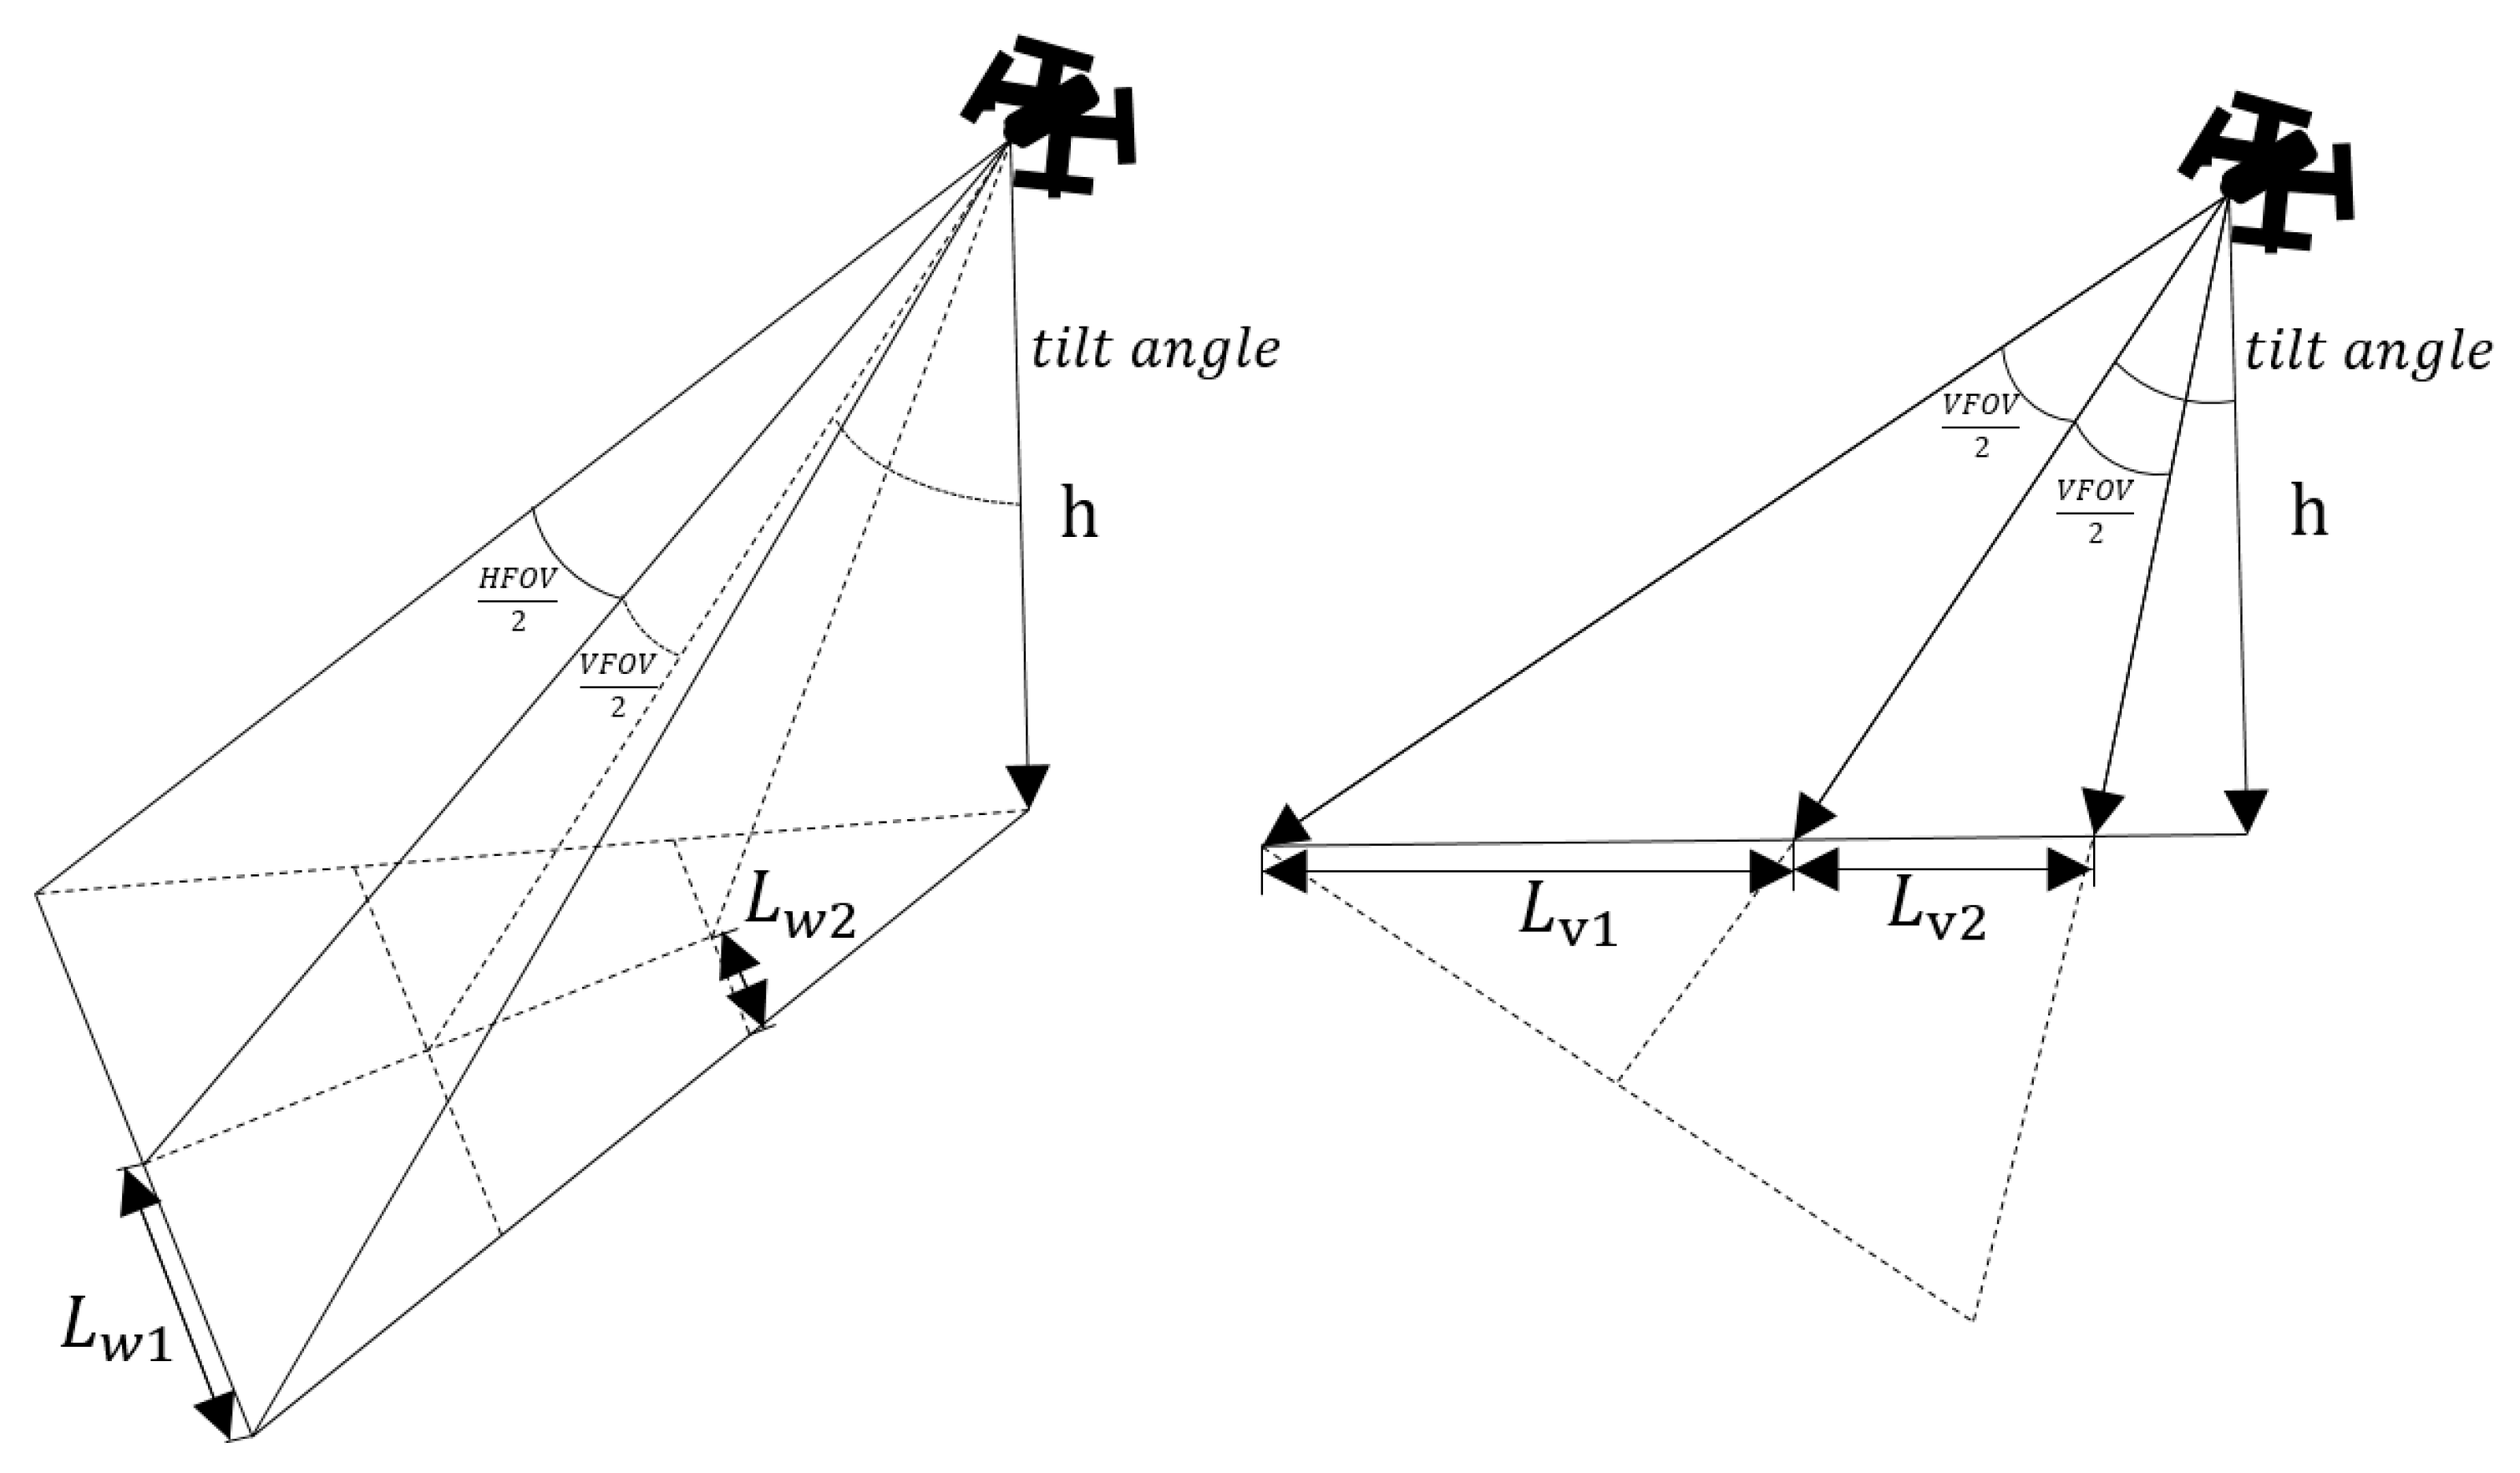
To address the significant registration errors caused by perspective and resolution discrepancies between UAV and satellite imagery, we employ a UAV field-of-view (FOV) model (as illustrated in Figure 5) for spatial alignments. This model integrates UAV flight attitudes with gimbal payload parameters to preprocess images through precise geographic cropping.
Initially, the Horizontal Field of View ( H F O V ) and Vertical Field of View ( V F O V ) are determined by the camera sensor dimensions and focal length as follows:
H F O V = 2 × atan ( W s e n s o r 2 × f ) V F O V = 2 × atan ( H s e n s o r 2 × f )
where W s e n s o r and H s e n s o r represent the sensor’s width and height, and f denotes the focal length.
By integrating the flight altitude ( h ), tilt angle, heading, and the previously calculated FOV angles, the model projects the camera’s optical cone onto the ground. Instead of assuming a simple nadir projection, the derivation accounts for the oblique geometry to determine the longitudinal spans ( L v 1 , L v 2 ) and lateral widths ( L w 1 , L w 2 ) of the projected trapezoidal footprint.
This geometric derivation further facilitates the computation of the precise geographic coordinates for the four vertices of the UAV image’s ground footprint. To ensure a robust initial alignment, the minimum bounding rectangle encompassing these vertices is calculated and used to crop the corresponding region from the reference satellite map.
Based on the heading angle, the cropped UAV image is rotated to align with the standard geographic orientation (north-up) of the satellite map. Subsequently, both the UAV and satellite image pairs are standardized to a uniform resolution of 640 × 480 pixels. These preprocessed images then serve as the direct input for the subsequent matching algorithms. Benchmarking experiments were conducted using the proposed MTA-Dataset as the evaluation set. Ten representative algorithms, spanning three distinct matching paradigms, were selected for comparison, as detailed in Table 4.
For deep learning-based methods, we employed off-the-shelf pre-trained models without additional fine-tuning to evaluate their inherent generalization capabilities. To rigorously assess the registration performance across various spatial regions in oblique UAV images, the experiments utilized three key metrics: the localization success ratio A @ T , the average localization error E [ a ° , b ° ) | n , and the matching success ratio P [ a ° , b ° ) | n . The detailed hardware specifications for the experimental platform are provided in Table 5.

4.2. Comparison of Matching Methods

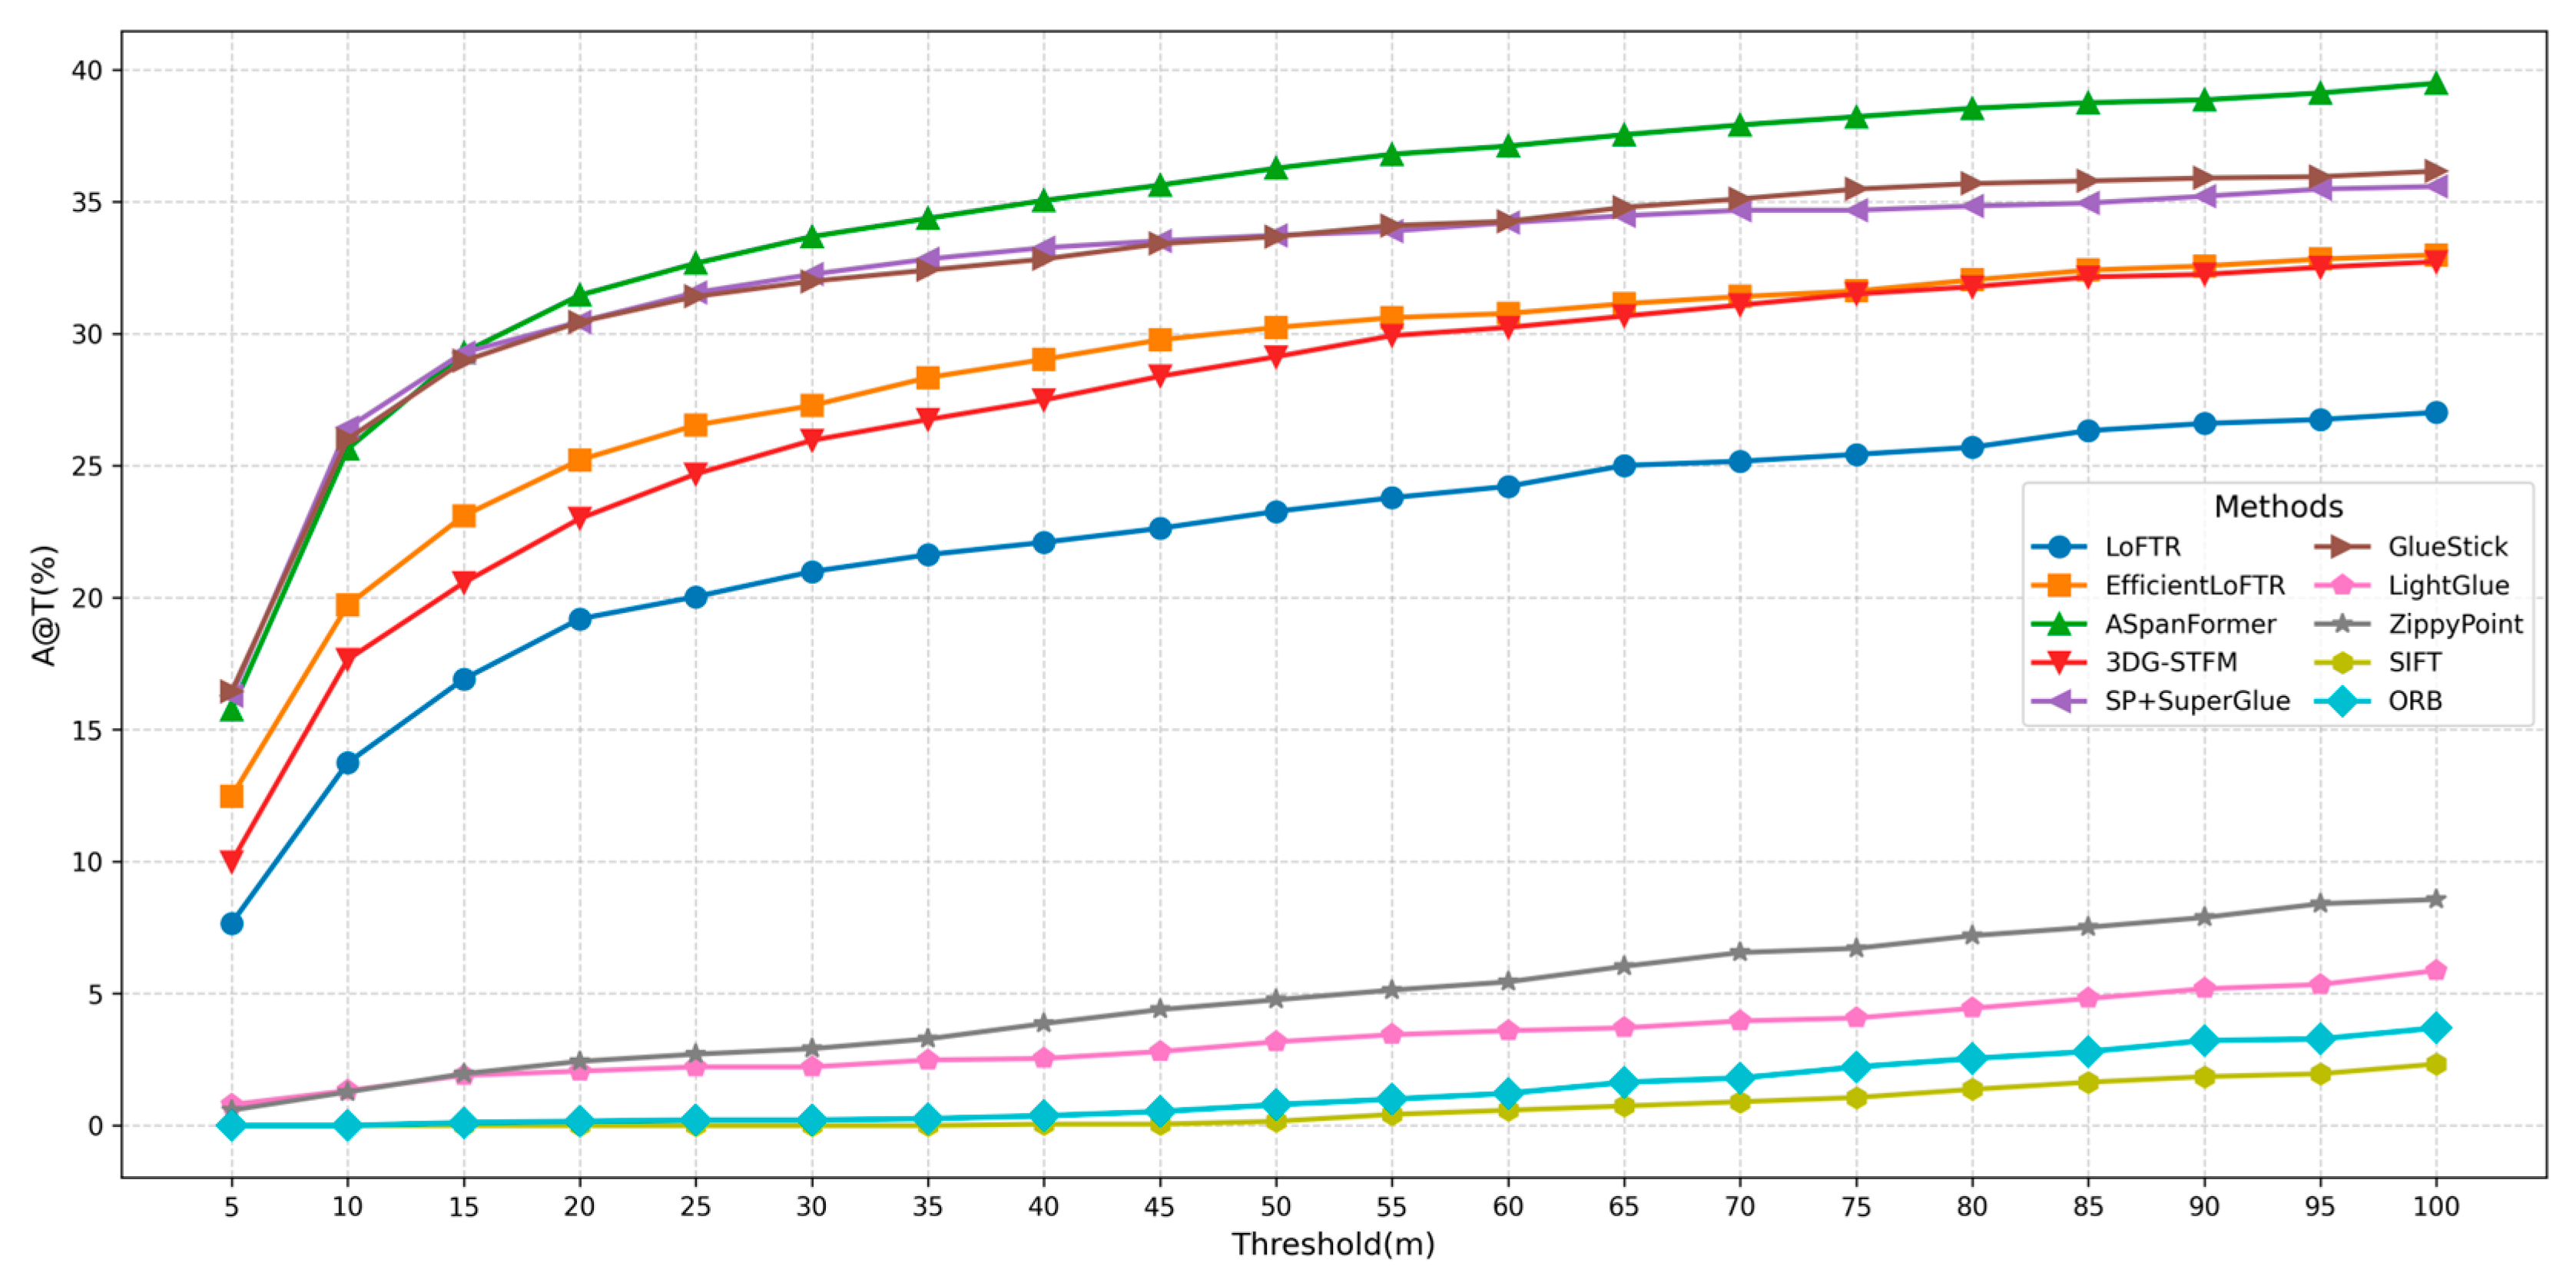
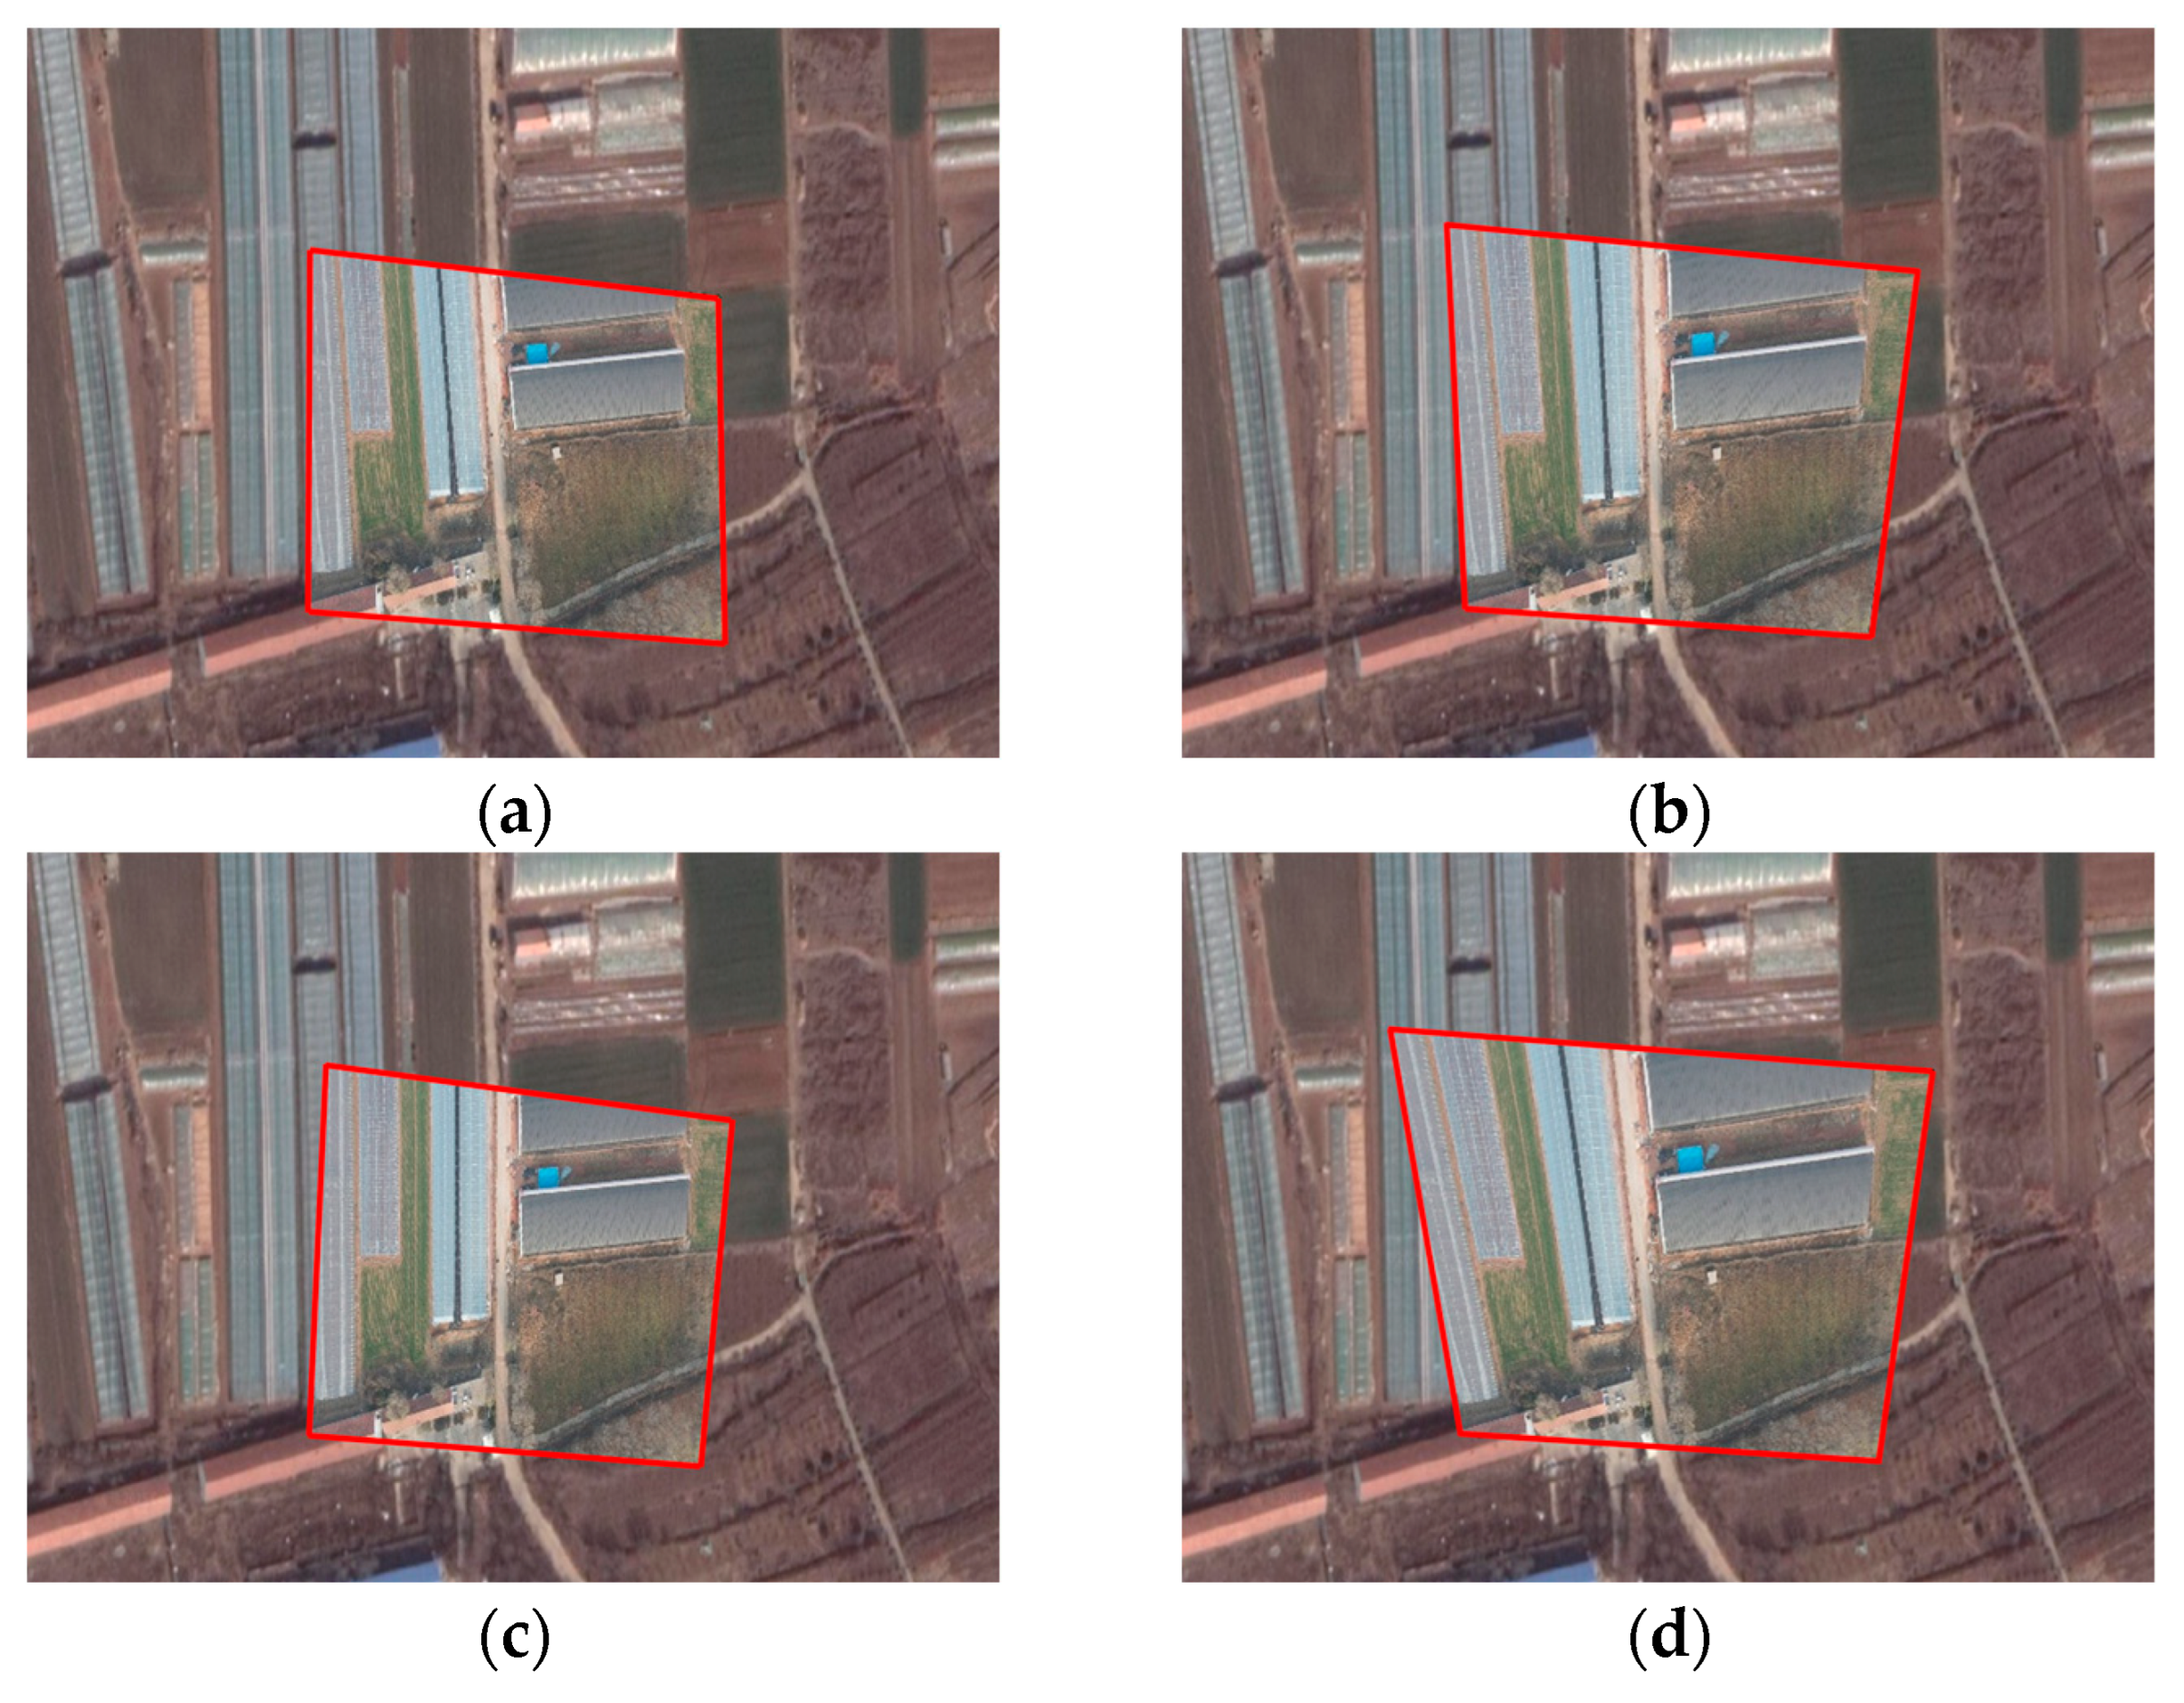
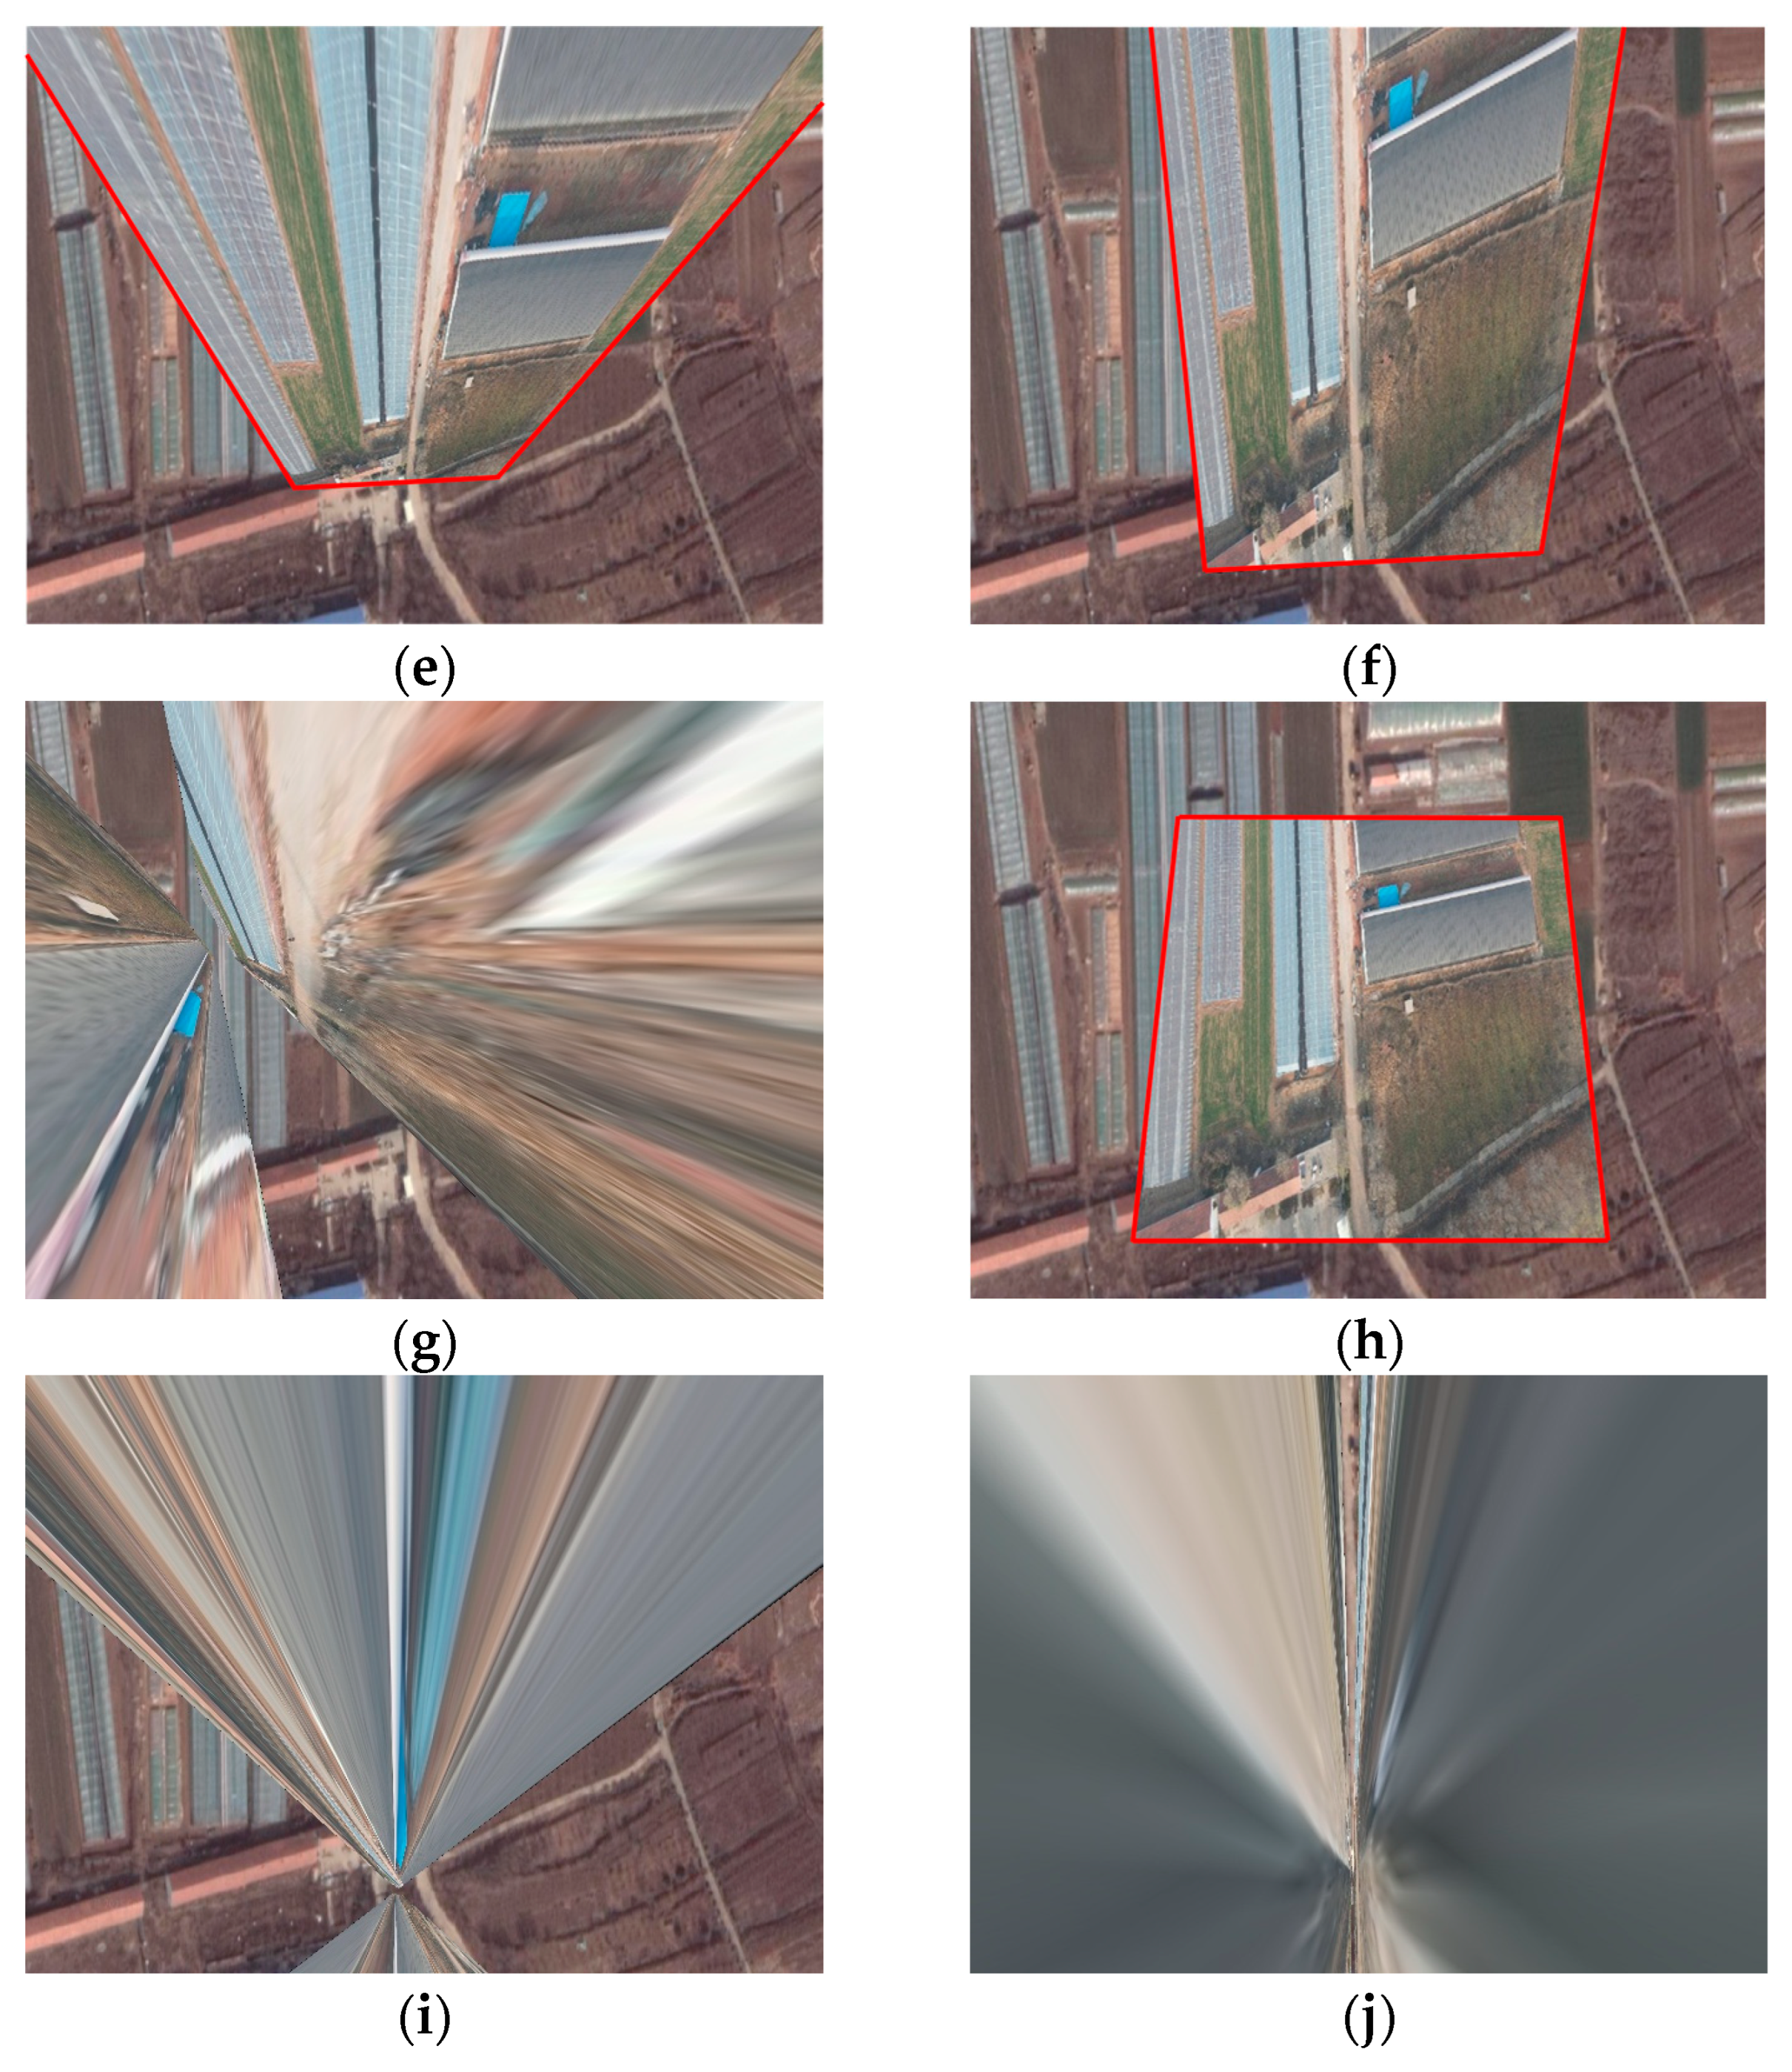
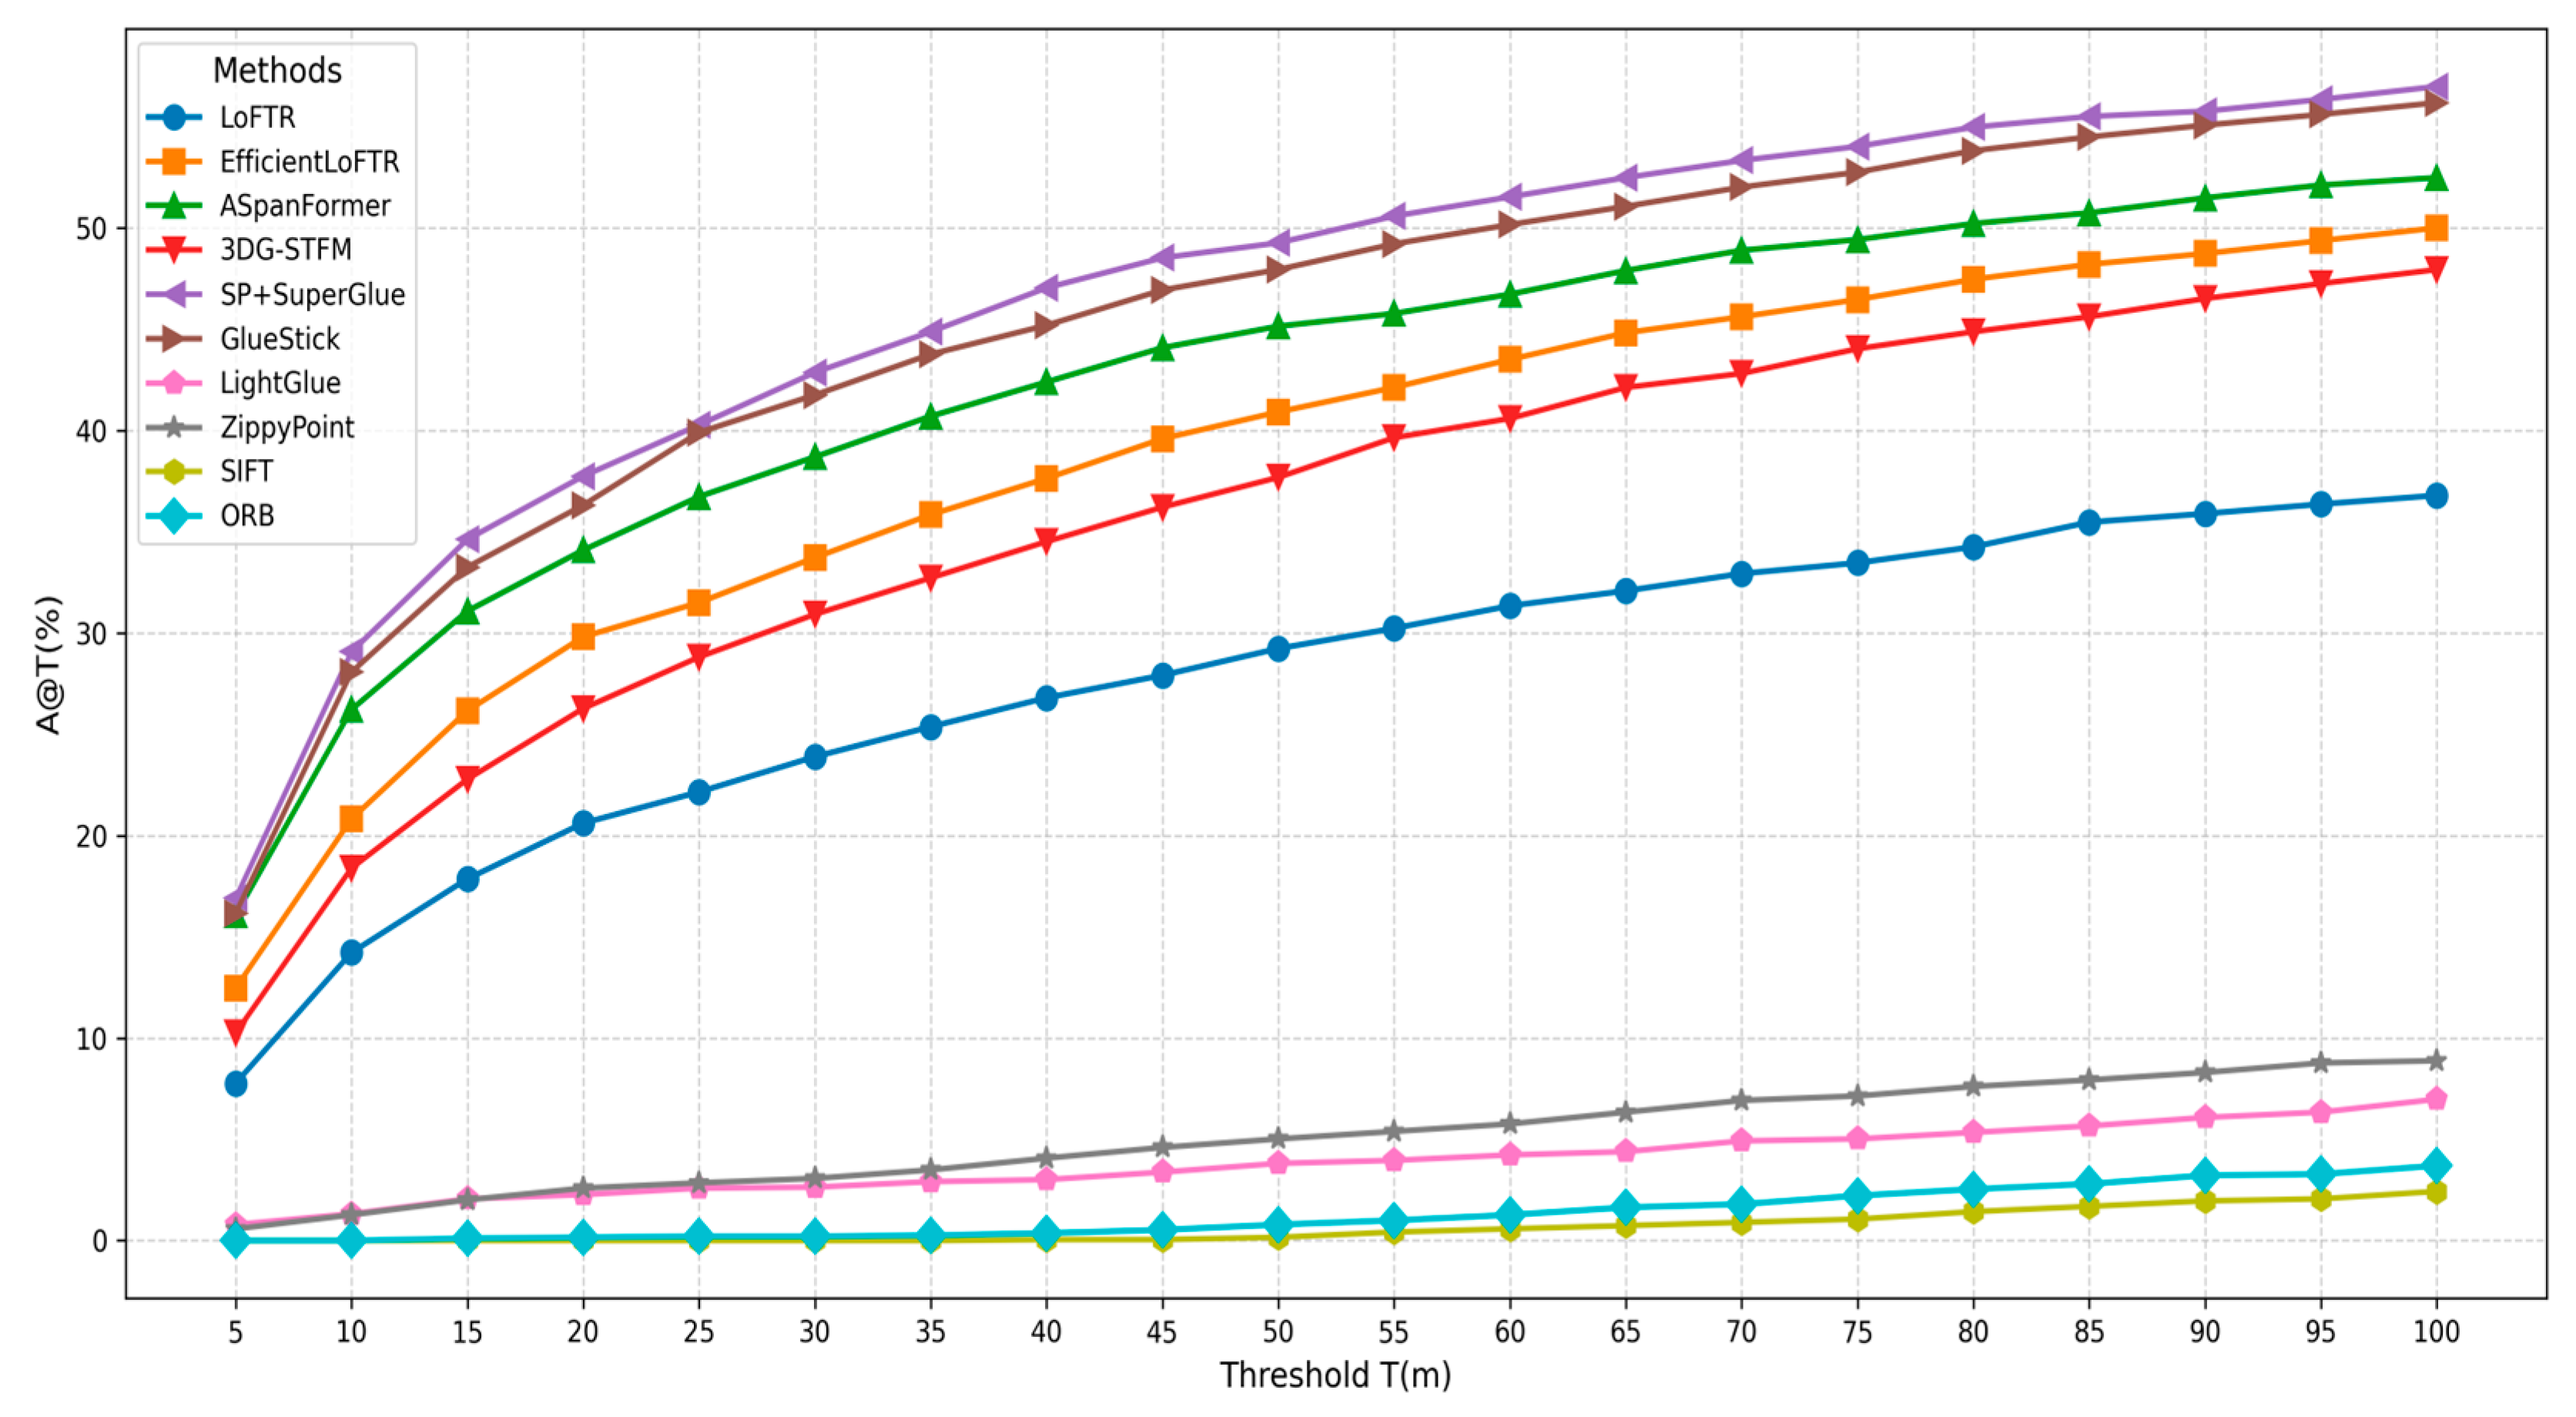
The matching and localization performances of the aforementioned algorithms were evaluated across the full range of tilt angles 0 ° , 90 ° in the MTA-dataset. The comparison of A @ T is presented in Figure 6, and the comparison of matching is visualized in Figure 7.
The experimental results demonstrate that ASpanFormer, SP + SuperGlue, GlueStick, EfficientLoFTR, and 3DG-STFM exhibit superior accuracy in multi-tilt-angle scenarios. Conversely, LoFTR, ZippyPoint, LightGlue, ORB, and SIFT show relative performance degradation under these conditions. Specifically, there can be spatial variance in the refinement process of LoFTR, which is caused by the entire correlation with redundant noisy features. ZippyPoint adopts a lightweight strategy that strikes a balance between inference speed and precision, which inherently compromises its overall accuracy. Similarly, LightGlue can aggregate contextual information and filter out potentially unmatchable features, and it may misinterpret these valid but distorted correspondences as noise, reduce the stability, and degrade the performance in large-tilt-angle scenarios. Regarding traditional methods, ORB employs binary descriptors to achieve high storage and matching efficiency, and it often exhibits insufficient discriminative power in large-tilt-angle scenarios, leading to an increased mismatch. Moreover, SIFT is a full-scale invariant but is not designed to cover the entire affine space; thus, its performance drops quickly under substantial tilt-angle changes.

4.3. Performance Analysis Across Varying Tilt-Angle Ranges

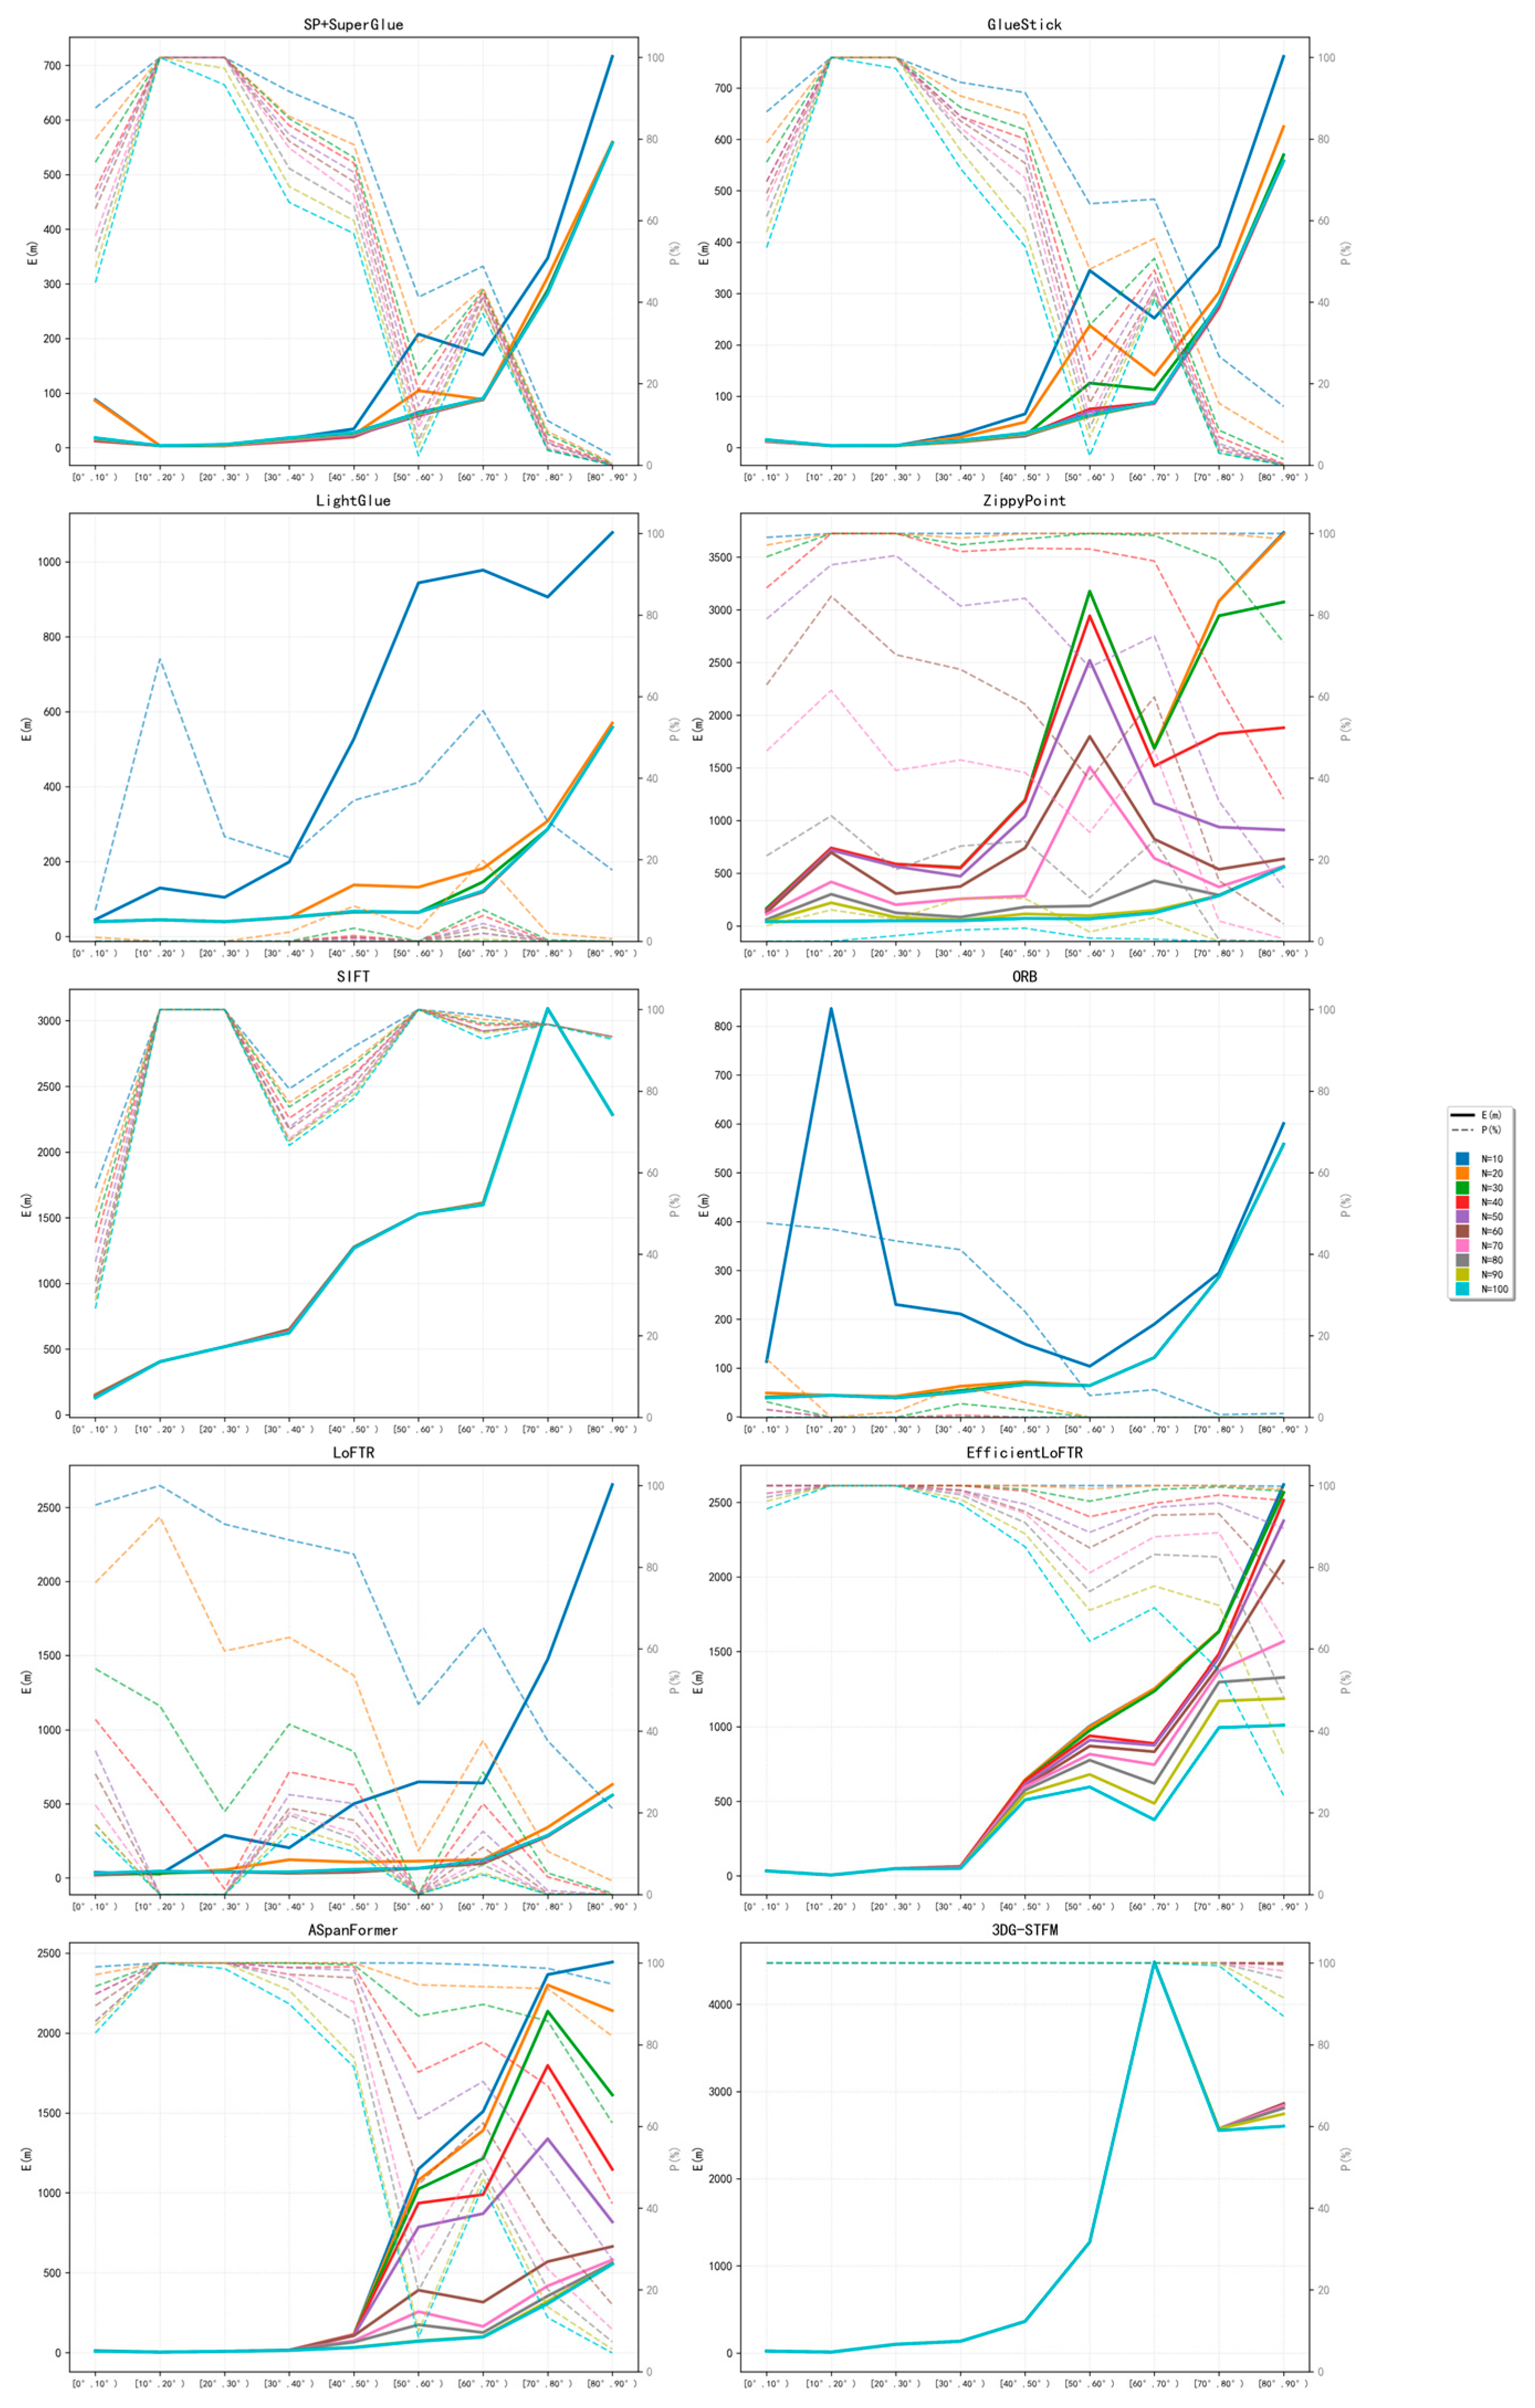
To evaluate matching performance under different perspective distortions, we statistically analyzed E [ a ° , b ° ) | n and P [ a ° , b ° ) | n for the evaluated methods across various tilt-angle intervals. As illustrated in Figure 8, when the threshold n is set too low, most algorithms exhibit abnormally high E [ a ° , b ° ) | n in specific intervals. This indicates that setting n too low is equivalent to assuming that the matching and location derived from a small number of feature matches are reliable. In fact, this approach is not robust and can lead to evaluation distortions. As n increases from 30 to higher values, E [ a ° , b ° ) | n for most algorithms across various tilt angles remains relatively stable. This suggests that n = 3 0 is sufficient to constrain the evaluation distortion caused by insufficient matching points. Furthermore, increasing n beyond this point does not materially alter the overall trend or characteristics of the error curves; instead, it causes a sharp decline in P [ a ° , b ° ) | n , which tends to overshadow the inherent performance differences between the algorithms. Therefore, to ensure both stability and discriminative fairness in the comparative analysis n = 30 is adopted as the evaluation benchmark in this study.
The quantitative results are presented in Table 6 and Table 7.
Experimental results demonstrate that, as the UAV tilt angle increases within the range of 0 ° , 90 ° , although the expanding field of view provides richer contextual information, the localization errors of all methods increase significantly and matching precision drops sharply due to severe geometric distortions in far-field regions and interference from redundant background information, with performance deteriorating most drastically in the 50 ° , 90 ° range.
Specifically, within the 0 ° , 10 ° tilt-angle range, the E [ a ° , b ° ) | 30 values for all evaluated methods exceed 5 m, while the P [ a ° , b ° ) | 30 metrics for 60% of these methods remain below 75%. This performance degradation is primarily attributable to the restricted field of view afforded by low-altitude and near-nadir perspectives. Such imaging constraints often lead to image pairs dominated by textureless surfaces, repetitive patterns, or transient land cover inconsistencies, all of which present significant challenges for reliable feature correspondence.
Within the 10 ° , 50 ° tilt-angle range, the P [ a ° , b ° ) | 30 metrics for most evaluated methods exceed 75%, with only a few exceptions; the E [ 10 ° , 30 ° ) | 30 values for most approaches remain below 100 m. This sustained performance can be attributed to the expanding field of view, which provides more contextual information while maintaining clear textural details, despite the onset of geometric distortions in the distant regions of the image. Furthermore, as the images in this range do not yet encompass the excess peripheral background, the discriminative features remain relatively undisturbed by irrelevant or redundant information, facilitating a more robust matching.
Within the 50 ° , 90 ° tilt-angle range, the matching performance of all evaluated methods deteriorates significantly, often failing to establish valid correspondences. Specifically, the E [ a ° , b ° ) | n values for all methods generally exceed 100 m, while the P [ a ° , b ° ) | n metrics for LoFTR, SP + SuperGlue, and GlueStick decline by more than 30%.
An analysis of the matching results reveals that this degradation is primarily driven by two factors related to spatial resolutions and geometric distortion. First, far-field regions in large-tilt UAV images exhibit significant texture blurring and severe geometric distortions. These degradations hinder the extraction of repeatable feature points and discriminative descriptors. Second, the expanding FOV introduces an influx of redundant regions with disparate spatial resolutions, which introduces substantial noise into the matching process. Given that the nadir-view satellite imagery maintains a uniform and fixed resolution, the resolution inconsistency between the cross-view images complicates feature correspondence even for the most robust descriptors.

5. Spatial-Resolution-Based Cropping and Matching Experiments

5.1. Implementation Details

To mitigate these resolution-related degradations, we implement a spatial-resolution-based cropping strategy for images captured at tilt angles within 50 ° , 90 ° . This approach aims to suppress interference from redundant, high-resolution image regions and enhance matching reliability by maintaining more consistent UAV–satellite image pairs.
Based on the ground footprint of the UAV’s field of view, we calculate the post-imaging spatial resolutions at varying positions along the vertical FOV axes, denoted as L v 1 and L v 2 . The UAV image regions where the spatial resolution falls below a predefined threshold are systematically cropped and preserved. Correspondingly, the relevant portions of the satellite map are cropped to ensure a precise spatial alignment with the processed UAV images. To prevent the loss of valid information due to overly restrictive thresholds, we enforce a constraint requiring the retained area to constitute at least 25% of the original image dimensions.
The experimental procedure was conducted as follows: First, we established a sequence of spatial resolution thresholds, K (measured in units of 0.3 m, corresponding to the spatial resolution of satellite map), specifically K of 0.9, 1.2, 1.8, 2.4, 2.7, 3.0, 3.3, 3.6, and 3.9. To serve as a baseline, a control group was formed using the aforementioned full-field-of-view (Full-FOV) cropping strategy ( K   =   inf ). Second, UAV–satellite image pairs within the tilt-angle range of 50 ° , 90 ° were cropped according to these diverse threshold settings to generate preprocessed inputs. Finally, matching analysis was performed on each threshold-specific result using the widely adopted SP + SuperGlue baseline. The optimal cropping threshold was identified as the value of K that minimized the metric E [ a ° , b ° ) | n . All other preprocessing steps, experimental configurations, and hardware environments remained consistent with the previous benchmarks to ensure a fair comparison.

5.2. Parameter Evaluation

The objective of this parameter evaluation is to identify the optimal spatial resolution threshold K that balances geometric fidelity with texture richness across varying imaging geometries. As the UAV’s tilt angle increases, the perspective distortion intensifies, leading to a non-uniform resolution across the image. Consequently, a static threshold is insufficient for all scenarios.
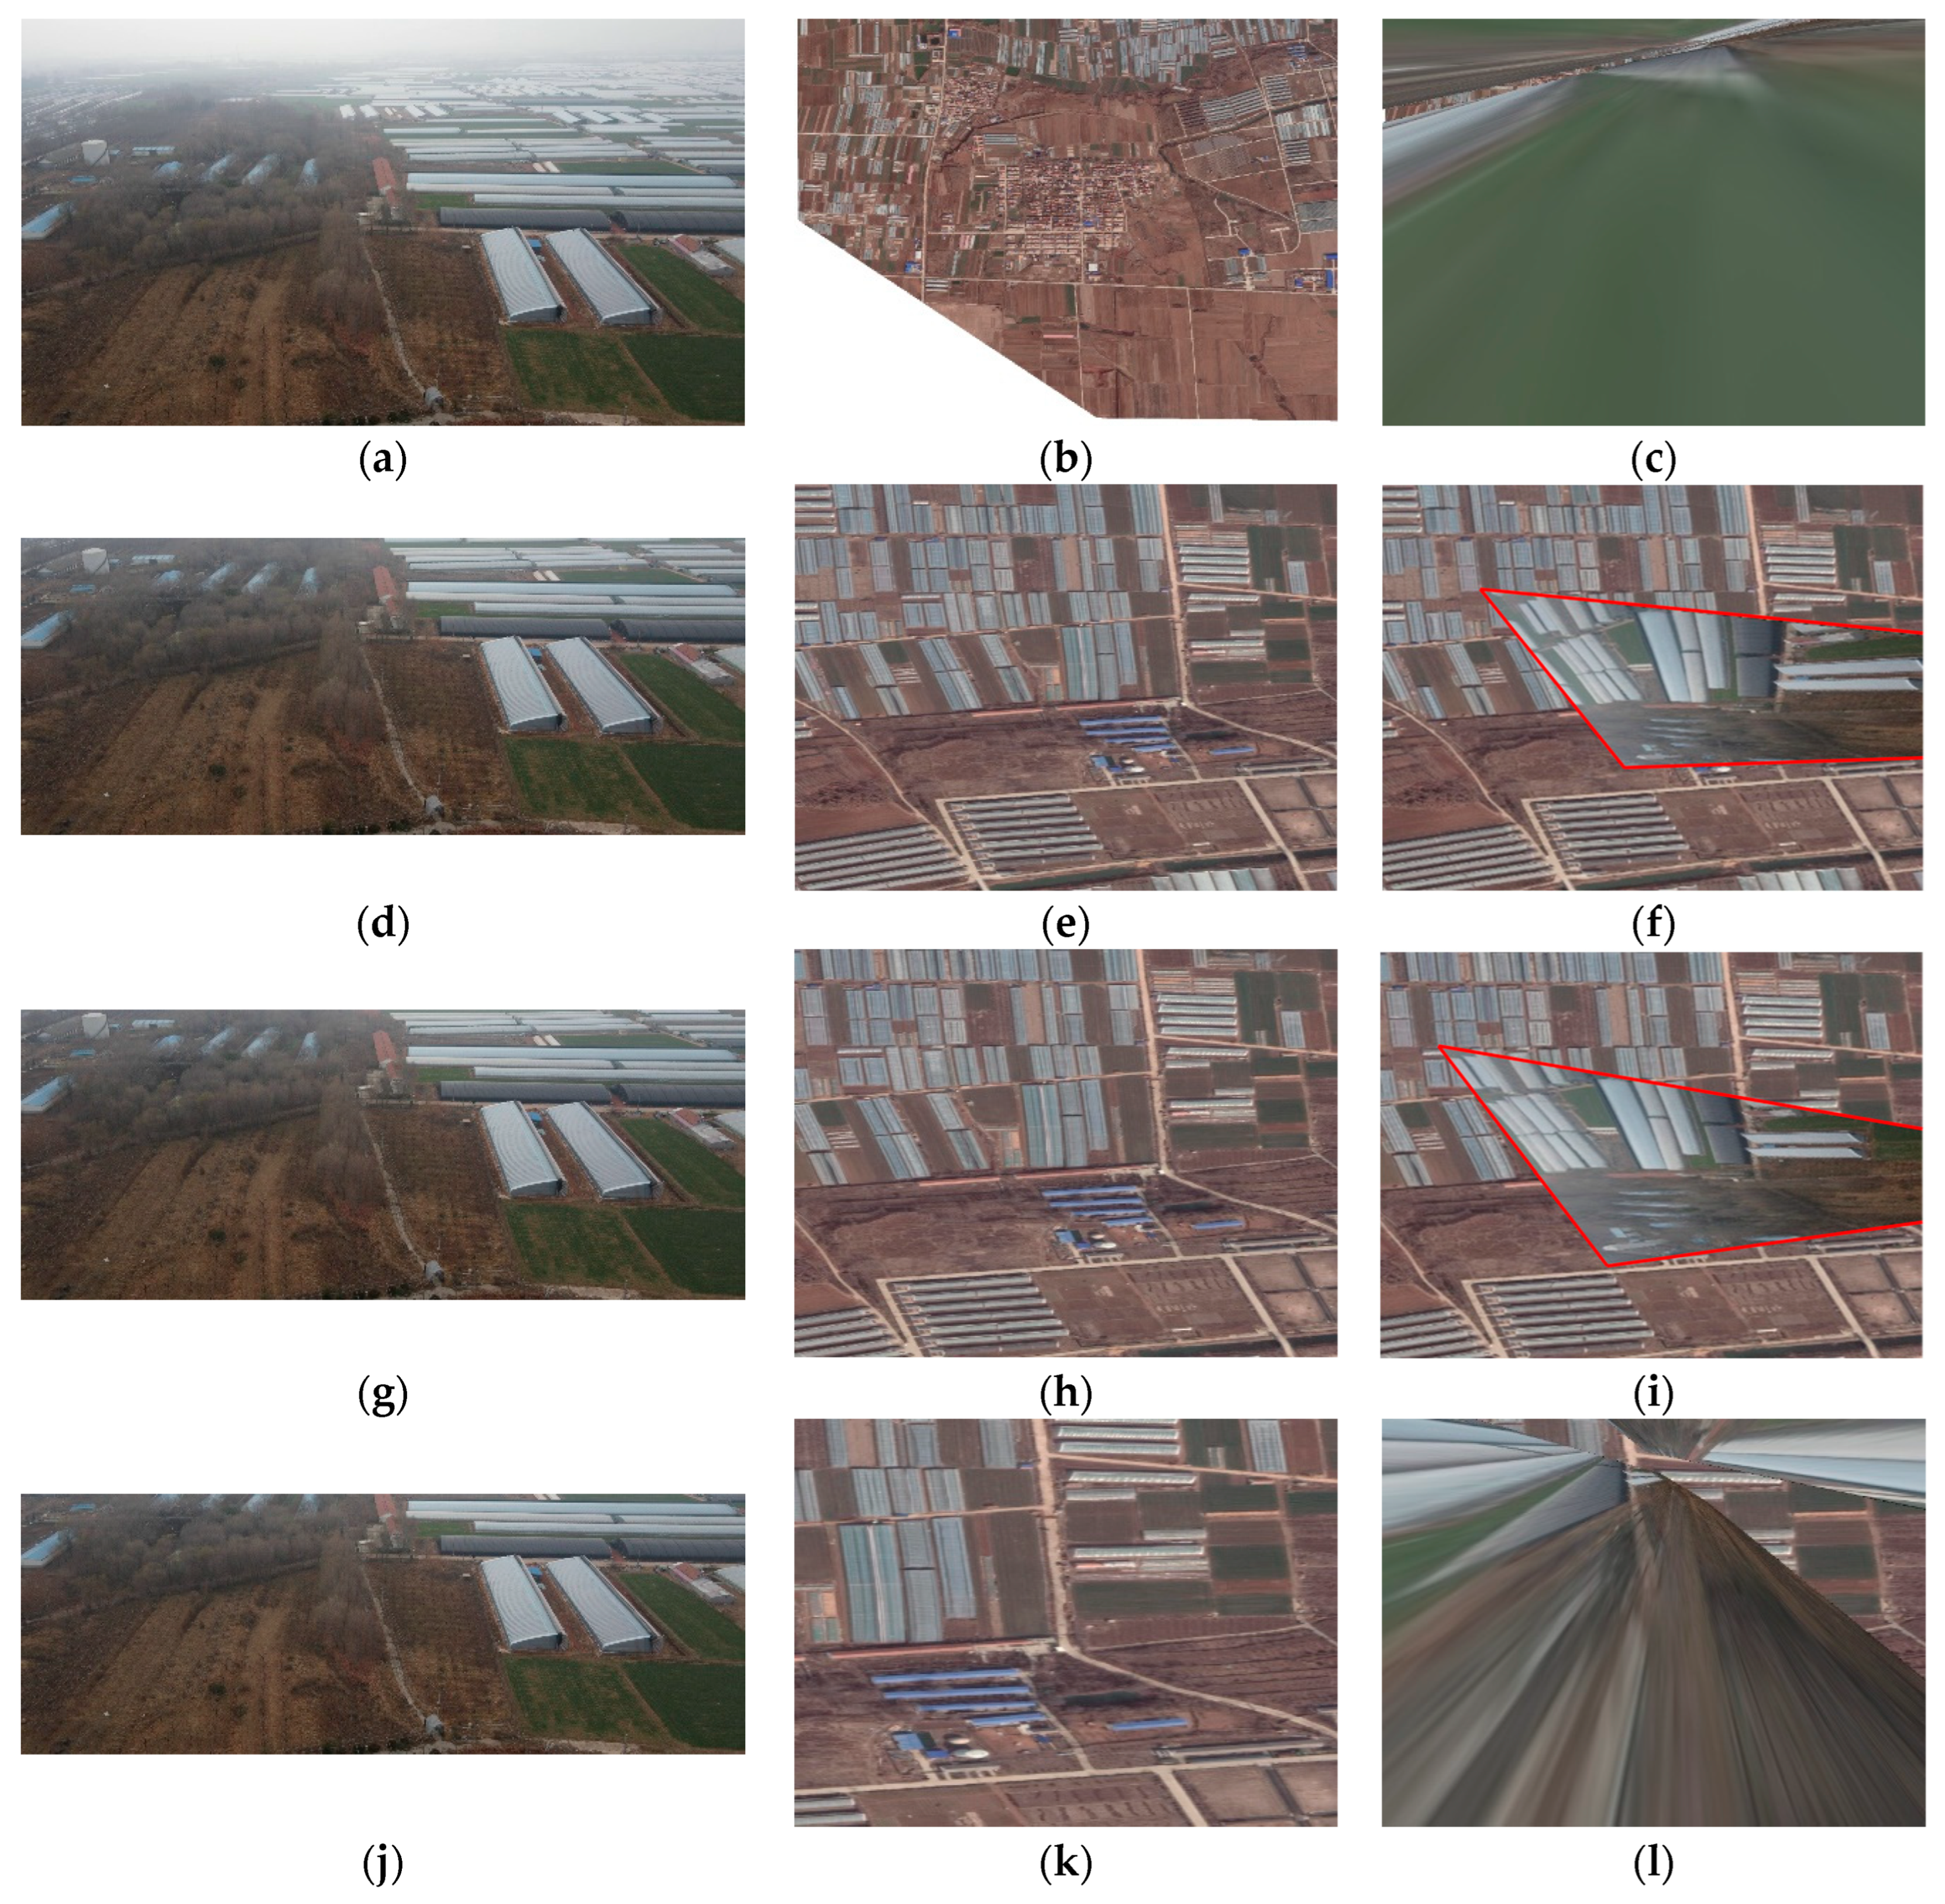
Figure 9 provides a qualitative visualization of how these thresholds reformulate the image pairs and affect matching performance.
Without resolution-based cropping, as shown in Figure 9a–c, the inclusion of extreme-oblique regions introduces severe stretching and compression, often leading to a high density of outlier matches or total registration failure. By systematically removing regions with a low spatial resolution, the model retains only the high-consistency areas, often leading to successful registration as shown in Figure 9d–f and in Figure 9g–i. While smaller thresholds, as shown in Figure 9j–l, maximize local resolution, they may occasionally result in an insufficient search area for texture-sparse regions and registration failure.
To determine the final thresholds with methodological transparency, we analyzed the statistical correlation between the threshold K and the average localization error E [ a ° , b ° ) | 30 , as summarized in Table 8. The selection process followed a minimum-error criterion: for each tilt-angle interval, the value of K that yielded the lowest average localization error was designated as the optimal operational threshold.
The empirical results reveal the following clear trend:
  • Low tilt angles 50 ° , 60 ° : Smaller K values performed better. In these ranges, the perspective distortion is relatively manageable, allowing for aggressive cropping to retain only the highest-resolution regions near the nadir point.
  • High tilt angles 70 ° , 90 ° : The optimal K shifts toward larger values. This suggests that, at an extreme oblique view, overly restrictive thresholds (small K ) might discard a high amount of discriminative texture information, whereas a slightly relaxed threshold preserves sufficient context for the SP + SuperGlue matcher to find stable correspondences.
  • Near-nadir ranges 0 ° , 50 ° : Since geometric distortions are negligible in this interval, the Full-FOV cropping strategy ( K = ) remains the most effective, as it provides the maximum available information without the need for resolution-based filtering.
Based on this quantitative analysis, the final thresholds were fixed as follows: K = 1.2 for 50 ° , 60 ° , K = 2.7 for 60 ° , 70 ° , K = 3.6 for 70 ° , 80 ° , and K = 2.4 for 80 ° , 90 ° . These refined image pairs were subsequently utilized as direct inputs for the subsequent comparative matching analysis.

5.3. Cropping Strategy Comparison

This experiment provides a comparative analysis of the matching and localization performance for the ten aforementioned methods under various cropping strategies, as illustrated in Figure 10.
Compared to the results obtained using the Full-FOV cropping strategy, the proposed spatial-resolution-based strategy generally enhances the matching and localization performance across most evaluated methods. To further investigate this effect under varying geometric distortions, we conducted a statistical analysis of E [ a ° , b ° ) | 30 and P [ a ° , b ° ) | 30 across four tilt-angle intervals. The comparison between Full-FOV and spatial-resolution-based strategies are presented in Table 9 and Table 10.
The experiment reveals that the proposed spatial-resolution-based strategy significantly outperforms the Full-FOV strategy across most evaluated methods. According to the results, SP + SuperGlue and GlueStick demonstrated substantial enhancements across both P [ a ° , b ° ) | 30 and E [ a ° , b ° ) | 30 . The average matching localization errors of SP + SuperGlue within the tilt-angle ranges of 50 ° , 60 ° , 60 ° , 70 ° , 70 ° , 80 ° , and 80 ° , 90 ° are reduced by 33.49 m, 37.86 m, 98.30 m, and 109.95 m, respectively. EfficientLoFTR, ASpanFormer, 3DG-STFM, and ZippyPoint exhibited significant improvements in E [ a ° , b ° ) | 30 , albeit with a slight decrease in P [ a ° , b ° ) | 30 . LoFTR, LightGlue, ORB, and SIFT underperform regardless of the strategy used and have been analyzed previously.
The performance enhancement is rooted in the mitigation of feature and spatial resolution disparity by retaining more consistent image regions. Compared with the proposed spatial-resolution-based strategy, the Full-FOV strategy forces the algorithm to process regions with vastly different spatial resolutions and severe geometric distortions. By incorporating our strategy, the feature matching process achieves significantly higher consistency and robustness rather than being overwhelmed by redundant image regions. In summary, the proposed spatial-resolution-based cropping strategy significantly enhances the UAV–satellite image matching in multi-tilt-angle scenarios.

6. Discussion

In this study, we propose a multiple-tilt-angle dataset and provide an extensive evaluation of representative image matching algorithms, which reveals that most methods exhibit high matching success rates and minimal localization errors in the 0 ° , 50 ° range, and the transition to extreme-tilt perspectives triggers a sharp decline in performance.
A critical finding of our research is the nature of expanding FOV in UAV–satellite image matching. Theoretically, a larger FOV can provide richer contextual information. However, in large-tilt-angle scenarios, this benefit is overshadowed by two major factors: First, far-field regions in UAV images with high spatial resolutions exhibit significant texture blurring and geometric distortions. These degradations hinder the extraction of repeatable feature points and discriminative descriptors. Second, the inclusion of redundant regions with disparate resolutions introduces substantial noise to the matching process. Since the nadir-view satellite imagery has a uniform and fixed resolution, the inconsistency between the UAV and satellite images complicates feature correspondence for even the most robust descriptors.
To mitigate these issues, our proposed spatial-resolution-based cropping strategy offers a practical solution. The experimental results validate that the proposed spatial-resolution-based cropping strategy is more effective than the Full-FOV cropping strategy in multi-tilt-angle scenarios. By integrating our strategy, the SuperPoint + SuperGlue baseline showed a drastic error reduction in the tilt-angle ranges of 50 ° , 60 ° , 60 ° , 70 ° , 70 ° , 80 ° , and 80 ° , 90 ° , and the average localization error E [ a ° , b ° ) | 30 were reduced by 33.49 m, 37.86 m, 98.3 m, and 109.95 m, respectively.
Despite these advancements, certain limitations remain. The current spatial resolution threshold K was determined through a systematic grid search rather than a dynamic theoretical model. While effective for the MTA-Dataset, its stability across varying terrains requires further analysis. As all UAV images were collected from a single geographic region during the same season, the dataset’s radiometric diversity is restricted. Future research will focus on optimizing data diversity and distribution across tilt-angle intervals and developing adaptive cropping methods based on real-time observations, to satisfy a wider range of research demands.

7. Conclusions

In this study, we addressed the critical challenges of UAV–satellite image matching in multi-tilt-angle scenarios by introducing the MTA-Dataset and a novel spatial-resolution-based cropping strategy. Our findings reveal that, while a larger field of view theoretically offers richer contextual information, the intensification of perspective distortions and radiometric discrepancies at extreme tilt angles, particularly in the 50 ° , 90 ° range, leads to a significant performance plateau for most state-of-the-art matching algorithms. We systematically demonstrated that far-field geometric stretching and resolution inconsistencies are the primary contributors to localization failure. By implementing the proposed cropping strategy, which filters the redundant background and preserves the high-consistency image regions, we achieved a substantial improvement in matching robustness. Specifically, the localization errors of the SuperPoint + SuperGlue baseline were significantly reduced across all extreme-tilt intervals, with a maximum reduction of 109.95 m observed in the 80 ° , 90 ° range. This research not only fills a crucial data gap with the MTA-Dataset and its five-point high-precision annotations but also provides a comprehensive evaluation framework and a practical preprocessing paradigm for autonomous UAV navigation and environmental perception in complex, wide-angle operational environments. Future research will aim at enhancing the dataset’s radiometric diversity and developing adaptive and real-time preprocessing methods to further improve cross-view registration accuracy.

Author Contributions

Conceptualization, L.J.; methodology, G.W. and K.H.; validation, Q.L.; formal analysis, L.J.; investigation, Q.L.; resources, L.J., G.W. and H.S.; data curation, G.L.; writing—original draft preparation, Q.L.; writing—review and editing, L.J., G.W., K.H. and H.S.; visualization, G.L.; supervision, L.J., G.W., K.H. and H.S.; project administration, L.J., G.W., K.H. and H.S. All authors have read and agreed to the published version of the manuscript.

Funding

This research received no external funding.

Institutional Review Board Statement

Not applicable.

Informed Consent Statement

Not applicable.

Data Availability Statement

The original data presented in the study are openly available in the MTA-Dataset at https://github.com/Feiker123/MTA-Dataset.git (accessed on 13 January 2026). The dataset is released under the MIT license.

Conflicts of Interest

Authors Qifei Liu, Guoqiang Wu, Kun Huang, Haohui Sun and Gengchen Liu were employed by the company Aerospace Times FeiHong Technology Corporation. Author Liang Jiang was employed by the company China Aerospace Science and Technology Corporation. Authors Guoqiang Wu, Kun Huang, Haohui Sun and Gengchen Liu were employed by the company China Aerospace Science and Technology Corporation the 9th Academy Unmanned System Center and the company China Aerospace Science and Technology Corporation Intelligent Unmanned System Overall Technology Research and Development Center. All authors declare that the research was conducted in the absence of any commercial or financial relationships that could be construed as a potential conflict of interest.

References

  1. Liao, Y.; Su, J.; Ma, D.; Niu, C. UAV-Satellite Cross-View Image Matching Based on Adaptive Threshold-Guided Ring Partitioning Framework. Remote Sens. 2025, 17, 2448. [Google Scholar] [CrossRef]
  2. He, Q.; Xu, A.; Zhang, Y.; Ye, Z.; Zhou, W.; Xi, R.; Lin, Q. A Contrastive Learning Based Multiview Scene Matching Method for UAV View Geo-Localization. Remote Sens. 2024, 16, 3039. [Google Scholar] [CrossRef]
  3. Singh, P.K.; Sharma, A. An intelligent WSN-UAV-based IoT framework for precision agriculture application. Comput. Electr. Eng. 2022, 100, 107912. [Google Scholar] [CrossRef]
  4. Khan, A.; Gupta, S.; Gupta, S.K. Emerging UAV technology for disaster detection, mitigation, response, and preparedness. J. Field Robot. 2022, 39, 905–955. [Google Scholar] [CrossRef]
  5. Zhou, Y. Unmanned aerial vehicles based low-altitude economy with lifecycle techno-economic-environmental analysis for sustainable and smart cities. J. Clean. Prod. 2025, 499, 145050. [Google Scholar] [CrossRef]
  6. Liu, K.; Chen, B.M. Industrial UAV-based unsupervised domain adaptive crack recognitions: From database towards real-site infrastructural inspections. IEEE Trans. Ind. Electron. 2022, 70, 9410–9420. [Google Scholar] [CrossRef]
  7. Xu, C.; Liu, C.; Li, H.; Ye, Z.; Sui, H.; Yang, W. Multiview Image Matching of Optical Satellite and UAV Based on a Joint Description Neural Network. Remote Sens. 2022, 14, 838. [Google Scholar] [CrossRef]
  8. Wang, B.; Wang, S.; Han, Y.; Xu, L.; Ye, D. LiteSAM: Lightweight and Robust Feature Matching for Satellite and Aerial Imagery. Remote Sens. 2025, 17, 3349. [Google Scholar] [CrossRef]
  9. Li, J.; Sun, Y.; Xiang, Y.; Lei, L. One-to-Many Retrieval Between UAV Images and Satellite Images for UAV Self-Localization in Real-World Scenarios. Remote Sens. 2025, 17, 3045. [Google Scholar] [CrossRef]
  10. Xu, W.; Yao, Y.; Cao, J.; Wei, Z.; Liu, C.; Wang, J.; Peng, M. Uav-visloc: A large-scale dataset for uav visual localization. arXiv 2024, arXiv:2405.11936. [Google Scholar]
  11. Zhou, X.; Zhang, X.; Yang, X.; Zhao, J.; Liu, Z.; Shuang, F. Towards UAV Localization in GNSS-Denied Environments: The SatLoc Dataset and a Hierarchical Adaptive Fusion Framework. Remote Sens. 2025, 17, 3048. [Google Scholar] [CrossRef]
  12. Ding, L.; Zhou, J.; Meng, L.; Long, Z. A Practical Cross-View Image Matching Method between UAV and Satellite for UAV-Based Geo-Localization. Remote Sens. 2021, 13, 47. [Google Scholar] [CrossRef]
  13. Jiang, S.; Jiang, W. On-Board GNSS/IMU Assisted Feature Extraction and Matching for Oblique UAV Images. Remote Sens. 2017, 9, 813. [Google Scholar] [CrossRef]
  14. Zheng, Z.; Wei, Y.; Yang, Y. University-1652: A multi-view multi-source benchmark for drone-based geo-localization. In Proceedings of the 28th ACM International Conference on Multimedia, Seattle, WA, USA, 12–16 October 2020; Association for Computing Machinery: New York, NY, USA, 2020; pp. 1395–1403. [Google Scholar]
  15. Zhu, R.; Yin, L.; Yang, M.; Wu, F.; Yang, Y.; Hu, W. SUES-200: A multi-height multi-scene cross-view image benchmark across drone and satellite. IEEE Trans. Circuits Syst. Video Technol. 2023, 33, 4825–4839. [Google Scholar] [CrossRef]
  16. Schleiss, M.; Rouatbi, F.; Cremers, D. VPAIR—Aerial Visual Place Recognition and Localization in Large-scale Outdoor Environments. arXiv 2022, arXiv:2205.11567. [Google Scholar]
  17. Dai, M.; Zheng, E.; Feng, Z.; Qi, L.; Zhuang, J.; Yang, W. Vision-based UAV self-positioning in low-altitude urban environments. IEEE Trans. Image Process. 2023, 33, 493–508. [Google Scholar] [CrossRef] [PubMed]
  18. Ji, Y.; He, B.; Tan, Z.; Wu, L. Game4loc: A uav geo-localization benchmark from game data. In Proceedings of the AAAI Conference on Artificial Intelligence, Philadelphia, PA, USA, 25 February–4 March 2025; AAAI Press: Palo Alto, CA, USA, 2025; Volume 39, pp. 3913–3921. [Google Scholar]
  19. Ye, Y.; Teng, X.; Chen, S.; Li, Z.; Liu, L.; Yu, Q.; Tan, T. Exploring the best way for UAV visual localization under Low-altitude Multi-view Observation Condition: A Benchmark. arXiv 2025, arXiv:2503.10692. [Google Scholar]
  20. Lowe, D.G. Distinctive image features from scale-invariant keypoints. Int. J. Comput. Vis. 2004, 60, 91–110. [Google Scholar] [CrossRef]
  21. Rublee, E.; Rabaud, V.; Konolige, K.; Bradski, G. ORB: An efficient alternative to SIFT or SURF. In Proceedings of the 2011 International Conference on Computer Vision, Barcelona, Spain, 6–13 November 2011; IEEE: Piscataway, NJ, USA, 2011; pp. 2564–2571. [Google Scholar]
  22. Liu, G.; Li, Z.; Gao, Q.; Yuan, Y. SAVL: Scene-Adaptive UAV Visual Localization Using Sparse Feature Extraction and Incremental Descriptor Mapping. Remote Sens. 2025, 17, 2408. [Google Scholar] [CrossRef]
  23. Zhang, X.; He, Z.; Ma, Z.; Wang, Z.; Wang, L. LLFE: A Novel Learning Local Features Extraction for UAV Navigation Based on Infrared Aerial Image and Satellite Reference Image Matching. Remote Sens. 2021, 13, 4618. [Google Scholar] [CrossRef]
  24. DeTone, D.; Malisiewicz, T.; Rabinovich, A. Superpoint: Self-supervised interest point detection and description. In Proceedings of the IEEE Conference on Computer Vision and Pattern Recognition Workshops, Salt Lake City, UT, USA, 18–22 June 2018; IEEE: Piscataway, NJ, USA, 2018; pp. 224–236. [Google Scholar]
  25. Sarlin, P.E.; DeTone, D.; Malisiewicz, T.; Rabinovich, A. Superglue: Learning feature matching with graph neural networks. In Proceedings of the IEEE/CVF Conference on Computer Vision and Pattern Recognition, Virtual, 16–20 June 2020; IEEE: Piscataway, NJ, USA, 2020; pp. 4938–4947. [Google Scholar]
  26. Phototourism Challenge, CVPR 2019 Image Matching Workshop. Available online: https://image-matching-workshop.github.io (accessed on 8 November 2019).
  27. Chen, H.; Luo, Z.; Zhou, L.; Tian, Y.; Zhen, M.; Fang, T.; Mckinnon, D.; Tsin, Y.; Quan, L. Aspanformer: Detector-free image matching with adaptive span transformer. In Proceedings of the European Conference on Computer Vision, Tel Aviv, Israel, 23–27 October 2022; Springer Nature: Cham, Switzerland, 2022; pp. 20–36. [Google Scholar]
  28. Li, Z.; Snavely, N. Megadepth: Learning single-view depth prediction from internet photos. In Proceedings of the IEEE Conference on Computer Vision and Pattern Recognition, Salt Lake City, UT, USA, 18–22 June 2018; IEEE: Piscataway, NJ, USA, 2018; pp. 2041–2050. [Google Scholar]
  29. Pautrat, R.; Suárez, I.; Yu, Y.; Pollefeys, M.; Larsson, V. Gluestick: Robust image matching by sticking points and lines together. In Proceedings of the IEEE/CVF International Conference on Computer Vision, Paris, France, 2–6 October 2023; IEEE: Piscataway, NJ, USA, 2023; pp. 9706–9716. [Google Scholar]
  30. Lindenberger, P.; Sarlin, P.E.; Pollefeys, M. Lightglue: Local feature matching at light speed. In Proceedings of the IEEE/CVF International Conference on Computer vision, Paris, France, 2–6 October 2023; IEEE: Piscataway, NJ, USA, 2023; pp. 17627–17638. [Google Scholar]
  31. Kanakis, M.; Maurer, S.; Spallanzani, M.; Chhatkuli, A.; Van Gool, L. Zippypoint: Fast interest point detection, description, and matching through mixed precision discretization. In Proceedings of the IEEE/CVF Conference on Computer Vision and Pattern Recognition, Vancouver, Canada, 18–22 June 2023; IEEE: Piscataway, NJ, USA, 2023; pp. 6114–6123. [Google Scholar]
  32. Sun, J.; Shen, Z.; Wang, Y.; Bao, H.; Zhou, X. LoFTR: Detector-free local feature matching with transformers. In Proceedings of the IEEE/CVF Conference on Computer Vision and Pattern Recognition, Virtual, 19–25 June 2021; IEEE: Piscataway, NJ, USA, 2021; pp. 8922–8931. [Google Scholar]
  33. Wang, Y.; He, X.; Peng, S.; Tan, D.; Zhou, X. Efficient LoFTR: Semi-dense local feature matching with sparse-like speed. In Proceedings of the IEEE/CVF Conference on Computer Vision and Pattern Recognition, Seattle, WA, USA, 17–21 June 2024; IEEE: Piscataway, NJ, USA, 2024; pp. 21666–21675. [Google Scholar]
  34. Mao, R.; Bai, C.; An, Y.; Zhu, F.; Lu, C. 3DG-STFM: 3D geometric guided student-teacher feature matching. In Proceedings of the European Conference on Computer Vision, Tel Aviv, Israel, 23–27 October 2022; Springer Nature: Cham, Switzerland, 2022; pp. 125–142. [Google Scholar]
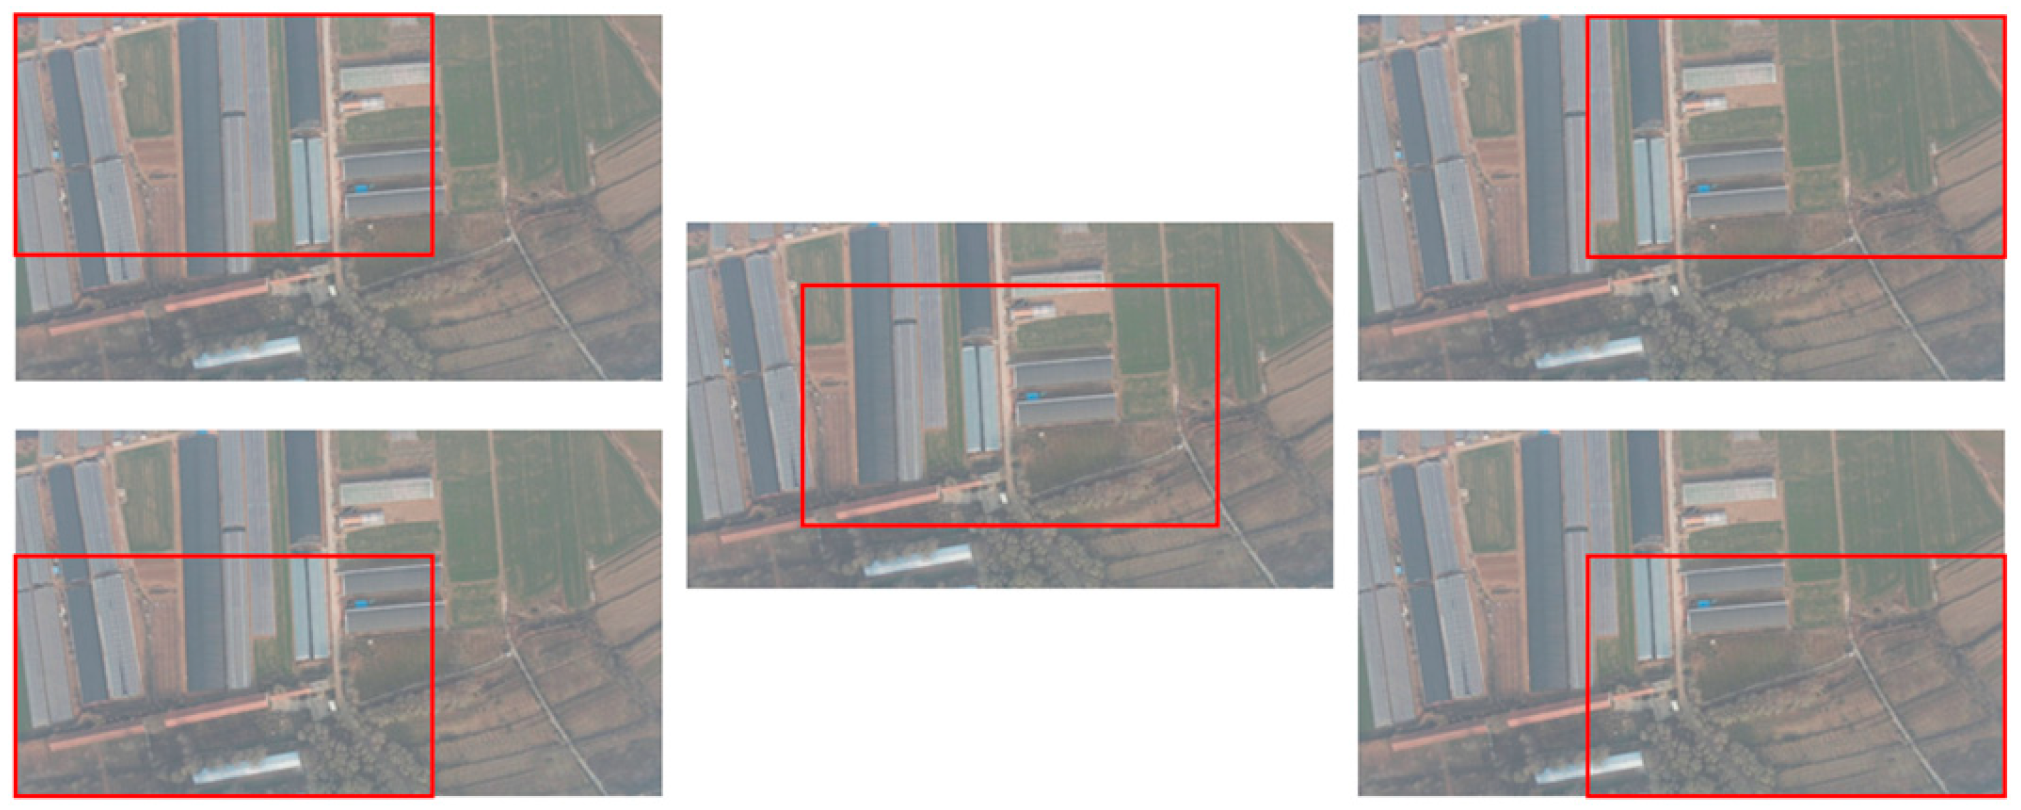
Figure 1. The multi-region annotation of five keypoints. The red boxes indicate different regions where keypoints are selected.
Applsci 16 02488 g001
Figure 2. Examples of keypoint selection: (a) general and (b) challenging regions. The red circle and dot indicate selected keypoints.
Applsci 16 02488 g002
Figure 3. The limitation of center-point-based metrics in oblique-view UAV images: example (a) and (b). Ground truths (green), predictions (red), and errors (yellow lines) are visualized.
Applsci 16 02488 g003
Figure 4. The visualization of cases where the keypoint projection exceeds or remains within three times of the FOV threshold.
Applsci 16 02488 g004
Figure 5. The UAV field-of-view model.
Applsci 16 02488 g005
Figure 6. Comparison of A@T for algorithms on the MTA-Dataset.
Applsci 16 02488 g006
Figure 7. Comparison of matching for algorithms on an UAV image with a 3.87 ° tilt angle: (a) ASpanFormer; (b) SP + SuperGlue; (c) GlueStick; (d) EfficientLoFTR; (e) 3DG-STFM; (f) LoFTR; (g) ZippyPoint; (h) LightGlue; (i) ORB; and (j) SIFT. The matching results labeled by red quadrilaterals indicate superior accuracy, whereas the unlabeled matching results indicate inferior performance.
Applsci 16 02488 g007aApplsci 16 02488 g007b
Figure 8. The sensitivity analysis of the threshold for the number of matched points.
Applsci 16 02488 g008
Figure 9. Preprocessing results and matching performance under varying spatial resolution thresholds: (ac) threshold = inf; (df) threshold = 3.0; (gi) threshold = 2.4; and (jl) threshold = 1.2. The matching results labeled by red quadrilaterals indicate superior accuracy, whereas the unlabeled matching results indicate inferior performance.
Applsci 16 02488 g009
Figure 10. Comparison of accuracy (A@T) at different thresholds for various methods on the MTA-Dataset using spatial-resolution-based cropping as a preprocessing step.
Applsci 16 02488 g010
Table 1. The composition of the MTA-Dataset.
Image TypeTilt AngleNumberTotal Number
UAV 0 ° , 10 ° 1051892
10 ° , 20 ° 13
20 ° , 30 ° 74
30 ° , 40 ° 180
40 ° , 50 ° 220
50 ° , 60 ° 131
60 ° , 70 ° 207
70 ° , 80 ° 303
80 ° , 90 ° 659
SatelliteNadir view11
Table 2. The comparison of existing UAV–satellite image matching datasets with our MTA-Dataset.
DatasetYearSourceAltitudeSceneTilt AngleGround Truth
University-16522021Synthetic121.5 m to 256 mBuildingsMultiple0
VPAIR2022Real300 m to 400 mMultiple0
SUES-2002023Real150/200/250/300 mUrbanMultiple0
DenseUAV2024Real80 m/90 m/100 mUrban0
UAV-VisLoc2024Real400 m to 2000 mMultiple1
GTA-UAV2025Synthetic80 m to 650 mMultiple0° to 10°0
AnyVisLoc2025Real30 m to 300 mMultiple0° to 70°0
MTA-Dataset 2025Real30 m to 300 mMultiple0° to 89°5
Table 3. The comparison of evaluation metrics of existing UAV–satellite image matching datasets.
DatasetYearMetrics
University-16522021Recall@K, AP
VPAIR2022Recall@K
SUES-2002023Recall@K, AP, RB, PF
DenseUAV2024Recall@K, SDM@K
UAV-VisLoc2024Not clearly defined
GTA-UAV2025Recall@K, AP, SDM@K, Dis@1
AnyVisLoc2025SDM@K, A@T, PDM@K
Table 4. Ten representative matching algorithms selected for comparison.
ParadigmAlgorithm
Traditional handcraftedSIFT, ORB
Joint detection and descriptionSuperPoint + SuperGlue, GlueStick [29], LightGlue [30], ZippyPoint [31]
Detector-freeLoFTR [32], Efficient LoFTR [33], ASpanFormer, 3DG-STFM [34]
Table 5. The hardware specifications for the experimental platform.
ConfigurationModel
CPUIntel i7-12700F
Memory16 GB
Graphics CardNVIDIA GeForce RTX 3070
Table 6. Comparison of E [ a ° , b ° ) | 30 (m) across different tilt-angle intervals for various methods.
Method [ 0 ° , 10 ° ) [ 10 ° , 20 ° ) [ 20 ° , 30 ° ) [ 30 ° , 40 ° ) [ 40 ° , 50 ° ) [ 50 ° , 60 ° ) [ 60 ° , 70 ° ) [ 70 ° , 80 ° ) [ 80 ° , 90 ° )
LoFTR19.0531.7440.2829.8738.2064.2197.05281.66557.90
Efficient LoFTR9.756.0943.3143.40158.76743.26646.51989.391317.62
ASpanFormer9.543.487.7615.9858.31488.88581.92951.12990.80
3DG-STFM11.7310.8373.8963.29165.39781.86660.66914.141262.48
SP + SuperGlue12.193.673.7411.4019.8357.0287.68280.31557.25
GlueStick11.803.913.9713.6723.53121.40113.01271.36569.90
LightGlue39.2144.2739.1650.8864.8964.21118.08286.50558.26
ZippyPoint69.19211.21303.46208.30341.72796.36875.691347.921278.08
SIFT91.88272.76275.48229.00371.64845.891025.001491.491500.24
ORB40.9044.2739.1654.0867.2864.21121.60286.59558.26
Table 7. Comparison of P [ a ° , b ° ) | 30 (%) across different tilt-angle intervals for various methods.
Method [ 0 ° , 10 ° ) [ 10 ° , 20 ° ) [ 20 ° , 30 ° ) [ 30 ° , 40 ° ) [ 40 ° , 50 ° ) [ 50 ° , 60 ° ) [ 60 ° , 70 ° ) [ 70 ° , 80 ° ) [ 80 ° , 90 ° )
LoFTR55.2446.1618.9241.1135.000.0029.955.280.30
Efficient LoFTR92.38100.0098.6596.1192.2787.7992.2790.7684.52
ASpanFormer93.33100.00100.0099.4496.3677.8684.5477.2352.96
3DG-STFM96.19100.0098.6594.4493.6489.3192.7587.1387.86
SP + SuperGlue73.33100.00100.0085.0075.4521.3743.006.930.30
GlueStick74.29100.00100.0087.2282.2733.5950.728.251.52
LightGlue0.000.000.000.003.180.007.250.330.00
ZippyPoint75.2469.2386.4976.1179.5576.3482.6177.5662.37
SIFT40.0084.6277.0363.8975.9188.5583.5788.1282.70
ORB3.810.000.003.331.360.000.000.000.00
Table 8. The average localization error E [ a ° , b ° ) | 30 (m) for preprocessed results at various spatial resolution thresholds.
Tilt-Angle RangeK = 0.9K = 1.2K = 1.8K = 2.4K = 2.7K = 3.0K = 3.3K = 3.6K = 3.9K = inf
50 ° , 60 ° 25.5325.3726.0629.1533.2135.2540.5542.3845.5857.02
60 ° , 70 ° 73.9051.9651.7052.9649.8269.1753.4358.1158.3387.68
70 ° , 80 ° 261.23244.00234.38206.13210.60198.85186.68182.01188.72280.31
80 ° , 90 ° 542.30531.36534.87447.30517.23518.90493.64505.16456.26557.25
Table 9. Comparison of E [ a ° , b ° ) | 30 (m) between Full-FOV and spatial-resolution-based strategies.
Method [ 50 ° , 60 ° ) [ 60 ° , 70 ° ) [ 70 ° , 80 ° ) [ 80 ° , 90 ° )
K = infK = 0.9K = infK = 2.7K = infK = 3.6K = infK = 2.4
LoFTR64.2163.6397.0597.14281.66260.60557.90549.87
Efficient LoFTR743.26123.50646.51177.03989.39315.161317.62457.67
ASpanFormer488.88119.83581.92130.23951.12279.83990.80546.09
3DG-STFM781.8688.48660.66178.72914.14359.251262.48486.82
SuperPoint + SuperGlue57.0223.5387.6849.82280.31182.01557.25447.30
GlueStick121.4026.82113.0161.26271.36194.38569.90420.95
LightGlue64.2164.21118.08118.65286.50281.76558.26560.87
ZippyPoint796.36297.31875.69387.861347.92657.271278.08614.01
SIFT845.89312.351025.00413.621491.49601.331500.24666.71
ORB64.2164.21121.60121.60286.59286.59558.26555.14
Table 10. Comparison of P a ° , b ° | 30 (%) between Full-FOV and spatial-resolution-based strategies.
Method [ 50 ° , 60 ° ) [ 60 ° , 70 ° ) [ 70 ° , 80 ° ) [ 80 ° , 90 ° )
K = infK = 0.9K = infK = 2.7K = infK = 3.6K = infK = 2.4
LoFTR0.006.8729.9529.955.2811.550.304.55
Efficient LoFTR87.7987.7992.2789.8690.7683.1784.5265.40
ASpanFormer77.8676.3484.5486.9677.2377.2352.9651.90
3DG-STFM89.3190.8492.7589.3787.1385.8187.8667.07
SuperPoint + SuperGlue21.3780.1543.0068.126.9345.540.3020.79
GlueStick33.5991.6050.7271.018.2546.861.5226.71
LightGlue0.000.007.257.250.331.980.000.76
ZippyPoint76.3471.7682.6181.1677.5676.5762.3762.82
SIFT88.5579.3983.5776.8188.1276.2482.7071.93
ORB0.000.000.000.000.000.000.000.15
Disclaimer/Publisher’s Note: The statements, opinions and data contained in all publications are solely those of the individual author(s) and contributor(s) and not of MDPI and/or the editor(s). MDPI and/or the editor(s) disclaim responsibility for any injury to people or property resulting from any ideas, methods, instructions or products referred to in the content.