1. Introduction
Against the backdrop of Industry 4.0, the digital and intelligent transformation of the coal processing industry has become a core pathway to safeguard production safety and improve operational efficiency. With the integrated application of technologies, including the Internet of Things (IoT), digital twin, virtual reality (VR) and augmented reality (AR), virtual monitoring systems have achieved non-contact, full-process, real-time monitoring and precise regulation of coal production workflows, and emerged as the core carriers for the intelligent operation of coal preparation plants [
1,
2,
3,
4,
5]. Flotation is the core link in slime purification and clean coal utilization. Its stable operation relies on the effective performance of the ventilation control virtual monitoring system, while the alarm interface serves as the core medium for human–computer interaction between on-site operators and the system [
6]. However, the operating conditions of flotation workshops, characterized by high dynamics, strong interference, and extreme time pressure, impose stringent requirements on alarm interface design. Operators are required to complete screening of high-density multi-source alarm information, safety risk identification, and emergency decision making within an extremely narrow time window, and dust and noise interference in the workshop further increase the difficulty of information perception [
7,
8,
9]. Currently, the alarm interfaces of traditional ventilation control monitoring systems generally suffer from prominent problems, including information overload, chaotic layout, and single-presentation modality [
10,
11,
12]. These defects directly aggravate operators’ extraneous cognitive load, leading to frequent issues, such as delayed alarm response and misoperation, which bring serious hidden dangers to the safe production of flotation workshops.
Cognitive Load Theory (CLT) holds that human working memory resources have inherent limitations. Unreasonable information presentation will increase extraneous cognitive load, thus reducing information processing efficiency and decision-making quality [
13]. This theory has been widely applied to the optimization of industrial human–machine interfaces in high-demand scenarios, such as radar visualization, security video surveillance, and fighter aircraft cockpits. Existing studies have confirmed that interface design elements, including alarm display position, visual coding, and spatial layout, have significant impacts on operators’ cognitive load and task performance [
14,
15].
However, most existing studies focus on two-dimensional monitoring interfaces in conventional industrial scenarios, while targeted research on alarm interfaces for three-dimensional virtual monitoring systems under the unique high-dust, strong-interference operating conditions of flotation workshops remains insufficient. The cognitive mechanism of interface design elements in such complex scenarios has not yet been systematically elucidated. Meanwhile, existing studies mostly focus on the independent impact of a single interface element on cognitive load, failing to fully validate the multi-factor interaction mechanism in complex scenarios, nor to clarify the optimal interface design combination for high-load emergency scenarios with concurrent multi-target tasks. From a practical perspective, most existing optimization schemes for alarm interfaces are based on qualitative design experience and lack systematic optimization strategies supported by quantitative empirical data, making it difficult to provide practicable scientific guidance for the interface design of virtual monitoring systems in flotation workshops.
To fill the aforementioned research gaps, this study takes the alarm interface of the ventilation control virtual monitoring system in a flotation workshop as the research object, and aims to address the following three core scientific considerations:
Clarify the independent effects of alarm display position, display format, and target quantity on operators’ cognitive performance and subjective cognitive load;
Elucidate the interaction effects among the three variables and determine the optimal design combination of interface elements in high-load scenarios;
Construct a systematic optimization strategy for alarm interfaces adapted to the operating conditions of flotation workshops.
The remainder of this paper is organized as follows:
Section 2 elaborates the theoretical foundation of Cognitive Load Theory and constructs a theoretical coupling model.
Section 3 describes the experimental design, materials, participants, procedure, and data analysis methods; presents the experimental results; and conducts the corresponding discussion.
Section 4 proposes a systematic optimization strategy for the alarm interface based on the experimental findings.
Section 5 summarizes the main conclusions of this study, and analyzes the research limitations and future research directions.
2. Theoretical Basis and Analysis of Cognitive Mechanism of Alarm Interface
2.1. Cognitive Load Theory
Cognitive load refers to the total cognitive resources consumed by an individual during information processing, which is fundamentally constrained by the upper capacity limit of human working memory [
16,
17]. According to Cognitive Load Theory (CLT), cognitive load can be divided into three core categories: intrinsic cognitive load, extraneous cognitive load, and germane cognitive load. Among them, intrinsic cognitive load is determined by the inherent complexity of the task itself; extraneous cognitive load, which is directly affected by information presentation methods, is the core dimension that can be optimized through interface design; germane cognitive load refers to the cognitive resources allocated to schema construction and learning, which is closely related to the improvement of operators’ long-term operational performance [
10]. The total cognitive load borne by an operator during human–computer interaction is the combined result of the above three types of cognitive load. The core goal of interface optimization is precisely to reduce extraneous cognitive load through rational design, thereby freeing up more cognitive resources for emergency decision-making tasks.
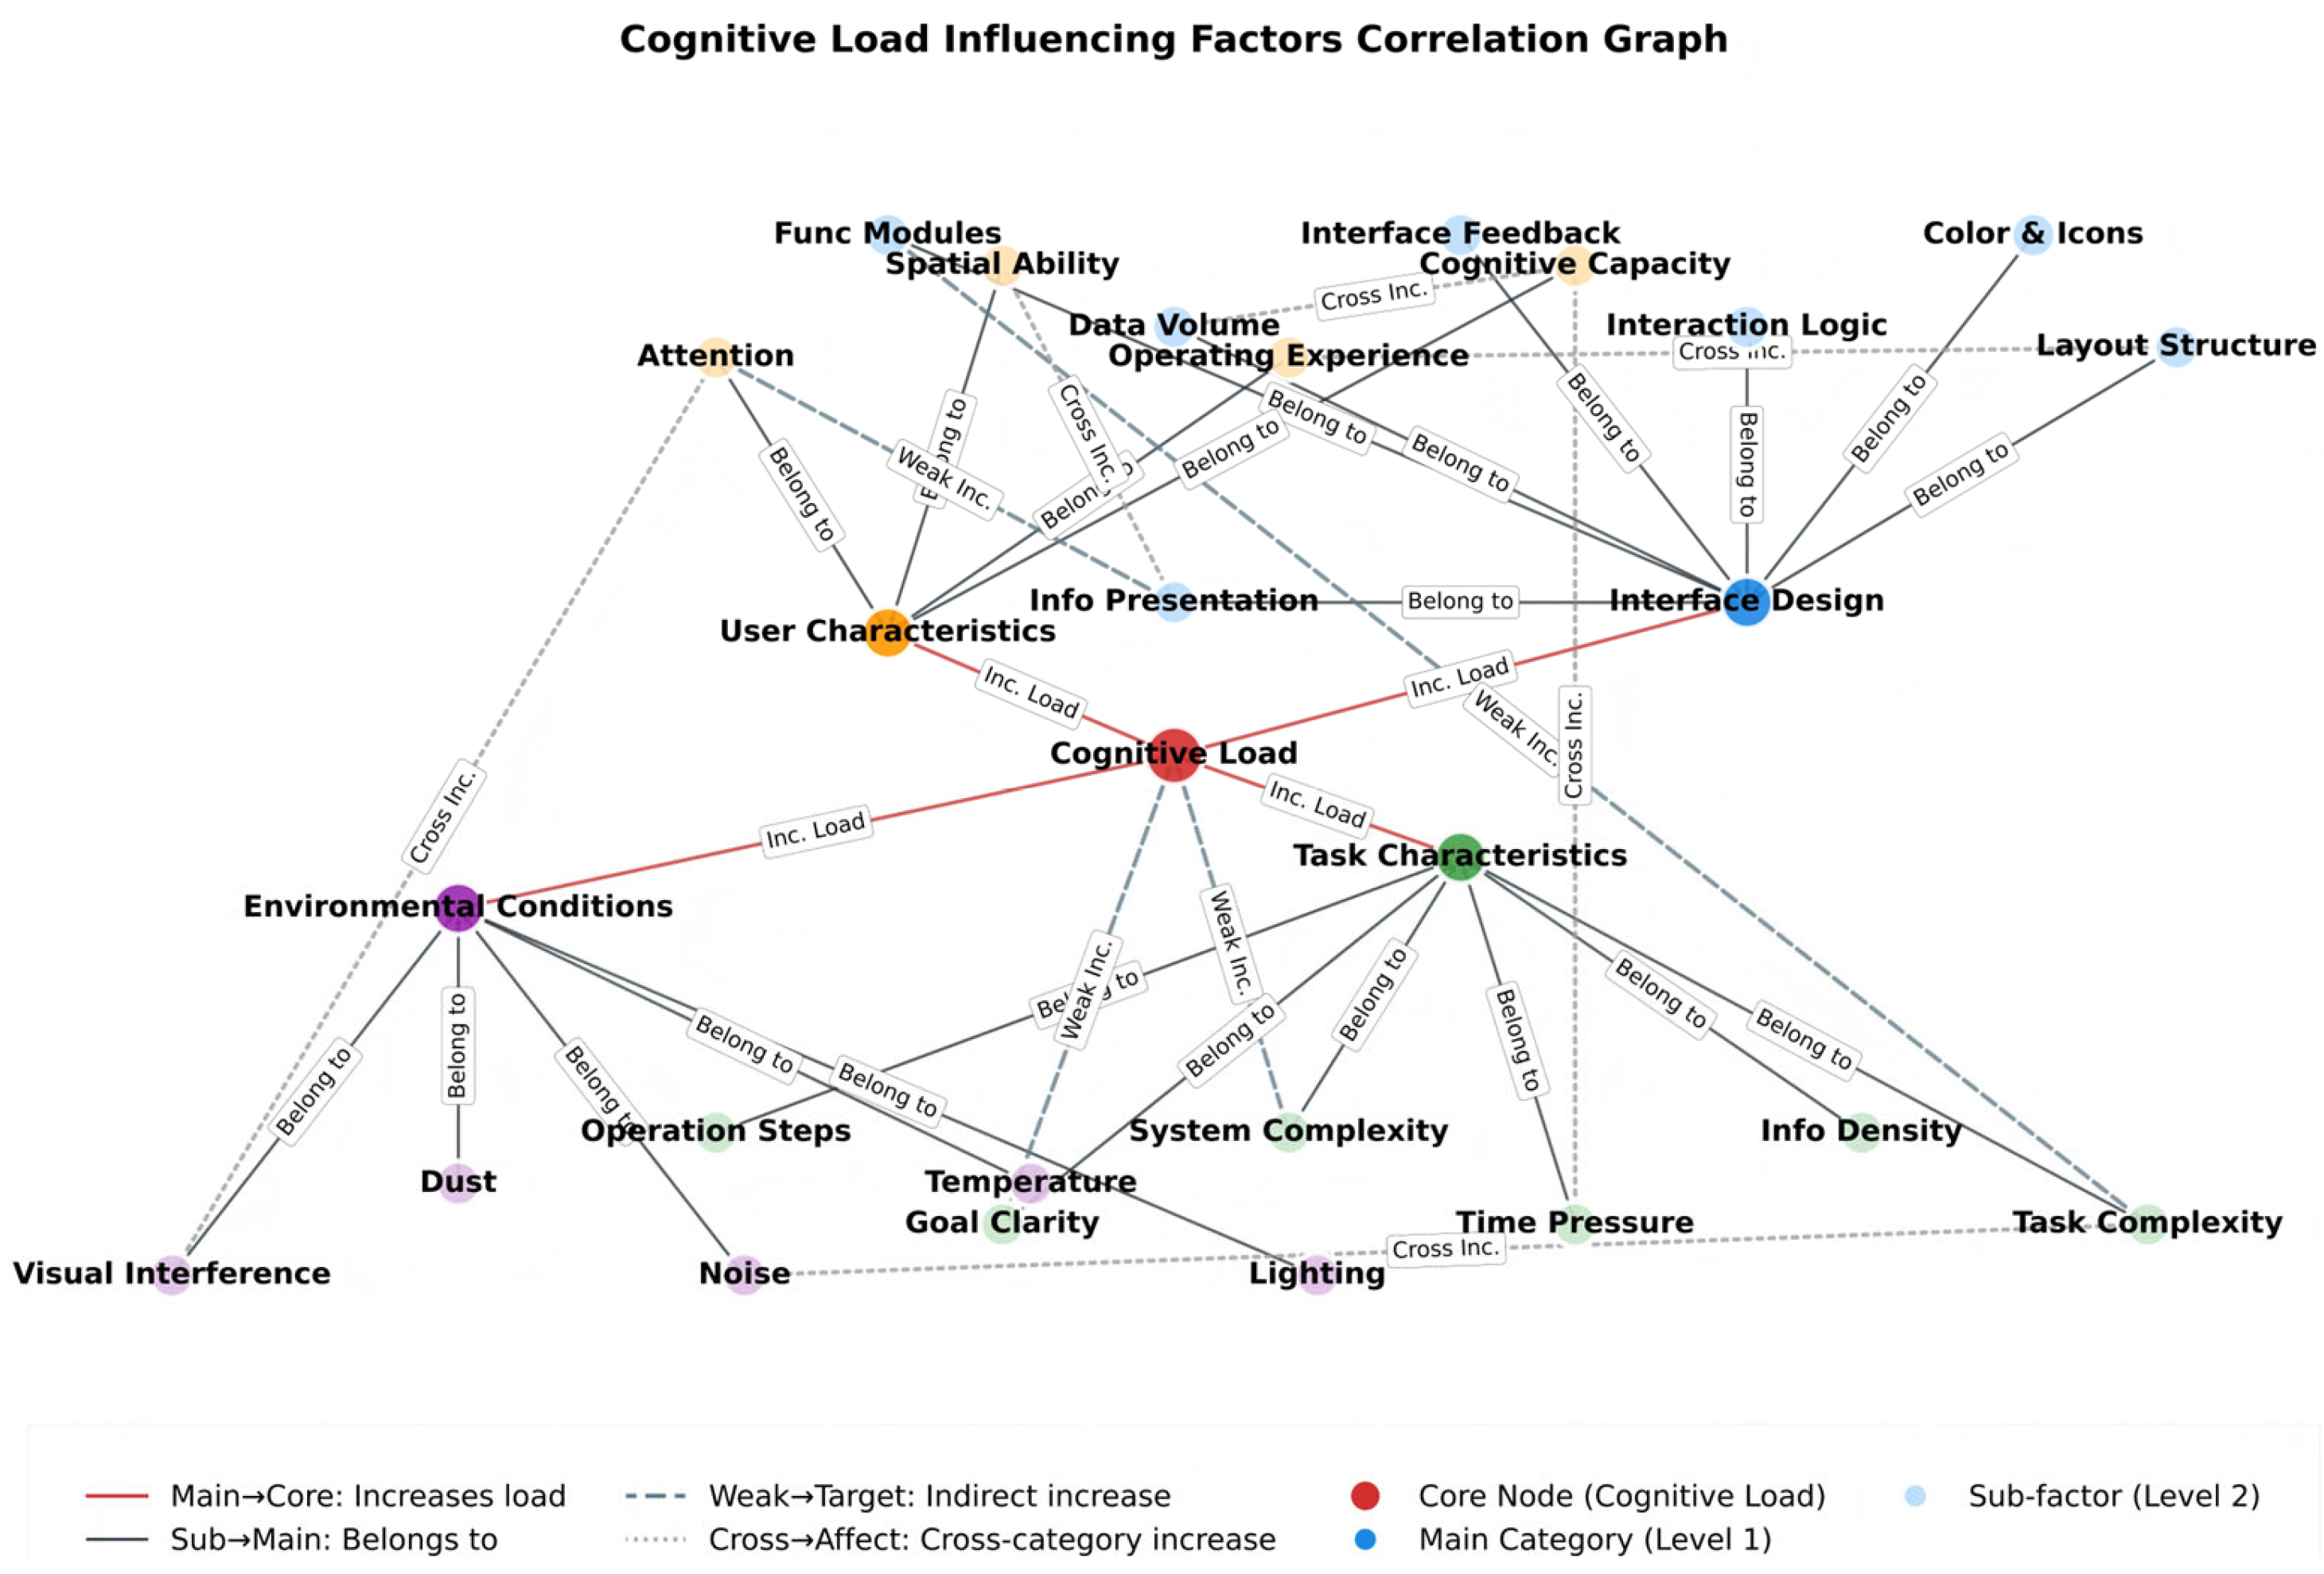
In industrial monitoring scenarios, the influencing factors of cognitive load can be summarized into four core dimensions: interface design, task characteristics, user characteristics, and environmental conditions (
Figure 1). At the interface design level, information presentation modality, spatial layout, and visual coding are the core elements that directly affect extraneous cognitive load [
18,
19,
20,
21]. At the task characteristic level, task complexity, information density, and time pressure show significant positive correlations with cognitive load [
22,
23,
24]. Individual differences in operators’ cognitive ability, operational experience, and spatial ability lead to significant differences in their cognitive load performance under identical task conditions [
25,
26]. Meanwhile, environmental factors in the workshop, including noise, dust, and illumination, can further amplify cognitive load by interfering with the operators’ information perception processes [
27].
At present, the mainstream cognitive load measurement system mainly consists of three categories of methods: subjective measurement, physiological measurement, and behavioral measurement. Existing studies widely combine these three methods to improve the comprehensiveness and accuracy of measurement [
28,
29]. Among them, the NASA Task Load Index (NASA-TLX) scale is the most widely used subjective measurement tool, which enables a comprehensive assessment of cognitive load across six core dimensions: Mental Demand, Physical Demand, Temporal Demand, Performance, Effort, and Frustration [
30,
31,
32]. Eye movement metrics (e.g., fixation duration, saccade amplitude) have become the most commonly used physiological measurement indicators, owing to their inherent advantages of non-intrusiveness, simple operation, and high sensitivity to fluctuations in cognitive load [
33]. Behavioral measurement indicators, centered on task completion time and accuracy rate, can objectively reflect the ultimate impact of cognitive load on task execution performance [
34,
35].
This study will comprehensively adopt the above three measurement methods to conduct a systematic evaluation of operators’ cognitive loads under different interface design conditions.
2.2. Analysis of Cognitive Mechanism of Alarm Interface
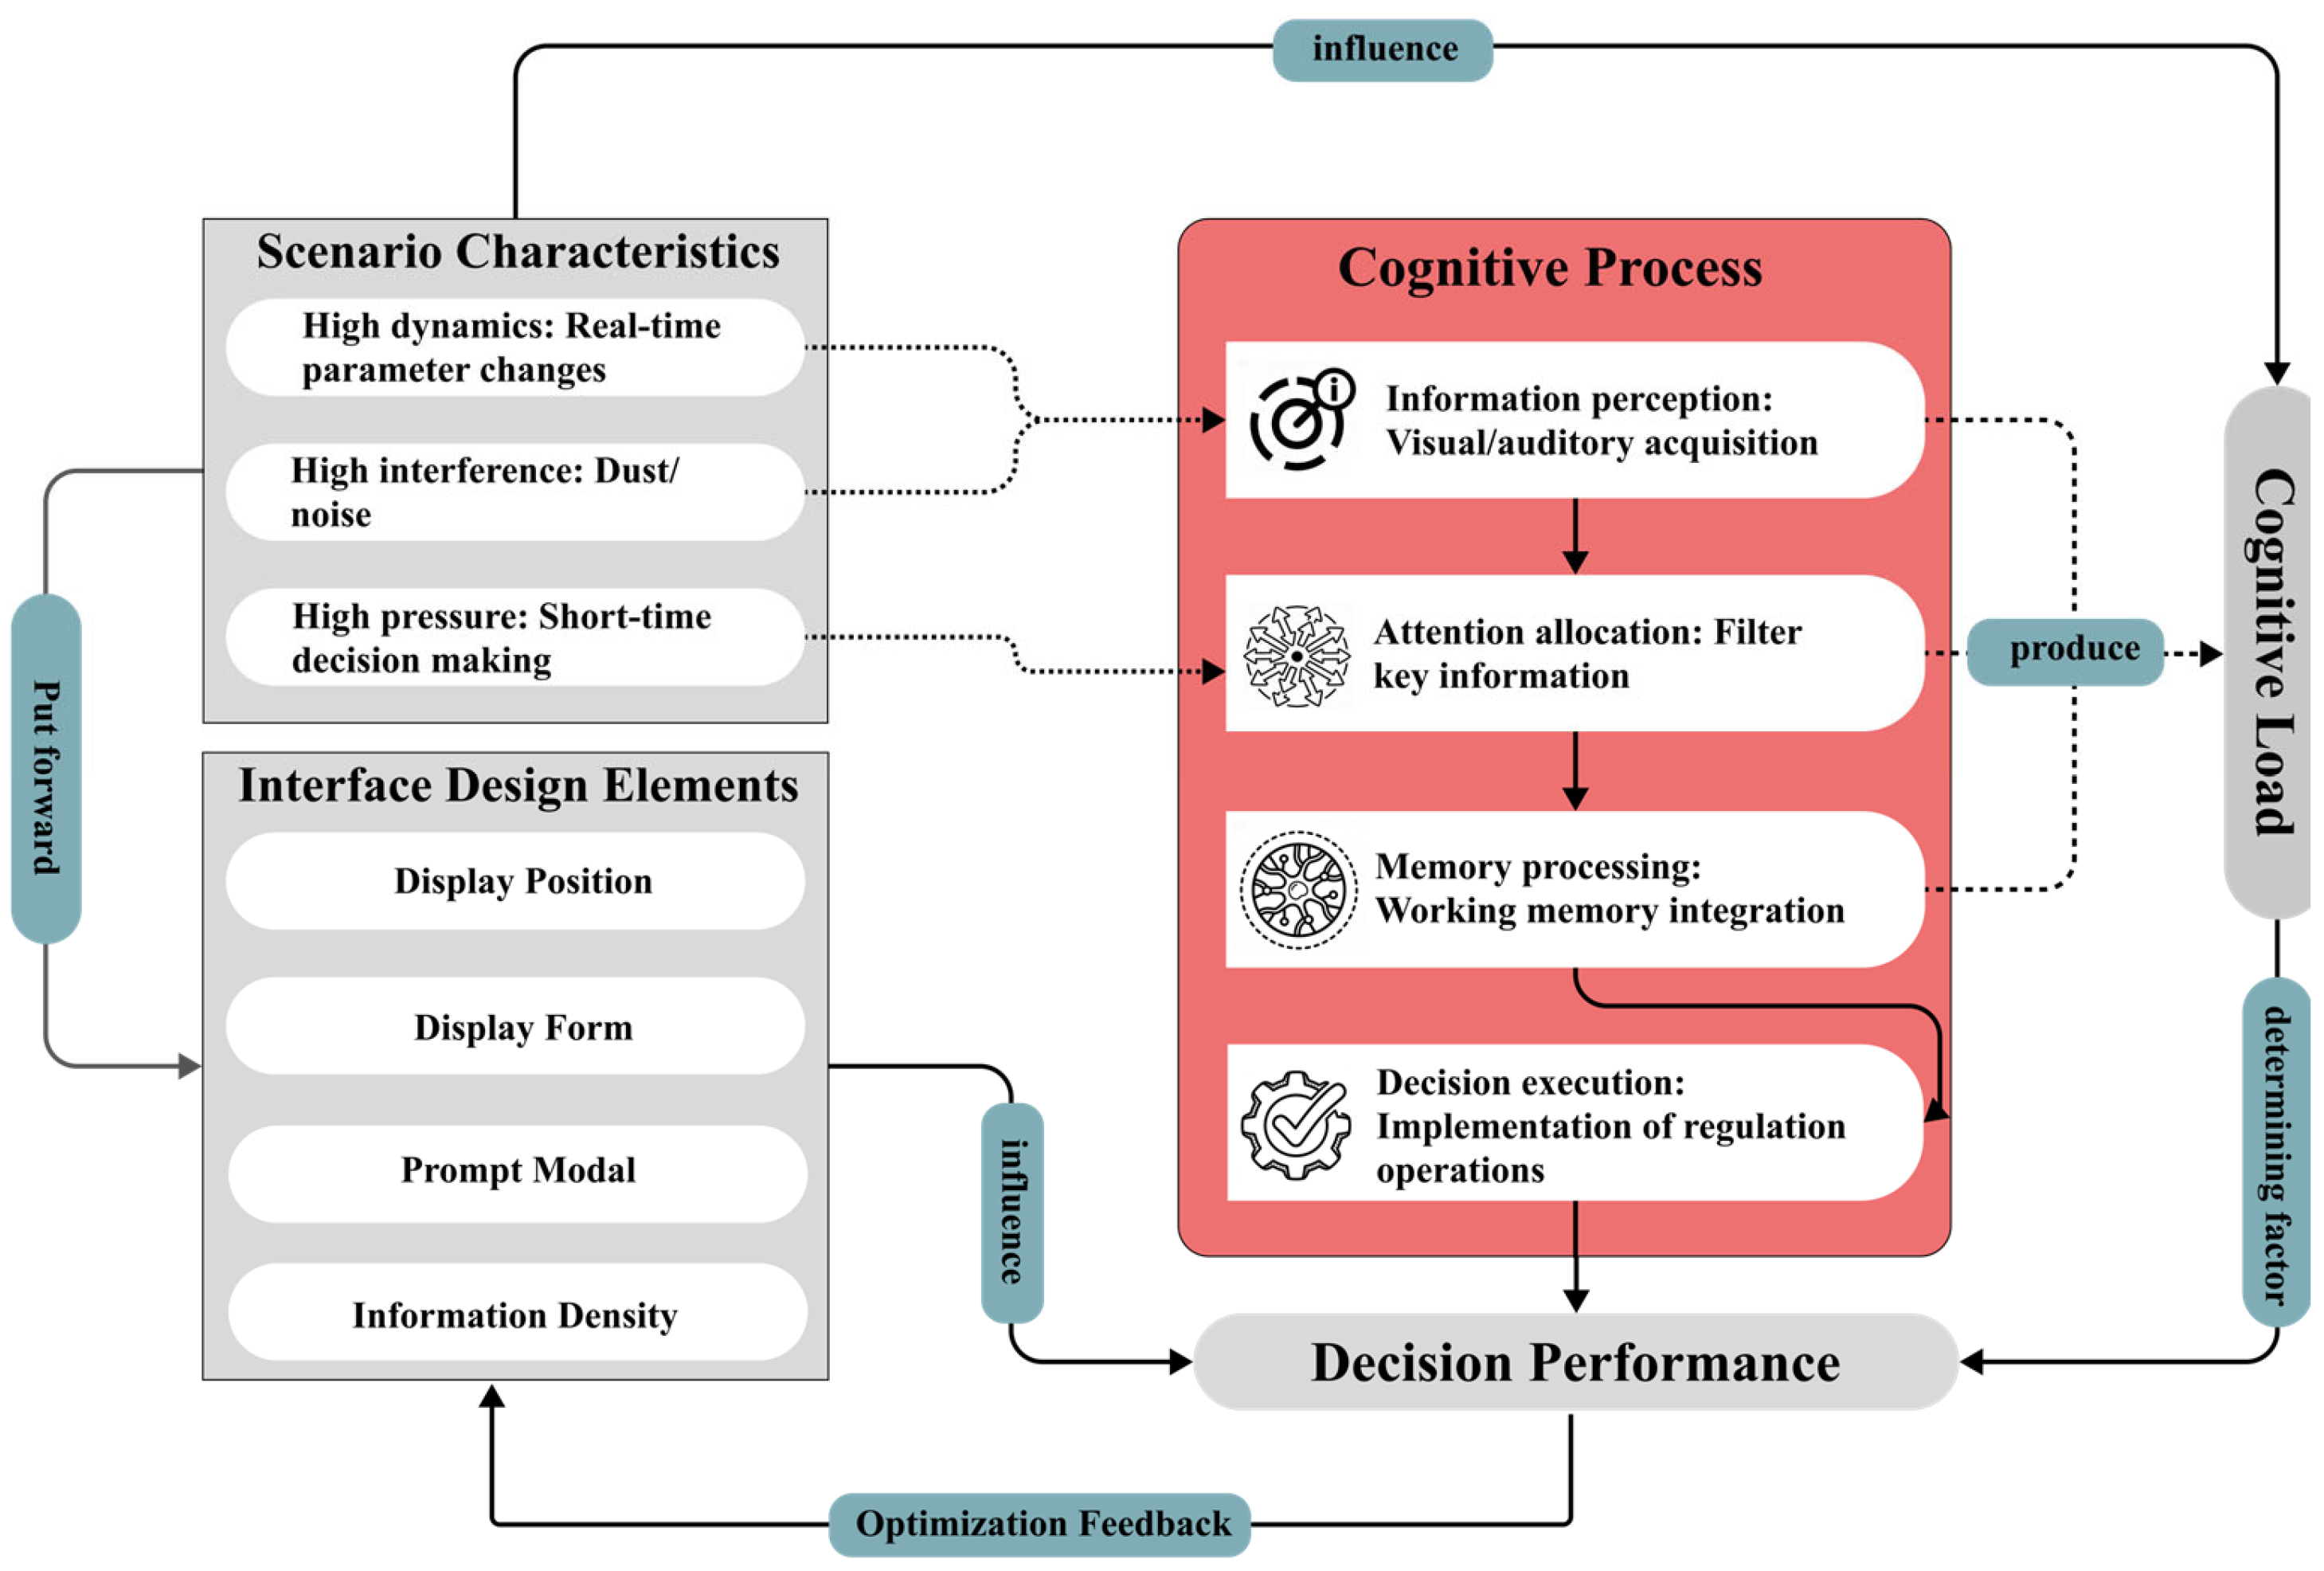
The cognitive process of human–computer interaction with the alarm interface of a virtual monitoring system can be divided into four consecutive stages: information perception, attention allocation, memory processing, and decision execution [
36,
37,
38]. In the information perception stage, operators acquire alarm information through visual and auditory channels, and the core cognitive goal of this stage is to reduce perceptual load. In the attention allocation stage, operators need to screen key alarm information from multi-source interference, where the main source of cognitive load is attentional competition. In the memory processing stage, operators must integrate current alarm information with existing experience and system rules, a process directly constrained by the upper capacity limit of human working memory. In the decision execution stage, operators complete emergency control operations based on cognitive outcomes; excessive decision options significantly increase cognitive load, thereby triggering operational errors [
39,
40].
Combined with the scenario characteristics of the flotation workshop, the core cognitive requirements of the alarm interface can be summarized into four dimensions: real-time performance, accuracy, comprehensibility, and low cognitive consumption. Real-time performance requires that the presentation speed of alarm information matches the dynamic changes in ventilation parameters. Accuracy requires no deviation in the semantics and numerical values of alarm information. Comprehensibility requires that the presentation of alarm information conforms to operators’ spatial cognitive habits. Low cognitive consumption requires that the interface design minimizes the occupation of cognitive resources, enabling operators to allocate more cognitive resources to emergency decision making, rather than information search and decoding [
41,
42,
43].
Based on the above analysis, this study constructs a Scenario Characteristics-Cognitive Requirements-Interface Design coupling model (
Figure 2) for the alarm interface of the virtual monitoring system in the flotation workshop. The scenario characteristics of the flotation workshop, namely high dynamics, strong interference, and extreme time pressure, determine the core cognitive requirements of the alarm interface, which, in turn, guide the optimization of key interface design elements (including display position, display format, information density, etc.). Rational interface design can reduce operators’ extraneous cognitive load by optimizing the cognitive process, ultimately improving the accuracy and efficiency of alarm response.
3. Experimental Research on Cognitive Influencing Factors of Alarm Interface
3.1. Experimental Purpose
Based on Cognitive Load Theory (CLT), this experiment targets the core pain points of the alarm interface for the ventilation control virtual monitoring system in the flotation workshop, including information overload, chaotic layout, excessively high cognitive load of operators, and low alarm response efficiency in high-dynamic, strong-interference industrial environments. Combining eye movement physiological metrics and the NASA Task Load Index (NASA-TLX) subjective scale, this study quantitatively investigates the influencing laws of three core interface design elements (alarm display position, display format, and target quantity) on operators’ cognitive performance and cognitive load. It further clarifies the optimal combination of design parameters for the alarm interface, to provide empirical data support for improving the efficiency of alarm identification and emergency response in high-risk industrial scenarios.
3.2. Experimental Materials
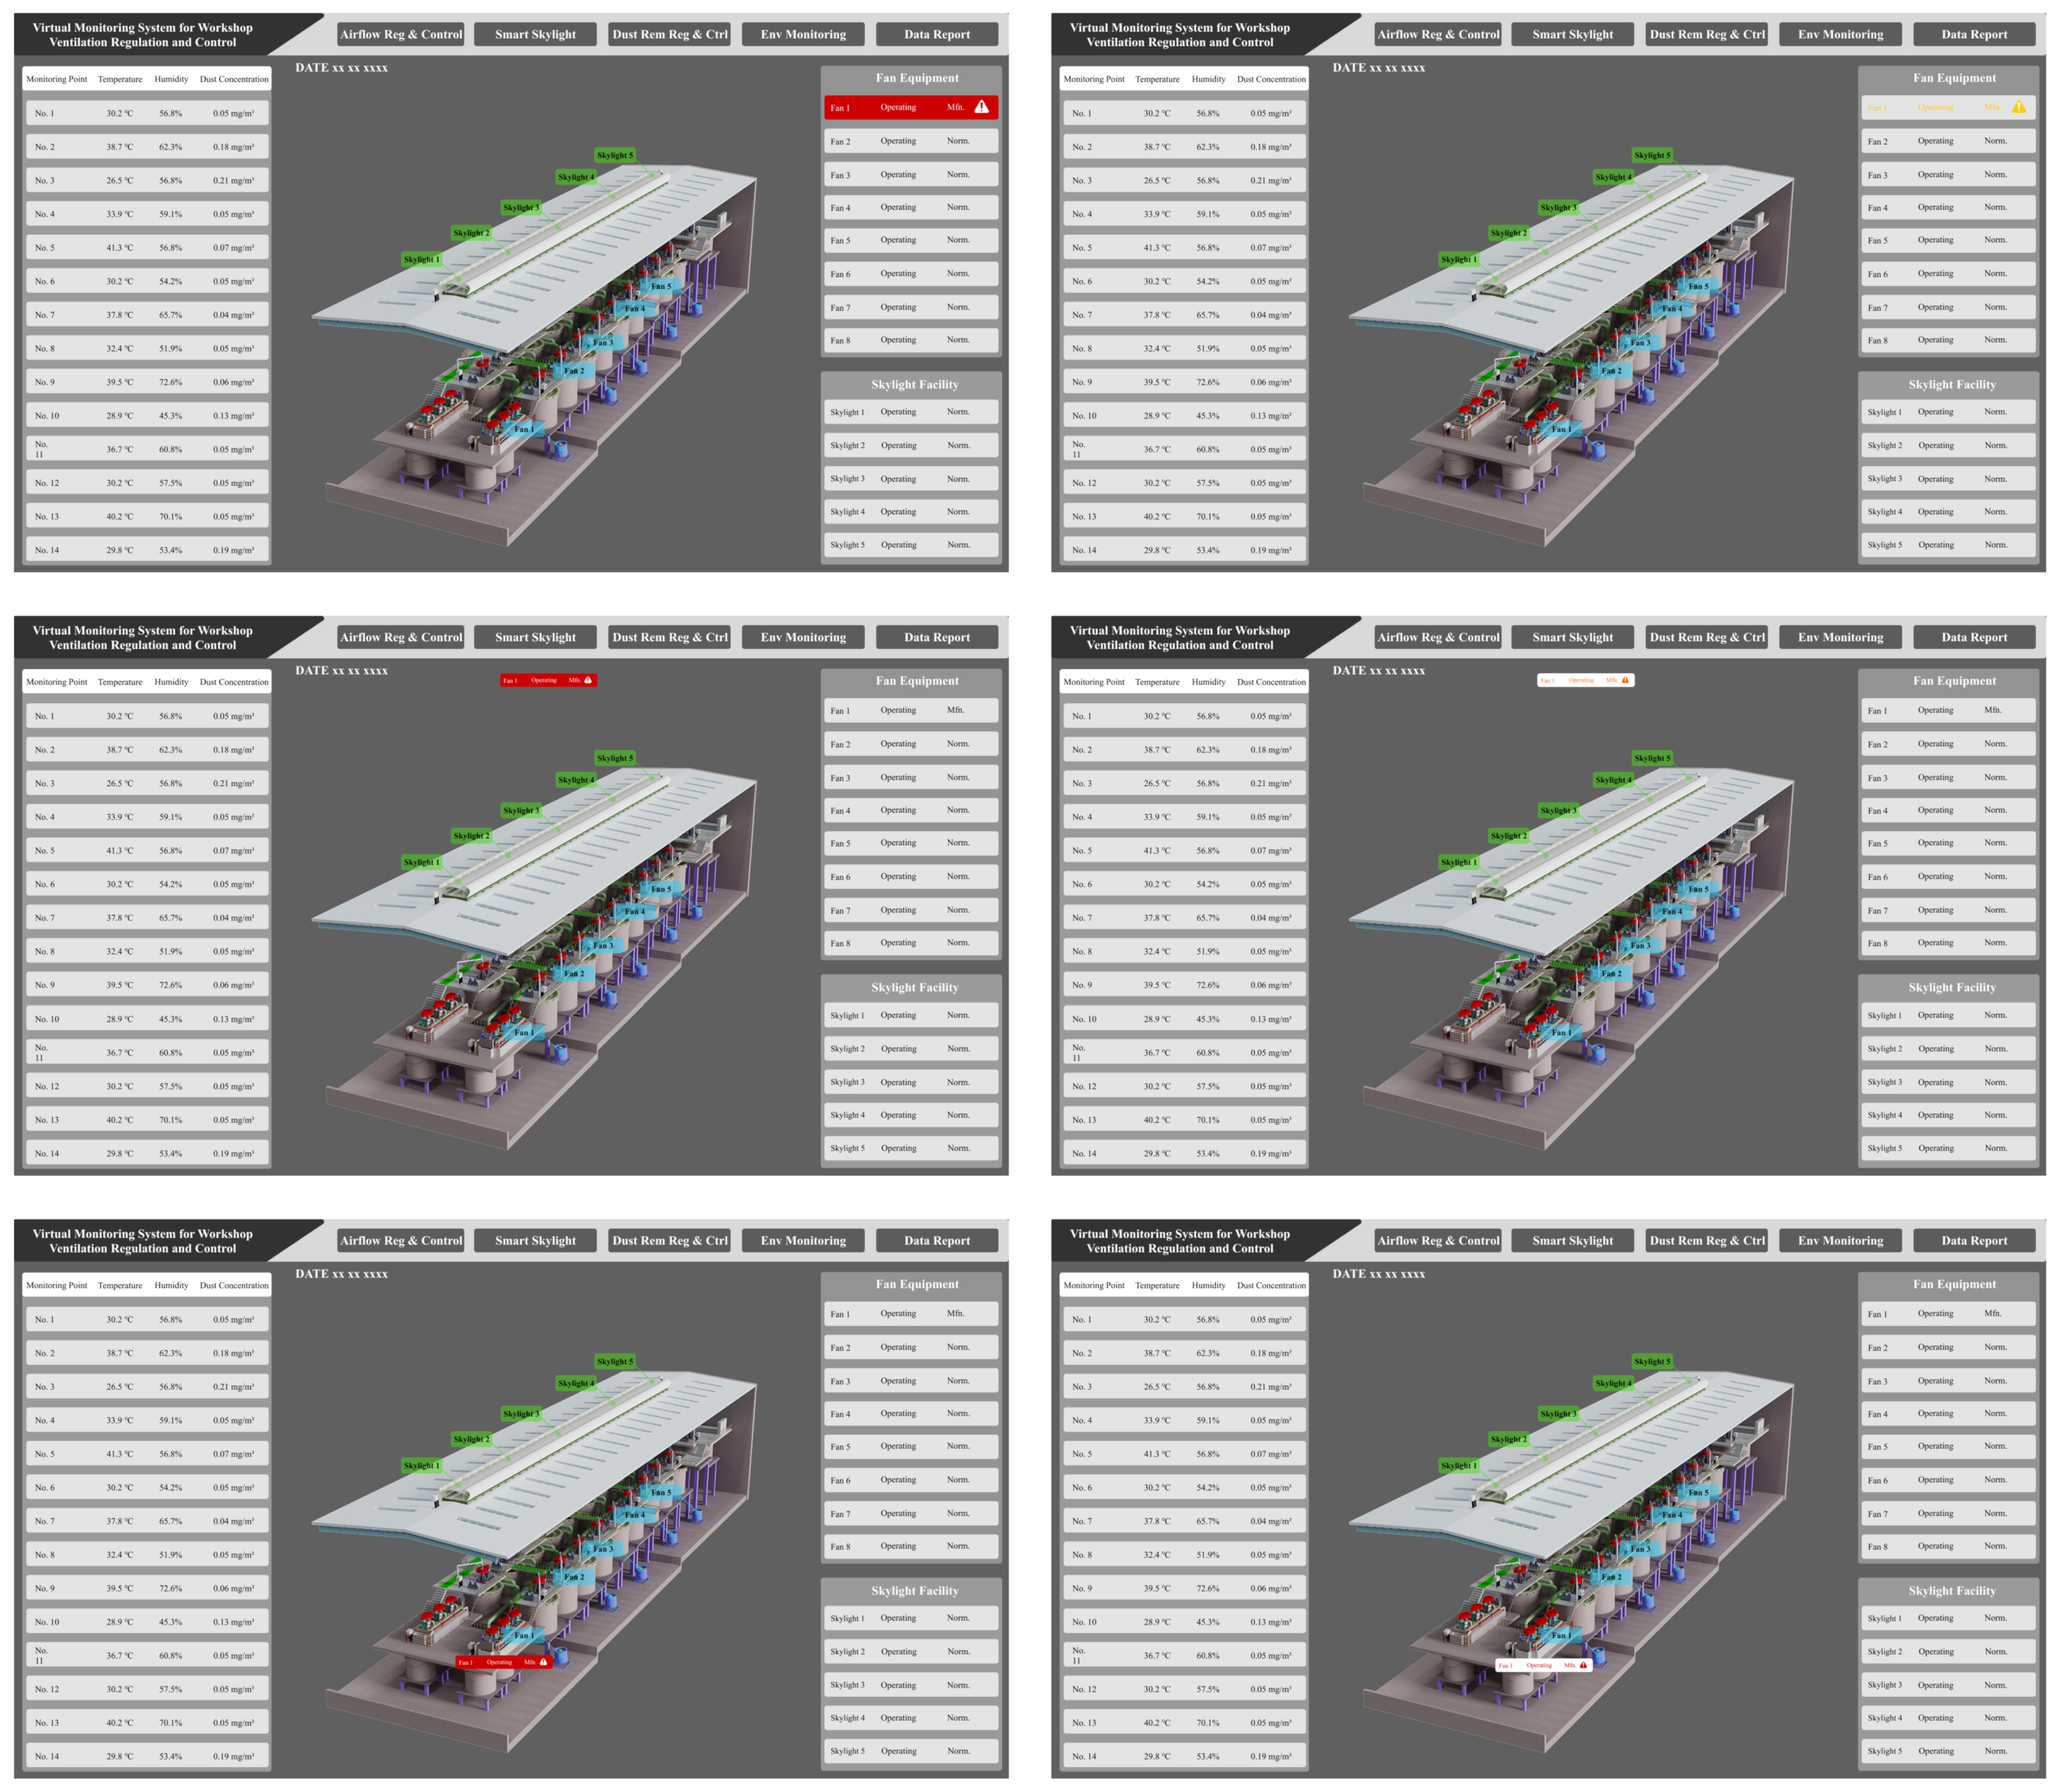
A three-way within-subjects experimental design was adopted in this study, with a 3 (alarm display position: 2D list panel, top–center of the screen, adjacent to the 3D model) × 2 (alarm presentation format: text-filled, background color-filled) × 2 (target quantity: single-target, multi-target) factorial structure. All participants completed trials under all experimental conditions.
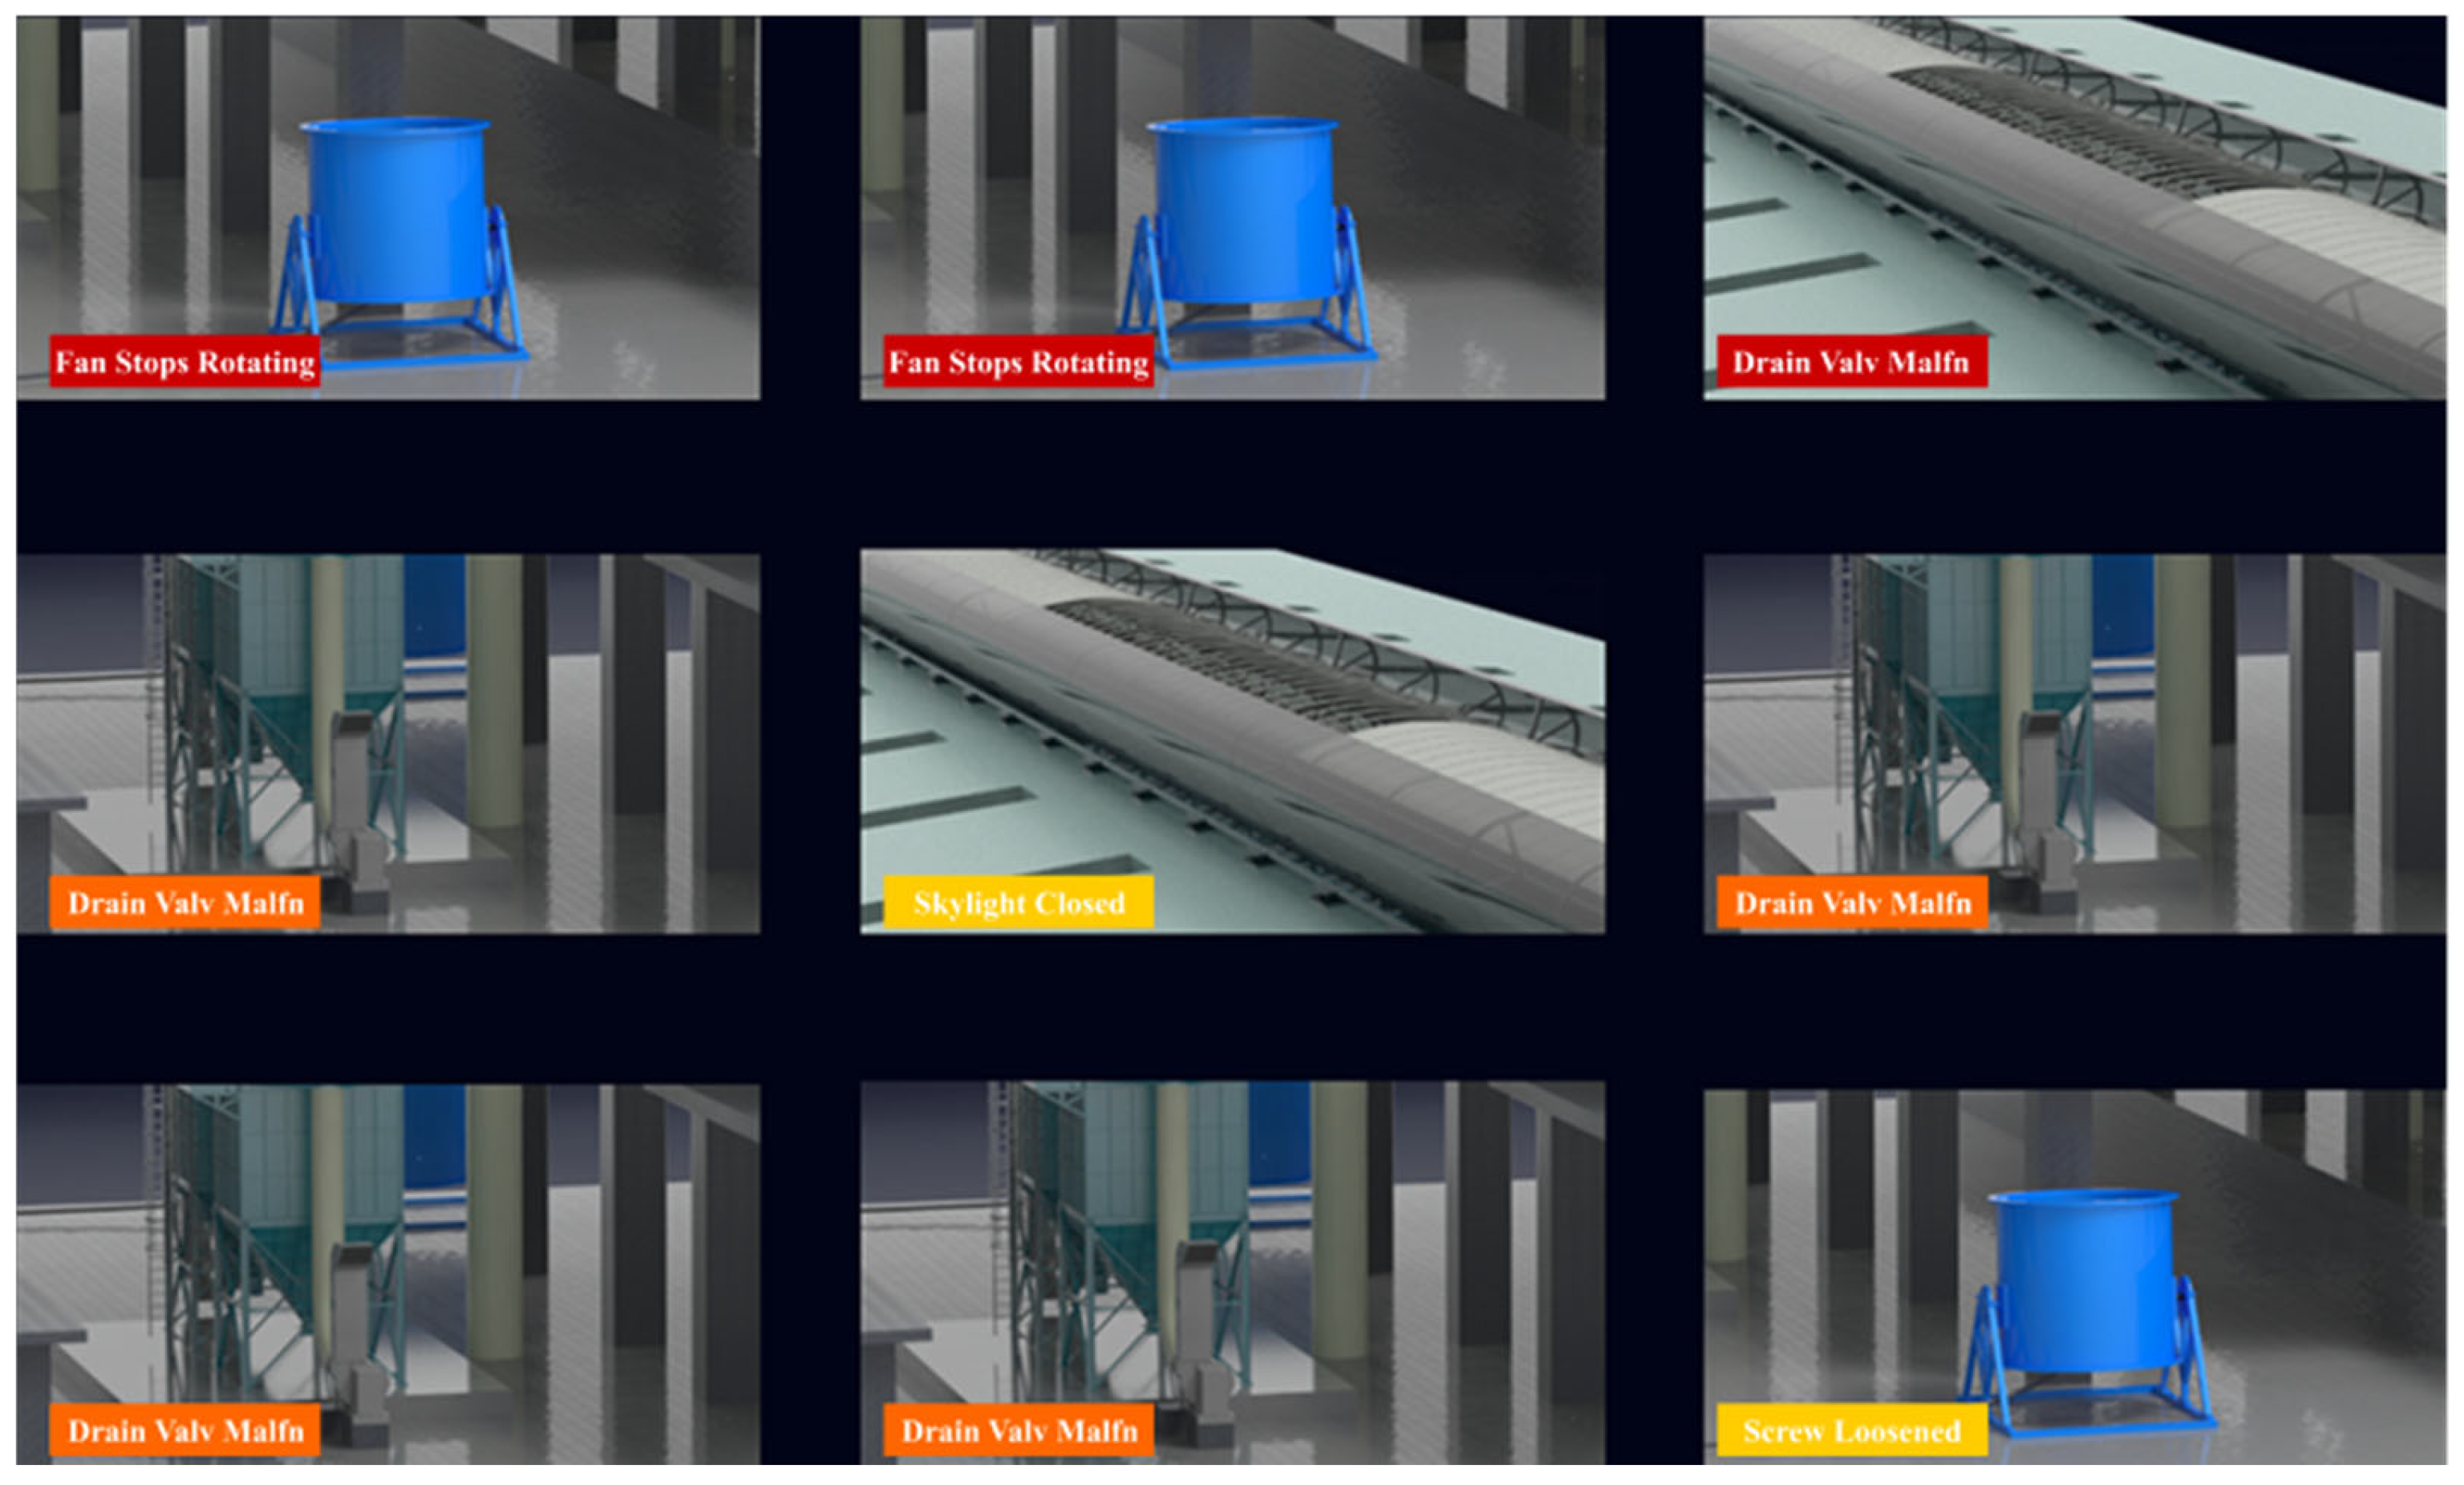
The experimental stimulus materials were developed based on a 3D virtual model of a real flotation workshop, with a full-scale replication of the workshop’s typical equipment distribution, pipeline layout, and environmental structure, as shown in
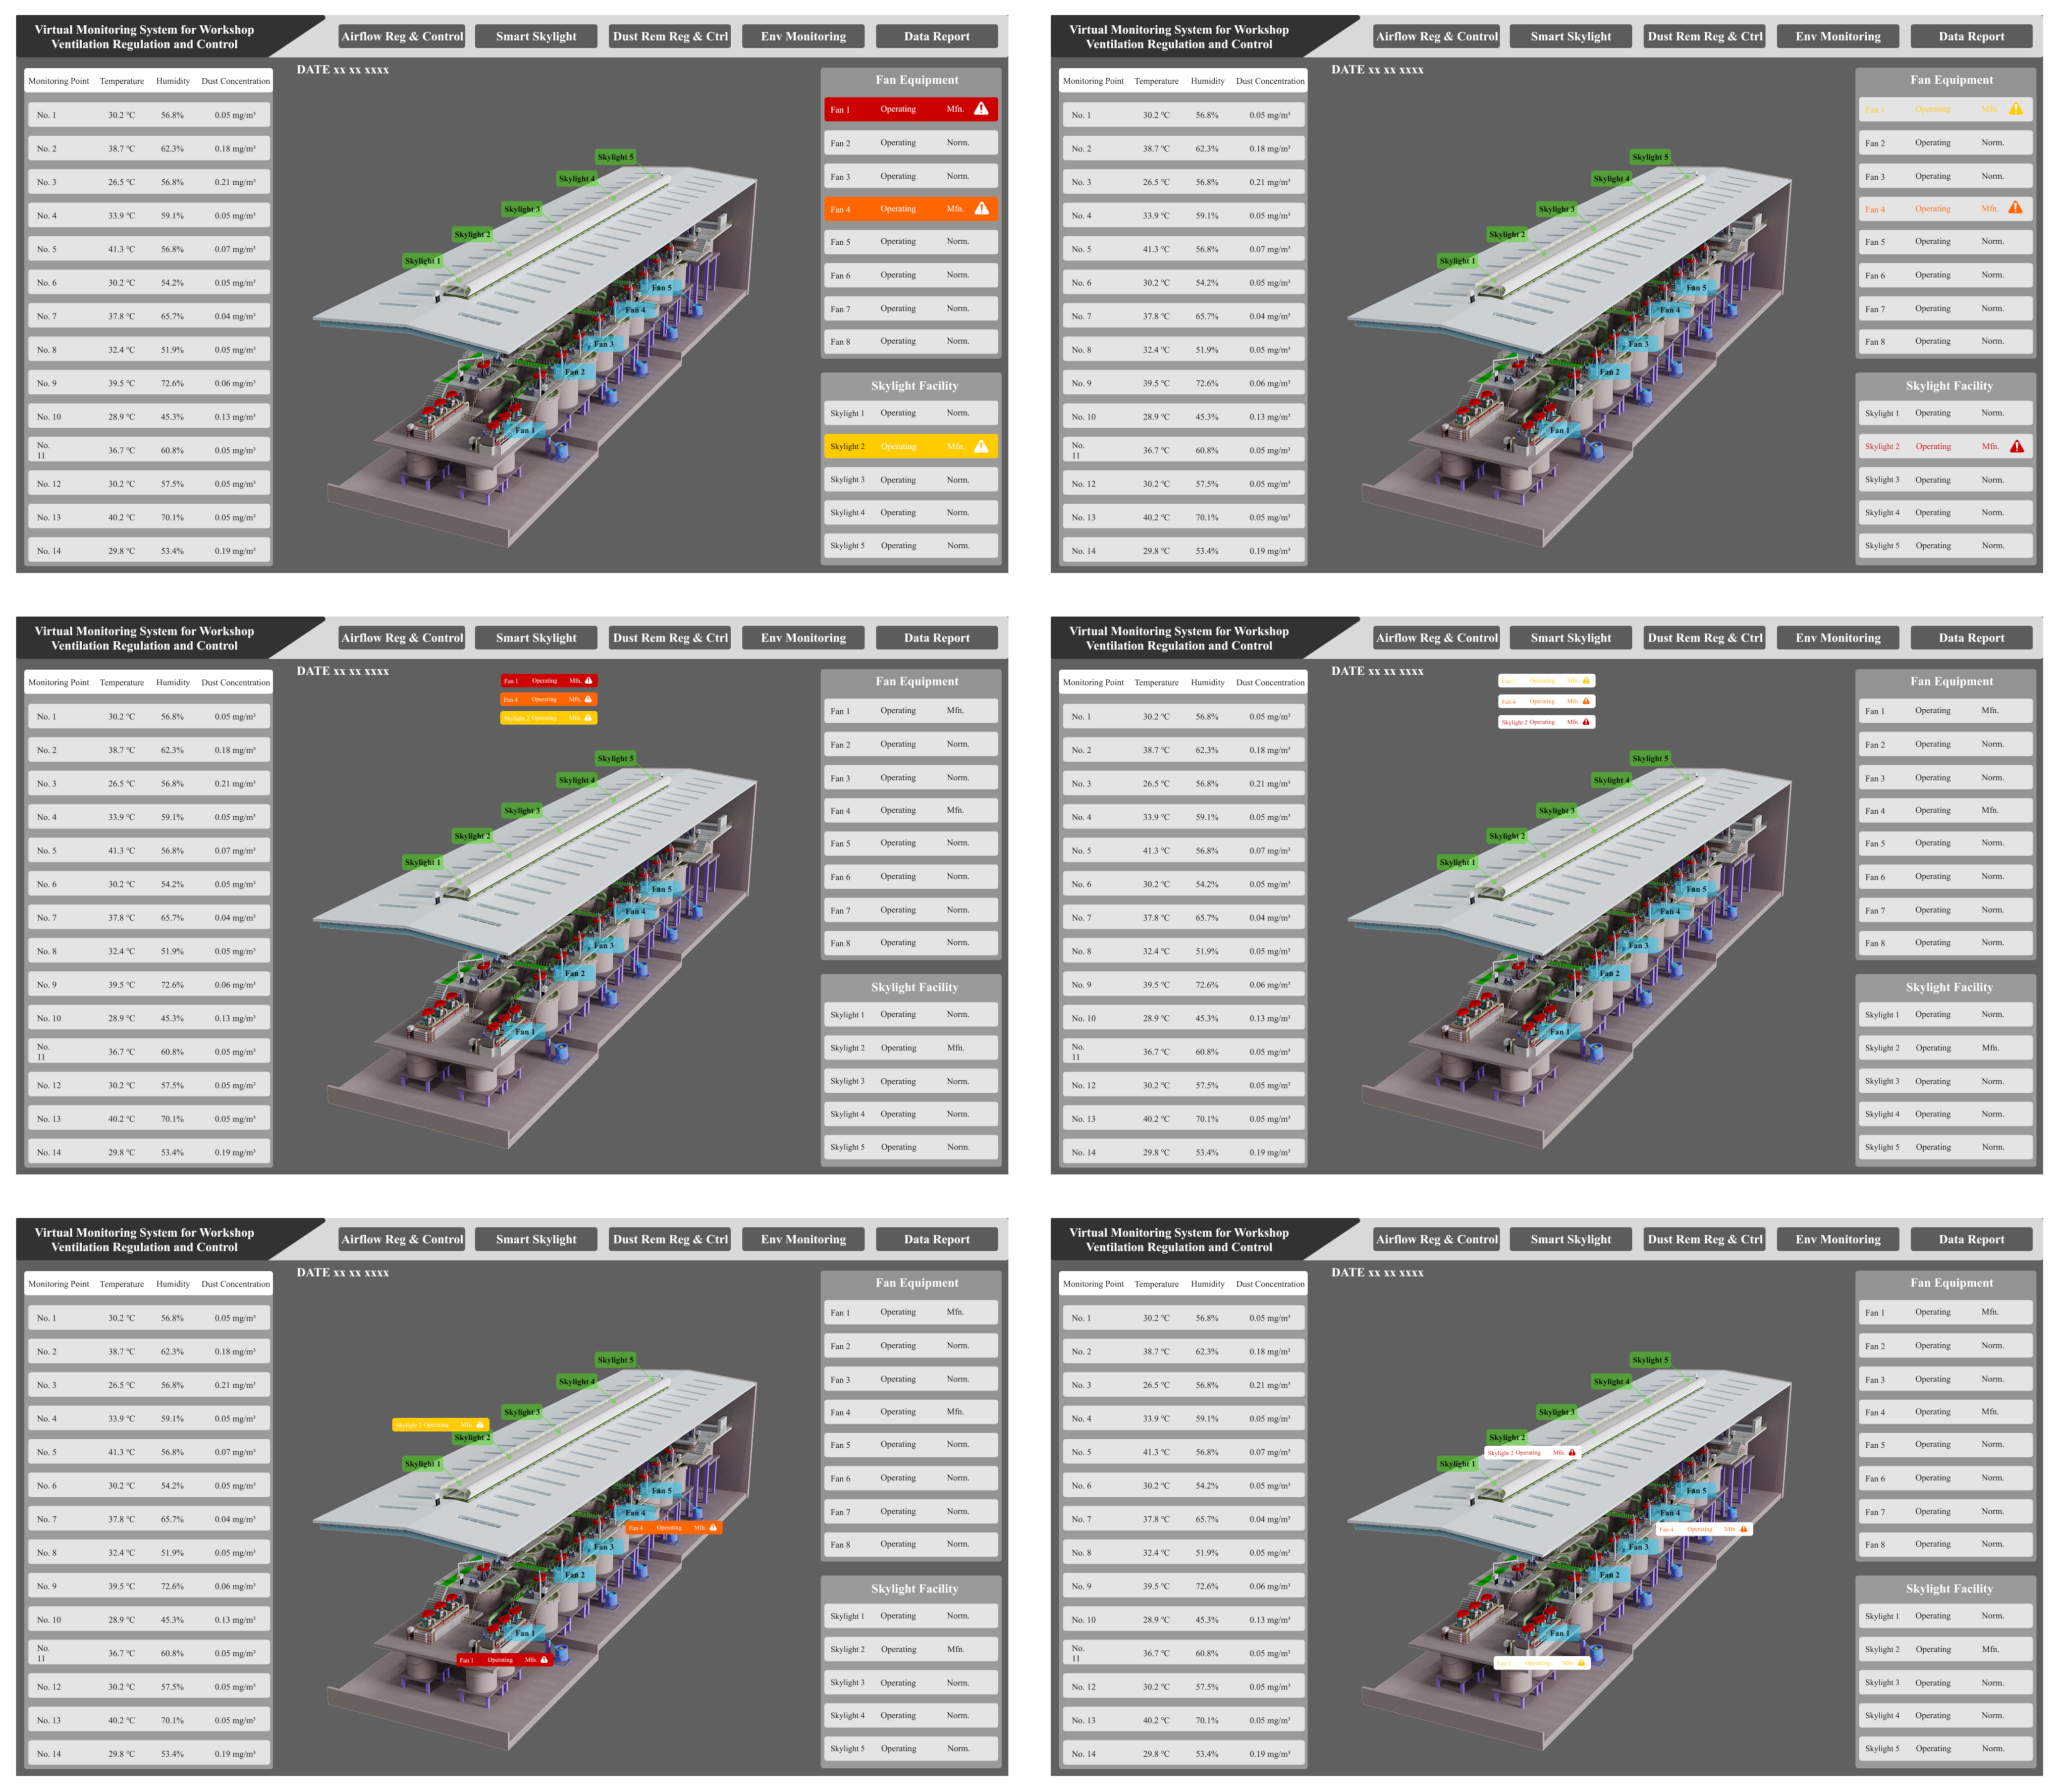
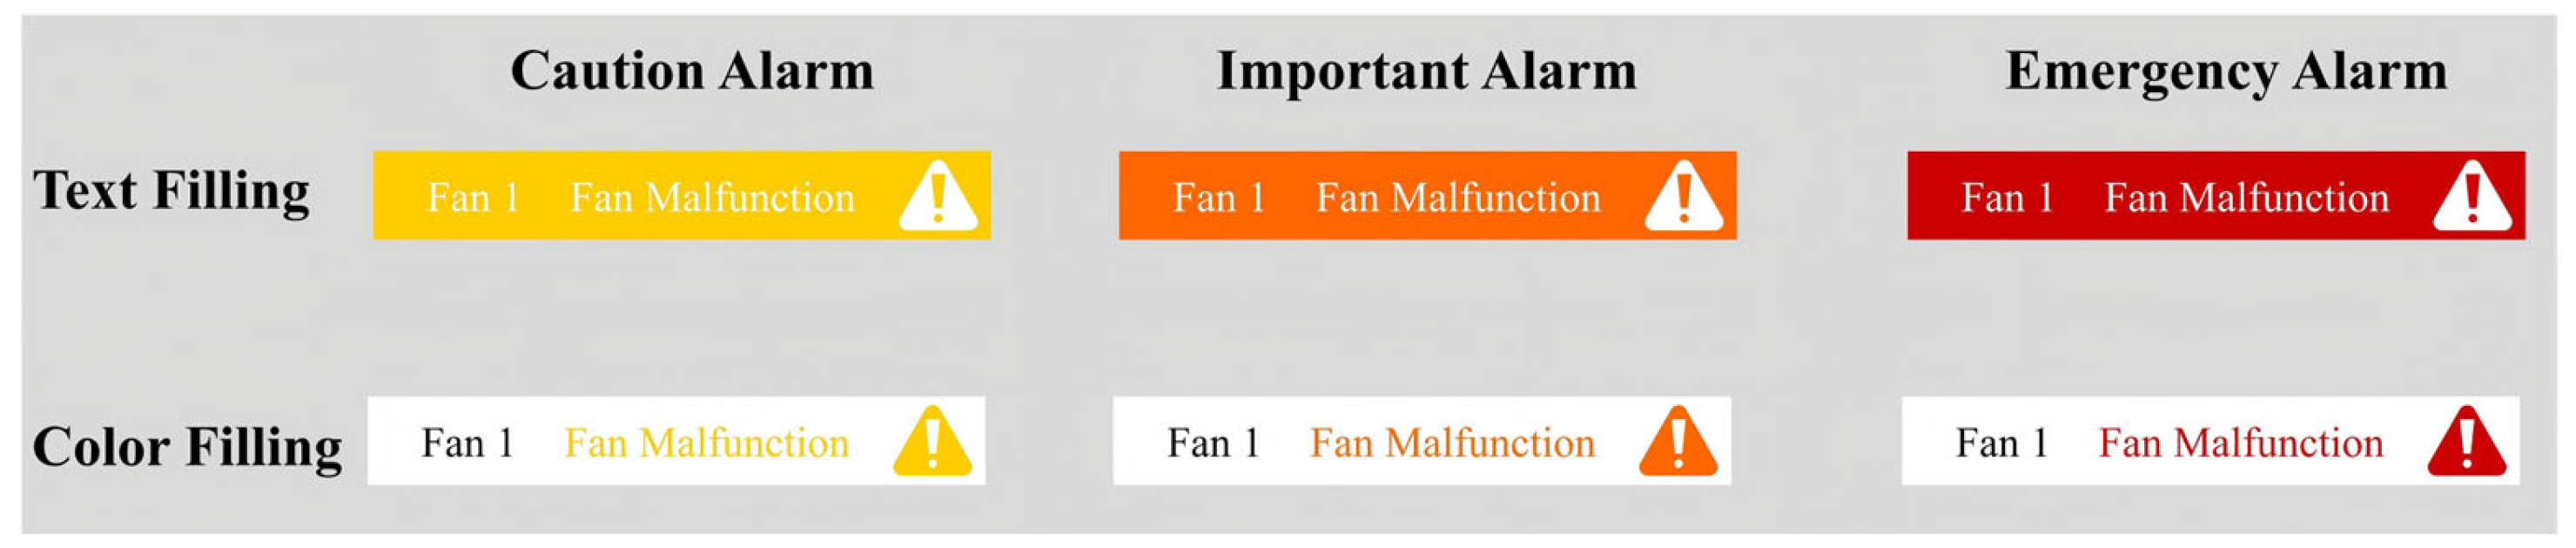
Figure 3. Each static stimulus image integrated the alarm information presentation mode corresponding to the experimental condition, including alarm icons, text prompts, and hierarchical color codes. A grayscale filter was applied to simulate the visual interference caused by workshop dust, to replicate the task scenario where operators identify and respond to abnormal information during actual monitoring. In accordance with the industrial safety standard GB 2893-2008 Safety Colours [
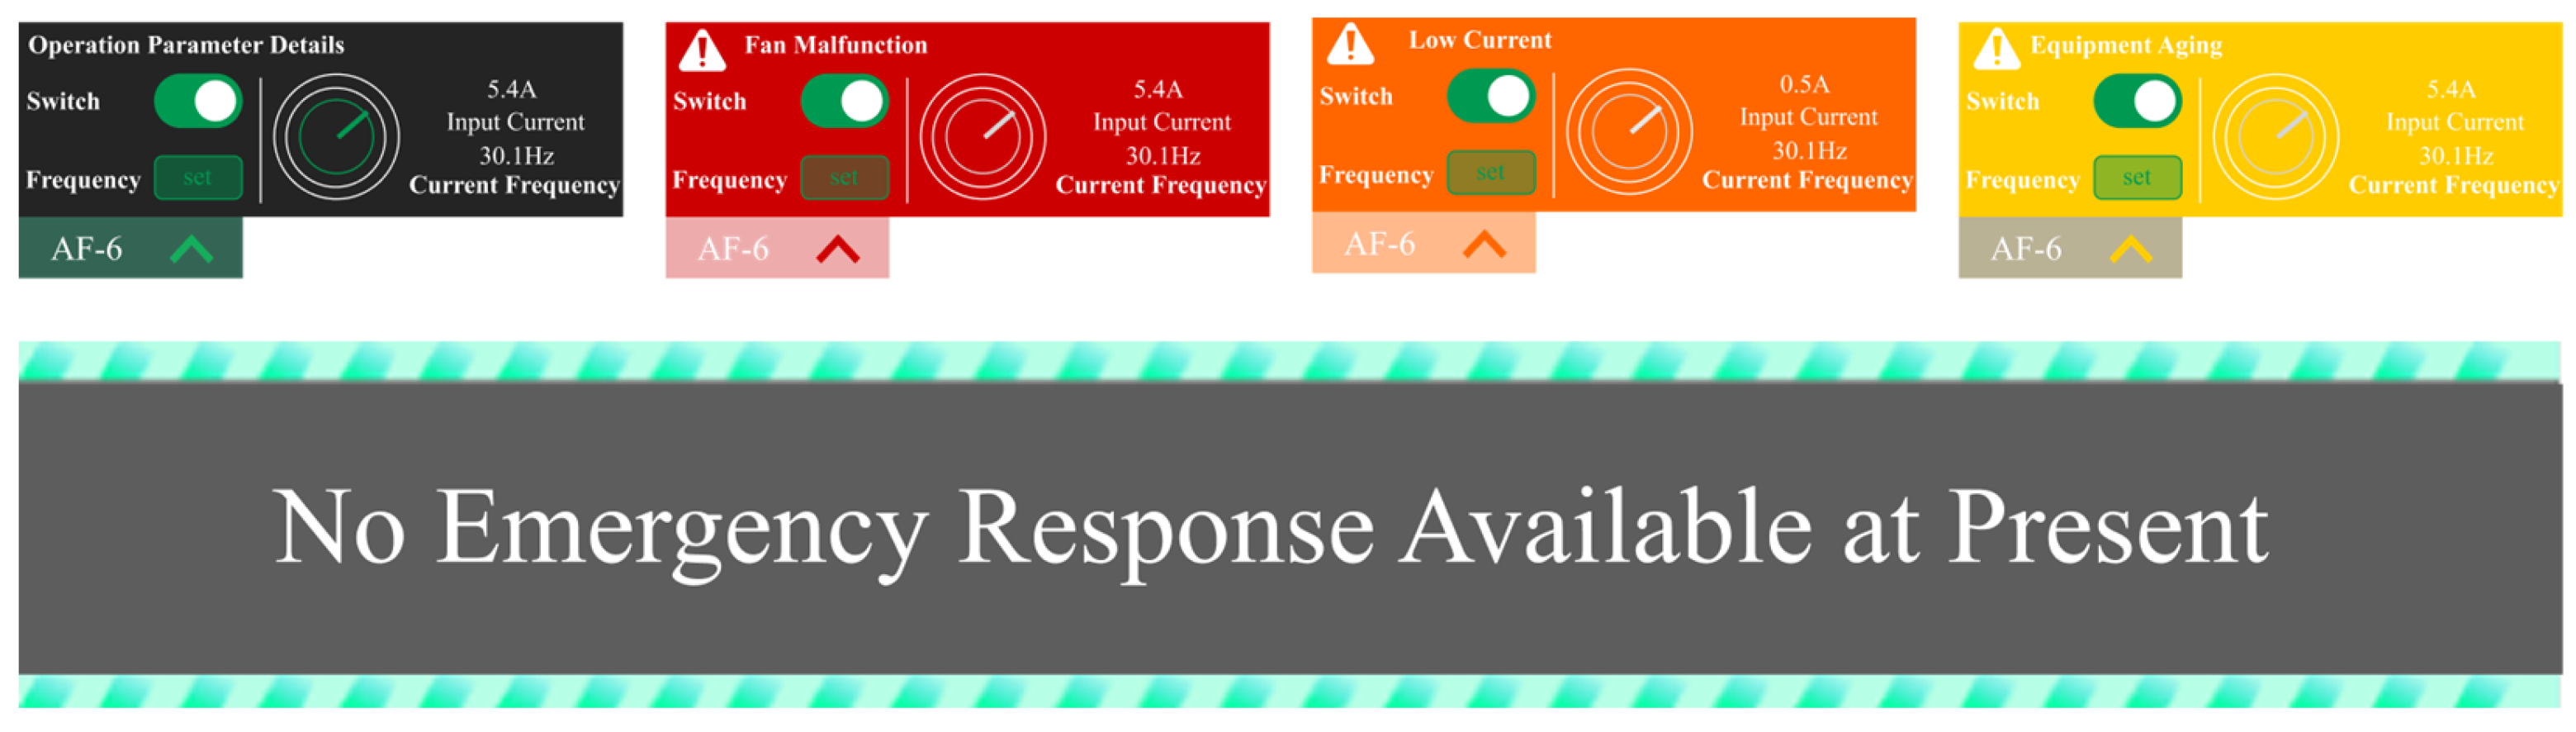
44], alarm levels were classified into three categories: Emergency, Critical, and Attention, corresponding to three standard safety color codes of red, orange, and yellow respectively, as detailed in
Figure 4. During the experiment, blank images without alarm information were randomly interspersed among stimulus materials containing alarm information, forming an experimental group with a 25% occurrence probability of alarm information to avoid learning effects in participants. All participants completed all trials, and the presentation order of the stimulus images was fully randomized.
3.3. Experimental Equipment and Subjects
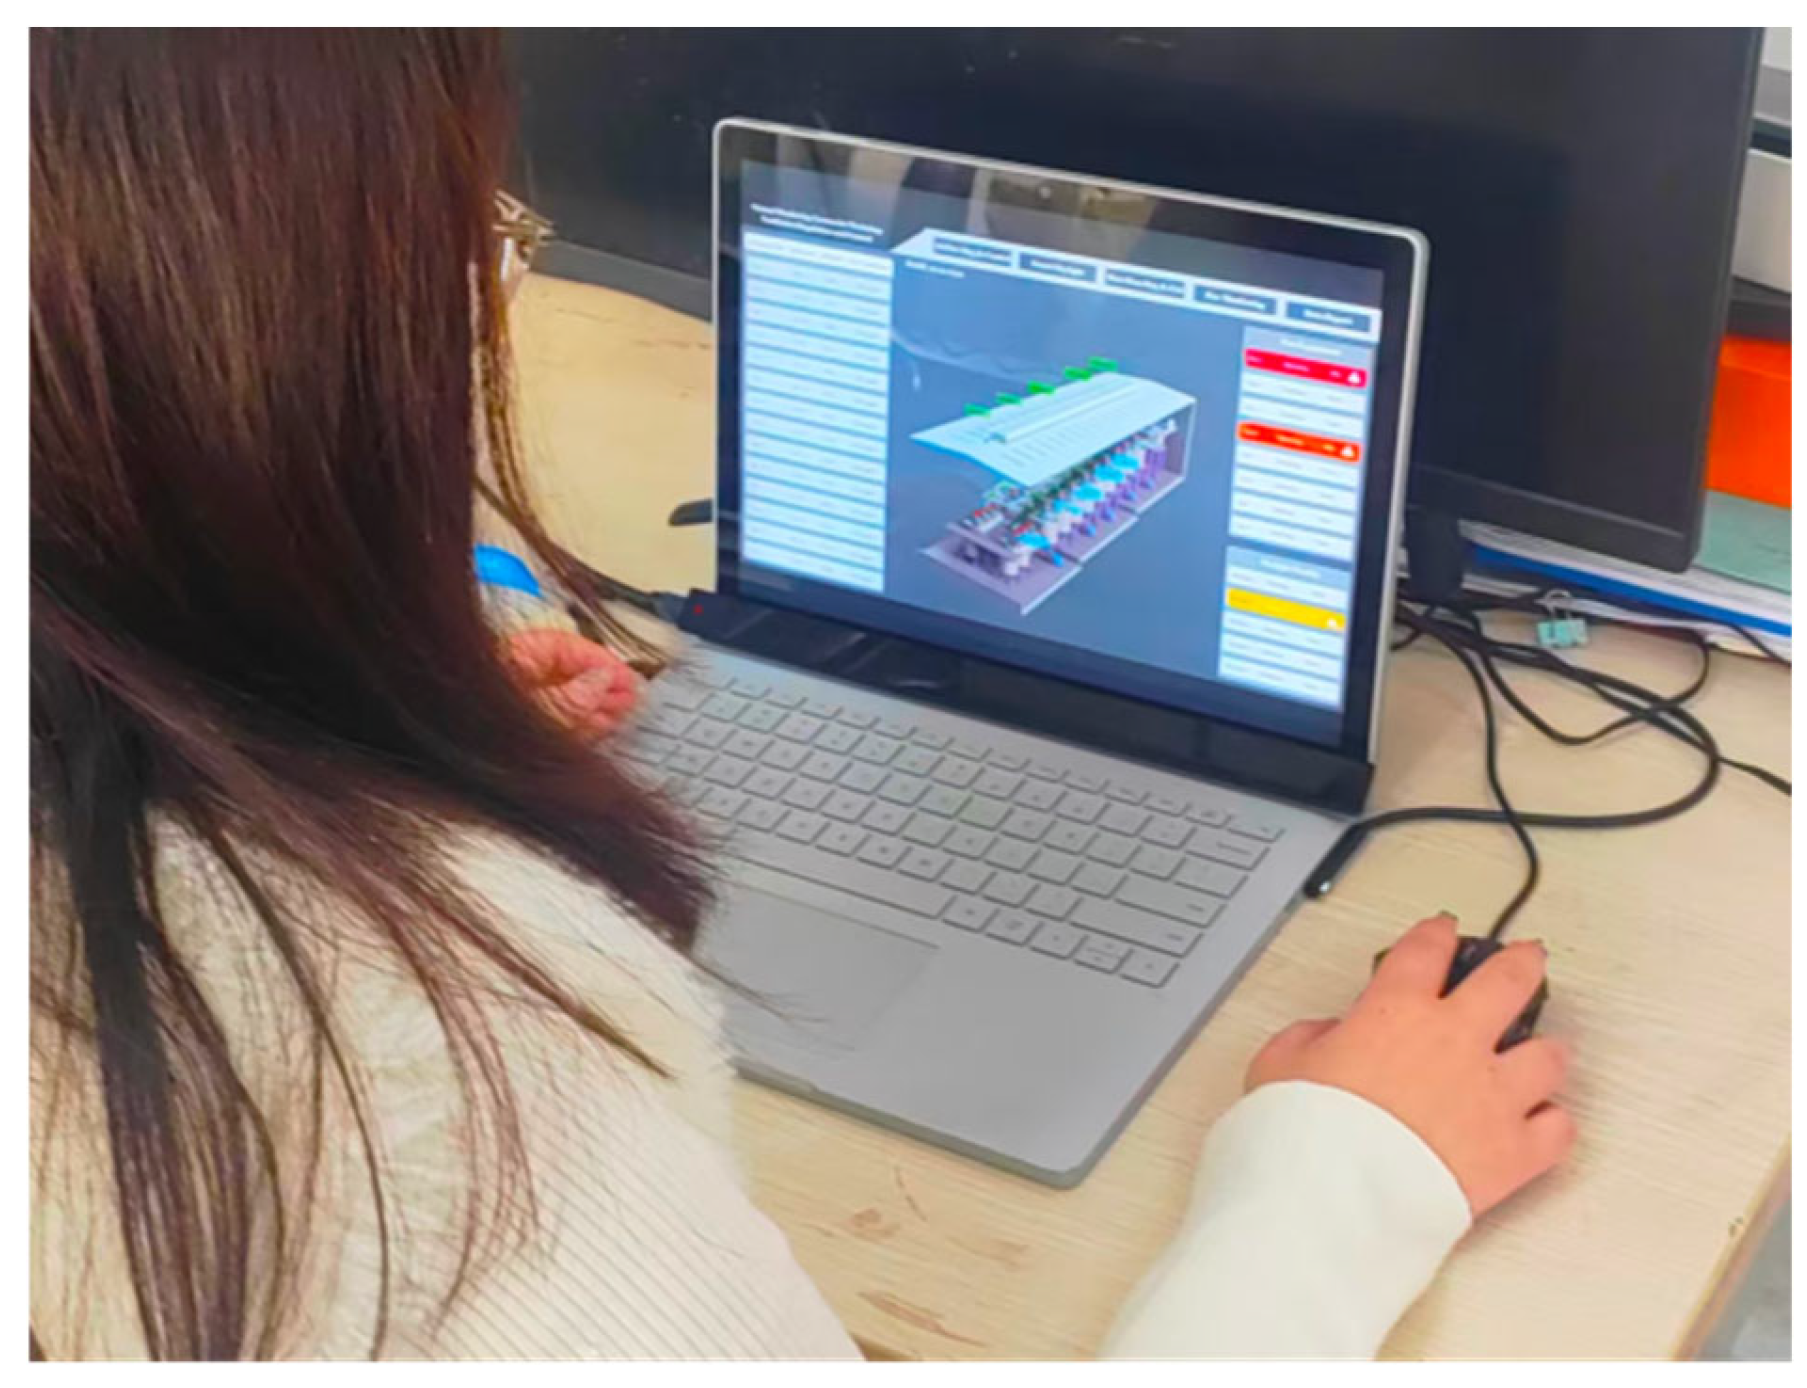
The experiment was conducted at the Intelligent Interaction Laboratory of China University of Mining and Technology, as shown in
Figure 5. Eye movement data were collected using the ErgoLAB Man-Machine-Environment Synchronization Platform combined with a Tobii X3-120 screen-based eye tracker (Tobii, Danderyd, Sweden), at a sampling frequency of 120 Hz. The experimental interface was presented on a 27-inch professional monitor with a resolution of 2560 × 1440 and a refresh rate of 144 Hz. During the experiment, the distance between the participants and the screen was maintained at 550~600 mm, and the head position was fixed with a chin rest to ensure the stability and accuracy of eye movement data acquisition.
A total of 24 participants with experience in operating industrial monitoring systems were recruited for the experiment. The sample size met the statistical power requirements of the within-subjects design for cognitive experiments on human–machine interfaces. The participants comprised 13 males and 11 females, aged 22 to 35 years with a mean age of 25.8 years, including postgraduate students majoring in industrial design and young practitioners from the mineral processing industry. The core rationale for selecting this population was to match the industrial scenario attributes of this study, ensuring that participants had basic operational cognition of industrial monitoring systems and scenario comprehension ability, thus avoiding data bias caused by a lack of scenario cognition. Meanwhile, the concentrated age range and balanced gender ratio could effectively control the interference of extraneous variables and improve the internal validity of the experiment.
All participants had normal or corrected-to-normal visual acuity, no color blindness or color weakness, and no history of psychiatric or neurological disorders, to guarantee the accuracy of visual information recognition and eye movement data acquisition. All participants signed informed consent forms prior to the experiment, and this study fully complied with relevant ethical guidelines.
3.4. Experimental Tasks and Procedures
The experiment was set up as two core task scenarios, single-target and multi-target, which respectively simulated the actual operating conditions of independent single-alarm occurrences and concurrent multi-alarm events in industrial production. In the single-target task, participants only needed to quickly locate the alarm-triggering device in the scenario and press the spacebar to complete confirmation, without distinguishing alarm levels. In the multi-target task, participants were required to screen the device with the highest alarm level on the screen, and complete feedback by pressing the keys “A (Emergency)”, “S (Critical)”, and “D (Attention)” corresponding to the alarm level. When no alarm stimulus was presented, participants needed to press the “L” key for confirmation.
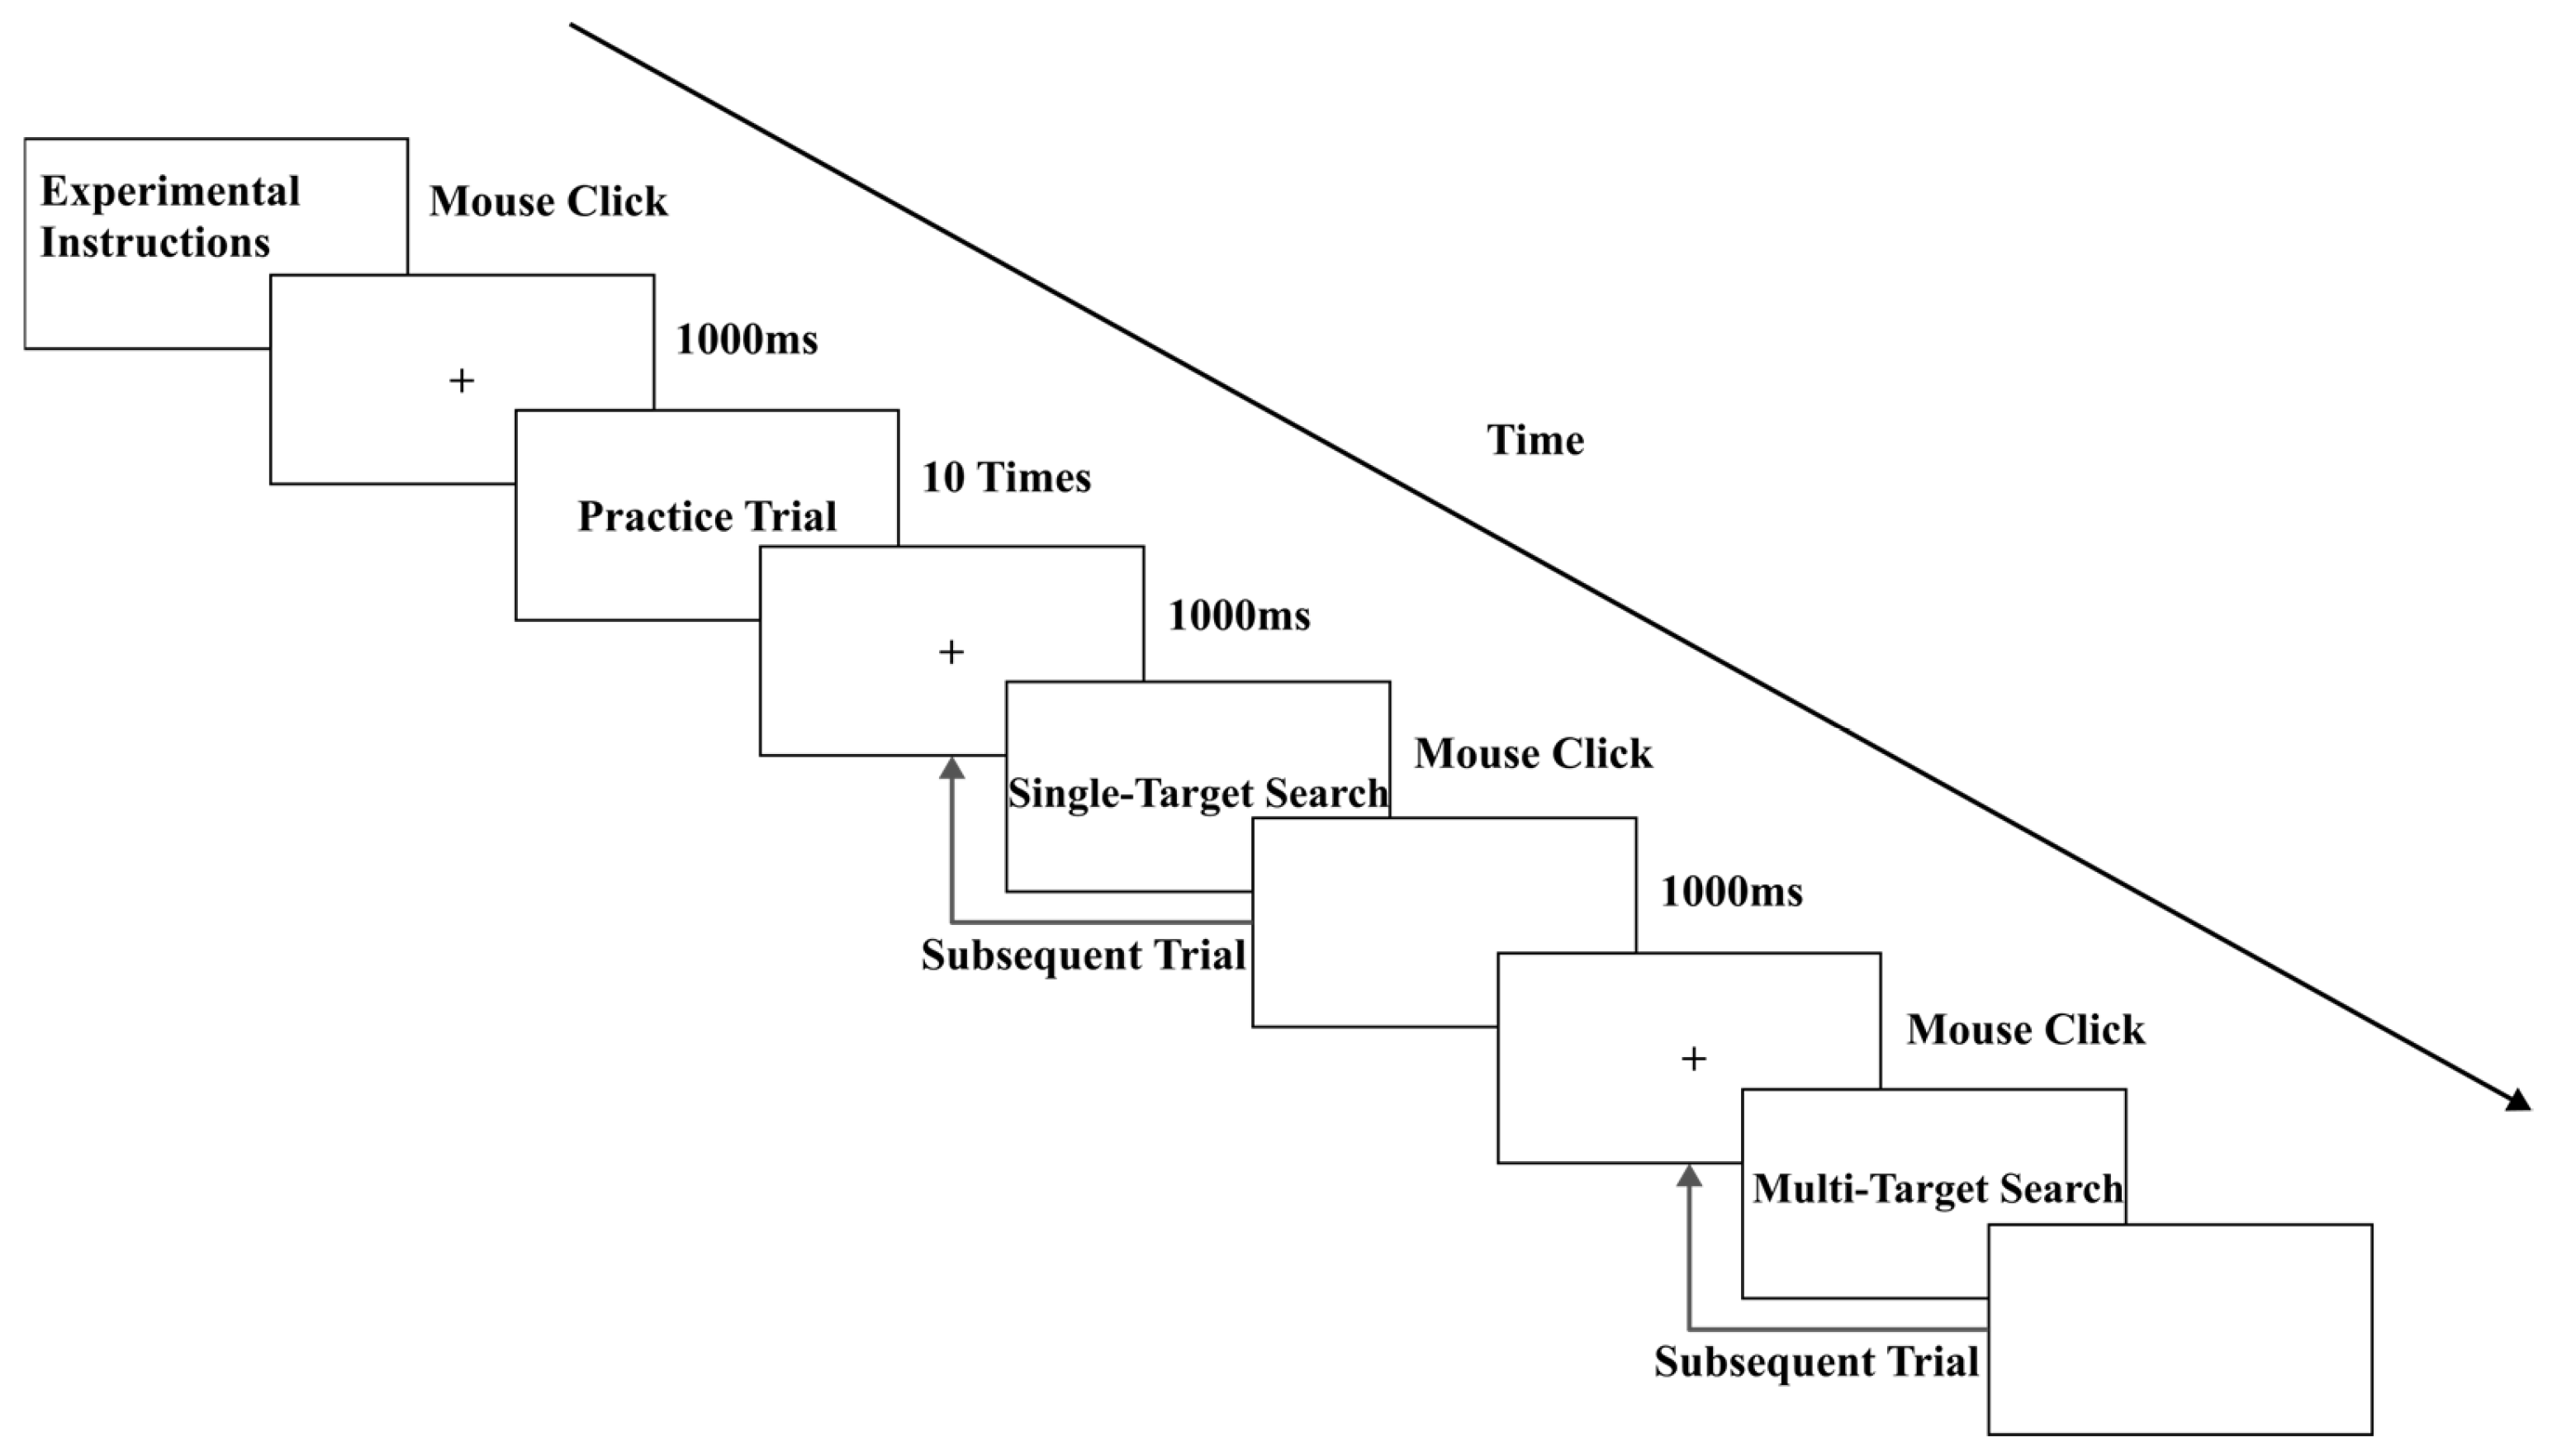
The entire experiment was divided into three phases—training, formal experiment, and subjective evaluation—with the detailed experimental procedure shown in
Figure 6.
Training phase: Prior to the formal experiment, participants completed approximately 20 min of adaptive training to familiarize themselves with the alarm coding rules, task operation modes, and experimental procedure. They also finished progressive training tasks ranging from single-alarm to concurrent multi-alarm scenarios. Only participants with a training accuracy rate above 85% were allowed to enter the formal experiment.
Formal experiment phase: The sequence of trials was randomly presented in accordance with the pre-set protocol. At the start of each trial, a “+” fixation cross was first presented in the center of the screen for 1000 ms, followed by a 1000 ms blank screen to guide participants to focus their attention. The stimulus image containing alarm information was then presented, and participants completed the key-press response according to the task requirements. A 1000 ms inter-trial blank screen was set between trials to reduce visual fatigue, and a 2 min rest period was arranged after each block of trials to avoid the impact of the fatigue effect on experimental data. Throughout the experiment, participants’ eye movement trajectories, key-press operation data, and reaction time (RT) of each trial were synchronously recorded via the ErgoLAB platform.
Subjective evaluation phase: After the formal experiment, all participants completed the NASA Task Load Index (NASA-TLX) subjective task load assessment scale. They rated the cognitive load under different experimental conditions across six core dimensions—Mental Demand, Physical Demand, Temporal Demand, Performance, Effort, and Frustration—to provide supplementary evidence for the cognitive load analysis of the alarm interface design.
The total experimental duration for each participant was approximately 30 min.
3.5. Experimental Results and Discussion
Statistical analysis of the experimental data was performed using SPSS 26.0 software. The Shapiro–Wilk test results showed that the data of each group conformed to a normal distribution (
p > 0.05). When the sphericity assumption of the repeated-measures analysis of variance (ANOVA) was violated, the Greenhouse–Geisser correction was applied for adjustment. The descriptive statistical results of reaction time (RT) and accuracy rate under different experimental conditions are detailed in
Table 1.
3.5.1. Reaction Time
The results of the repeated-measures ANOVA for reaction time (RT) are detailed in
Table 2, which shows that the main effect of target quantity was significant (F(1,23) = 7.676,
p = 0.012, η
2 = 0.288), with the mean RT of participants in the multi-target task significantly longer than that in the single-target task; the main effect of alarm display position was significant (F(2,46) = 35.172,
p < 0.001, η
2 = 0.649); and the main effect of alarm presentation format was significant (F(1,23) = 17.119,
p = 0.001, η
2 = 0.474). Under the same task conditions, the RT of the background color-filled group was significantly shorter than that of the text-filled group.
The results of LSD post hoc multiple comparisons for different alarm display positions are detailed in
Table 3, which shows that the reaction time (RT) of the display position adjacent to the 3D model was significantly shorter than that of the fixed top–center position of the screen (
p < 0.001) and the 2D list panel position (
p < 0.001). There was no statistically significant difference in RT between the fixed top–center position of the screen and the 2D list panel position (
p = 0.092).
No significant two-way interaction effect was observed between any pair of variables, while the three-way interaction effect of target quantity × display position × presentation format was statistically significant (F(2,46) = 6.830,
p = 0.003, η
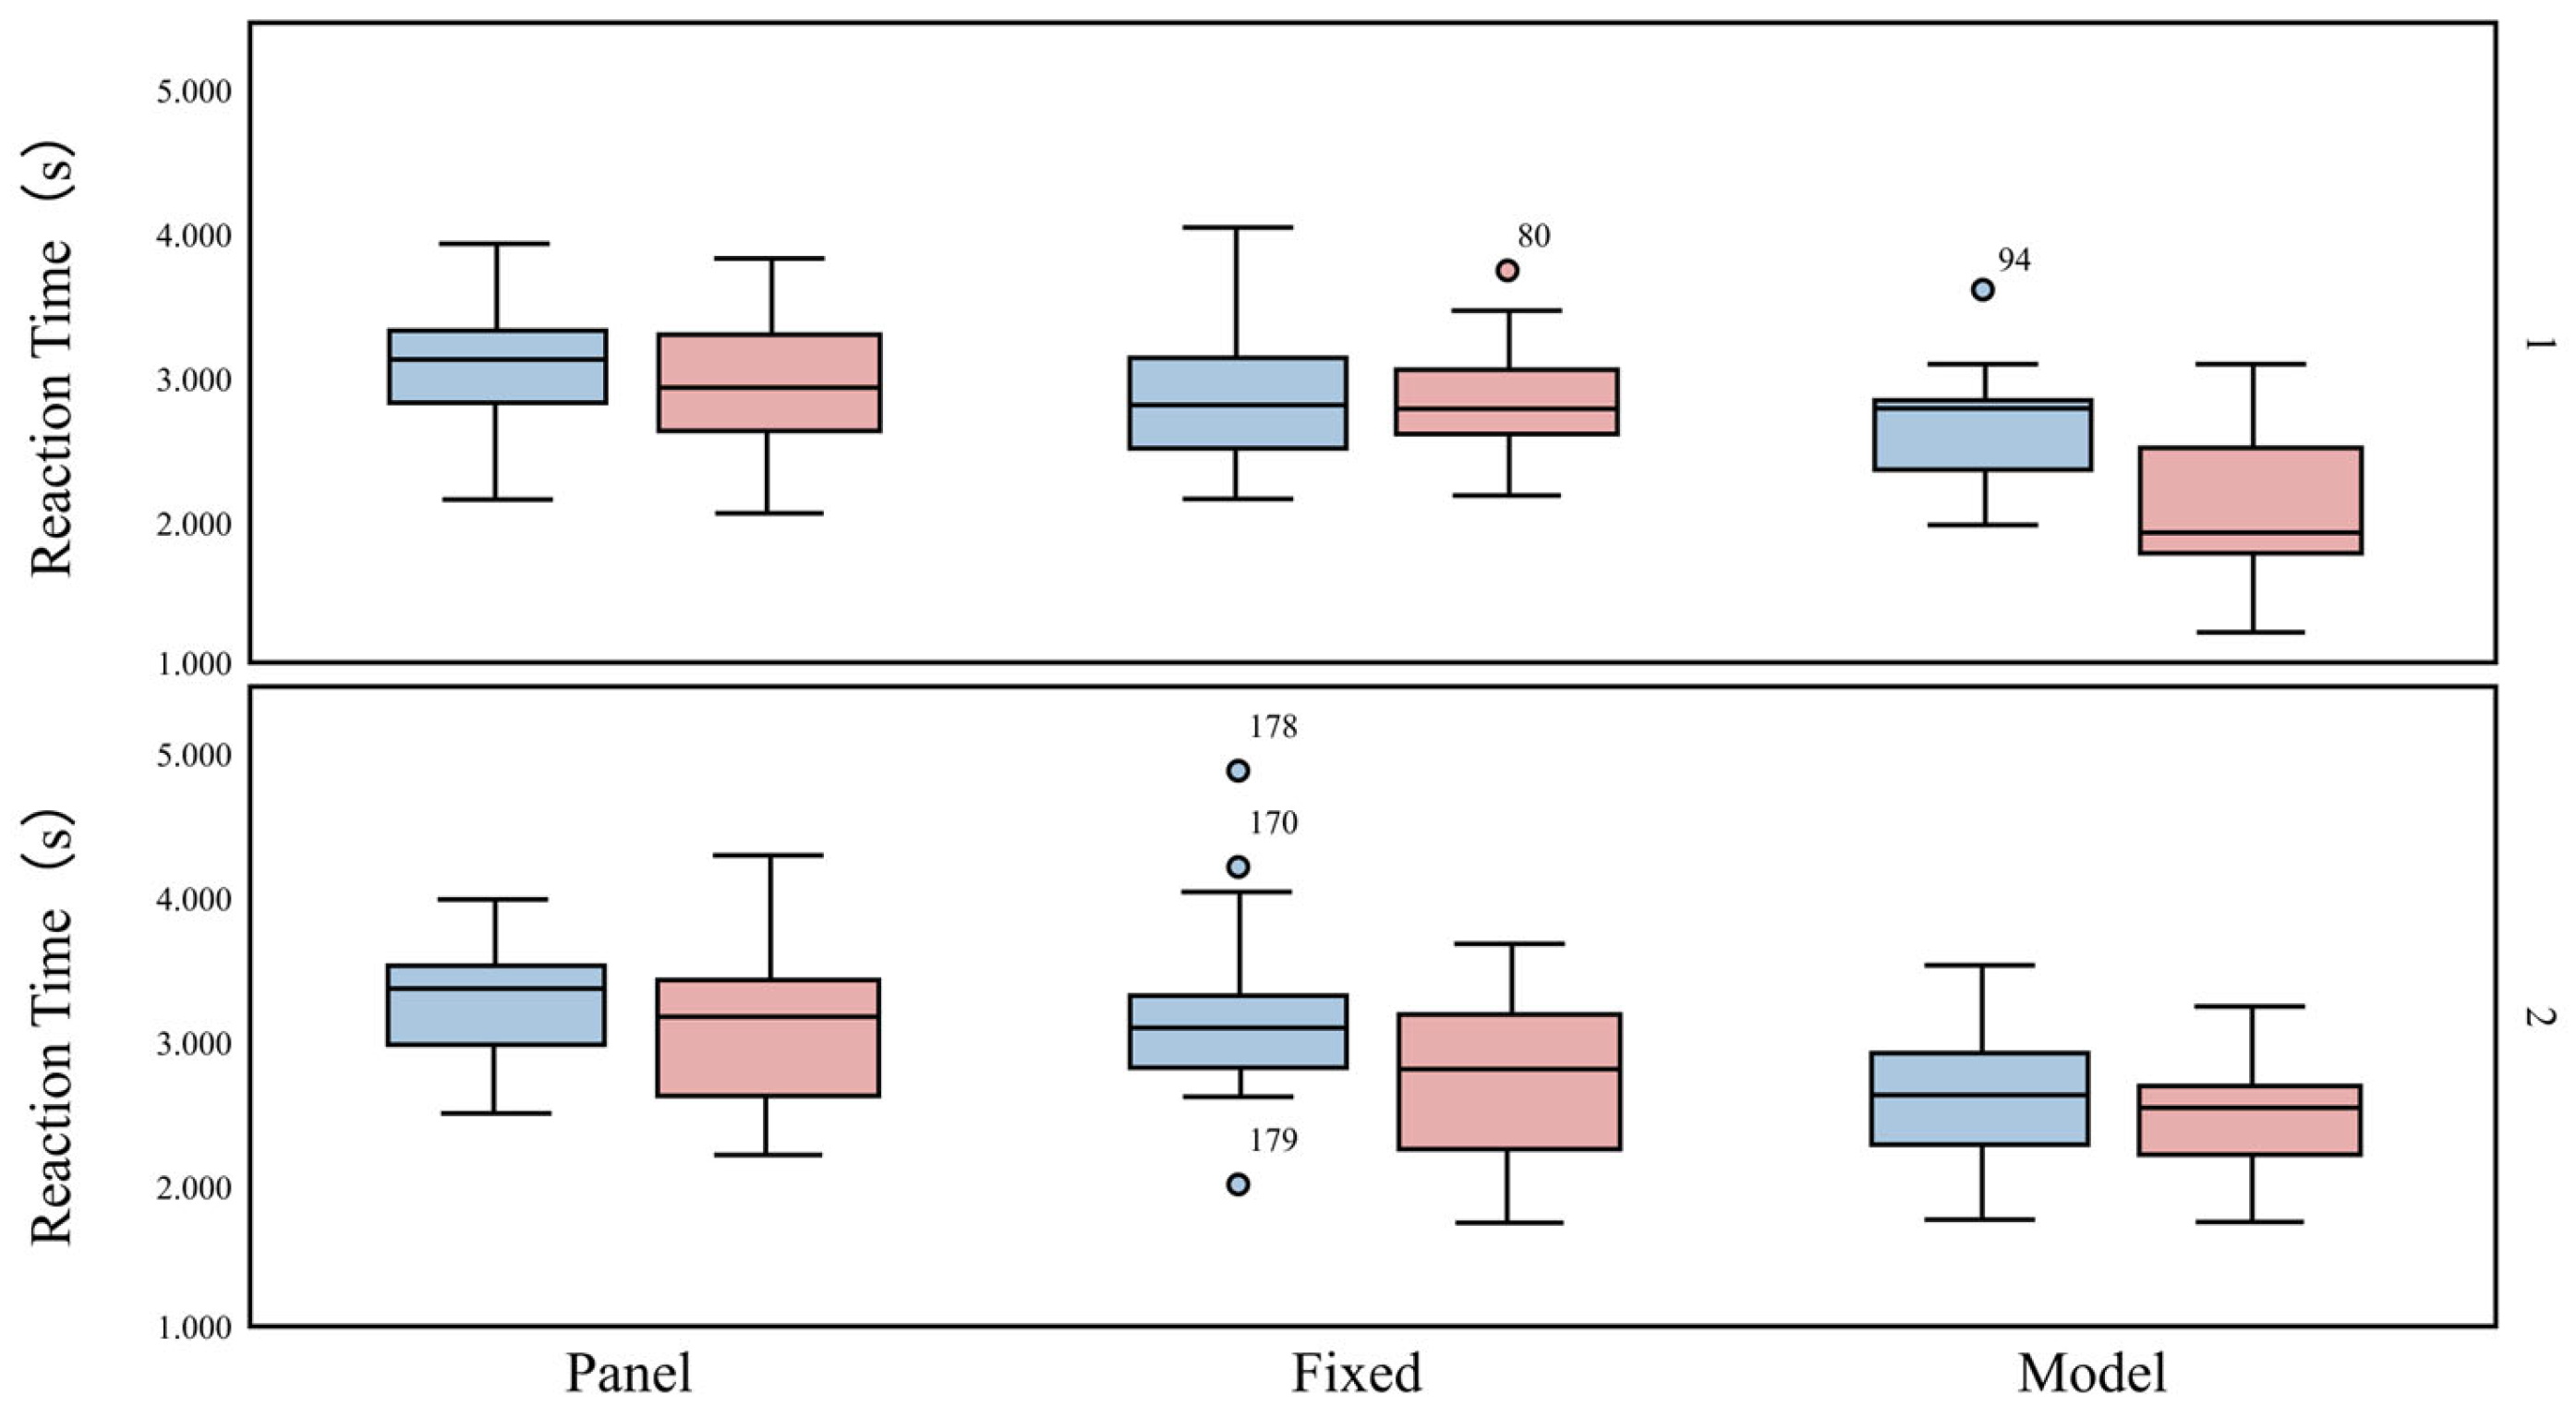
2 = 0.264). Simple effect decomposition revealed that, in the multi-target task, the combination of “background color-filled + display adjacent to the 3D model” yielded the shortest reaction time (RT) (M = 2.460 s, SD = 0.415 s), while the combination of “text-filled + 2D list panel” resulted in the longest RT (M = 3.248 s, SD = 0.410 s). In contrast, in the single-target task, there were only minor differences in RT across different design combinations, with a gentle changing trend, as detailed in
Figure 7.
3.5.2. Accuracy Rate
The results of the repeated-measures ANOVA for accuracy rate are detailed in
Table 4, which shows that the main effect of target quantity on accuracy rate was significant (F(1,23) = 271.188,
p < 0.001, η
2 = 0.935), with the accuracy rate in the multi-target task significantly lower than that in the single-target task; the main effect of alarm display position was significant (F(2,46) = 285.972,
p < 0.001, η
2 = 0.938), with the accuracy rate of the display position adjacent to the 3D model significantly higher than that of the other two positions; the main effect of alarm presentation format was not significant (F(1,23) = 2.694,
p = 0.117, η
2 = 0.124), indicating that text-filled and background color-filled formats had no significant effect on participants’ judgment accuracy.
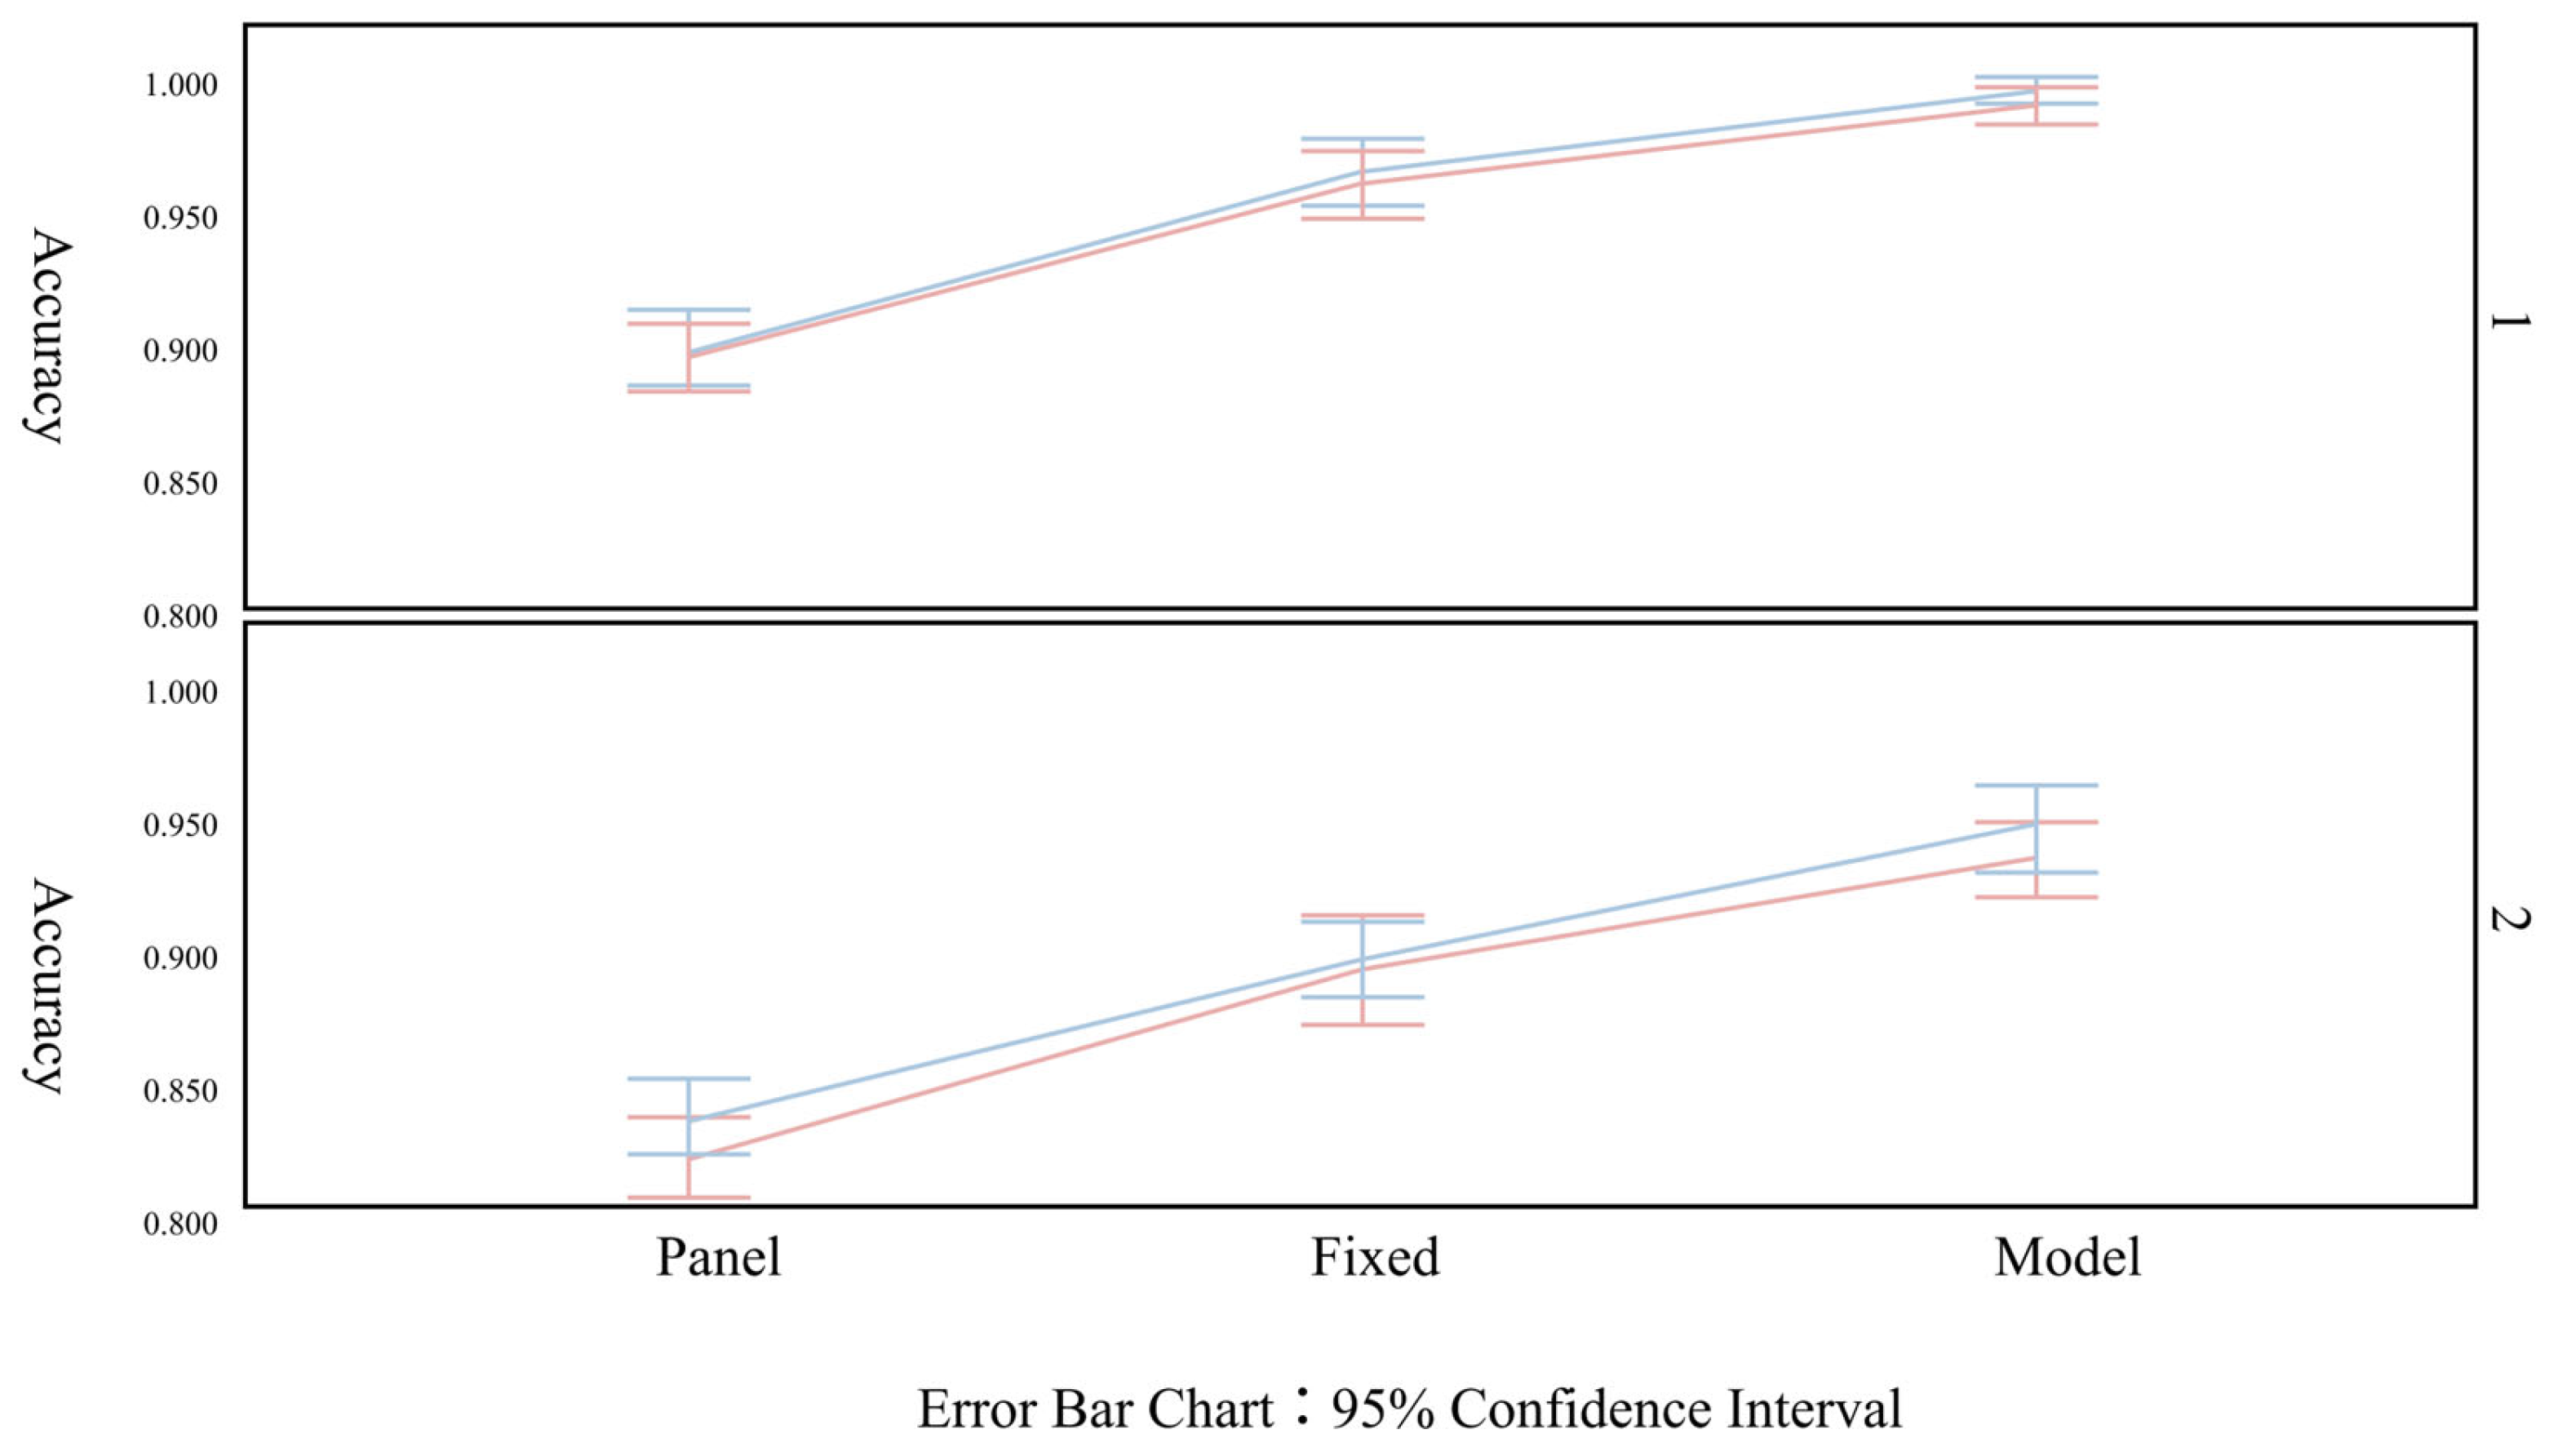
None of the two-way or three-way interaction effects were statistically significant, indicating that the accuracy rate was mainly affected by task target quantity and alarm display position, while the alarm presentation format had a limited impact on accuracy rate. The overall accuracy rate of the multi-target task was lower than that of the single-target task, during which the most significant drop in accuracy rate was observed under the “text-filled + 2D list panel” condition. The changing trend of accuracy rate is detailed in
Figure 8.
3.5.3. Subjective Cognitive Load Analysis Based on NASA-TLX Scale
The mean total score of subjective cognitive load measured by the NASA-TLX scale for the 24 participants was 51.7 ± 9.2. Among all variables, the main effect of target quantity on subjective cognitive load was the most significant: the mean total score under the single-target task was 40.3 ± 6.8, while that under the multi-target task was 63.1 ± 8.5, with a statistically significant difference (t = 10.89,
p < 0.001). This result was consistent with the objective performance outcomes of longer reaction time (RT) and lower accuracy rate in the multi-target task. The overall characteristics of scores across all dimensions of the scale are detailed in
Table 5.
From the perspective of dimensional composition, “Temporal Demand” (M = 59.4 ± 8.7) and “Effort” (M = 57.2 ± 9.1) were the main sources of cognitive load, while the score for “Physical Demand” was the lowest (M = 20.6 ± 5.3), which is consistent with the interaction characteristic that the virtual monitoring system only requires keyboard and mouse operation. The mean total score of subjective cognitive load for the display position adjacent to the 3D model was the lowest (44.8 ± 7.6), significantly lower than those for the top–center screen position (52.9 ± 8.3, p < 0.01) and the 2D list panel position (61.5 ± 9.5, p < 0.001), showing high consistency with the objective performance results. The mean total score of subjective cognitive load in the background color-filled group (47.9 ± 7.8) was significantly lower than that in the text-filled group (55.5 ± 8.6, p < 0.05), with the core difference concentrated in the “Effort” dimension.
In the multi-target task, the combination of “background color-filled + display adjacent to the 3D model” yielded the lowest total cognitive load score (42.5 ± 6.7), which was significantly better than the other combinations (
p < 0.001). In the single-target task, there was no statistically significant difference in subjective cognitive load among different combinations (
p > 0.05). The total cognitive load scores under different experimental conditions are detailed in
Table 6.
3.6. Discussion
This experiment, based on the three-dimensional framework of Cognitive Load Theory (CLT), systematically investigated the effects of alarm interface design elements on operators’ cognitive performance and cognitive load in the virtual monitoring scenario of a flotation workshop. The experimental results can be fully explained by the mechanism of CLT and also provide theoretical and empirical support for virtual monitoring interface design in high-risk industrial scenarios.
The combination of display adjacent to the 3D model + background color-filled achieved the best performance in reaction time, accuracy rate, and subjective cognitive load. In the single-target task, it reached a reaction time of 2.067 s and an accuracy rate of 99.5%; in the multi-target task, it achieved a reaction time of 2.460 s and an accuracy rate of 94.6%. Its core advantage stems from the effective reduction in extraneous cognitive load throughout the entire cognitive process of human–computer interaction [
45]. In the information perception stage, background color filling utilizes the pre-attentive processing characteristics of human vision and directly conveys alarm levels via industrial-standard safety colors, eliminating the semantic decoding step required for text filling and reducing cognitive consumption in the perception stage [
46,
47]. In the attention allocation stage, the spatial binding of alarm information to the equipment model completely eliminates the cost of visual switching and attention shifting between the “alarm list—scene equipment” in the traditional 2D list panel design, greatly shortening the visual search path [
48]. In the memory processing stage, the spatially correlated information presentation reduces the occupation of working memory, as operators do not need to additionally store the mapping relationship between “alarm information—equipment location”, further reducing unnecessary cognitive consumption [
49]. This is also confirmed by the significantly lower scores of the 3D model adjacent display position in the “Mental Demand” and “Effort” dimensions of the NASA-TLX scale.
The significant three-way interaction effect of target quantity, display position, and presentation format observed in the experiment also verifies the boundary effect of intrinsic cognitive load in CLT [
13]. In the low-complexity single-target task, the intrinsic cognitive load imposed by the task itself is very low, and the surplus cognitive resources of operators are sufficient to cover the extra consumption caused by interface design defects, so the performance differences among different design combinations are masked. In the high-complexity multi-target task, however, the intrinsic cognitive load is greatly increased, and the difference in extraneous cognitive load caused by interface design is fully amplified [
45]. This result also clarifies the core applicable scenario of cognitive-friendly design for industrial alarm interfaces—the more complex the working conditions with high load, parallel multi-tasking, and high time pressure, the more prominent the value of interface design optimization [
50].
The unexpected finding that alarm presentation format had no significant effect on accuracy rate essentially reflects the stage characteristics of cognitive processing. Reaction time mainly corresponds to the early stages of information perception and attention allocation, whose efficiency is primarily affected by the salience of visual stimuli and the length of the visual search path; this is the fundamental reason why background color filling can significantly shorten reaction time [
51]. Accuracy rate mainly corresponds to the later stages of semantic decoding and decision-making judgment, whose correctness depend on the integrity and clarity of information transmission. Since both coding formats in this experiment could convey the core information of alarm levels completely and without deviation, no significant difference was observed in accuracy rate.
4. Alarm Interface Optimization Strategies
Combined with the experimental results and the NASA-TLX scale, the design of alarm information display in the virtual monitoring system should give priority to the synergistic effect of the spatial position and display form of the alarm. Especially in multi-task and high-load environments, the combination of model position and background color filling can significantly optimize a user’s reaction time and accuracy rate, thereby improving the overall performance and safety of the system.
4.1. Optimization of Alarm Information Display
In terms of the display position of alarm information, the display positions beside the model and at the top of the screen are more effective than the 2D panel. This indicates that, in the ventilation control system, alarm information should be preferentially displayed in the user’s visual center area to quickly attract the user’s attention and reduce reaction time. Therefore, when an alarm occurs, a combination of multiple alarm methods is adopted, and alarm information is provided both in the center of the interface and beside the model, so that users can quickly associate the information with specific alarm equipment after noticing the alarm information (
Figure 9).
4.2. Design of Alarm Information
The real-time alarm component adopts color-filling coding as the level differentiation method: red indicates “Emergency”, orange indicates “Important”, and yellow indicates “Caution”. Referring to the experimental conclusions, the alarm information is presented in a card-style pop-up window beside the 3D visualization model. To ensure that users can focus on and quickly perceive alarm information in the case of multi-target alarms, alarm information is added at the top of the screen at the same time. This ensures that users can quickly capture the alarm information and locate the corresponding equipment. The background color is uniformly filled, combined with text and graphic identifiers to enhance recognizability and attention guidance. To adapt to the dark background, the text of the component is displayed in highlighted white, and transparency is set in the color-filled area to ensure that the information is prominent without blocking the model content (
Figure 10).
4.3. Lightweight Information and Multimodal Prompting Strategies
A single piece of real-time alarm information only retains three core contents: “equipment number (e.g., Fan 1)”, “fault type (e.g., Screw Loosened)”, and “alarm level”, excluding non-immediate demand parameters such as “historical fault frequency and maintenance records”. The size of a single alarm card is controlled at 120 px × 80 px to avoid occupying too much interface space; in the case of multi-target alarms, the system automatically sorts them in the order of “Emergency > Important > Caution”. The emergency alarm card is enlarged by 20% and added with a 2 Hz slight flashing effect (dynamic thickening of the border, no screen flicker interference) to guide the priority allocation of attention; visual prompts and auditory prompts cooperate—emergency alarms trigger “card flashing + 1 kHz single beep (duration 0.5 s)”, important alarms only have card highlighting without auditory prompts, and caution alarms maintain static display to avoid attention distraction caused by excessive auditory stimulation. After the operator clicks the alarm card, the card immediately displays a gray “Attention Paid” mark, and automatically jumps to the detailed page of the corresponding equipment (displaying real-time operating parameters such as fan speed and current), shortening the operation path of “identifying alarm—viewing details—executing regulation”.
5. Conclusions
This study breaks through the traditional binary analysis framework of “interface design–cognitive load”, and constructs a “Scenario Characteristics–Cognitive Requirements–Interface Design” coupling model for virtual monitoring in high-risk industrial scenarios. By incorporating the unique characteristics of the flotation workshop—high dynamics, strong interference, and high time pressure—into the analysis, it fills the research gap regarding the cognitive mechanism of virtual monitoring interfaces in the specific high-risk scenario of the mineral processing industry. The experiment reveals a significant three-way interaction effect among interface elements and task complexity, which corrects the cognitive misconception of “universal design optimization” in existing studies. It confirms that the effect of interface optimization is highly bound to task load, and the optimal control of cognitive load can only be achieved when design elements exert a synergistic effect. In terms of practical application, this study promotes the transformation of industrial monitoring interface design from “complete information presentation” to “controllable cognitive load”. It proves that the design pattern of “spatial binding + visual pre-attentive coding” can significantly improve response efficiency under high-load working conditions compared with the traditional 2D list alarm mode. This design logic can be extended to similar high-risk industrial scenarios, such as chemical engineering and mining, providing fundamental design principles for digital twin and VR/AR virtual monitoring systems, and can also be directly applied to the upgrade of existing monitoring interfaces.
Nevertheless, due to the constraints of the research stage, experimental control conditions, and on-site objective circumstances, there remains room for optimization and expansion. To ensure that participants had a basic understanding of the experimental tasks and industrial system operations, this study mainly recruited postgraduate students and young practitioners with experience in industrial system operation. Limited by the shift schedules of front-line staff, experimental time and venue, the sample did not cover on-site operators with different lengths of service, so the breadth and representativeness of the sample can be further improved. To strictly control the interference of extraneous variables and guarantee the internal validity of the core effect tests, this study only simulated the visual interference of workshop dust using a grayscale filter, and failed to fully reproduce the complex, multi-dimensionally coupled working conditions on site, such as dust, noise, and dynamic lighting changes. The ecological validity of the experiment can, therefore, be further enhanced. Meanwhile, to accurately isolate the independent effects of the core design elements, this study only focused on three key interface design elements, and did not include other important influencing variables, such as multimodal cues, information density, and individual cognitive differences. The comprehensiveness of the research dimensions, thus, needs to be expanded. In addition, restricted by on-site production safety and scheduling, this study only carried out controlled laboratory experiments and has not yet conducted field validation in real production scenarios. The field applicability of the conclusions still requires further examination.
Author Contributions
Conceptualization: J.S. and Z.-Y.C.; Methodology: J.S., Z.-Y.C. and G.-P.M.; Investigation: J.S., S.-S.J., H.-Y.F., Y.-P.L. and G.-P.M.; Formal Analysis: J.S.; Data Curation: J.S., S.-S.J., H.-Y.F., Y.-P.L. and G.-P.M.; Writing—Original Draft Preparation: J.S.; Writing—Review and Editing: Z.-Y.C.; Visualization: S.-S.J. and H.-Y.F.; Supervision: J.S.; Project Administration: J.S.; Funding Acquisition: J.S.; Validation: Z.-Y.C. and Y.-P.L. All authors have read and agreed to the published version of the manuscript.
Funding
This paper was financially supported by the National Key R&D Program of China (No. 2024YFC3015005).
Institutional Review Board Statement
Not applicable.
Informed Consent Statement
Not applicable.
Data Availability Statement
The raw data supporting the conclusions of this article will be made available by the authors on request.
Conflicts of Interest
The authors declare no conflicts of interest.
References
- Yin, W.; Hu, Y.; Ding, G.; Feng, L.; Chen, X. Research on the construction of digital twin virtual model of coal mills. Measurement 2025, 242, 116235. [Google Scholar] [CrossRef] [Scilit]
- Turysheva, A.; Kozhubaev, Y.; Yin, C.; Ershov, R.; Novak, D.; Poddubniy, D. Integrated control technologies for mechanized coal mining. Symmetry 2025, 17, 1947. [Google Scholar] [CrossRef] [Scilit]
- Akbulut, N.K.B.; Anani, A.; Adewuyi, S.O. Review of virtual reality integration for safer and efficient mining operations. IEEE Access 2025, 13, 34177–34199. [Google Scholar] [CrossRef] [Scilit]
- Zhang, X.; Wang, H.; Zhang, C.; Xiao, Y.; Ren, C. Augmented reality based decision support system in coal mine. Procedia Comput. Sci. 2022, 214, 892–897. [Google Scholar] [CrossRef] [Scilit]
- Zhang, M.; Su, C. Research and application of coal intelligent loading system based on AI technology. Clean Coal Technol. 2025, 31, 863–873. [Google Scholar]
- Yang, X.; Li, H. Digital twin-driven deep learning prediction and adaptive control for coal mine ventilation systems. Sci. Rep. 2025, 16, 940. [Google Scholar] [CrossRef] [Scilit]
- Liu, M.; Yue, C.; Xia, W.; Zhang, J.; Liu, X. Real-time monitoring of milling cutter status based on digital twin. Comput. Integr. Manuf. Syst. 2023, 29, 2118–2129. [Google Scholar]
- Yazdani, H.; Bosaghzadeh, A.; Ebrahimpour, R.; Dornaika, F. A computational–cognitive model of audio-visual attention in dynamic environments. Big Data Cogn. Comput. 2025, 9, 120. [Google Scholar]
- Yang, L.; Qi, B.; Guo, Q. The effect of icon color combinations in information interfaces on task performance under varying levels of cognitive load. Appl. Sci. 2024, 14, 4212. [Google Scholar] [CrossRef] [Scilit]
- Bach, B.; Freeman, E.; Abdul-Rahman, A.; Turkay, C.; Khan, S.; Fan, Y.; Chen, M. Dashboard design patterns. IEEE Trans. Vis. Comput. Graph. 2023, 29, 342–352. [Google Scholar]
- Fang, H.; Hu, Y.; Chen, S.; Yang, X.; Zhao, Y.; Niu, H.; Cai, C. Effects of interface design and spatial ability on teleoperation cognitive load and task performance. Displays 2025, 87, 102977. [Google Scholar] [CrossRef] [Scilit]
- Jeong, S.; Kim, J.; Lee, J. The differential effects of multisensory attentional cues on task performance in VR depending on the level of cognitive load and cognitive capacity. IEEE Trans. Vis. Comput. Graph. 2024, 30, 2703–2712. [Google Scholar] [CrossRef] [Scilit]
- Sweller, J. Cognitive Load During Problem Solving: Effects on Learning. Cogn. Sci. 1988, 12, 257–285. [Google Scholar] [CrossRef]
- Matseevich, S.V.; Vladko, U.A.; Zyuzina, A.D.; Mochalov, M.N.; Zakharov, A.S. Application of the cognitive load indicator of a graphic element to justify the requirements for a long-range discrimination radar visualization system. Sci. Vis. 2024, 16, 87–96. [Google Scholar] [CrossRef] [Scilit]
- Pei, H.; Wang, Z.; Cao, J.; Chen, Y.; Bai, Z. A cognitive load assessment method for fighter cockpit human-machine interface based on integrated multi-criteria decision making. Appl. Soft Comput. 2024, 167, 112287. [Google Scholar] [CrossRef] [Scilit]
- Tao, J.; Gong, J.; Gao, N.; Fu, S.; Liang, S.; Yu, C. Human-computer interaction for virtual-real fusion. J. Image Graph. 2023, 28, 1513–1542. [Google Scholar] [CrossRef] [Scilit]
- Sweller, J.; van Merriënboer, J.J.G.; Paas, F. Cognitive Architecture and Instructional Design: 20 Years Later. Educ. Psychol. Rev. 2019, 31, 261–292. [Google Scholar] [CrossRef] [Scilit]
- Laera, F.; Manghisi, V.M.; Evangelista, A.; Uva, A.E.; Foglia, M.M.; Fiorentino, M. Evaluating an augmented reality interface for sailing navigation: A comparative study with an immersive virtual reality simulator. Virtual Real. 2023, 27, 929–940. [Google Scholar] [CrossRef] [Scilit]
- Li, S.; Yu, J.; Li, M.; Liu, L.; Zhang, X.; Yuan, X. A framework for multiclass contour visualization. IEEE Trans. Vis. Comput. Graph. 2023, 29, 353–362. [Google Scholar] [CrossRef] [Scilit]
- Du, P.; Li, D.; Liu, T.; Zhang, L.; Yang, X.; Li, Y. Crisis map design considering map cognition. ISPRS Int. J. Geo-Inf. 2021, 10, 692. [Google Scholar] [CrossRef] [Scilit]
- Gauthier, A.; Porayska-Pomsta, K.; Dumontheil, I.; Mayer, S.; Mareschal, D. Manipulating interface design features affects children’s stop-and-think behaviours in a counterintuitive-problem game. ACM Trans. Comput.-Hum. Interact. 2022, 29, 1–21. [Google Scholar] [CrossRef] [Scilit]
- Kwon, Y.H.; Kwon, Y.B.; Nwagbala, D.C.; Park, J.Y. The cognitive load limits of multiple safety signs. Buildings 2024, 14, 2391. [Google Scholar] [CrossRef] [Scilit]
- Schreiber, C.; Abbad-Andaloussi, A.; Weber, B. On the cognitive and behavioral effects of abstraction and fragmentation in modularized process models. Inf. Syst. 2024, 125, 102424. [Google Scholar] [CrossRef] [Scilit]
- Kim, H.; Kim, M.; Han, Y. Models for classifying cognitive load using physiological data in healthcare context: A scoping review. Appl. Sci. 2025, 15, 9155. [Google Scholar] [CrossRef] [Scilit]
- Islam, F.; Bright, Z.; Chen, M.-H.; Zhan, L.; Shi, C. Evaluating the effect of immersive virtual reality technologies on cognitive load, situation awareness, and engagement using eye movements. Appl. Ergon. 2026, 134, 104720. [Google Scholar] [CrossRef] [Scilit]
- Clark, J.; Boz, L. Exploring the Effects of Visual and Auditory Distractors in Virtual Reality on Perceived Cognitive Load and Cognitive Alertness. WSEAS Trans. Inf. Sci. Appl. 2025, 22, 358–372. [Google Scholar] [CrossRef] [Scilit]
- Zhang, G.; Gong, J.; Zhang, D. Research on spatial cognitive load characteristics of augmented reality maps on different carriers. J. Geo-Inf. Sci. 2024, 26, 99–109. [Google Scholar]
- Wang, A.; Huang, C.; Wang, J.; He, D. The association between physiological and eye-tracking metrics and cognitive load in drivers: A meta-analysis. Transp. Res. Part F Traffic Psychol. Behav. 2024, 104, 474–487. [Google Scholar] [CrossRef] [Scilit]
- Cai, R.; Dai, S.; Wu, X.; Song, X.; Li, M.; Hu, D. Few-shot cross-subject EEG cognitive load assessment based on global cross-attention domain adaptation. IEEE Sens. J. 2025, 1. [Google Scholar] [CrossRef] [Scilit]
- Bolton, M.L.; Biltekoff, E.; Humphrey, L. The mathematical meaninglessness of the NASA Task Load Index: A level of measurement analysis. IEEE Trans. Hum.-Mach. Syst. 2023, 53, 590–599. [Google Scholar] [CrossRef] [Scilit]
- Kia, K.; Hwang, J.; Kim, I.-S.; Ishak, H.; Kim, J.H. The effects of target size and error rate on the cognitive demand and stress during augmented reality interactions. Appl. Ergon. 2021, 97, 103502. [Google Scholar] [CrossRef] [Scilit]
- Reis, T.; Dumberger, L.; Bruchhaus, S.; Krause, T.; Schreyer, V.; Bornschlegl, M.X.; Hemmje, M.L. AI-based user empowerment for empirical social research. Big Data Cogn. Comput. 2024, 8, 11. [Google Scholar] [CrossRef] [Scilit]
- Sokol, M.; Hejda, J.; Volf, P.; Leová, L.; Kutílek, P. Efficient cognitive load decoding using causal spatiotemporal patterns from multimodal physiological signals. Comput. Biol. Med. 2025, 197, 111063. [Google Scholar] [CrossRef] [Scilit] [PubMed]
- Said, R.R.; Bin Heyat, M.B.; Song, K.; Tian, C.; Wu, Z. A systematic review of virtual reality and robot therapy as recent rehabilitation technologies using EEG-brain-computer interface based on movement-related cortical potentials. Biosensors 2022, 12, 1134. [Google Scholar] [CrossRef] [Scilit]
- Kyriaki, K.; Koukopoulos, D.; Fidas, C.A. A comprehensive survey of EEG preprocessing methods for cognitive load assessment. IEEE Access 2024, 12, 23466–23489. [Google Scholar] [CrossRef] [Scilit]
- He, X.; He, S.; Shao, J. Research status and development trend of cognitive load in human-computer interaction. Comput. Integr. Manuf. Syst. 2023, 29, 1069–1081. [Google Scholar]
- Jin, H.; Zhu, L.; Li, M.; Duffy, V.G. Recognition and evaluation of mental workload in different stages of perceptual and cognitive information processing using a multimodal approach. Ergonomics 2024, 67, 377–397. [Google Scholar]
- Chen, X.; Tang, X.; Luo, Z.; Zhang, J. Evaluating user cognition of network diagrams. Vis. Inform. 2021, 5, 26–33. [Google Scholar] [CrossRef] [Scilit]
- Li, X.; Zheng, C.; Pan, Z.; Huang, Z.; Niu, Y.; Wang, P.; Geng, W. Comparative study on 2D and 3D user interface for eliminating cognitive loads in augmented reality repetitive tasks. Int. J. Hum.-Comput. Interact. 2024, 40, 8008–8024. [Google Scholar]
- Chen, T.; Wang, L.; Huang, B.; Yu, J.; Wu, Y. Pursued spatial perception benefit considering attractiveness and cognitive load: Appropriate visual complexity of indoor commercial space. J. Build. Eng. 2024, 98, 111144. [Google Scholar] [CrossRef] [Scilit]
- Belkhiria, C.; Peysakhovich, V. EOG metrics for cognitive workload detection. Procedia Comput. Sci. 2021, 192, 1875–1884. [Google Scholar] [CrossRef] [Scilit]
- Blundell, J.; Collins, C.; Sears, R.; Plioutsias, T.; Huddlestone, J.; Harris, D.; Harrison, J.; Kershaw, A.; Harrison, P.; Lamb, P. Multivariate analysis of gaze behavior and task performance within interface design evaluation. IEEE Trans. Hum.-Mach. Syst. 2023, 53, 875–884. [Google Scholar] [CrossRef] [Scilit]
- Warden, A.C.; Wickens, C.D.; Rehberg, D.; Ortega, F.R.; Clegg, B.A. Fast, accurate, but sometimes too-compelling support: The impact of imperfectly automated cues in an augmented-reality head-mounted display on visual search performance. IEEE Trans. Hum.-Mach. Syst. 2023, 53, 1061–1072. [Google Scholar] [CrossRef] [Scilit]
- GB 2893-2008; Safety Colours. Standardization Administration of China: Beijing, China, 2008.
- Pei, H.; Wang, Z.; Ding, M.; Bai, Z.; Gong, H.; Cao, J.; Chen, Y. The effects of light and noise levels and task types on the visual cognitive load of pilots. Int. J. Ind. Ergon. 2025, 107, 103747. [Google Scholar] [CrossRef] [Scilit]
- Huang, Y.T.; Hsu, C.C.; Wang, T.H. Effects of interactive loading interfaces for virtual reality game environments on time perception, cognitive load, and emotions. Front. Virtual Real. 2025, 6, 1540406. [Google Scholar] [CrossRef] [Scilit]
- Yao, X.; Gan, Y.; Jiang, A.; Shen, Y.; Feng, B.; Guo, Y. An Association Study on Response Performance and Warning Color in Spacecraft Alarm Interface. J. Manned Spacefl. 2023, 29, 378–385. [Google Scholar]
- Wang, H.; Yu, S.; Chen, D.; Zhang, W.; Chen, C. Task-oriented importance evaluation of human-computer interaction information for manned deep submersibles. Comput. Integr. Manuf. Syst. 2024, 30, 1683–1693. [Google Scholar]
- Zhou, Y.; Chen, D.-K.; Tan, X.-X.; Zhao, M. Study on Visual Search Performance of Cockpit Interfaces Under Time Pressures. J. Northeast. Univ. Nat. Sci. 2023, 44, 1514–1520. [Google Scholar]
- Lu, N.; Li, M. Research on the design of alarm information interface of fully automatic driving vehicle. In International Conference on Man-Machine-Environment System Engineering; Lecture Notes in Electrical Engineering; Springer: Singapore, 2023; Volume 1069, pp. 416–423. [Google Scholar]
- De Bruyne, J.; Joundi, J.; Morton, J.; Zheleva, A.; Van Kets, N.; Van Wallendael, G.; Talsma, D.; Saldien, J.; De Marez, L.; Durnez, W.; et al. I spy with my AI: The effects of AI-based visual cueing on human operators’ performance and cognitive load in CCTV control rooms. Int. J. Ind. Ergon. 2023, 95, 103444. [Google Scholar] [CrossRef] [Scilit]
Figure 1.
Correlation factors of cognitive load in industrial scenarios.
Figure 1.
Correlation factors of cognitive load in industrial scenarios.
Figure 2.
Cognitive mechanism of the alarm interface of the virtual monitoring system.
Figure 2.
Cognitive mechanism of the alarm interface of the virtual monitoring system.
Figure 3.
3D static scene diagram of the virtual model of the flotation workshop: (a) single-objective search materials; (b) multi-objective search materials.
Figure 3.
3D static scene diagram of the virtual model of the flotation workshop: (a) single-objective search materials; (b) multi-objective search materials.
Figure 4.
Alarm information coding of different levels.
Figure 4.
Alarm information coding of different levels.
Figure 5.
Experimental scenario.
Figure 5.
Experimental scenario.
Figure 6.
Experimental flow chart.
Figure 6.
Experimental flow chart.
Figure 7.
Reaction time of the within-subjects variable. Red represents the single-target task, and blue represents the multi-target task (Group 1: text-filled alarm presentation format; Group 2: background color-filled alarm presentation format).
Figure 7.
Reaction time of the within-subjects variable. Red represents the single-target task, and blue represents the multi-target task (Group 1: text-filled alarm presentation format; Group 2: background color-filled alarm presentation format).
Figure 8.
Accuracy rate of within-subjects variables under different alarm levels. Red represents the single-target task, and blue represents the multi-target task (Group 1: text-filled alarm presentation format; Group 2: background color-filled alarm presentation format).
Figure 8.
Accuracy rate of within-subjects variables under different alarm levels. Red represents the single-target task, and blue represents the multi-target task (Group 1: text-filled alarm presentation format; Group 2: background color-filled alarm presentation format).
Figure 9.
Design of alarm information display form and position.
Figure 9.
Design of alarm information display form and position.
Figure 10.
Alarm information design.
Figure 10.
Alarm information design.
Table 1.
Descriptive statistics of reaction time and accuracy rate of within-subjects independent variables under different alarm levels.
Table 1.
Descriptive statistics of reaction time and accuracy rate of within-subjects independent variables under different alarm levels.
| Number of Alarms | Alarm Form | Alarm Position | Reaction Time (s) | | Accuracy Rate | |
|---|
| | | | Mean | SD | Mean | SD |
|---|
| Single-Target | Text Filling | Panel | 3.083 | 0.412 | 0.896 | 0.033 |
| | | Fixed | 2.925 | 0.459 | 0.898 | 0.029 |
| | | Model | 2.827 | 0.427 | 0.960 | 0.027 |
| | Color Filling | Panel | 2.820 | 0.395 | 0.965 | 0.027 |
| | | Fixed | 2.659 | 0.373 | 0.990 | 0.015 |
| | | Model | 2.067 | 0.503 | 0.995 | 0.008 |
| Multi-Target | Text Filling | Panel Position | 3.248 | 0.410 | 0.820 | 0.033 |
| | | Fixed | 3.080 | 0.576 | 0.835 | 0.028 |
| | | Model | 3.172 | 0.622 | 0.894 | 0.044 |
| | Color Filling | Panel | 2.701 | 0.543 | 0.896 | 0.031 |
| | | Fixed | 2.552 | 0.474 | 0.934 | 0.029 |
| | | Model | 2.460 | 0.415 | 0.946 | 0.034 |
Table 2.
Tests of within-subjects effects on reaction time under different alarm levels.
Table 2.
Tests of within-subjects effects on reaction time under different alarm levels.
| Experimental Variable | Type III Sum of Squares | df | Mean Square | F | Significance | Partial Eta Squared |
|---|
| Number of Alarms (A) | 1.152 | 1 | 1.152 | 7.676 | 0.012 | 0.288 |
| Alarm Position (B) | 17.647 | 2 | 8.823 | 35.172 | <0.001 | 0.649 |
| Alarm Form (C) | 3.686 | 1 | 3.686 | 17.119 | 0.001 | 0.474 |
| A × B | 0.023 | 2 | 0.012 | 0.033 | 0.968 | 0.002 |
| A × C | 0.001 | 1 | 0.001 | 0.009 | 0.924 | 0.000 |
| B × C | 0.322 | 2 | 0.161 | 0.702 | 0.502 | 0.036 |
| A × B × C | 2.328 | 2 | 1.164 | 6.830 | 0.003 | 0.264 |
Table 3.
LSD test of reaction time at different alarm positions.
Table 3.
LSD test of reaction time at different alarm positions.
| Alarm Position (I) | Alarm Position (J) | Mean Difference (I − J) | Std. Error | Significance (b) |
|---|
| Panel Position | Fixed | 0.204 | 0.087 | 0.092 |
| | Model | 0.649 * | 0.071 | 0.000 |
| Fixed Position | Panel | −0.204 | 0.087 | 0.092 |
| | Model | 0.445 * | 0.078 | 0.000 |
| Model Position | Panel | −0.649 * | 0.071 | 0.000 |
| | Fixed | −0.445 * | 0.078 | 0.000 |
Table 4.
Tests of within-subjects effects on accuracy rate under different alarm levels.
Table 4.
Tests of within-subjects effects on accuracy rate under different alarm levels.
| Experimental Variable | Type III Sum of Squares | df | Mean Square | F | Significance | Partial Eta Squared |
|---|
| Number of Alarms (A) | 0.239 | 1 | 0.239 | 271.188 | <0.001 | 0.935 |
| Alarm Position (B) | 0.444 | 2 | 0.222 | 285.972 | <0.001 | 0.938 |
| Alarm Form (C) | 0.003 | 1 | 0.003 | 2.694 | 0.117 | 0.124 |
| A × B | 0.003 | 2 | 0.002 | 1.292 | 0.287 | 0.064 |
| A × C | 0.001 | 1 | 0.001 | 0.689 | 0.417 | 0.035 |
| B × C | 0.000 | 2 | 0.000 | 0.277 | 0.759 | 0.014 |
| A × B × C | 0.001 | 2 | 0.000 | 0.502 | 0.609 | 0.026 |
Table 5.
Overall characteristics of scores of each dimension of the NASA-TLX scale.
Table 5.
Overall characteristics of scores of each dimension of the NASA-TLX scale.
| Evaluation Dimension | Score of Single-Target Task | Score of Multi-Target Task | Difference | t-Value | p-Value |
|---|
| Mental Demand | 38.5 ± 6.9 | 65.7 ± 8.2 | 27.2 | 12.36 | <0.001 |
| Physical Demand | 18.9 ± 4.7 | 22.3 ± 5.8 | 3.4 | 1.98 | 0.058 |
| Time Pressure | 45.6 ± 7.8 | 73.2 ± 9.1 | 27.6 | 11.92 | <0.001 |
| Performance Level (Reverse) | 35.2 ± 7.1 | 68.9 ± 8.3 | 33.7 | 14.15 | <0.001 |
| Effort | 42.3 ± 7.5 | 72.1 ± 8.6 | 29.8 | 13.07 | <0.001 |
| Frustration | 36.8 ± 6.7 | 64.5 ± 8.4 | 27.7 | 12.51 | <0.001 |
| Total Cognitive Load | 40.3 ± 6.8 | 63.1 ± 8.5 | 22.8 | 10.89 | <0.001 |
Table 6.
Total cognitive load scores of NASA-TLX under different experimental conditions.
Table 6.
Total cognitive load scores of NASA-TLX under different experimental conditions.
| Number of Alarm Targets | Alarm Form | Alarm Position | Total Cognitive Load Score | Reaction Time (s) | Accuracy Rate | p-Value |
|---|
| Single-Target | Text Filling | Panel | 52.3 ± 8.1 | 3.083 ± 0.412 | 0.896 ± 0.033 | 0.008 |
| | | Fixed | 49.6 ± 7.8 | 2.925 ± 0.459 | 0.898 ± 0.029 | 0.021 |
| | | Model | 45.7 ± 7.5 | 2.827 ± 0.427 | 0.960 ± 0.027 | 0.073 |
| | Color Filling | Panel | 46.1 ± 7.6 | 2.820 ± 0.395 | 0.965 ± 0.027 | 0.068 |
| | | Fixed | 43.2 ± 7.3 | 2.659 ± 0.373 | 0.990 ± 0.015 | 0.035 |
| | | Model | 40.1 ± 6.9 | 2.067 ± 0.503 | 0.995 ± 0.008 | - |
| Multi-Target | Text Filling | Panel | 73.2 ± 9.6 | 3.248 ± 0.410 | 0.820 ± 0.033 | <0.001 |
| | | Fixed | 68.5 ± 9.2 | 3.080 ± 0.576 | 0.835 ± 0.028 | <0.001 |
| | | Model | 62.8 ± 8.7 | 3.172 ± 0.622 | 0.894 ± 0.044 | 0.002 |
| | Color Filling | Panel | 60.3 ± 8.5 | 2.701 ± 0.543 | 0.896 ± 0.031 | 0.003 |
| | | Fixed | 54.7 ± 8.1 | 2.552 ± 0.474 | 0.934 ± 0.029 | 0.012 |
| | | Model | 42.5 ± 6.7 | 2.460 ± 0.415 | 0.946 ± 0.034 | - |
| Disclaimer/Publisher’s Note: The statements, opinions and data contained in all publications are solely those of the individual author(s) and contributor(s) and not of MDPI and/or the editor(s). MDPI and/or the editor(s) disclaim responsibility for any injury to people or property resulting from any ideas, methods, instructions or products referred to in the content. |