Article

Numerical Modeling of Acoustic Emission Source Mechanisms and Crack Damage in Westerly Granite Subject to Triaxial Compression Tests


Department of Earth Science, University of Turin, 10125 Turin, Italy
*
Author to whom correspondence should be addressed.
Appl. Sci. 2026, 16(5), 2281; https://doi.org/10.3390/app16052281
Submission received: 2 February 2026 / Revised: 16 February 2026 / Accepted: 20 February 2026 / Published: 26 February 2026
(This article belongs to the Section Earth Sciences)

Abstract

This study investigates the complex relationship between fracture patterns and acoustic emission (AE) mechanisms during triaxial deformation experiments on Westerly granite under various confining pressures (5, 10, 20, and 40 MPa). Using numerical simulations with the Particle Flow Code (PFC2D, 6.0, Itasca Consulting Group Inc., Minneapolis, MN, USA), this research emphasizes the significant influence of confining pressure on crack development, AE events, spatiotemporal distribution, energy dissipation, and peak stress in the samples. AE source mechanisms, categorized into T-Type, C-Type, and S-Type, show the dominance of T-Type fractures during post-peak unstable failure and the emergence of C-Type fractures as precursors to critical damage. Additionally, increasing confining pressure is found to correlate with changes in fracture dynamics, evidenced by an increase in big events and a decrease in small events. The analysis of b-values across different pressures reveals fluctuations that indicate change in fracture features. Fractures originate in the model center and propagate towards both ends as loading progresses, ultimately leading to failure. In summary, these findings provide important insights into the fracture patterns of granite and the underlying mechanisms of AE release. Moreover, they carry practical implications for identifying failure precursors and for the potential application of early warning systems in rock engineering.

1. Introduction

Microcrack damage in crystalline rocks can result in extensive damage and failure [1,2]. Granite, a common rock type among crystalline formations and an acid igneous rock, primarily forms via the slow cooling of magma bodies at depth. Granite is characterized by high density, compressive strength, and heterogeneity, all of which significantly influence crack damage and failure mode [3,4,5]. Under pressure, granite often undergoes the formation, nucleation, and propagation of microcracks, leading to the development of larger-scale damage and, eventually, failure [6,7]. Currently, research on the dynamic properties of rocks primarily relies on uniaxial, triaxial, or Brazilian splitting tests as outlined by the International Standards and the International Society for Rock Mechanics (ISRM). In uniaxial tests, dynamic compression experiments are employed to elucidate the effects of initial microcracks on the mechanical properties of rocks [8,9,10,11,12,13]. In triaxial tests, the triaxial Hopkinson pressure bar is used to examine the dynamic mechanical response of rocks under triaxial stress conditions [14,15,16,17,18,19]. For Brazilian splitting tests, recent studies have investigated various failure mechanisms under dynamic loading [20,21]. Among these, triaxial stress experiments are preferred for studying the mechanical properties of rocks under varying confining pressures. Triaxial stress experiments can be categorized into true triaxial [22,23,24] and pseudo or conventional triaxial tests [25,26]. True triaxial testing involves applying different forces in three directions to the rock, with adjustable magnitudes, effectively simulating the stress conditions experienced by rocks. On the other hand, pseudo-triaxial testing maintains equal forces in two directions other than the axial stress applied to the rock sample. This method reproduces well the lithological increasing pressure at depth, and it is practical experimentally and sees widespread use with comparison to true triaxial testing. Following compression, microcracks gradually form within the interior of the rock sample [27,28,29,30]. These microcracks develop and coalesce over time [31,32,33], eventually evolving into larger cracks. As these larger cracks link up, they gradually form large-scale fractures, resulting in a decrease in the mechanical properties of the rock and eventually causing it to fracture [34,35].
Acoustic emission (AE) is a non-destructive testing technique used to monitor the geophysical signatures generated during the loading process of materials or structures. Acoustic (elastic) waves are produced by ongoing damage processes within the material, such as crack damage. By capturing and analyzing the radiated signals, acoustic emission technology can provide valuable information about the mechanism, performance, and conditions of structures or materials [36,37,38,39]. AE can be used to detect and locate cracks that occur throughout the entire sample. By employing AE analysis, it is possible to study the initiation and propagation of cracks within the sample, whether on the surface or within its volume [40,41]. The AE can accurately reproduce temporal and spatial distributions, reproducing the fracture initiation and propagation mechanics controlling AE occurrence [42]. AE monitoring allowed us to assess that dynamic instability is preceded by three phases: crack nucleation and formation, subsequent quasi-static steady crack growth, and, finally, accelerating crack growth, leading to instability once a critical length is reached [43,44]. Combining AE and wave velocities highlights changes in anisotropy during rock deformation [45]. King et al. [41] have shown that different lithologies and confining pressures influence the deformation patterns and control the failure mode with distinct AE precursor characteristics. In conventional triaxial tests on Alzo Granite and Darley Dale Sandstone, S-type (shearing) events are scarce, displaying poor spatial correlation to fault structures. Instead, deformation involves a complex interplay between compacted (C-type) and dilatant (T-type) deformation regions [41].
Alongside laboratory tests [46,47,48] and theoretical analyses [49,50,51], numerical simulations have become important in rock mechanics for reproducing ongoing deformation mechanisms [52,53,54]. For instance, Castro-Filgueira et al. [55] explored granite micromechanical properties using the flat-joint model (FJM) within a 3D distinct-element modeling (DEM) framework, namely the Particle Flow Code, focusing on the role of particle size distribution. Hu et al. [56] introduced the particle-based discrete element model combined with digital image processing to take into account the grain geometry and size distribution by using PFC2D. Meanwhile, Hu et al. [57] numerically investigated (PFC2D) the influence of mechanical heterogeneity in grain boundaries on the mechanical properties and microcracking behavior of semi-circular bend granite samples under mode I loading. Currently, there are still shortcomings in simulating AE signals during the loading process of rocks using PFC, including challenges related to event detection, localization, and an understanding of their source mechanisms.
In summary, this study aims to understand the mechanisms of fracturing in Westerly granite under increasing confining pressures by numerically reproducing the process using PFC2D. PFC2D can provide a more direct and clearer observation of the initiation and propagation of microcracks, enabling precise analysis of the correlation between stress conditions and crack development at any moment during the compression of rock samples.

2. Description of Westerly Granite (WG)

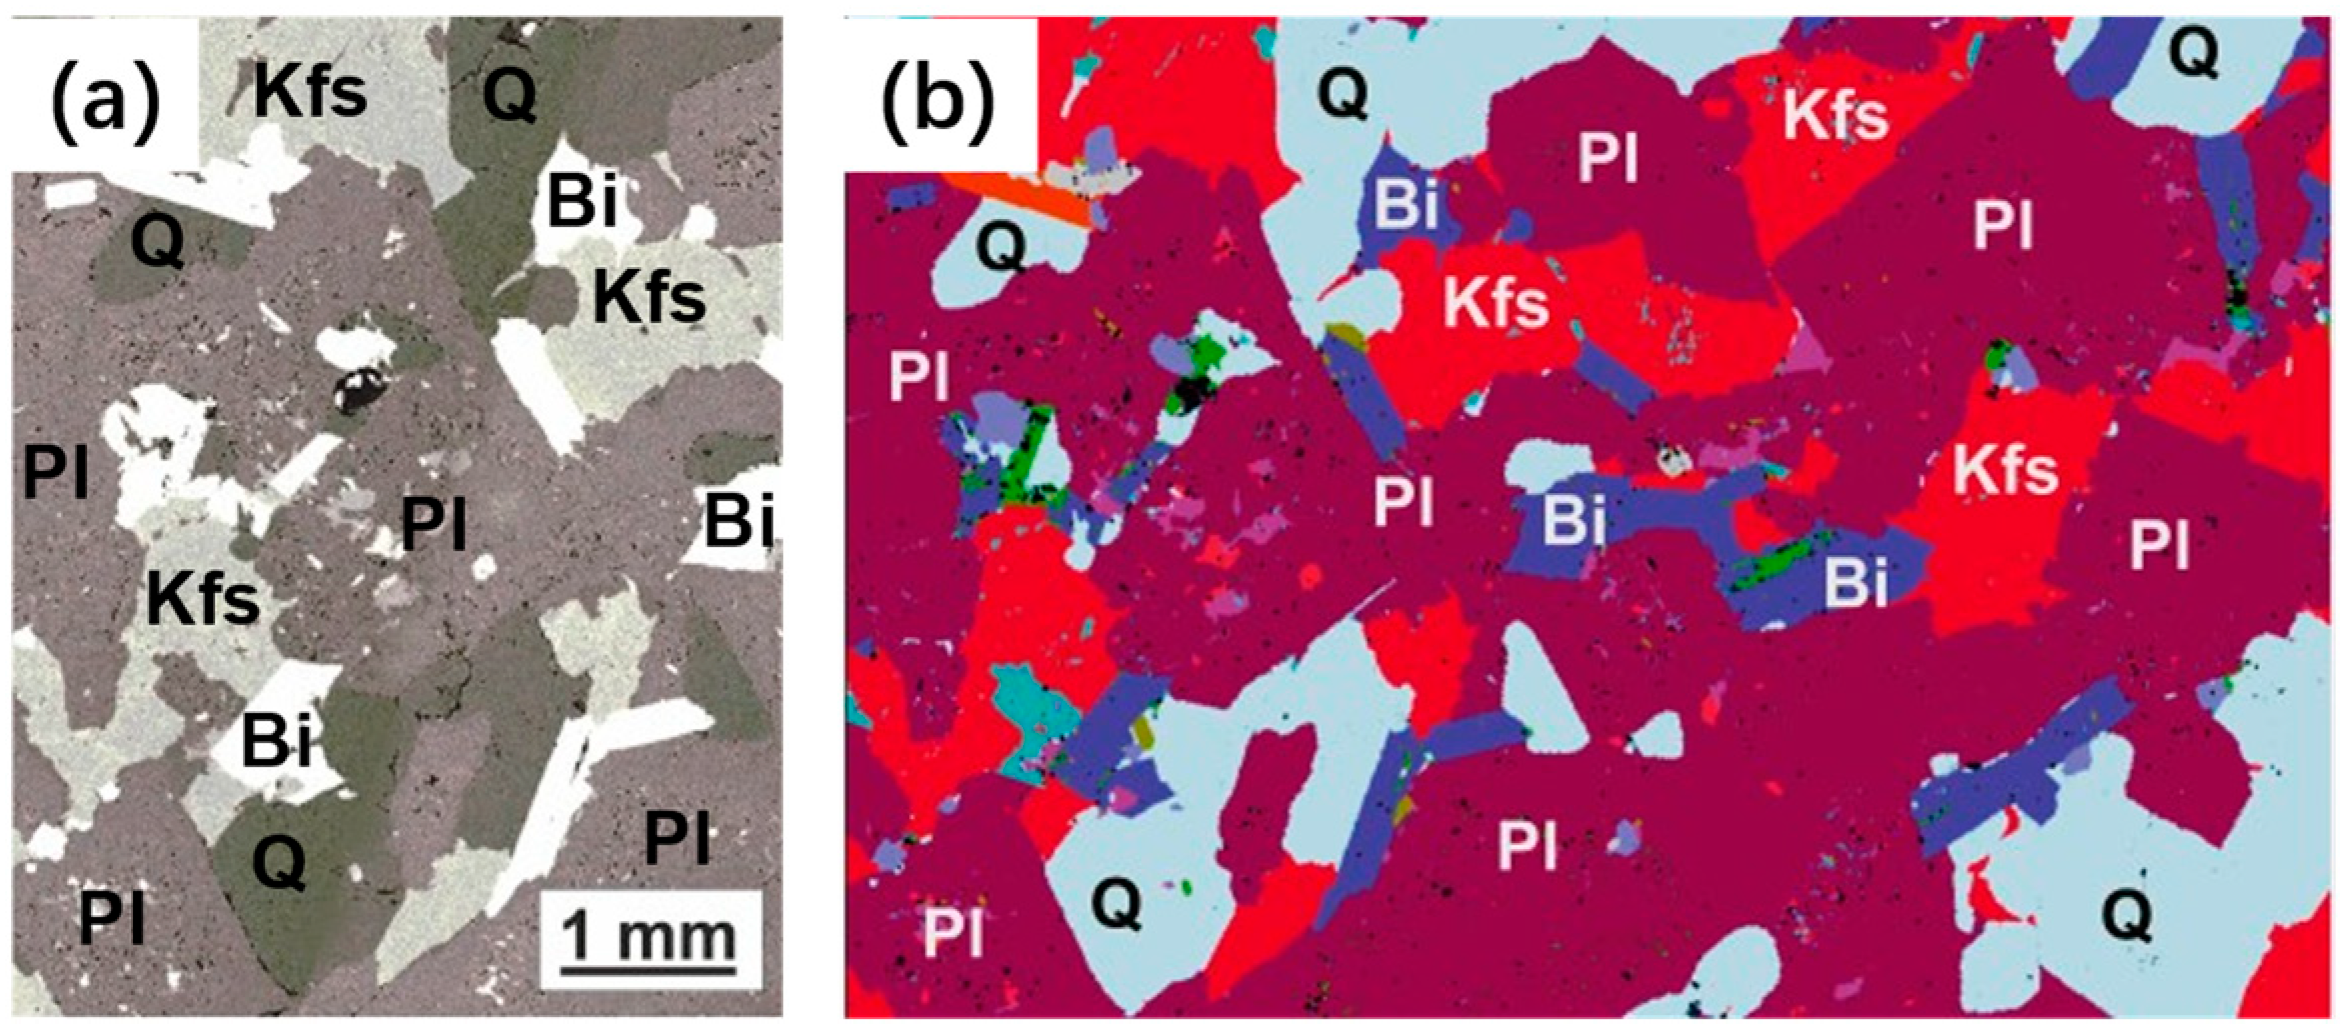
Westerly granite is characterized by its fine grain size, high uniformity, and low anisotropy. Petrologically, it is a quartz monzonite or granodiorite, representing a typical type of granite. It primarily consists of quartz, plagioclase, K-feldspar, biotite, and a notable amount of bioclastic rock, which collectively contribute to its fine-grained texture, as shown in Figure 1. It has a density of 2640 kg/m3 and a porosity of 0.9%, which is considered low. The unconfined compressive strength has been reported to be 226.6 MPa, with a Young’s modulus of (E = 51 GPa) and Poisson ratio of (ν = 0.25), by Petružálek et al. [58] and Heap et al. [59] using cylindrical rock samples measuring 100 mm × 40 mm.
The grain size distribution for plagioclase, K-feldspar, and quartz indicated a dominant grain size in the range of 0.1–0.6 mm. Biotite grains were smaller, typically in the range of 0.1–0.3 mm. The relative proportions of the different minerals are shown in Table 1.

3. Methodology

Before conducting triaxial compression tests using PFC2D, it is essential to establish a high-fidelity numerical model. In this study, the grain-based model (GBM) method is employed to model Westerly granite. Compared to traditional particle-based modeling approaches, this method allows for a more accurate reconstruction of Westerly granite’s internal structure and models that are based on its original grain composition, providing a more faithful representation of its mechanical response under quasi-static loading. The confining pressure was set at 5 MPa, 10 MPa, 20 MPa, and 40 MPa, respectively. Following the application of confining pressure, the loading platens were moved to apply axial loading to the model until failure occurred. To reduce transient waves and ensure precise test results, a loading velocity of 0.001 mm/s was employed in the simulations, and the selected loading rate was sufficiently low to ensure the sample remains in a quasi-static equilibrium loading conditions [60]. Under these conditions, early-stage fracture development is governed primarily by progressive stress redistribution and distributed bond failure. However, once peak stress is reached, the system loses mechanical equilibrium along the quasi-static loading path. Crack growth then accelerates rapidly, accompanied by a macroscopic stress drop and a sharp increase in bond breakage, reflecting the sudden release of stored elastic strain energy. In this study, this post-peak behavior is interpreted as unstable crack propagation, as defined by the loss of equilibrium along the quasi-static loading path and the associated macroscopic stress drop during continued deformation. The rapid increase in AE activity and crack coalescence observed near peak stress therefore reflects a transition from equilibrium-controlled deformation to post-peak unstable failure driven by elastic energy release within a quasi-static loading framework, rather than a dynamically driven fracture.

3.1. Model Establishment

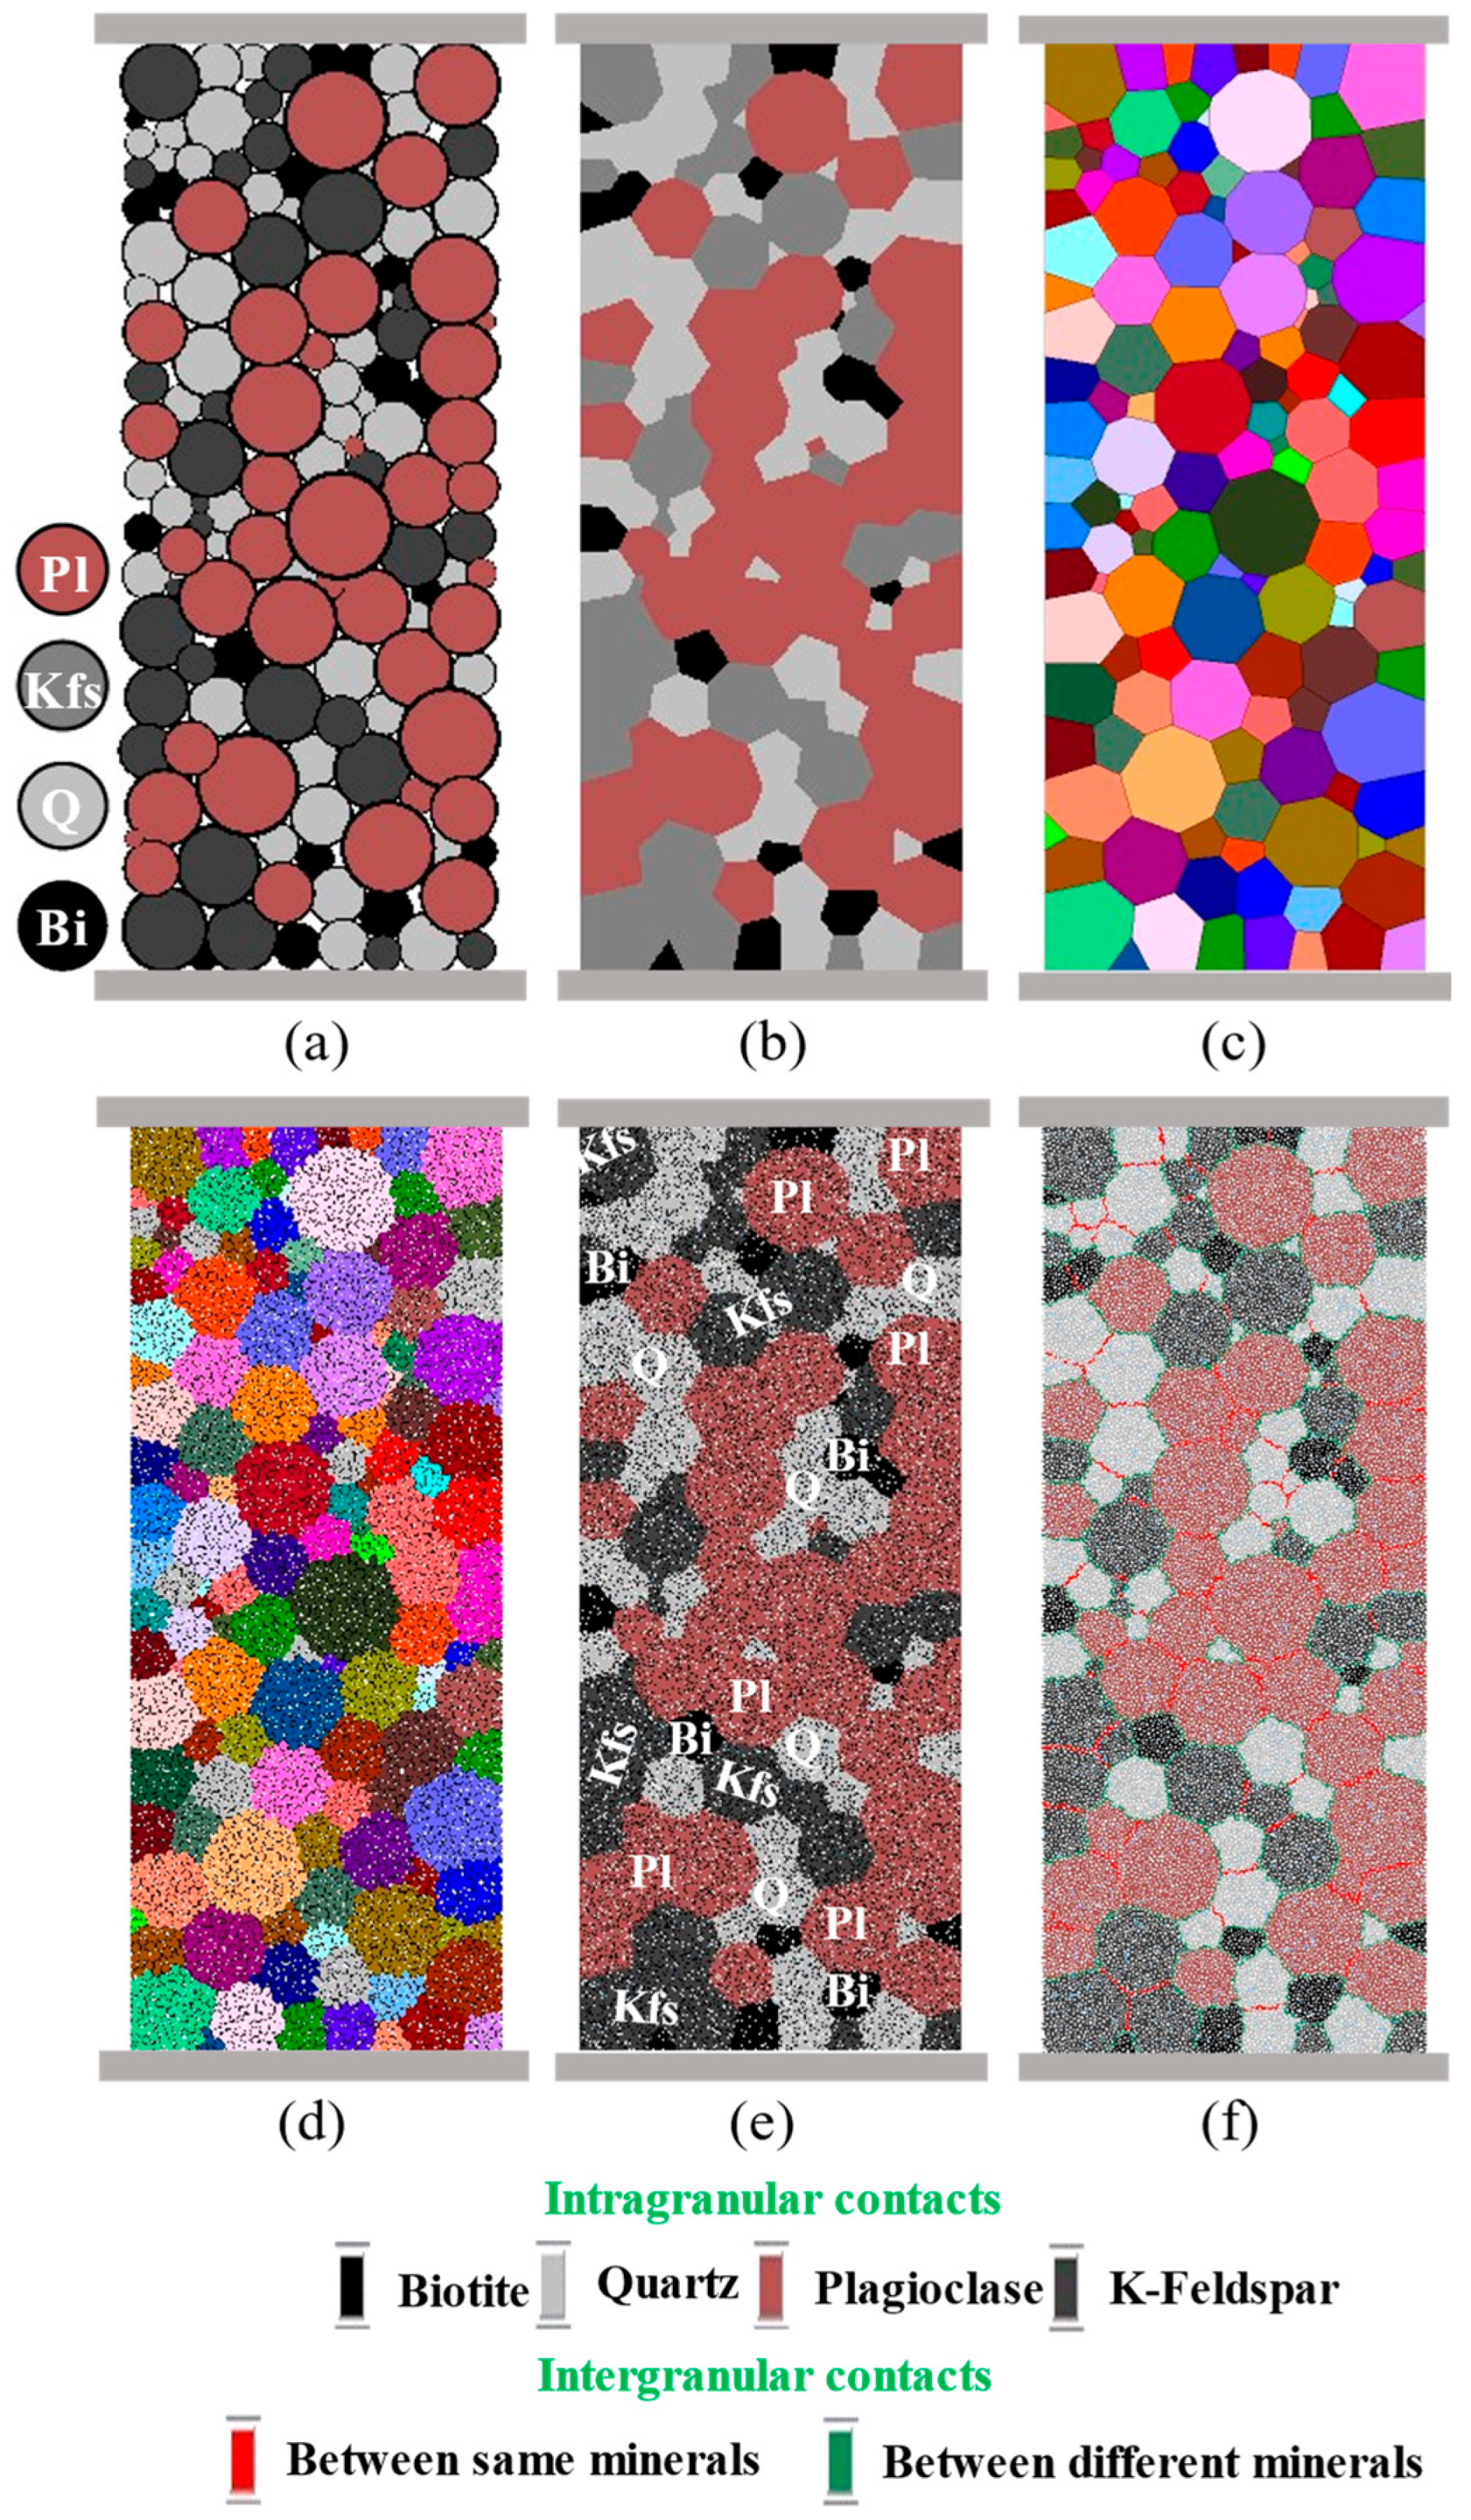
A particle-based model, where each particle represents a mineral grain, was established, as shown in Figure 2a. It is important to note that our numerical model has dimensions of 40 mm × 100 mm, consistent with triaxial laboratory sample sizes. The final numerical sample model is shown in Figure 2. Notably, the maximum ratio of mineral grain diameter to the numerical sample model diameter is less than 0.1, which is consistent with the recommendations of Fairhurst and Hudson [61], and the initial particles are only used for determining the mineral grain position and size, as well as to classify the mineral grain, as shown in Figure 2a, being deleted after the Rblock generation and not contributing to the final mechanical calculation. Additionally, each grain is composed of multiple particles, with a maximum diameter of 0.6 mm; this ensures that the maximum particle size is smaller than the smallest mineral grain size, which makes the specimen’s particle width and diameter equal to 66.667 (40/0.6), 20 times higher than in the paper Potyondy et al. [62]. At this scale, the ratio of the disk size to model size is minimal, thereby not having significant scale effects. These particles are involved in the final mechanical calculations; the bond is also applied between these particles, as shown in Figure 2f.
Particles are generated on the basis of the different mineral grain sizes in Westerly granite, as shown in Figure 2a. At this stage, each particle in the model represents an individual grain. The generated grains are rigid spheres, meaning that they cannot fracture, unlike actual rock grains that can undergo intragrain fracturing. Thus, the Rblock module in PFC is employed to replace the grains. Notably, in this step, Rblock elements are grouped based on the positions of the various grain groups from the initial grain-based model. This approach allows for subsequent grouping based on the size and distribution of grains generated in the initial step, as demonstrated in Figure 2b. Since the Rblocks remain rigid, they are replaced by geometry units, which are hollow and provide a framework structure that defines the boundaries of the mineral particle assemblies. These assemblies are then filled with basic elements. The geometry units are grouped corresponding to Rblocks, after which the Rblocks are deleted. At this point, each individual grain is labeled according to its mineral attribution, as shown in Figure 2c. Smaller particles (basic elements, 0.1 mm–0.6 mm) are generated to fill the grains and grouped according to the previous markings, as illustrated in Figure 2d,e. Each group represents a grain, and these grains are capable of breaking. Polymerization grouping is then performed based on similar mineral grains. The mineral grains in granite are primarily divided into four groups: K-feldspar, quartz, biotite, and plagioclase, as shown in Figure 2e. In this manner, the macroscale mechanical behavior of rock samples in laboratory tests is partially replicated.

3.2. Contact Constitutive Models

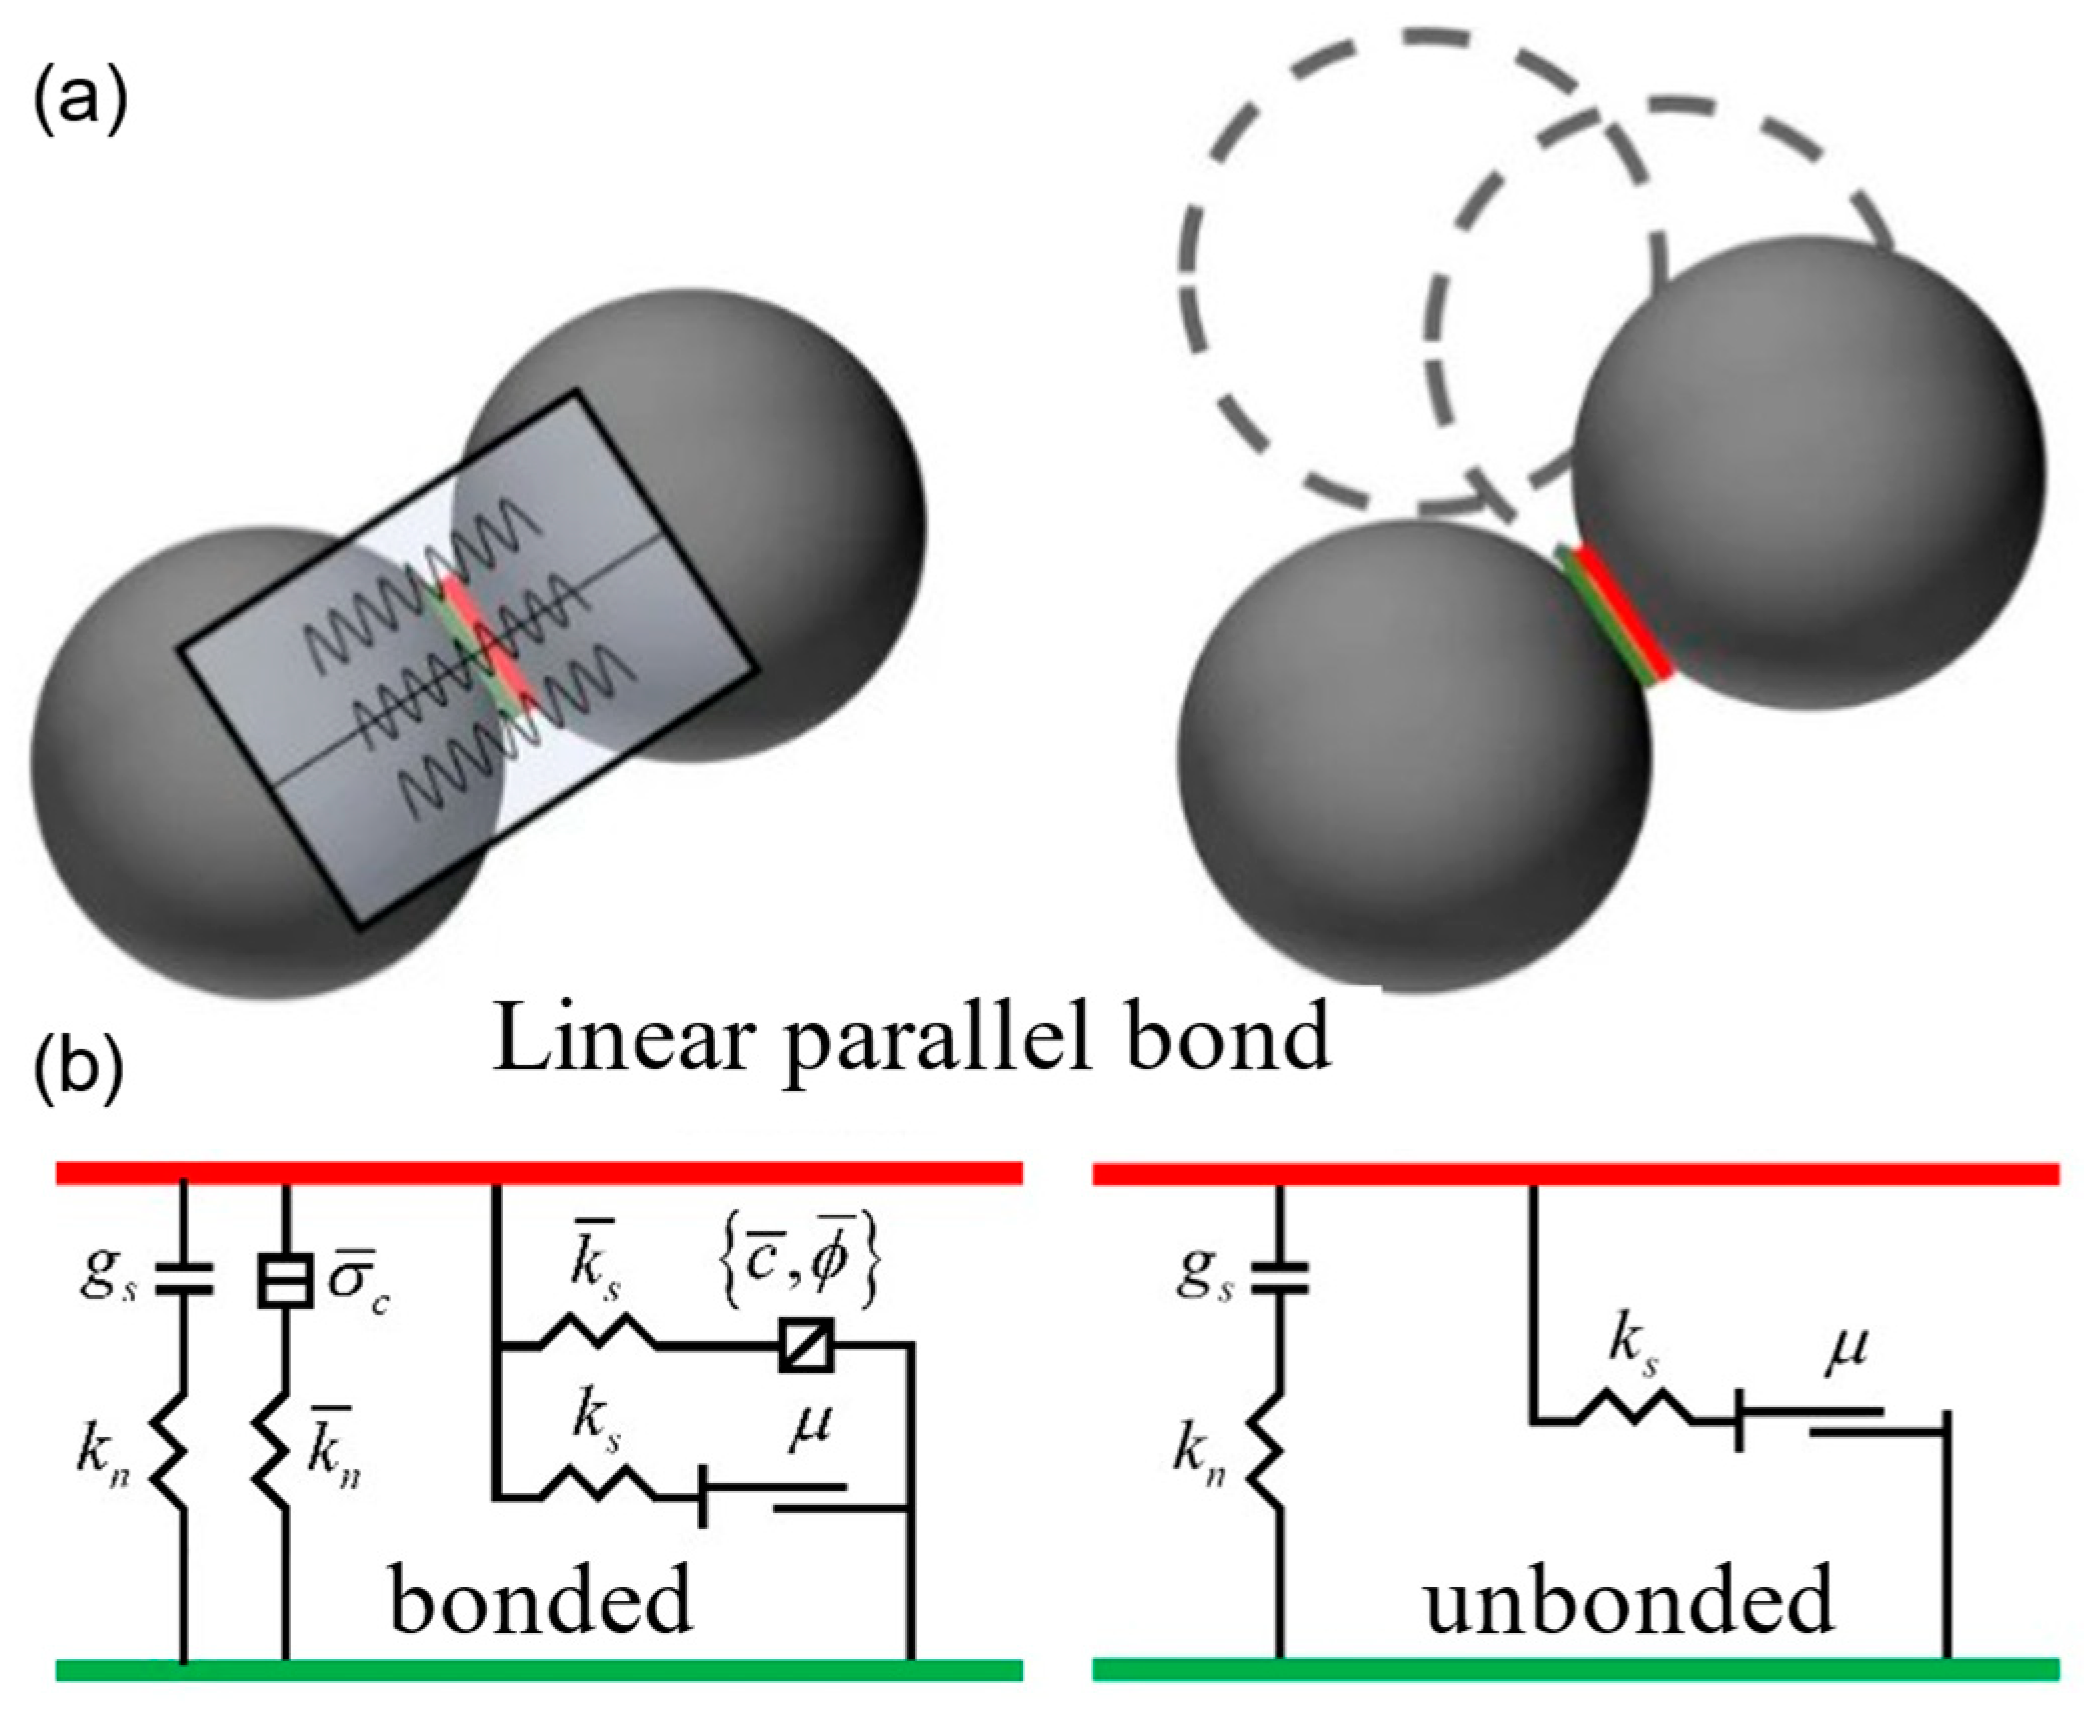
In PFC, the contact constitutive model consists of (1) the contact-stiffness model, which defines the elastic relationship between particle contact forces and relative displacements, incorporating both the linear contact model and the simplified Hertz–Mindlin model; (2) the contact-slip model, which characterizes the relationship between normal and tangential contact forces to describe the relative movement between two contacting particles; and (3) the bonding model, which defines the maximum resultant normal and shear forces, including the contact bond and parallel bond models. In PFC, cracks form exclusively when using the bond contact modes (contact bond and parallel bond). In the parallel bond model [62], bonding is achieved by introducing a bonding material with a defined cross-sectional shape and size between particles. The parallel bond model includes two interfaces (Figure 3): The first is an infinitesimal linear elastic and frictional interface that does not resist relative rotation or sliding. The second interface, known as the parallel bond, is a finite-size linear elastic bonding interface that transmits forces and moments and can experience elongation, compression, shear, and torsion of interacting particles. The behavior of a parallel bond remains linearly elastic until its strength limit is reached. Once the bond breaks, it is removed from the system and can no longer resist relative rotation at the contact [63,64,65]. The bonding between particles adheres to the force-displacement law. The force-displacement law for the linear parallel bond model relates the contact force ( F c ) and the moment ( M c ):
F c = F l + F d + F ¯
M c = M ¯
where F l is the linear force, F d is the dashpot force, F ¯ is the parallel bond force, and M ¯ is the parallel bond moment.
The parallel bond force is resolved into a normal ( F ¯ n ) and shear force ( F ¯ s ), and the parallel bond moment is resolved into a bending moment ( M ¯ b ):
F ¯ = F ¯ n n ^ c + F ¯ s
M ¯ = M ¯ b
Bonds break when they get overstressed during the evolution of the system; the breaking of a bond is mainly caused by stretching and bending:
σ ¯ = F ¯ n A ¯ + M ¯ b R ¯ I ¯
τ ¯ = F ¯ s A ¯
where R ¯ is the bond cross-sectional properties, A ¯ is the cross-sectional area. The tensile and shear strengths are σ ¯ and τ ¯ ; if σ m a x σ ¯ or τ m a x τ ¯ , the cemented contact between particles breaks.
Thus, considering the microstructure and properties of Westerly granite, we selected the parallel bond model for contact simulation in the developed model. The primary challenges include the following: (1) assigning uniform bonding properties within individual mineral grain, (2) assigning weaker bonding properties between distinct mineral grains, and (3) assigning weaker bonding properties within grains of the same mineral type. The bonded sample and its bonding state are illustrated in Figure 2f. This illustrates that particles within the same mineral exhibit uniform bonding, while particles between different minerals and within the same mineral group exhibit weaker bonding. This approach enables the entire sample to be modeled and composed of mineral particles of varying sizes bonded together, closely resembling the natural formation of granite, as shown in Figure 2f.

3.3. Parameter Calibration

The strength of the rock material is derived from the parallel bonding between particles, essentially representing the cementing effect between particles [66,67,68,69,70,71,72]. In PFC, the macroscopic behavior of the material is governed by the interaction of its microscopic properties. Calibrating microscopic parameters aims to define the properties of particles and bonds used in PFC simulations. Parameters such as contact stiffness and bond strength are treated as input variables, often with initially unknown values. The relationship between these input microscopic properties and target macroscopic parameters (e.g., Young’s modulus, Poisson’s ratio, and UCS) is not linear or straightforward [73].
Previous studies [62,74] have examined the relationships between micromechanical parameters and macroscopic mechanical properties, thereby providing a theoretical basis for optimizing microparameters for specific rock types. Incorporating the sensitivity analysis of macroscopic mechanical behavior to micromechanical parameters conducted by Li et al. [75], the calibration procedure evaluates a set of micromechanical parameters and performs triaxial loading simulations until the macroscopic responses obtained from the proposed GBM framework align with those measured in laboratory experiments. When discrepancies are observed between the simulated and target responses, the corresponding control parameters are iteratively adjusted to achieve improved agreement.
In this process, Young’s modulus is calibrated by iteratively modifying parameters such as pb_emod and emod until the linear elastic portion of the simulated triaxial stress–strain curve aligns with the corresponding portion of the laboratory curve. Poisson’s ratio is then calibrated by adjusting pb_kratio and kratio in an iterative manner. Finally, peak stress is calibrated by iteratively modifying parameters, including pb_coh and pb_ten, until the simulated peak strength is consistent with the experimental results. Bahrani et al. [76] summarized the GBM calibration procedure by reproducing the mechanical and fracturing behavior of intact and granular Wombeyan marble, and the effectiveness of this procedure has also been confirmed by Hofmann et al. [77] and Liu et al. [78]. Table 2 presents the calibration results of the numerical samples used in this study.

3.4. Model Validation

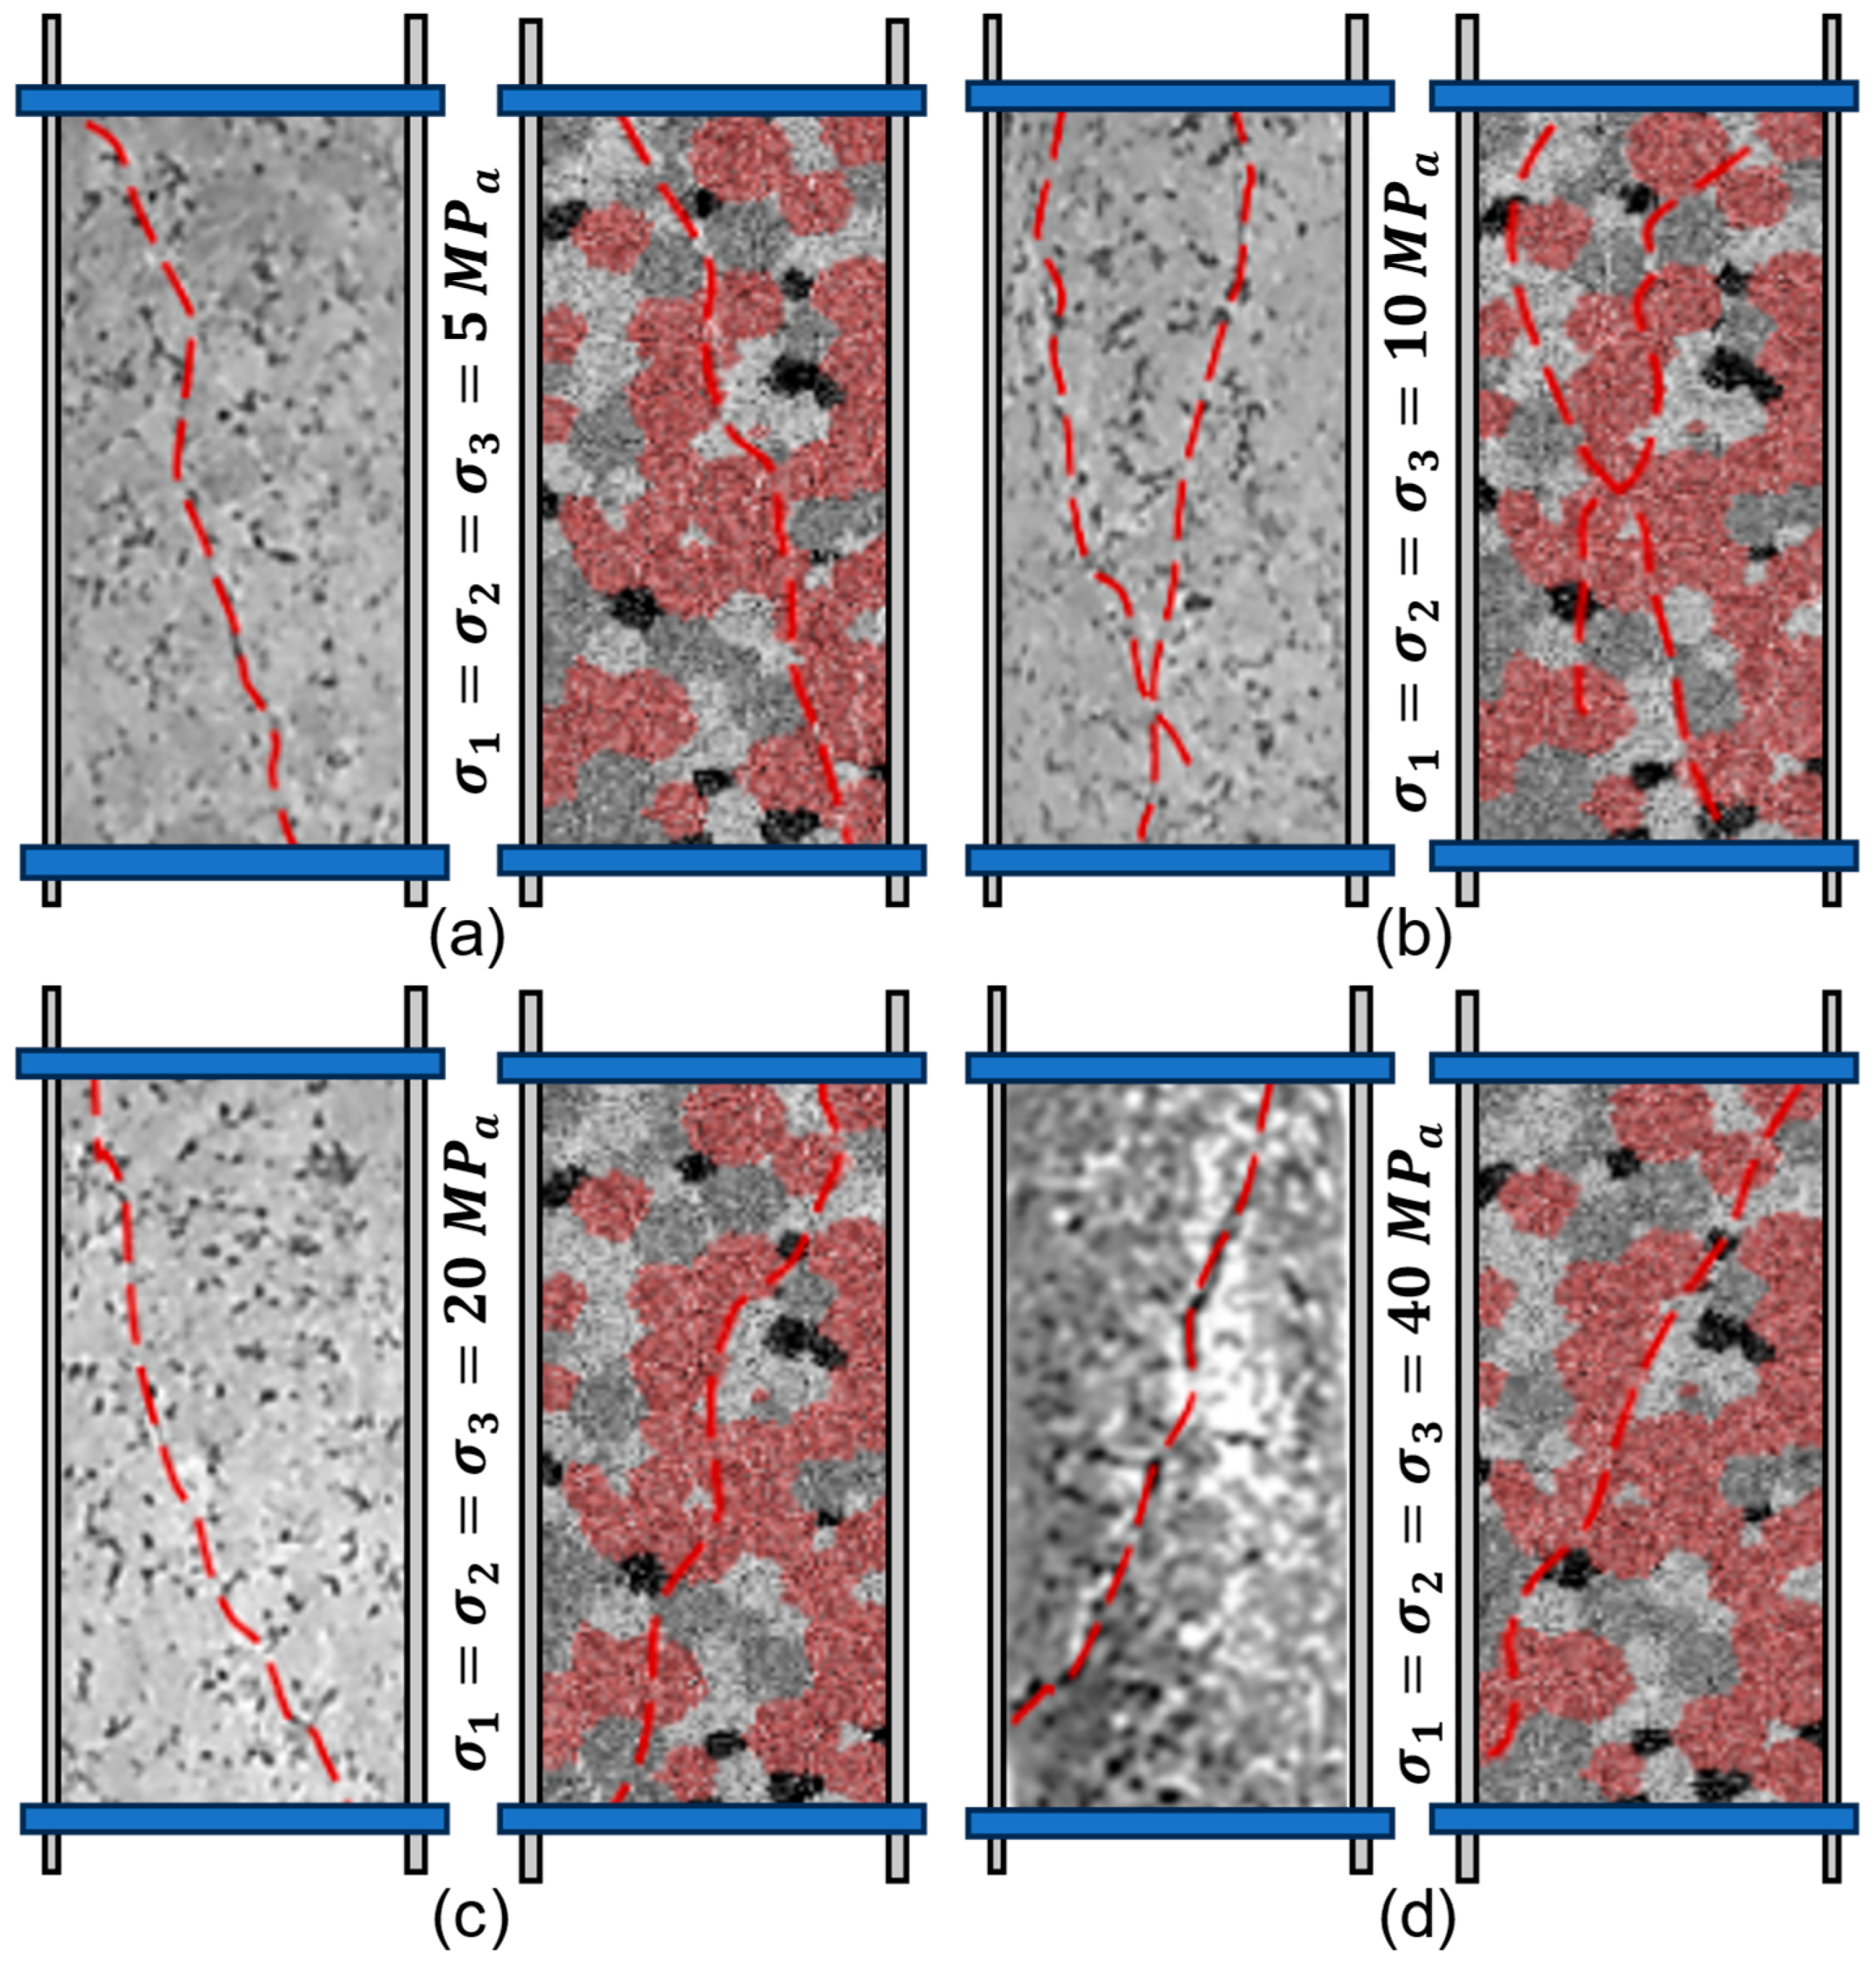
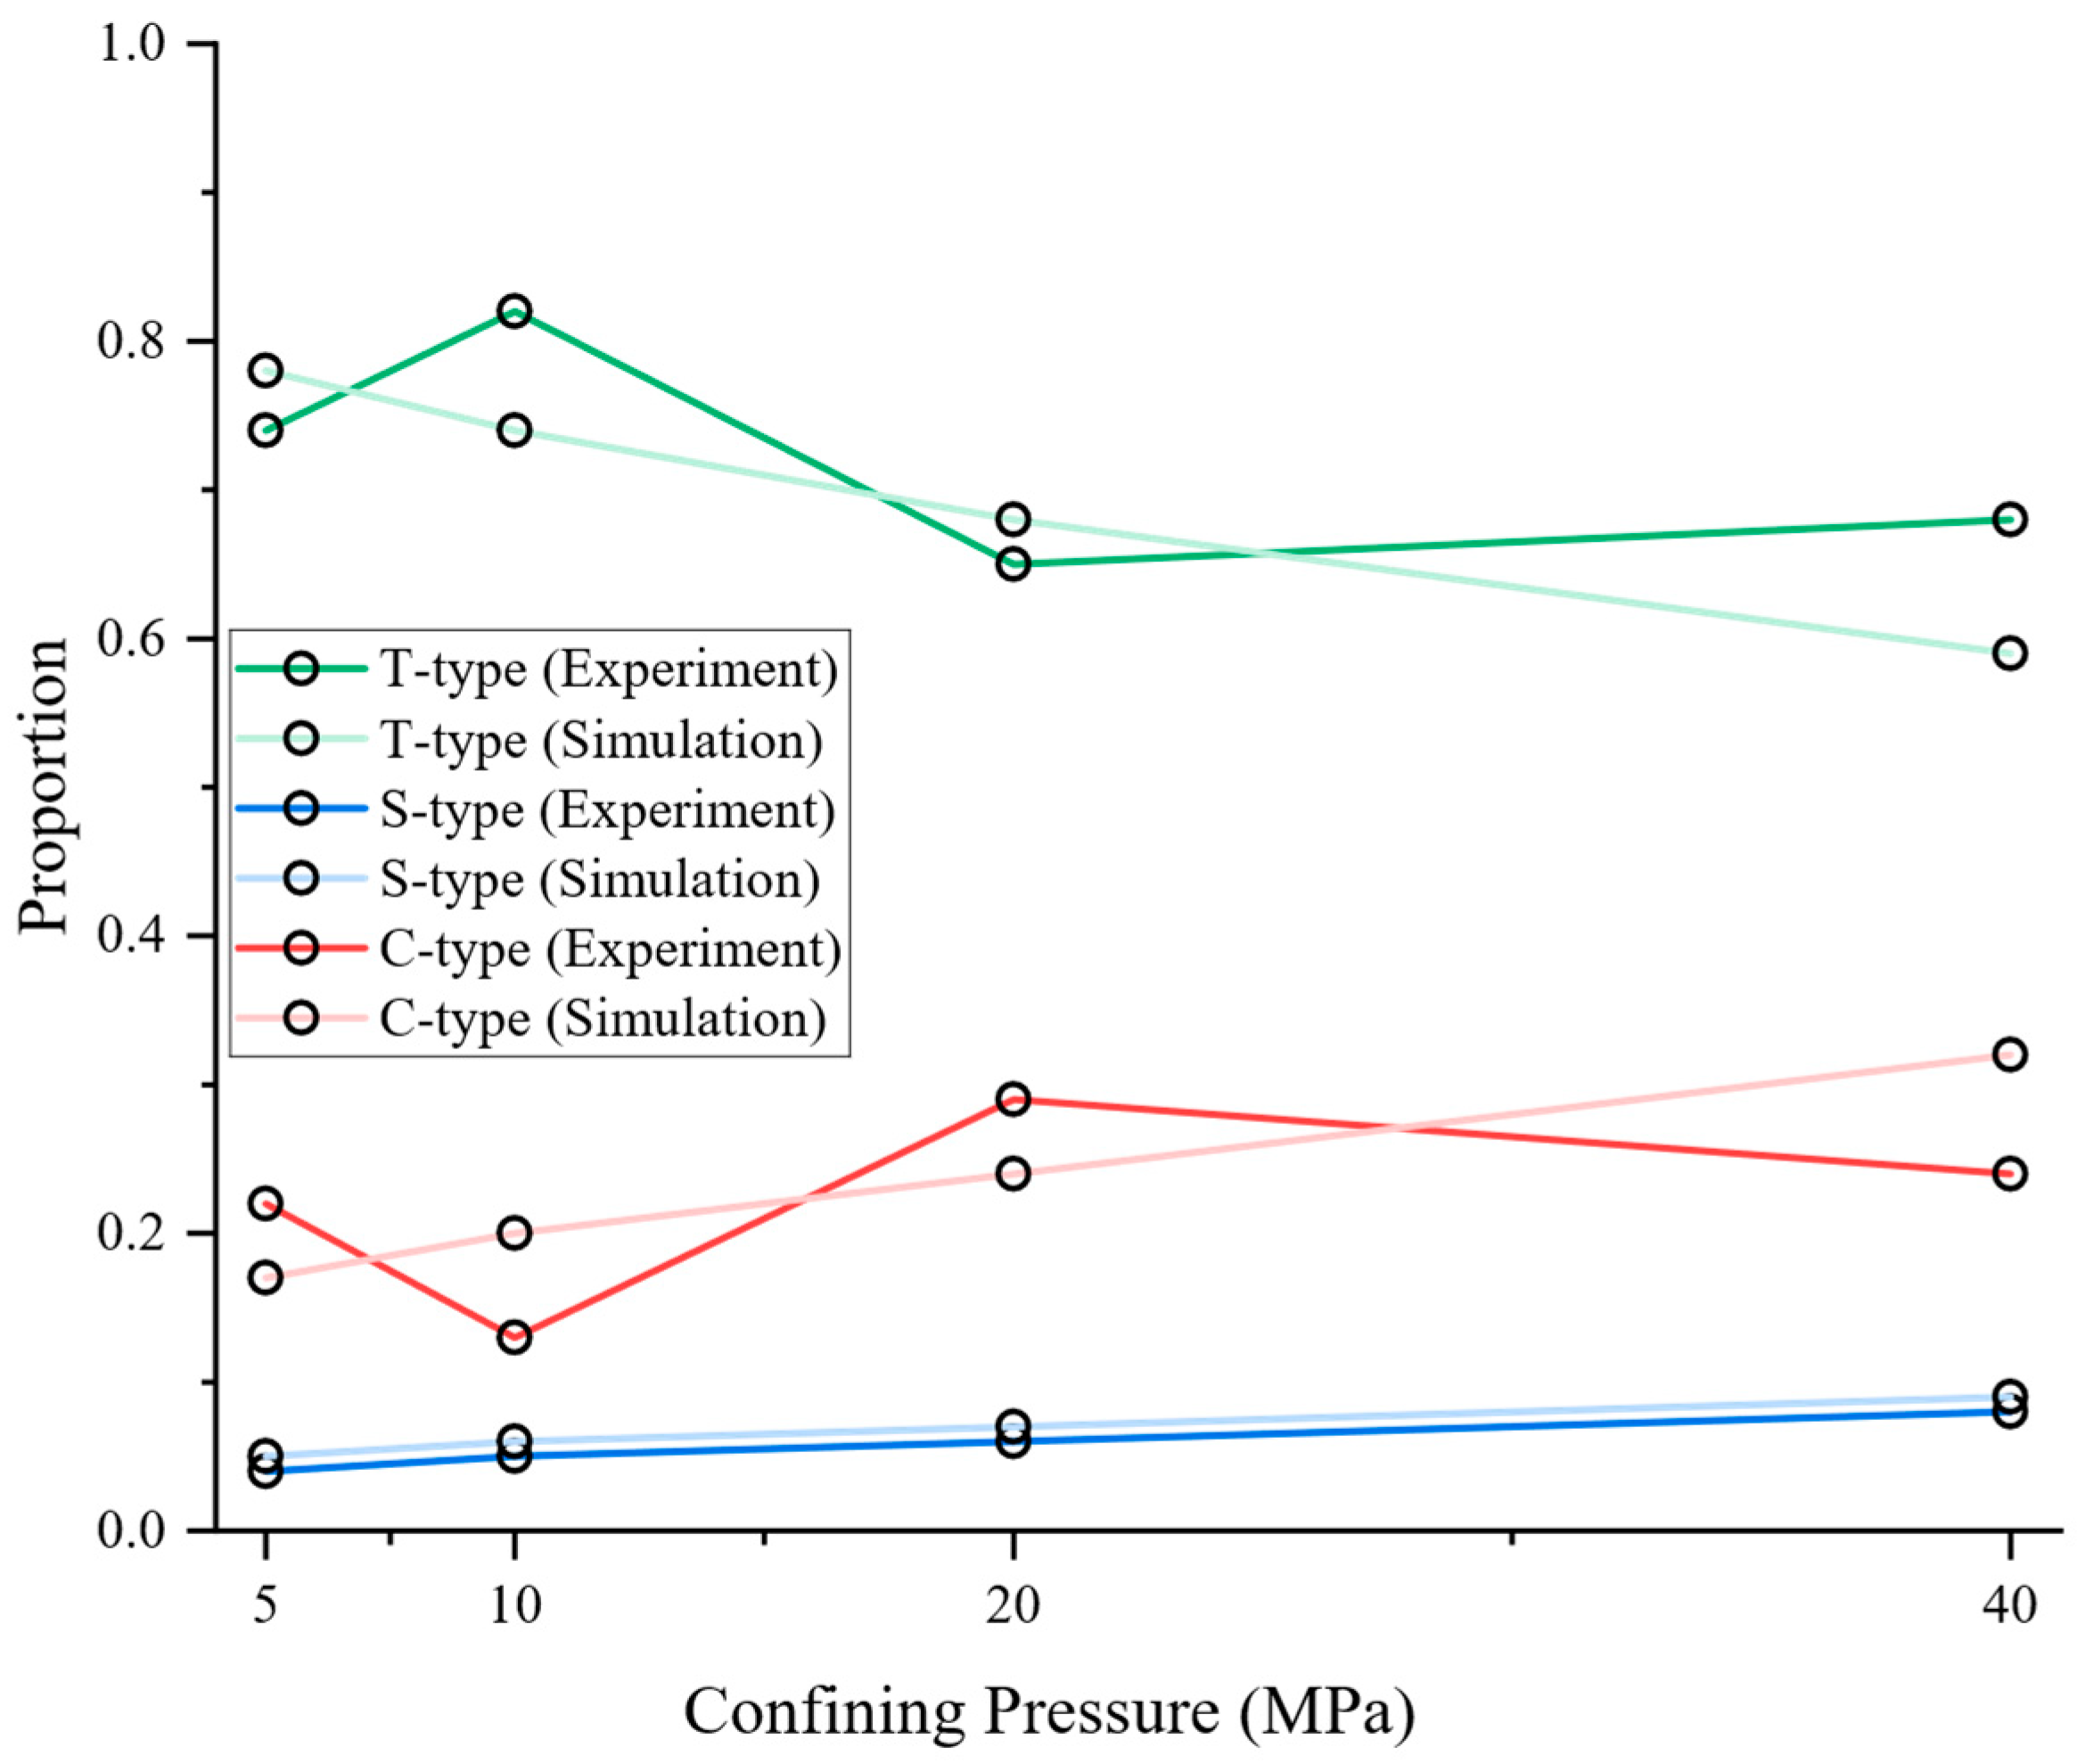
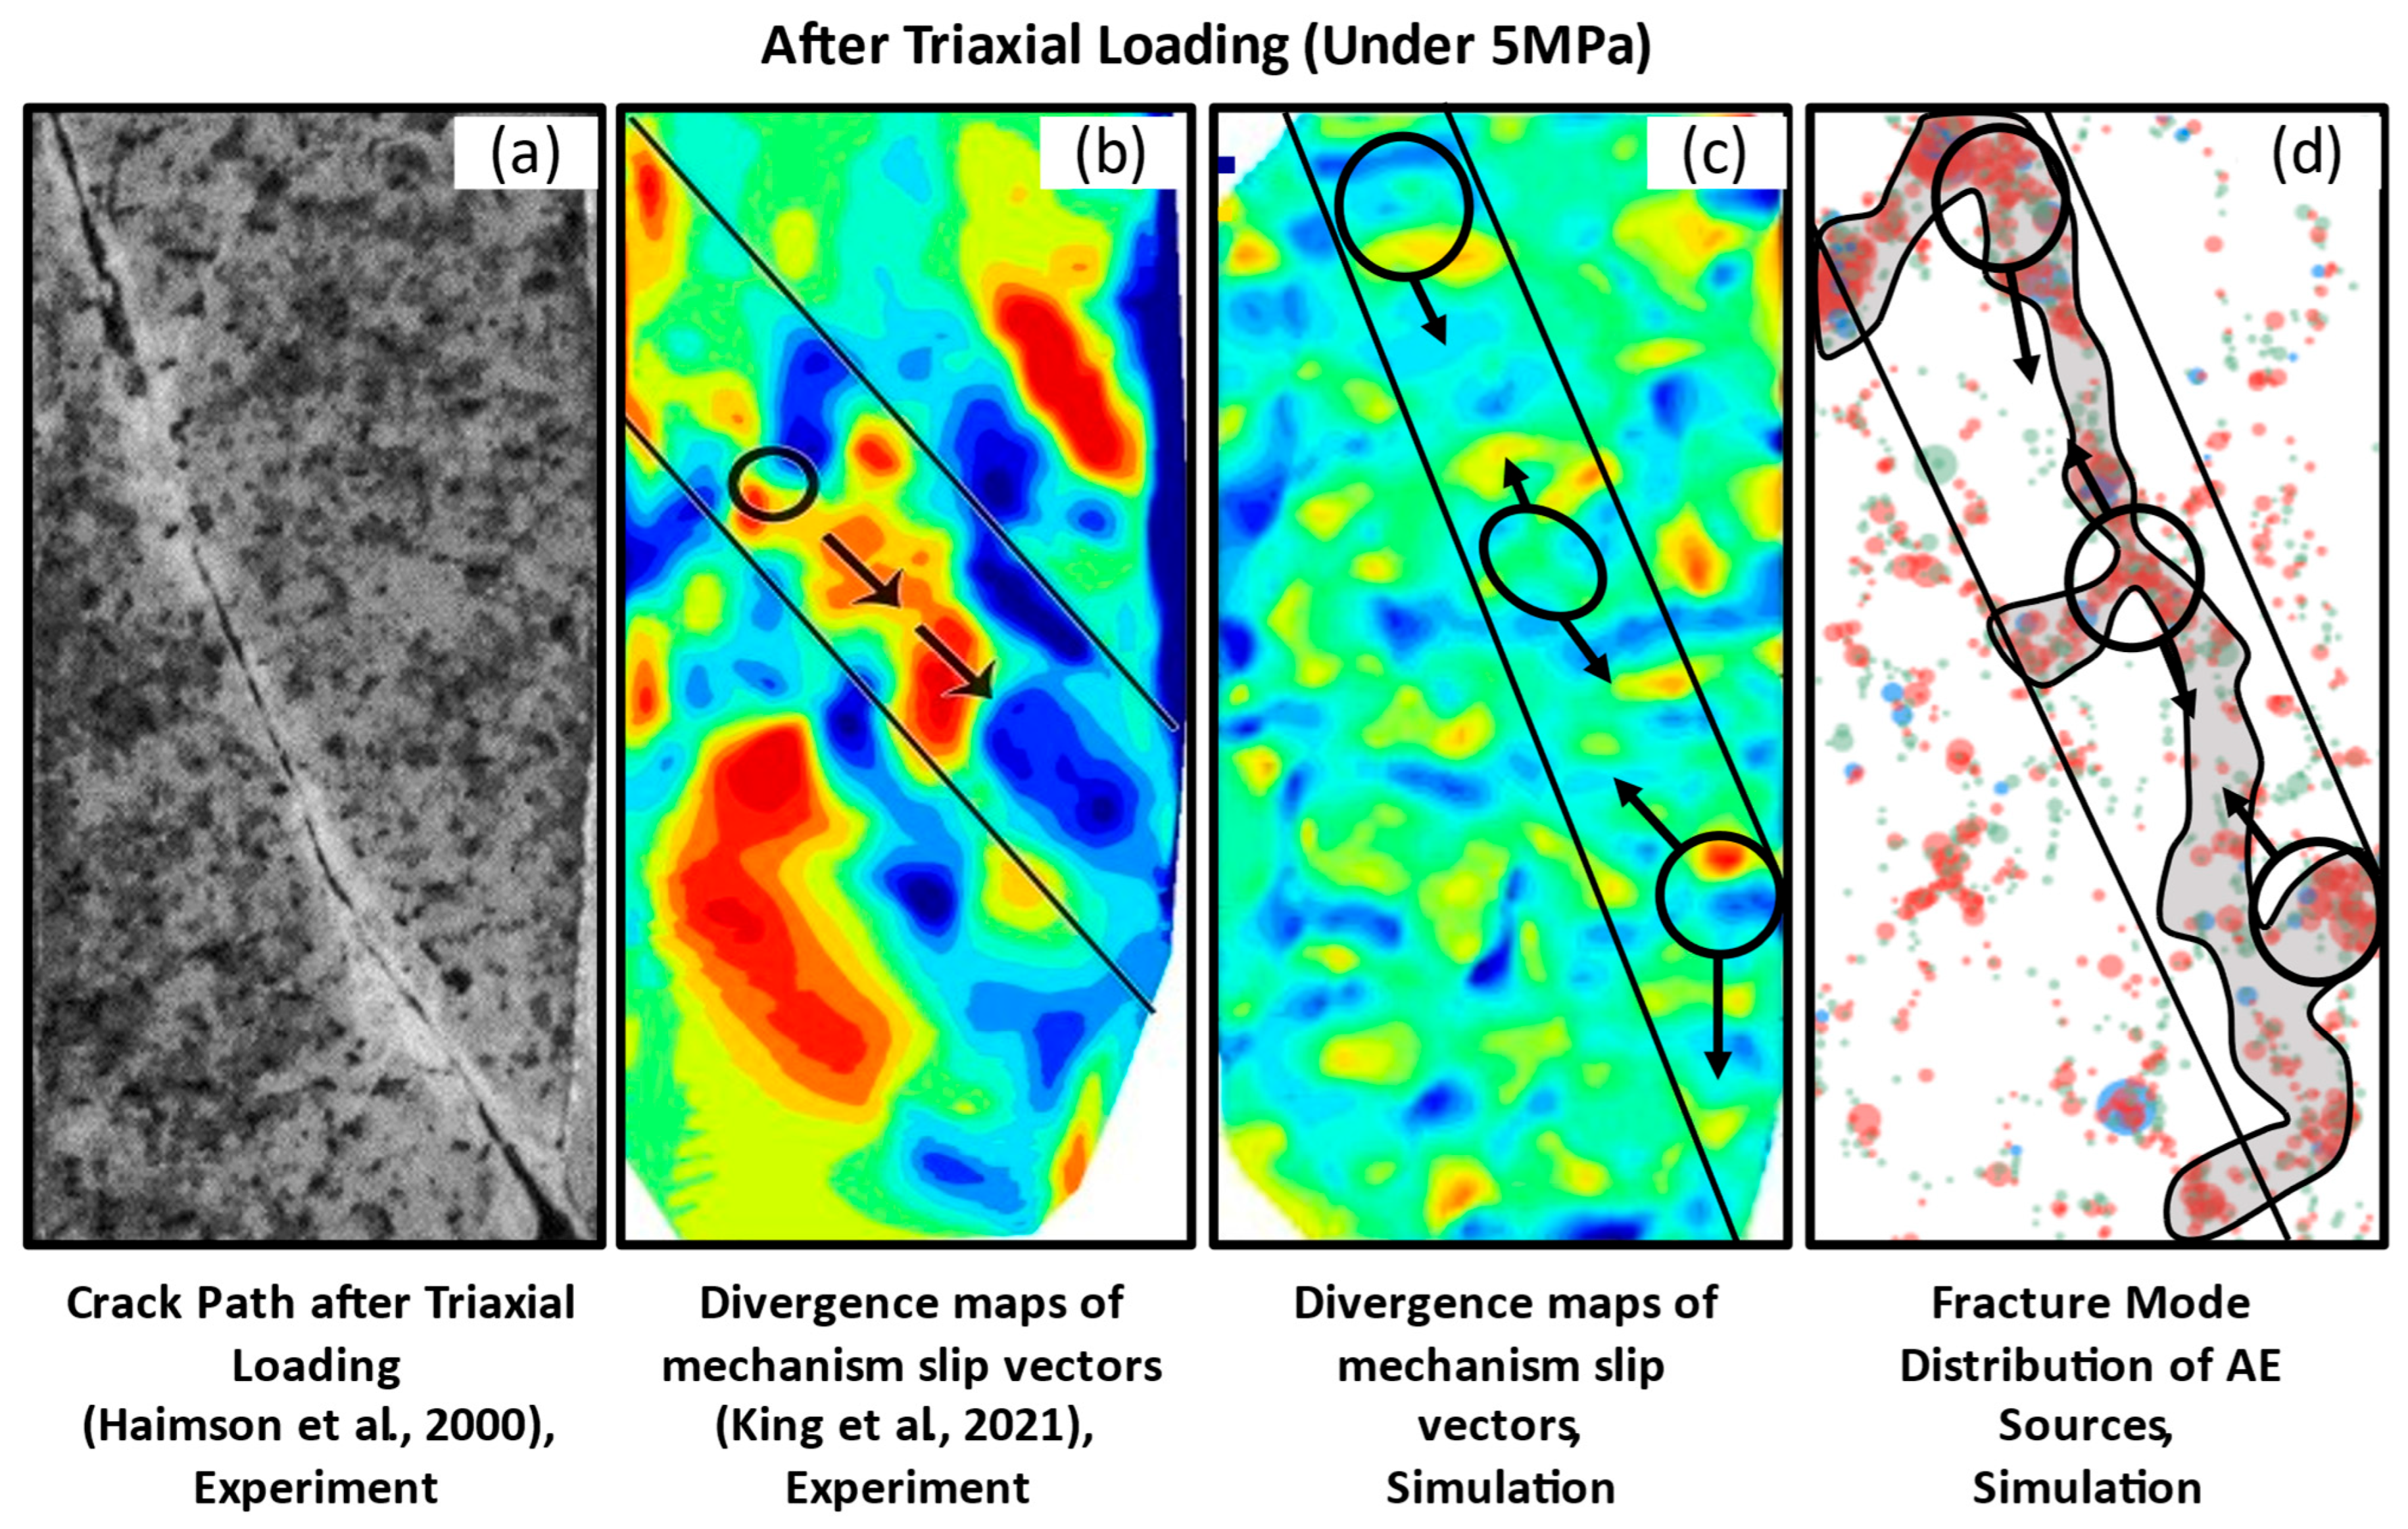
Table 3 presents the final mechanical results [79,80,81], while Figure 4 depicts the comparison of typical crack path in granite after triaxial loading in the experiment [81] and the simulation (this study). Table 4 and Figure 5 compare the proportion of source mechanisms for AE events in experimental and simulation granite models under different confining pressure loading conditions (the classification for AE source mechanisms and the analysis of results will be detailed in the subsequent sections).
The final comparison of mechanical results, crack paths, and AE response show good agreement with those reported by Petružálek et al. [58], Heap et al. [59], Haimson et al. [83], and King et al. [41], demonstrating the appropriateness of microparameter selection and the applicability of the granite model.

3.5. Microparameter Sensitivity Analysis

To evaluate the robustness of the numerical results with respect to microparameter selection, a local sensitivity analysis was conducted. Key DEM microparameters, including the stiffness ratio, bond tensile strength, bond cohesion strength, and friction coefficient, were independently perturbed by ±10% around their calibrated values, while all other parameters were kept constant. The analysis was performed under a representative confining pressure of 20 MPa. The resulting macroscopic mechanical responses and acoustic emission (AE) characteristics, including peak stress, total AE event number, and source mechanism proportions (T-Type), were systematically compared with those of the baseline simulation.
The sensitivity analysis results indicate that moderate variations in DEM microparameters lead to limited quantitative changes in both mechanical and AE responses. As summarized in Table 5, the peak stress varied within approximately ±5%, and the total AE event number varied within ±8% across all perturbation scenarios. Despite these quantitative differences, the relative proportions of AE source mechanisms remained stable, and the dominance of T-Type fractures during post-peak unstable failure was consistently observed. Notably, variations in the T-Type fracture proportion were generally within ±7%, and no qualitative change in AE source mechanism hierarchy was detected. These results demonstrate that although reasonable microparameter variations may slightly affect absolute magnitudes, the main conclusions regarding fracture patterns, AE mechanisms, and the influence of confining pressure are robust and are not strongly dependent on the specific choice of DEM microparameters.
Overall, the sensitivity analysis confirms that the observed relationships between confining pressure, AE source mechanism evolution, and AE characteristics reflect the intrinsic mechanical behavior of the rock material rather than numerical artifacts associated with a particular parameter set.

3.6. AE Event Monitoring and Recognition Method

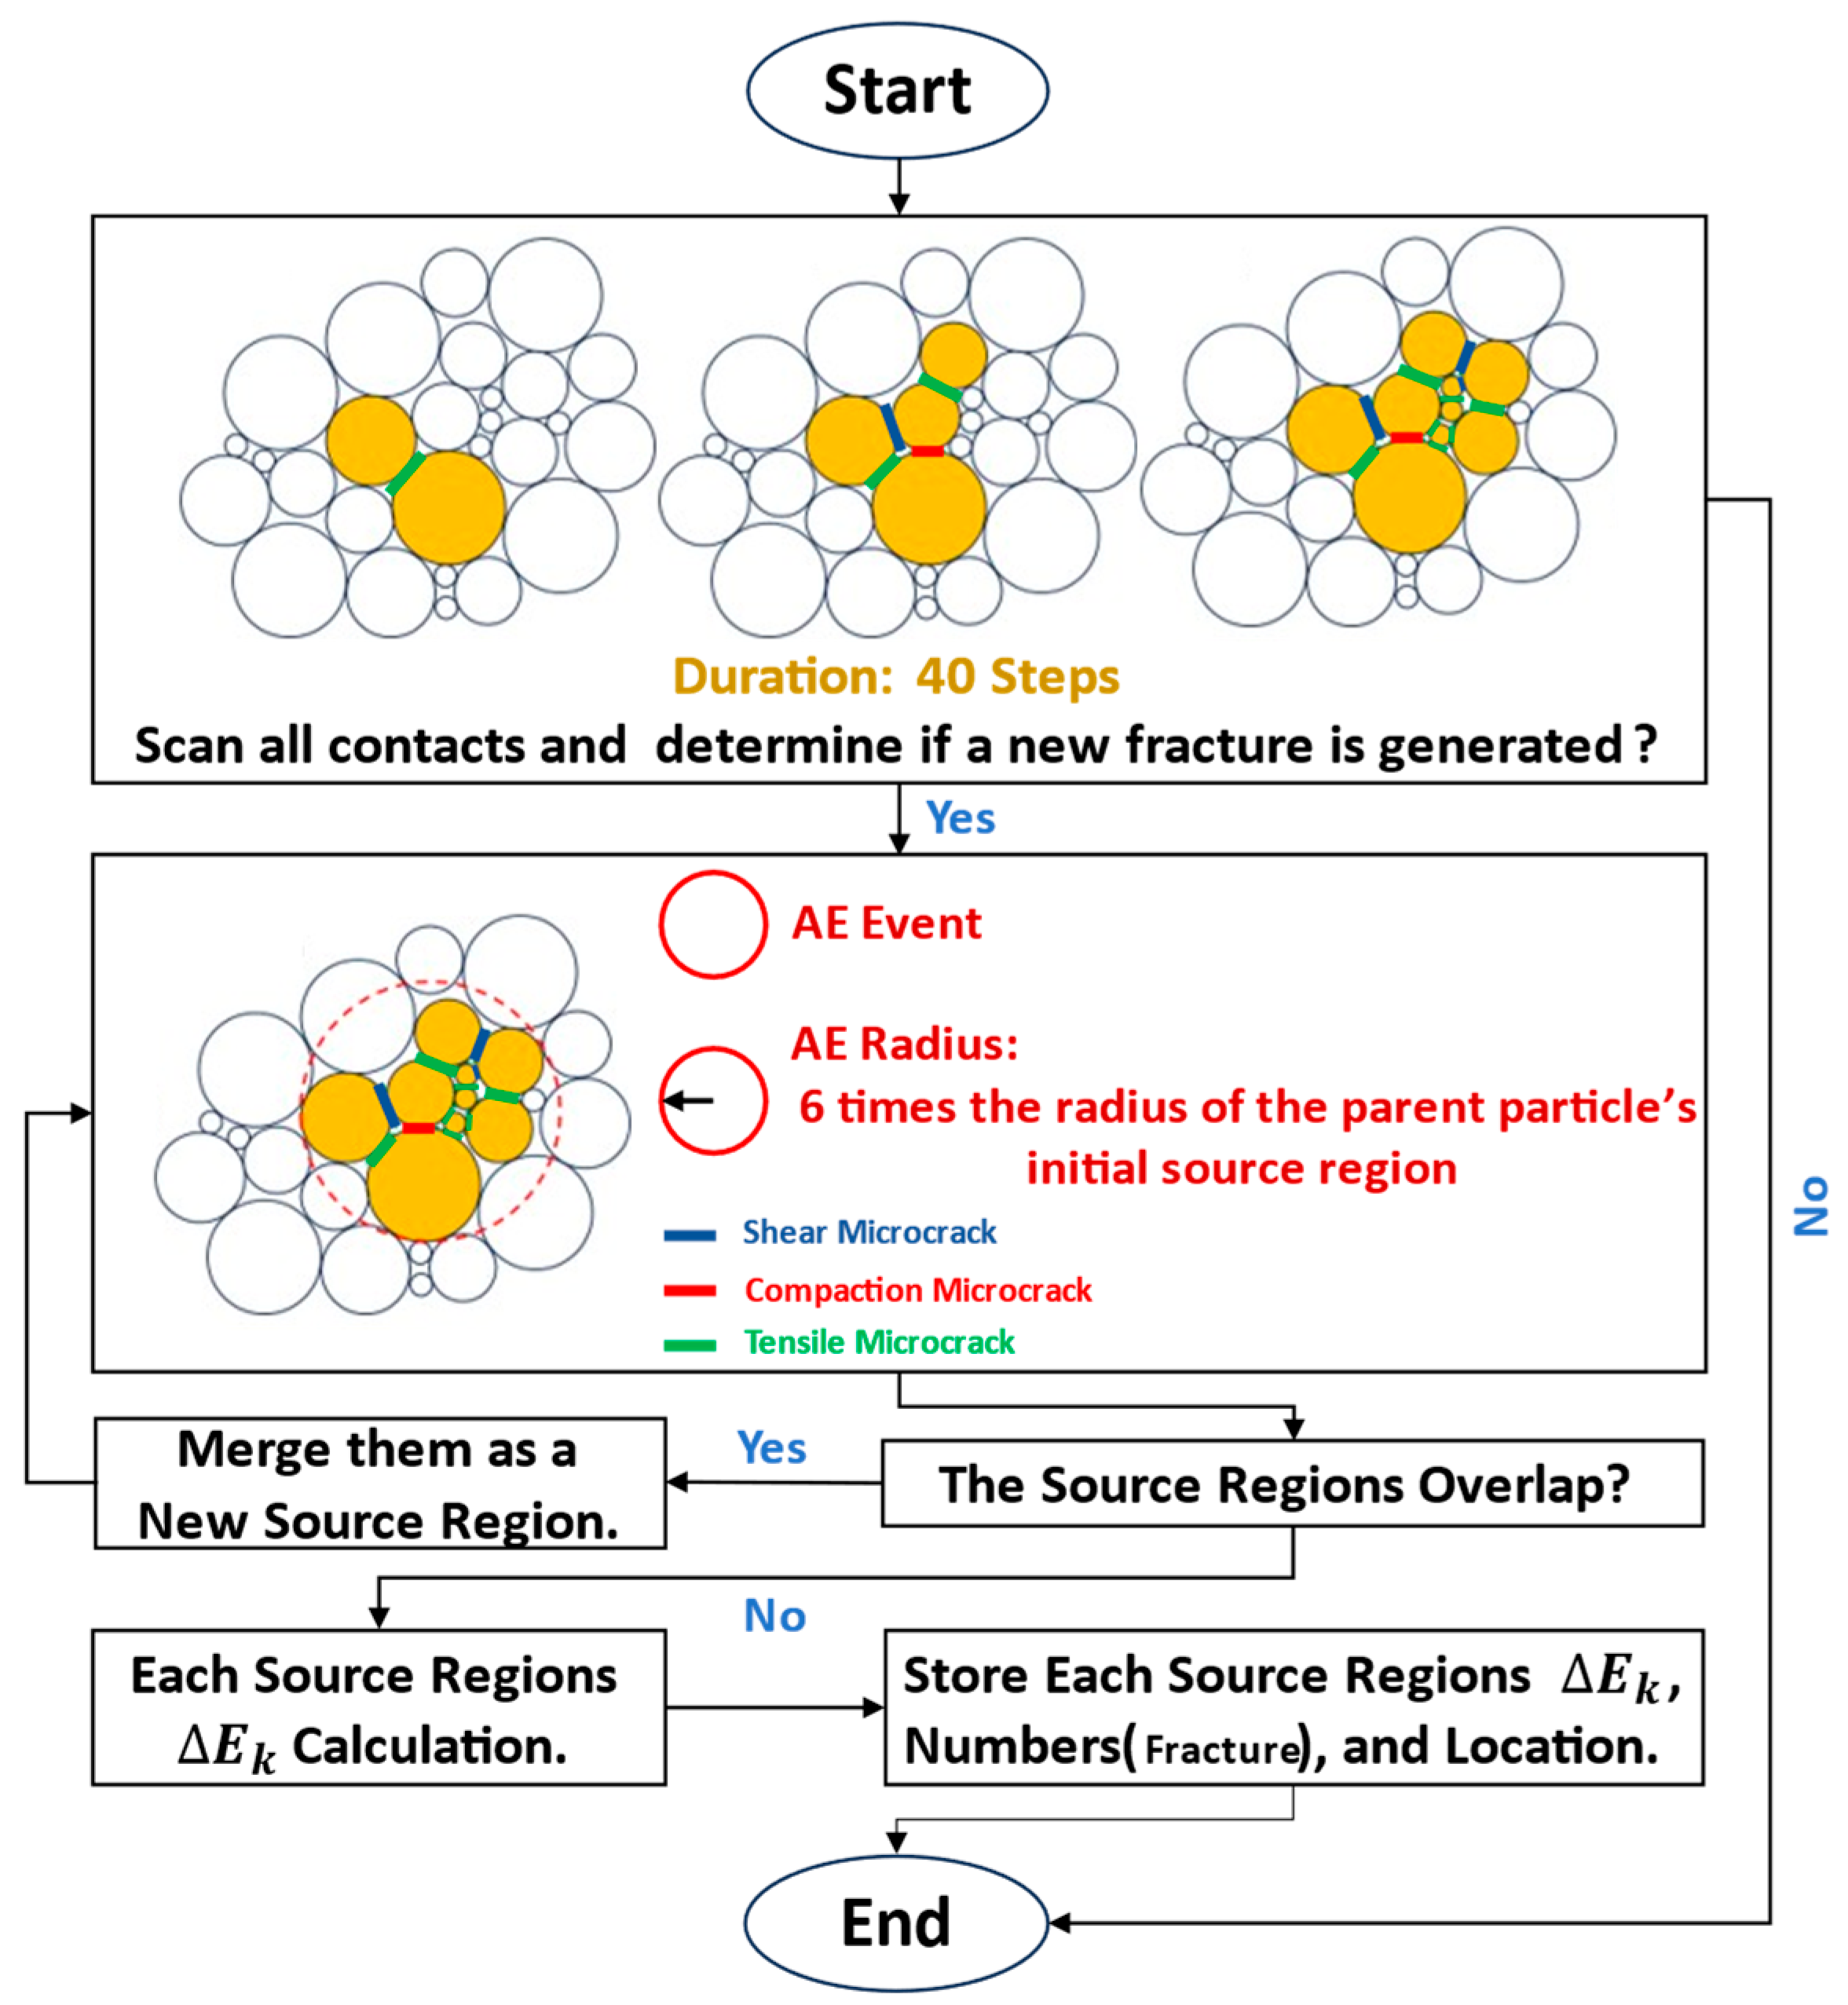
Acoustic emission (AE), generated by microcrack occurrence, is a universal phenomenon in brittle fracture, offering valuable insights into rock damage processes [84]. In PFC, each bond breakage is regarded as a microcrack in the modeled rock [85]. AE signals originate from the energy released during these bond breakages, enabling the simulation of AE characteristics, including spatial location, amplitude, and failure type, from the perspective of energy dissipation. During the AE event simulation, multiple microcracks can occur in close spatial and temporal proximity due to contact bond failure; such clusters are classified as a single AE event. This approach aggregates the total energy released from all bond breaks within a specific region over the AE duration, treating it as a single AE event [86]. A single AE event does not necessarily correspond to a single microcrack, which is consistent with field observations. AE events comprising only a single microcrack are considered noise, as their energy is minimal and their contribution to mapping mechanical responses during loading is negligible. During the loading process, the AE monitor program, scripted in Fish language, is used to simulate and capture AE signals generated throughout the failure process. To define the composition of AE events, the computation considers the finite affected region resulting from bond failure. When a microcrack forms, the two particles directly involved in the bond failure and their neighboring particles are identified as belonging to the AE event. The energy of the event is computed based on the cumulative changes in contact forces and relative displacements among these marked particles. The duration of an AE event is set to forty computational steps, which corresponds to the time required for peak strain energy release [87]. If new microcracks develop within the spatial and temporal extent of an ongoing AE event before the forty-step duration ends, the event window is dynamically extended to incorporate these new fractures. Particles surrounding the newly formed microcracks that have not yet been assigned to any ongoing event are also included. The spatial extent of each AE event is constrained within a maximum equivalent radius of six times the mean particle radius, ensuring that localized fracture clusters are treated as a single event [88]. It should be noted that this approach models AE as microcrack source activity related to a discrete rupture, without considering any effect of wave propagation. Thus, the PFC framework does not consider dynamic wave effects, and therefore, it does not capture elastic wave properties related to propagation. As well as the above, the AE event monitoring and identification flowchart is shown in Figure 6.
The energy of each AE event is calculated from the contact forces, contact stiffness, and relative displacements among the marked particles (Equation (8)), representing the elastic strain energy released due to bond breakage. Because the loading process is quasi-static and a high local damping coefficient is applied, inertial effects are negligible and kinetic energy contributions can be safely ignored. Therefore, the energy formulation does not include kinetic energy, and the computed AE energy corresponds to the reduction in stored elastic energy at particle contacts associated with bond failure. In this study, loading was conducted under quasi-static conditions with a damping coefficient of 0.7, which is sufficiently high to suppress inertial oscillations. Previous tests confirmed that the calculated AE energy is insensitive to reasonable variations in the damping coefficient. Consequently, the energy computation is formulated within the framework of static solid mechanics [89].
E k = E k E k 0
E k = 1 2 ( ( F n l ) 2 K n ) + F s l 2 K s
where E k is the change in AE energy at each timestep; E k 0 is the initial energy of all particles in the source region; E k is the AE energy of all particles in the source region monitored for the duration of the AE event; F s l is the contact shear force; F n l is the contact normal force; K n is normal stiffness; K s is shear stiffness.

3.7. AE Source Mechanisms Classification Method

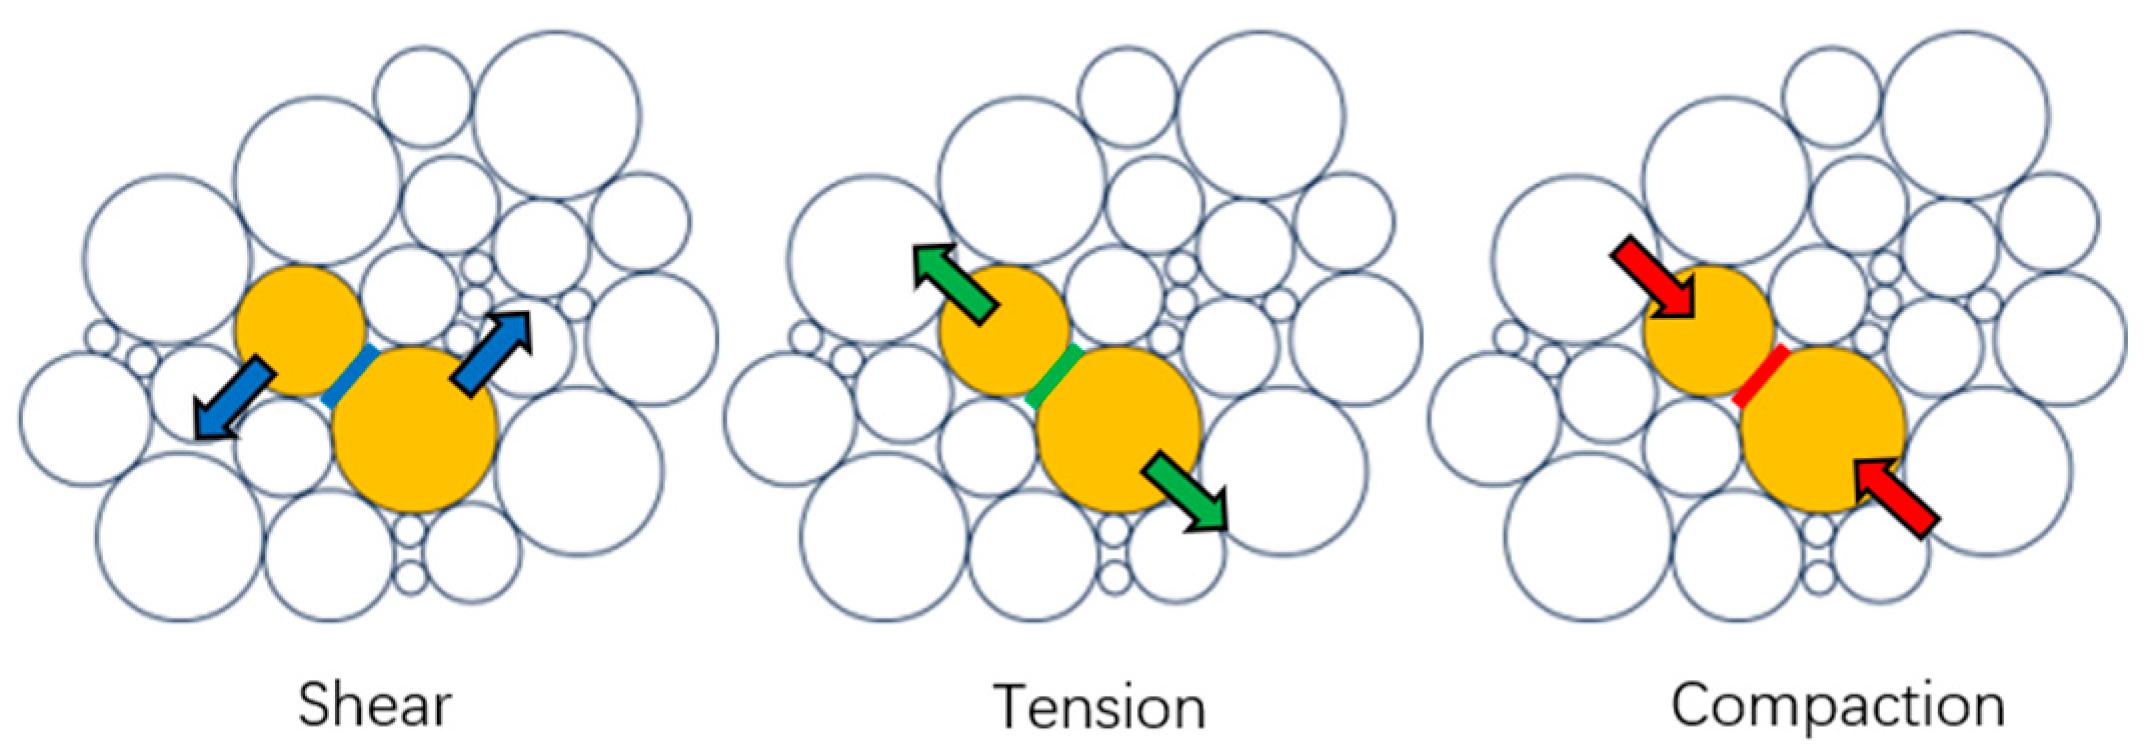
The AE source mechanism can be investigated as a precursor to the eventual failure of the rock. In the deformation process, particle fracture occurs when the forces acting on interparticle bonds overcome their strength, but the AE source mechanism within the model will be different. Three AE source mechanisms can be idealized: tension (T-Type), shear (S-Type), and compaction (C-Type). In practice, competing mechanisms are being used, and several methods have been proposed to identify leading mechanisms. King et al. [41] assumed a statistical approach to discriminate between competing mechanisms compared to idealized focal spheres, as shown in Figure 7.
Since AE signals in PFC are simulated based on the energy released during inter-particle bond fractures, we employ moment tensors to quantify the intensity, energy, and mechanical characteristics of the rupture sources. In PFC, the moment tensor is computed by multiplying the change in contact force by the vector from the contact point to the center of the microcrack. For AE events comprising multiple microcracks, the overall moment tensor is obtained by aggregating the contributions from each individual microcrack.
M i j = F i R j
where M i j is the component of the moment tensor, F i is the i -th component of the change in the contact force, and R j is the j -th component of the change in the contact force.
The moment tensor can be conceptualized as the equivalent body force of a seismic source, with its principal values represented by two vectors. The directions and magnitudes of these vectors correspond to the orientation and size of the moment tensor, respectively. Based on the peak scalar moment of the AE event’s moment tensor, the magnitude of the AE event can be calculated as follows [88]:
M e = 2 3 ( l o g 10 M 0 6 )
Here, the magnitude of an AE event is quantified based on the variation in energy released during the event, M 0 = E k , m a x .
Feignier et al. [90] indicated that each AE event can be decomposed into a isotropic and deviatoric parts:
M = t r ( M ) 3 [ m 1 m 2 m 3 ]
where t r ( M ) is the trace of the moment tensor matrix, which is equal to the summation of eigenvalue t r ( M ) = ( m 1 + m 2 + m 3 ) ; m i is the deviation eigenvalue; m i = m i t r ( M ) 3 .
In the PFC2D code, we represent the deviation eigenvalue as:
m i = m i 1 2 t r ( M ) ( i = 1,2 )
where t r ( M ) = m 1 + m 2 , and m i ( i = 1,2 ) is the eigenvalue of moment tensor ( M ).
The AE source mechanism is characterized using the ratio R between the isotropic and deviatoric components of the moment tensor [88,90]. According to the value of R, events are classified into three distinct types: shear, tension, and compaction. The ratio R is defined as:
R = t r ( M ) × 100 | t r ( M ) + i = 1 2 m i |
The R ranges from −100 (pure implosion) to 100 (pure explosion), and R = 0 represents a pure shear failure mechanism. Using the R-value to evaluate the damage properties of AE events is based on the stress state of the AE sources rather than on the tensile or shear microcrack composition of AE events. On the basis of the isotropic ratio R-value, the types of AE events are divided into “ explosive”, “shear”, or “implosive”, corresponding to the conditions that R 30 , 30 < R < 30 , and R 30 . According to Zhang et al. [91], AE events are classified as tensile if R 30 , as compaction if R 30 , and as shear if 30 < R < 30 . In this study, “explosive” events correspond to the tensile category, while “implosive” events correspond to the compaction category. This classification is consistent with the tension (T-Type), shear (S-Type), and compaction (C-Type) identification proposed by King et al. [41].

4. Results

We investigated the deformation properties and acoustic emission source mechanisms of granite numerical models under triaxial loading at different confining pressures (5, 10, 20, and 40 MPa) using PFC2D simulations. The results are presented in the following sections.

4.1. Stress–Strain Curve and AE Tendencies

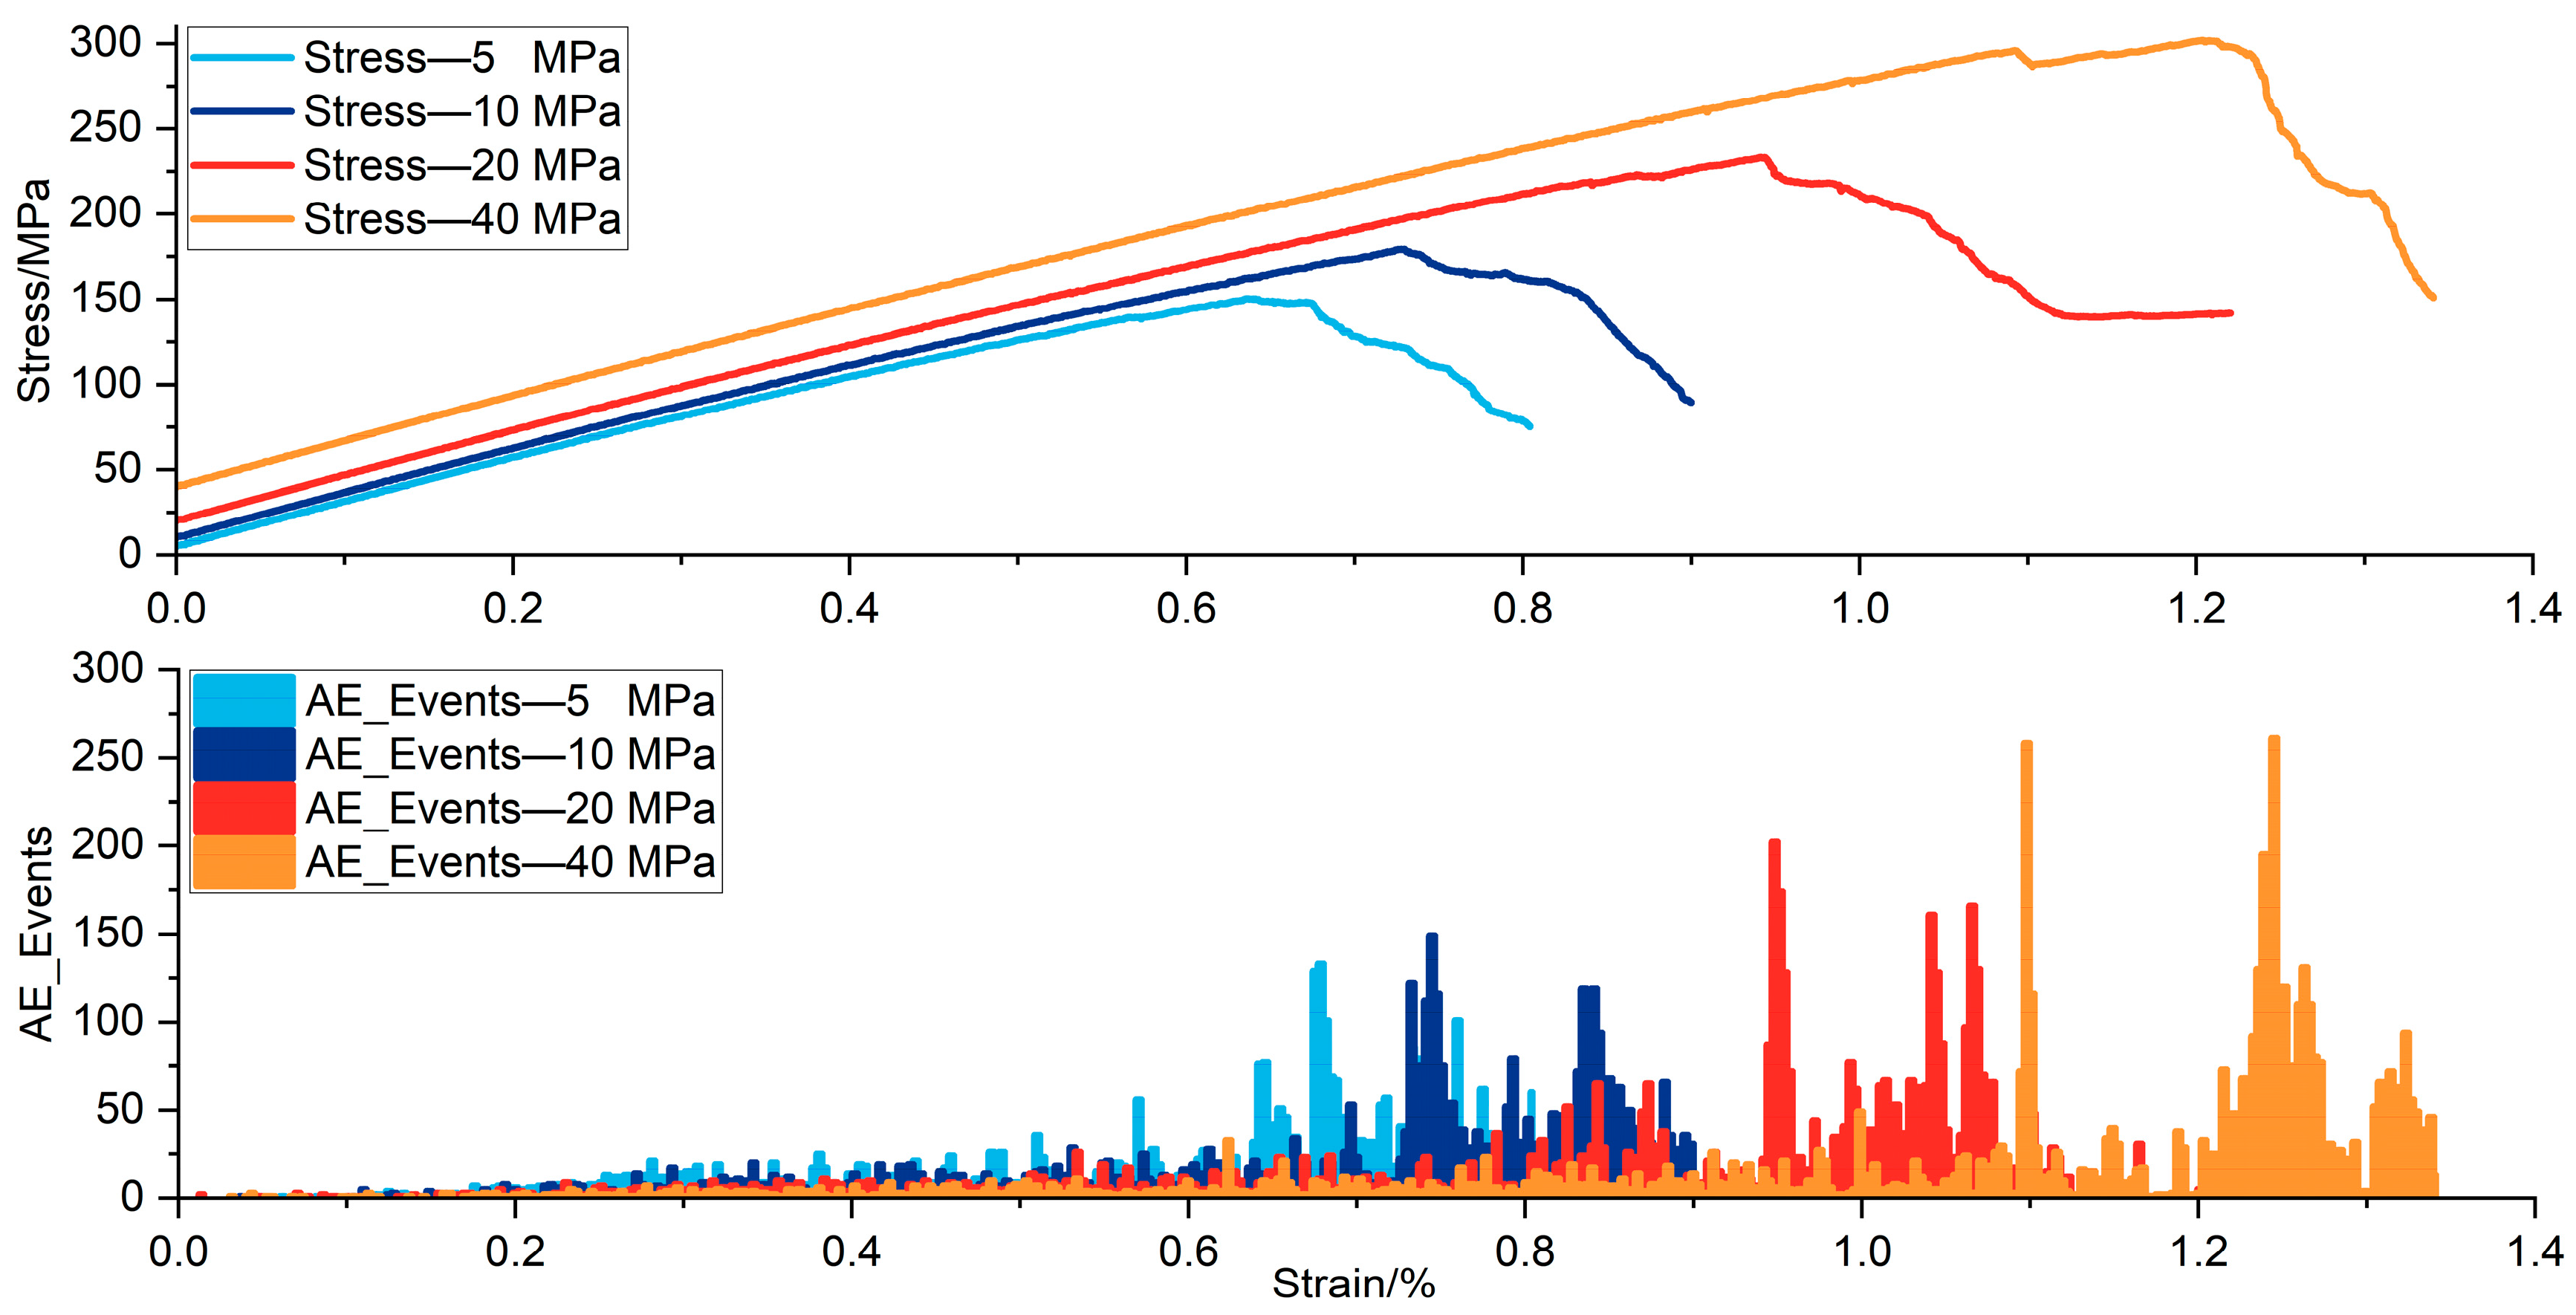
Figure 8 illustrates the stress–strain curves (top) and the corresponding trends of AE events (bottom) across different confining pressures. The total number of AE events increases with higher confining pressures, correlating with higher peak stresses. Clusters of AE events occur during the deformation stage under varying confining pressures. The cumulative AE trend of the loaded model and the clustering of AE events prior to peak stress both highly correlate with laboratory AE measurement results [41,82,92], confirming the reliability of the Fish-based AE event monitoring and recognition methods.
At confining pressures of 5 MPa, 10 MPa, 20 MPa, and 40 MPa, the peak stress values were 150.49 MPa, 179.35 MPa, 233.24 MPa, and 301.81 MPa, respectively. The corresponding strain values at peak stress were 0.64% (5 MPa), 0.73% (10 MPa), 0.94% (20 MPa), and 1.20% (40 MPa). These results are summarized in Table 6.
Increasing confining stress led to higher peak stress and specific deformation patterns before failure. Distinct AE events were observed across all confining stress experiments after a strain of 0.2%. For confining pressures of 20 and 40 MPa, the increase in AE events occurred later in the deformation process. In contrast, samples deformed under lower pressures (5 and 10 MPa) exhibited a more linear increase in AE events. This difference is attributed to the progressively delayed crack coalescence resulting from the competition between dilatant patches and strain hardening [42].

4.2. AE Evolution

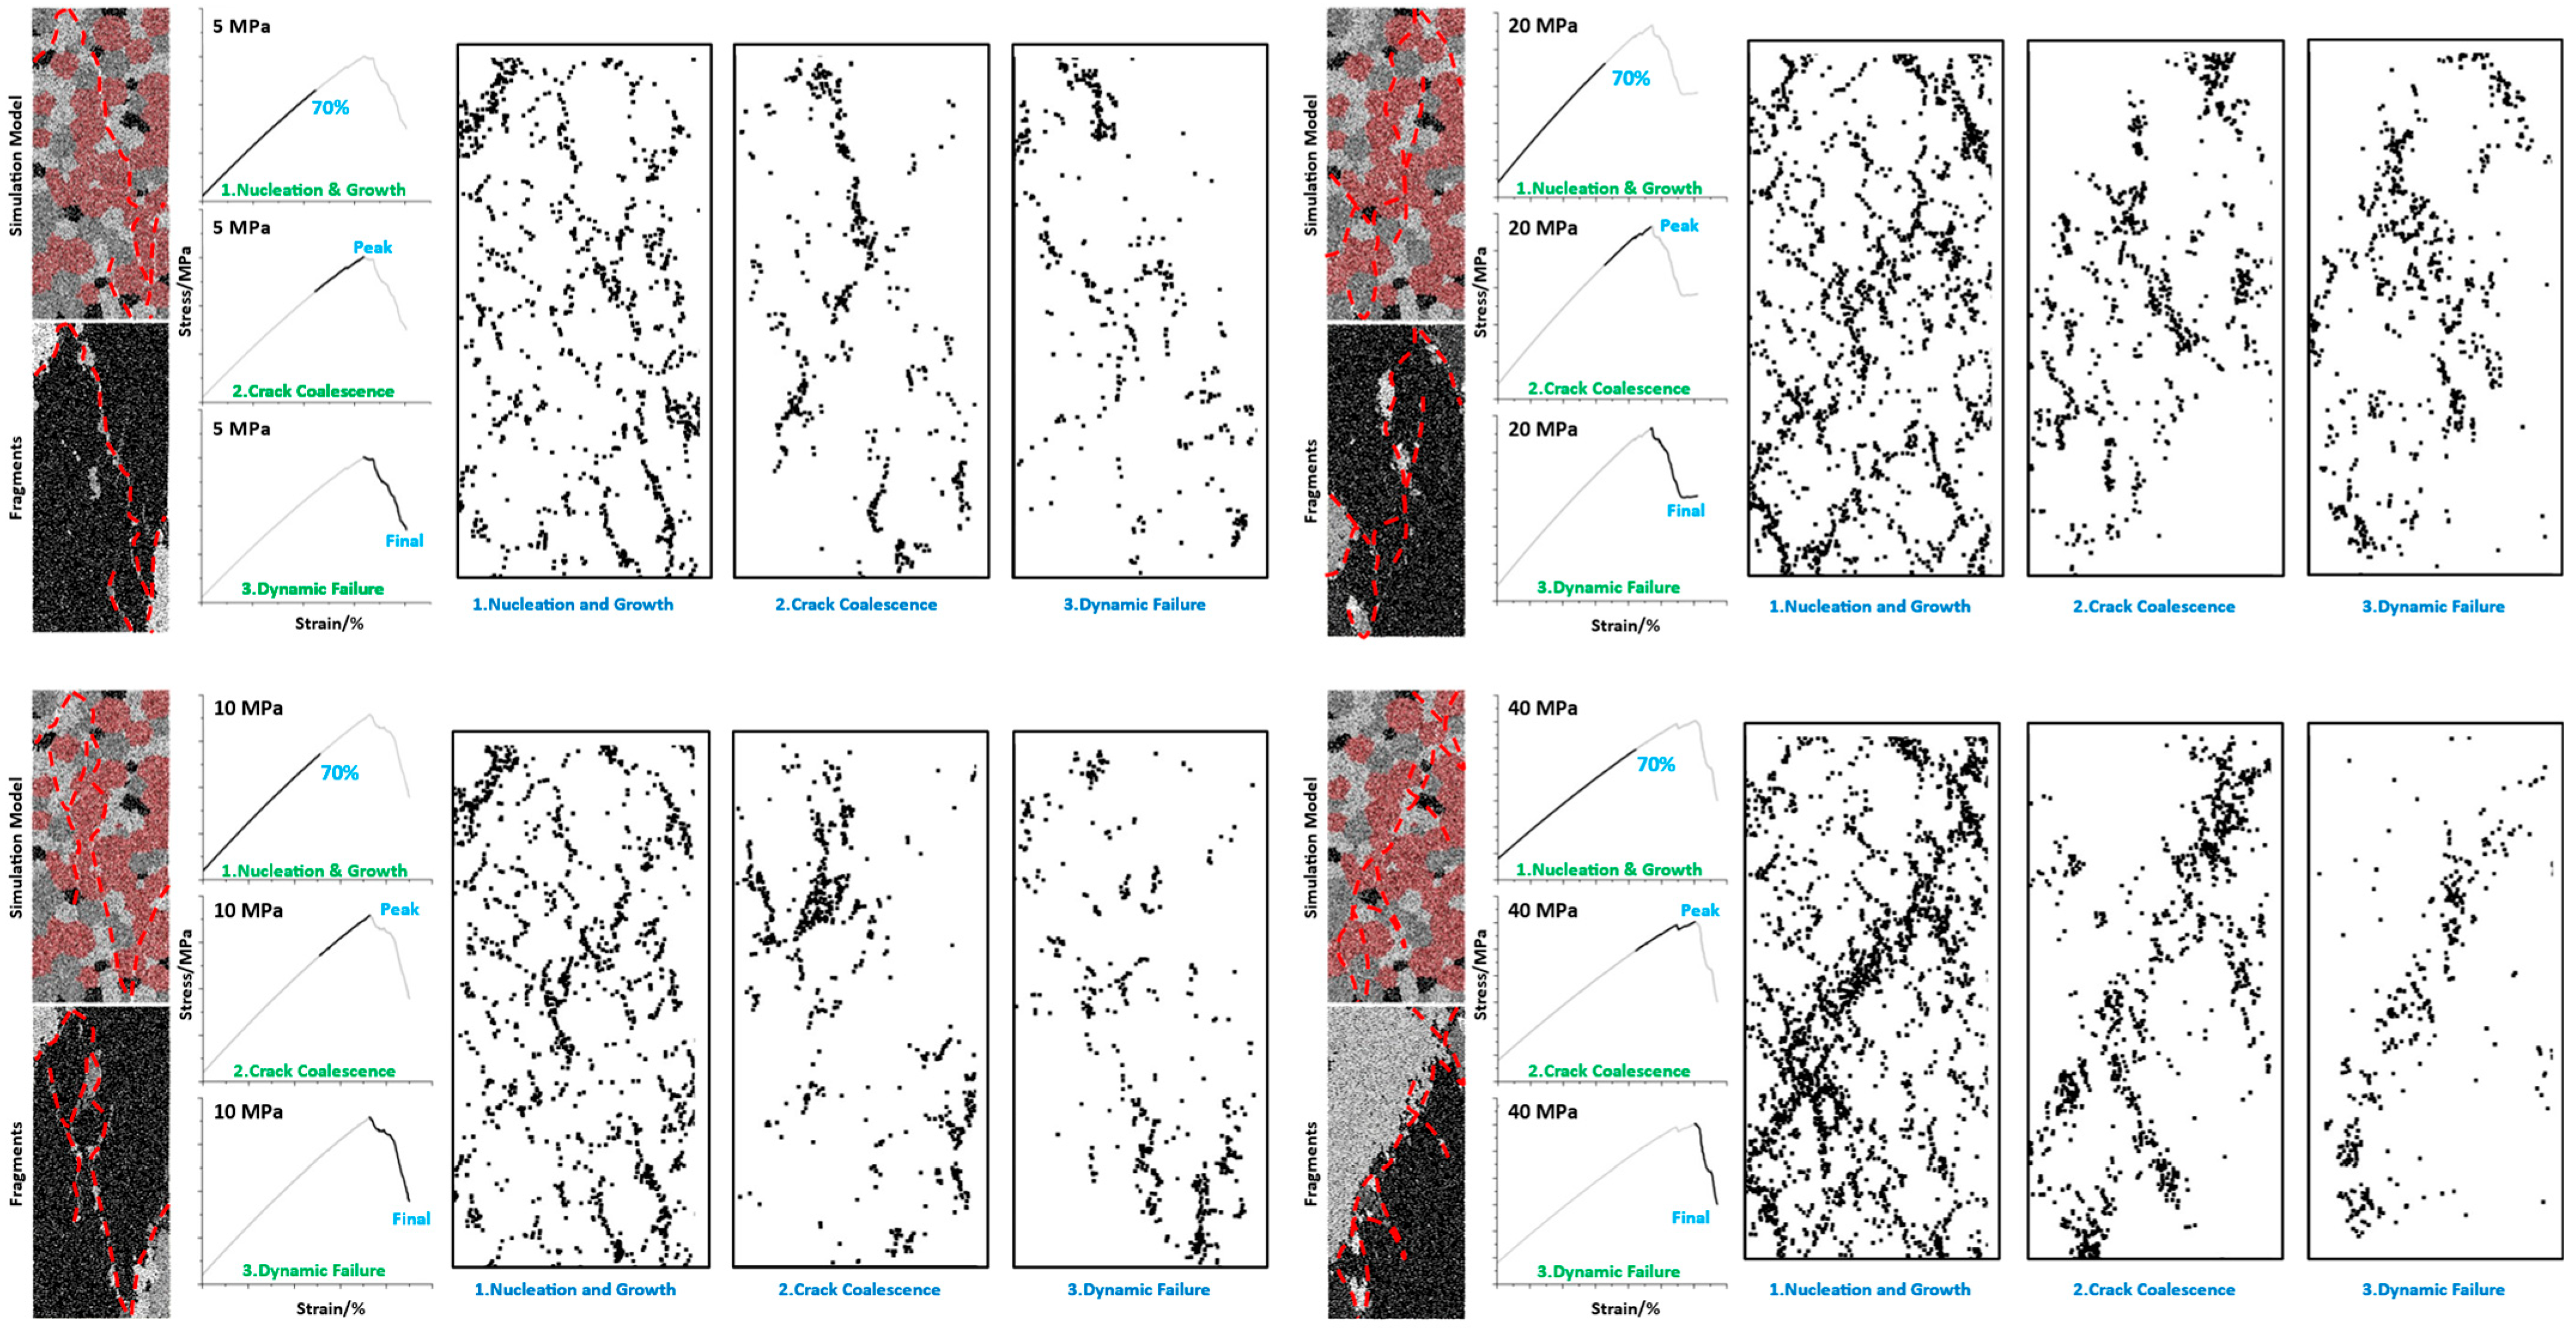
We have delineated three distinct deformation stages, each corresponding to specific strain intervals: (1) fracture nucleation and fault growth (0% to 70%), (2) crack coalescence (70% to peak stress), and (3) post-peak unstable failure of the sample.
Figure 9 displays the AE events generated by numerical modeling for three stress–strain curves at each confining pressure, showing that AE events appear at discrete loading stages. Additionally, the density and distribution of AE events vary across these stages.
During the nucleation and growth stage, AE events are abundant and widely dispersed throughout the model. In this phase, AE events predominantly occur between crystals, with fewer events generated within the crystals. In the subsequent crack coalescence step, cracks begin to develop more extensively within the crystals and link up into macroscopic cracks. By the final post-peak unstable failure stage, AE events are almost exclusively concentrated around macroscopic cracks, reflecting the model progression to failure, with a predominance of intragranular events.
Comparing AE event distributions in equivalent stages under varying confining pressures indicates that pre-failure events are generally isolated, randomly located, and often associated with the formation of a single microcrack. When multiple cracks occur in close spatial and temporal proximity, they tend to cluster into a larger AE event. Failure occurs rapidly and is recorded as numerous large AE events, each comprising dozens of microcracks. In the initial stage, lower confining pressure tends to produce a more random distribution of AE events across the sample, which predominantly occurred in the intergranular regions. As confining pressure increased, AE events tended to concentrate around macroscopic cracks, and the likelihood of occurrence within the crystal increased, suggesting that higher confining pressure may have encouraged the early accumulation of AE events around these fractures. In the second stage, higher confining pressure resulted in a notable concentration of AE events in the intragranular regions and around emerging macroscopic fractures. Additionally, a reduction in AE event numbers was observed in the third stage as confining pressure increased. This decrease could be attributed to the earlier concentration of AE events around macroscopic fractures under elevated confining pressure in the initial phase.
The left side of Figure 9 illustrates the crack development paths at various confining pressures (5 MPa, 10 MPa, 20 MPa, and 40 MPa). At lower pressures, cracks predominantly follow vertical paths, whereas at higher pressures, X-shaped crack patterns emerge. This transition signifies a shift from localized faulting to more distributed crack damage as confining pressure increases [41].

4.3. AE Magnitude Distribution

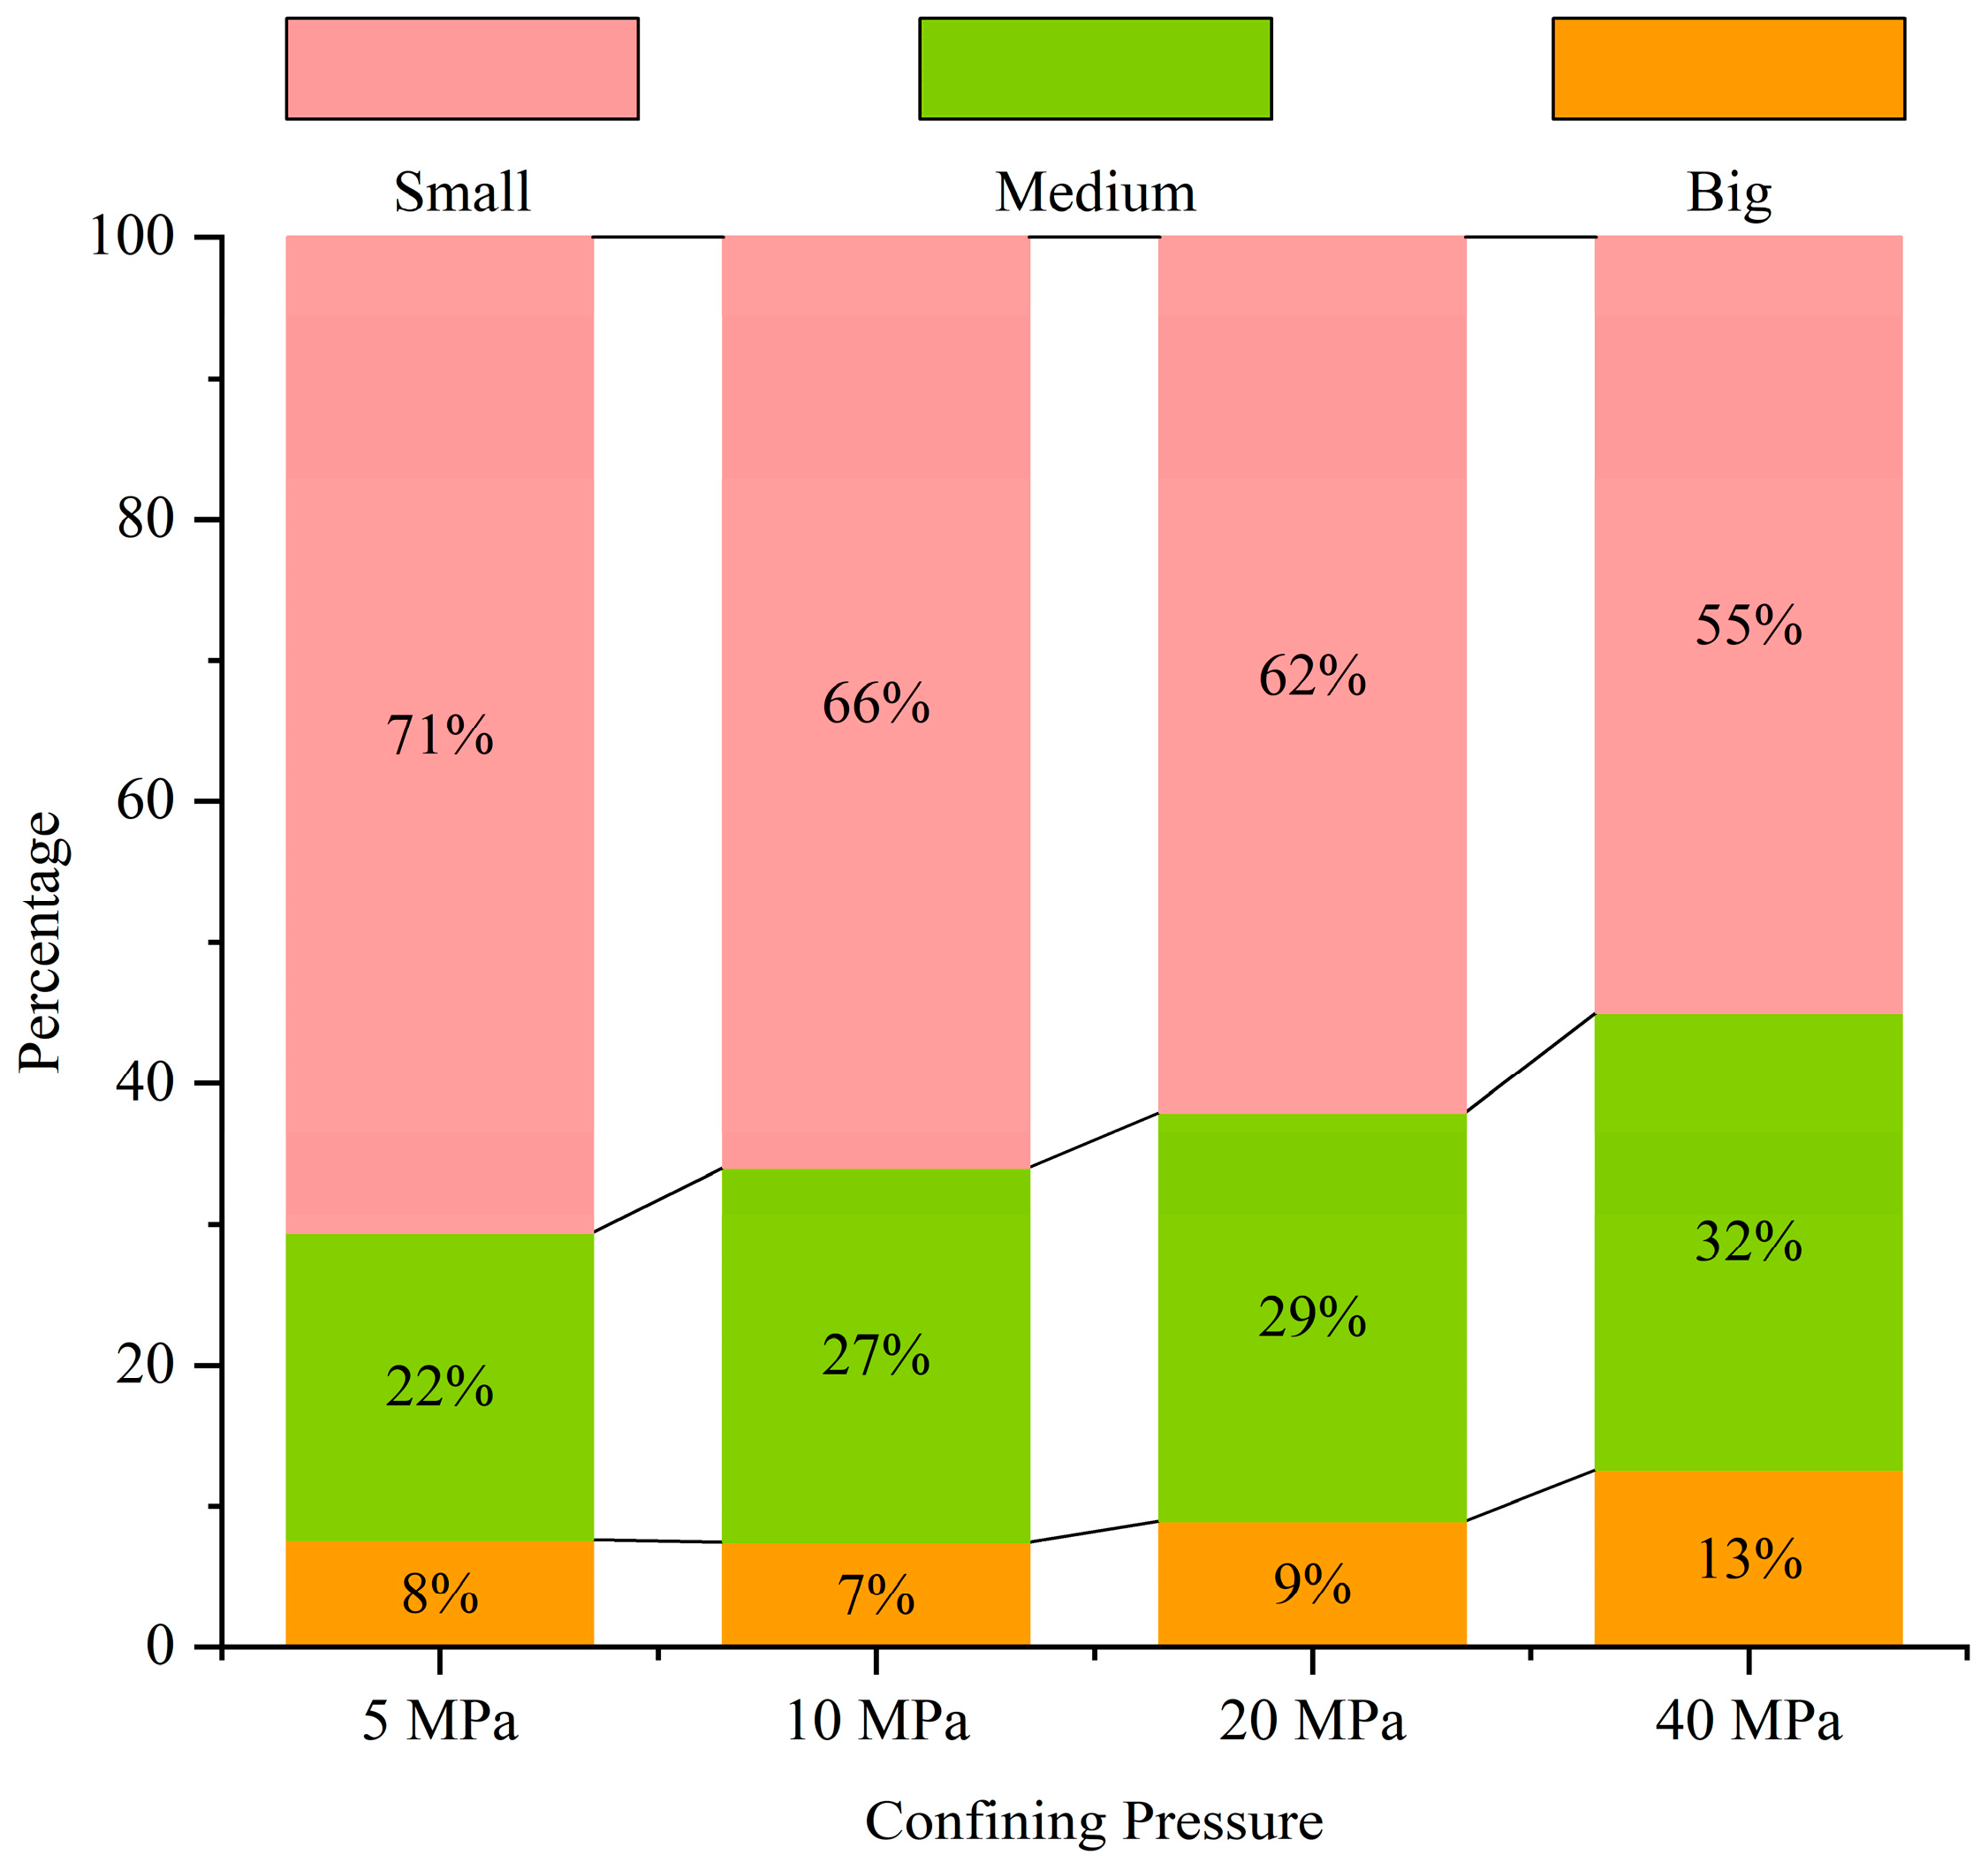
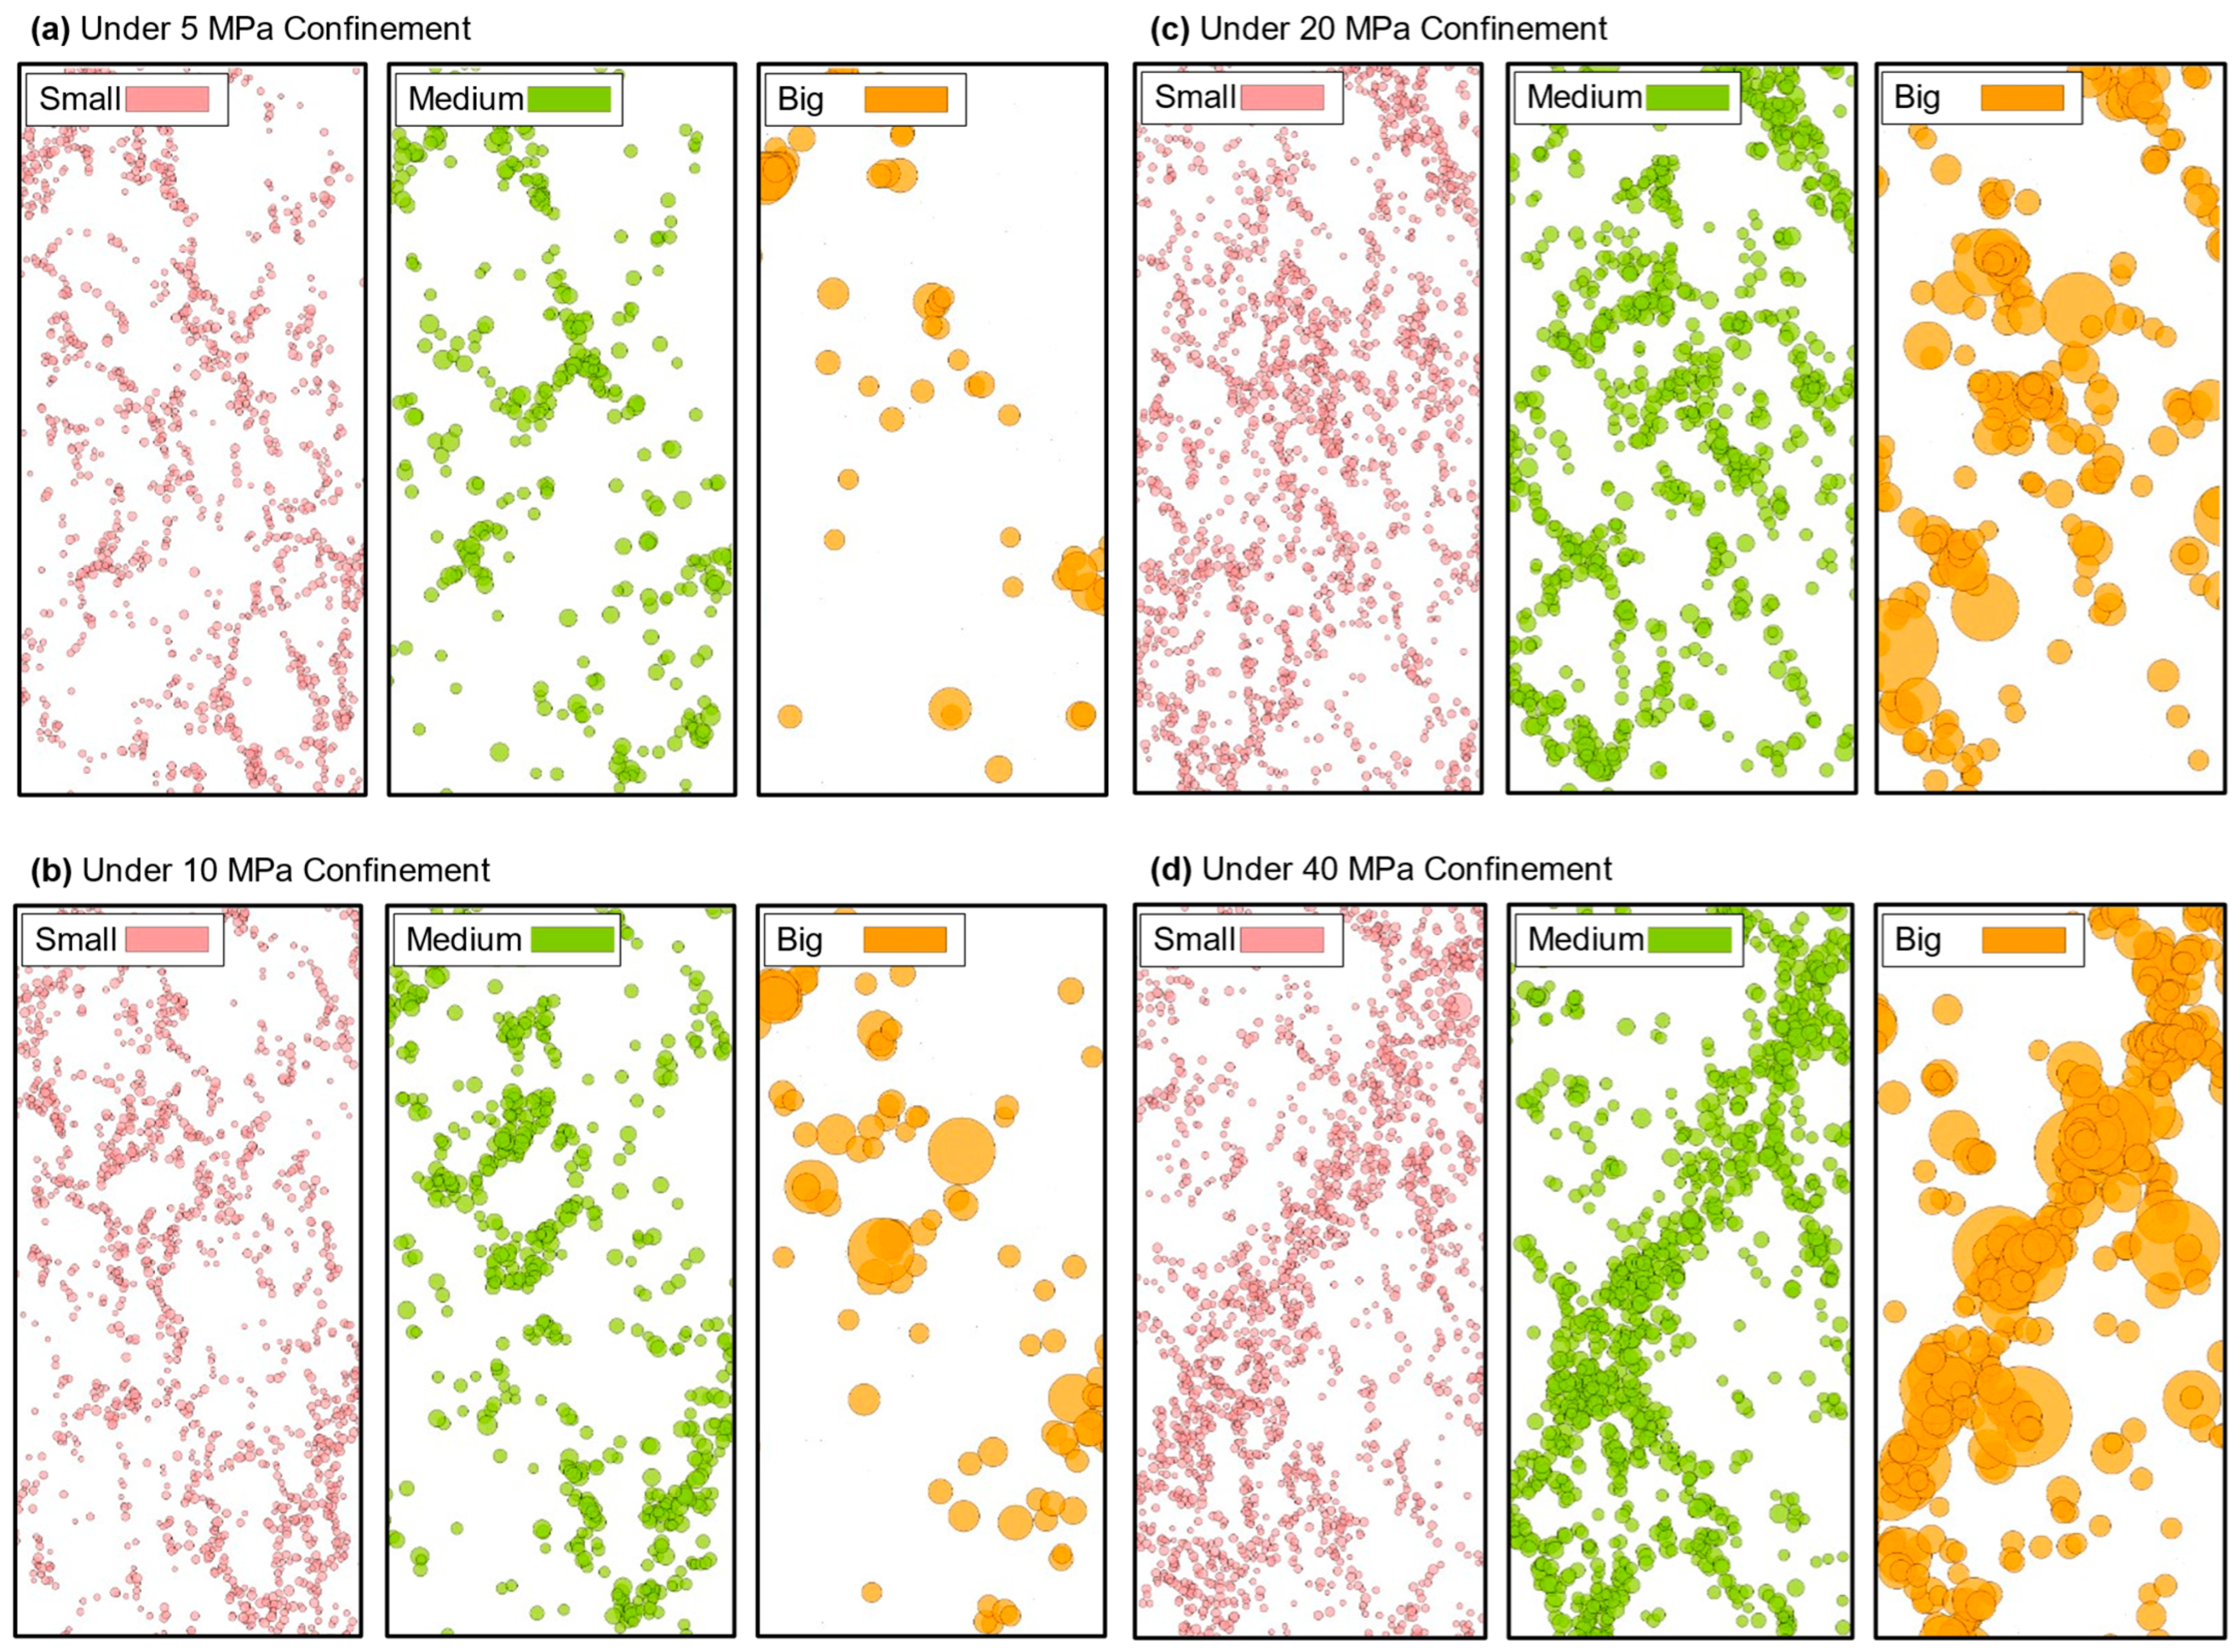
According to the empirical relationship between the AE moment magnitude and energy release [93,94], AE events were classified into three categories based on their moment magnitude ( M e ): events with a moment magnitude below −4 were categorized as small events (during the microcrack initiation), those with Me ranging between −4 and −3.5 were classified as medium events (crack propagation and secondary linkage), and events above −3.5 were classified as big events (before the main crack penetration or failure). This classification ensures approximately one order of magnitude difference in energy release between adjacent categories, which is consistent with the logarithmic scaling behavior of AE energy.
The results depicted in Figure 10 reveal that in samples undergoing compression at various confining pressures, small events consistently dominate, accounting for approximately 71% to 55% of all seismic events. With increasing confining pressure, medium events rise from 22% to 32%, while the occurrence of big events rises from 8% to 13%. This behavior is driven by the influence of confining pressure on crack nucleation and aggregation, particularly affecting the development of big events. Moreover, higher confining pressures significantly impact the occurrence of high-energy AE events.
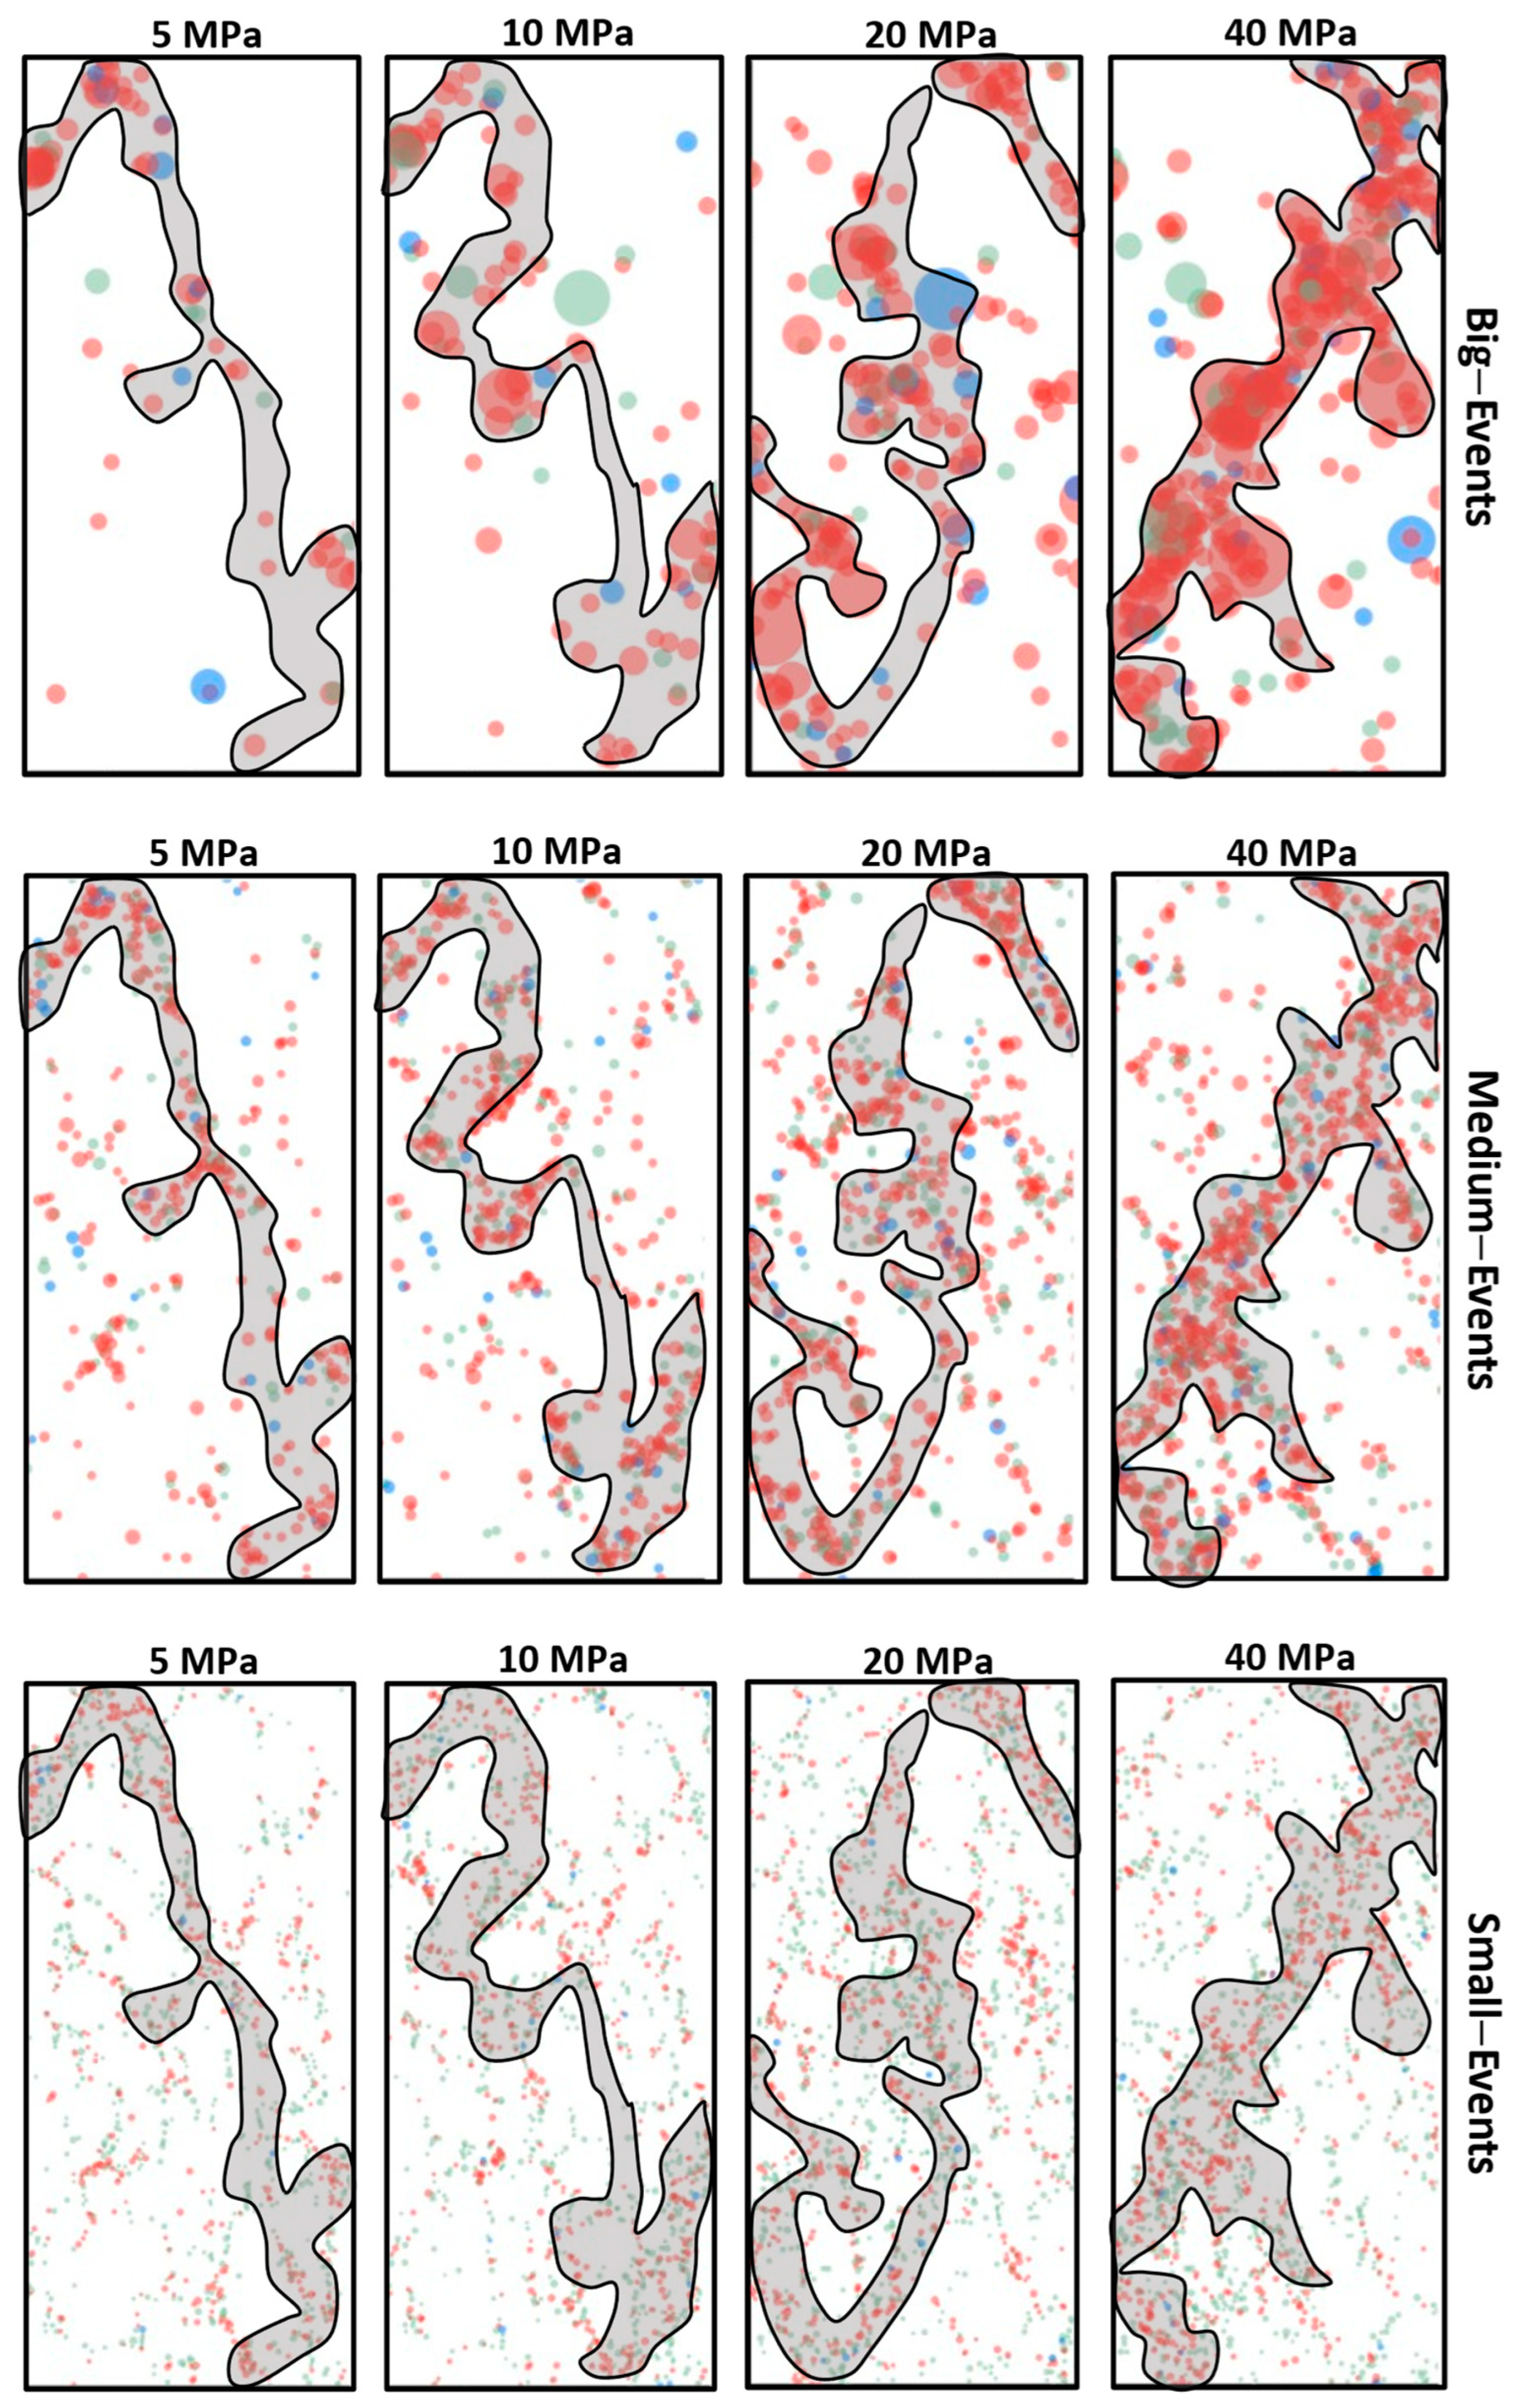
The size of each circle represents the magnitude of AE events (Figure 11), with three types (small, medium, big) highlighted in different colors. As confining pressure increases, the energy released by AE events around macroscopic fractures notably amplifies. While AE events occur elsewhere in the model, their energy release is comparatively minor to that of AE events surrounding macroscopic fractures. Most of the energy released by the model is attributed to AE events associated with the formation of macroscopic fractures. Additionally, the energy released by AE events around these fractures increases with higher confining pressures.
As the confining pressure increases, the energy released by AE events surrounding macroscopic fractures significantly amplifies. Although AE events occur in other regions of the model, their energy release remains relatively minor compared to that of AE events around macroscopic fractures. Most of the energy released in the model appears to be associated with AE events related to the formation of macroscopic fractures. Furthermore, the energy released by AE events around these fractures grows with increasing confining pressures, indicating how confining pressure influences the distribution and magnitude of AE events during the compression process. The rise in confining pressure is correlated with a higher proportion of big events, reflecting more intense fracturing processes. Monitoring AE energy, along with observed AE mechanisms, may provide valuable insights for predicting fracture precursors in rock samples.

4.4. AE b-Value

b-value can be seen as an indicator of the crack damage degree during rock deformation. It is calculated by the Gutenberg–Richter law [95]:
l g N = a b M e
where M e is the magnitude (Equation (10)), a is the constant, and N is the event number in a specific magnitude interval or the event number with a magnitude greater than M e [96]. The b-value is the angular coefficient of the best fit obtained from the linear regression of lgN vs. M e .
Computed from the AE size and occurrence, the b-value reflects the ratio between minor and major events. Specifically, a higher b-value indicates the dominance of smaller-size events, whereas the b-value decreases with the occurrence of higher-magnitude events. The b-value is a parameter typically associated with the stress state, strength, and homogeneity of the medium [97]. The b-value can serve as a valuable metric for studying structural damage evolution and predicting disaster precursors [98,99].
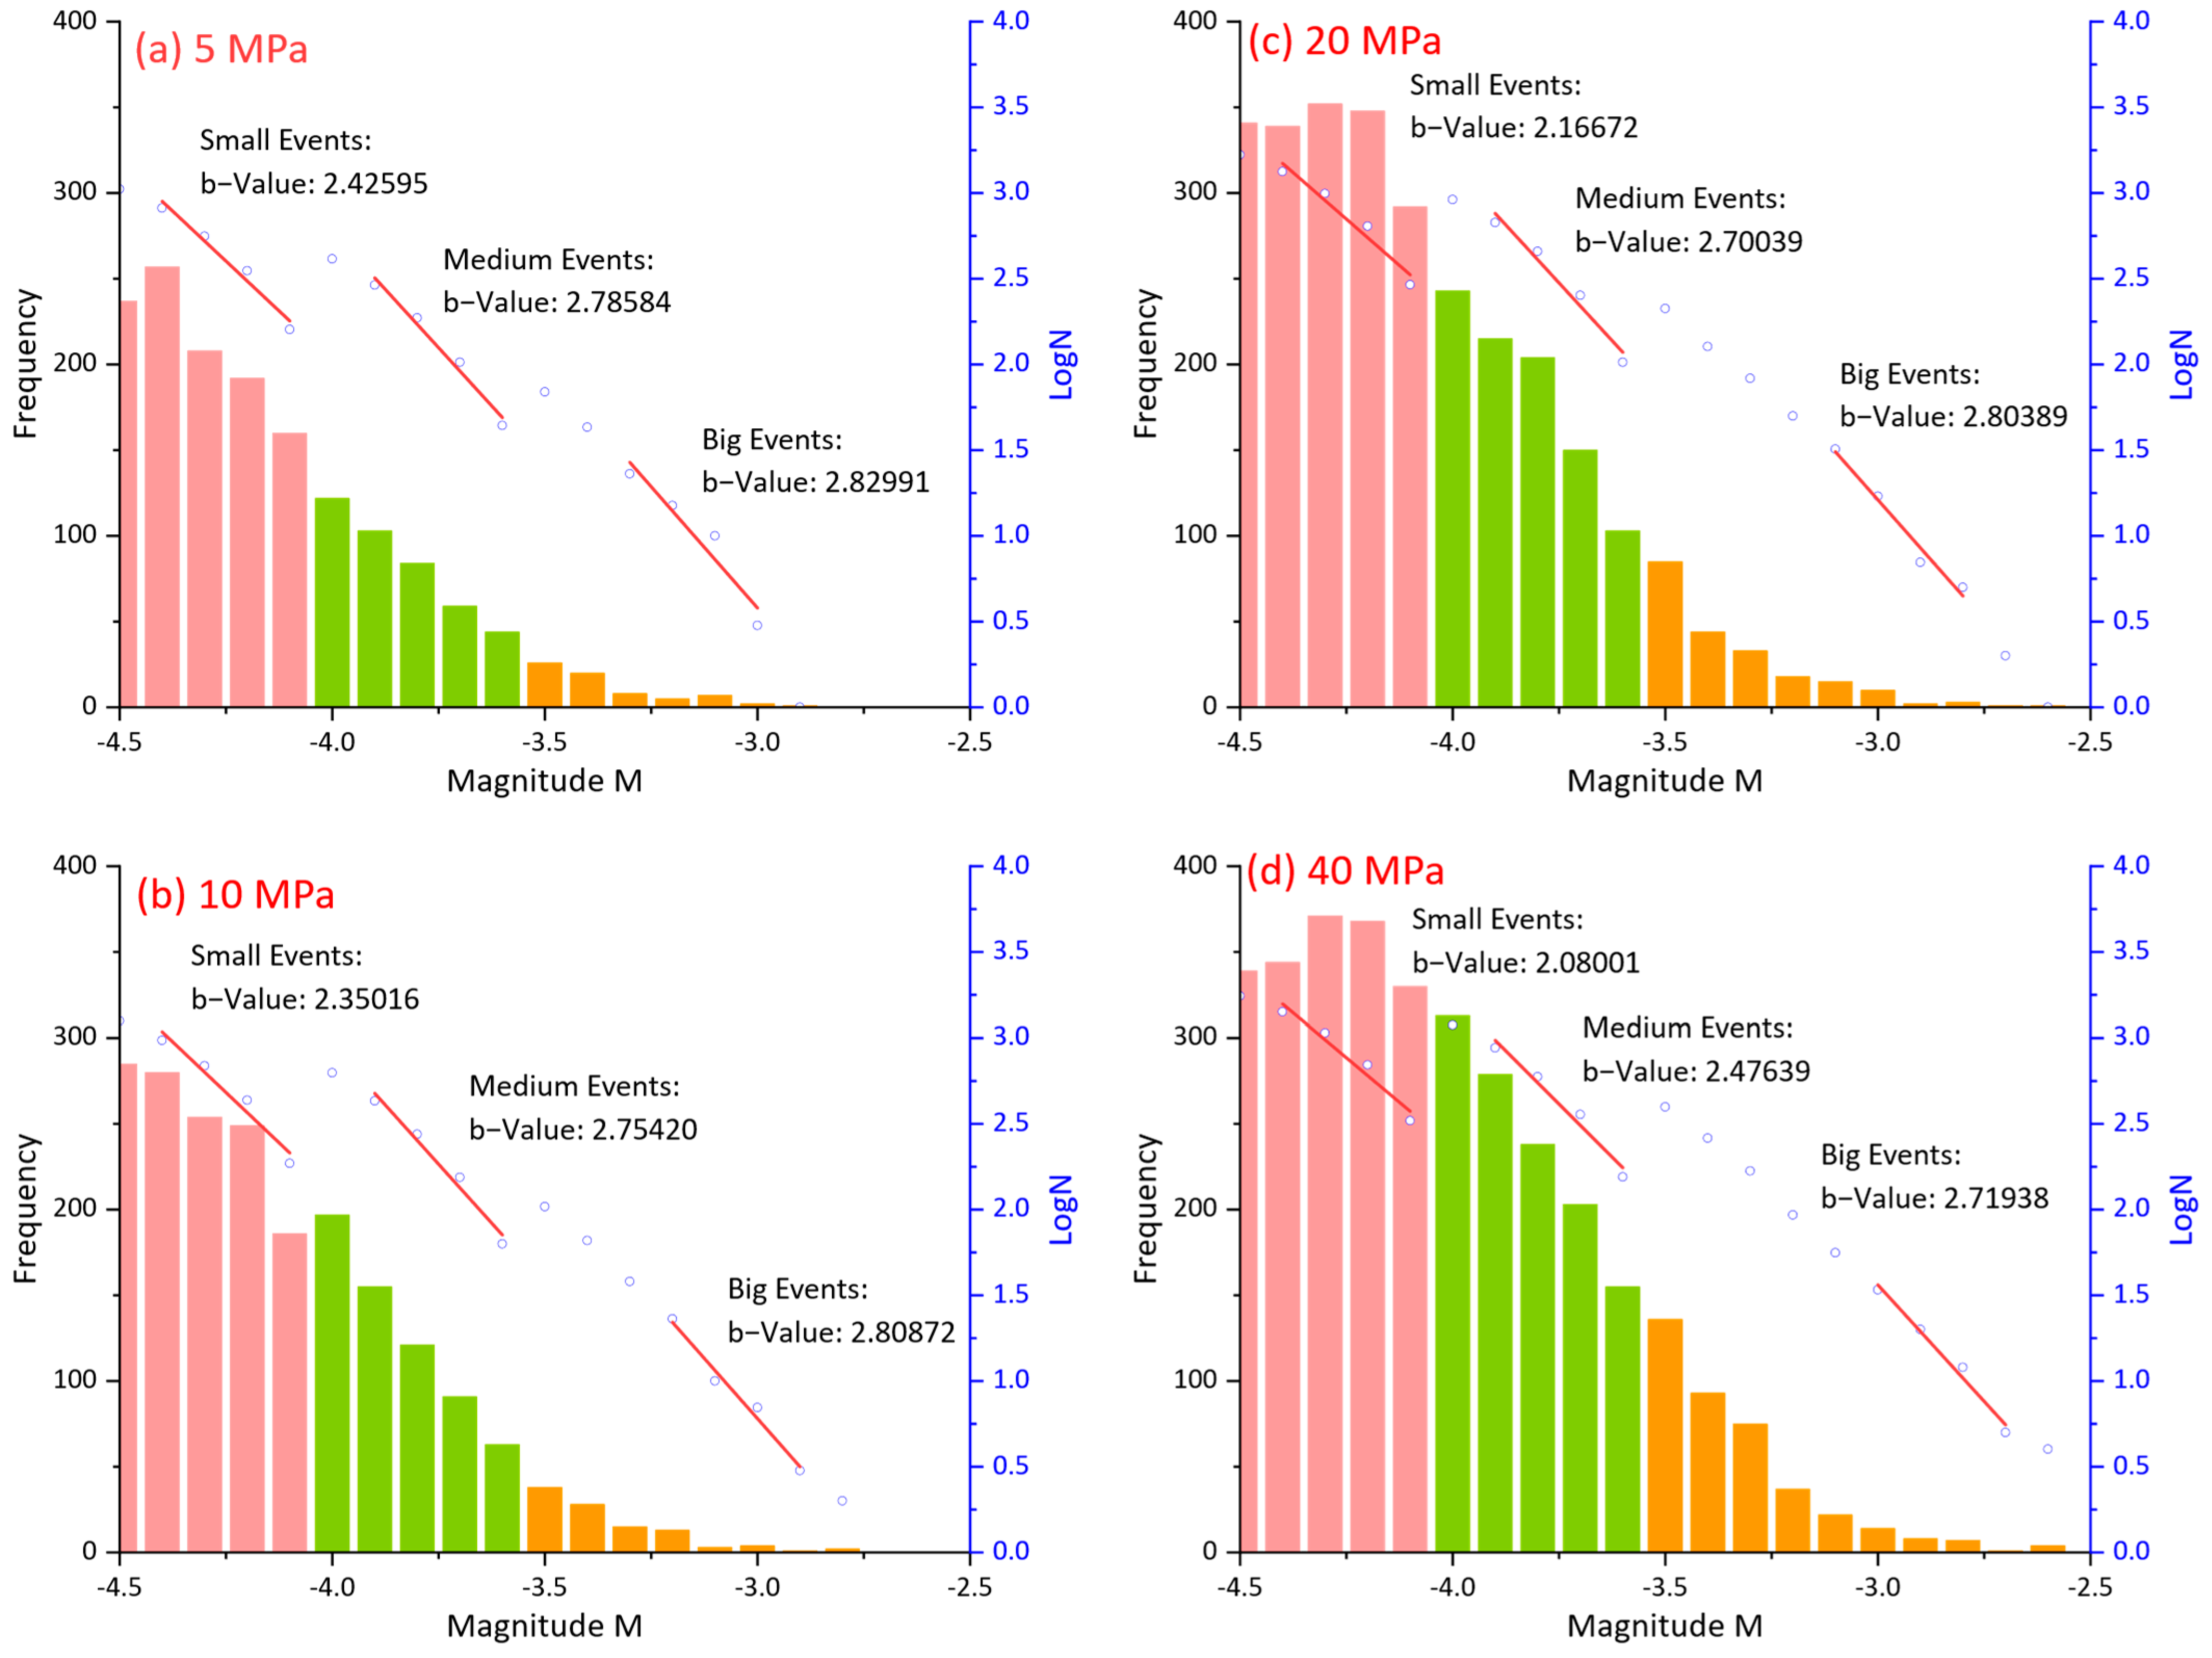
Leveraging M e of the acoustic emissions, we calculated the b-value via the relationship between the frequency of the acoustic emission and the magnitude occurrence under varying confining pressures. In the PFC simulations, the AE event monitoring and recognition methods generate events across a wide magnitude range, including very small events. However, AE events with M e < 4.5 generally involve single microcracks, and their released energy is extremely low. These ultra-small events have a negligible impact on the overall mechanical response of the model during loading and do not contribute meaningfully to fracturing mechanisms. To focus on physically significant AE activity and avoid negligible events, only events within the magnitude range 4.5 < M e < 2.5 were considered for the b-value calculation. The slope of the near-linear segment in the L o g N M e curve within this range was used to compute the b-value (as shown in Figure 12), reflecting the evolution of microcracking activity in a manner consistent with laboratory observations.
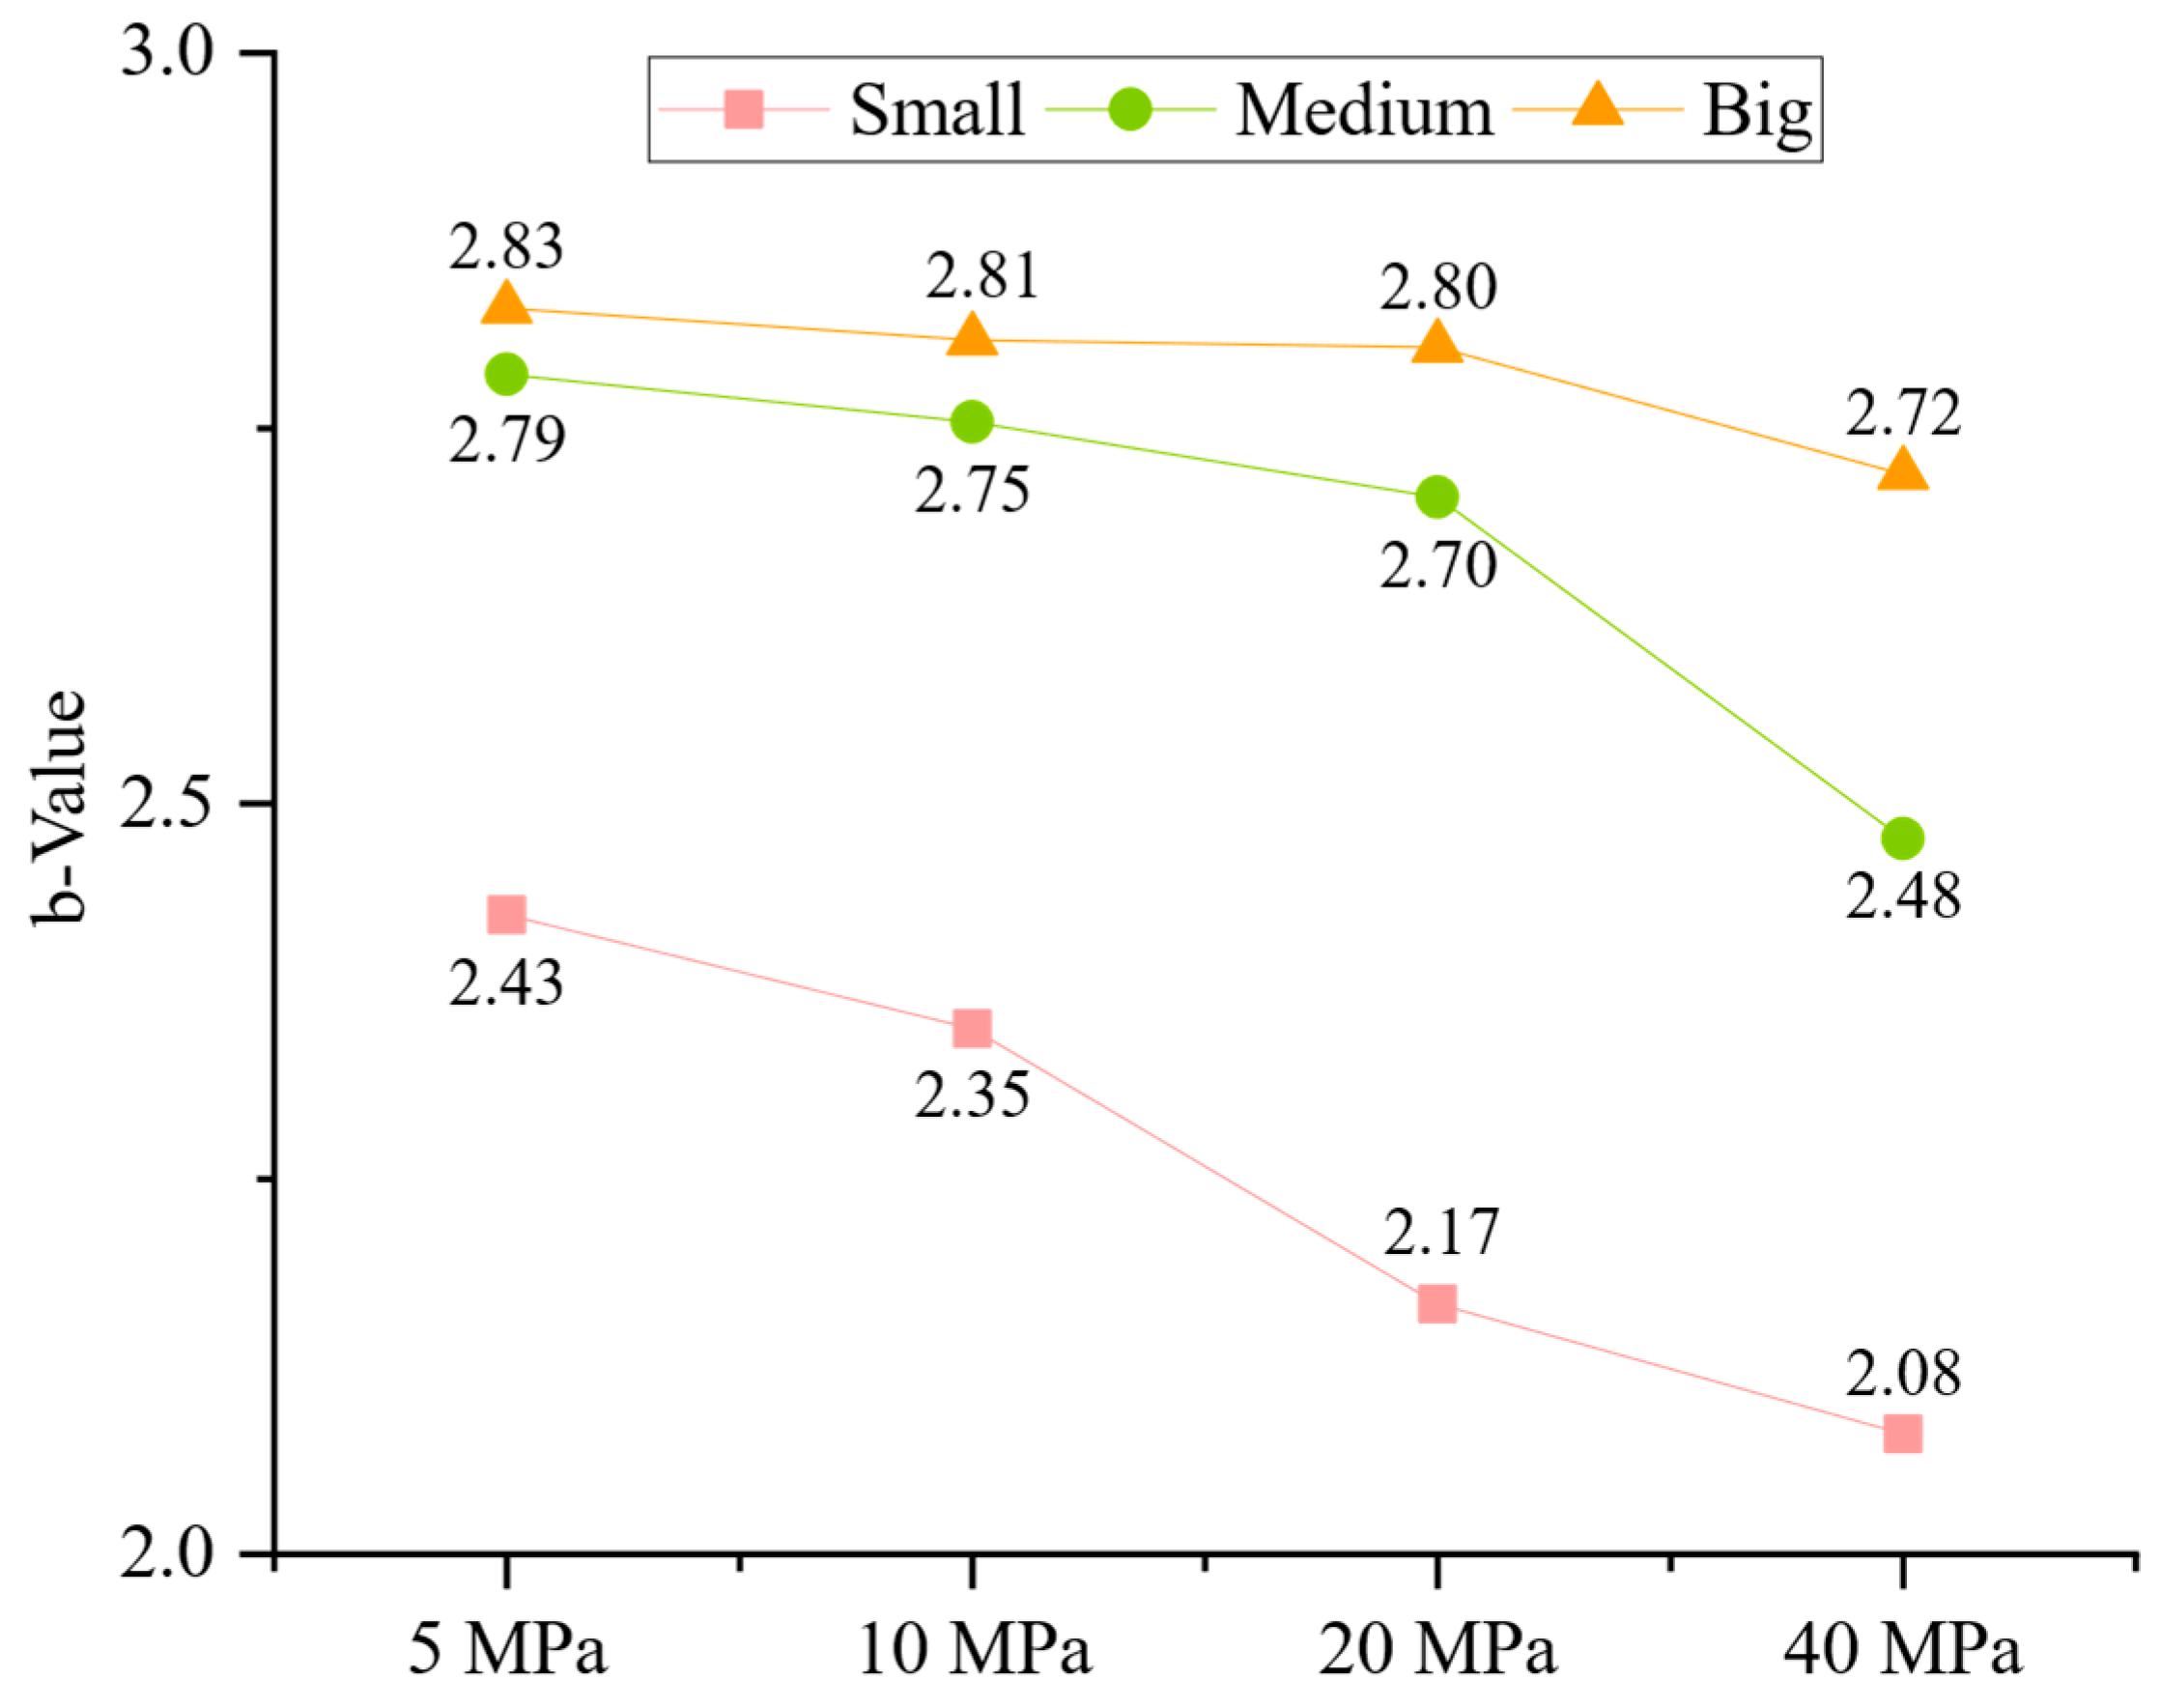
As shown in Figure 12, we calculated the b-values for three different size ranges of AE events and with respect to the increasing confining pressure. In Figure 13, it can be observed that as the confining pressure increases, the occurrence of medium and big events during loading increases. Meanwhile, the b-values of medium and big events decrease with the increase in confining pressure. This correlation between confining pressure and the b-value suggests that elevated confining pressure induces significant structural damage within the sample, leading to an increase in internal crack damage. Van der Baan and Chorney [100] demonstrated that large b-values are indicative of tensile-dominant failure; therefore, the decrease in the b-value with increasing confining pressure may be related to a reduction in the proportion of tensile events within the sample, as we investigate in the next section (Figure 14).
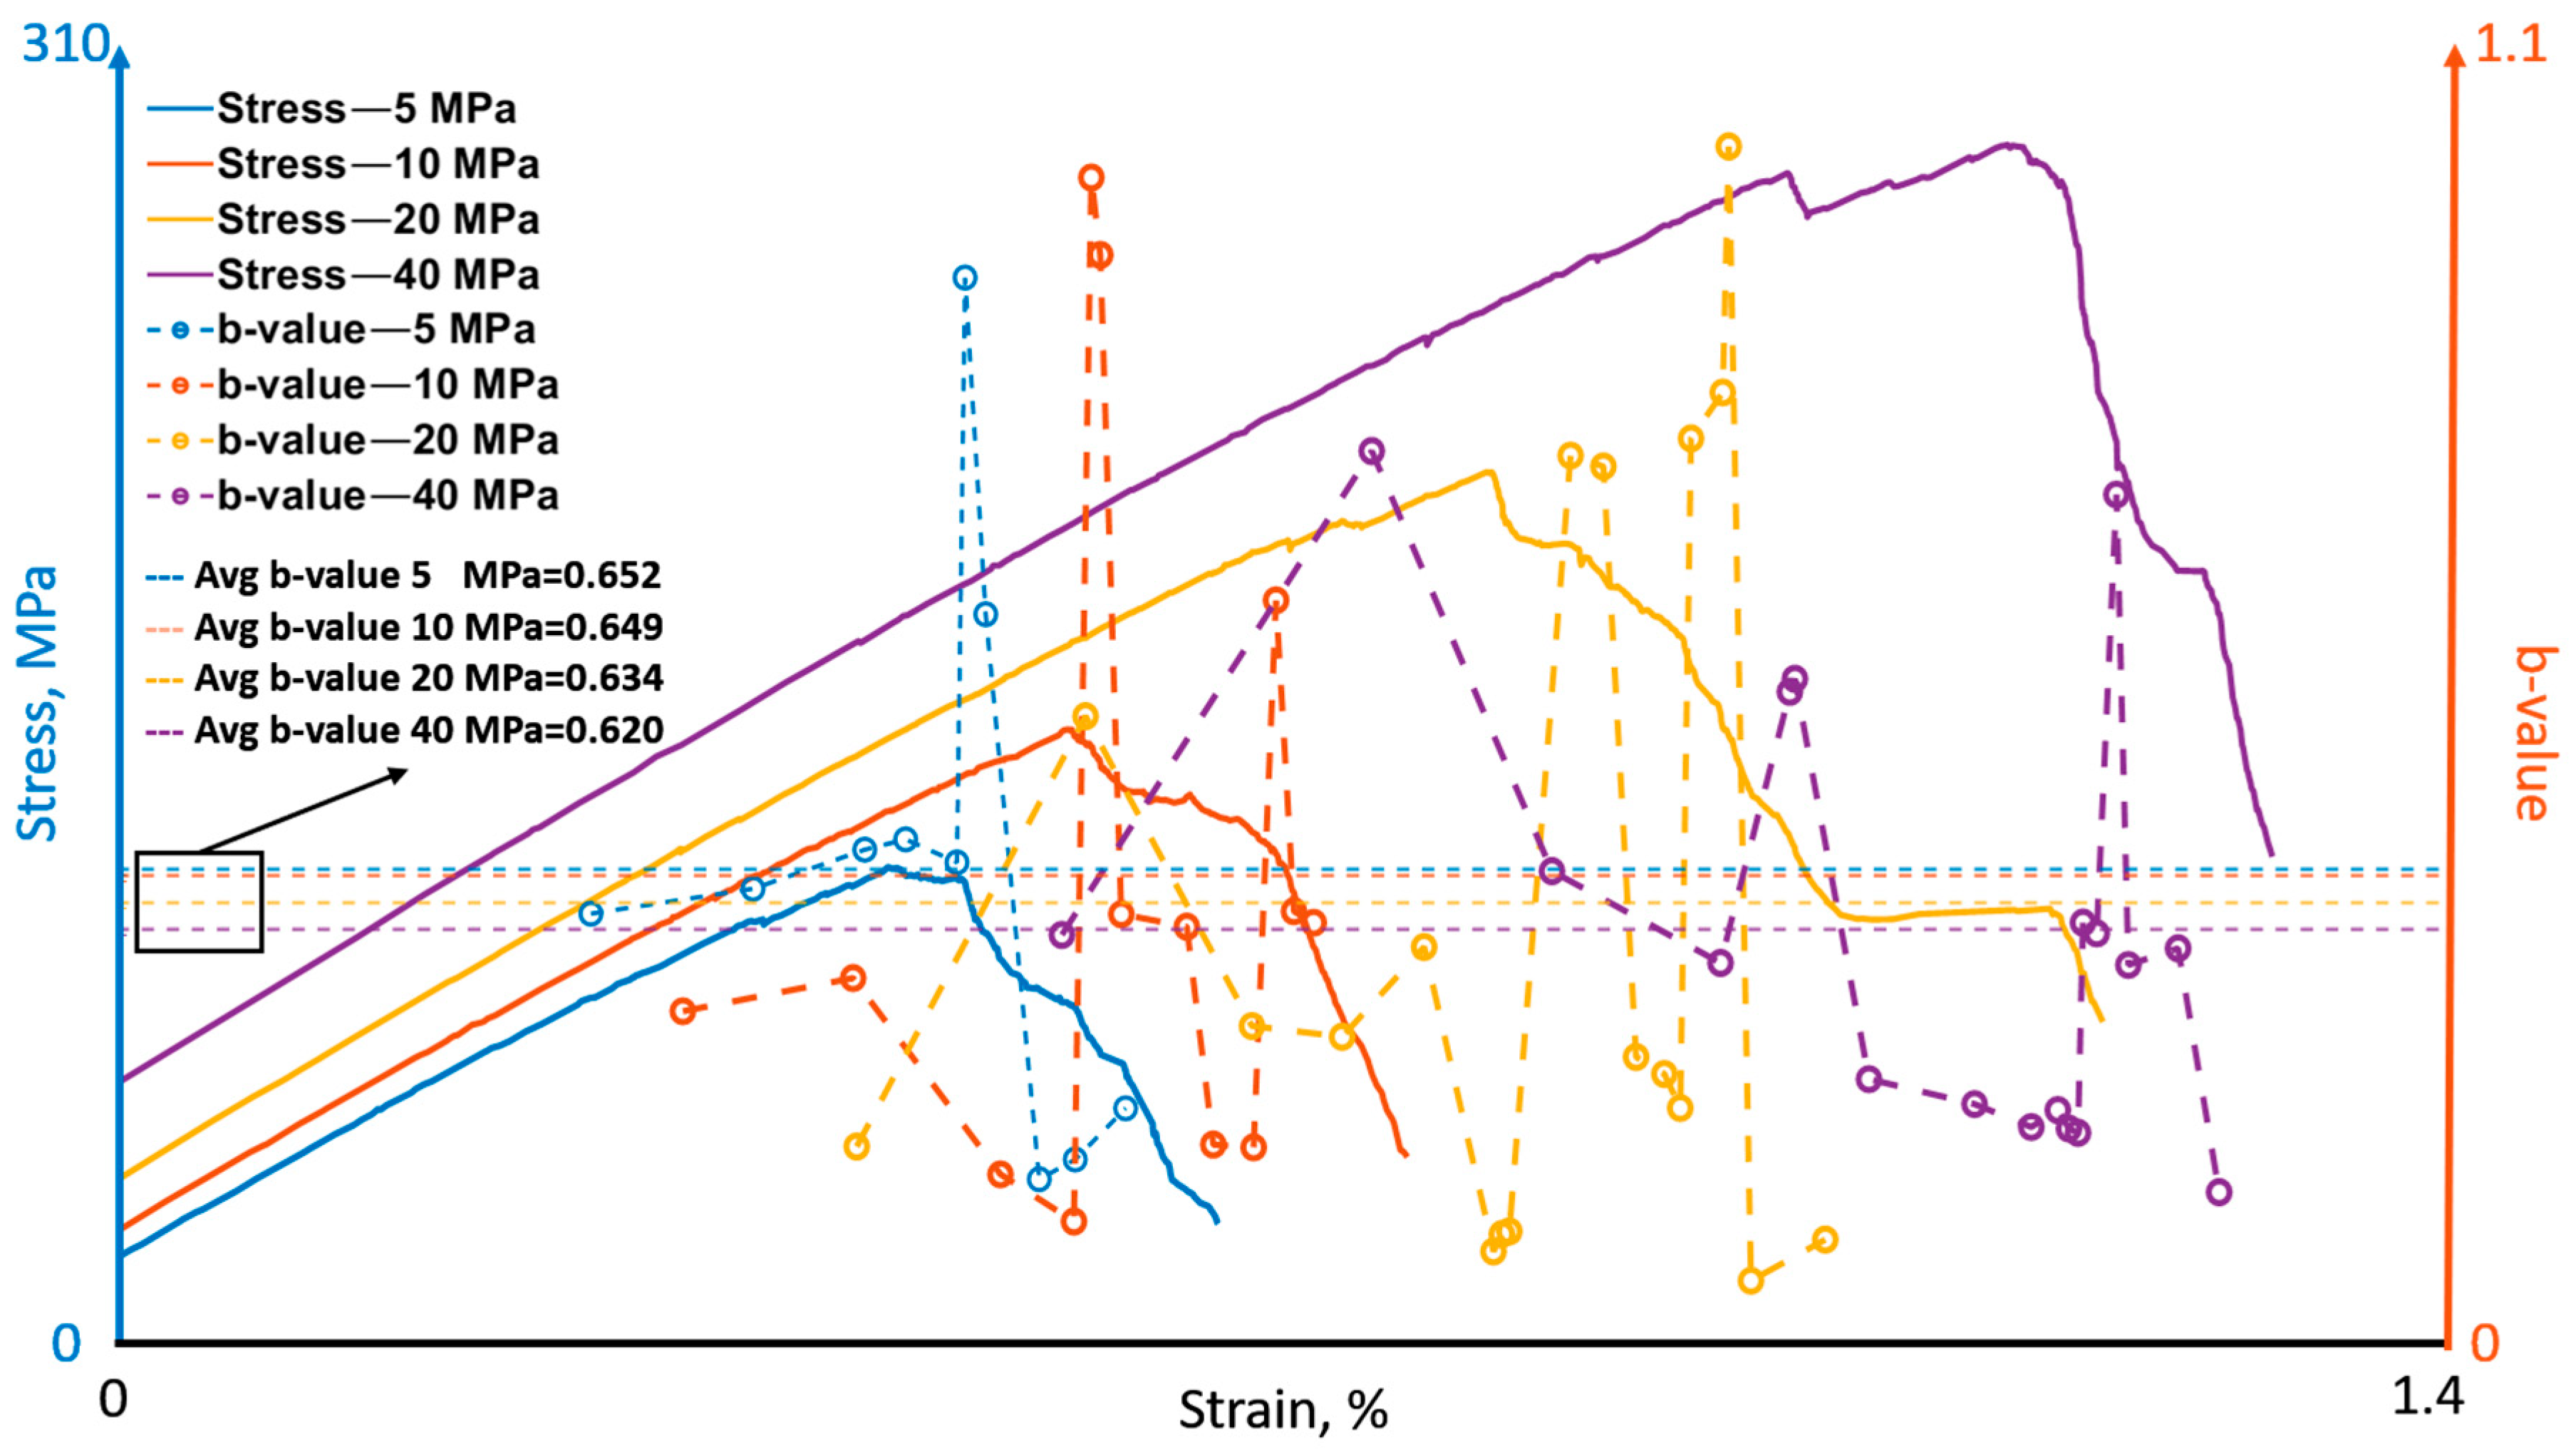
Subsequently, a sliding-window approach was employed to characterize the evolution of acoustic emission (AE) b-values during triaxial loading under different confining pressures, as shown in Figure 14. Under all confining pressure conditions, the b-value exhibits relatively large fluctuations at the initial loading stage. This behavior is primarily associated with the closure of pre-existing microcracks and pores, as well as the sporadic activation of isolated microdamage events, leading to an unstable distribution of AE magnitudes. With continued loading, the b-value gradually stabilizes and fluctuates within a relatively narrow range during the intermediate stage, indicating that microcrack initiation and stable propagation dominate the damage process. At this stage, internal damage evolves in a quasi-steady manner without pronounced localization. As the applied stress approaches the peak value, a sustained and pronounced decrease in the b-value is observed. This reduction reflects a rapid increase in the proportion of high-magnitude AE events, corresponding to the accelerated coalescence and interaction of microcracks. Notably, the minimum b-value generally occurs immediately before or around the peak stress, which is closely associated with the formation and penetration of through-going fractures and marks the transition from distributed microdamage to localized macroscopic failure. During the subsequent post-peak unstable failure stage, the b-value remains at a low level, indicating the dominance of large-scale internal damage.
A comparison of the average b-values under different confining pressures further reveals a systematic trend. For confining pressures of 5 MPa, 10 MPa, 20 MPa, and 40 MPa, the corresponding average b-values are 0.652, 0.649, 0.634, and 0.620, respectively. These results demonstrate that the average b-value decreases monotonically with increasing confining pressure, suggesting that higher confining pressures promote the development of larger-scale fracture events and enhance damage localization within the specimen. This observation is consistent with the mechanical responses discussed in previous sections. Importantly, the continuous decline and pronounced fluctuations of the b-value prior to the onset of post-peak unstable failure can be identified as a reliable precursor signal of impending instability. Therefore, the b-value provides an effective quantitative indicator for characterizing damage evolution and predicting failure precursors in rock materials, in agreement with previous studies [98,99].

4.5. AE Source Mechanism Distribution

Based on the calculation of Equations (9) and (10), we quantified the failure mechanism of AE events by analyzing the ratio R of isotropic to deviatoric components of the moment tensor.
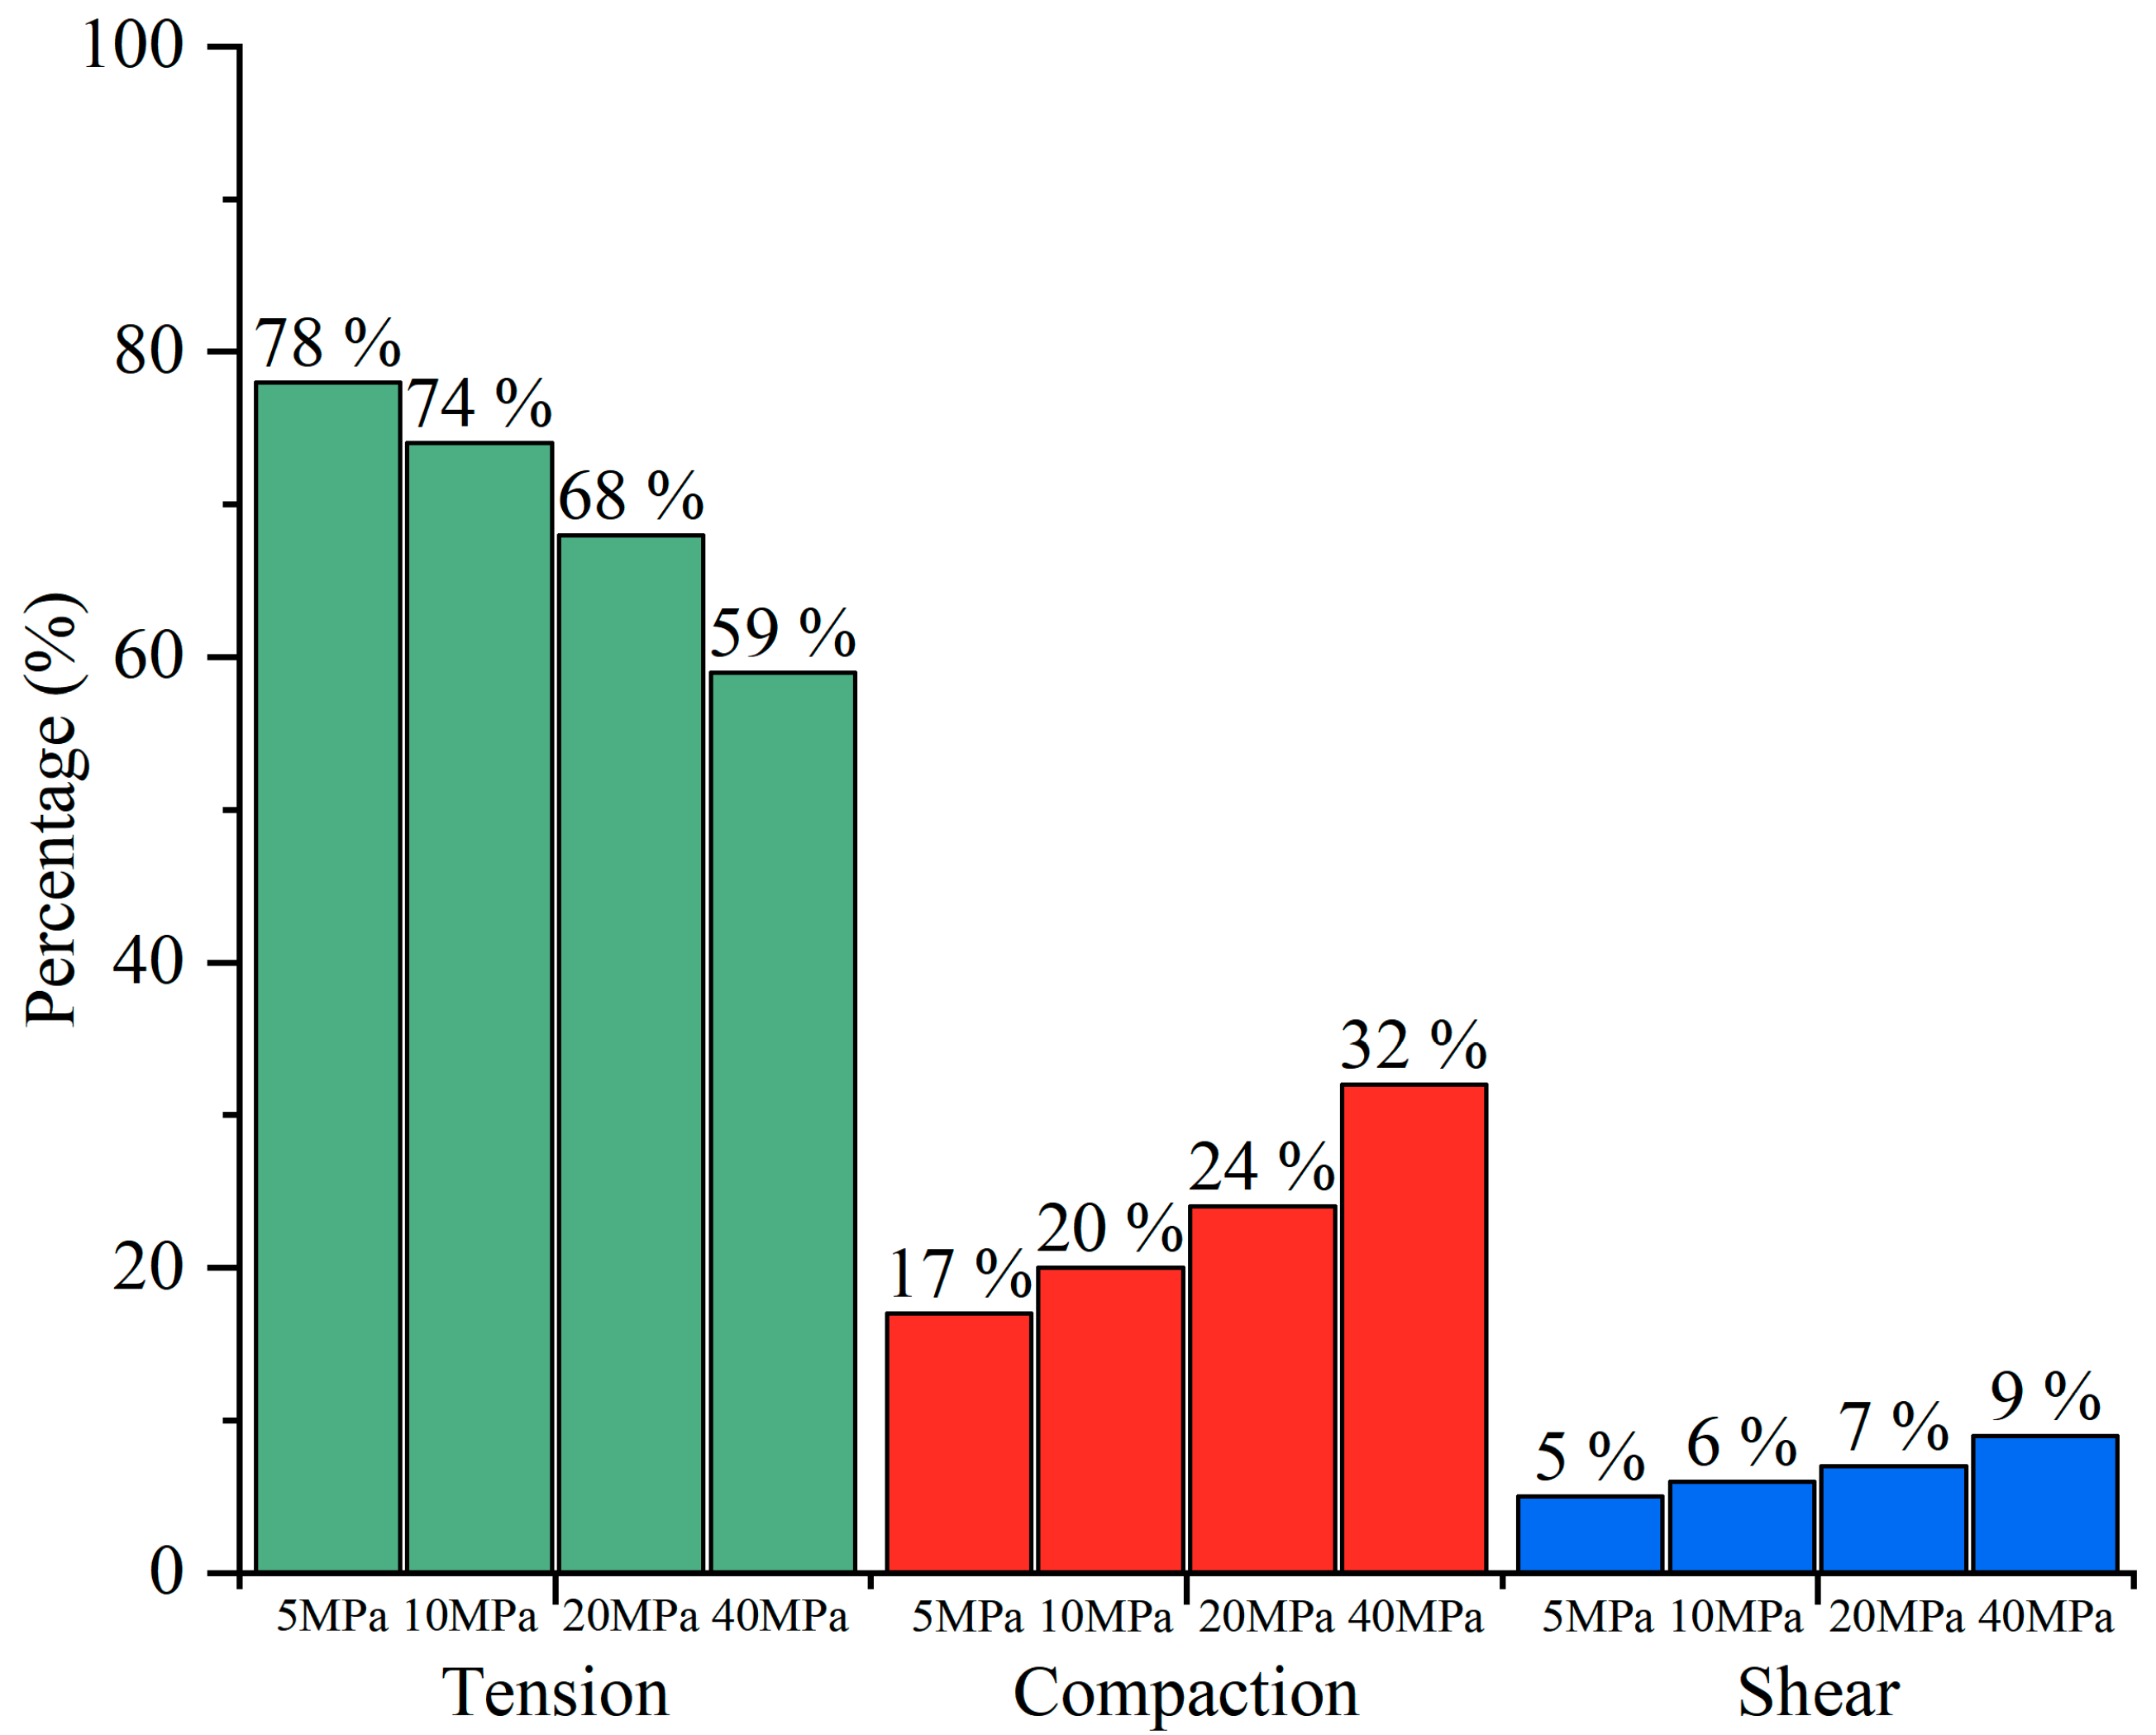
As illustrated in Figure 15, the distribution of three distinct failure modes within the sample becomes evident. Among these, the tensile T-Type is the most prevalent mode. During post-peak unstable failure, shear fault zones develop, characterized by microcracks that predominantly exhibit tensile fractures between particles. Consequently, the formation of shear fault zones is significantly influenced by the T-Type tensile damage mode and the associated tensile microcracks. Additionally, the frequency of S-Type failure modes increases within the samples, especially with higher confining pressures. C-Type failure modes initially appear in considerable numbers before unstable crack propagation occurs and their frequency increases around the shear fracture zone as the sample reaches its peak stress. These C-Type failures are distributed internally within the sample, with their prevalence rising with increasing confining pressure. Despite the increased occurrence of C-Type failures with higher confining pressures, the primary failure mode remains T-Type. This observation aligns with the previous findings from the experimental datasets [41], where tensile failures were also predominant and related to dilatant patches driving the fracture formation and propagation with competing mechanisms driven by C-Type events, although their percentage remains lower compared to tensile failures.
The distribution of the AE source mechanism among big, medium, and small AE events is shown in Figure 15. During the formation of macroscopic fractures, the predominant AE source mechanism within big AE events appears to be C-Type. Additionally, the number of C-Type events tends to increase with higher confining pressure. Moreover, there are small numbers of S-Type and T-Type events, with T-Type events still being noticeably present at higher confining pressures. Within the medium AE events category, a notable presence of T-Type fractures is observed, with relatively larger T-Type fractures being concentrated around macroscopic fractures, while smaller T-Type fractures are more randomly distributed throughout the model. In the small AE events category (Figure 16), numerous T-Type events are observed to be randomly distributed throughout the sample. However, due to their classification as very small AE events, their influence on the macroscopic failure of the sample appears to be minimal.
Overall, as confining pressure increases, the proportion of T-Type fractures decreases; however, they remain present throughout the loading process. At the same time, the frequency and number of C-Type fractures tend to increase, indicating the increased contribution of compacting mechanisms driven by higher confining pressure on the growing fault patches [41]. Specifically, C-Type failure modes tend to emerge before post-peak unstable failure, often occurring before the maximum stress. This observation is also in good agreement with King et al. [41], suggesting that C-Type failures represent a precursory phase related to the building of a critical damage threshold.
Regarding the small AE events, we observed that they tend to be randomly distributed, Consequently, small AE events are not involved with the formation of macroscopic fracture. We found that under lower confining pressure, T-Type events are predominant among the small AE events. As confining pressure increase, the proportion of small events decreases, as does the occurrence of T-Type events. This suggests that under lower confining pressure, microdamage within the sample predominantly occurs in the form of T-Type, and decreases as confining pressure increase. This may be due to the relatively smaller stress concentrations at lower confining pressure, making microdamage more likely to occur in tension. Although small AE events are limited in their occurrence and have no impact on the formation of macroscopic fracture, they still reflect ongoing microstructural changes within the sample.

5. Discussion

This study employs the PFC numerical simulation method alongside the grain-based model (GBM) to model Westerly granite rock deformation laboratory experiments with AE [41], simulating triaxial stress tests to examine crack nucleation, growth, and propagation mechanisms under varying confining pressures, as well as the mechanical behavior of the model during loading. The AE event monitoring and identification method, implemented using Fish scripting, accurately captured and located AE events generated throughout the loading process. AE events were classified into tensile, compressive, and shear failure modes based on the ratio R of the isotropic and deviatoric components of the moment tensor. This method effectively quantifies AE source failure modes, facilitating a more efficient quantitative analysis of the failure mechanism. Compared to prior studies [101,102,103,104,105,106,107] that investigated the micro and macromechanical responses of rock using the DEM method, which had certain limitations such as low model accuracy [108] and partial loss of effective AE event data [109], this research provides a more comprehensive approach to the high-precision numerical modeling of granite, along with improved AE event simulation, capture, and localization. In the simulation experiments, the PFC code directly identified tensile or compaction events, classifying them as T-type or C-type, The numerical simulation captures and determines the magnitude of AE events based on the energy released during particle bond breakage, providing a robust theoretical foundation for the temporal, spatial, and source mechanism evolutions of AE events.
In the later stages of loading, microcrack initiation and propagation tend to concentrate around the macroscopic fracture shear zone. Concurrently, as the confining pressure increases, the peak stress of the sample rises, along with an increase in the number of microcracks around the macroscopic fracture zone. This finding suggests that increased external stress affects the internal microstructure of the sample, promoting the formation and propagation of microcracks, and thus concentrating them around the macroscopic fracture zone. Segmenting the loading process allows for a clearer observation of microcrack distribution before and after reaching the peak stress.
For the distribution of sample damage at three distinct stages of the loading process, we observed that as confining pressure increases, the failure mode transitions gradually from axial splitting to shear localization [91]. The intermediate transition to localization occurs only when a critical threshold is reached, at confining pressures between 10 and 20 MPa. This behavior can be explained by the confinement-dependent strengthening of interparticle contacts in the model: under low confinement, tensile bond breakages dominate, producing distributed axial splitting, whereas higher confinement increases normal forces at contacts, enhancing shear resistance and promoting the coalescence of microcracks into localized shear bands. In other words, strain localization requires sufficient confining pressure to activate shear-dominated failure, a result consistent with previous studies [41].
The energy dissipation method was used to determine the size of AE events, revealing that medium-sized events generally prevail during diffuse fracturing. Most of these medium-sized events are concentrated around the macroscopic fracture shear zone, while some are scattered across other regions of the sample. In contrast, big events, characterized by higher energy release, are predominantly located along the macroscopic fracture shear zone. This suggests that big events are primarily driven by post-peak unstable failure, likely indicating crack propagation and fault slip, which contributes to the formation and expansion of macroscopic fracture.
The b-value of acoustic emission events of different sizes under various confining pressures was computed by following the Gutenberg–Richter law. We observed a gradual decrease in the b-value with increasing confining pressure, which suggests a higher frequency of larger-size crack events under elevated pressure. This trend indicates that higher confining pressures may lead to diffused crack damage because of an enhanced diffuse crack regime, increasing both the frequency and size of AE events. By analyzing the variation in b-values, we can gain deeper insight into the crack damage evolution of the sample under different confining pressures.
Figure 15 shows the classification of AE events based on moment tensor analysis. The results indicate that tension (T-Type) fractures are prevalent throughout the loading process, though their occurrence diminishes as confining pressure increases. Meanwhile, C-Type fractures dominate along the macroscopic fracture surface and become more frequent and larger as confining pressure rises, suggesting that elevated confining pressure results in more internal crack damage.
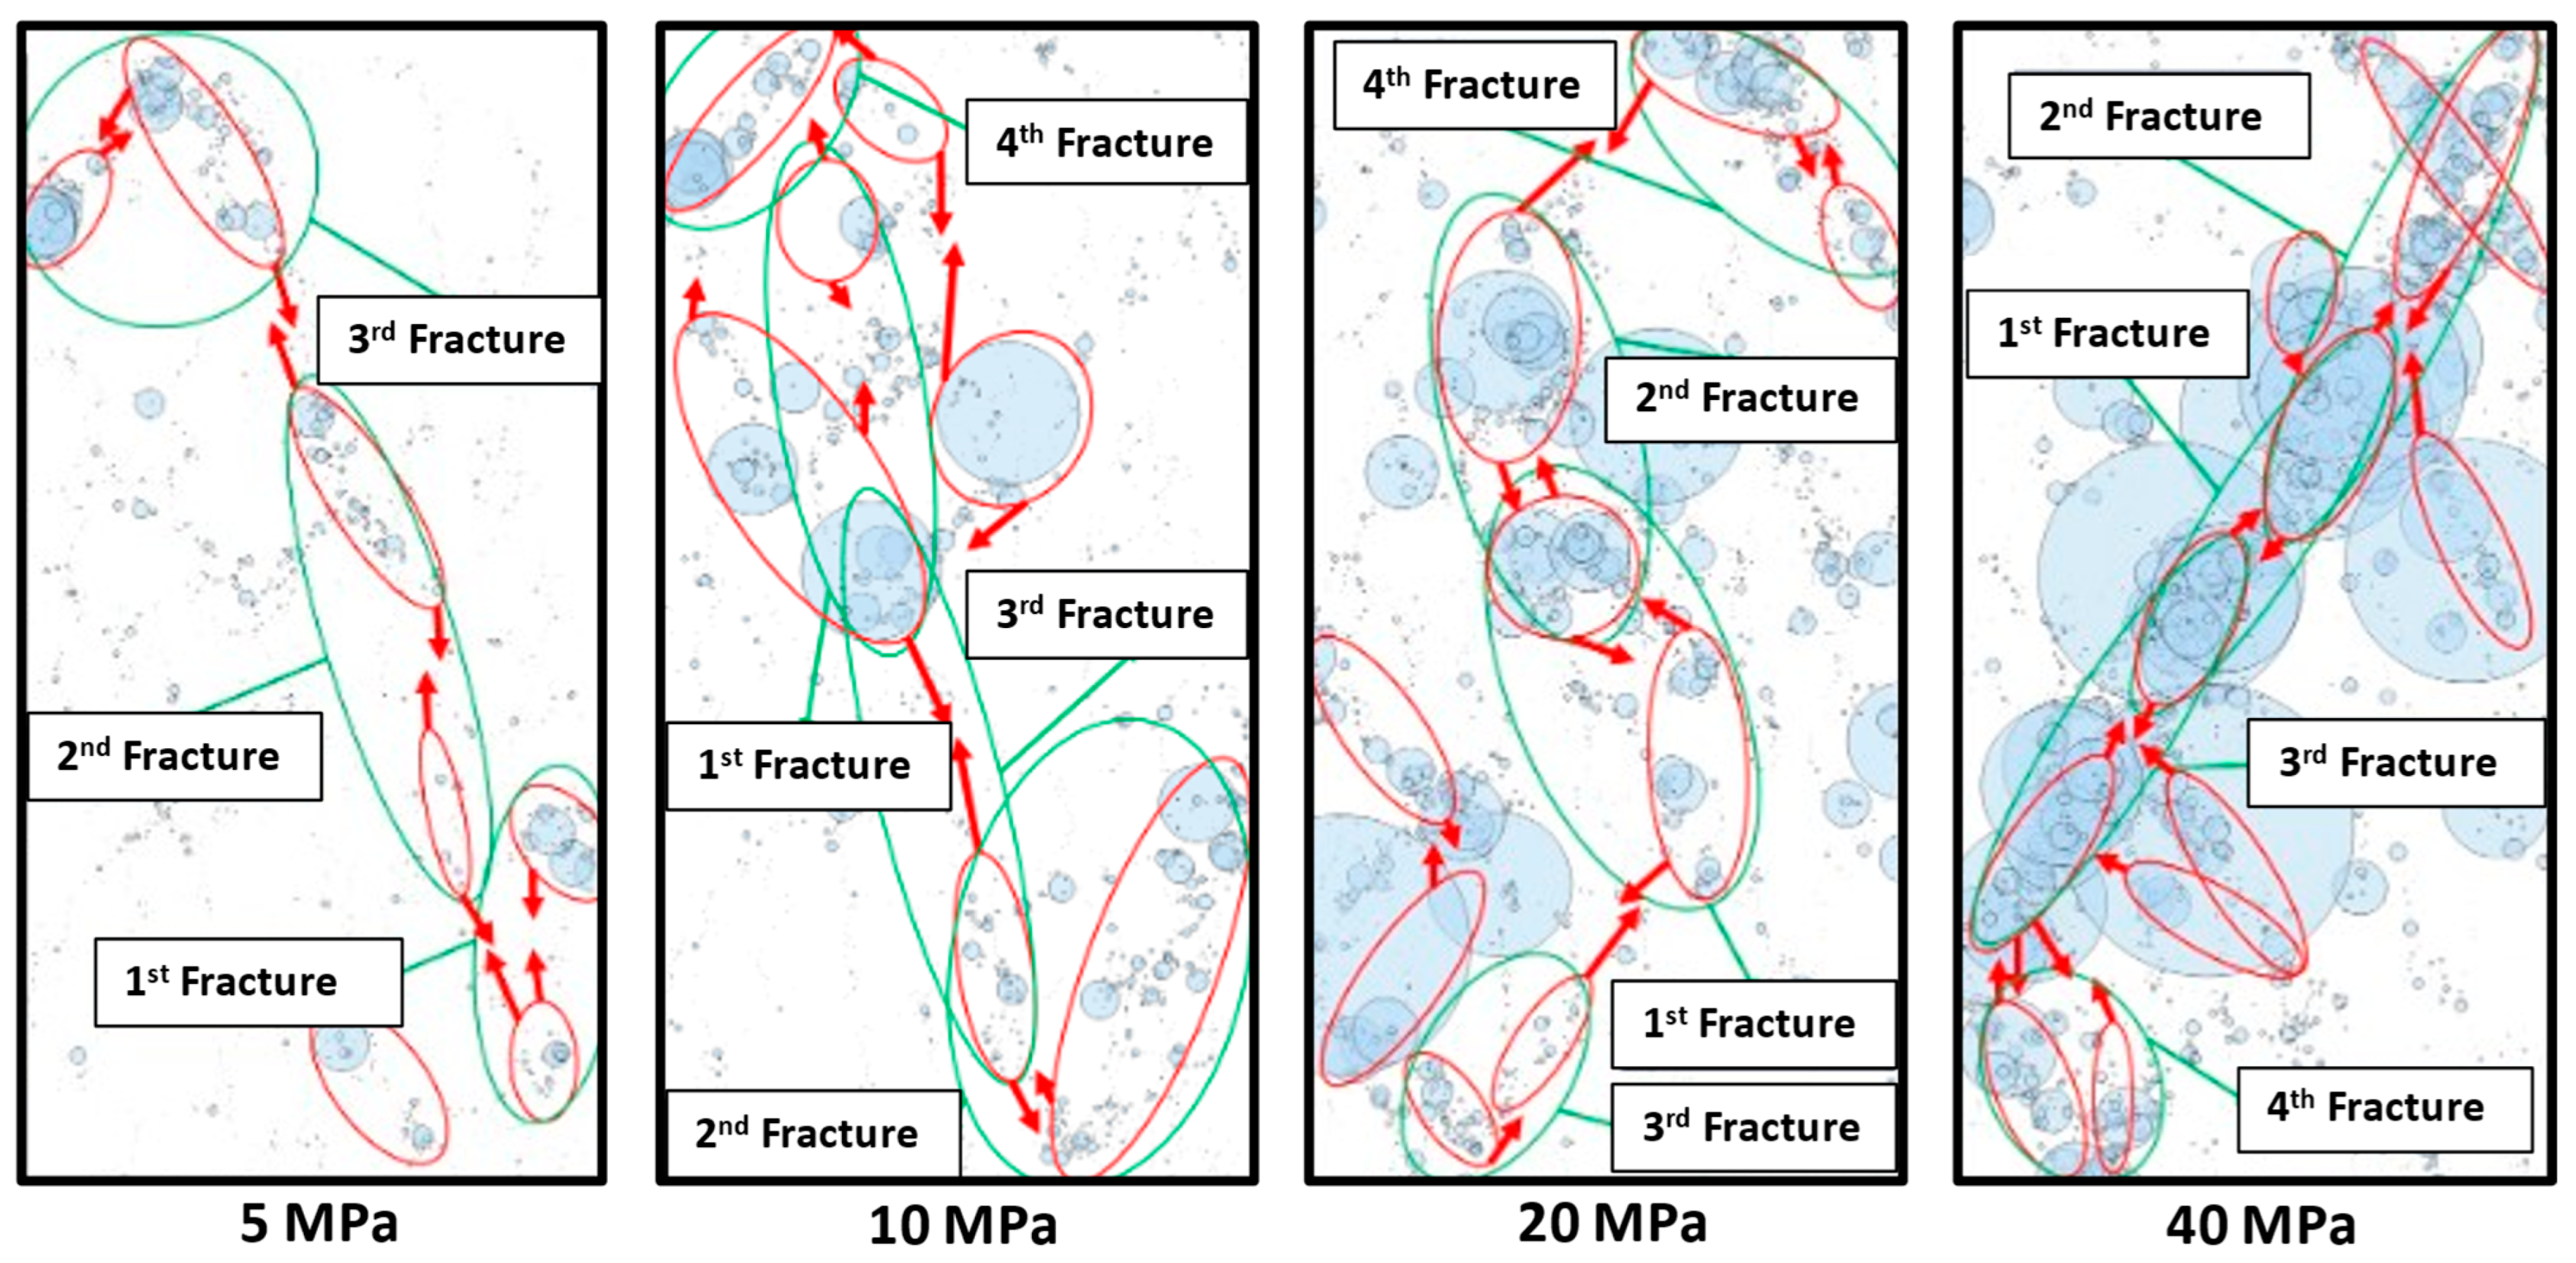
In Section 3.4, we employed the energy dissipation mechanism during bond breakage to detect and quantify AE events. Fracture formation results from the accumulation of numerous microcracks, releasing significant energy during this process. By analyzing the timing, magnitude, and spatial distribution of AE events, the origin, propagation direction, and occurrence timing of fractures can be inferred. Figure 17 illustrates fracture sources and crack propagation paths under different confining pressures. At 5 MPa, the first fracture occurs near the lower right corner of the model; at 10 MPa, it occurs slightly lower in the middle; at 20 MPa, it occurs in the center; and at 40 MPa, it occurs near the upper center. This trend indicates that increasing confining pressure shifts the initial fracture location upward. At low confining pressures, fractures typically initiate at the model base and propagate upward in shear mode until complete failure occurs. With higher confining pressures, the initial fractures form closer to the model center, developing into cracks that expand bidirectionally towards both ends. Subsequent fractures nucleate near these initial cracks and progressively link, leading to total model failure. This upward shift in initial fracture location is attributed to stress redistribution and the influence of mineral-scale heterogeneity. Low confining pressures induce tensile stress concentrations near sample boundaries, promoting early crack initiation at the lower edges. As confining pressure increases, lateral confinement suppresses boundary-induced tensile cracking and enhances central shear stress concentration, favoring fracture nucleation near the sample center. Furthermore, mineral heterogeneity introduced in the GBM, such as weaker biotite grains, induces local stress perturbations that contribute to the observed variation in initial crack positions.
Validating the R-value-based fracture classification with independent micro-mechanical evidence is crucial for ensuring the reliability of source-type identification. In this study, AE events were categorized into tensile (T-type), shear (S-type), and compaction (C-type) failures, where the R-value quantitatively represents the ratio between the isotropic and deviatoric components of the moment tensor. To assess the robustness of this classification, four comparative datasets were examined (Figure 18): (a) post-failure fracture traces observed in triaxial tests on Westerly granite [82]; (b) divergence maps of mechanism slip vectors representing experimentally derived fracture mechanisms in granite [41]; (c) divergence maps of mechanism slip vectors obtained from numerical simulations; and (d) the spatial distribution of the three AE source types under triaxial loading conditions. These datasets collectively reveal a nearly coincident fracture band, indicating a strong correspondence between the moment tensor-derived source types and the actual crack geometries and stress-induced fracture evolution. Specifically, T-type events are concentrated around the tensile wing cracks during the early initiation stage, while C-type events occur predominantly within zones of intense grain crushing and pore collapse at the terminal compaction stage. The simulated divergence field of slip vectors exhibits a clear transition from extensional (red/yellow regions) to compressional (blue regions) domains, consistent with the experimentally observed deformation patterns. The spatial and temporal consistency between the simulated AE mechanisms and the experimentally observed fracture structures confirms that the R-value classification effectively captures the progressive transition from tension-dominated to shear- and compaction-dominated failure regimes. A similar correspondence between moment tensor solutions and physical fracture orientations was also reported by King et al. [41] in their study of source mechanisms during fault nucleation and formation, further validating the methodology adopted in this work. Therefore, the integration of moment tensor analysis with direct micro-mechanical observations provides a robust framework for deciphering the evolution of mixed-mode fracture processes in brittle rocks.
While this study focuses on laboratory-scale simulations of Westerly granite using the GBM–DEM framework, several key findings carry broader implications for field-scale rock engineering applications. First, the observed decrease in AE b-values with increasing confining pressure reveals that high-pressure environments promote more frequent and larger crack events, indicating intensified cataclastic damage. Second, the transition of the AE source mechanism from tension-dominated to compaction-dominated patterns demonstrates how confining pressure controls the failure mechanism. Third, the identified relationship between AE energy, event magnitude, and fracture localization provides a reliable indicator of the onset and progression of post-peak unstable failure. In addition, the upward migration of initial fracture initiation zones with higher confining pressures reflects the shift of stress concentration regions, offering valuable clues for understanding fracture nucleation in deep rock masses. These findings not only deepen our understanding of microcrack damage evolution under stress confinement but also provide a theoretical foundation for AE-based monitoring and early-warning systems in deep mining and tunneling projects. Despite these insights, several limitations of this current study should be noted. The use of a 2D model inherently simplifies 3D stress distribution and fracture interactions. In particular, stress redistribution in the simulations is confined to the model plane, whereas in real rock specimens, stress released by local bond breakage can dissipate volumetrically. The restricted redistribution pathways in the 2D framework may lead to more localized stress concentrations and, consequently, a higher apparent density of microcrack activation compared with fully 3D conditions. Therefore, while the model captures the essential processes of stress concentration, crack initiation, interaction, and strain localization, the absolute number and spatial density of simulated AE events should be interpreted with caution when compared directly with laboratory observations. In addition, the AE monitoring approach is source-based and does not include wave propagation effects such as attenuation, reflection, or background noise, limiting direct comparison with laboratory AE waveforms.
Future work should address these limitations by integrating high-fidelity 3D numerical simulations with field AE data, performing mode-specific energy quantification, and adopting systematic parameter optimization and sensitivity analyses, advancing predictive frameworks that link laboratory-scale acoustic emissions to large-scale rock failure processes in complex geological environments.

6. Conclusions

This study utilizes numerical simulation methods to explore the fracture mechanisms of Westerly granite under various confining pressures. The results show that increasing confining pressure affects peak stress and deformation patterns. Most of the AE events occurred before the peak stress, with a smaller percentage occurring post-peak. Higher confining pressures lead to more pronounced clustering around developing macroscopic fractures. This study identified three distinct deformation steps, each one characterized by specific AE event features. with medium-sized events dominating diffuse fracturing and large, high-energy events becoming more frequent under elevated confinement. The b-value decreases with increasing confining pressure, reflecting a higher proportion of large events and more widespread microcrack damage. Moment tensor analysis reveals a transition in AE source mechanisms: tensile (T-Type) fractures prevail at low confinement, whereas compaction (C-Type) fractures increase along macroscopic fracture surfaces under higher pressures, and large AE events are primarily associated with these C-Type fractures. The initial fracture typically originated from the central section of the model and propagated towards both ends. Subsequent fractures appeared at the sample ends and progressively linked with the initial fracture until complete failure.
These findings provide a robust understanding of fracture precursors in granite, highlighting how AE characteristics, energy release, and AE source mechanisms evolve under different confining conditions. The insights gained offer valuable guidance for the early-warning monitoring and predictive modeling of rock post-peak unstable failure in engineering and geotechnical applications.

Author Contributions

Y.Z.: Writing—original draft, Visualization, Methodology, Software, Validation, Formal analysis, Data curation. S.C.V.: Writing—review and editing, Supervision, Project administration, Investigation, Conceptualization. G.U.: Validation, Supervision, Software, Methodology, Investigation. A.M.F.: Supervision, Methodology, Investigation. All authors have read and agreed to the published version of the manuscript.

Funding

This research was funded by China Scholarship Council, grant n. 202208410062 and FERA_AUTOF_23_02 Ferrero Anna Maria-Ricerca Autofinanziata.

Data Availability Statement

Data will be made available on request.

Conflicts of Interest

The authors declare that they have no known competing financial interests or personal relationships that could have appeared to influence the work reported in this paper.

References

  1. Aziznejad, S.; Esmaieli, K.; Hadjigeorgiou, J.; Labrie, D. Responses of jointed rock masses subjected to impact loading. J. Rock Mech. Geotech. Eng. 2018, 10, 624–634. [Google Scholar] [CrossRef]
  2. Zhang, H.; Lu, C.P.; Liu, B.; Liu, Y.; Zhang, N.; Wang, H.Y. Numerical investigation on crack development and energy evolution of stressed coal-rock combination. Int. J. Rock Mech. Min. Sci. 2020, 133, 104417. [Google Scholar] [CrossRef]
  3. Bauer, S.J.; Song, B.; Sanborn, B. Dynamic compressive strength of rock salts. Int. J. Rock Mech. Min. Sci. 2019, 113, 112–120. [Google Scholar] [CrossRef]
  4. Kim, K.M.; Lee, S.; Cho, J.Y. Effect of maximum coarse aggregate size on dynamic compressive strength of high-strength concrete. Int. J. Impact Eng. 2019, 125, 107–116. [Google Scholar] [CrossRef]
  5. Mardoukhi, A.; Mardoukhi, Y.; Hokka, M.; Kuokkala, V.T. Effects of heat shock on the dynamic tensile behavior of granitic rocks. Rock Mech. Rock Eng. 2017, 50, 1171–1182. [Google Scholar] [CrossRef]
  6. Chen, Y.; Li, W.; Feng, G.; Gao, Z.; Liu, S.; Zhang, H.; Wang, T.; Hao, R. Failure characteristics and surrounding damage mechanisms of containing hole sandstone under DIC and AE monitoring: The influence of loading rate. Theor. Appl. Fract. Mech. 2025, 136, 104784. [Google Scholar] [CrossRef]
  7. Mourlas, C.; Pardoen, B.; Bésuelle, P. Large-scale failure prediction of clay rock from small-scale damage mechanisms of the rock medium using multiscale modelling. Int. J. Numer. Anal. Methods Geomech. 2023, 47, 1254–1288. [Google Scholar] [CrossRef]
  8. Basu, A.; Mishra, D.A.; Roychowdhury, K. Rock failure modes under uniaxial compression, brazilian, and point load tests. Bull. Eng. Geol. Environ. 2013, 72, 457–475. [Google Scholar] [CrossRef]
  9. Fan, C.; Liu, J.; Meng, F. Microcracking process characterization and failure time prediction of three typical rocks upon uniaxial compression based on acoustic emission activity. Rock Mech. Rock Eng. 2024, 57, 9145–9164. [Google Scholar] [CrossRef]
  10. Tan, T.; Zhang, C.; Li, W.; Zhao, E. Evolution of Freeze–Thaw Damage Characteristics and Corresponding Models of Intact and Fractured Rocks Under Uniaxial Compression. Rock Mech. Rock Eng. 2024, 57, 8013–8033. [Google Scholar] [CrossRef]
  11. Wang, S.; Zhao, Y.; Guo, J.; Liu, B. Investigation on prediction of sandstone failure under uniaxial compression based on supervised deep learning. Rock Mech. Rock Eng. 2023, 56, 8485–8501. [Google Scholar] [CrossRef]
  12. Yin, P.F.; Yang, S.Q. Experimental study on strength and failure behavior of transversely isotropic rock-like material under uniaxial compression. Geomech. Geophys. Geo-Energy Geo-Resour. 2020, 6, 44. [Google Scholar] [CrossRef]
  13. Zhang, G.K.; Li, H.B.; Wang, M.Y.; Li, X.F. Crack initiation of granite under uniaxial compression tests: A comparison study. J. Rock Mech. Geotech. Eng. 2020, 12, 656–666. [Google Scholar] [CrossRef]
  14. Hu, X.; Su, G.; Xu, C.; Mei, S. Influence of axial stress on borehole rockburst: Insights from true-triaxial tests using granite specimens. Rock Mech. Rock Eng. 2024, 57, 4953–4971. [Google Scholar] [CrossRef]
  15. Li, J.; Liu, D.; He, M.; Guo, Y. Experimental investigation on rockburst energy characteristics of true triaxial unloading in sandstone under high stress. Rock Mech. Rock Eng. 2024, 57, 6031–6046. [Google Scholar] [CrossRef]
  16. Liu, K.; Zhang, Q.B.; Wu, G.; Li, J.C.; Zhao, J. Dynamic mechanical and fracture behaviour of sandstone under multiaxial loads using a triaxial hopkinson bar. Rock Mech. Rock Eng. 2019, 52, 2175–2195. [Google Scholar] [CrossRef]
  17. Yin, Z.Q.; Li, X.B.; Jin, J.F.; He, X.Q.; Du, K. Failure characteristics of high stress rock induced by impact disturbance under confining pressure unloading. Trans. Nonferrous Met. Soc. China Engl. Ed. 2012, 22, 175–184. [Google Scholar] [CrossRef]
  18. Youn, H.; Tonon, F. Multi-stage triaxial test on brittle rock. Int. J. Rock Mech. Min. Sci. 2010, 47, 678–684. [Google Scholar] [CrossRef]
  19. Zhang, J.; Feng, X.t.; Yang, C.; Lin, F.; Li, S.; Tong, T.; Su, X. The characteristics and mechanism of microwave-induced borehole fracturing of hard rock under true triaxial stress. Eng. Geol. 2022, 306, 106768. [Google Scholar] [CrossRef]
  20. De Simone, M.; Souza, L.M.S.; Roehl, D. Brazilian splitting test—Experimental and numerical analysis. In Proceedings of the 4th Brazilian Conference on Composite Materials (BCCM4 2018), Rio de Janeiro, Brazil, 22–25 July 2018. [Google Scholar] [CrossRef]
  21. Packulak, T.R.M.; Day, J.J. The impact of axial load distribution on Brazilian tensile testing on rock. Rock Mech. Rock Eng. 2024, 57, 979–991. [Google Scholar] [CrossRef]
  22. Asahina, D.; Takemura, T.; Kawakita, S.; Li, Y. Development of a direct shear testing method using true triaxial apparatus. IOP Conf. Ser. Earth Environ. Sci. 2021, 833, 012013. [Google Scholar] [CrossRef]
  23. Haimson, B. True triaxial stresses and the brittle fracture of rock. Pure Appl. Geophys. 2006, 163, 1101–1130. [Google Scholar] [CrossRef]
  24. Ødegaard, H.; Nilsen, B. Rock stress measurements for unlined pressure tunnels: A true triaxial laboratory experiment to investigate the ability of a simplified hydraulic jacking test to assess fracture normal stress. Rock Mech. Rock Eng. 2021, 54, 2995–3015. [Google Scholar] [CrossRef]
  25. Fang, X.; Tong, H.; Feng, J.; Wang, Y.; Ni, X.; Hou, S.; Bie, K. Study on mechanical properties and elasto-brittle-plastic constitutive model of hard brittle rock based on conventional triaxial test. Arab. J. Geosci. 2022, 15, 798. [Google Scholar] [CrossRef]
  26. Ma, Z.; Li, X. Aeolian sand test with true triaxial stress path achieved by pseudo-triaxial apparatus. Sustainability 2023, 15, 8328. [Google Scholar] [CrossRef]
  27. Kranz, R.L. Microcracks in rocks: A review. Tectonophysics 1983, 100, 449–480. [Google Scholar] [CrossRef]
  28. Wu, Z.; Li, X.; Xiao, H.; Liu, X.; Lin, W.; Rao, Y.; Li, Y.; Zhang, J. The establishment and evaluation method of artificial microcracks in rocks. Energies 2021, 14, 2780. [Google Scholar] [CrossRef]
  29. Zhang, C.; Zhu, Z.; Wang, S.; Zhang, Y. Experimental research on dynamic failure of rock–cemented material–rock interface considering strain rate effect. Rock Mech. Rock Eng. 2024, 57, 145–162. [Google Scholar] [CrossRef]
  30. Zhao, K.; Yang, D.; Gong, C.; Zhuo, Y.; Wang, X.; Zhong, W. Evaluation of internal microcrack evolution in red sandstone based on time–frequency domain characteristics of acoustic emission signals. Constr. Build. Mater. 2020, 260, 120435. [Google Scholar] [CrossRef]
  31. Wang, C.; Chang, X.; Liu, Y. Experimental study on fracture patterns and crack propagation of sandstone based on acoustic emission. Adv. Civ. Eng. 2021, 2021, 8847158. [Google Scholar] [CrossRef]
  32. Wang, M.; Lu, Z.; Zhao, Y.; Wan, W. Experimental and numerical study on peak strength, coalescence and failure of rock-like materials with two folded preexisting fissures. Theor. Appl. Fract. Mech. 2023, 125, 103830. [Google Scholar] [CrossRef]
  33. Zhang, Q.; Zhang, X.P.; Yang, S.Q. Numerical study of fracture failure nature around the circular and horseshoe openings using the bonded-particle model. Geophys. J. Int. 2023, 232, 725–737. [Google Scholar] [CrossRef]
  34. Weng, L.; Li, X.; Taheri, A.; Wu, Q.; Xie, X. Fracture evolution around a cavity in brittle rock under uniaxial compression and coupled static–dynamic loads. Rock Mech. Rock Eng. 2018, 51, 531–545. [Google Scholar] [CrossRef]
  35. Zhou, X.P.; Zhang, J.Z.; Yang, S.Q.; Berto, F. Compression-induced crack initiation and growth in flawed rocks: A review. Fatigue Fract. Eng. Mater. Struct. 2021, 44, 1681–1707. [Google Scholar] [CrossRef]
  36. Grosse, C.U.; Ohtsu, M. Acoustic Emission Testing: Basics for Research-Applications in Civil Engineering; Springer: Berlin/Heidelberg, Germany, 2008. [Google Scholar] [CrossRef]
  37. Ju, S.; Li, D.; Jia, J. Machine-learning-based methods for crack classification using acoustic emission technique. Mech. Syst. Signal Process. 2022, 178, 109253. [Google Scholar] [CrossRef]
  38. Rao, A.K. Acoustic emission and signal analysis. Def. Sci. J. 1990, 40, 55–70. [Google Scholar] [CrossRef]
  39. Zhang, Z.; Liu, X.; Zhang, Y.; Qin, X.; Khan, M. Comparative study on fracture characteristics of coal and rock samples based on acoustic emission technology. Theor. Appl. Fract. Mech. 2021, 111, 102851. [Google Scholar] [CrossRef]
  40. Benson, P.M.; Thompson, B.D.; Meredith, P.G.; Vinciguerra, S.; Young, R.P. Imaging slow failure in triaxially deformed Etna basalt using 3D acoustic-emission location and X-ray computed tomography. Geophys. Res. Lett. 2007, 34, L03303. [Google Scholar] [CrossRef]
  41. King, T.; Vinciguerra, S.; Burgess, J.; Benson, P.; De Siena, L. Source Mechanisms of Laboratory Earthquakes During Fault Nucleation and Formation. J. Geophys. Res. Solid Earth 2021, 126, e2020JB021059. [Google Scholar] [CrossRef]
  42. Vinciguerra, S.; Meredith, P.G.; Hazzard, J. Experimental and modeling study of fluid pressure-driven fractures in Darley Dale sandstone. Geophys. Res. Lett. 2004, 31, L09609. [Google Scholar] [CrossRef]
  43. Jia, H.; Wang, E.; Chen, D.; Li, Z.; Mao, Z.; Shan, T.; Zhang, Q. Scaling local instability to critical failure of coal under quasi-static loading through combined acoustic emission and electromagnetic radiation analysis. Phys. Fluids 2025, 37, 056602. [Google Scholar] [CrossRef]
  44. Thompson, B.D.; Young, R.P.; Lockner, D.A. Observations of premonitory acoustic emission and slip nucleation during a stick slip experiment in smooth faulted westerly granite. Geophys. Res. Lett. 2005, 32, L10304. [Google Scholar] [CrossRef]
  45. Zhang, G.; Li, H.; Wang, M.; Li, X.; Wang, Z.; Deng, S. Crack-induced acoustic emission and anisotropy variation of brittle rocks containing natural fractures. J. Geophys. Eng. 2019, 16, 599–610. [Google Scholar] [CrossRef]
  46. Ju, M.; Li, J.; Li, J.; Zhao, J. Loading rate effects on anisotropy and crack propagation of weak bedding plane-rich rocks. Eng. Fract. Mech. 2020, 230, 106983. [Google Scholar] [CrossRef]
  47. Tian, W.L.; Yang, S.Q.; Wang, J.G.; Zeng, W. Numerical simulation of permeability evolution in granite after thermal treatment. Comput. Geotech. 2020, 126, 103705. [Google Scholar] [CrossRef]
  48. Yu, L.; Fu, A.; Yin, Q.; Jing, H.; Zhang, T.; Qin, H. Dynamic fracturing properties of marble after being subjected to multiple impact loadings. Eng. Fract. Mech. 2020, 230, 106988. [Google Scholar] [CrossRef]
  49. Huang, J.; Wang, H.; Zhou, L.; Zhu, Z.; Deng, Z.; Deng, A. Analysis of stress intensity factor for a crack emanating from elliptical hole subjected to compressive stress and shear stress. Theor. Appl. Fract. Mech. 2022, 120, 103413. [Google Scholar] [CrossRef]
  50. Mei, J.; Yang, L.; Sheng, X.; Ma, X.; Sui, B.; Yang, W. An experimental and theoretical investigation of time-dependent cracking and creep behavior of rocks under triaxial hydro-mechanical coupling. Theor. Appl. Fract. Mech. 2021, 115, 103046. [Google Scholar] [CrossRef]
  51. Wu, D.; Jing, H.; Xu, L.; Zhao, L.; Han, Y. Theoretical and numerical analysis of creep crack initiation combined with primary and secondary stresses. Theor. Appl. Fract. Mech. 2018, 95, 143–154. [Google Scholar] [CrossRef]
  52. Gong, F.Q.; Zhao, G.F. Dynamic indirect tensile strength of sandstone under different loading rates. Rock Mech. Rock Eng. 2014, 47, 2271–2278. [Google Scholar] [CrossRef]
  53. Hu, L.; Liang, X.; Liang, Z.; Li, Y.; Zhang, Z.; Tang, C. Influence of radial stress on strainbursts under true triaxial conditions: Insights from a distinct element modelling. Int. J. Rock Mech. Min. Sci. 2021, 138, 104577. [Google Scholar] [CrossRef]
  54. Tian, W.L.; Yang, S.Q.; Elsworth, D.; Wang, J.G.; Li, X.Z. Permeability evolution and crack characteristics in granite under treatment at high temperature. Int. J. Rock Mech. Min. Sci. 2020, 134, 104461. [Google Scholar] [CrossRef]
  55. Castro-Filgueira, U.; Alejano, L.R.; Ivars, D.M. Particle flow code simulation of intact and fissured granitic rock samples. J. Rock Mech. Geotech. Eng. 2020, 12, 960–974. [Google Scholar] [CrossRef]
  56. Hu, X.; Xie, N.; Zhu, Q.; Chen, L.; Li, P.C. Modeling damage evolution in heterogeneous granite using digital image-based grain-based model. Rock Mech. Rock Eng. 2020, 53, 4925–4945. [Google Scholar] [CrossRef]
  57. Hu, X.; Liao, D.; Hu, H.; Xie, S.; Xie, N.; Gong, X. The influence of mechanical heterogeneity of grain boundary on mechanical and microcracking behavior of granite under mode I loading using a grain-based model. Rock Mech. Rock Eng. 2024, 57, 3139–3169. [Google Scholar] [CrossRef]
  58. Petružálek, M.; Jechumtálová, Z.; Šílený, J.; Kolář, P.; Svitek, T.; Lokajíček, T.; Turková, I.; Kotrlý, M.; Onysko, R. Application of the shear-tensile source model to acoustic emissions in Westerly granite. Int. J. Rock Mech. Min. Sci. 2020, 128, 104246. [Google Scholar] [CrossRef]
  59. Heap, M.J.; Faulkner, D.R. Quantifying the evolution of static elastic properties as crystalline rock approaches failure. Int. J. Rock Mech. Min. Sci. 2008, 45, 564–573. [Google Scholar] [CrossRef]
  60. Liu, X.; Chen, H.; Liu, B.; Deng, W.; Liu, Q.; Zhang, Z. Experimental and numerical study on failure characteristics and mechanism of coal under different quasi-static loading rates. Theor. Appl. Fract. Mech. 2022, 121, 103478. [Google Scholar] [CrossRef]
  61. Fairhurst, C.E.; Hudson, J.A. Draft ISRM suggested method for the complete stress-strain curve for intact rock in uniaxial compression. Int. J. Rock Mech. Min. Sci. 1999, 36, 279–289. [Google Scholar]
  62. Potyondy, D.O.; Cundall, P.A. A bonded-particle model for rock. Int. J. Rock Mech. Min. Sci. 2004, 41, 1329–1364. [Google Scholar] [CrossRef]
  63. Bieniawski, Z.T. Mechanism of brittle fracture of rock. Part I-theory of the fracture process. Int. J. Rock Mech. Min. Sci. 1967, 4, 395–406. [Google Scholar] [CrossRef]
  64. Bobet, A.; Einstein, H.H. Fracture coalescence in rock-type materials under uniaxial and biaxial compression. Int. J. Rock Mech. Min. Sci. 1998, 35, 863–888. [Google Scholar] [CrossRef]
  65. Thompson, B.D.; Young, R.P.; Lockner, D.A. Fracture in Westerly Granite under AE Feedback and Constant Strain Rate Loading: Nucleation, Quasi-static Propagation, and the Transition to Unstable Fracture Propagation. Pure Appl. Geophys. 2006, 163, 995–1019. [Google Scholar] [CrossRef]
  66. Li, Y.; Xu, W.; Wu, P.; Meng, S. Dissolution versus cementation and its role in determining tight sandstone quality: A case study from the upper paleozoic in northeastern ordos basin, China. J. Nat. Gas Sci. Eng. 2020, 78, 103324. [Google Scholar] [CrossRef]
  67. Liu, B.; Zhao, Y.; Zhang, C.; Zhou, J.; Li, Y.; Sun, Z. Characteristic strength and acoustic emission properties of weakly cemented sandstone at different depths under uniaxial compression. Int. J. Coal Sci. Technol. 2021, 8, 1288–1301. [Google Scholar] [CrossRef]
  68. Liu, X.; Zhang, X.; Kong, L.; Li, X.; Wang, G. Effect of cementation on the small-strain stiffness of granite residual soil. Soils Found. 2021, 61, 520–532. [Google Scholar] [CrossRef]
  69. Lyu, X.; Du, J.; Fu, H.; Lyu, D.; Wang, W. Macro-micro behaviors and failure mechanism of frozen weakly cemented mudstone. J. Rock Mech. Geotech. Eng. 2024, 16, 1337–1347. [Google Scholar] [CrossRef]
  70. Ouyang, S.; Zhang, X.; Yao, C.; Ma, Y.; Yang, J.; Ye, Z.; Zhou, C. Shear property and failure mechanism of bonded rock-cement interface: Experimental and numerical approaches. J. Rock Mech. Geotech. Eng. 2025, 17, 1018–1036. [Google Scholar] [CrossRef]
  71. Wessling, A.; Larsson, S.; Kajberg, J. A statistical bonded particle model study on the effects of rock heterogeneity and cement strength on dynamic rock fracture. Comput. Part. Mech. 2024, 11, 1313–1327. [Google Scholar] [CrossRef]
  72. Zhang, Y.; Tao, Z.; Hou, J.; Di, S.; Li, J. DEM investigation of the mechanical response of cementation-type methane hydrate-bearing sand using an improved linear parallel bond contact model. Acta Geotech. 2025, 20, 2009–2030. [Google Scholar] [CrossRef]
  73. Zhang, Y.; Shao, Z.; Wei, W.; Qiao, R. PFC simulation of crack evolution and energy conversion during basalt failure process. J. Geophys. Eng. 2019, 16, 639–651. [Google Scholar] [CrossRef]
  74. Yoon, J. Application of experimental design and optimization to PFC model calibration in uniaxial compression simulation. Int. J. Rock Mech. Min. Sci. 2007, 44, 871–889. [Google Scholar] [CrossRef]
  75. Li, M.; Wu, Z.; Weng, L.; Liu, Q.; Chu, Z. Quantitative relationships between the mineral composition and macro mechanical behaviors of granite under different temperatures: Insights from mesostructure-based DEM investigations. Comput. Geotech. 2022, 148, 104838. [Google Scholar] [CrossRef]
  76. Bahrani, N.; Kaiser, P.K.; Valley, B. Distinct element method simulation of an analogue for a highly interlocked, non-persistently jointed rockmass. Int. J. Rock Mech. Min. Sci. 2014, 71, 117–130. [Google Scholar] [CrossRef]
  77. Hofmann, H.; Babadagli, T.; Yoon, J.S.; Zang, A.; Zimmermann, G. A grain based modeling study of mineralogical factors affecting strength, elastic behavior and micro fracture development during compression tests in granites. Eng. Fract. Mech. 2015, 147, 261–275. [Google Scholar] [CrossRef]
  78. Liu, Q.; Jiang, Y.; Wu, Z.; Qian, Z.; Xu, X. Numerical modeling of acoustic emission during rock failure process using a Voronoi element based—Explicit numerical manifold method. Tunn. Undergr. Space Technol. 2018, 79, 175–189. [Google Scholar] [CrossRef]
  79. Liu, J.; Zhang, L.M.; Cong, Y.; Wang, Z.Q. Research on the mechanical characteristics of granite failure process under true triaxial stress path. Yantu Lixue/Rock Soil Mech. 2021, 42, 2069–2077. [Google Scholar] [CrossRef]
  80. Wang, H.; Miao, S.J. Energy evolution mechanism and confining pressure effect of granite under triaxial loading-unloading cycles. IOP Conf. Ser. Mater. Sci. Eng. 2018, 362, 012018. [Google Scholar] [CrossRef]
  81. Yang, S.Q.; Tang, J.Z.; Wang, S.S.; Yang, D.S.; Zheng, W.T. An experimental and modeling investigation on creep mechanical behavior of granite under triaxial cyclic loading and unloading. Rock Mech. Rock Eng. 2022, 55, 5577–5597. [Google Scholar] [CrossRef]
  82. Li, D.; Sun, Z.; Xie, T.; Li, X.; Ranjith, P.G. Energy evolution characteristics of hard rock during triaxial failure with different loading and unloading paths. Eng. Geol. 2017, 228, 270–281. [Google Scholar] [CrossRef]
  83. Haimson, B.; Chang, C. A new true triaxial cell for testing mechanical properties of rock, and its use to de-termine rock strength and deformability of Westerly granite. Int. J. Rock Mech. Min. Sci. 2000, 37, 285–296. [Google Scholar] [CrossRef]
  84. Wang, Y.Q.; Peng, K.; Shang, X.Y.; Li, L.P.; Liu, Z.P.; Wu, Y.; Long, K. Experimental and numerical simulation study of crack coalescence modes and microcrack propagation law of fissured sandstone under uniaxial compression. Theor. Appl. Fract. Mech. 2021, 115, 103060. [Google Scholar] [CrossRef]
  85. Hazzard, J.F.; Young, R.P.; Maxwell, S.C. Micromechanical modeling of cracking and failure in brittle rocks. J. Geophys. Res. Solid Earth 2000, 105, 16683–16697. [Google Scholar] [CrossRef]
  86. Hazzard, J.F.; Young, R.P. Simulating acoustic emissions in bonded-particle models of rock. Int. J. Rock Mech. Min. Sci. 2000, 37, 867–872. [Google Scholar] [CrossRef]
  87. Hazzard, J.F.; Damjanac, B. Further investigations of microseismicity in bonded particle models. In Proceedings of the 3rd International FLAC/DEM Symposium, Hangzhou, China, 22–24 October 2013. [Google Scholar]
  88. Zhao, Y.; Zhao, G.; Zhou, J.; Ma, J.; Cai, X. Failure mechanism analysis of rock in particle discrete element method simulation based on moment tensors. Comput. Geotech. 2021, 136, 104215. [Google Scholar] [CrossRef]
  89. Ding, J.; Wang, X.; Liu, S.; Lei, M.; Liang, M.; Wu, Z. Phase-field anisotropic damage with bond-slip model for reinforced concrete beam under the service load. Eng. Fract. Mech. 2024, 307, 110317. [Google Scholar] [CrossRef]
  90. Feignier, B.; Young, R.P. Moment tensor inversion of induced microseisnmic events: Evidence of non-shear failures in the −4 < M < −2 moment magnitude range. Geophys. Res. Lett. 1992, 19, 1503–1506. [Google Scholar] [CrossRef]
  91. Zhang, Q.; Zhang, X.P.; Yang, S.Q. A numerical study of acoustic emission characteristics of sandstone specimen containing a hole-like flaw under uniaxial compression. Eng. Fract. Mech. 2021, 242, 107430. [Google Scholar] [CrossRef]
  92. Passelègue, F.X.; Schubnel, A.; Nielsen, S.; Bhat, H.S.; Deldicque, D.; Madariaga, R. Dynamic rupture processes inferred from laboratory microearthquakes. J. Geophys. Res. Solid Earth 2016, 121, 4343–4365. [Google Scholar] [CrossRef]
  93. Hanks, T.C.; Kanamori, H. A moment magnitude scale. J. Geophys. Res. B Solid Earth 1979, 84, 2348–2350. [Google Scholar] [CrossRef]
  94. Shiotani, T.; Ohtsu, M.; Ikeda, K. Detection and evaluation of AE waves due to rock deformation. Constr. Build. Mater. 2001, 15, 235–246. [Google Scholar] [CrossRef]
  95. Liu, X.; Han, M.; He, W.; Li, X.; Chen, D. A new b value estimation method in rock acoustic emission testing. J. Geophys. Res. Solid Earth 2020, 125, e2020JB019658. [Google Scholar] [CrossRef]
  96. Gutenberg, B.; Richter, C.F. Frequency of earthquakes in california*. Bull. Seismol. Soc. Am. 1944, 34, 185–188. [Google Scholar] [CrossRef]
  97. Mogi, K. Effect of the intermediate principal stress on rock failure. J. Geophys. Res. 1967, 72, 5117–5131. [Google Scholar] [CrossRef]
  98. Cao, W.; Durucan, S.; Cai, W.; Shi, J.Q.; Korre, A. A physics-based probabilistic forecasting methodology for hazardous microseismicity associated with longwall coal mining. Int. J. Coal Geol. 2020, 232, 103627. [Google Scholar] [CrossRef]
  99. Cao, W.; Durucan, S.; Cai, W.; Shi, J.Q.; Korre, A.; Jamnikar, S.; Rošer, J.; Lurka, A.; Siata, R. The role of mining intensity and pre-existing fracture attributes on spatial, temporal and magnitude characteristics of microseismicity in longwall coal mining. Rock Mech. Rock Eng. 2020, 53, 4139–4162. [Google Scholar] [CrossRef]
  100. van der Baan, M.; Chorney, D. Insights from micromechanical modeling of intact rock failure: Event characteristics, stress drops, and force networks. J. Geophys. Res. Solid Earth 2019, 124, 12955–12980. [Google Scholar] [CrossRef]
  101. Abdelaziz, A.; Zhao, Q.; Grasselli, G. Grain based modelling of rocks using the combined finite-discrete element method. Comput. Geotech. 2018, 103, 73–81. [Google Scholar] [CrossRef]
  102. Li, X.F.; Li, H.B.; Zhao, J. The role of transgranular capability in grain-based modelling of crystalline rocks. Comput. Geotech. 2019, 110, 161–183. [Google Scholar] [CrossRef]
  103. Li, X.F.; Zhang, Q.B.; Li, H.B.; Zhao, J. Grain-based discrete element method (GB-DEM) modelling of multi-scale fracturing in rocks under dynamic loading. Rock Mech. Rock Eng. 2018, 51, 3785–3817. [Google Scholar] [CrossRef]
  104. Peng, J.; Wong, L.N.Y.; Teh, C.I. Influence of grain size on strength of polymineralic crystalline rock: New insights from DEM grain-based modeling. J. Rock Mech. Geotech. Eng. 2021, 13, 755–766. [Google Scholar] [CrossRef]
  105. Saadat, M.; Taheri, A. Modelling micro-cracking behaviour of pre-cracked granite using grain-based distinct element model. Rock Mech. Rock Eng. 2019, 52, 4669–4692. [Google Scholar] [CrossRef]
  106. Sun, Y.; Kwok, C.Y.; Duan, K. Size effects on crystalline rock masses: Insights from grain-based DEM modeling. Comput. Geotech. 2024, 171, 106376. [Google Scholar] [CrossRef]
  107. Yahaghi, J.; Liu, H.; Chan, A.; Fukuda, D. Development of a three-dimensional grain-based combined finite-discrete element method to model the failure process of fine-grained sandstones. Comput. Geotech. 2023, 153, 105065. [Google Scholar] [CrossRef]
  108. Peng, S.; Li, X.; Li, C.; Liang, L.; Huang, L. Crack-closure behavior and stress-sensitive wave velocity of hard rock based on flat-joint model in particle-flow-code (PFC) modeling. Comput. Geotech. 2024, 170, 106320. [Google Scholar] [CrossRef]
  109. Bai, R.; He, C.; Xu, G.; Wang, S.; Shu, Y. Investigation of Phyllite-based Brazilian tests and fracture failure patterns via AE and PFC3D. Bull. Eng. Geol. Environ. 2024, 83, 113. [Google Scholar] [CrossRef]
Figure 1. Backscattered electron (BSE) image and corresponding phase map of a representative area of Westerly granite (WG). (a) Thin-section micrograph showing the major mineral constituents: Q—quartz, Pl—plagioclase, Kfs—K-feldspar, Bi—biotite. (b) Mineral phase distribution derived from TIMA analysis.
Applsci 16 02281 g001
Figure 2. The generation process. (a) Particles are generated on the basis of the different mineral grain sizes in Westerly granite. (b) The Rblock is employed to replace the grains. (c) The geometry is employed to replace the Rblocks, and different colors represent single geometry. (d) Smaller particles are generated to fill the grains, and different colors represent different grains. (e) Minerals grouped according to the previous markings. (f) The bonded sample and its bonding state.
Applsci 16 02281 g002
Figure 3. Bond of PFC numerical model. (a) The mechanical behavior of a bond between two contacting balls in a finite space. (b) The balls are connected by a linear contact bond, a parallel contact bond, and a damping element in the bonded state.
Applsci 16 02281 g003
Figure 4. Comparison of crack path in granite after triaxial loading in the experiment ((ad) left) [81,82] and simulation ((ad) right). The red dotted lines represent the macro crack paths.
Applsci 16 02281 g004
Figure 5. Comparison of proportion of source mechanism in AE events following loading of granite under different confining pressures in experiment and simulations.
Applsci 16 02281 g005
Figure 6. AE event monitoring and identification flowchart. Each circle represents an individual particle; yellow circles represent particles surrounding microcracks (microcracks are indicated by different color lines: blue is shear microcrack, green is tensile microcrack, and red is compaction microcrack). These particles collectively form a single AE source region (denoted by the red dashed circle). By assessing whether a new fracture occurs within the specified source region, the completion of each AE monitoring cycle is determined. Overlapping source regions are merged into a single AE event. During the AE monitoring and recognition process, the energy generated by each AE event is calculated, and data on energy, crack count, and location are recorded.
Applsci 16 02281 g006
Figure 7. Three types of AE source mechanisms.
Applsci 16 02281 g007
Figure 8. Distribution of acoustic emission (AE) and stress variation for granite as samples are deformed.
Applsci 16 02281 g008
Figure 9. Stress–strain under 5–40 MPa confining pressure; the crack distribution at each deformation stage is shown. The red dotted lines represent the macro crack paths.
Applsci 16 02281 g009
Figure 10. Variation of the percentage of AE magnitude in the compression process with the size of the confining pressure.
Applsci 16 02281 g010
Figure 11. AE event energy distribution. The circle size corresponds to the energy released by AE events. Pink circles represent small events, green circles represent medium events, orange circles represent big events.
Applsci 16 02281 g011
Figure 12. The curve depicts the relationship between the logarithm of N and magnitude. The blue line represents the straight line fitted using the least squares method on the logarithmic N data, while the red line represents the best fit, from which the b-value is obtained. Among them, the pink column represents small events, the green column represents medium events, and the orange column represents big events.
Applsci 16 02281 g012
Figure 13. The curve shows the variation of AE b-values at different confining pressures.
Applsci 16 02281 g013
Figure 14. Evolution of acoustic emission b-values obtained using a sliding window method during triaxial loading under different confining pressures.
Applsci 16 02281 g014
Figure 15. Percentage of the three failure modes at different confining pressures.
Applsci 16 02281 g015
Figure 16. Distribution of the three AE source mechanisms in AE events of different magnitudes (red circles: compaction; green circles: tension; blue circles: shear) within the samples. The dark-shaded regions enclosed by black lines indicate the zones of macrocracking.
Applsci 16 02281 g016
Figure 17. Direction and number of macroscopic fractures during the loading process. Red circles indicate the regions where fractures initiate, and red arrows indicate their propagation directions. Green circles represent the regions where the final macroscopic fractures form. Light blue shaded circles denote AE events, and the circle size represents the magnitude of the AE events.
Applsci 16 02281 g017
Figure 18. (a) Post-failure crack path in triaxial loading on Westerly granite [83]; (b) divergence map of experimentally derived mechanism slip vectors [41]; (c) divergence map of numerically simulated mechanism slip vectors; and (d) spatial distribution of three AE source types under triaxial loading. In the divergence maps of mechanism slip vectors, red regions (yellow in simulation) represent extensional domains dominated by tensile (T-type) sources, whereas blue regions denote compressional domains dominated by compaction (C-type) sources. Circles mark fracture nucleation points, and arrows indicate fracture propagation directions.
Applsci 16 02281 g018
Table 1. Volume composite proportion of mineral grain.
Westerly Granite: Massive, Fine-Grained, Equi-GranularRadius
Quartz24%0.1–0.4 mm
K-Feldspar25%0.1–0.5 mm
Plagioclase46%0.1–0.6 mm
Biotite5%0.1–0.3 mm
Classification: Granodiorite
Table 2. Microparameters of grain-based model.
MicroparametersValue
Mineral grainPlagioclaseK-FeldsparQuartzBiotite
Volume composite/%4625245
Minimum grain radius/mm0.1
Ratio of maximum to minimum grain radius6
Basic elements
Minimum particle radius/mm0.01
Ratio of maximum to minimum particle radius6
Density/kg/m32640
Intragranular contacts
Young’s modulus/GPa (pb_emod)56.670.842.537.8
Stiffness ratio (pb_kratio)1.61.41.82
Friction coefficient0.30.250.40.5
Friction angle/°30243642
Cohesion strength/MPa (pb_coh)164199141105
Tension strength/MPa (pb_ten)8299.670.352.7
Intergranular contacts
Between same mineralsBetween different minerals
Stiffness ratio (pb_kratio)2.62.8
Friction coefficient0.70.8
Friction angle/°6066
Young’s modulus/GPa (pb_emod)2.362.08
Cohesion strength/MPa (pb_coh)23.418.8
Tension strength/MPa (pb_ten)11.79.38
Table 3. Granite mechanical results after triaxial loading, experiment, and simulation comparison.
Experiment (Target Value)Simulation (PFC Test)
Confining PressurePeak stressStrainPeak stressStrain
5 MPa141.19 MPa0.59%150.49 MPa0.64%
10 MPa180.00 MPa0.68%179.35 MPa0.73%
20 MPa230.11 MPa0.89%233.24 MPa0.94%
40 MPa299.80 MPa1.17%301.81 MPa1.20%
Table 4. Proportion of AE source mechanisms in AE events following loading of granite under different confining pressures in experiment and simulations.
Pressure (MPa)Proportion
T-Type (Experiment)T-Type (Simulation)S-Type (Experiment)S-Type (Simulation)C-Type (Experiment)C-Type (Simulation)
574%78%4%5%22%17%
1082%74%5%6%13%20%
2065%68%6%7%29%24%
4068%59%8%9%24%32%
Table 5. Sensitivity of macroscopic and AE responses to DEM microparameters.
MicroparameterPercentage ChangePeak Stress (%)AE Number (%)T-Type Proportion (%)
Stiffness ratio+10%+3.2+3.5+1.8
−10%−3.8−5.1−2.3
Friction coefficient+10%+2.6−3.9−2.1
−10%−2.9+4.2+2.5
Cohesion strength/MPa+10%+4.7−6.8−3.4
−10%−5.2+7.5+3.9
Tension strength/MPa+10%+3.9−5.6−6.1
−10%−4.4+6.3+6.7
Table 6. The results of PFC simulation on the Westerly granite model.
Confining PressurePeak-StressStrain
5 MPa150.49 MPa0.64%
10 MPa179.35 MPa0.73%
20 MPa233.24 MPa0.94%
40 MPa301.81 MPa1.20%
Disclaimer/Publisher’s Note: The statements, opinions and data contained in all publications are solely those of the individual author(s) and contributor(s) and not of MDPI and/or the editor(s). MDPI and/or the editor(s) disclaim responsibility for any injury to people or property resulting from any ideas, methods, instructions or products referred to in the content.