Abstract
Addressing the challenges of insufficient reserve capacity allocation and wind power uncertainty-induced security and economic concerns under high wind power penetration, this paper develops an integrated energy–reserve market clearing model for regional electricity markets. Firstly, a comprehensive day-ahead market clearing mechanism is designed, encompassing market participant bidding, security-constrained unit commitment (SCUC), security-constrained economic dispatch (SCED), nodal marginal price calculation, and market settlement. Secondly, a SCUC model targeting the minimization of total system operating costs and a SCED model targeting the minimization of energy and reserve procurement costs are established, comprehensively incorporating constraints, such as power balance, unit output and ramping limits, reserve requirements, and network power flows, with nodal marginal prices calculated using the Lagrangian multiplier method. Finally, simulation verification is conducted using a modified IEEE 30-bus system as a case study. Results demonstrate that the proposed model effectively coordinates wind power integration with system reserve requirements, achieving economically optimal dispatch while ensuring grid security and stability. Thermal units obtain substantial market revenues by providing reserve ancillary services, while wind units achieve high revenues through zero marginal cost advantages, fully validating the model’s effectiveness and economic efficiency under high wind power penetration conditions. The research findings provide theoretical foundations and practical guidance for constructing electricity spot market mechanisms adapted to large-scale renewable energy integration.
1. Introduction
During the operation of power systems, it is crucial to ensure stable operation [1,2]. However, uncertainties such as load fluctuations, transmission line faults, and generator outages may lead to system imbalances, posing significant threats to the security of the power system [3,4]. The reserve capacity of standby units is the most direct and effective solution to these problems [5]. Therefore, reserves, as an important ancillary service, play a crucial role in ensuring the safe and stable operation of the power system.
With the continued advancement of global energy transition and the strategic implementation of the “dual carbon” goals, the penetration of renewable energy sources such as wind power in the power system has been steadily increasing [6,7,8]. By the end of August 2025, China’s wind power installed capacity had reached 580 million kilowatts, a year-on-year increase of 22.1% [9]. The integration of such clean energy sources into the grid will impose stricter requirements on the system’s reserve ancillary services [10]. In regions with high wind power penetration, sufficient reserve capacity must be reserved to address the uncertainty of wind power output. In areas with insufficient reserve adjustment capacity, serious wind curtailment phenomena may occur [11]. However, reserves are primarily provided by traditional coal-fired units or gas turbines, and the current compensation mechanisms do not fully compensate for the costs incurred by these traditional units providing reserves. Additionally, cost differences between units providing reserves are not considered, putting significant operational pressure on traditional units, resulting in low enthusiasm for reserves provided by coal-fired power plants [12]. Therefore, there is an urgent need to adopt a market-based approach to ensure the sufficient supply of reserve capacity and the effective compensation of the costs associated with providing reserve ancillary services.
Two market designs are primarily employed for energy and reserve markets: co-optimization and sequential clearing [13]. In co-optimized markets, energy and reserves are cleared simultaneously, a model adopted by all major U.S. regional electricity markets (PJM, CAISO, ERCOT, MISO, and NYISO) [13,14]. In sequential markets, energy and reserves are cleared successively to form the dispatch schedule, a model currently used by the integrated European energy market [15,16]. Among these, the co-optimization model demonstrates superior performance in terms of total generation cost, market prices, and other key indicators [17,18]. Consequently, recent studies have shifted towards the joint optimization of energy and reserve markets.
Existing research has made certain progress in this field. References [19,20,21,22] proposed joint energy–reserve market clearing models that minimize bidding costs while comprehensively considering static and dynamic security indicators. Based on the modeling and analysis of diverse flexible loads, Reference [23] presents a joint energy and reserve ancillary services market clearing model that incorporates load flexibility. However, these models primarily focus on conventional energy and reserve resources with insufficient consideration of wind power resources. To address the uncertainty of wind power, References [24,25] characterize it using an interval optimization method and a truncated generalized distribution model, respectively. Based on this, References [26,27,28] considered the uncertainty of wind power output and established unit commitment-constrained clearing models for joint energy–reserve markets with wind power participation. Nevertheless, these studies fail to adequately characterize the intrinsic coupling relationship between energy supply and reserve allocation, particularly overlooking the constraining effect of units’ energy provision on their reserve capability. In summary, while the aforementioned literature has proposed models conducive to efficient market operation and stable system performance in energy–reserve joint market clearing, comprehensive consideration of factors such as reserve deployability and wind power accommodation remains insufficient, and joint energy–reserve clearing models for regional electricity markets with high wind power penetration still require further research.
To fill this gap, this paper proposes a regional power market energy–reserve joint clearing model adapted to high wind power penetration. Compared to existing models, this model innovatively integrates reserve deployability constraints with wind power accommodation objectives by establishing reserve–energy coupling constraints and wind curtailment penalty mechanisms, simultaneously ensuring the actual availability of reserve resources and the full utilization of wind power within a unified co-optimization framework. Firstly, a complete day-ahead market clearing process is designed, including market participant declarations, security constrained unit commitment (SCUC), security constrained economic dispatch (SCED), nodal pricing calculations, and market settlements, achieving the joint optimization of energy and reserve ancillary services. Secondly, an optimization objective function is established that comprehensively considers the fuel costs, startup/shutdown costs, reserve costs, and wind power curtailment penalty costs of coal-fired power units, and multi-dimensional constraints such as power balance, unit technical constraints, reserve demand, and network security are incorporated to construct the SCUC and SCED two-stage optimization model. Thirdly, the Lagrange multiplier method is used to calculate the system’s nodal marginal prices, providing reasonable economic signals to market participants. Finally, an improved IEEE 30-bus system is used for simulation verification, analyzing the startup/shutdown schedules, output arrangements, reserve configurations, and economic benefits of different units. The effectiveness and practicality of the proposed model under high wind power penetration conditions are verified. This research provides theoretical support and practical reference for the construction of China’s electricity spot market and the design of renewable energy consumption mechanisms.
The rest of the paper is organized as follows. Section 2 presents the design of the joint energy–reserve clearing mechanism and discusses the modeling of the day-ahead joint energy–reserve clearing with wind power integration. Section 3 provides a case study analysis to validate the effectiveness of the proposed model. Section 4 provides a discussion of the limitations and future research directions for the proposed model. The main conclusions are presented in Section 5.
2. Materials and Methods
2.1. Design of the Joint Energy–Reserve Clearing Mechanism for the Day-Ahead Market with Wind Power Integration
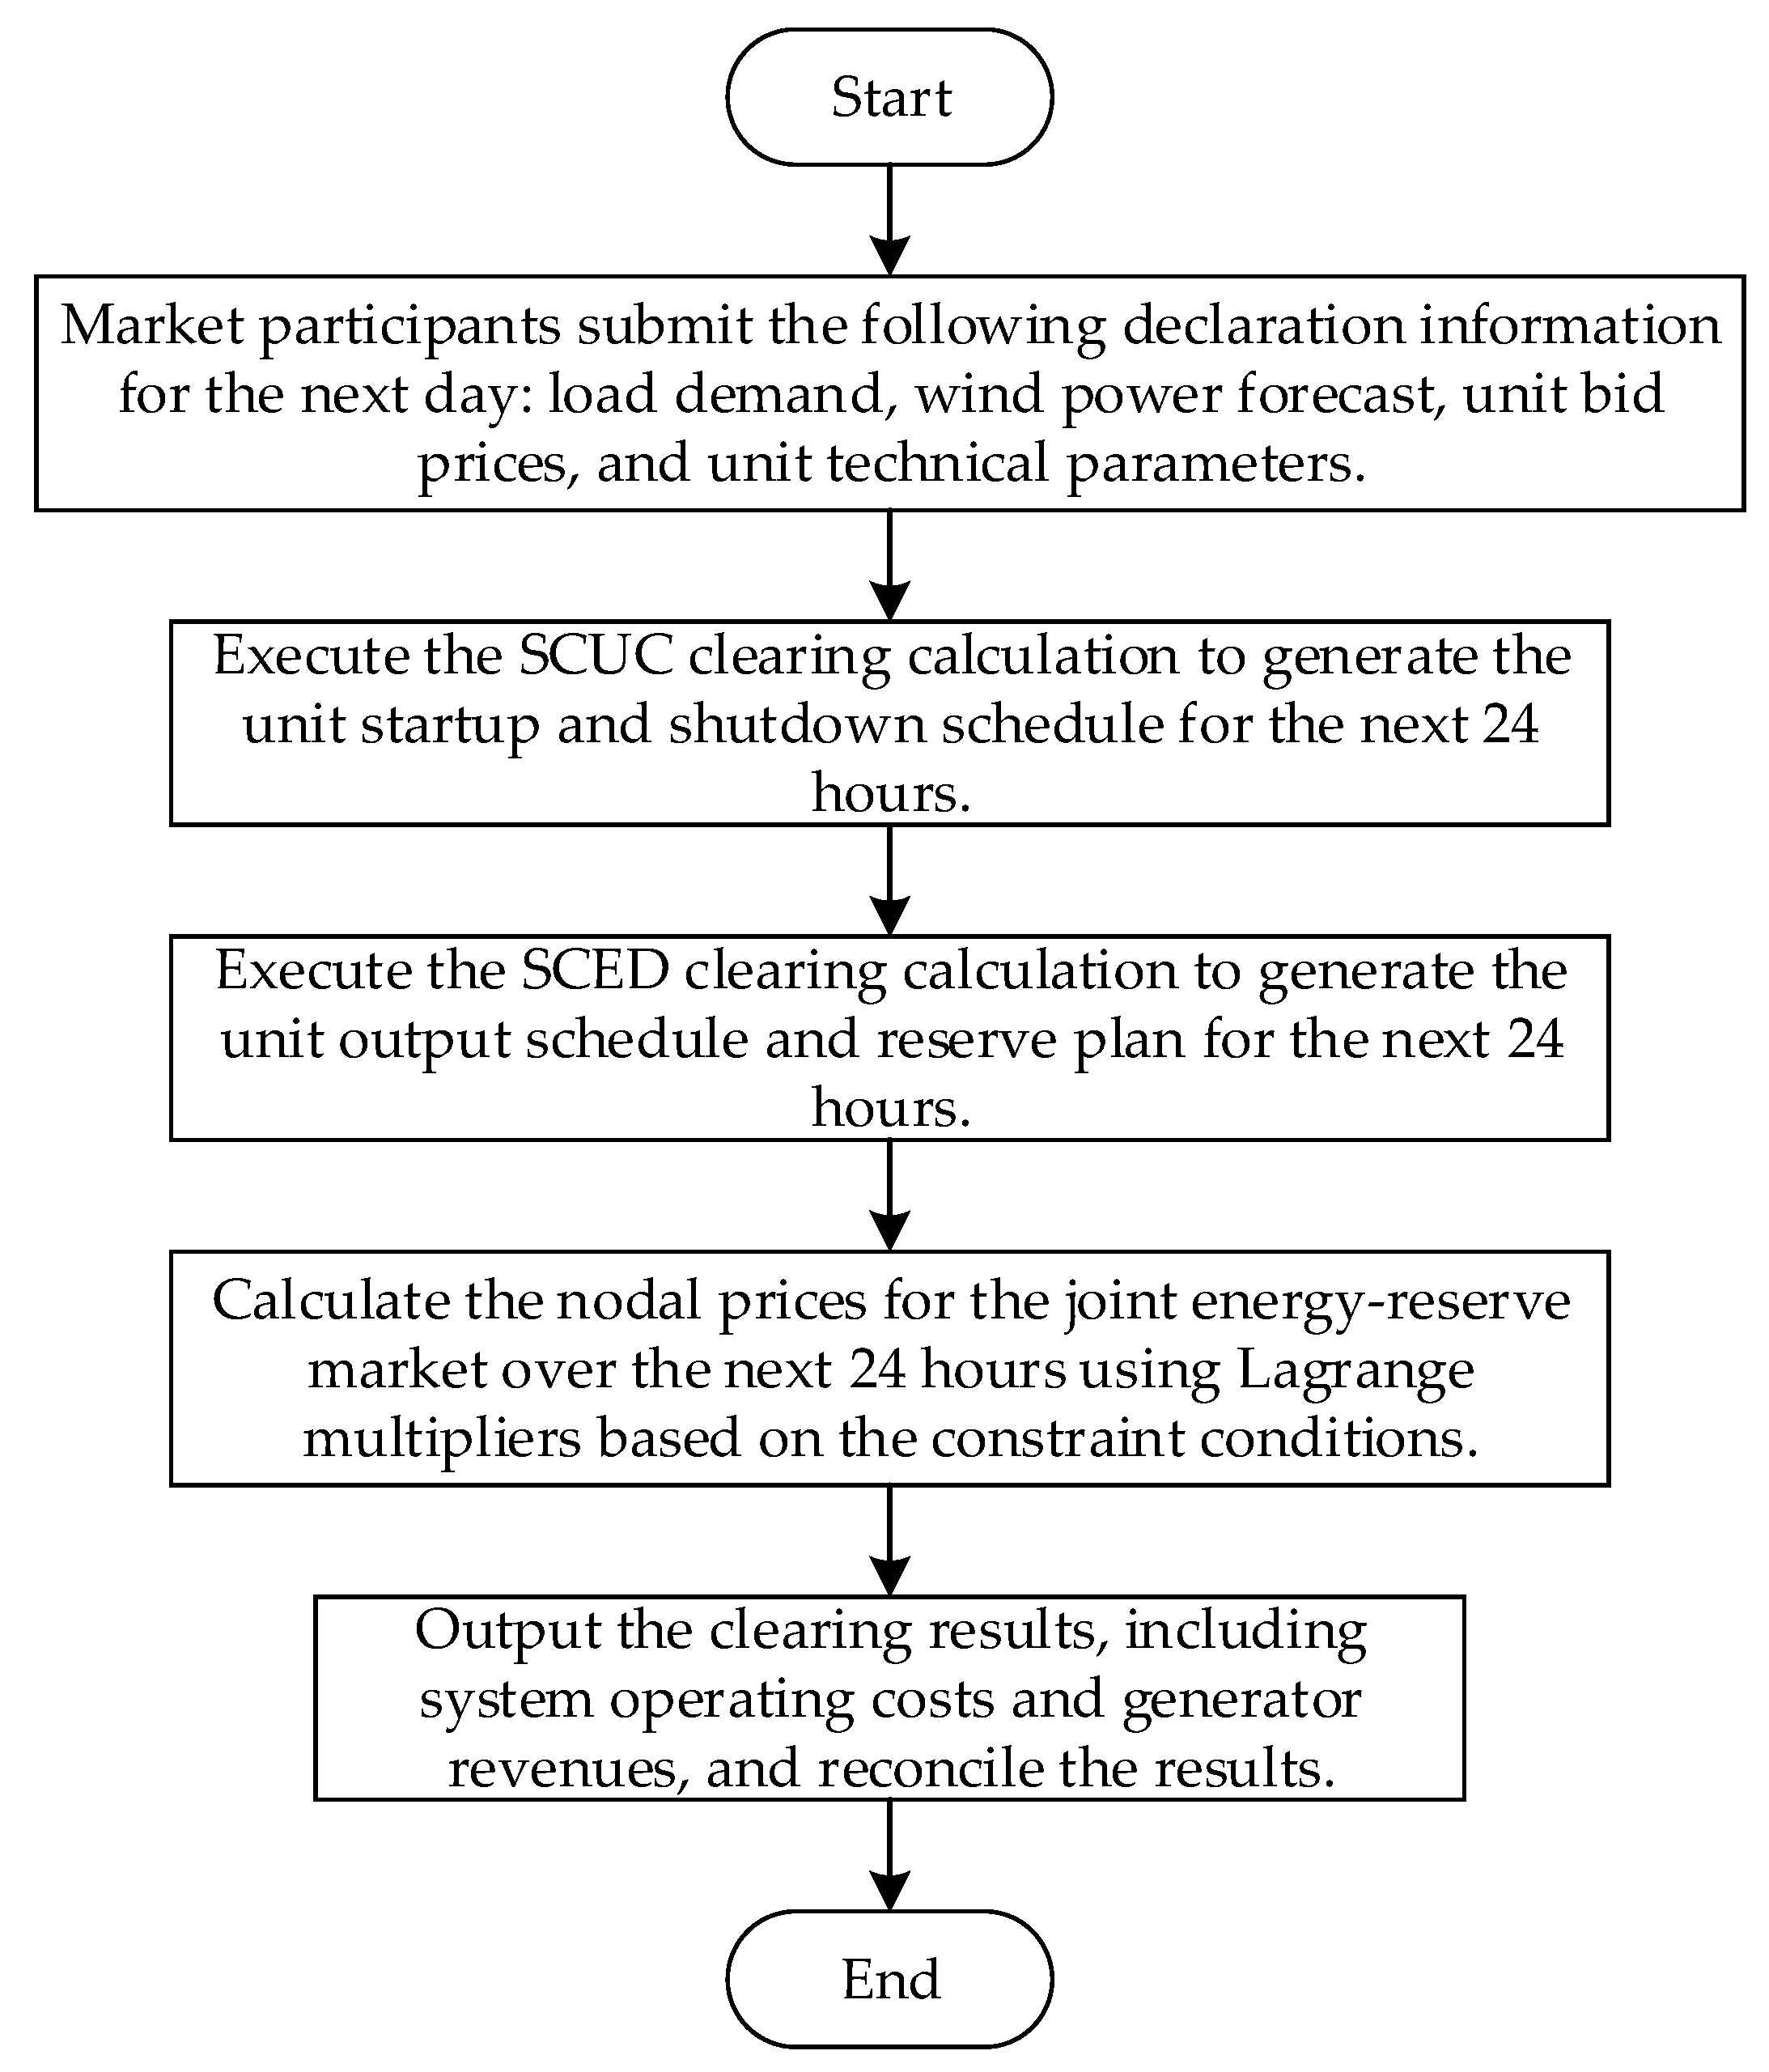
The arrangements for the energy market and ancillary services market are typically made the day before operation to minimize the total purchase cost of the energy and ancillary services markets through a centralized bidding process. After considering the generation reports from the energy market and ancillary services market, system constraints, unit scheduling, and network constraints, a joint optimization scheduling calculation is performed. The joint optimization scheduling includes SCUC, SCED calculation, and system-level locational marginal price (LMP) calculation. This calculation model plans the unit startup, shutdown, and scheduling for a 24 h period, with the purchase and planning of energy and ancillary services relying on these calculations. All objectives and constraints are based on the optimization model, and the joint optimization scheduling clearing process for the energy and ancillary services markets is specifically shown in Figure 1.
Figure 1.
Flow chart for clearing the electricity reserve joint market.
Step 1: Market Participant Declaration. Users and wind farms submit their next-day load demand curve and wind power output forecast curve to the trading center, while conventional power plants submit their energy and reserve bid prices along with technical parameters, providing the data foundation for subsequent optimization calculations.
Step 2: SCUC Clearing Calculation. The trading center executes the SCUC program with the goal of minimizing the total system operating cost. It determines the unit startup and shutdown plan for the next 24 h while satisfying load balancing, reserve demand, unit output and ramping constraints, minimum up and down time, and line flow safety constraints.
Step 3: SCED Clearing Calculation. Based on the unit startup and shutdown schedule, the trading center performs further optimization using the SCED program. SCED aims to minimize the energy and reserve purchase costs as well as wind curtailment penalty costs. It accounts for additional safety constraints beyond the startup and shutdown constraints to achieve joint optimization clearing of energy and reserve ancillary services, generating the unit output and reserve configuration plan for the next 24 h.
Step 4: Marginal Price Calculation. The trading center uses the results of SCED to calculate the system’s nodal prices via the Lagrange multiplier method. By extracting the shadow prices of load balance constraints and reserve demand constraints, the nodal prices for coal-fired and wind power units are calculated for the 24 time periods.
Step 5: Result Release and Settlement. The trading center releases the market clearing results, outputs the awarded units’ energy and reserve operating schedules, and executes market settlements based on the clearing prices, completing the scheduling and trading process of the electricity market.
2.2. Modeling of the Day-Ahead Joint Energy–Reserve Clearing with Wind Power Integration
The joint market clearing model includes SCUC model, SCED model, and the nodal price calculation model. The SCUC model, with a day-ahead time period as the decision cycle, determines the startup/shutdown status and preliminary output plan of each unit, ensuring the system’s security constraints are met. The SCED model then refines the optimization of unit outputs and reserve capacities based on the SCUC results, further reducing the system’s operating costs. The nodal price calculation model, based on the optimization results, uses the Lagrange multiplier method to calculate the marginal prices at each node, providing clear price signals to market participants and guiding the rational allocation of resources. These three models are interconnected and progressively built upon each other, forming a complete day-ahead market clearing mechanism. The specific model design is shown below.
2.2.1. Day-Ahead Security-Constrained Unit Commitment Model
The joint clearing optimization of energy and reserve ancillary services aims to minimize the total purchase cost of energy and reserves. The optimization objective includes the fuel costs, startup and shutdown costs, reserve provision costs, and wind curtailment penalty costs. The specific mathematical model is as follows:
where
where T is the number of simulation periods; Ng is the number of coal-fired power units; Nw is the number of wind power units; Ci is the fuel cost of coal-fired unit i; Pi,t is the active power output of coal-fired unit i in period t; ai, bi, and ci are the coefficients for the quadratic, linear, and constant terms of the fuel cost for coal-fired unit i; is the startup/shutdown cost of coal-fired unit i; xi,t and yi,t are the startup and shutdown states of coal-fired unit i in period t, respectively; and are the startup and shutdown costs of coal-fired unit i per instance; is the reserve cost of coal-fired unit i; and are the upward and downward spinning reserve capacities of coal-fired unit i in period t, respectively; and are the upward and downward spinning reserve costs for coal-fired unit i; is the wind curtailment penalty cost for wind power unit j in period t; Kwc is the wind curtailment penalty coefficient; and and are the forecasted and actual outputs of wind power unit j in period t, respectively.
In addition, the constraints imposed on this model are as follows.
- 1.
- System Operating Constraints
The power balance constraint can be expressed as:
where PL,t is the system load at time period t.
- 2.
- Unit Operating Constraints
The wind power output constraint can be expressed as:
The output constraint for coal-fired units is as follows:
where ui,t represents the operating status of coal-fired unit i at time t (ui,t = 1 indicates that unit i is online, and ui,t = 0 indicates that unit i is offline); and represent the maximum and minimum technical output of coal-fired unit i, respectively; and and represent the upper and lower output limits of coal-fired unit i at time period t.
Ramp rate constraint for coal-fired units can be represented as:
where and represent the maximum upward and downward ramp rates of coal-fired unit iii, respectively.
The minimum startup and shutdown time constraint for coal-fired units is:
where and represent the minimum startup and shutdown times for coal-fired unit i, respectively.
The startup and shutdown logic constraint for coal-fired units can be expressed as:
- 3.
- System Reserve Service Constraints
The reserve capacity constraints are as follows:
where and represent the maximum upward and downward spinning reserve capacities of coal-fired unit i, respectively.
The reserve demand constraint is as follows:
where α and β represent the reserve demand coefficients for upward and downward reserves, respectively; and kdown and kup represent the upward and downward reserve demand coefficients declared by wind power units. The setting of reserve demand coefficients aims to characterize the relationship between the amount of renewable energy consumption and the system’s reserve requirements. As the consumption of renewable energy increases, the system’s uncertainty also rises, thereby increasing the demand for reserve capacity accordingly.
- 4.
- System Network Constraints
The node power balance constraint is as follows:
where Pline,t is the branch power flow at time period t; H is the conversion matrix that represents the relationship between branch power flow and the node’s coal-fired power, wind power, and load; and Xg and Xw are sparse matrices representing the correspondence between coal-fired units and wind power units with the nodes.
The transmission line flow constraint is as follows:
where PL,min is the minimum load on the branch, and PL,max is the maximum load on the branch.
2.2.2. Day-Ahead Security-Constrained Economic Dispatch Model
The SCED model optimizes the generation output of the online units to meet electricity demand while minimizing the scheduling cost. Unlike the SCUC model, which focuses on unit startup and shutdown decisions, the SCED model also optimizes the output and operational status of the units. This model is based on the predefined unit startup and shutdown states and further optimizes the operation process of the units. Therefore, the objective function and constraints of the SCED model are similar to those of the SCUC model, with the goal of minimizing generation costs, ensuring system security, and meeting load demand. The specific adjustments of the SCED model compared to the SCUC model are as follows.
Ignoring the startup costs of the units, the adjusted objective function is as follows:
Ignoring the minimum startup and shutdown time constraints (Equations (10) and (11)) and the startup/shutdown logic constraints, the adjusted constraints are as follows: Equations (6)–(9) and Equations (12)–(15), where the integer variables are the known values determined by the SCUC model.
2.2.3. Nodal Price Calculation Model
By solving the SCED model and obtaining the Lagrange multipliers for each constraint, the system marginal price for the energy and reserve markets at each hour can be derived. The specific expression is as follows:
where L is the Lagrangian function of the optimization model; PE is the energy price; ED is the system energy demand; λ is the Lagrange multiplier for the active power balance constraint; PR is the reserve price; RD is the system reserve demand; and μ is the Lagrange multiplier for the reserve constraint.
3. Results
3.1. Case Study Base Data
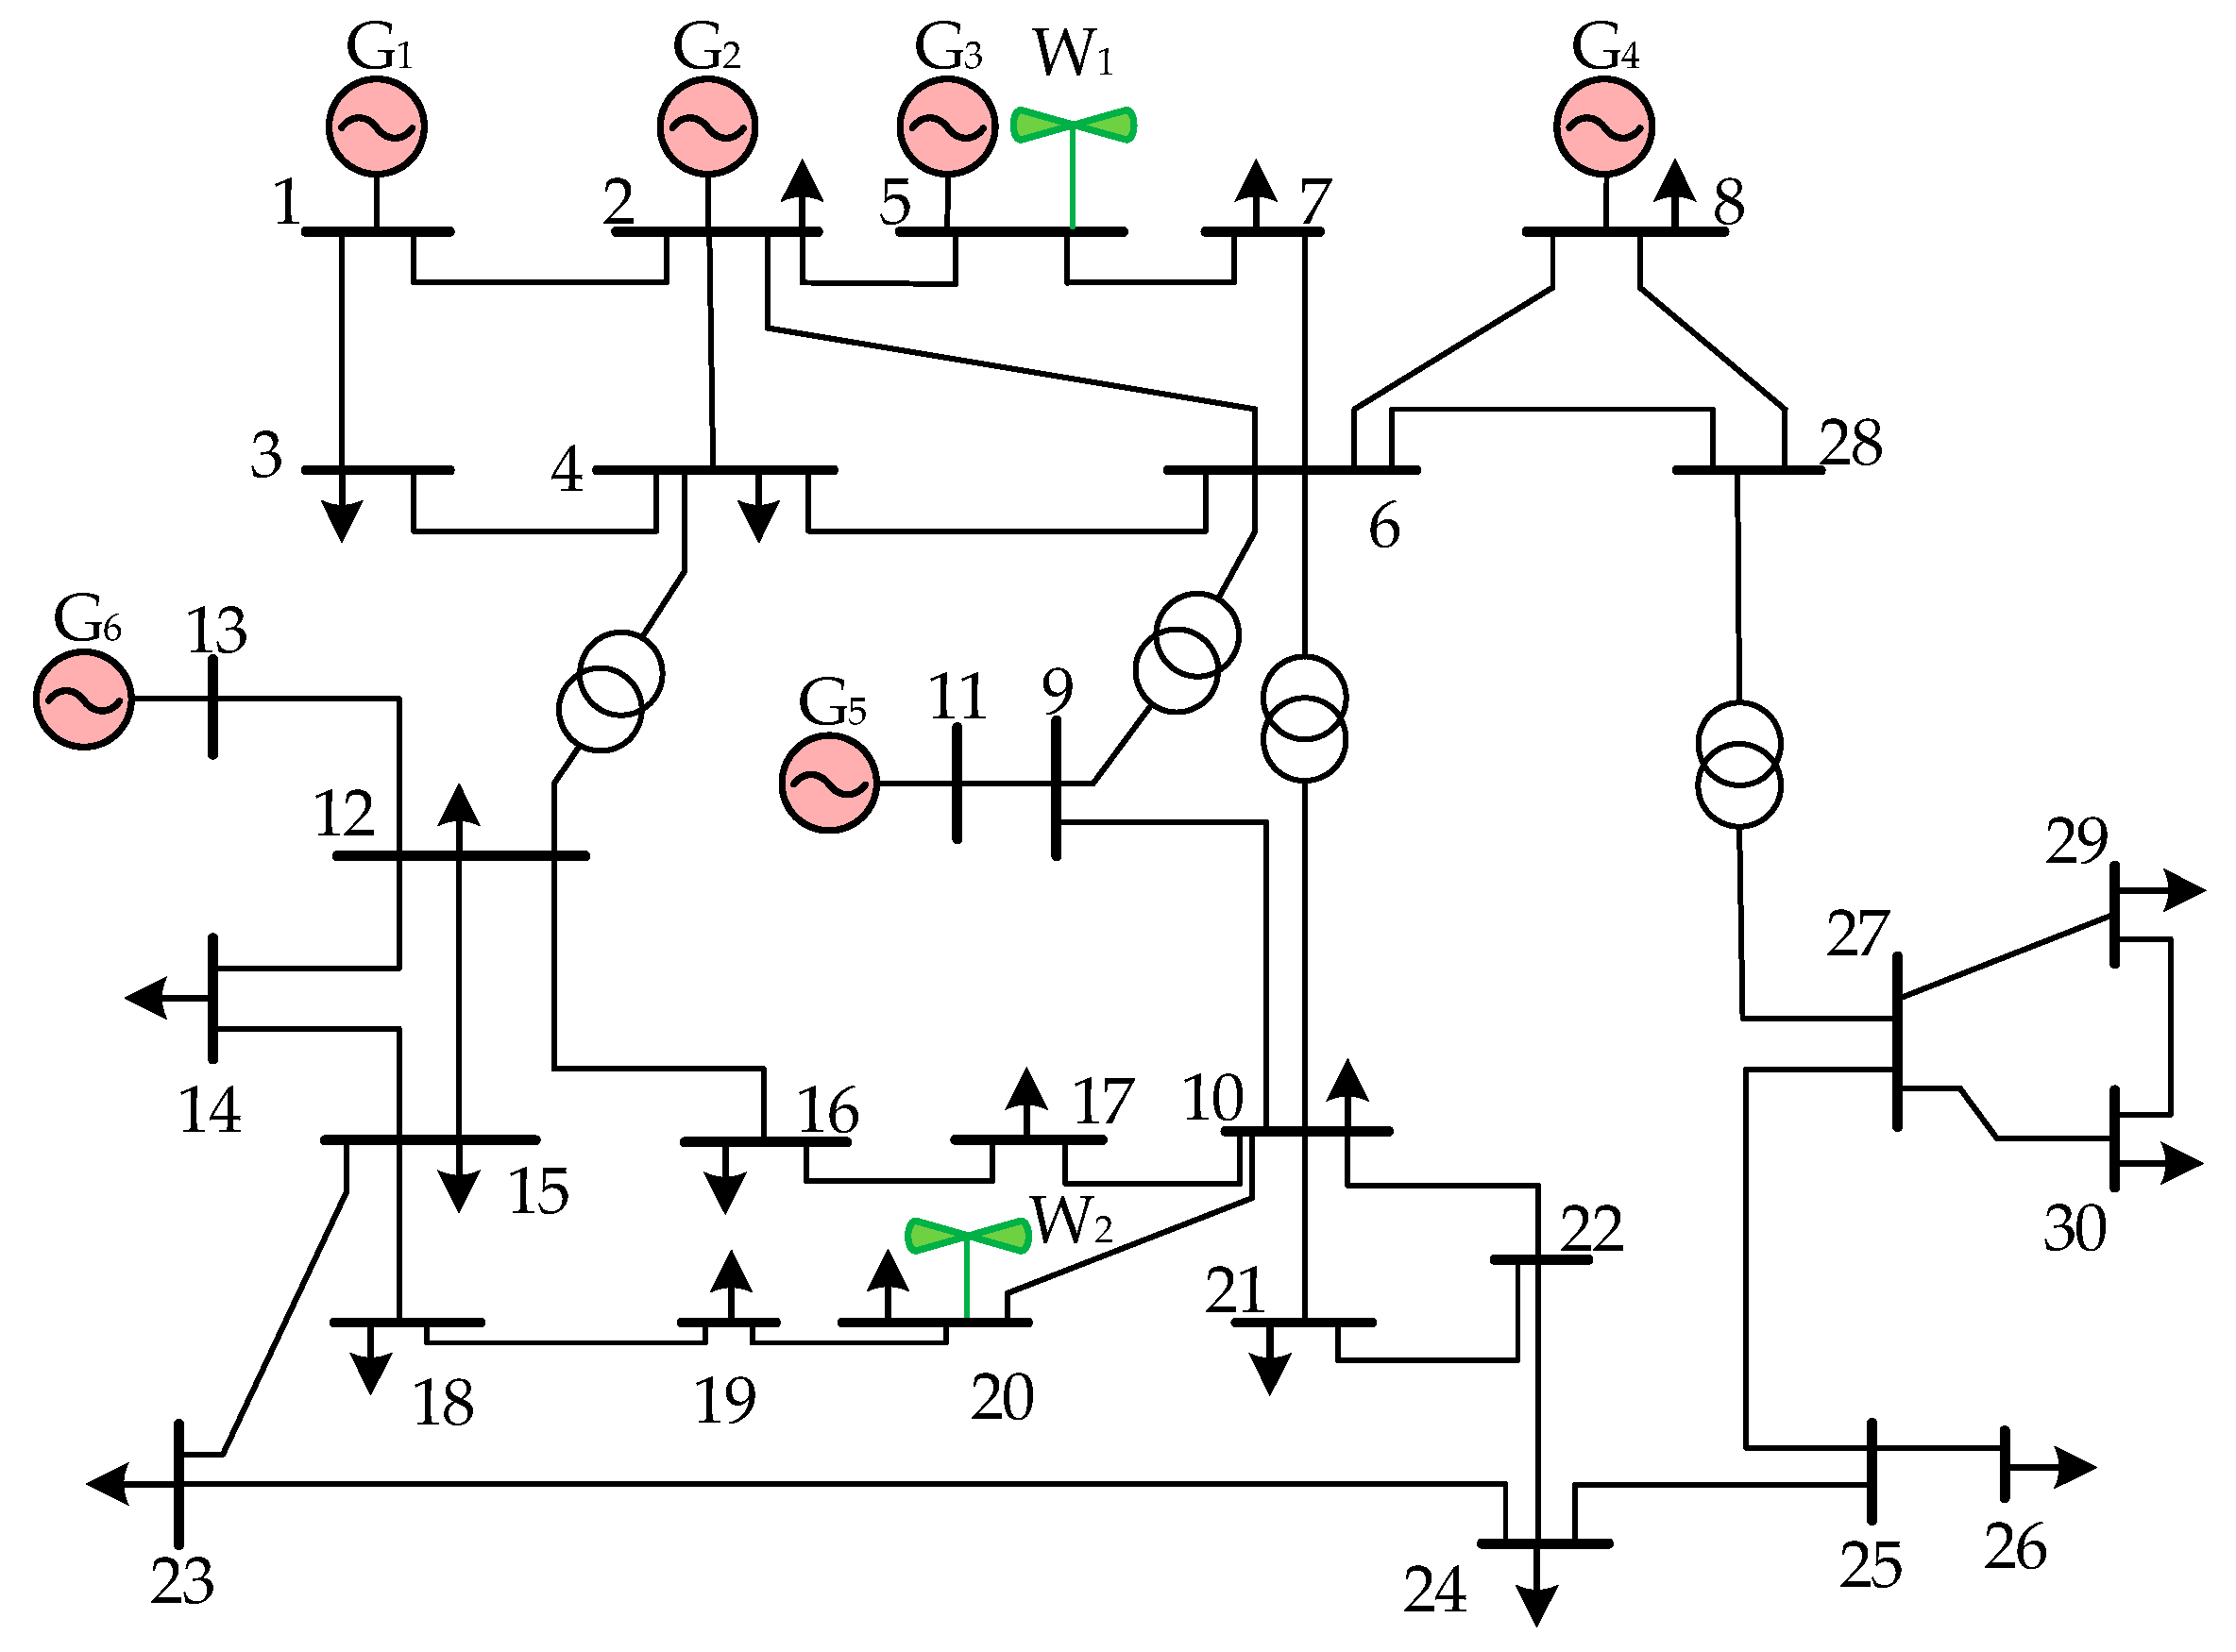
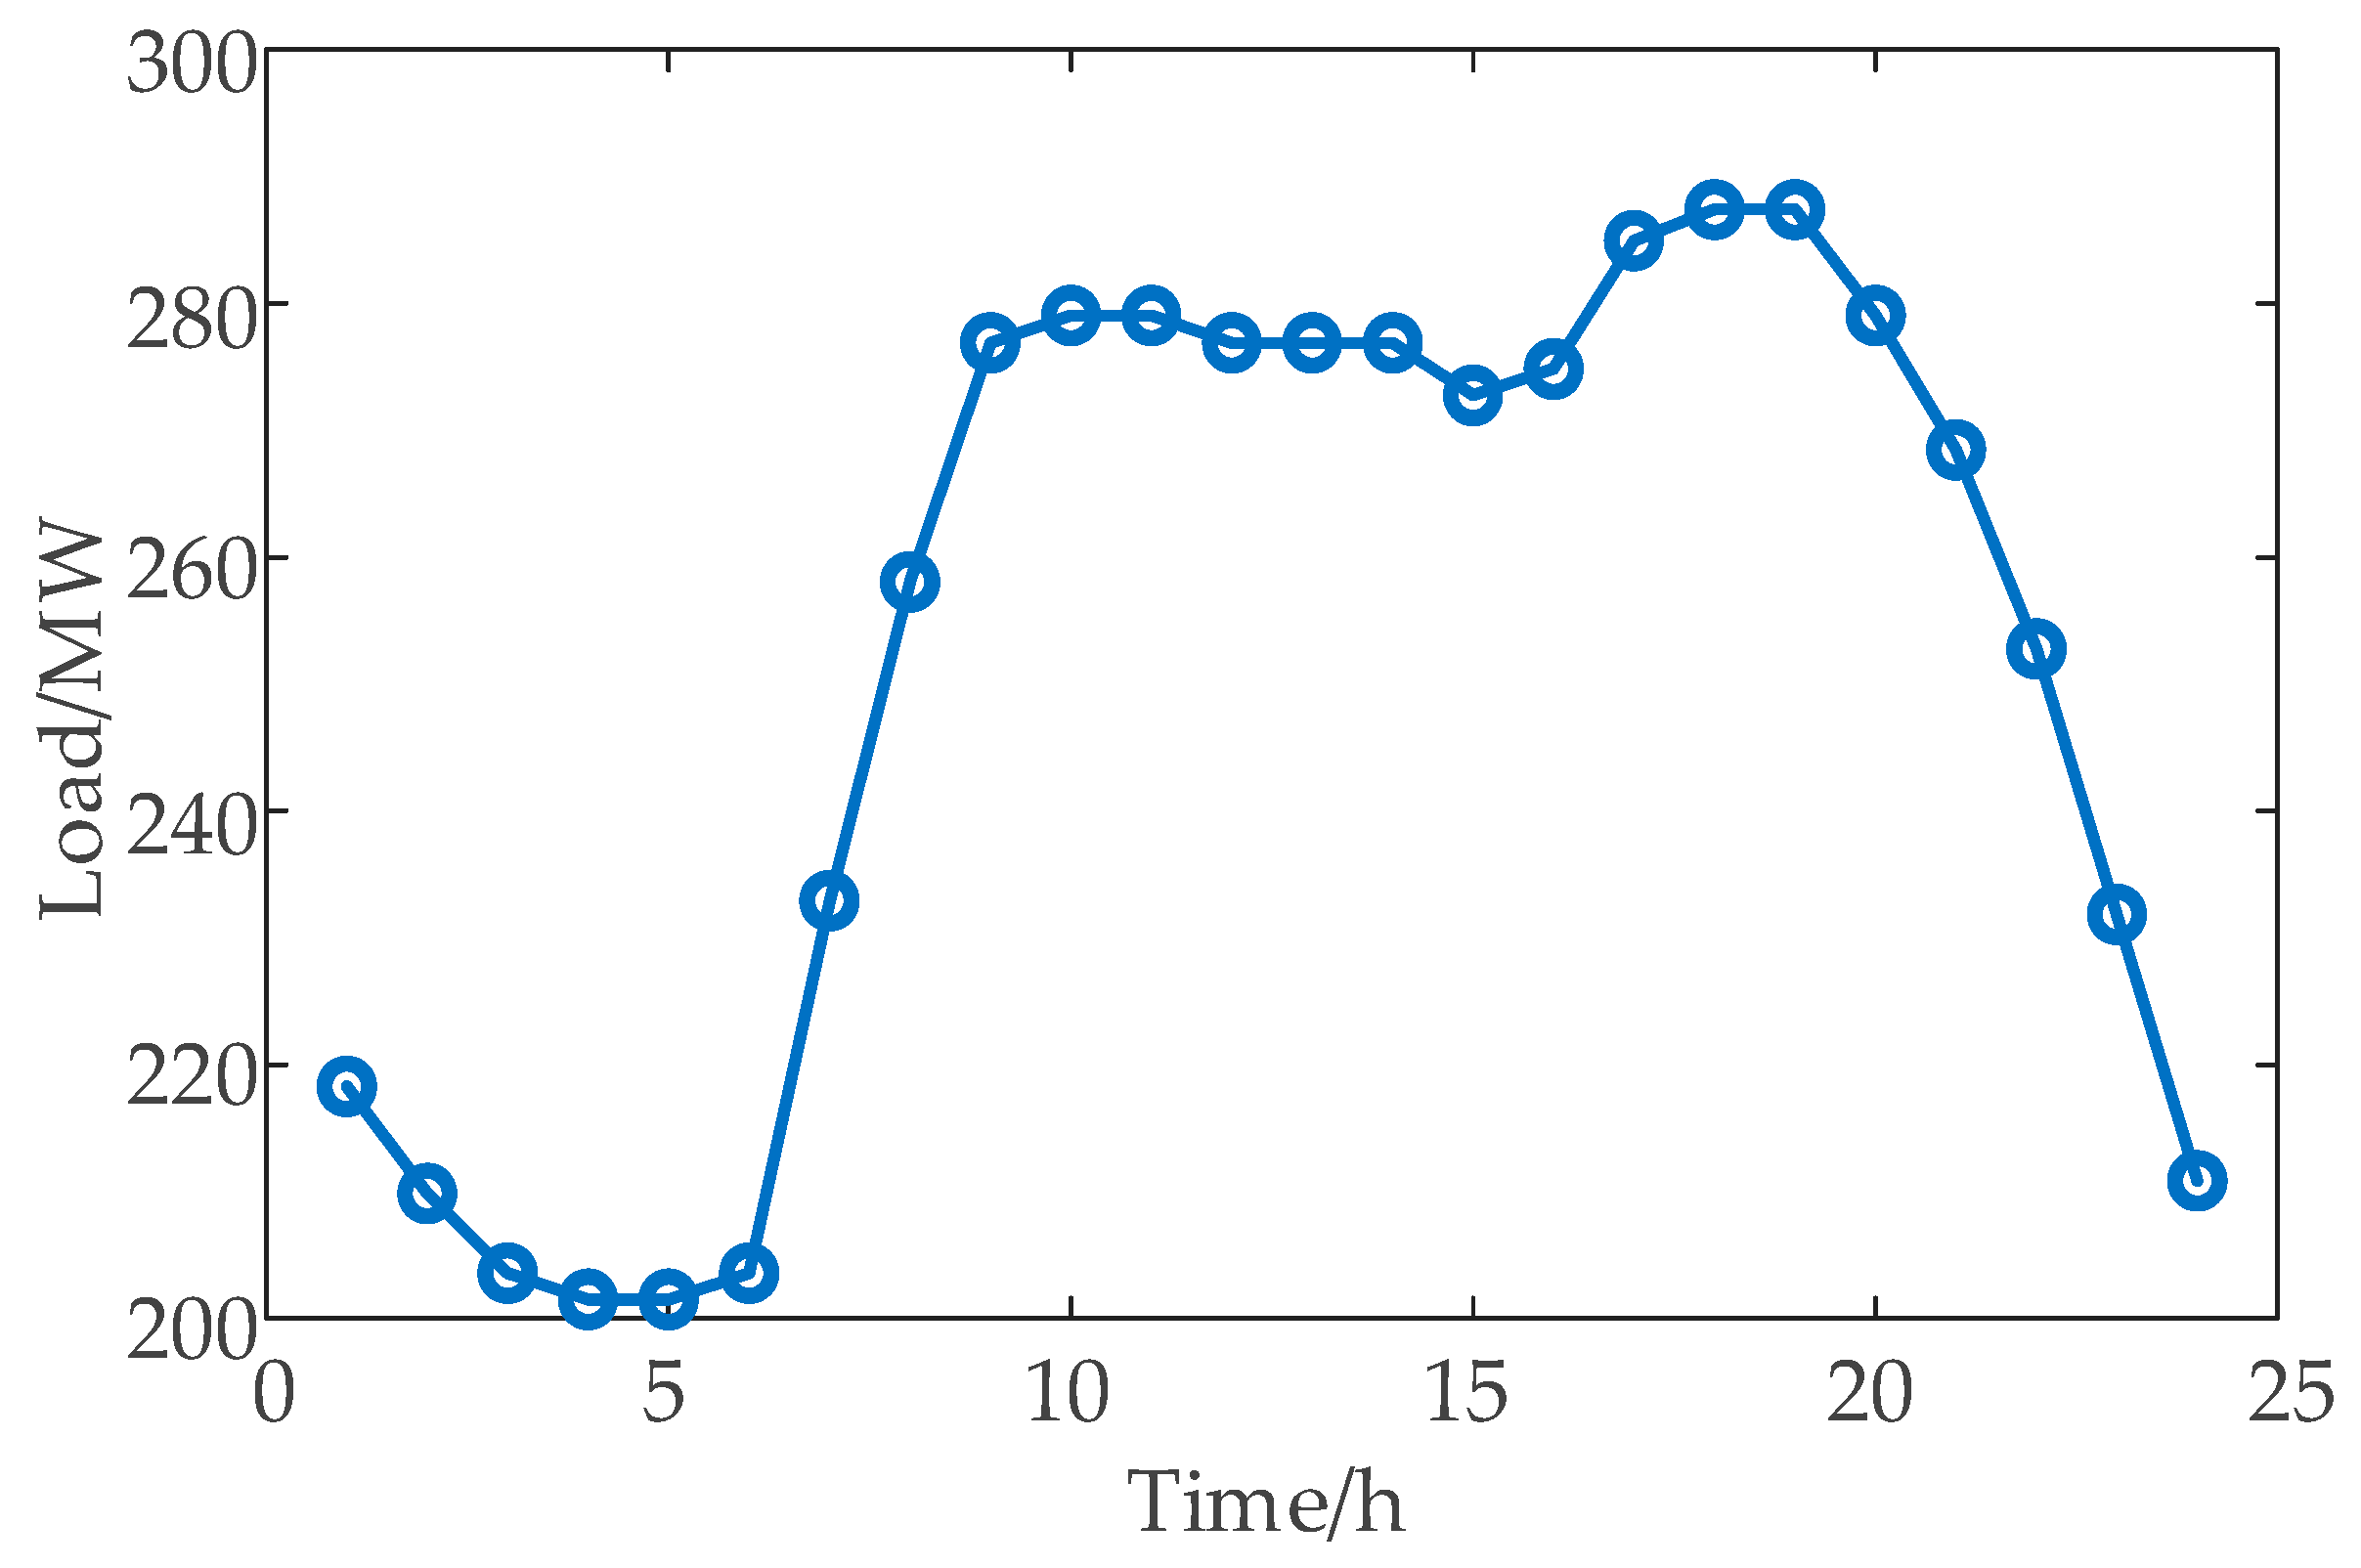
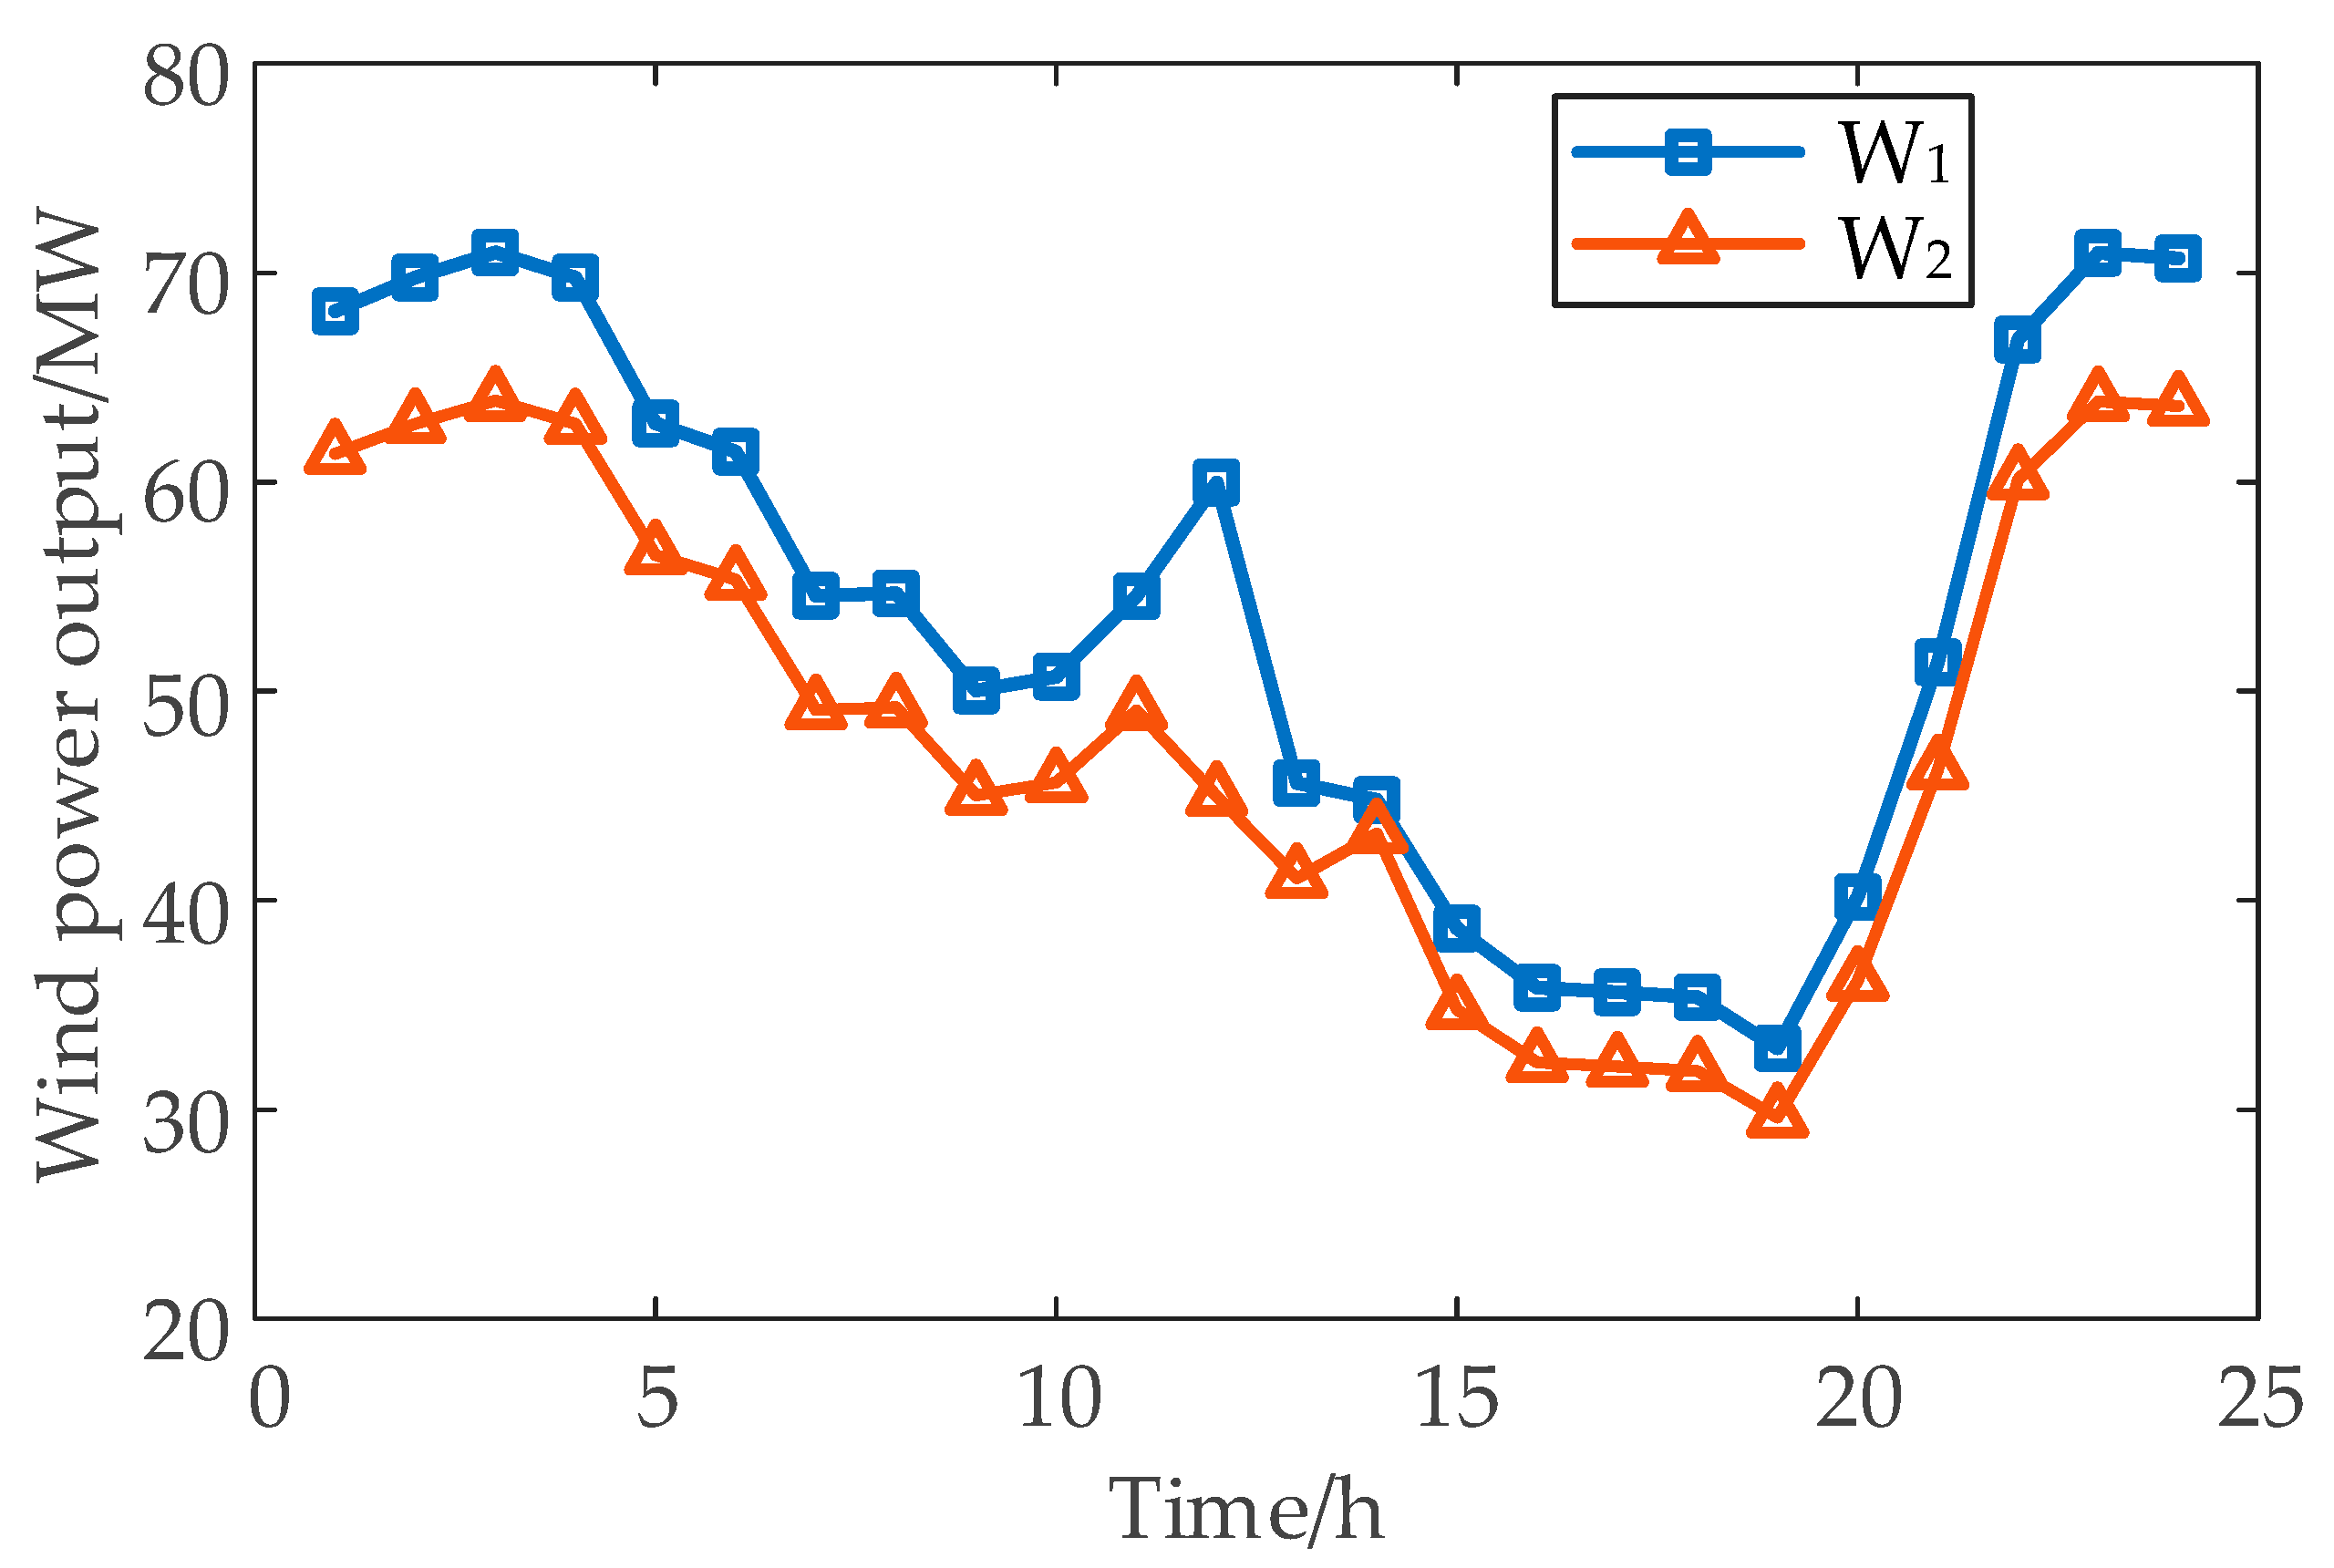
To validate the effectiveness of the proposed day-ahead joint energy–reserve clearing model, this section uses the improved IEEE 30-bus system as a case study. The system topology is shown in Figure 2, which includes 41 transmission lines, 20 load nodes, 6 conventional generators (G1–G6), and 2 wind power units (W1–W2). The typical daily load curve for the system is shown in Figure 3, with reserve demand coefficients for upward and downward reserves set at 0.05 and 0.06, respectively. The parameters for the coal-fired power units are provided in Table 1 [29]. It should be noted that all per-unit (p.u.) values are normalized based on a system base power of 100 MVA. Wind power units are connected to nodes 5 and 20, and their output curves are shown in Figure 4. The wind curtailment penalty coefficient for the system is set to 5. The upward and downward reserve coefficients for the two wind power units are set to 0.25 and 0.18, respectively, based on reference [29]. The energy–reserve joint market optimization program is written in MATLAB R2021b and solved using the CPLEX 12.10 solver. The final results include the unit commitment, output schedule, market clearing prices, and economic benefits.
Figure 2.
Typical tariff simulation path diagram.
Figure 3.
Typical daily load curve.
Table 1.
Thermal power unit parameters.
Figure 4.
Typical daily wind power output curve.
3.2. Case Study Analysis Results
3.2.1. Unit Commitment and Output Schedule
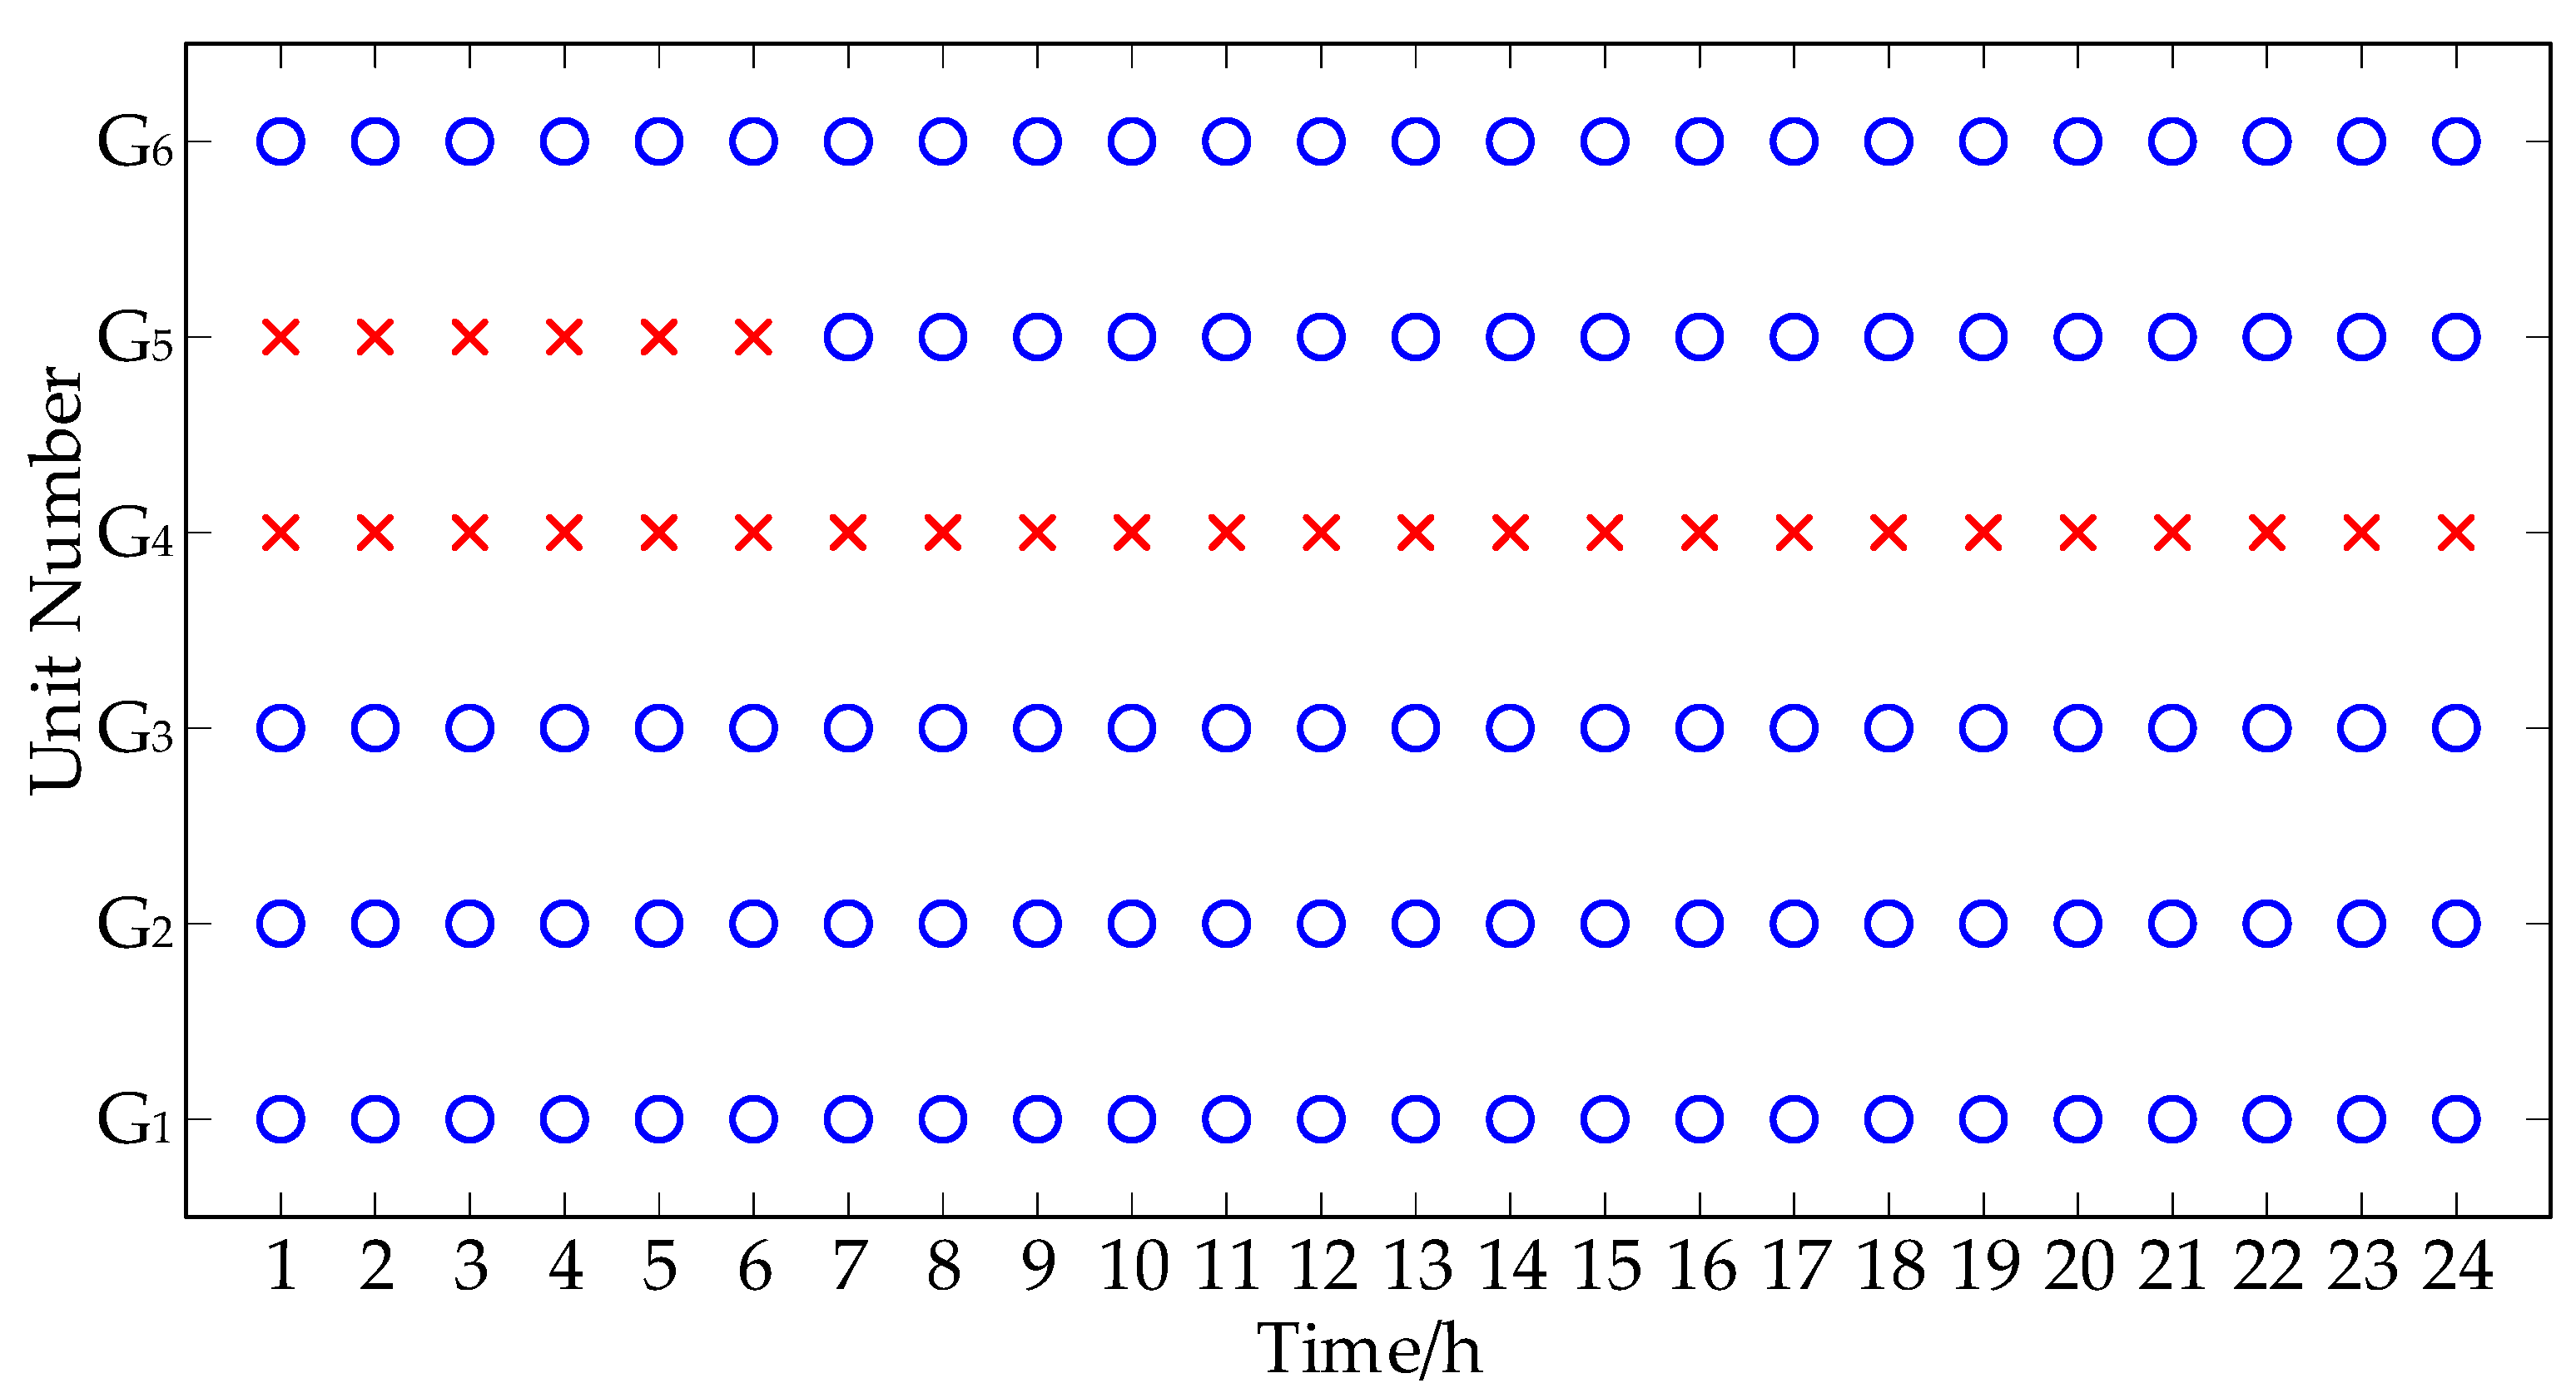
The initial states of units G1 to G3 are “online,” while the initial states of units G4 to G6 are “offline.” Figure 5 shows the startup and shutdown schedule for the coal-fired units, where “O” denotes the unit is online, and “×” indicates the unit is offline. As shown in Figure 5, units G1, G2, G3, and G6 remain online from the initial time and continue to operate in subsequent periods. Unit G4 stays offline throughout the period. Unit G5 remains offline for the first 6 periods and then starts operating from periods 7 to 24. Since the startup cost of units G5 and G6 is lower than that of G4, they are prioritized for startup when the load demand increases.
Figure 5.
Unit combination solution results.
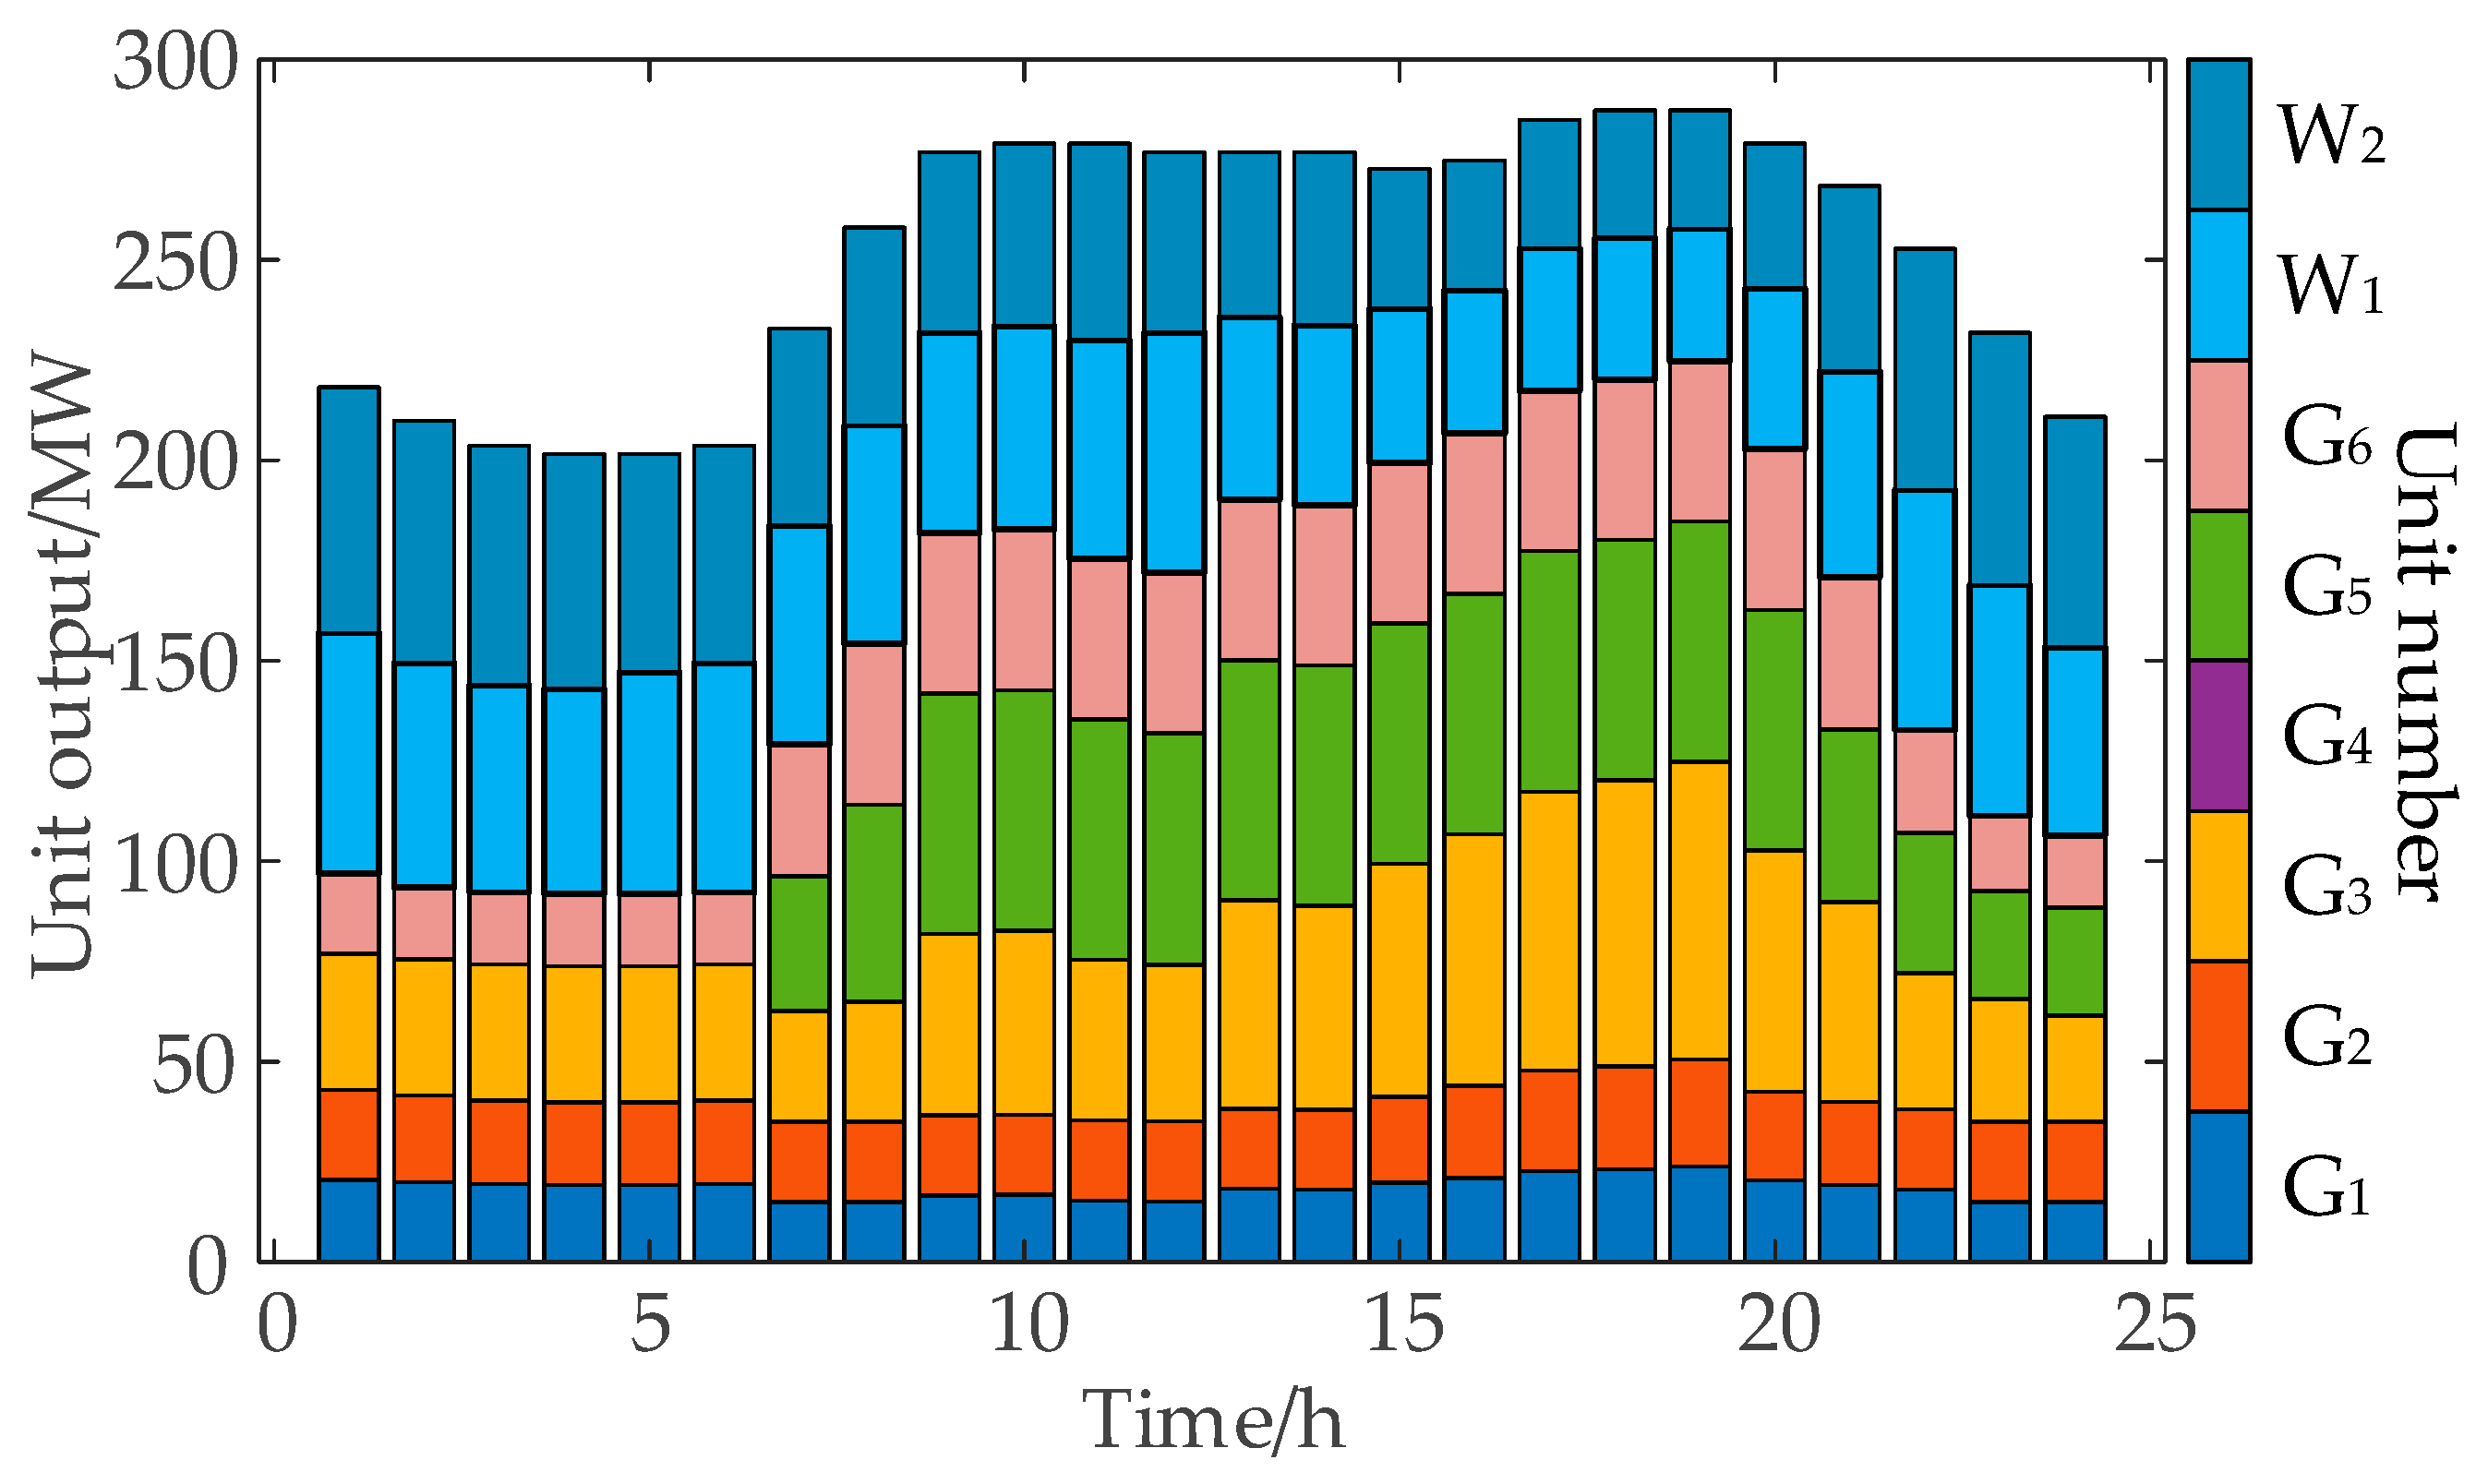
Figure 6 shows the output schedule for each generating unit. It can be observed that the operational states of G1 and G2 remain stable, consistently operating at low output levels. This is due to their higher startup and shutdown costs. To avoid incurring additional expenses from frequent startups and shutdowns, the system typically keeps these units at their minimum output levels. The continuous and stable operation of G1 and G2 reflects the system’s strategy of prioritizing high startup/shutdown cost units in low-load scenarios to maintain economic efficiency. After the 7th period, as the load increases significantly, G5 starts operating, and G6’s output also rises substantially. This indicates that the growth in load demand directly drives the activation of these units. Since G6 has a lower startup cost, the system can quickly bring it online to address the increased load, showcasing the system’s flexibility in adjusting to load fluctuations. It is worth noting that while G3’s output level is relatively low, it remains online throughout. Given G3’s relatively high bid price, the system prioritizes dispatching lower-cost units such as G6 and G5 when responding to load changes, avoiding increasing G3’s output whenever possible. This characteristic reflects the system’s strategy of not prioritizing high-priced units at the beginning of a demand increase; instead, such units are considered for output increase only when other lower-cost units cannot meet the load demand. This scheduling strategy helps to effectively control the overall system cost during high-load periods.
Figure 6.
Unit output plan.
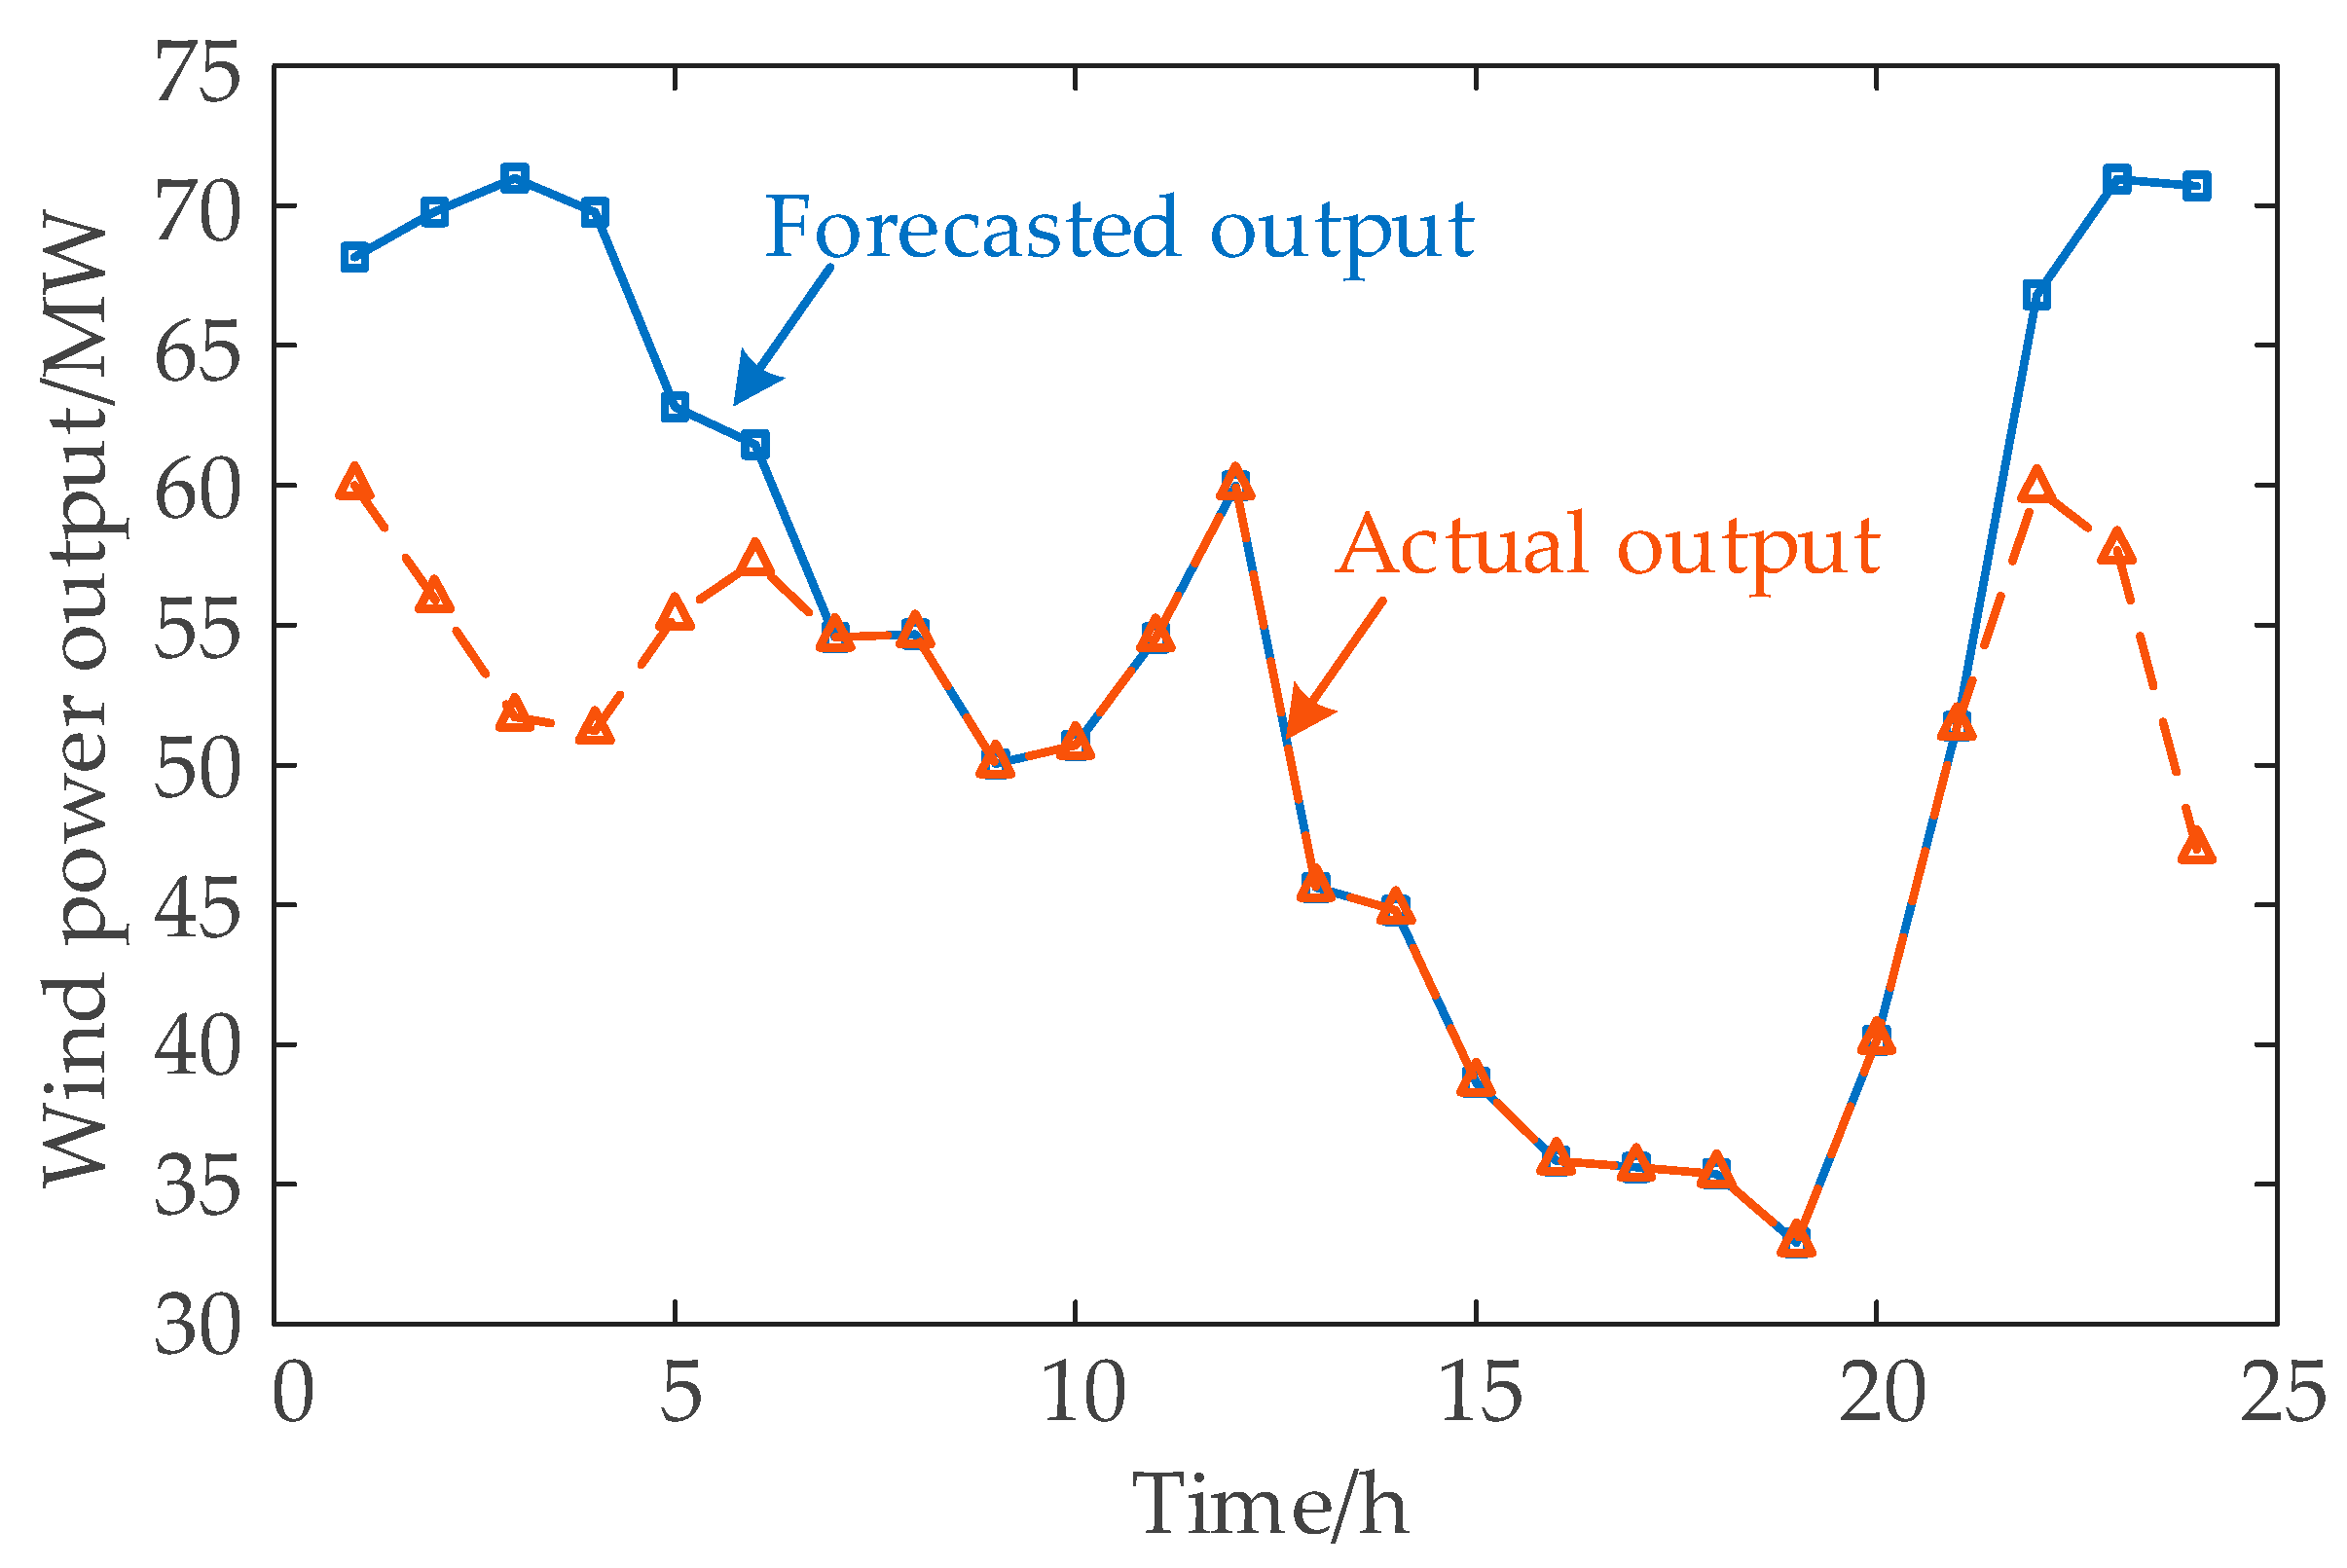
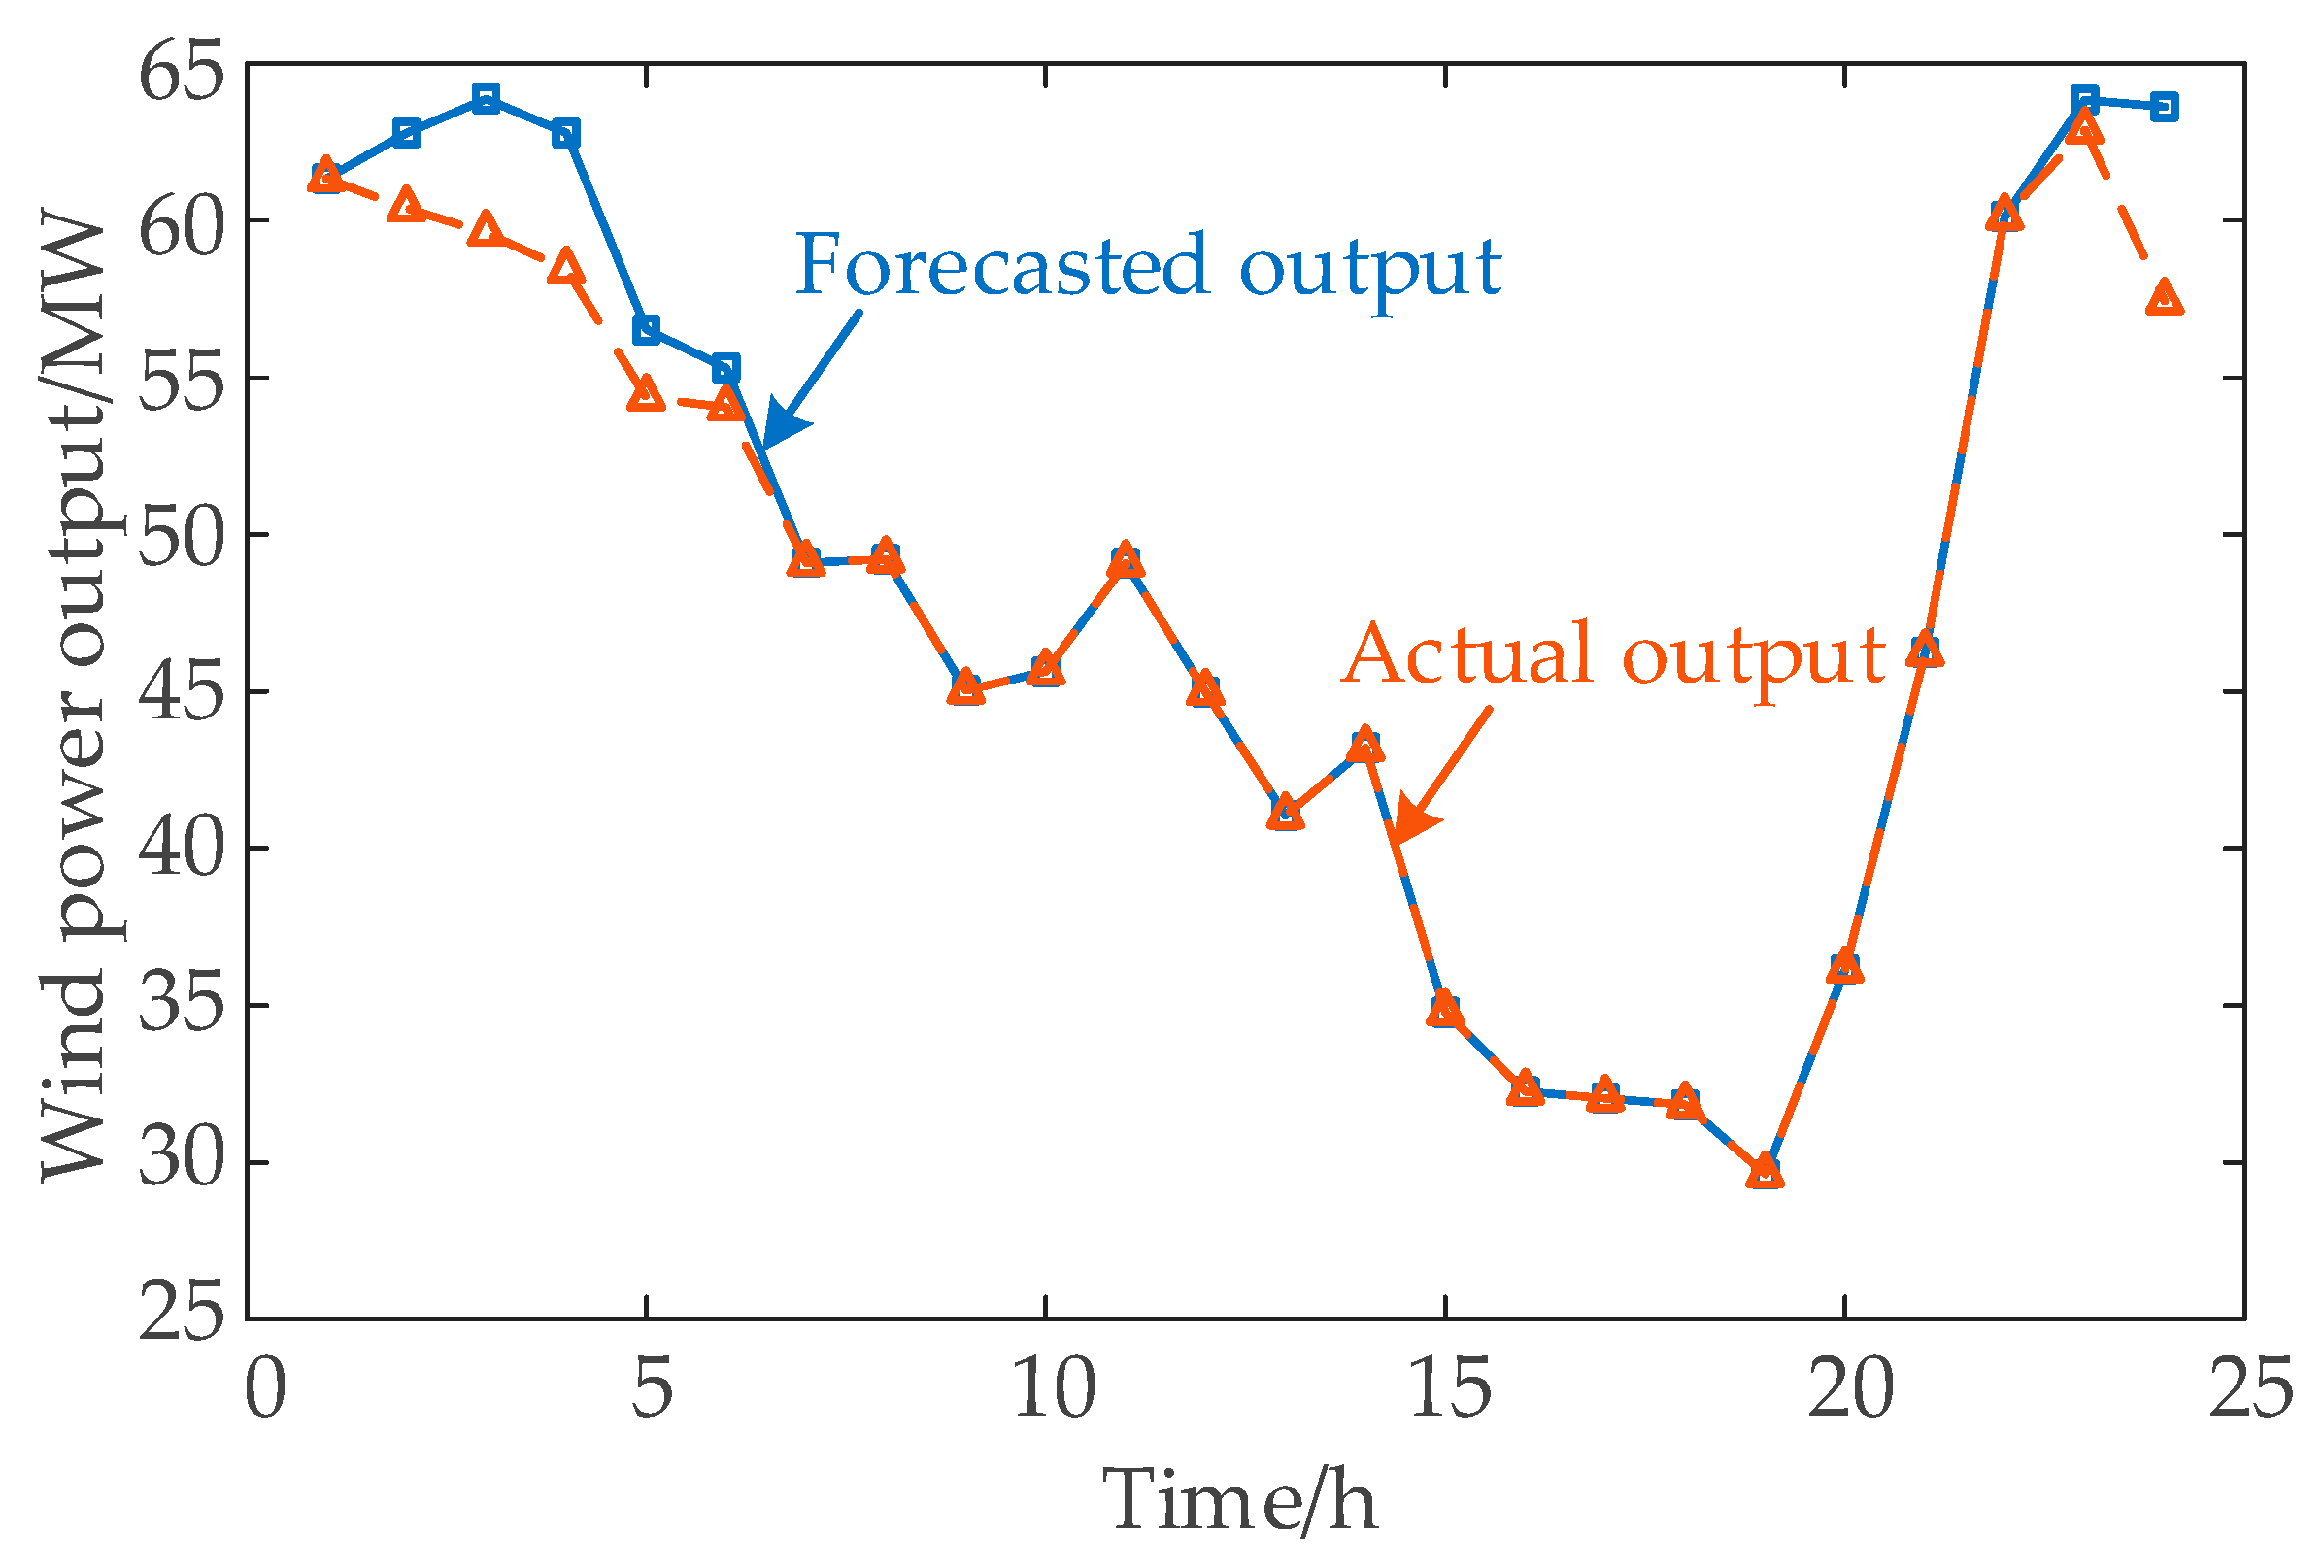
Figure 7 and Figure 8 show the comparison between the forecasted and actual outputs for wind power units W1 and W2. From 0:00 to 6:00, there is a significant difference between the forecasted and actual wind power outputs. This is because the system’s load demand is low during this period, and the wind power output is relatively abundant, allowing the system to fully utilize these wind resources. From 7:00 to 21:00, the forecasted and actual wind power outputs are closely aligned. This is due to the higher load demand during this period, where the system prioritizes wind power dispatch, but still relies on coal-fired units to meet the remaining gap. The wind power utilization and penetration rates are 94.43% and 38.38%, respectively, indicating that the wind power units are operating at high efficiency and play a significant role in the system’s electricity supply.
Figure 7.
Comparison between predicted and actual output of wind turbine unit W1.
Figure 8.
Comparison between predicted and actual output of wind turbine unit W2.
3.2.2. Nodal Prices and Economic Benefits
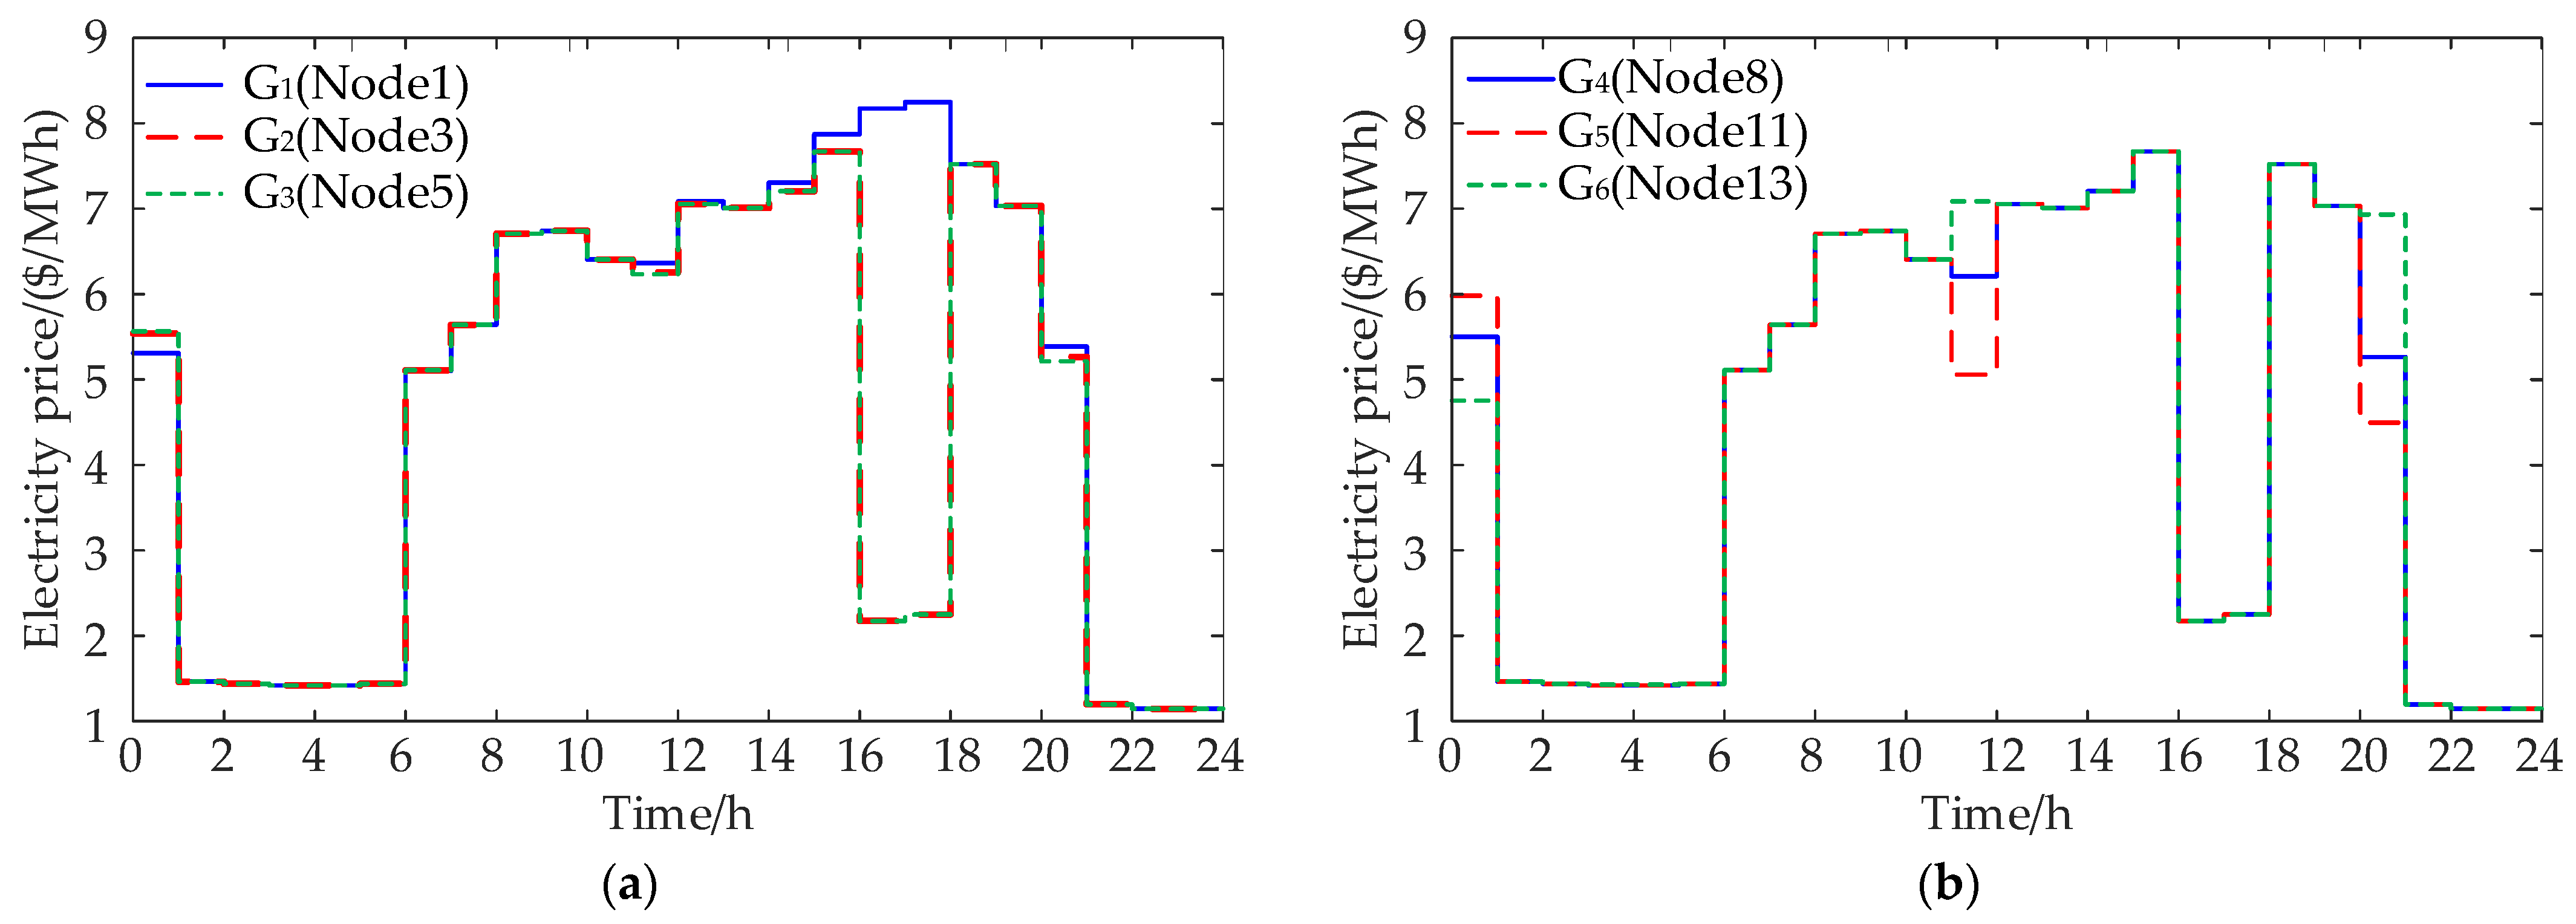
Figure 9 shows the nodal prices for coal-fired units. It is evident that the prices exhibit clear peak and valley characteristics over time. During peak load periods (8 AM to 8 PM), nodal prices are generally high, with some nodes (e.g., G1, G3) reaching peak values of 6–8 USD/MWh, reflecting the system’s high demand for generation resources at these times. During off-peak hours (12 AM to 6 AM and 10 PM to 12 AM), the prices drop significantly to 1–2 USD/MWh, indicating a relaxed supply–demand balance after load decreases. Spatially, there are price differences between nodes, such as G3 (node 5) and G4 (node 8), which have slightly higher prices during certain periods. This is due to factors like network topology, transmission line capacity limits, and load density, suggesting that transmission congestion affects nodal prices.
Figure 9.
Node electricity price for thermal power units. (a) G1, G2, G3; (b) G4, G5, G6.
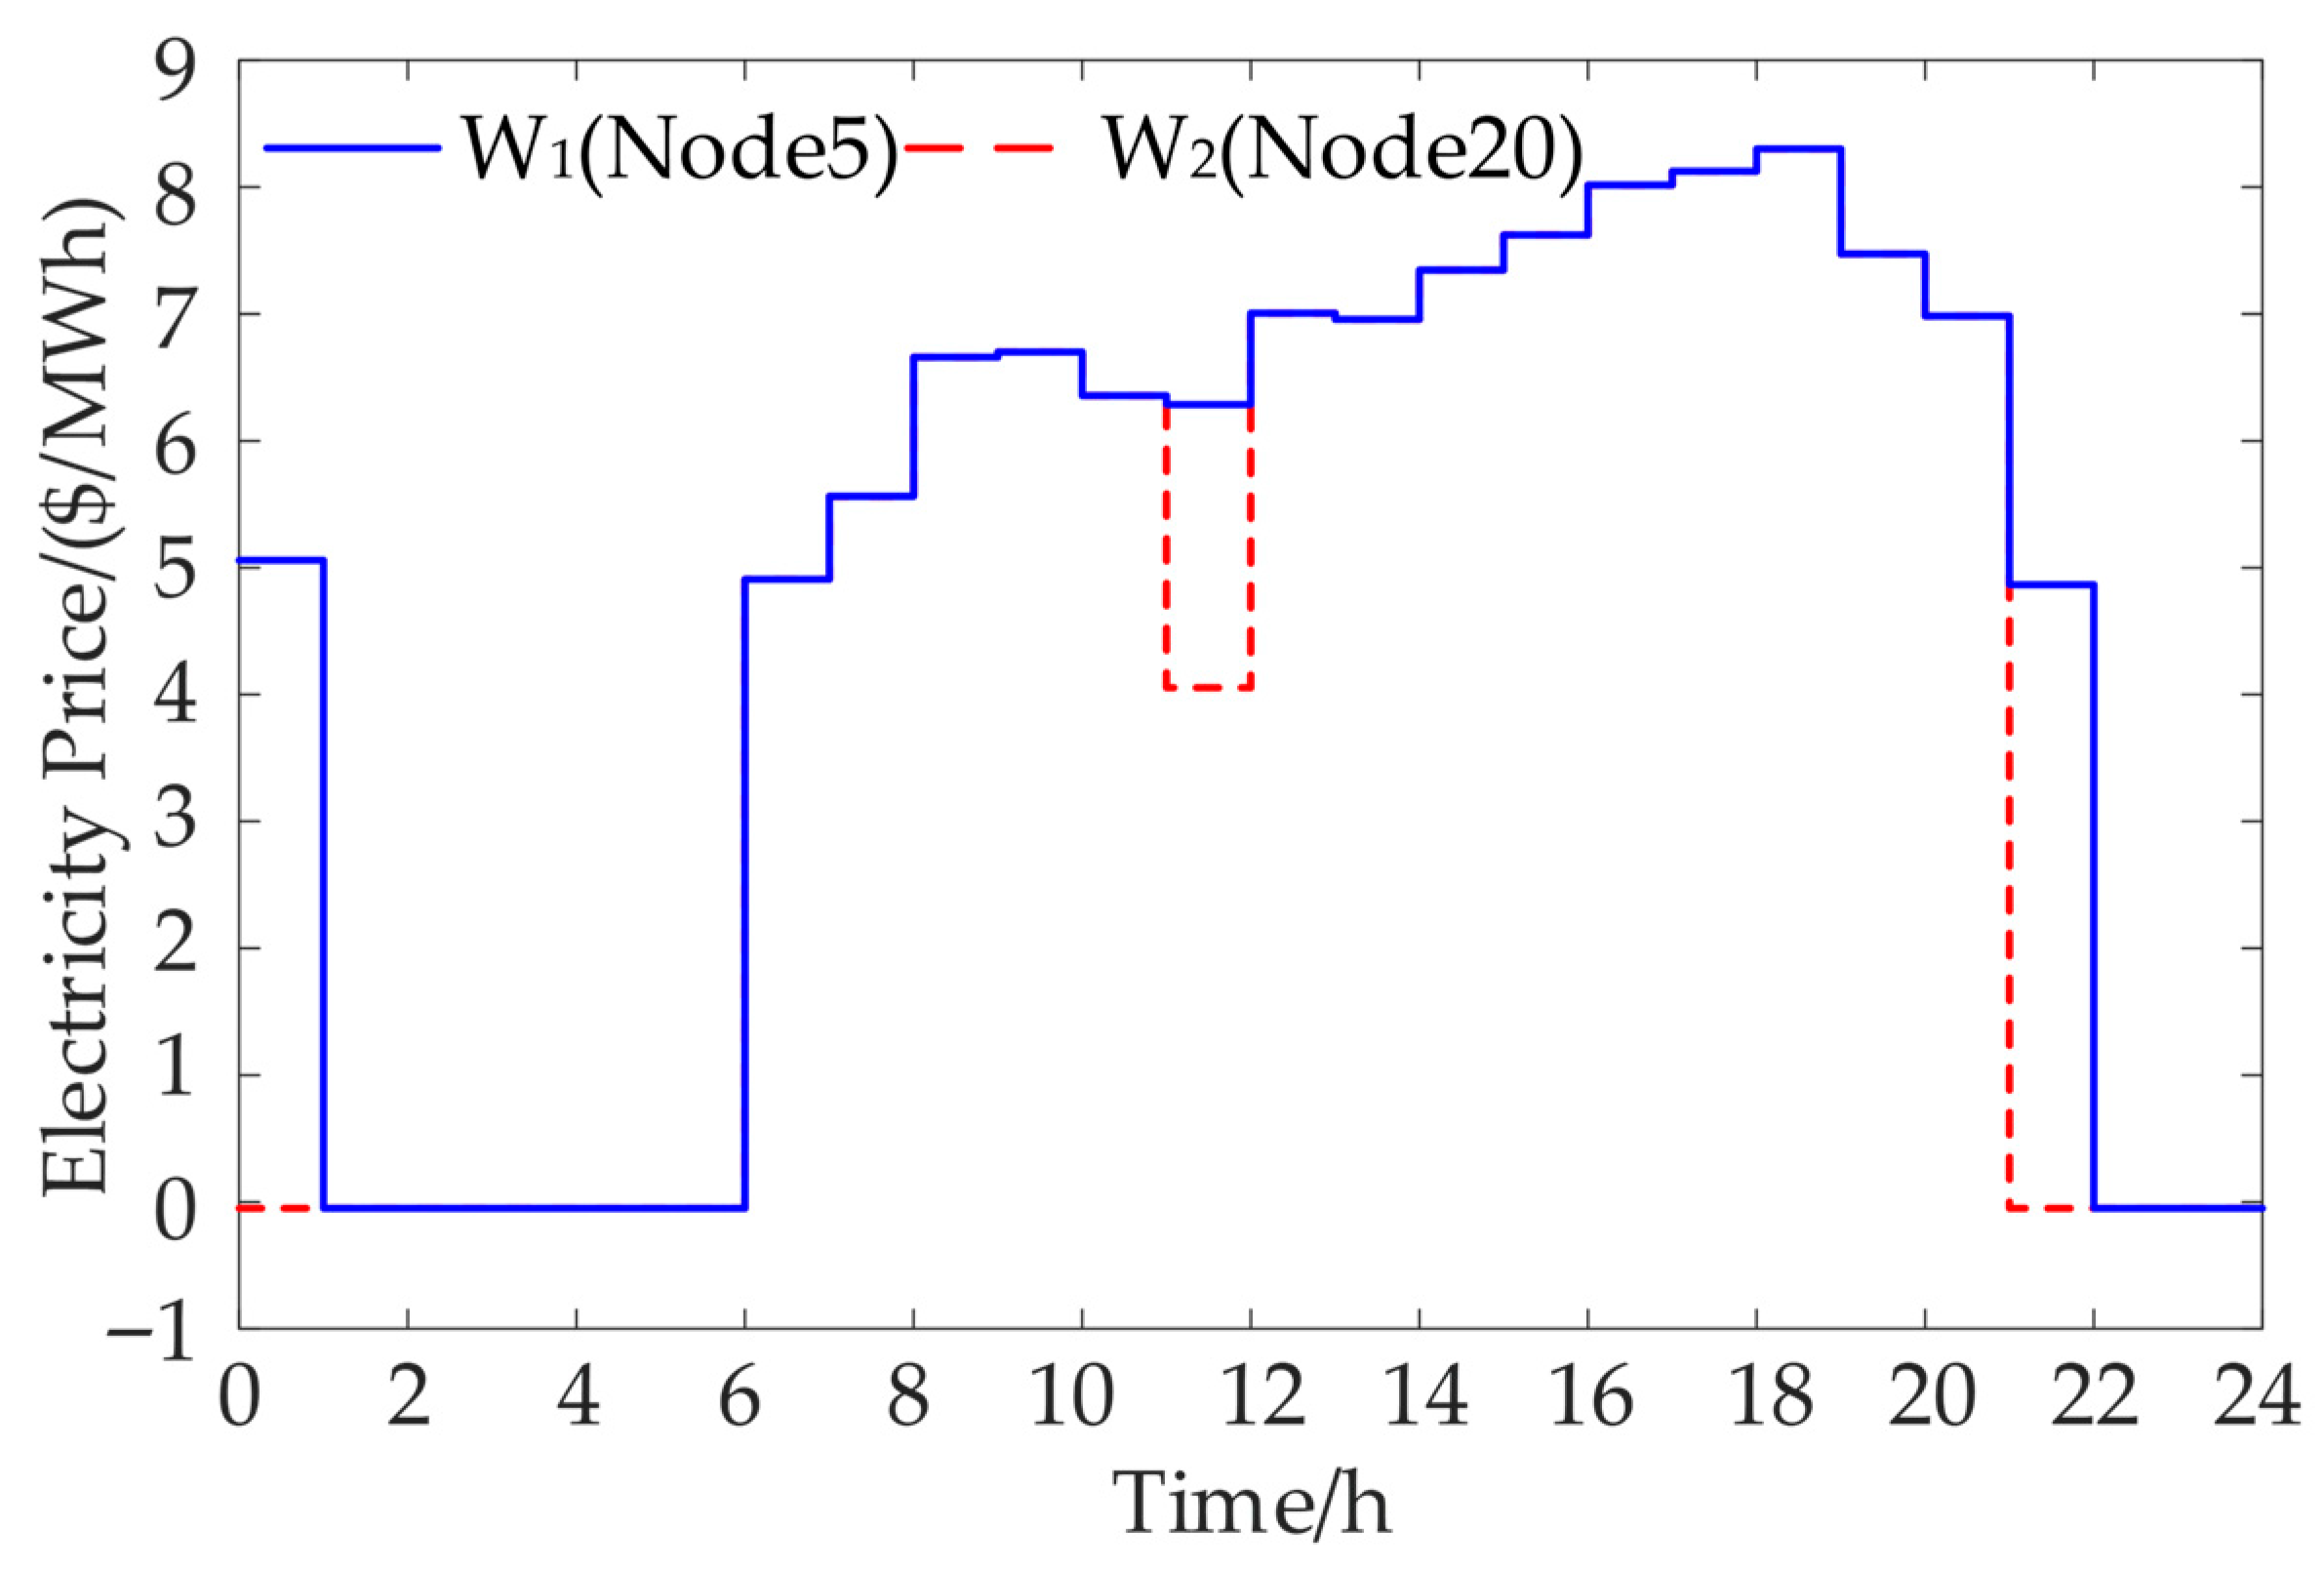
Figure 10 displays the nodal prices for wind power units. As seen, the nodal prices for wind power units exhibit clear periodical fluctuations. The price curves for W1 (node 5) and W2 (node 20) remain high (6–8 USD/MWh) during the peak load period (8 AM to 8 PM), which aligns with the trend of coal-fired unit nodal prices, indicating that wind power has a higher market value during peak load periods. Notably, W2 (node 20) experiences sharp price drops, even approaching zero, during certain periods (e.g., around 12 PM and 9 PM). This is due to the sufficient wind power output during these times, leading to local oversupply, combined with transmission bottlenecks preventing effective delivery, causing a significant drop in nodal prices. This phenomenon highlights the risk of wind curtailment and market price volatility under high wind power penetration, exacerbated by insufficient grid flexibility and transmission constraints.
Figure 10.
Node electricity price for wind turbine.
Table 2 presents the reserve capacity clearing prices for thermal power units. The results show that the upward reserve price exhibits remarkable stability, staying within the range of 0.138–0.140 $/MWh throughout the day. This indicates that the system’s upward adjustment capacity is ample, and market competition is strong. In contrast, the downward reserve price shows significant fluctuations, with sharp peaks and valleys: during low-load periods, such as 1 AM, the price rises to a peak of 6.131 $/MWh, while during high-load periods, such as 6 PM, the price drops to 0.023 $/MWh. This pronounced price divergence highlights the supply–demand imbalance in the system’s adjustment capacity: during late-night hours, when units operate at low output, downward adjustment flexibility is extremely scarce, resulting in a significant price premium; during the daytime, when units have more output headroom, downward adjustment capacity is abundant, and the price decreases accordingly.
Table 2.
Reserve Capacity Clearing Price.
Table 3 presents the economic benefits results for generating units. From the perspective of system cost composition, the total cost is $20,971.72, with fuel cost accounting for $18,633.67, approximately 89% of the total, representing the primary expenditure. Start-up and shut-down costs of $2200 reflect the adjustment requirements for units responding to load fluctuations. Reserve costs of $131.22 comprise a relatively small portion, indicating economical allocation of regulation resources. Wind curtailment penalty costs of only $6.83 demonstrate favorable wind power accommodation with effective control of energy waste. Regarding generation revenue, thermal units earned a total of $2882.04, with reserve revenue of $1467.52 slightly exceeding energy revenue of $1414.52, reflecting the market value of thermal units in providing ancillary services. Wind power units achieved significantly higher revenue of $9563.59, benefiting from zero fuel costs and higher market prices. Overall, the clearing results demonstrate a well-balanced system optimization among economic efficiency, security, and renewable energy integration, providing valuable insights for dispatch strategy optimization and system flexibility enhancement.
Table 3.
Economic benefits of generator set clarification results.
The wind power reserve demand coefficient is used to characterize the correlation between renewable energy accommodation and system reserve demand. The higher the wind power uncertainty in the system, the greater the demand for reserve capacity [30]. Therefore, the wind power reserve coefficient can serve as a quantitative indicator of wind power uncertainty. Table 4 presents the impact of wind power reserve demand on market clearing results. The results show that when wind power reserve demand increases with intensified wind power uncertainty, both wind power utilization rate and penetration rate exhibit a downward trend, while total system operating costs rise and total generation revenue decreases. This indicates that wind power uncertainty weakens the system’s wind power accommodation capability and reduces the economic efficiency of system operation.
Table 4.
Impact of wind power reserve demand on market clearing outcomes.
4. Discussion
For discussion, this paper presents a promising joint energy–reserve clearing model, but it also has certain limitations that need to be addressed in future research. The current model’s validation relies on the IEEE 30-bus test system, and its moderate scale may limit the generalizability of the quantitative conclusions to larger, real-world systems. Additionally, this study focuses on the joint clearing paradigm and has not conducted formal benchmark comparisons with sequential clearing or pure energy market designs. As a result, the marginal benefits of co-optimization—including cost savings, wind curtailment reduction, and price efficiency improvement—have not been fully quantified. Moreover, the analysis uses a single representative load curve, which does not capture diverse operating conditions such as peak demand and seasonal variations. Therefore, future research should extend to larger-scale test networks to verify the model’s scalability, implement systematic comparisons with alternative market designs such as sequential clearing, and include diverse load scenarios for a comprehensive assessment of model performance. Furthermore, adapting the proposed mechanism to other high coal-fired power markets undergoing energy transitions—such as India, Southeast Asia, and Eastern Europe—will enhance the applicability of the study and provide valuable insights for adjusting market design parameters in different regulatory environments and generation structures.
5. Conclusions
Addressing the challenges of insufficient reserve capacity allocation and wind power uncertainty-induced security and economic concerns under high wind power penetration, this paper develops an integrated energy–reserve market clearing model for regional electricity markets and validates its effectiveness and practicality through case simulations, yielding the following key conclusions:
- The proposed day-ahead joint energy–reserve clearing model establishes a comprehensive clearing mechanism encompassing market participant bidding, SCUC unit commitment, SCED economic dispatch, nodal marginal price calculation, and market settlement. This achieves deep coordination between energy and reserve ancillary service markets, providing a scientific and efficient market-based dispatch solution for power systems operating under high wind penetration conditions.
- The joint clearing model effectively coordinates the dynamic balance between wind power accommodation and system reserve requirements. The model comprehensively incorporates multi-dimensional constraints including power balance, unit output and ramping limits, reserve allocation requirements, and network power flow security, achieving optimal system operating cost allocation while ensuring grid security and stability.
- The nodal marginal pricing mechanism accurately characterizes the spatiotemporal supply–demand characteristics and network security constraints of electricity markets. Nodal prices calculated using the Lagrangian multiplier method exhibit significant peak–valley fluctuation patterns across time periods, with price differentials among nodes clearly reflecting the impact of transmission congestion on market clearing outcomes. This provides transparent and reasonable price signals to market participants, effectively guiding the optimal allocation of generation and consumption resources.
Author Contributions
Conceptualization, P.Z. and Z.F.; Methodology, P.Z. and X.L.; Software, X.C.; Validation, Y.L. and J.F.; Formal analysis, J.L.; Investigation, X.C. and Y.L.; Resources, Z.F.; Data curation, J.F. and J.L.; Writing—original draft preparation, P.Z.; Writing—review and editing, X.L. and Z.F.; Visualization, X.C.; Supervision, Z.F.; Project administration, Z.F.; Funding acquisition, Z.F. All authors have read and agreed to the published version of the manuscript.
Funding
This work is supported by the Science and Technology Project of State Grid Shanxi Electric Power Co., Ltd. “Capacity Adequacy Mechanism Design and Key Technologies for New Power System” (No. 52053024003G).
Data Availability Statement
The original contributions presented in this study are included in the article. Further inquiries can be directed to the corresponding authors.
Conflicts of Interest
Author Peng Zou is employed by Shanxi Power Exchange Center Co., Ltd. The company had no role in the design of the study; in the collection, analyses, or interpretation of data; in the writing of the manuscript; or in the decision to publish the results. This work was funded by the Science and Technology Project of State Grid Shanxi Electric Power Co., Ltd. The funder had no role in the design of the study; in the collection, analyses, or interpretation of data; in the writing of the manuscript; or in the decision to publish the results.
References
- Valuva, C.; Chinnamuthu, S.; Khurshaid, T.; Kim, K.-C. A Comprehensive Review on the Modelling and Significance of Stability Indices in Power System Instability Problems. Energies 2023, 16, 6718. [Google Scholar] [CrossRef] [Scilit]
- Fang, Z.; Huang, Z.; Xue, Y.; Fu, J.; Zhang, Y.; Yang, X.; Fan, J. Impacts of terminal voltage control on stability of power synchronization control in grid-forming converter connected to low-impedance grid. IEEE Trans. Power Electron. 2025, 41, 5962–5974. [Google Scholar] [CrossRef] [Scilit]
- Guo, Z.; Pinson, P.; Chen, S.; Yang, Q.; Yang, Z. Chance-Constrained Peer-to-Peer Joint Energy and Reserve Market Considering Renewable Generation Uncertainty. IEEE Trans. Smart Grid 2021, 12, 798–809. [Google Scholar] [CrossRef] [Scilit]
- Huang, Z.; Fang, Z.; Fu, J.; Wang, Z.; Zhang, Y.; Xue, Y.; Fan, Y.; Shu, Y. Analytical evaluation of voltage stability based on stability region boundary and probability transformation method. IEEE Trans. Sustain. Energy 2025, 1–14. [Google Scholar] [CrossRef] [Scilit]
- Tang, Z.; Liu, Y.; Wu, L.; Liu, J.; Gao, H. Reserve Model of Energy Storage in Day-Ahead Joint Energy and Reserve Markets: A Stochastic UC Solution. IEEE Trans. Smart Grid 2021, 12, 372–382. [Google Scholar] [CrossRef] [Scilit]
- Wang, C.; Ni, M.; Shi, Y.; Zhang, L.; Li, W.; Li, X. Optimizing Power Market Clearing with Segmented Electricity Prices: A Bilevel Model. Sustainability 2023, 15, 13575. [Google Scholar] [CrossRef] [Scilit]
- Chen, L.; Hao, W.; Cheng, Z. A Co-Optimization Method for Energy Storage Participating Day-Ahead Energy and Reserve Market. In Proceedings of the 2024 4th Power System and Green Energy Conference (PSGEC), Shanghai, China, 24 August 2024; pp. 430–436. [Google Scholar]
- Liu, Y.; Chen, M.; Fan, Y.; Ying, L.; Cui, X.; Zou, X. Design of a Stochastic Electricity Market Mechanism with a High Proportion of Renewable Energy. Energies 2024, 17, 3044. [Google Scholar] [CrossRef] [Scilit]
- National Energy Administration Releases National Power Industry Statistics for January–August 2025. Available online: https://www.nea.gov.cn/20250926/2e8ea0184702461f8531527b015964d5/c.html (accessed on 26 December 2025).
- Liang, J.; Liu, D.; Shi, L.; Zhao, X.; Zhang, C.; Meng, Q.; Hao, Z.; Wang, C. Design of Medium- and Long-term Reserve Capacity Market Mechanisms to Accommodate the Participation of New Types of Entities. Power Syst. Technol. 2025, 1–16. [Google Scholar] [CrossRef]
- Yuan, K.; Zhang, K.F.; Zheng, Y.X.; Li, D.; Wang, Y.; Yang, Z. Irregular distribution of wind power prediction. J. Mod. Power Syst. Clean Energy 2018, 6, 1172–1180. [Google Scholar] [CrossRef] [Scilit]
- Zou, P.; Cui, X.; He, X.; Jing, Z.; Zhang, C.; Cheng, X.; Sun, T.; Ye, W. Design and Practice of Power Reserve Ancillary Service Market Mechanism of Shanxi in China. Power Syst. Technol. 2024, 48, 2490–2501. [Google Scholar]
- He, Y.; Chen, Q.; Fei, Y.; Fu, C.; Chang, Y.; Pang, Y.; Zou, L.; Ke, Y. Typical foreign ancillary service market products and enlightenment to China. Power Syst. Technol. 2018, 42, 2915–2922. [Google Scholar]
- Al-Abdullah, Y.; Sahraei-Ardakani, M. Analysis of reserve relaxations in electric energy markets. Electr. Power Syst. Res. 2016, 141, 460–466. [Google Scholar] [CrossRef] [Scilit]
- Gomez, T.; Herrero, I.; Rodilla, P.; Escobar, R.; Lanza, S.; de la Fuente, I.; Llorens, M.L.; Junco, P. European Union electricity markets: Current practice and future view. IEEE Power Energy Mag. 2019, 17, 20–31. [Google Scholar] [CrossRef] [Scilit]
- Papavasiliou, A.; Cartuyvels, J.; Bertrand, G.; Marien, A. Implementation of scarcity pricing without co-optimization in European energy-only balancing markets. Util. Policy 2023, 81, 101488. [Google Scholar] [CrossRef] [Scilit]
- Cui, X.; Zou, P.; Yin, K.; Long, Z.; Jing, C.; Cheng, X.; Li, R. Research on Interconnection Mechanism Between Reserve and Spot Power Markets. Guangdong Electr. Power 2024, 37, 90–97. [Google Scholar]
- Zhou, H.; Hu, Y.; Nie, Y.; He, X.; Zhao, H.; Xia, Q.; Lai, X.; Dong, C. Co-optimization Model of Energy and Reserve Auxiliary Service for Regional Interconnected Power Grid. Power Syst. Technol. 2020, 44, 991–1001. [Google Scholar]
- Chen, Z.; Fu, B.; Qiu, F.; Yang, Z.; Yang, Y.; Liu, H. Bidding Strategy for Independent Energy Storage Participating in The Day-Ahead Energy and Reserve Joint Market. Power Demand Side Manag. 2025, 27, 57–63. [Google Scholar]
- Liu, Y.; Zhang, Z.; Yin, Z.; Sun, C. Analysis on Coupling Mechanism of Joint Clearing Electricity Prices in Electric Power Energy and Ancillary Service Markets. Autom. Electr. Power Syst. 2024, 48, 76–86. [Google Scholar]
- Chen, W.; Yuan, S. Analysis of Bidding Strategies in Joint Energy-Ancillary Service Markets Considering Participation of Virtual Power Plants with Concentrated Solar Power. Integr. Intell. Energy 2025, 1–11. Available online: https://link.cnki.net/urlid/41.1461.TK.20251124.1606.008 (accessed on 26 December 2025).
- Xiao, Y.; Mou, Y.; Pan, B.; Jin, L. Design of color-coded pricing for electric vehicle aggregators participating in energy-reserve markets. Electr. Power Eng. Technol. 2025, 44, 13–24. [Google Scholar]
- Sun, G.; Hua, D.; Chen, H.; Zhang, C.; Xi, P. A joint clearing model of power energy and reserve ancillary service market considering flexible load. Guangdong Electr. Power 2020, 33, 1–11. [Google Scholar]
- Li, H.; Li, C.; Zhu, C.; Wang, G. SCED model and interval optimization considering uncertain wind power. Electr. Energy Manag. Technol. 2019, 21, 63–69. [Google Scholar]
- Chen, X.; Xu, Q.; Yang, Y. Day-ahead optimized economic dispatch of CCHP microgrid considering wind power uncertainty. Electr. Power Constr. 2020, 41, 107–113. [Google Scholar]
- Habibi, M.; Vahidinasab, V.; Pirayesh, A.; Shafie-Khah, M.; Catalao, J.P.S. An enhanced contingency-based model for joint energy and reserve markets operation by considering wind and energy storage systems. IEEE Trans. Ind. Inform. 2021, 17, 3241–3252. [Google Scholar] [CrossRef] [Scilit]
- Mi, Z.; Jia, Y.; Wang, J.; Zheng, X. Optimal Scheduling Strategies of Distributed Energy Storage Aggregator in Energy and Reserve Markets Considering Wind Power Uncertainties. Energies 2018, 11, 1242. [Google Scholar] [CrossRef] [Scilit]
- Bai, L.; Wu, F.; Ye, L.; Cai, C.; Lei, X. Joint clearing model of the power spot market considering wind power uncertainty. Integr. Intell. Energy 2025, 47, 73–83. [Google Scholar]
- Ma, Y. Research on Day-Ahead Market Clearing Model Considering Inertia Demand. Master’s Thesis, Donghua University, Shanghai, China, 2025. [Google Scholar]
- Yang, F.; Yang, Z. Inter-Provincial Energy-Reserve Co-Optimization Clearing Method Considering Tie-Line Capacity Reservation for Reserve. Trans. China Electrotech. Soc. 2025. ahead of print. [Google Scholar] [CrossRef]
Disclaimer/Publisher’s Note: The statements, opinions and data contained in all publications are solely those of the individual author(s) and contributor(s) and not of MDPI and/or the editor(s). MDPI and/or the editor(s) disclaim responsibility for any injury to people or property resulting from any ideas, methods, instructions or products referred to in the content. |
© 2026 by the authors. Licensee MDPI, Basel, Switzerland. This article is an open access article distributed under the terms and conditions of the Creative Commons Attribution (CC BY) license.