Article

Evaluation of a Company’s Media Reputation Based on the Articles Published on News Portals

by
Algimantas Venčkauskas
,
Vacius Jusas
* and
Dominykas Barisas
Department of Computer Science, Kaunas University of Technology, LT-51390 Kaunas, Lithuania
*
Author to whom correspondence should be addressed.
Appl. Sci. 2026, 16(4), 1987; https://doi.org/10.3390/app16041987
Submission received: 15 January 2026 / Revised: 12 February 2026 / Accepted: 13 February 2026 / Published: 17 February 2026
(This article belongs to the Special Issue Multimodal Emotion Recognition and Affective Computing)

Abstract

A company’s reputation is an important, intangible asset, which is heavily influenced by media reputation. We developed a method to measure a company’s reputation based on sentiments detected in online articles. The sentiment of each sentence was evaluated and categorized into one of three polarities: positive, negative, or neutral. Then, we developed another method to assess a company’s media reputation using all available online articles about the company. The company’s media reputation is presented as a tuple consisting of their media reputation on a scale from 0 to 100, the number of articles related to the company, and the margin of error. Experiments were conducted using articles written in Lithuanian published on major news portals. We used two different tools to assess the sentiments of the articles: Stanford CoreNLP v.4.5.10, combined with Google API, and the pre-trained transformer model XLM-RoBERTa. Google API was used for translation into English, as Stanford CoreNLP does not support the Lithuanian language. The results obtained were compared with those of existing methods, based on the coefficients of media endorsement and media favorableness, showing that the results of the proposed method are less moderate than the coefficient of media favorableness and less extreme than the coefficient of media endorsement.

1. Introduction

Reputation is as important to companies as it is to individuals. A company’s reputation is considered a vital intangible asset that includes brand equity, product and service quality, customer relationships, supplier relationships, and community standing [1]. Reputation is not inherent; to build it, a company must invest in marketing and advertising. To reflect the importance of media coverage in building this asset, Deephouse [2] coined the term “media reputation” in 2000, defining it as “the overall evaluation of a firm presented in the media” (p. 1097).
In a general sense, a company’s reputation is referred to as its corporate image. Vito [3] distinguished four different methods commonly used to assess corporate reputation in the literature: corporate reputation ranking, structured questionnaires, third-party indices, and media coverage. Structured questionnaires are the most common method, used in 33% of cases. In contrast, media coverage analysis remains relatively understudied, accounting for only 10% of cases. However, media reporting on companies is widespread. Since the internal workings of a company are often a “black box” to the public, media coverage is the main tool reducing information asymmetry regarding a company’s actions [4]. Opinions are often expressed using sentiment-laden words [5], which serve as a primary mechanism by which the media impacts readers’ perceptions. These words subtly influence readers to form judgments about a subject. For example, the positive or negative framing of events provides a visible public expression of approval or disapproval of companies. Thus, in addition to sharing information, business journalists also disseminate their own perceptions.
The tone of a company’s media coverage—the aggregate sentiment of articles—reflects a difficult-to-quantify assessment of a company’s fundamentals [6]. Positive media coverage is likely to increase credibility and trust among consumers. Over time, positive media sentiment makes a company’s offerings more attractive to existing and potential customers, thereby driving sales growth. Therefore, media reputation is a strategic resource and driving force behind a company’s overall reputation.
Modern media can be divided into two broad groups: articles published on news portals; social media. To date, research has primarily focused on sentiment analysis in social media [5,7,8]. Very few studies have assessed the media reputation of companies based on articles published on news portals. Therefore, our study focuses on this underexplored area.
The contributions of this paper are as follows:
  • Providing a systematic literature review of methods that assess the media reputation of companies based on online news articles;
  • Proposing a novel method to measure an article’s reputation index;
  • Creating and implementing a method to measure the media reputation of companies, which can be easily adapted to any language;
  • Collecting news articles from major Lithuanian portals, conducting experiments to measure the media reputation of companies, and comparing the results with those of other existing methods.
The remainder of this paper is organized as follows: Section 2 reviews existing methods for assessing media reputation. Section 3 presents the proposed methods. Section 4 explains the experimental results and compares them with those of different methods. Finally, Section 5 presents the conclusions drawn from this study.

2. Review of Related Work

Content and sentiment analysis methodologies are commonly used to assess media content [2]. Content analysis is one of the most frequently employed methods by media content raters to systematically analyze and categorize information to determine the emotional tone, which can be negative, neutral, or positive. Janis I. L. and Fadner R. H. [9] developed a coefficient of imbalance in 1943 to assess media content during wartime. Content was divided into two groups: relevant (r) and non-relevant (N). Relevant content was divided into three subgroups: favorable (f), unfavorable (u), and neutral (n). Content was favorable if it expressed a positive direction and unfavorable if it expressed a negative direction; if neither, it was categorized as neutral. The formula to calculate the coefficient of imbalance is as follows:
C = f 2 − f ∗ u ( f + u + n ) ( f + u + n + N ) ,   f > u 0 ,   f = u f ∗ u − u 2 ( f + u + n ) ( f + u + n + N ) , f < u  
This research is extremely valuable. The coefficient was defined based on ten criteria, the values of which ranged in the interval [−1, 1]. This coefficient ensured robust standardization across different sample sizes and domains. The coefficient limited outliers, overcoming the influence of anomalous sentiment expressions. However, in current practice, including non-relevant content in the calculation of the coefficient is seen as a flaw in the formula. It is now understood that irrelevant content is innumerable.
One of the first researchers to notice the value of the Janis–Fadner coefficient was Deephouse [10]. He did not criticize the coefficient but derived his own coefficient from theirs called the coefficient of media endorsement (CME), calculated as follows:
C M E = e 2 − e ∗ c ( e + c ) 2 ,   e > c 0 ,   f = u e ∗ c − c 2 ( e + c ) 2 , e < c  
Deephouse [10] used the terms “endorsing” and “challenging”, which correspond to the terms “favorable” and “unfavorable”, respectively. It should be emphasized that neither neutral nor non-relevant units were included. Then, Deephouse [2] presented a new version of the Janis–Fadner coefficient called the coefficient of media favorableness, which is calculated as follows:
C M F = f 2 − f ∗ u ( f + u + n ) ( f + u + n ) ,   f > u 0 ,   f = u f ∗ u − u 2 ( f + u + n ) ( f + u + n ) , f < u  
The coefficient of media favorableness (CMF) reflects the true purpose of the Janis–Fadner coefficient and is appropriate for current research. Moreover, in Formula (3), Deephouse [2] used the same symbols as they were presented in the original research by Janis and Fadner [9]. The adaptation of the Janis–Fadner coefficient went almost unnoticed by the research community; although cited in several works [11,12,13], the version presented tended to be that of Deephouse [2]. For example, Li et al. [14] cited the Janis–Fadner coefficient but used an earlier version provided by Deephouse [10] in 1996. Thus, although the initial work by Janis and Fadner [9] is credited, the modifications proposed by Deephouse [2,10] are often overlooked.
Zhang [15] is one of the few researchers who noticed the contributions of Deephouse. Zhang considered not only the nonlinear coefficient presented by Janis and Fadner [9] and its adaptations provided by Deephouse [2,10] but also the linear function models presented by other scholars to measure media reputation. In total, seven measures were used to investigate a correlation between the existing measures of media reputation and their correlation with corporate reputation. The findings of Zhang are as follows: (1) all pairs of measures were positively correlated, (2) media reputation and corporate financial performance were significantly correlated, and (3) a more accurate measurement of media reputation would enable “a company to more accurately compare its media reputation with those of its competitors” (899p.).
Zhang [16] developed a new measure of media reputation, called the media reputation index, which is a composite measure of media favorability, media visibility, and recency. The formula is expressed as follows:
M R I = w × M F , w = M V + R , M V = ∑ i = 1 n l o g   L × P
where MF—media favorability (the Janis–Fadner coefficient and so on); R—recency; n—number articles; L—length of the article (number of words); and P—prominence to measure the position, where the name of the company appeared (headline, the first paragraph, other places). Formula (4) possesses no qualities inherent to the Janis–Fadner coefficient. While an experiment was conducted, many details were omitted, making it impossible to replicate or interpret the results. While paper [16] has several citations, they are all generic. Moreover, Zhang himself did not cite paper [16] in a related publication [17] even though he examined all known measures of media reputation. As such, the value of Formula (4) is uncertain.
Zhang and Ha [17] compared five measures of media reputation at the attribute level, but they did not include the Janis–Fadner coefficient since it does not a relevant item that could be measured in a news sample at the attribute level. Zhang and Ha [17] argued that the differences in the formulas of these measures and the lack of discussion about these reasons call for an empirical analysis to compare the measures. The authors concluded that the measures identify different values of media reputation; they cannot be substituted for one another. Therefore, to assess media reputation, a single consensus measure needs to be developed.
A second method in the domain of media content analysis is sentiment analysis, which assumes that investors rely on the news media to obtain information about the reputation of companies they are interested in. This method uses natural language processing techniques to automatically determine the emotional tone of news media coverage. Many surveys [5,18,19] on sentiment analysis have been conducted in recent years. However, none of these surveys reviewed articles on media sentiment analysis to assess the reputation of companies. Nevertheless, Misra et al. [20] presented a method that is close to this field: the sentiments of the news article were measured using the event sentiment score (ESS), which was obtained from the RavenPack News Analytics database [21]. The value of the ESS variable is based on an expert coding system. Despite the ESS, this method has several points that can be built upon: (1) the assessment of media sentiment is computed by averaging the ESS values of all news items published during the period considered, (2) the ESS values range from 0 to 100, and (3) news volume is measured as a separate variable. In addition, the average media sentiment is confirmed by other works [22,23]. Also, including the news volume in the analysis is significant, as it is necessary to distinguish one negative news item from multiple negative news articles [24,25].
This review of related work can be summarized as follows: The Janis–Fadner coefficient and its derivatives were used to define media reputation in content analysis. Zhang and Ha [17] concluded that the Janis–Fadner coefficient and its derivatives identify different values of media reputation, and they are not interchangeable. A single consensus measure is needed to assess media reputation. The event sentiment score (ESS) from the RavenPack News Analytics database has been used in sentiment analysis. The relevance of the ESS has been verified in various studies [20,25,26,27]; however, its application has been limited to companies listed in the RavenPack News Analytics database, and an independent measure of sentiment is needed to evaluate the media reputation of companies. Thus, our goal, based on the rich research base of our content analysis, is to develop a measure that can analyze sentiment.

3. Method Used to Measure Media Reputation

Firstly, we introduce a method to measure an article’s reputation index. This method is novel and part of the process used to measure the media reputation of companies.

3.1. Method Used to Measure an Article’s Reputation Index

The steps implemented in the well-known and largely applied Janis–Fadner coefficient for content analysis can be used to develop an article reputation index in sentiment analysis. Zhang [16] attempted to develop a new measure of media reputation. However, his attempt was unsuccessful, since it lost all features inherent to the Janis–Fadner coefficient. Nevertheless, the idea of using the length of an article to calculate the reputation index of an article can be borrowed, as it is important to know the volume of the context in which positive or negative sentiments are expressed. The volume of context is included in the Janis–Fadner coefficient; however, its value is masked by nonlinear calculation. We take Formula (3) as the basis for a new formula that calculates the media reputation index of an article. The goal of our derivation is two-fold: (1) to preserve the properties of the Janis–Fadner coefficient and (2) to explicitly consider the length of the article. We performed several experimental derivations of the formulas before reaching a successful outcome. We divided Formula (3) by the ratio f/(f + u + n), if f > n, which represents the number of favorable sentences compared to the total number of sentences. In the same manner, if f < n, we can divide Formula (3) by the ratio u/(f + u + n), which represents the number of unfavorable sentences compared to the total number of sentences. Thus, the article reputation index is presented as Formula (5):
A R I = f 2 − f ∗ u ( f + u + n ) ( f + u + n ) ÷ f f + u + n ,   f > u 0 ,   f = u f ∗ u − u 2 ( f + u + n ) ( f + u + n ) ÷ u f + u + n , f < u
After manipulating and simplifying Formula (5), we obtain Formula (6):
A R I = f 2 − f ∗ u f + u + n ∗ f ,   f > u 0 ,   f = u f ∗ u − u 2 f + u + n ∗ u , f < u
Next, we prove that Formula (6) retains the features of the Janis–Fadner coefficient with a value in the interval of [−1, 1]. In an extreme case, let us say that all sentences are positive. In this case, the numerator is f2, and the denominator is f ∗ f. Thus, the result is one. A similar situation occurs if all sentences are negative. In this case, the numerator is −u2 and the denominator is u ∗ u. Thus, the final result is −1. If an article contains sentences of different polarities and the number of positive sentences is greater than the number of negative sentences, the value of the numerator will decrease, since f2 − f ∗ u; meanwhile, the value of the denominator will increase, since (f + u + n) ∗ f. The obtained value will be less than one. The same phenomenon occurs if the number of negative sentences is greater than the number of positive sentences. In this case, the obtained value will be greater than −1.
The values of the ESS variable, designed to measure the sentiment score of an event, range on a scale from 0 to 100. Such scaling has been confirmed in various studies [20,25,26,27] and was followed in this study. Therefore, we convert the obtained ARI value to a scale of 0 to 100 according to Formula (7):
A R I % = A R I ∗ 50 + 50
Next, we compare the values of the CMF, CME, and ARI to confirm the suitability of the proposed ARI for assessing an article’s reputation. The comparison was carried out using synthetic values. The scaled values used are shown in Table 1.
Firstly, we must note that the article’s reputation index CME% does not take into account the number of neutral sentences. The article in the second row contains two positive sentences and one negative sentence, meaning that the values of the article’s reputation indices differ. Thus, the value of the article’s reputation index ARI% is 66.67. This proportion means that two-thirds of the article is positive. Meanwhile, the values of the other two indices are 61.11, which is lower than 66.67. The article in the tenth row contains one positive and three negative sentences, meaning that three-quarters of the article is negative. Only ARI% had a value of 25, which is consistent with the tone of the article. Similar reasonings can be applied to each row in Table 1.
Next, Table 2 presents the reputation assessment of real articles dedicated to a real, large and well-known Lithuanian company. The articles were collected from different open access Lithuanian portals. We present the assessment of just a small proportion of these collected articles.
We can observe that the reputation indices of various articles differ as with synthetic data. For instance, the values given in the third row for positive, negative, and neutral sentences are ten times larger than those in the fifth row of Table 1. The values for the reputation indices are the same as in Table 2. In addition, we calculated the average values presented in Table 2 for each column separately. The average reputation index of articles should reflect the reputation value of the company being reported. However, the average value of our proposed reputation index ARI% is less moderate than the coefficient of media favorableness and less extreme than the coefficient of media endorsement. The moderate nature of the values in the CMF% index is explained by its nonlinear dependence on the length of the article. The extremeness of the values derived for the CME% index is due to the lack of consideration of neutral sentiments.

3.2. Description of the Method Used to Measure Media Reputation

During the review of related work, we noticed that several authors [20,25,26,27] used the ESS variable from RavenPack to measure event-related sentiments. When assessing sentiment across multiple events, the average of the ESS variables was calculated to obtain a single overall measure for the company. Since the ESS variable is only available for companies listed in the RavenPack dataset, we propose ARI%, introduced in Section 3.1, as an independent measure of article sentiment. We suggest using an averaging method, such as the application of ESS variables, to assess company reputation based on available articles. The averaging of media sentiment is supported by other studies [22,23]; however, this only yields a summary measurement. For instance, it is also important to know how many elements are included in the average, as it is necessary to distinguish a single negative news article from a high volume of negative news articles [24,25]. The second limitation of the average is that it completely obscures opposite assessments of the sentiment polarity. This effect can be evaluated by calculating the margin of error. Therefore, the media reputation of a company should be based on a combination of variables, including the average of the article’s reputation indices, the total number of articles, and the margin of error.
We approach the problem of assessing a company’s media reputation under the assumption that sentence-level sentiments within an article can be calculated. Our field of application focuses on articles published in open access online news media. The language used in these articles is regulated and less noisy compared to that in social networks, as it is supervised by editors-in-chief and language editors [28,29,30]. Therefore, the methods required to analyze sentiment in news articles on the sentence level are less computationally demanding compared to social media. Existing tools can be used to determine the polarity of sentences, such as Stanford CoreNLP [31], which has been employed by several authors [32,33]. However, the articles in our study are written in Lithuanian, which is not compatible with Stanford CoreNLP. To solve this problem, we utilized Google Translate API. Many researchers [34,35,36,37] expressed the concern that the translation process could alter sentiment polarity. However, experiments revealed that the performance rates of sentiment analysis on the original and translated datasets are comparable. The results obtained showed that translating the input text from a specific language to English and using compatible tools may be better than developing language-specific methods.
To diversify the assessment of sentiment polarity, we used an additional tool, the pre-trained transformer model XLM-RoBERTa, which is the latest development in the field of NLP [38]. XLM-RoBERTa is a large multi-language model trained on 100 languages, including Lithuanian [39], and has outperformed other transformer models on various NLP tasks under low-resource language settings [40].
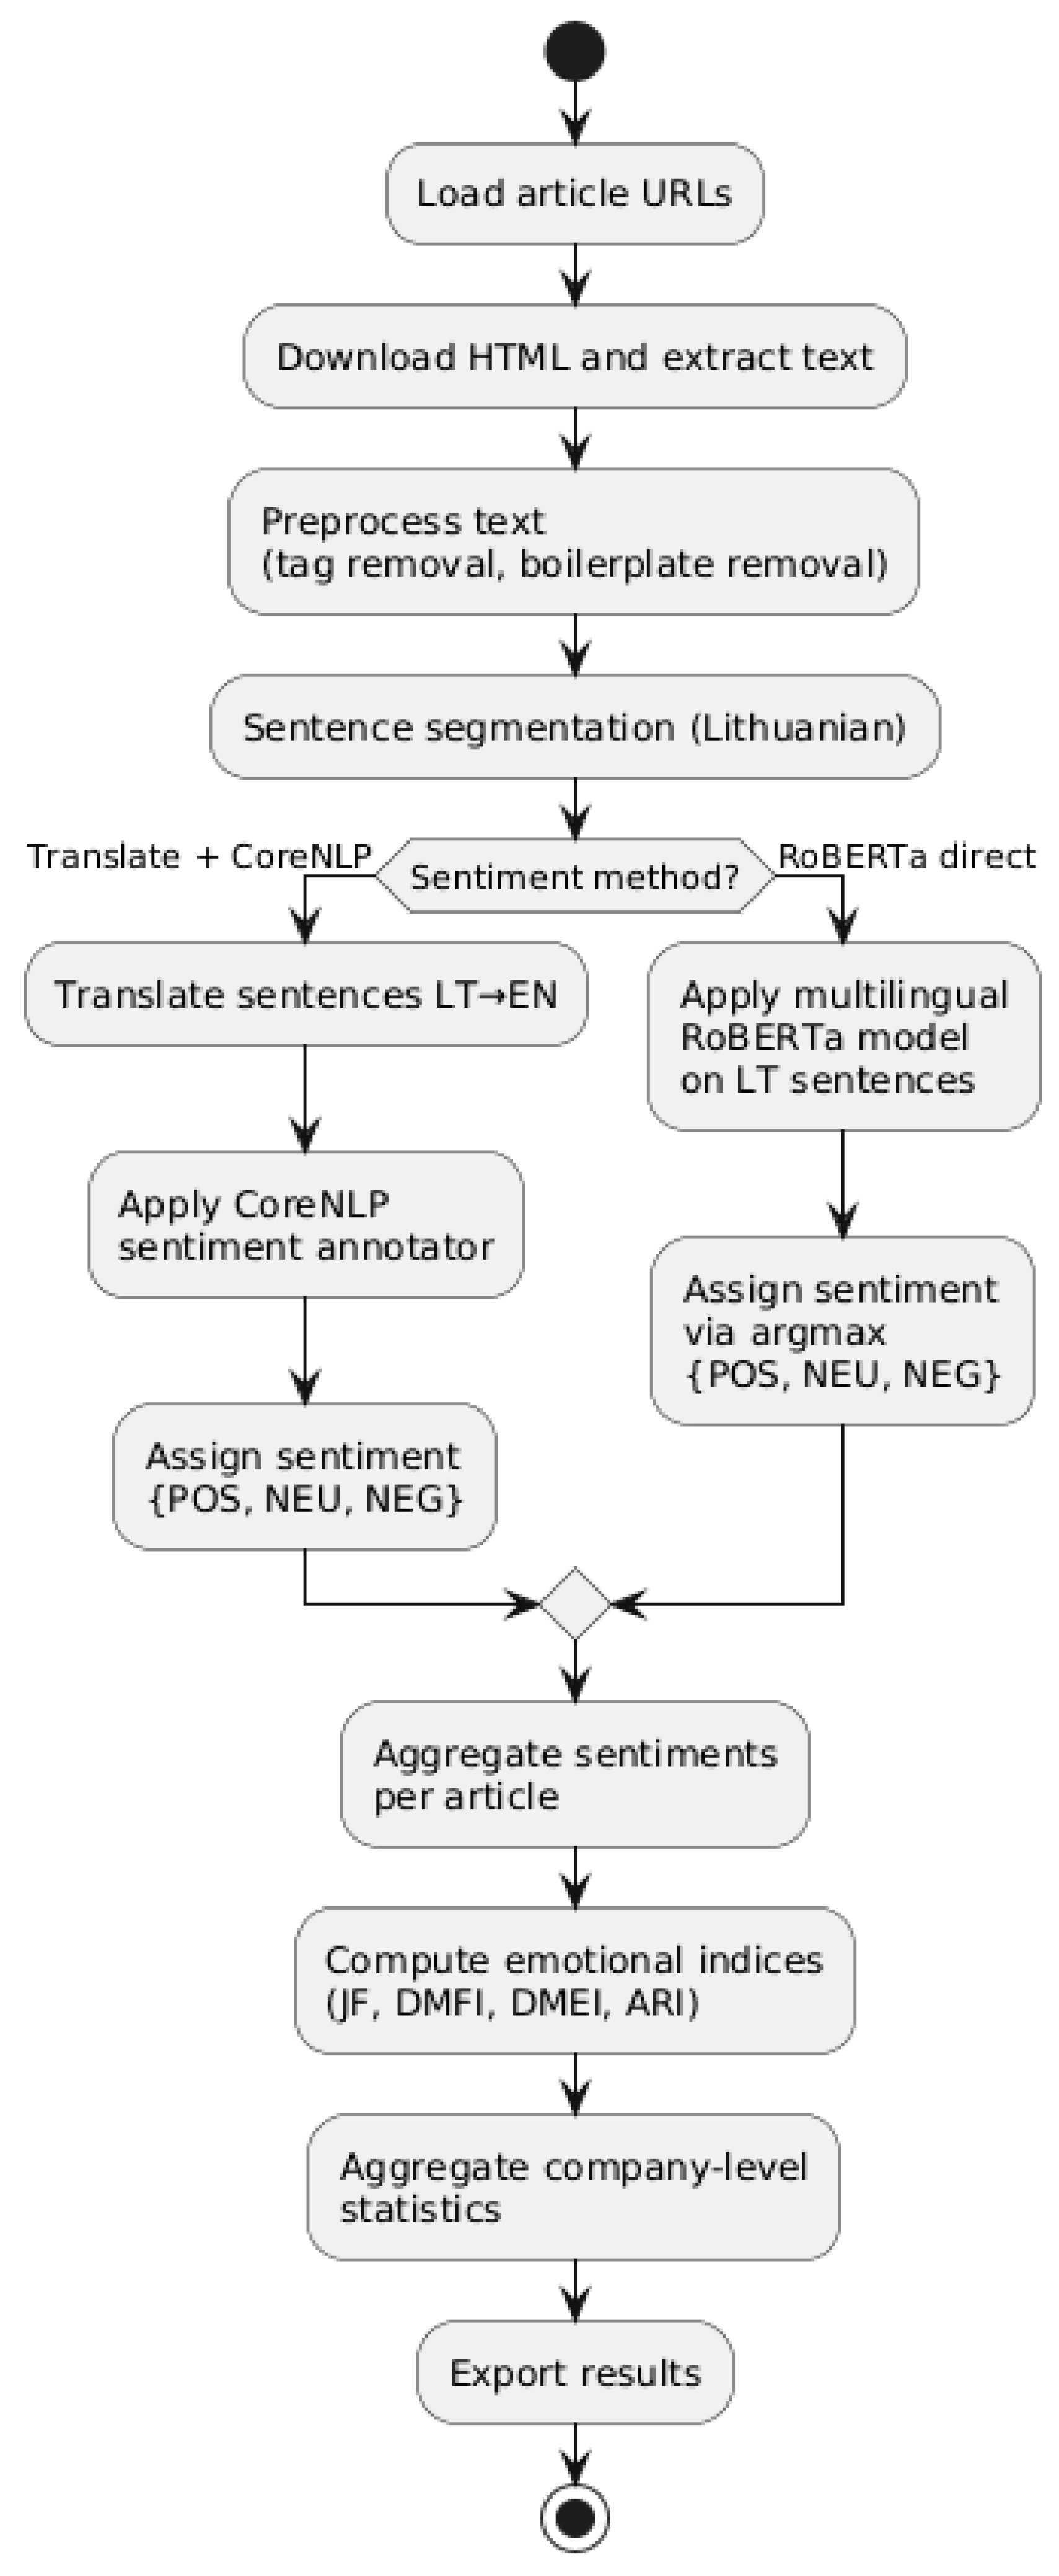
We combined all components of the proposed method in Figure 1, which demonstrates the workflow of the proposed method for determining the media reputation of a specific company. The main steps include article collection, text preprocessing, sentence segmentation, sentence-level sentiment analysis using either CoreNLP with a translated text or a multilingual RoBERTa model, aggregation of sentiments (article level), computation of emotional indices (including ARI), and aggregation of company-level media reputation statistics.
Next, we will discuss the initial steps of the workflow in more detail, as they have not received sufficient attention. During text preprocessing, the first step is the removal of HTML tags. The next step involves segmenting the text into sentences, as all tools assign sentiments to sentences. Sentence segmentation was performed using a deterministic rule-based tokenizer, which temporarily masks dots in short 1–2 letter abbreviations, and a predefined list of words such as “pvz.”, “t.t.”, and “t.y.”. The masked dots are restored after segmentation. Empty segments are removed, and copyright footer phrases are filtered out.

4. Experiment and Discussion

To assess the media reputation of selected companies, we followed the steps defined for the method proposed in Section 3. The first step involves collecting company-related articles published in online Lithuanian media. We collected articles from major open access Lithuanian news portals published over the past two years. The articles were then grouped by company. Larger companies received significantly more media attention than smaller ones, ranging from 36 to 64 and from 6 to 7 articles, respectively. A significant difference in volume was observed across the dataset. Subsequently, we carried out the remaining steps of the proposed method. Company data were anonymized, and the results for the larger and smaller companies are presented in Table 3 and Table 4, respectively.
To confirm the suitability of the proposed article reputation index (ARI), we compared its values with those of the media favorability coefficient (CMF) and the media endorsement coefficient (CME). The values of the CMF, CME, and ARI indices were converted to a scale of 0 to 100 using Formula (7); consequently, these values are denoted as CMF%, CME%, and ARI%. To account for variability in the results, a 95% confidence level [41,42] was chosen, and the corresponding confidence intervals were calculated. The sample size of larger companies (Table 3) was sufficient, i.e., n ≥ 30; therefore, the distribution was assumed to be normal [41]. The values of all indexes and margins of error were rounded to the closest integer value. The sample size of smaller companies (Table 4) was limited, so the distribution of values was checked and observed to be close to normal. We made a cautious assumption that the same formula could be used to calculate the confidence interval.
Let us now discuss the results presented in Table 3. Firstly, from the results summarized in the right-hand column of Table 3, it is surprising to note that the average values of indices CMF% and ARI% do not depend on the sentiment assessment tool. Instead, they are the same for both tools. A small difference is observed only in the CME% index. The average number of positive articles is the same for both tools. XLM-RoBERTa is more moderate than Stanford’s CoreNLP, as the average number of negative articles (two) neared the average number of neutral articles.
For the results of individual companies, there is no correlation between the results of all three indices for each company and the values only correlate individually with the indices. The values of the CMF% index are the same for the following companies: L04, L14, L15, L21, and L23; the values of the CME% index are the same for two companies: L06 and L22; and the values of the ARI% index are the same only for company L22.
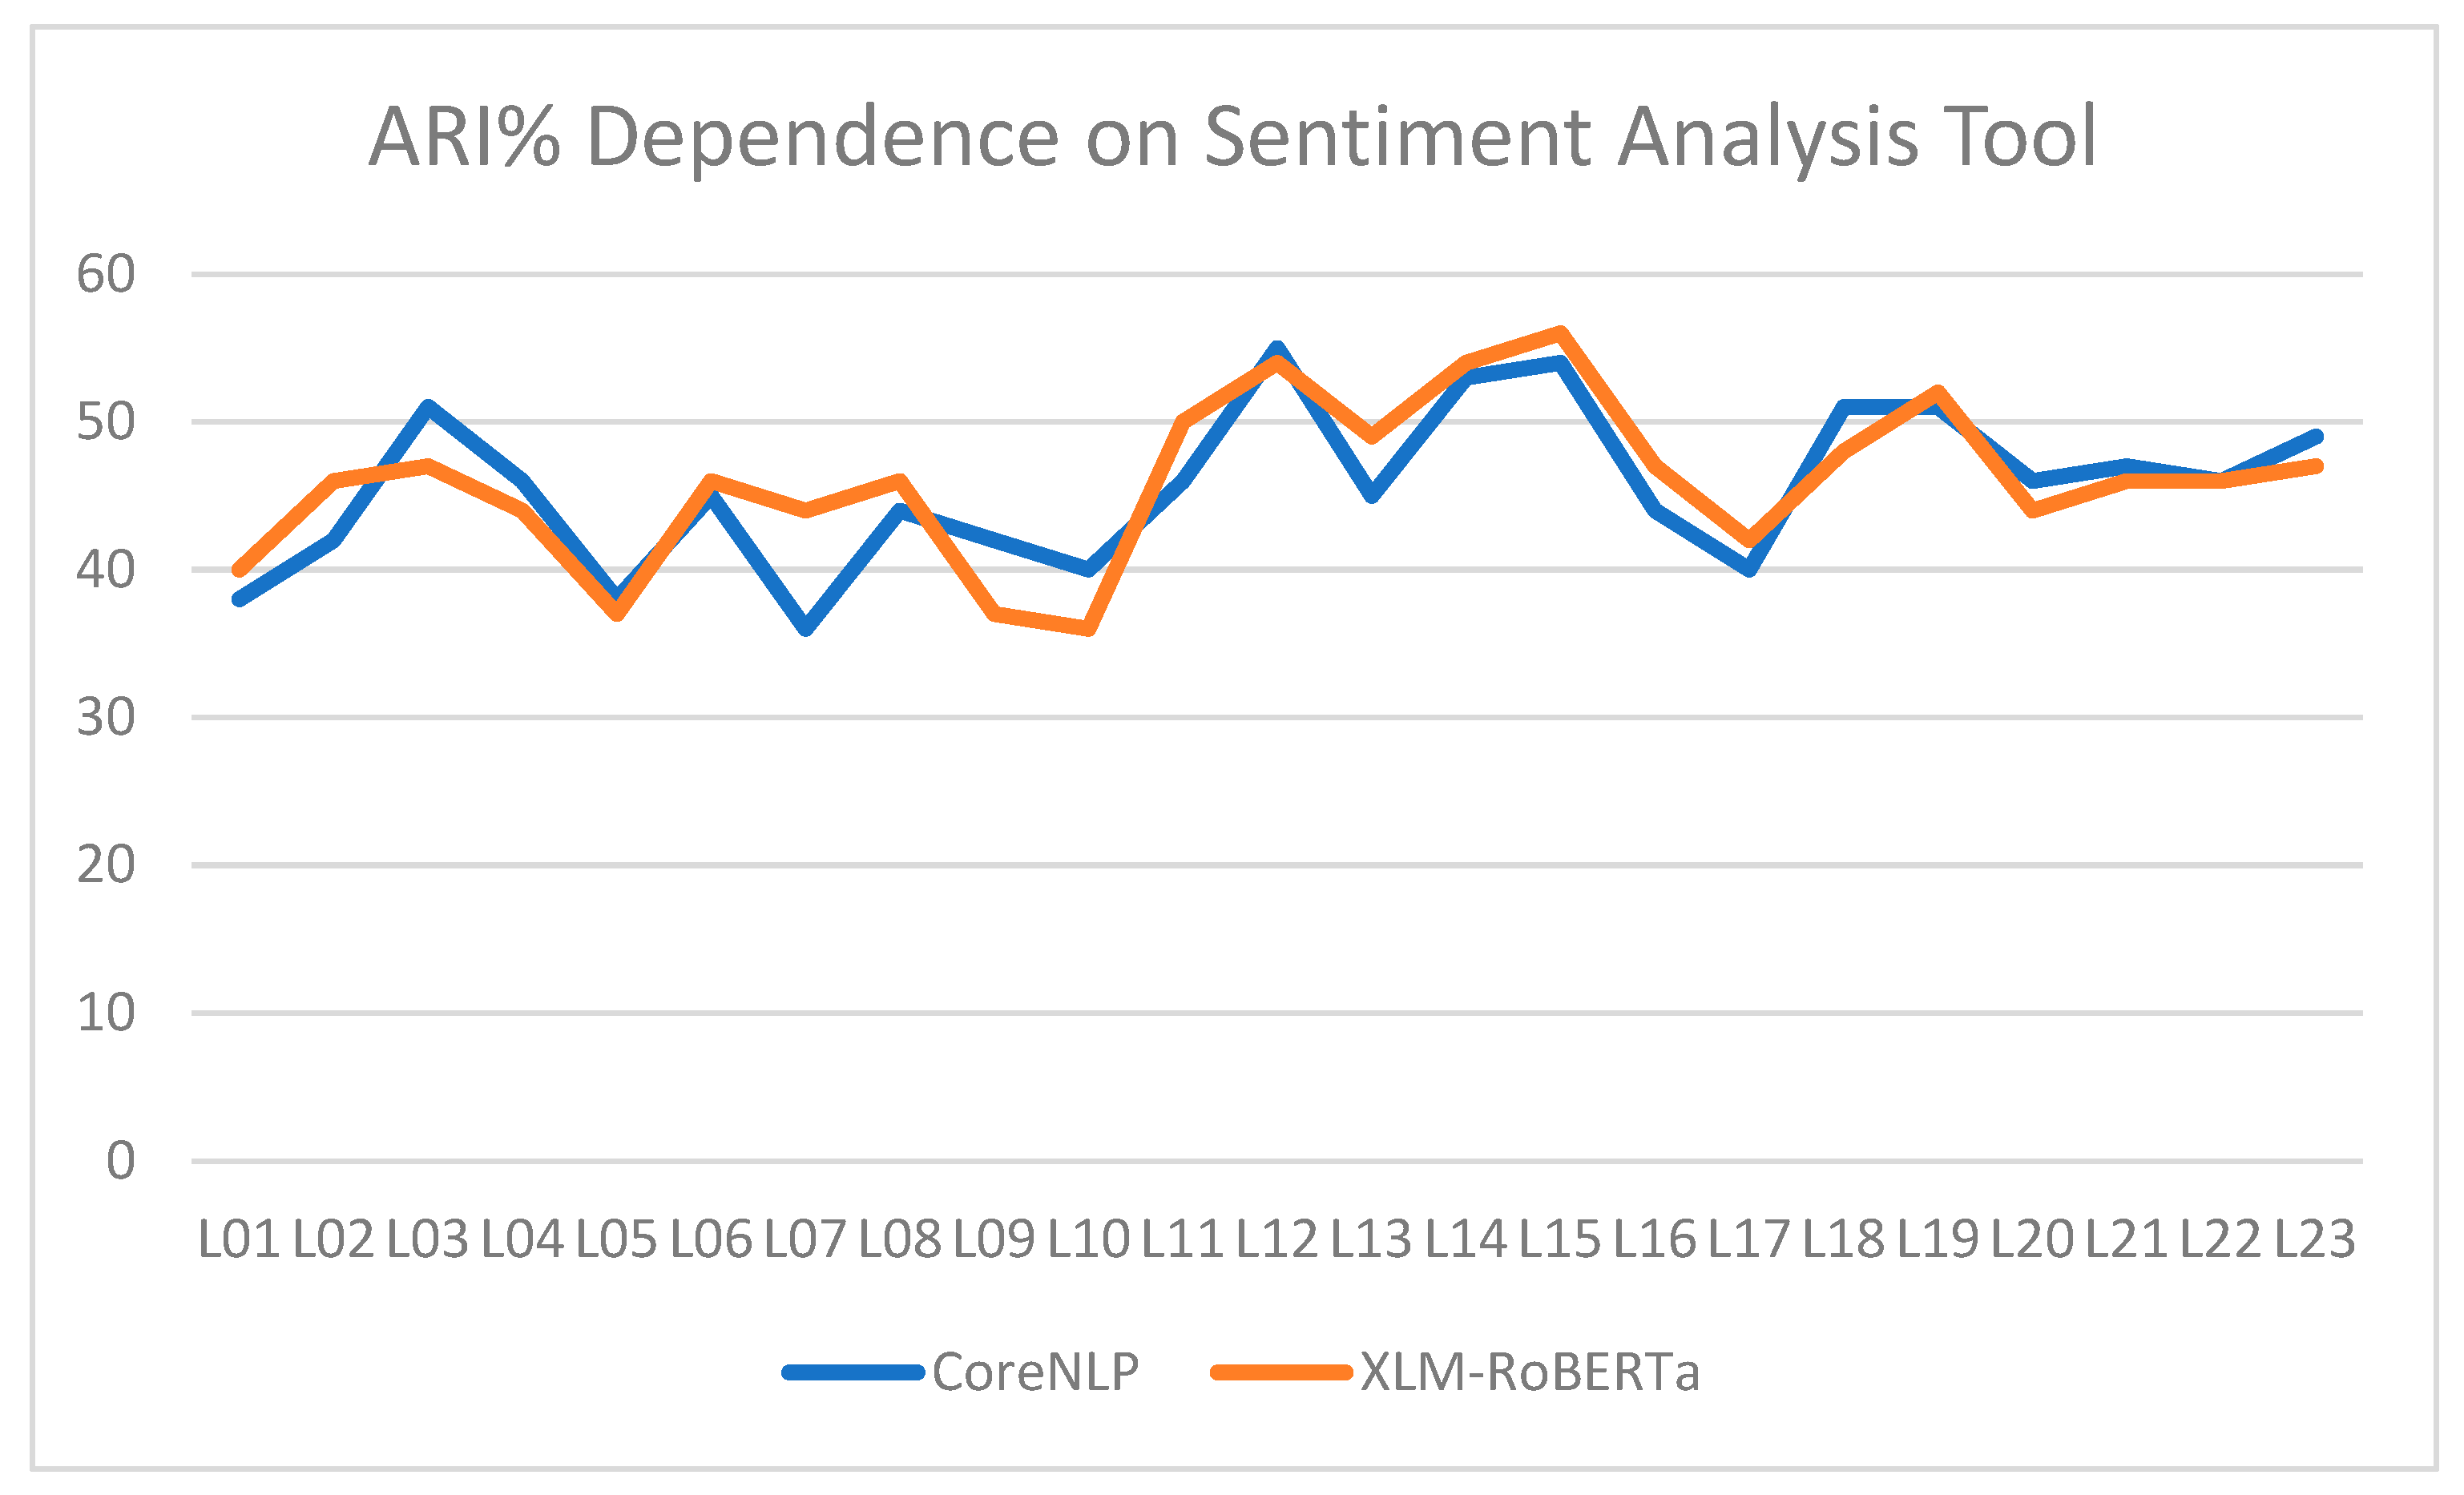
The distribution of ARI% index values across all companies and both sentiment analysis tools is shown in Figure 2. The largest differences are observed for the following companies: L03, L07, L09, and L10. For company L03, the number of positive articles decreased, while the number of negative articles increased in the case of XLM-RoBERTa. The opposite effect is observed for company L07 compared to company L03. The number of positive articles for company L09 became 0 in the case of XLM-RoBERTa. Three of these articles were negative, and the other three were neutral. The number of positive articles and neutral articles for company L10 decreased in the case of XLM-RoBERTa. Evidently, in the case of XLM-RoBERTa, changing the sentiment polarity assessment resulted in different values.
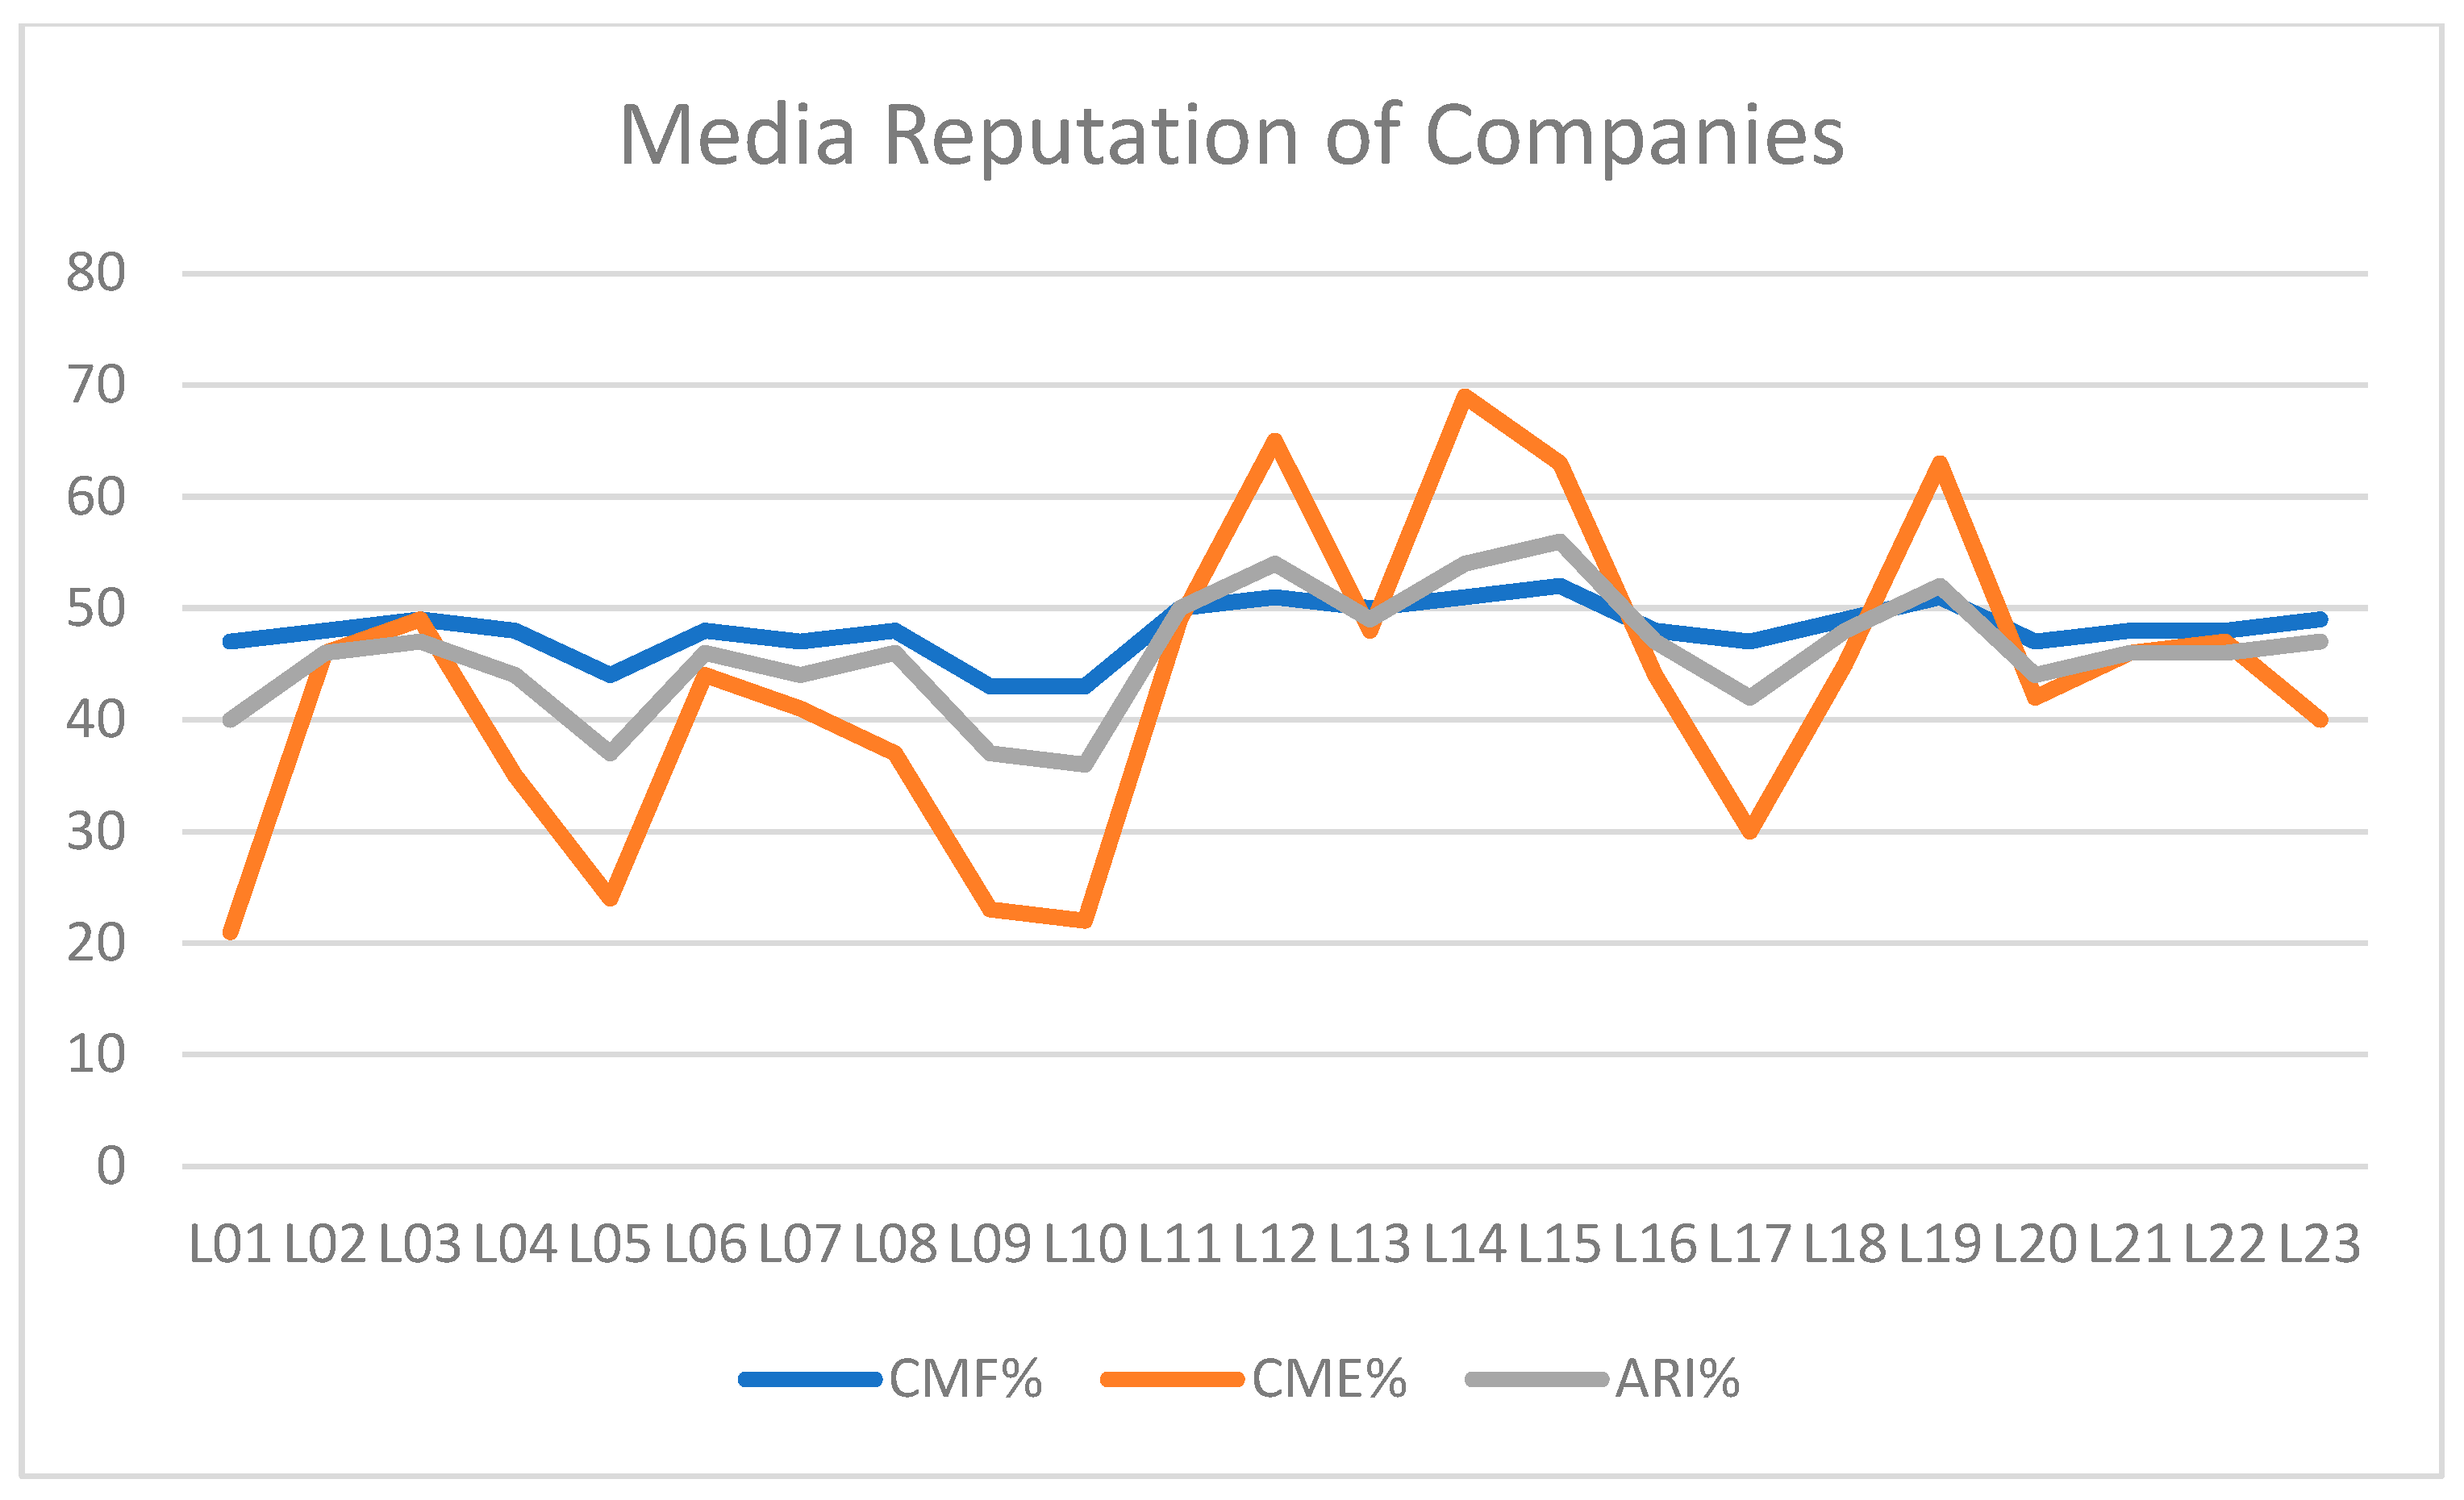
To observe the general tendencies of the indices considered, we conclude that the CMF% index is the most moderate. The values of this index vary the least between the two sentiment analysis tools. In addition, the CMF% index has the smallest margin of error. The range of values for the CME% index is the largest one, with the highest margin of error as well. The increase in the range of values is particularly noticeable for the sentiment analysis tool XLM-RoBERTa. A significant change in sentiment polarity is observed for company L14 between the two sentiment analysis tools. However, this radical change has little effect on the other two indices. The value of our proposed ARI% index increased by one in the case of XLM-RoBERTa compared to CoreNLP, as the number of positive articles increased by four. The CMF% index did not react to this increase in the number of positive articles. We conclude that this index is sensitive to changes in sentiment polarity. The ARI% index responds better to changes in sentiment polarity than the CMF% index, as shown by the increase in positive articles to four.
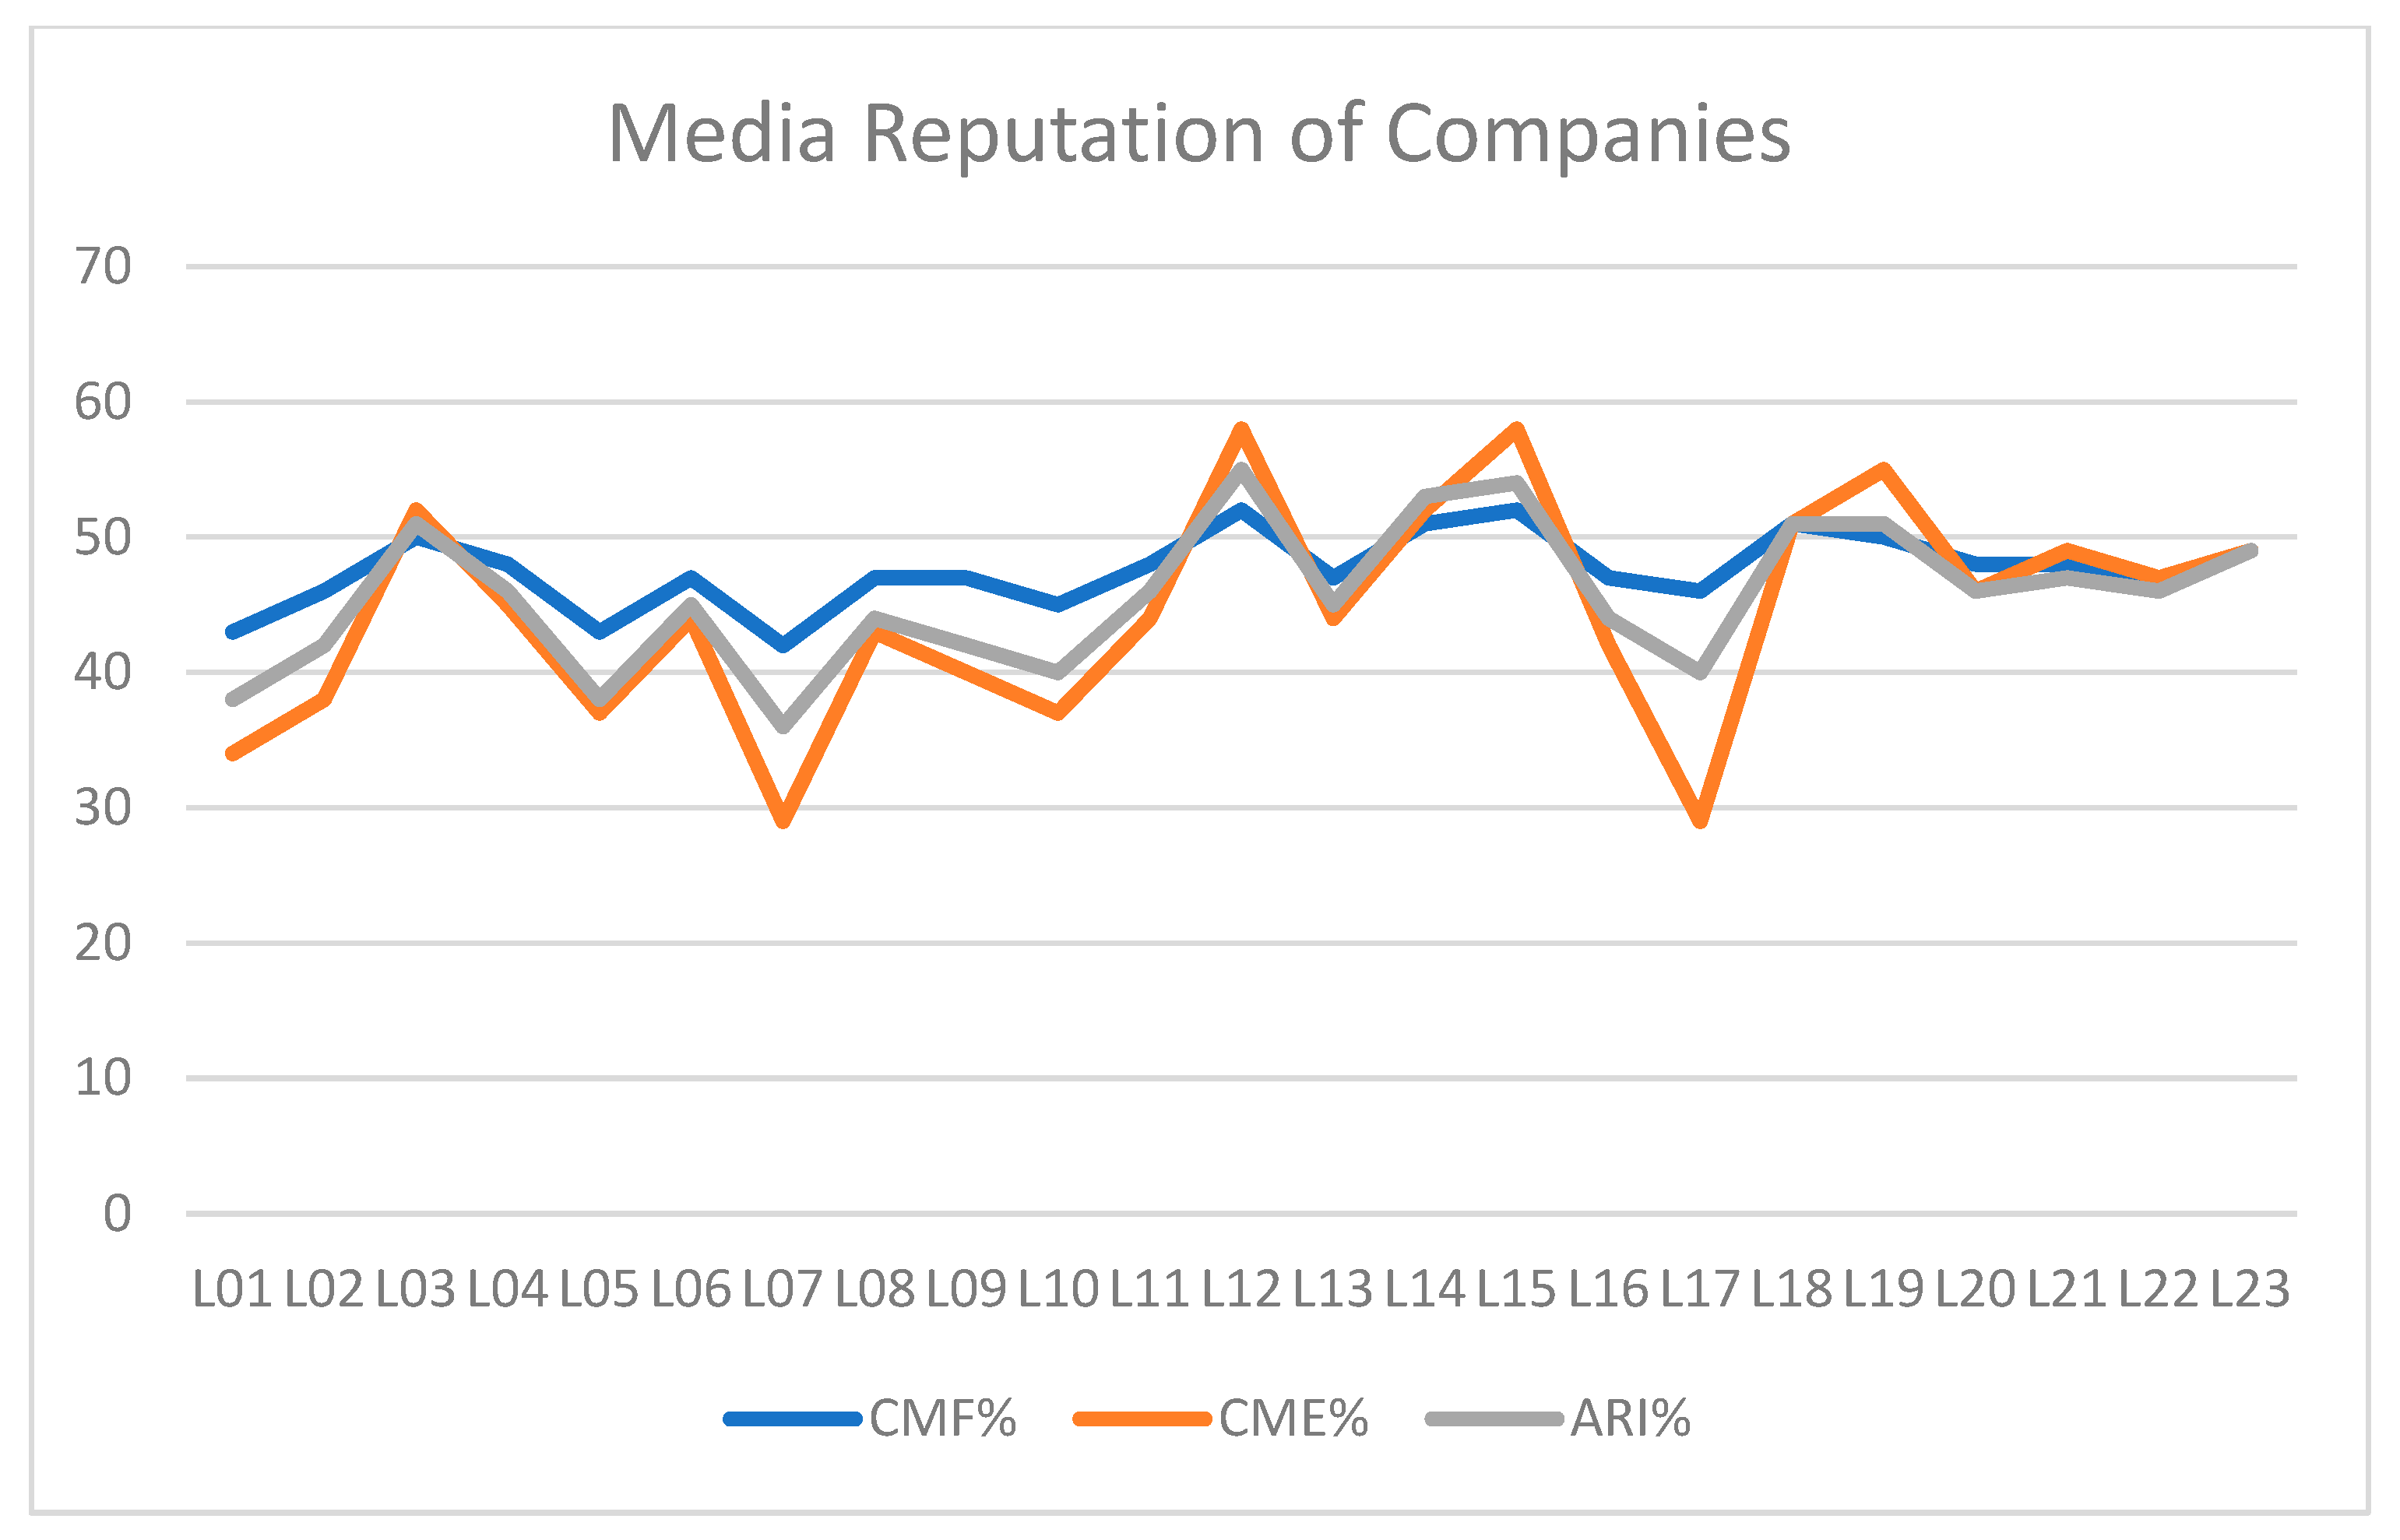
The values of all three indices across all companies are visualized in Figure 3 and Figure 4, which show that the trends of the indices remain the same for both sentiment analysis tools.
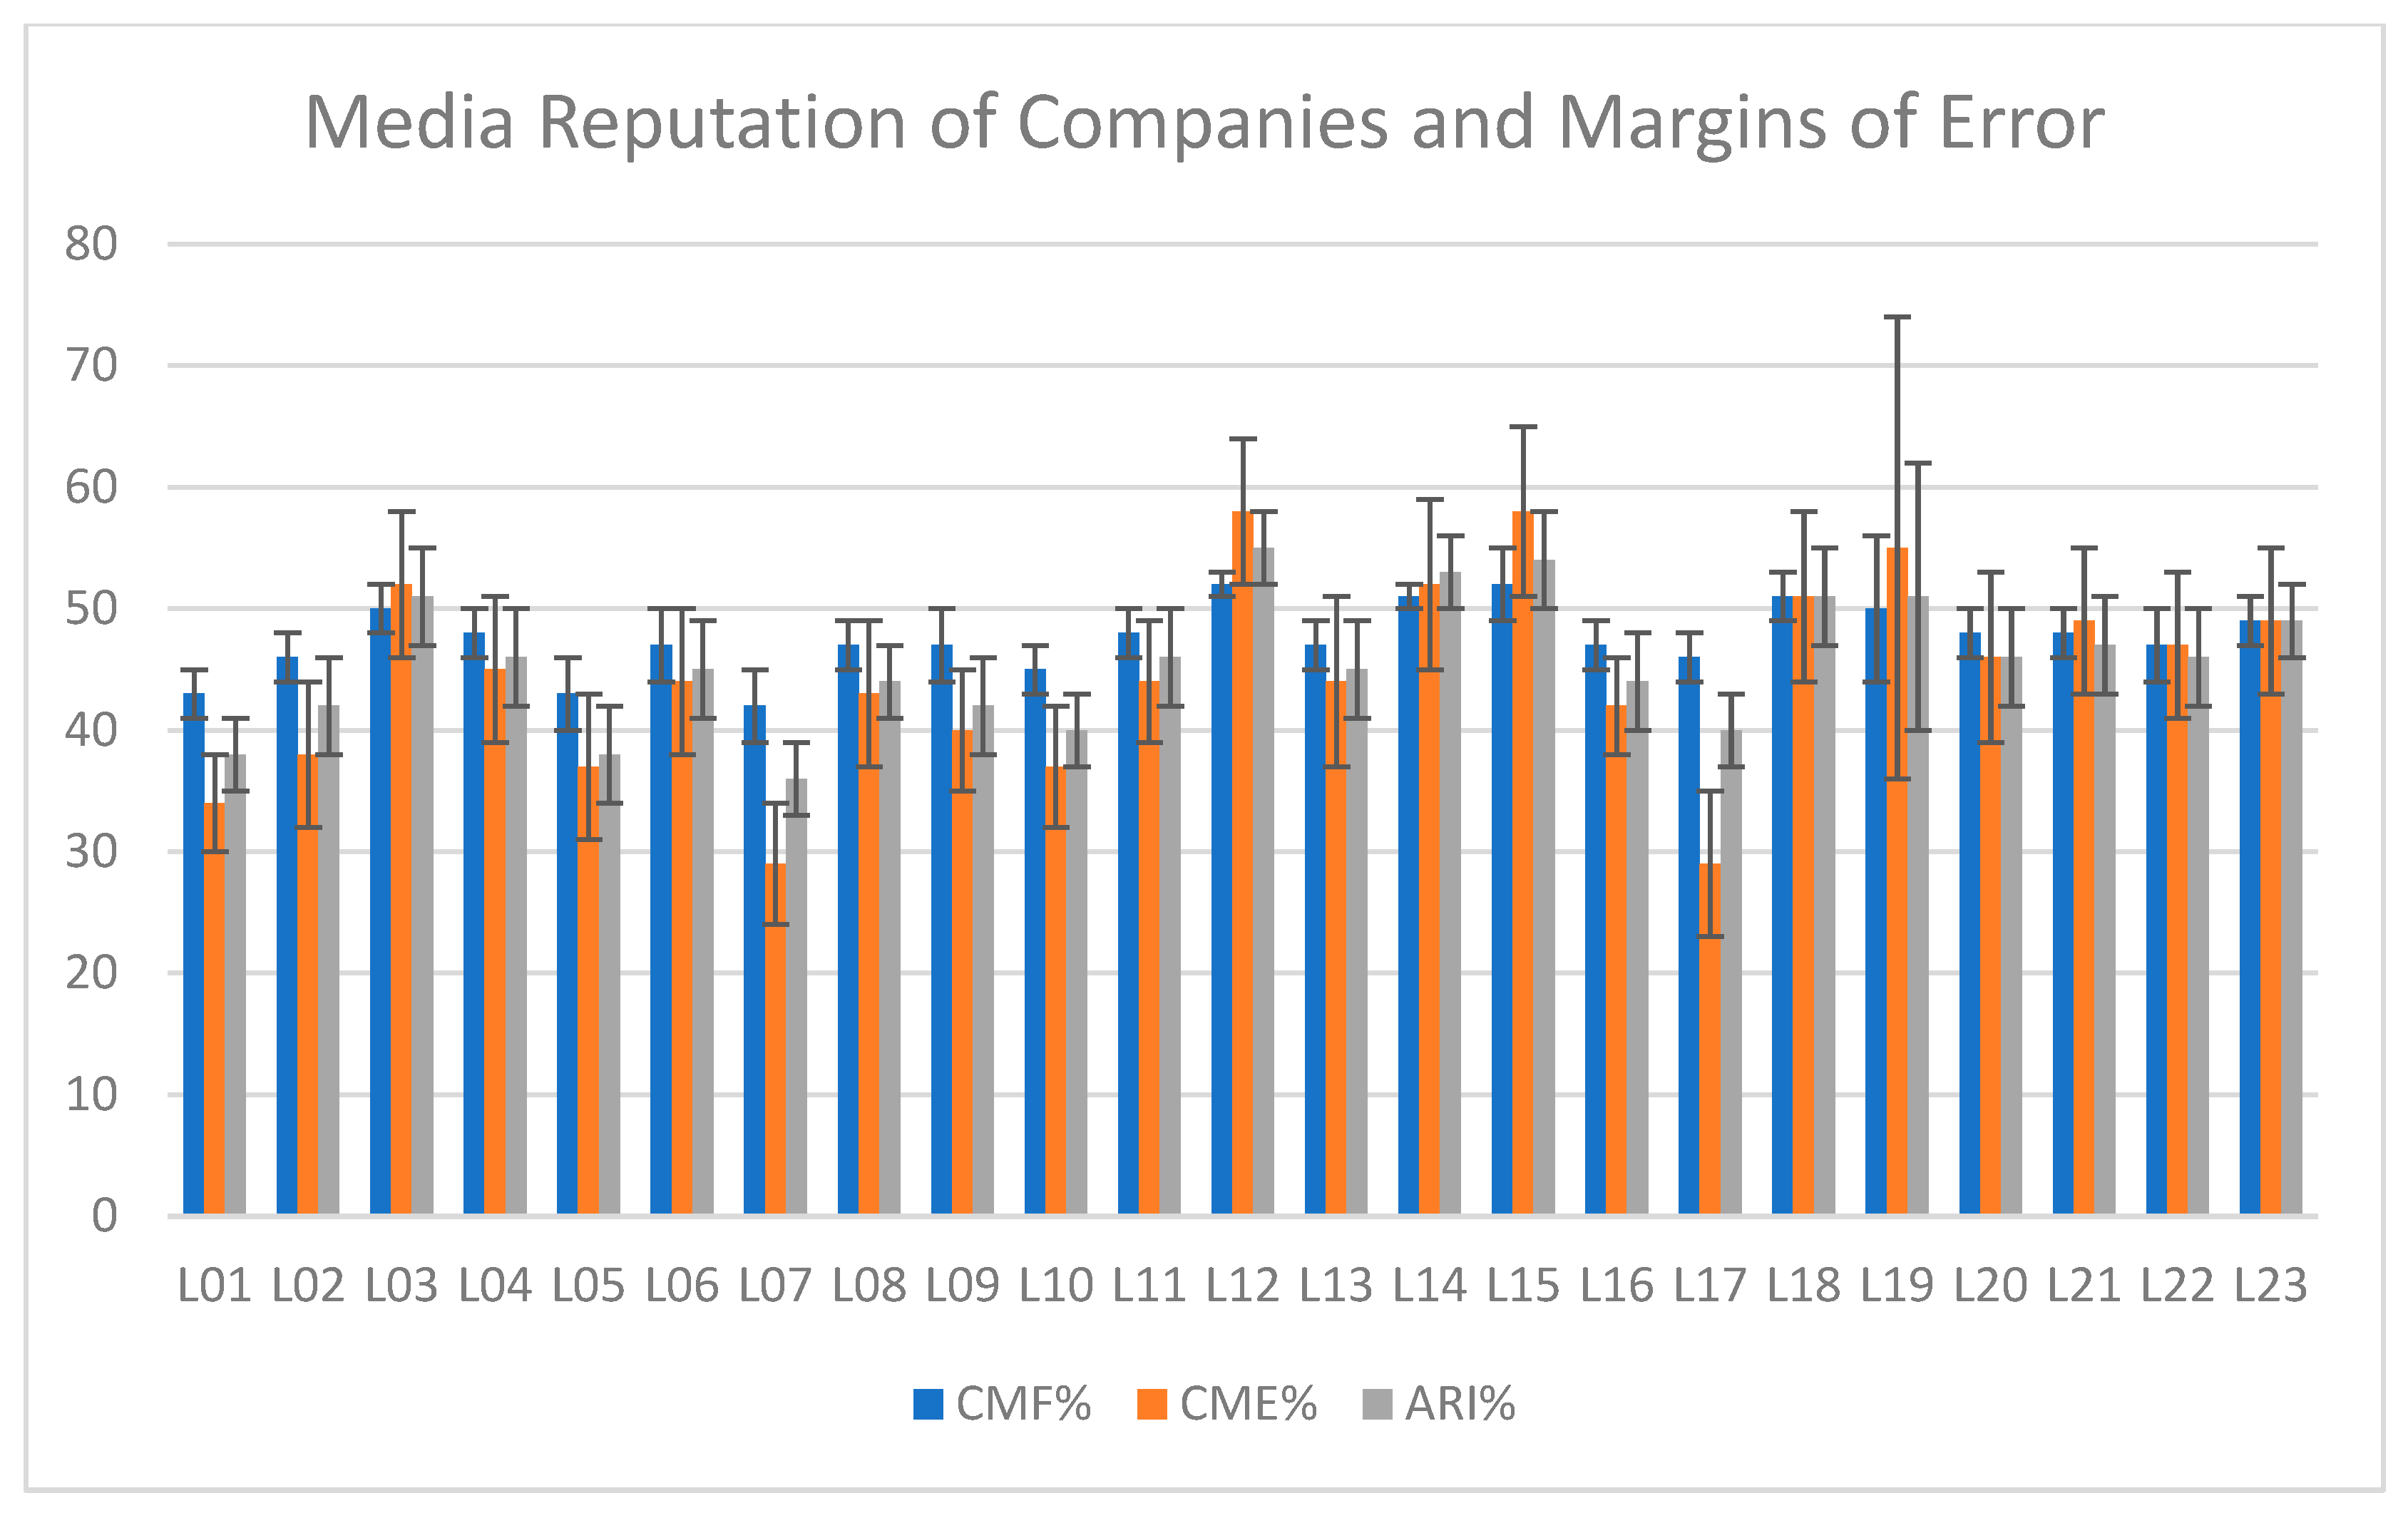
The margins of error for the ARI% index lie between those of the CMF% and CME% indices. This conclusion is valid for both sentiment analysis tools. Therefore, a diagram combining media reputation values and margins of error is shown for a single sentiment analysis tool in Figure 5. All margins of error are moderate, except for company L19. We examined the articles related to this company and found that three were very negative and one was very positive, resulting in a large margin of error for this company. Moreover, we observed that all three indices have the same margin of error for both sentiment analysis tools. This led us to conclude that a strongly positive or strongly negative article is assessed in the same manner by all tools.
Let us now examine the average values presented in the right-hand column of Table 4. The average values of the number of articles with different polarities are the same for both sentiment analysis tools. However, the average values of different indices differ slightly. The average values of the CMF% and ARI% indices increase, while the average value of the CME% index decreases in the case of XLM-RoBERTa compared to CoreNLP.
For the results of individual companies, there is no complete correspondence between the three indices for each company, as in the case of larger companies. The only correspondence between values exists for separate indices. Two companies have the same CMF% index value: S09 and S14. Moreover, while no companies share the same CMF% index value, two other companies share the same ARI% index value: S05 and S06.
If we compare the average media reputation values for companies in Table 3 and Table 4, the values of the CMF% and ARI% indices are present in the case of XLM-RoBERTa. This suggests that even a small number of articles can indicate trends in the media reputation of companies.
However, we observed that the number of negative articles overwhelmed the number of positive articles. In Table 3, the number of positive articles is greater than the number of negative articles for only six out of twenty-three companies, and in Table 4, the number of positive articles is greater than the number of negative articles for three companies out of twenty-one companies, and equal for two companies. The dominance of negative news can result from the deep-rooted negativity that is naturally present in all humans due to the evolutionary processes [43]. Researchers theorize that people have developed a defense mechanism in response to negative information and actively seek out threats [44]. Therefore, if information indicates a potential threat to human wellbeing, it should be processed to avoid risks and potential threats. It can be concluded that media providing negative information helps people avoid threats and form a more comfortable lifestyle.
A significant difference is observed when comparing the media reputation of larger and smaller companies. The margin of error is greater for smaller companies than for larger companies. This is influenced by the significantly limited number of articles available for smaller companies.
Although this study was conducted using the Lithuanian language only, we used two completely different tools to assess sentiment polarity. The results obtained show uniform behavior for the proposed method across both sentiment analysis tools. Moreover, we employed two different datasets of companies, and this method achieved the same results and revealed similar trends for the same company across different databases using both sentiment analysis tools. Therefore, we conclude that the proposed method will have similar outcomes for different languages.

5. Conclusions

The media rankings of companies are less demanding and offer many advantages over other measures of reputation. Researchers can develop a sentiment classification model that fits the conceptual definition of reputation. Using fully automated natural language processing techniques, such a method is less time-consuming, more cost-effective, and more easily applicable than other methods for assessing reputation. Methodological advances enable text-based measurements of reputation that are reliable, valid, and representative of the company, provided that the data collection process involves a wide range of online resources.
We developed a method to measure a company’s reputation based on sentiments detected in online articles. The sentiment of each sentence was evaluated and categorized into one of three polarities: positive, negative, or neutral. Based on this approach, we also developed a fully automated method for assessing a company’s media reputation using all available online articles. Experiments were conducted with articles written in Lithuanian and sourced from major news portals.
To validate the proposed method in different ways, two sentiment analysis tools were employed: Stanford CoreNLP combined with Google API and the pre-trained transformer XLM-RoBERTa. The average results of the proposed ARI% index for larger companies were similar for both sentiment analysis tools. However, when comparing specific companies, such correspondence only existed in 1 out of 23 three companies. Larger differences were observed in 4 out of 23 companies. Thus, the use of different sentiment analysis tools had a moderate impact on assessing a company’s media reputation.
We also conducted two experiments focusing on larger and smaller companies, yielding similar results for both, aside from the margin of error. Smaller companies had a greater margin of error because the number of articles available was almost ten times less than that of larger companies. It was also observed that negative articles prevailed for many companies. This result can be explained by human interest in negative news, as humans are evolutionarily primed to be aware of threats to avoid. The obtained results were compared with those of existing methods, specifically the coefficients of media endorsement and media favorableness, the results of the proposed method are less moderate than those of the coefficient of media favorableness and less extreme than those of the coefficient of media endorsement.

Author Contributions

Conceptualization, V.J. and A.V.; Methodology, V.J.; Software, D.B.; Validation, V.J., D.B. and A.V.; Formal Analysis, V.J.; Investigation, V.J.; Resources, V.J. and D.B.; Data Curation, V.J. and D.B.; Writing—Original Draft Preparation, V.J.; Writing—Review and Editing, V.J.; Visualization, D.B.; Supervision, A.V.; Project Administration, A.V.; Funding Acquisition, A.V. All authors have read and agreed to the published version of the manuscript.

Funding

This research was funded by Economic Revitalization and Resilience Enhancement Plan “New Generation Lithuania” as part of the execution of Project “Mission-driven Implementation of Science and Innovation Programmes” (No. 02-002-P-0001).

Institutional Review Board Statement

Not applicable.

Informed Consent Statement

Not applicable.

Data Availability Statement

The raw data supporting the conclusions of this article will be made available by the authors on request.

Conflicts of Interest

The authors declare no conflicts of interest.

References

  1. Castilla-Polo, F.; Licerán-Gutiérrez, A.; Guerrero-Baena, M.D. SMEs in the reputation literature: A review of the state-of-the-art. Rev. Manag. Sci. 2025, 1–41. [Google Scholar] [CrossRef] [Scilit]
  2. Deephouse, D.L. Media reputation as a strategic resource: An integration of mass communication and resource-based theories. J. Manag. 2000, 26, 1091–1112. [Google Scholar] [CrossRef]
  3. Vito, D. Measuring Corporate Reputation. In Corporate Reputation as Strategic Intangible Asset; SIDREA Series in Accounting and Business Administration; Springer: Cham, Switzerland, 2025; pp. 101–125. [Google Scholar] [CrossRef] [Scilit]
  4. Bigus, J.; Hua, K.P.M.; Raithel, S. Definitions and measures of corporate reputation in accounting and management: Commonalities, differences, and future research. Account. Bus. Res. 2024, 54, 304–336. [Google Scholar] [CrossRef] [Scilit]
  5. Heydarian, P.; Bifet, A.; Corbet, S. Understanding market sentiment analysis: A survey. J. Econ. Surv. 2025, 39, 1125–1147. [Google Scholar] [CrossRef] [Scilit]
  6. Cordeiro, D.; Lopezosa, C.; Guallar, J.A. Methodological Framework for AI-Driven Textual Data Analysis in Digital Media. Future Internet 2025, 17, 59. [Google Scholar] [CrossRef] [Scilit]
  7. Alqahtani, A.; Khan, S.B.; Alqahtani, J.; AlYami, S.; Alfayez, F. Sentiment Analysis of Semantically Interoperable Social Media Platforms Using Computational Intelligence Techniques. Appl. Sci. 2023, 13, 7599. [Google Scholar] [CrossRef] [Scilit]
  8. Bashiri, H.; Naderi, H. Comprehensive review and comparative analysis of transformer models in sentiment analysis. Knowl. Inf. Syst. 2024, 66, 7305–7361. [Google Scholar] [CrossRef] [Scilit]
  9. Janis, I.L.; Fadner, R.H. A coefficient of imbalance for content analysis. Psychometrika 1943, 8, 105–119. [Google Scholar] [CrossRef] [Scilit]
  10. Deephouse, D.L. Does isomorphism legitimate? Acad. Manag. J. 1996, 39, 1024–1039. [Google Scholar] [CrossRef] [Scilit]
  11. Bhardwaj, A.; Imam, S. The tone and readability of the media during the financial crisis: Evidence from pre-IPO media coverage. Int. Rev. Financ. Anal. 2019, 63, 40–48. [Google Scholar] [CrossRef] [Scilit]
  12. Wu, C.; Xiong, X.; Gao, Y. The role of different information sources in information spread: Evidence from three media channels in China. Int. Rev. Econ. Financ. 2022, 80, 327–341. [Google Scholar] [CrossRef] [Scilit]
  13. Yan, H.; Wu, Q.; Tian, M.; Yang, X. How institutional advantage influences overseas subsidiary performance: The mediating role of media legitimacy. Chin. Manag. Stud. 2025; ahead-of-print. [CrossRef] [Scilit]
  14. Li, X.; Deng, Q.; Liu, Q. From stock forums to boardrooms: How investor sentiment contagion drives corporate strategic aggressiveness in China. Int. Rev. Financ. Anal. 2025, 109, 104793. [Google Scholar] [CrossRef] [Scilit]
  15. Zhang, X. Measuring Media Reputation: A Test of the Construct Validity and Predictive Power of Seven Measures. Journal. Mass Commun. Q. 2015, 93, 884–905. [Google Scholar] [CrossRef] [Scilit]
  16. Zhang, X. Developing a New Measure of Media Reputation. Corp. Reput. Rev. 2018, 21, 71–83. [Google Scholar] [CrossRef] [Scilit]
  17. Zhang, X.; Ha, L. Comparing the Five Measures of Media Reputation Attributes in Local and National Newspapers. Int. J. Bus. Commun. 2021, 60, 678–698. [Google Scholar] [CrossRef] [Scilit]
  18. Du, K.; Zhao, Y.; Mao, R.; Xing, F.; Cambria, E. Natural language processing in finance: A survey. Inf. Fusion 2025, 115, 102755. [Google Scholar] [CrossRef] [Scilit]
  19. Chandan, M.K.; Mandal, S. A comprehensive survey on sentiment analysis: Framework, techniques, and applications. Comput. Sci. Rev. 2025, 58, 100777. [Google Scholar] [CrossRef] [Scilit]
  20. Misra, S.; Pedada, K.; Ben, L.; Agnihotri, R.; Sinha, A. Media sentiments and firm’s sales growth: The moderating role of offering characteristics. Eur. J. Mark. 2025, 59, 669–688. [Google Scholar] [CrossRef] [Scilit]
  21. RavenPack. News Analytics. Available online: https://www.ravenpack.com/products/edge/data/news-analytics (accessed on 5 December 2025).
  22. Bansal, N.; Joseph, K.; Ma, M.; Wintoki, M.B. Do CMO Incentives Matter? An Empirical Investigation of CMO Compensation and Its Impact on Firm Performance. Manag. Sci. 2016, 63, 1993–2015. [Google Scholar] [CrossRef] [Scilit]
  23. Germann, F.; Ebbes, P.; Grewal, R. The Chief Marketing Officer Matters! J. Mark. 2015, 79, 1–22. [Google Scholar] [CrossRef] [Scilit]
  24. Core, J.E.; Guay, W.; Larcker, D.F. The power of the pen and executive compensation. J. Financ. Econ. 2008, 88, 1–25. [Google Scholar] [CrossRef] [Scilit]
  25. Desforges, P.; Geissler, C.; Liu, F. Analysis of the relevance of sentiment data for the prediction of excess returns in a multiasset framework. J. Forecast. 2023, 42, 1360–1369. [Google Scholar] [CrossRef] [Scilit]
  26. Dang, T.L.; Moshirian, F.; Zhang, B. Commonality in news around the world. J. Financ. Econ. 2015, 116, 82–110. [Google Scholar] [CrossRef] [Scilit]
  27. Audrino, F.; Sigrist, F.; Ballinari, D. The impact of sentiment and attention measures on stock market volatility. Int. J. Forecast. 2020, 36, 334–357. [Google Scholar] [CrossRef] [Scilit]
  28. Rogers, D.; Preece, A.; Innes, M.; Spasić, I. Real-Time Text Classification of User-Generated Content on Social Media: Systematic Review. IEEE Trans. Comput. Soc. Syst. 2022, 9, 1154–1166. [Google Scholar] [CrossRef] [Scilit]
  29. Jim, J.R.; Talukder, M.A.R.; Malakar, P.; Kabir, M.M.; Nur, K.; Mridha, M.F. Recent advancements and challenges of NLP-based sentiment analysis: A state-of-the-art review. Nat. Lang. Process. J. 2024, 6, 100059. [Google Scholar] [CrossRef] [Scilit]
  30. Mao, Y.; Liu, Q.; Zhang, Y. Sentiment analysis methods, applications, and challenges: A systematic literature review. J. King Saud Univ.-Comput. Inf. Sci. 2024, 36, 102048. [Google Scholar] [CrossRef] [Scilit]
  31. Manning, C.; Surdeanu, M.; Bauer, J.; Finkel, J.; Bethard, S.; McClosky, D. The Stanford CoreNLP Natural Language Processing Toolkit. In Proceedings of the 52nd Annual Meeting of the Association for Computational Linguistics: System Demonstrations, Baltimore, MD, USA, 22–27 June 2014; Association for Computational Linguistics: Stroudsburg, PA, USA, 2014; pp. 55–60. [Google Scholar] [CrossRef] [Scilit]
  32. Verma, R.; Kim, S.; Walter, D. Syntactical analysis of the weaknesses of sentiment analyzers. In Proceedings of the 2018 Conference on Empirical Methods in Natural Language Processing, Brussels, Belgium, 31 October–4 November 2018; Association for Computational Linguistics: Stroudsburg, PA, USA, 2018; pp. 1122–1127. [Google Scholar] [CrossRef] [Scilit]
  33. Iqbal, F.; Pfarrer, M.D. Using Coreference Resolution to Mitigate Measurement Error in Text Analysis. Organ. Res. Methods 2025, 1–28. [Google Scholar] [CrossRef] [Scilit]
  34. Lohar, P.; Afli, H.; Way, A. Maintaining sentiment polarity in translation of user-generated content. Prague Bull. Math. Linguist. 2017, 108, 73–84. [Google Scholar] [CrossRef] [Scilit]
  35. Araújo, M.; Pereira, A.; Benevenuto, F. A comparative study of machine translation for multilingual sentence-level sentiment analysis. Inf. Sci. 2020, 512, 1078–1102. [Google Scholar] [CrossRef] [Scilit]
  36. Kapočiūtė-Dzikienė, J.; Salimbajevs, A.; Skadiņš, R. Monolingual and Cross-Lingual Intent Detection without Training Data in Target Languages. Electronics 2021, 10, 1412. [Google Scholar] [CrossRef] [Scilit]
  37. Kapočiūtė-Dzikienė, J.; Ungulaitis, A. Towards Media Monitoring: Detecting Known and Emerging Topics through Multilingual and Crosslingual Text Classification. Appl. Sci. 2024, 14, 4320. [Google Scholar] [CrossRef] [Scilit]
  38. Conneau, A.; Khandelwal, K.; Goyal, N.; Chaudhary, V.; Wenzek, G.; Guzmán, F.; Grave, E.; Ott, M.; Zettlemoyer, L.; Stoyanov, V. Unsupervised Cross-lingual Representation Learning at Scale. arXiv 2019, arXiv:1911.02116. [Google Scholar] [CrossRef] [Scilit]
  39. Hugging Face. Transformers. Available online: https://huggingface.co/docs/transformers/en/model_doc/xlm-roberta (accessed on 26 January 2026).
  40. Siddiqui, J.A.; Yuhaniz, S.S.; Shaikh, G.M.; Soomro, S.A.; Mahar, Z.A. Fine-Grained Multilingual Hate Speech Detection Using Explainable AI and Transformers. IEEE Access 2024, 12, 143177–143192. [Google Scholar] [CrossRef] [Scilit]
  41. Aityan, S.K. Confidence Intervals; Springer International Publishing: Cham, Switzerland, 2022; pp. 233–277. [Google Scholar] [CrossRef] [Scilit]
  42. Moreira, C.C.; Moreira, D.C.; Sales, C., Jr. A comprehensive analysis combining structural features for detection of new ransomware families. J. Inf. Secur. Appl. 2024, 81, 103716. [Google Scholar] [CrossRef] [Scilit]
  43. Hutchens, M.J.; Romanova, E.; Shaughnessy, B. The Good, the Bad, and the Evil Media: Influence of Online Comments on Media Trust. Journal. Stud. 2023, 24, 1440–1457. [Google Scholar] [CrossRef] [Scilit]
  44. Van der Meer, T.G.L.A.; Hameleers, M.; Kroon, A.C. Crafting our Own Biased Media Diets: The Effects of Confirmation, Source, and Negativity Bias on Selective Attendance to Online News. Mass Commun. Soc. 2020, 23, 937–967. [Google Scholar] [CrossRef] [Scilit]
Figure 1. The workflow of the proposed method for determining media reputation.
Applsci 16 01987 g001
Figure 2. Media reputation of companies presented according to the proposed index ARI%.
Applsci 16 01987 g002
Figure 3. Media reputation of companies presented according to different indices using Google API combined with Stanford CoreNLP.
Applsci 16 01987 g003
Figure 4. Media reputation of companies presented according to different indices using XLM-RoBERTa.
Applsci 16 01987 g004
Figure 5. Media reputation of companies and margins of error presented according to different indices using Google API combined with Stanford CoreNLP.
Applsci 16 01987 g005
Table 1. Comparison of CMF%, CME%, and ARI%.
NoNumber of
Positive Sentences
Number
of
Negative Sentences
Number of
Neutral Sentences
CMF%CME%ARI%
1100100100100
221061.1161.1166.67
321156.2561.1162.5
431068.7568.7575
53116268.7570
6110505050
7010000
812038.8938.8933.33
912143.7538.8937.5
1013031.2531.2525
111313831.2530
Table 2. Assessment of real articles’ reputation.
NoNumber of Positive SentencesNumber of Negative SentencesNumber of Neutral
Sentences
CMF%CME%ARI%
110219547863
211610546059
3301011626970
4211626515454
5163331463839
6271739525756
716210648575
8632576164
9938576964
1013210618272
11513627872
127210557263
131418679078
14814678577
1516110669278
1610219547863
Average13.936.6713.4058.3371.3365.60
Table 3. Media reputation of larger companies.
NoSentiment Analysis ToolNumber of
Positive Articles
Number of
Negative Articles
Number of
Neutral Articles
Total Number of ArticlesCMF%CME%ARI%
L01CoreNLP75346443 ± 234 ± 438 ± 3
XLM-RoBERTa3547 47 ± 121 ± 540 ± 2
L02CoreNLP102924146 ± 238 ± 642 ± 4
XLM-RoBERTa14207 48 ± 146 ± 1146 ± 3
L03CoreNLP292075650 ± 252 ± 651 ± 4
XLM-RoBERTa182810 49 ± 149 ± 947 ± 3
L04CoreNLP183055348 ± 245 ± 646 ± 4
XLM-RoBERTa14345 48 ± 135 ± 844 ± 3
L05CoreNLP84035143 ± 337 ± 638 ± 4
XLM-RoBERTa4416 44 ± 224 ± 737 ± 3
L06CoreNLP203055547 ± 344 ± 645 ± 4
XLM-RoBERTa19288 48 ± 144 ± 946 ± 3
L07CoreNLP34154942 ± 329 ± 536 ± 3
XLM-RoBERTa112711 47 ± 141 ± 944 ± 3
L08CoreNLP133645347 ± 243 ± 644 ± 3
XLM-RoBERTa103013 48 ± 137 ± 846 ± 2
L09CoreNLP63164347 ± 340 ± 542 ± 4
XLM-RoBERTa0349 43 ± 223 ± 637 ± 3
L10CoreNLP32853645 ± 237 ± 540 ± 3
XLM-RoBERTa1323 43 ± 222 ± 736 ± 3
L11CoreNLP143114648 ± 244 ± 546 ± 4
XLM-RoBERTa21232 50 ± 249 ± 950 ± 4
L12CoreNLP331645352 ± 158 ± 655 ± 3
XLM-RoBERTa32129 51 ± 165 ± 954 ± 3
L13CoreNLP163326147 ± 244 ± 745 ± 4
XLM-RoBERTa19239 50 ± 148 ± 1049 ± 3
L14CoreNLP2522105751 ± 152 ± 753 ± 3
XLM-RoBERTa29820 51 ± 169 ± 954 ± 2
L15CoreNLP241254152 ± 358 ± 754 ± 4
XLM-RoBERTa27104 52 ± 263 ± 1156 ± 4
L16CoreNLP172814647 ± 242 ± 444 ± 4
XLM-RoBERTa19243 48 ± 244 ± 747 ± 4
L17CoreNLP34385446 ± 229 ± 640 ± 3
XLM-RoBERTa63711 47 ± 130 ± 842 ± 3
L18CoreNLP222185151 ± 251 ± 751 ± 4
XLM-RoBERTa20229 49 ± 245 ± 1148 ± 4
L19CoreNLP2518105350 ± 655 ± 1951 ± 11
XLM-RoBERTa261413 51 ± 663 ± 1952 ± 11
L20CoreNLP1029155448 ± 246 ± 746 ± 4
XLM-RoBERTa16335 47 ± 242 ± 944 ± 4
L21CoreNLP212655448 ± 249 ± 647 ± 4
XLM-RoBERTa17278 48 ± 246 ± 946 ± 4
L22CoreNLP222965747 ± 347 ± 646 ± 4
XLM-RoBERTa24285 48 ± 147 ± 946 ± 3
L23CoreNLP222665449 ± 249 ± 649 ± 3
XLM-RoBERTa17298 49 ± 140 ± 1047 ± 3
Aver.CoreNLP162965148 ± 244 ± 646 ± 4
XLM-RoBERTa16278 48 ± 243 ± 946 ± 4
Table 4. Media reputation of smaller companies.
NoSentiment Analysis ToolNumber of Positive ArticlesNumber of Negative
Articles
Number of Neutral ArticlesTotal Number of ArticlesCMF%CME%ARI%
S01CoreNLP250742 ± 630 ± 1536 ± 9
XLM-RoBERTa061 47 ± 214 ± 1539 ± 5
S02CoreNLP241748 ± 352 ± 2046 ± 8
XLM-RoBERTa241 49 ± 250 ± 2648 ± 6
S03CoreNLP250748 ± 936 ± 2444 ± 14
XLM-RoBERTa151 46 ± 429 ± 2541 ± 7
S04CoreNLP160746 ± 442 ± 943 ± 8
XLM-RoBERTa331 49 ± 344 ± 1949 ± 8
S05CoreNLP151745 ± 537 ± 1140 ± 9
XLM-RoBERTa052 46 ± 324 ± 1440 ± 6
S06CoreNLP340746 ± 546 ± 1144 ± 9
XLM-RoBERTa250 48 ± 332 ± 2644 ± 8
S07CoreNLP070739 ± 430 ± 531 ± 4
XLM-RoBERTa070 46 ± 318 ± 1238 ± 4
S08CoreNLP340748 ± 646 ± 2046 ± 13
XLM-RoBERTa151 47 ± 236 ± 1343 ± 6
S09CoreNLP241751 ± 347 ± 751 ± 5
XLM-RoBERTa322 51 ± 160 ± 2052 ± 5
S10CoreNLP241749 ± 143 ± 647 ± 4
XLM-RoBERTa322 51 ± 251 ± 1952 ± 6
S11CoreNLP133745 ± 535 ± 1541 ± 9
XLM-RoBERTa142 49 ± 537 ± 1546 ± 9
S12CoreNLP421754 ± 966 ± 2357 ± 13
XLM-RoBERTa412 48 ± 764 ± 2450 ± 11
S13CoreNLP232747 ± 544 ± 1545 ± 9
XLM-RoBERTa250 49 ± 127 ± 2046 ± 4
S14CoreNLP222650 ± 248 ± 1949 ± 7
XLM-RoBERTa312 50 ± 167 ± 3051 ± 6
S15CoreNLP160745 ± 538 ± 1240 ± 10
XLM-RoBERTa241 50 ± 1041 ± 2547 ± 16
S16CoreNLP322748 ± 446 ± 1648 ± 9
XLM-RoBERTa151 43 ± 721 ± 2737 ± 12
S17CoreNLP160743 ± 724 ± 1837 ± 11
XLM-RoBERTa331 48 ± 649 ± 2948 ± 10
S18CoreNLP511755 ± 466 ± 1360 ± 7
XLM-RoBERTa421 52 ± 267 ± 2655 ± 6
S19CoreNLP340750 ± 558 ± 2149 ± 10
XLM-RoBERTa241 48 ± 235 ± 2645 ± 6
S20CoreNLP061744 ± 528 ± 1237 ± 7
XLM-RoBERTa241 46 ± 538 ± 1243 ± 8
S21CoreNLP331750 ± 251 ± 951 ± 6
XLM-RoBERTa232 48 ± 248 ± 2846 ± 6
Aver.CoreNLP241747 ± 543 ± 1445 ± 9
XLM-RoBERTa241 48 ± 341 ± 2146 ± 7
Disclaimer/Publisher’s Note: The statements, opinions and data contained in all publications are solely those of the individual author(s) and contributor(s) and not of MDPI and/or the editor(s). MDPI and/or the editor(s) disclaim responsibility for any injury to people or property resulting from any ideas, methods, instructions or products referred to in the content.