Article

Characteristics of Source Rocks and Oil–Source Correlation in the Seventh Member of the Yanchang Formation (Chang 7 Member), Pingbei Area, Ordos Basin


1
Hubei Key Laboratory of Complex Shale Oil and Gas Geology and Development in Southern China, Wuhan 430100, China
2
Hubei Engineering Research Center of Unconventional Petroleum Geology and Engineering, Wuhan 430100, China
3
School of Geosciences, Yangtze University, Wuhan 430100, China
4
Huabei Geophysical Exploration Branch, BGP Inc., CNPC, Renqiu 062550, China
*
Author to whom correspondence should be addressed.
Appl. Sci. 2026, 16(4), 1939; https://doi.org/10.3390/app16041939
Submission received: 19 December 2025 / Revised: 9 February 2026 / Accepted: 11 February 2026 / Published: 14 February 2026
(This article belongs to the Section Earth Sciences)

Abstract

To clarify the hydrocarbon generation potential of dark mudstones and the source of crude oil in the seventh member of the Yanchang Formation (Chang 7 Member) in the Pingbei area of the Ordos Basin, and to support tight oil exploration in this region, this study focuses on the source rocks and crude oils from the Chang 7 Member. Comprehensive analyses including total organic carbon (TOC), rock pyrolysis, vitrinite reflectance (Ro), and saturated hydrocarbon gas chromatography–mass spectrometry (GC-MS) were conducted to systematically investigate the characteristics of source rocks and the geochemical properties of crude oils, and to perform oil–source correlation. The results indicate that the dark mudstones in the Chang 7 Member of the Pingbei area meet the geological conditions of effective source rocks: they exhibit high organic matter abundance with an average TOC content of 1.69% and strong heterogeneity, among which the Chang 73 sub-member has an average organic carbon content of 2.8%, conforming to the standard of high-quality source rocks; the organic matter type is dominated by Type II1, mixed with a small amount of Type II2 and Type III, characterized by both aquatic biological and terrestrial organic matter inputs; the Ro values range from 0.76% to 0.87%, indicating a mature stage corresponding to the peak period of liquid hydrocarbon generation. The crude oils in the study area can be classified into two types (Type A and Type B): Type A crude oil is distributed in deep reservoirs of the Chang 7 Member, while Type B crude oil is present in both shallow and deep layers. Oil–source correlation shows that Type A crude oil is highly consistent with the dark mudstones of the Chang 7 Member in terms of Pr/Ph ratio, rearranged hopane enrichment degree, and pentacyclic triterpane distribution pattern, clearly indicating that the Chang 7 Member dark mudstones are the main source rocks for Type A crude oil. In contrast, Type B crude oil is geochemically consistent with crude oils from the sixth member of the Yanchang Formation (Chang 6 Member) in oilfields surrounding the Pingbei area; it is derived from the Chang 6 Member source rocks in the peripheral regions.

1. Introduction

The Ordos Basin is a significant large-scale petroliferous basin in China. The Triassic Yanchang Formation within the basin is a typical representative of continental tight oil exploration and represents a key area for present and future growth in oil and gas reserves and production [1,2,3,4,5,6,7]. The seventh member of the Yanchang Formation (Chang 7 Member) is universally recognized as the principal Mesozoic source rock interval in the basin, characterized by the development of thick, organic-rich black shales, and dark mudstones [8,9,10,11], which exert a crucial control on tight oil accumulation [12,13,14]. The Pingbei area is situated within the Pingqiao nose fold belt on the central Yishan Slope Zone, in a delta-front distributary channel area under the northeastern provenance system. Sand bodies, such as distributary channels and sheet sands, are widely developed, forming typical low-porosity and low-permeability tight reservoirs [15,16]. However, its location distal from the main hydrocarbon generation center complicates research on crude oil migration and accumulation mechanisms.
Previous studies have systematically revealed the geochemical characteristics of the Chang 7 Member source rocks in the Ordos Basin and their key role as the basin’s primary source rocks. Nevertheless, in the Pingbei area—a geologically complex marginal zone—the Chang 7 Member source rocks are not typical organic-rich shales but are dominated by dark mudstones [17,18]. Research on the hydrocarbon generation potential of these locally developed, potentially atypical dark mudstones, and their specific contribution to local oil and gas accumulation remains insufficient and unclear. Key issues, such as whether the dark mudstones are effective source rocks, whether there is multiplicity in crude oil sources, and the correlation between oils from different horizons and source rocks, remain unresolved. These uncertainties constrain the accurate evaluation of tight oil exploration potential in this area.
Therefore, this study focuses on the Chang 7 Member in the Pingbei area. By systematically collecting source rock and crude oil samples and applying petrographic techniques (maceral identification, vitrinite reflectance measurement) and geochemical analyses (TOC, rock pyrolysis, saturated/aromatic hydrocarbon GC-MS), this study aims to address the research gap concerning the hydrocarbon generation potential of dark mudstones and oil–source relationships in the Pingbei area. It provides theoretical support for tight oil exploration in the Chang 7 Member and deeper layers, holding significant practical importance for optimizing exploration and development strategies.

2. Geological Background

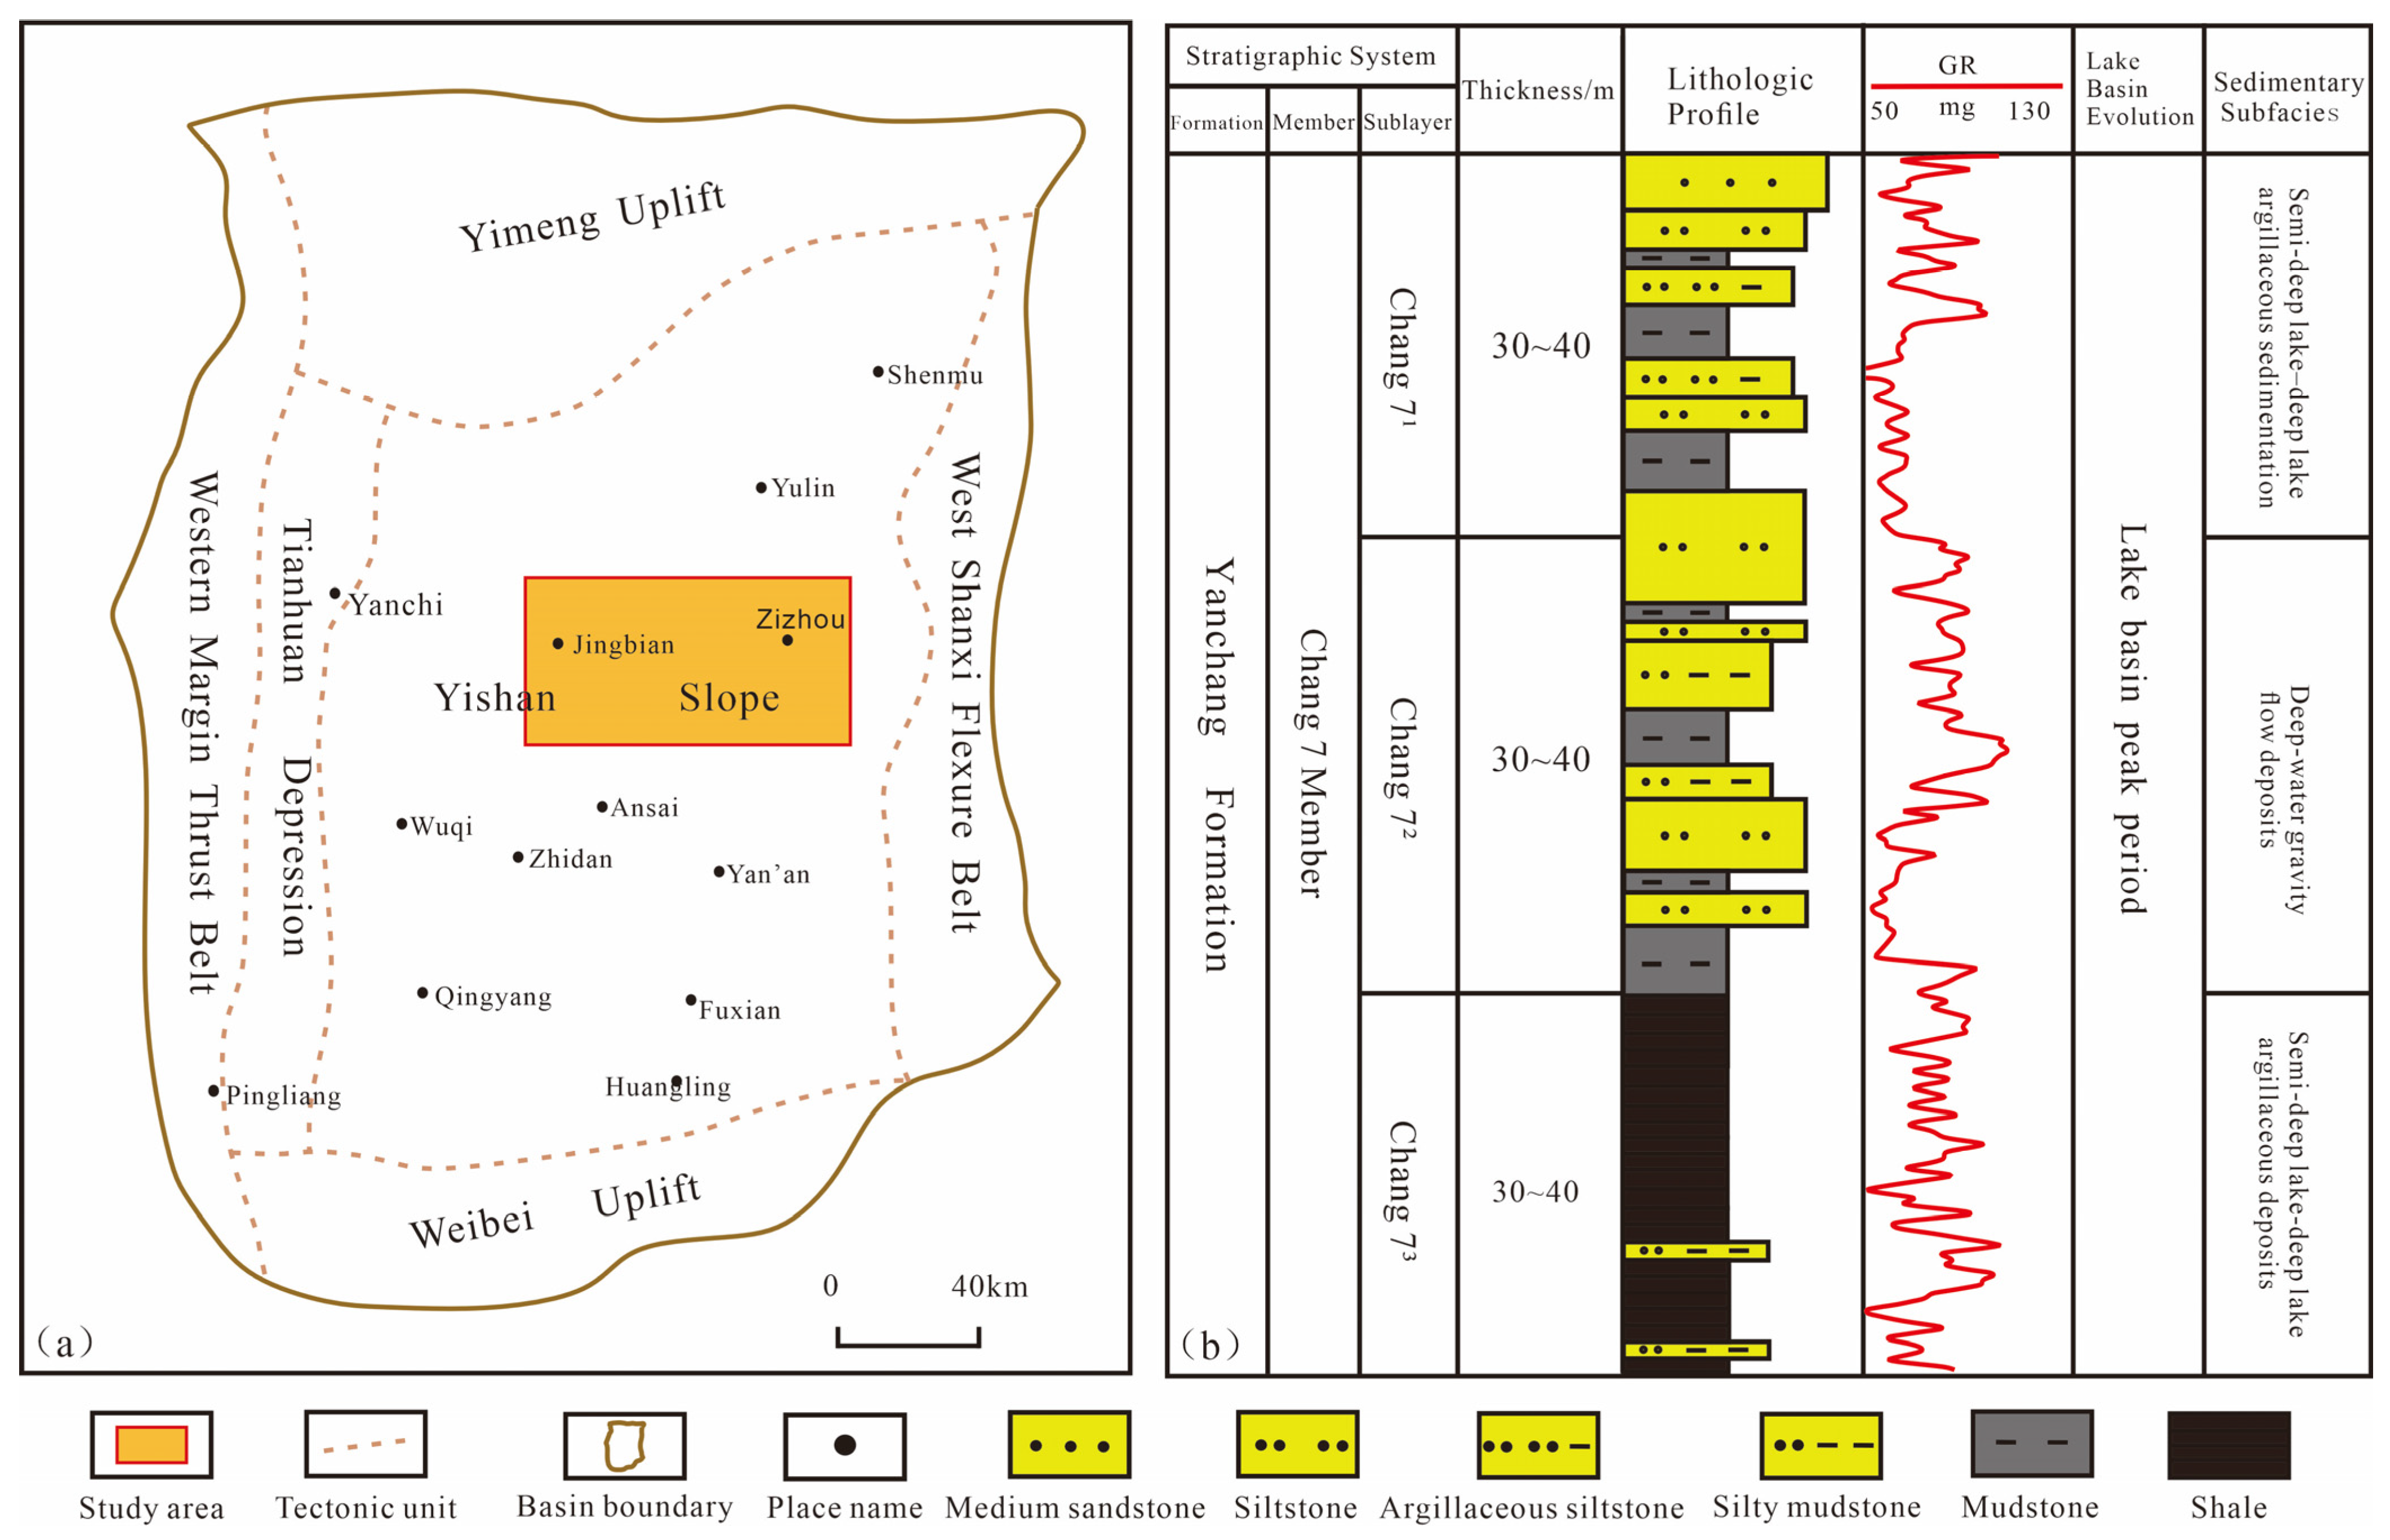
The Ordos Basin is located in the western part of the North China Craton, with an overall rectangular outline. As a large-scale polycyclic sedimentary superimposed basin in China, it is divided into six tectonic units: the Yimeng Uplift, Weibei Uplift, Western Margin Thrust Belt, Tianhuan Depression, Yishan Slope, and Jinxi Flexure Belt [19,20,21]. The study area is situated in the Pingqiao nose fold belt in the central part of the Yishan Slope Zone, covering an exploration area of approximately 65 km2 (Figure 1a). The Triassic Yanchang Formation is the largest tight oil production base in China [22]. Due to environmental changes, the Yanchang Formation experienced the entire process of initial lake formation, continuous expansion, and gradual contraction. Based on lithological and sedimentary characteristics, the Yanchang Formation can be divided into ten oil-bearing intervals (Chang 1 to Chang 10) from bottom to top [23,24]. During the middle stage of lake development, the basin expanded significantly to 5.5 × 10⁴ km2, with prosperous aquatic organisms. Deep lake and semi-deep lake sediments were mainly developed, widely distributed in Wuqi–Dingbian County. The Chang 7 Member is further subdivided into three sub-members (Chang 71, Chang 72, and Chang 73) from top to bottom (Figure 1b), mainly consisting of approximately 100 m thick dark gray mudstones or oil shales with high-quality and high-abundance organic matter [25]. The areal distribution of areas with a cumulative thickness greater than 20 m reaches up to 3 × 10⁴ km2. The organic-rich shales have high TOC contents, mainly ranging from 6% to 14%, with the “Zhangjiatan” shale at the bottom as a typical representative, showing great development potential.

3. Materials and Methods

3.1. Sample Collection

To ensure the representativeness of the dataset, source rock and crude oil samples were systematically collected from multiple wells across the Pingbei area, covering the key stratigraphic intervals (Chang 72, Chang 73, Chang 63, and Chang 4 + 52). Sampling prioritized fresh core material from depths below the weathering zone to minimize surface alteration. All samples were immediately sealed in aluminum foil and stored at 4 °C to prevent oxidation and hydrocarbon loss prior to analysis. There were a total of 41 source rock samples. The study area is located within the Pingqiao nose fold belt in the central part of the Yishan Slope, where lateral migration pathways (such as delta-front distributary channel sand bodies) exist. Research in surrounding areas has confirmed that hydrocarbons can migrate laterally through such sand bodies into underlying strata. Additionally, faults are present between some shallow formations (e.g., Chang 6 and Chang 4 + 5) and the Chang 7 Formation, which may facilitate cross-strata migration of hydrocarbons.

3.2. Experimental Analysis Methods

3.2.1. Total Organic Carbon (TOC) Analysis

TOC content was determined in compliance with the standard SY/T 5735-2019. Samples were first treated with 10% hydrochloric acid to remove carbonate minerals, dried at 60 °C to constant weight, and then measured using a LECO CS-230 carbon–sulfur analyzer.

3.2.2. Rock Pyrolysis Analysis

Samples were crushed to 80 mesh and analyzed using a Rock-Eval 6 pyrolyzer. The pyrolysis procedure consisted of low-temperature oxidation (300 °C, 3 min), programmed heating from 300 to 600 °C at a rate of 25 °C/min, and high-temperature oxidation (600–850 °C). Key parameters obtained included the free hydrocarbon content (S1), pyrolyzable hydrocarbon content (S2), and the maximum pyrolysis temperature (Tmax).

3.2.3. Maceral Identification and Organic Matter Type Determination

Maceral classification followed the International Committee for Coal and Organic Petrology (ICCP) System 1994 [26,27]. The sample preparation protocol was as follows: source rock samples were crushed to <1 mm, mounted in epoxy resin, and polished to produce polished particulate blocks. Observations were carried out under reflected light using a Leitz Ortholux II microscope fitted with a reflected light attachment and 50 × oil immersion objective. The relative abundances of vitrinite, inertinite, and liptinite maceral groups were determined by point counting, with at least 500 points counted per sample using a regular grid spacing of approximately 0.4 mm. Alginite was identified as a distinctive liptinite maceral when present. Organic matter type was assessed based on maceral composition and calculated type index from petrological analysis, and corroborated with geochemical data (hydrogen index vs. Tmax cross-plot) from Rock-Eval pyrolysis. Among the 41 source rock samples, 20 representative samples (covering different well locations and various sub-members) were selected for petrological analysis. The selection criteria were as follows: total organic carbon (TOC) content ≥ 0.5% (the lower limit for effective source rocks), intact lithology, and absence of weathering.

3.2.4. Vitrinite Reflectance (Ro) Measurement

Vitrinite reflectance (Ro) measurements were conducted in accordance with the Chinese petroleum industry standard SY/T 5124-2019. Sample preparation was consistent with the procedure described for maceral identification (Section 3.2.3). Reflectance measurements were performed on vitrinite particles using a Leitz MPV-SP microscope photometer under incident light at a wavelength of 546 nm. Following the guidelines of the ASTM D7708 standard and recent best practices for dispersed organic matter [27], we aimed for a minimum of 20–30 valid measurements per sample. Raw data were screened, and statistical outliers (defined as measurements falling outside ±2 standard deviations from the preliminary mean) were excluded to obtain a robust mean reflectance value for each sample. The final mean Ro, its standard deviation, and the count of valid measurements for each of the 20 analyzed samples are provided in Table A1. A minimum of 20 valid data points were collected per sample, with outliers excluded from the final calculation. Among the 41 source rock samples, 20 representative samples covering different well locations and stratigraphic sub-members were selected for detailed petrological analysis. The selection criteria were: (1) a total organic carbon (TOC) content ≥ 0.5% (considered the lower limit for effective source rocks); (2) intact lithology; and (3) absence of weathering.

3.2.5. Analysis of Aromatic Hydrocarbon Fraction

Following separation of the saturated and aromatic hydrocarbon fractions, the aromatic fraction was analyzed using an Agilent 7890A-5975C gas chromatography–mass spectrometer (GC–MS). The system was equipped with a DB-5MS capillary column (30 m × 0.25 mm × 0.25 μm film thickness). The GC oven temperature was programmed as follows: initial temperature of 60 °C (maintained for 2 min), then ramped to 300 °C at 5 °C/min, and finally held at 300 °C for 20 min. High-purity helium was used as the carrier gas at a constant flow rate of 1.0 mL/min. The mass spectrometer was operated in electron impact (EI) ionization mode at 70 eV, with an ion source temperature of 230 °C. Compound quantification was achieved using the peak area normalization method. The same set of 20 representative source rock samples selected for petrological analysis, along with 12 crude oil samples (5 from the Pingbei area and 7 from surrounding oilfields), was subjected to GC–MS analysis for both saturated and aromatic hydrocarbons. The remaining 21 source rock samples were analyzed solely for total organic carbon (TOC) content and Rock-Eval pyrolysis parameters.

3.2.6. Saturated and Aromatic Hydrocarbon GC–MS Analysis

Prior to chromatographic analysis, samples were extracted using a Soxhlet extractor with a chloroform–methanol mixture (9:1 by volume) for 72 h. The resulting total extract was subsequently separated into saturated hydrocarbon, aromatic hydrocarbon, and non-hydrocarbon (including asphaltene) fractions via silica gel–alumina column chromatography, using sequential elution with *n*-hexane, benzene, and methanol. Both saturated and aromatic hydrocarbon fractions were analyzed using an Agilent 7890A-5975C gas chromatography–mass spectrometer (GC–MS) equipped with a DB-5MS capillary column (30 m × 0.25 mm × 0.25 μm). For the saturated hydrocarbon fraction, the GC oven temperature was programmed from an initial 80 °C (held for 2 min) to 300 °C at a rate of 4 °C/min, followed by a 15 min isothermal hold at 300 °C. For the aromatic hydrocarbon fraction, the temperature program began at 60 °C (held for 2 min), was raised to 300 °C at 5 °C/min, and was then held at 300 °C for 20 min. In terms of the separation efficiency of target compounds, aromatic hydrocarbons in crude oils and source rocks (e.g., naphthalenes, phenanthrenes, dibenzothiophenes) have a wide range of molecular weights and boiling points (60–350 °C). A heating rate of 5 °C/min balances separation efficiency and analysis time—a rate slower than 5 °C/min would extend runtime without significant separation improvement, while faster rates cause peak co-elution (e.g., methylnaphthalene isomers).
Complete elution of high-molecular-weight aromatics: The 20 min hold at 300 °C ensures full elution of high-molecular-weight aromatic homologs (e.g., pentamethylnaphthalenes, trimethylphenanthrenes), avoiding sample carryover and ensuring accurate quantification of maturity-sensitive biomarkers. This temperature program was optimized to achieve effective separation and detection of saturated and aromatic hydrocarbon compounds. The low initial temperature aids in retaining low-boiling-point components, while the slow ramp rate combined with a final isothermal stage ensures adequate elution and chromatographic resolution of medium- to high-molecular-weight biomarkers (e.g., steranes, hopanes) and polycyclic aromatic hydrocarbons, consistent with established analytical protocols and previous studies.

3.2.7. Investigation of Source Rock Distribution

Based on the established sedimentary facies framework, well-log lithology interpretations were calibrated against core descriptions and cuttings logs. This process enabled the precise delineation of vertical dark mudstone intervals within individual wells. Subsequently, within the context of sedimentary microfacies distribution, the lateral continuity and areal extent of these organic-rich, dark mudstone units were predicted and mapped.

4. Results

4.1. Geochemical and Petrological Characteristics of Source Rocks

4.1.1. Distribution of Source Rocks

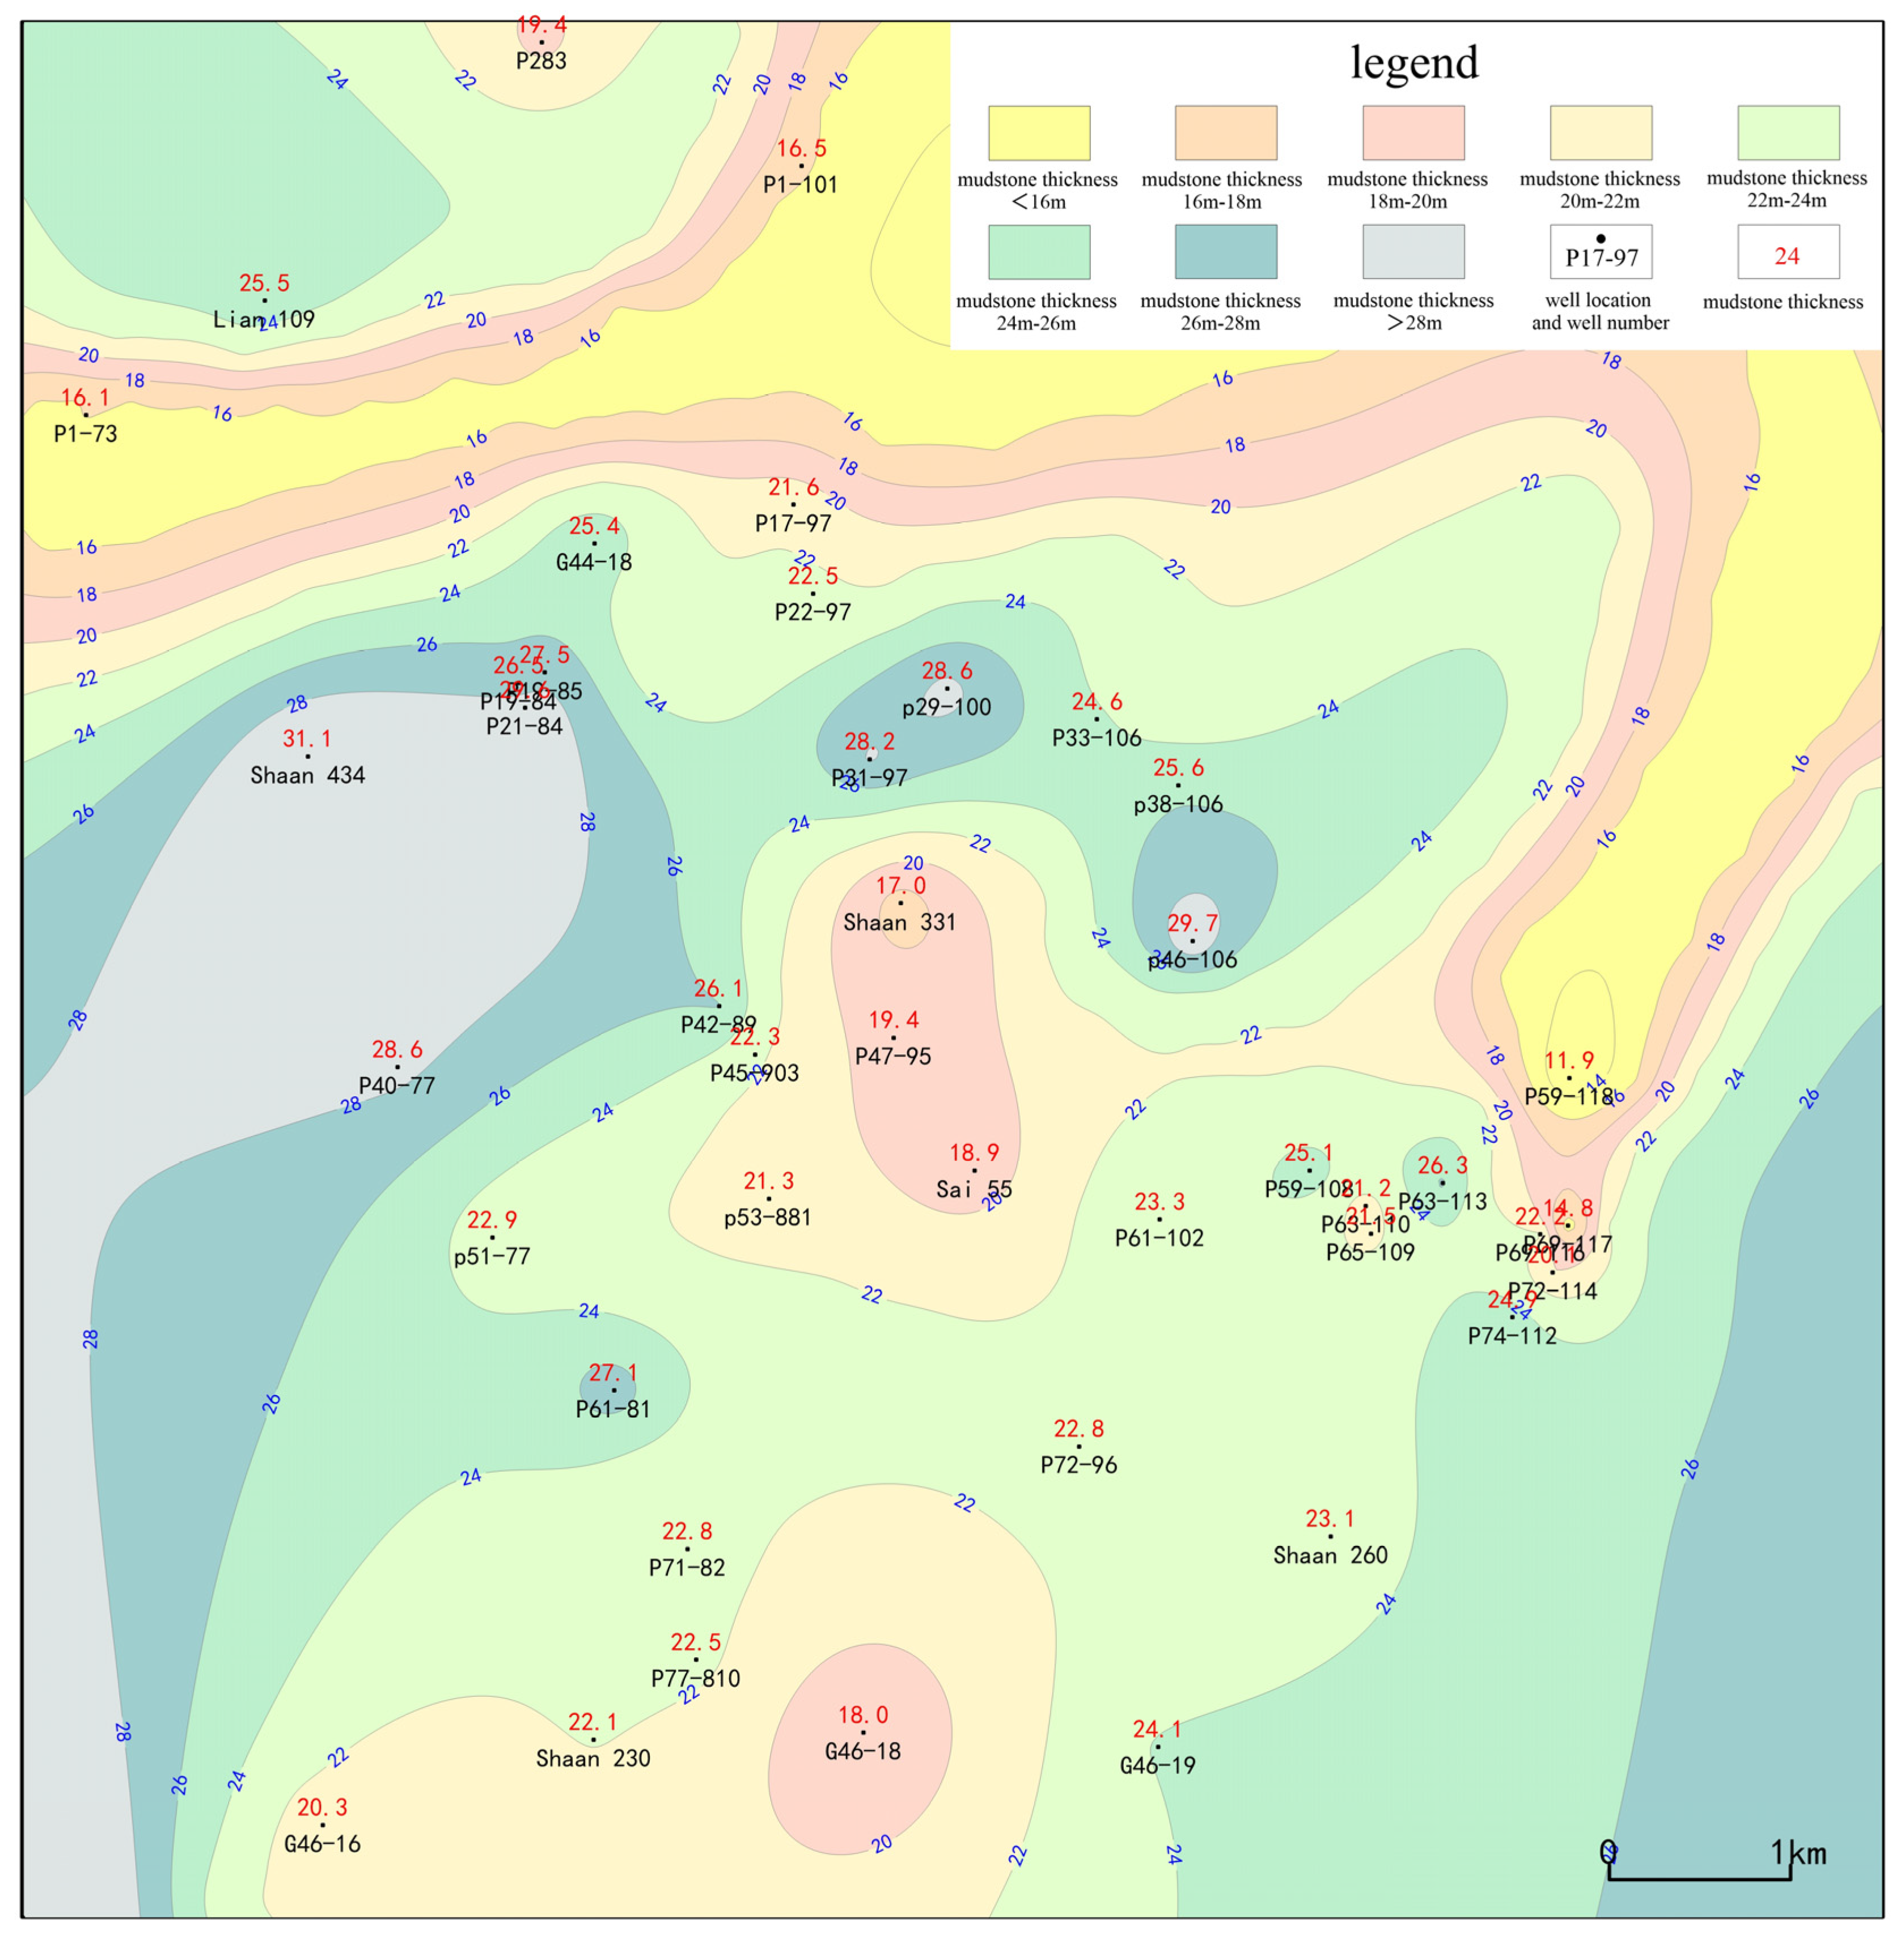
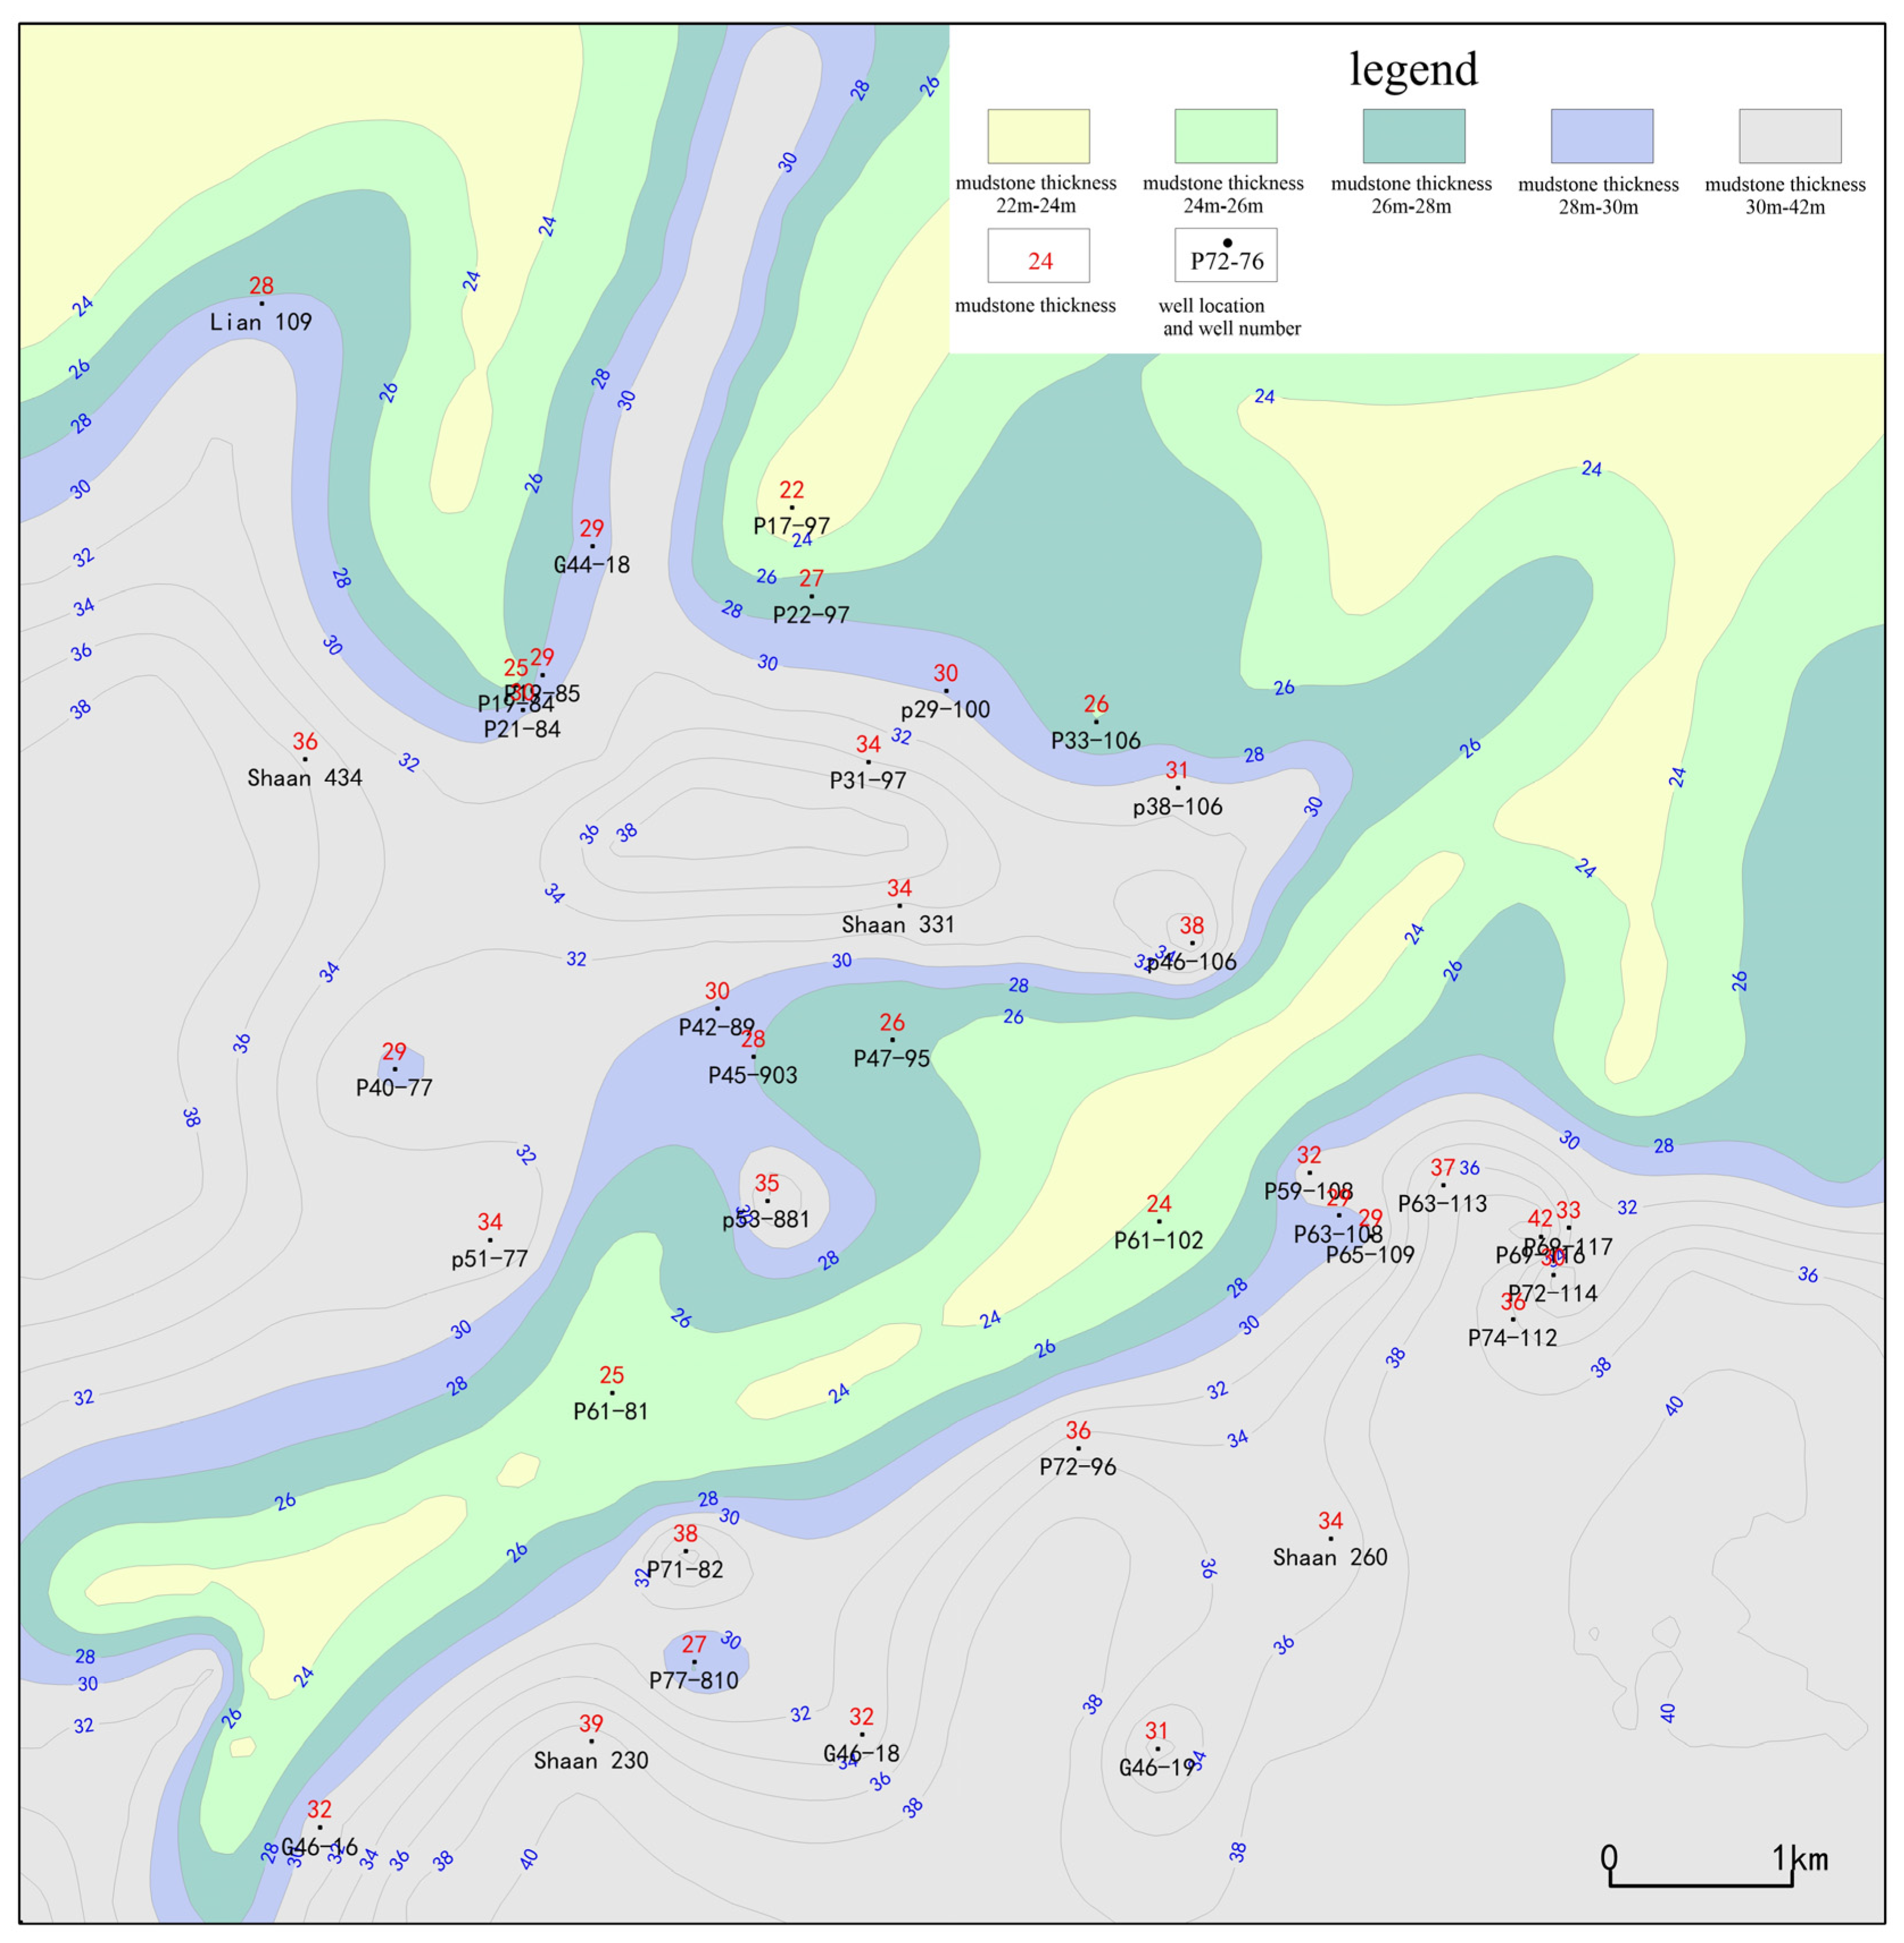
The source rock system of the Chang 7 Member exhibits a distribution pattern characterized by extensive lateral coverage yet significant local variability, in which black shale and dark mudstone are complementarily distributed [25]. In the Pingbei area, the dark mudstone within the Chang 7 Member has a thickness ranging from 40 to 60 m, constituting over 60% of the total member thickness. Spatially, the thickness demonstrates a general decreasing trend from the northeast to the southwest. Specifically, the northern and southeastern sectors of the area feature greater thicknesses, while the central part is relatively thinner (Figure 2 and Figure 3).

4.1.2. Organic Matter Abundance

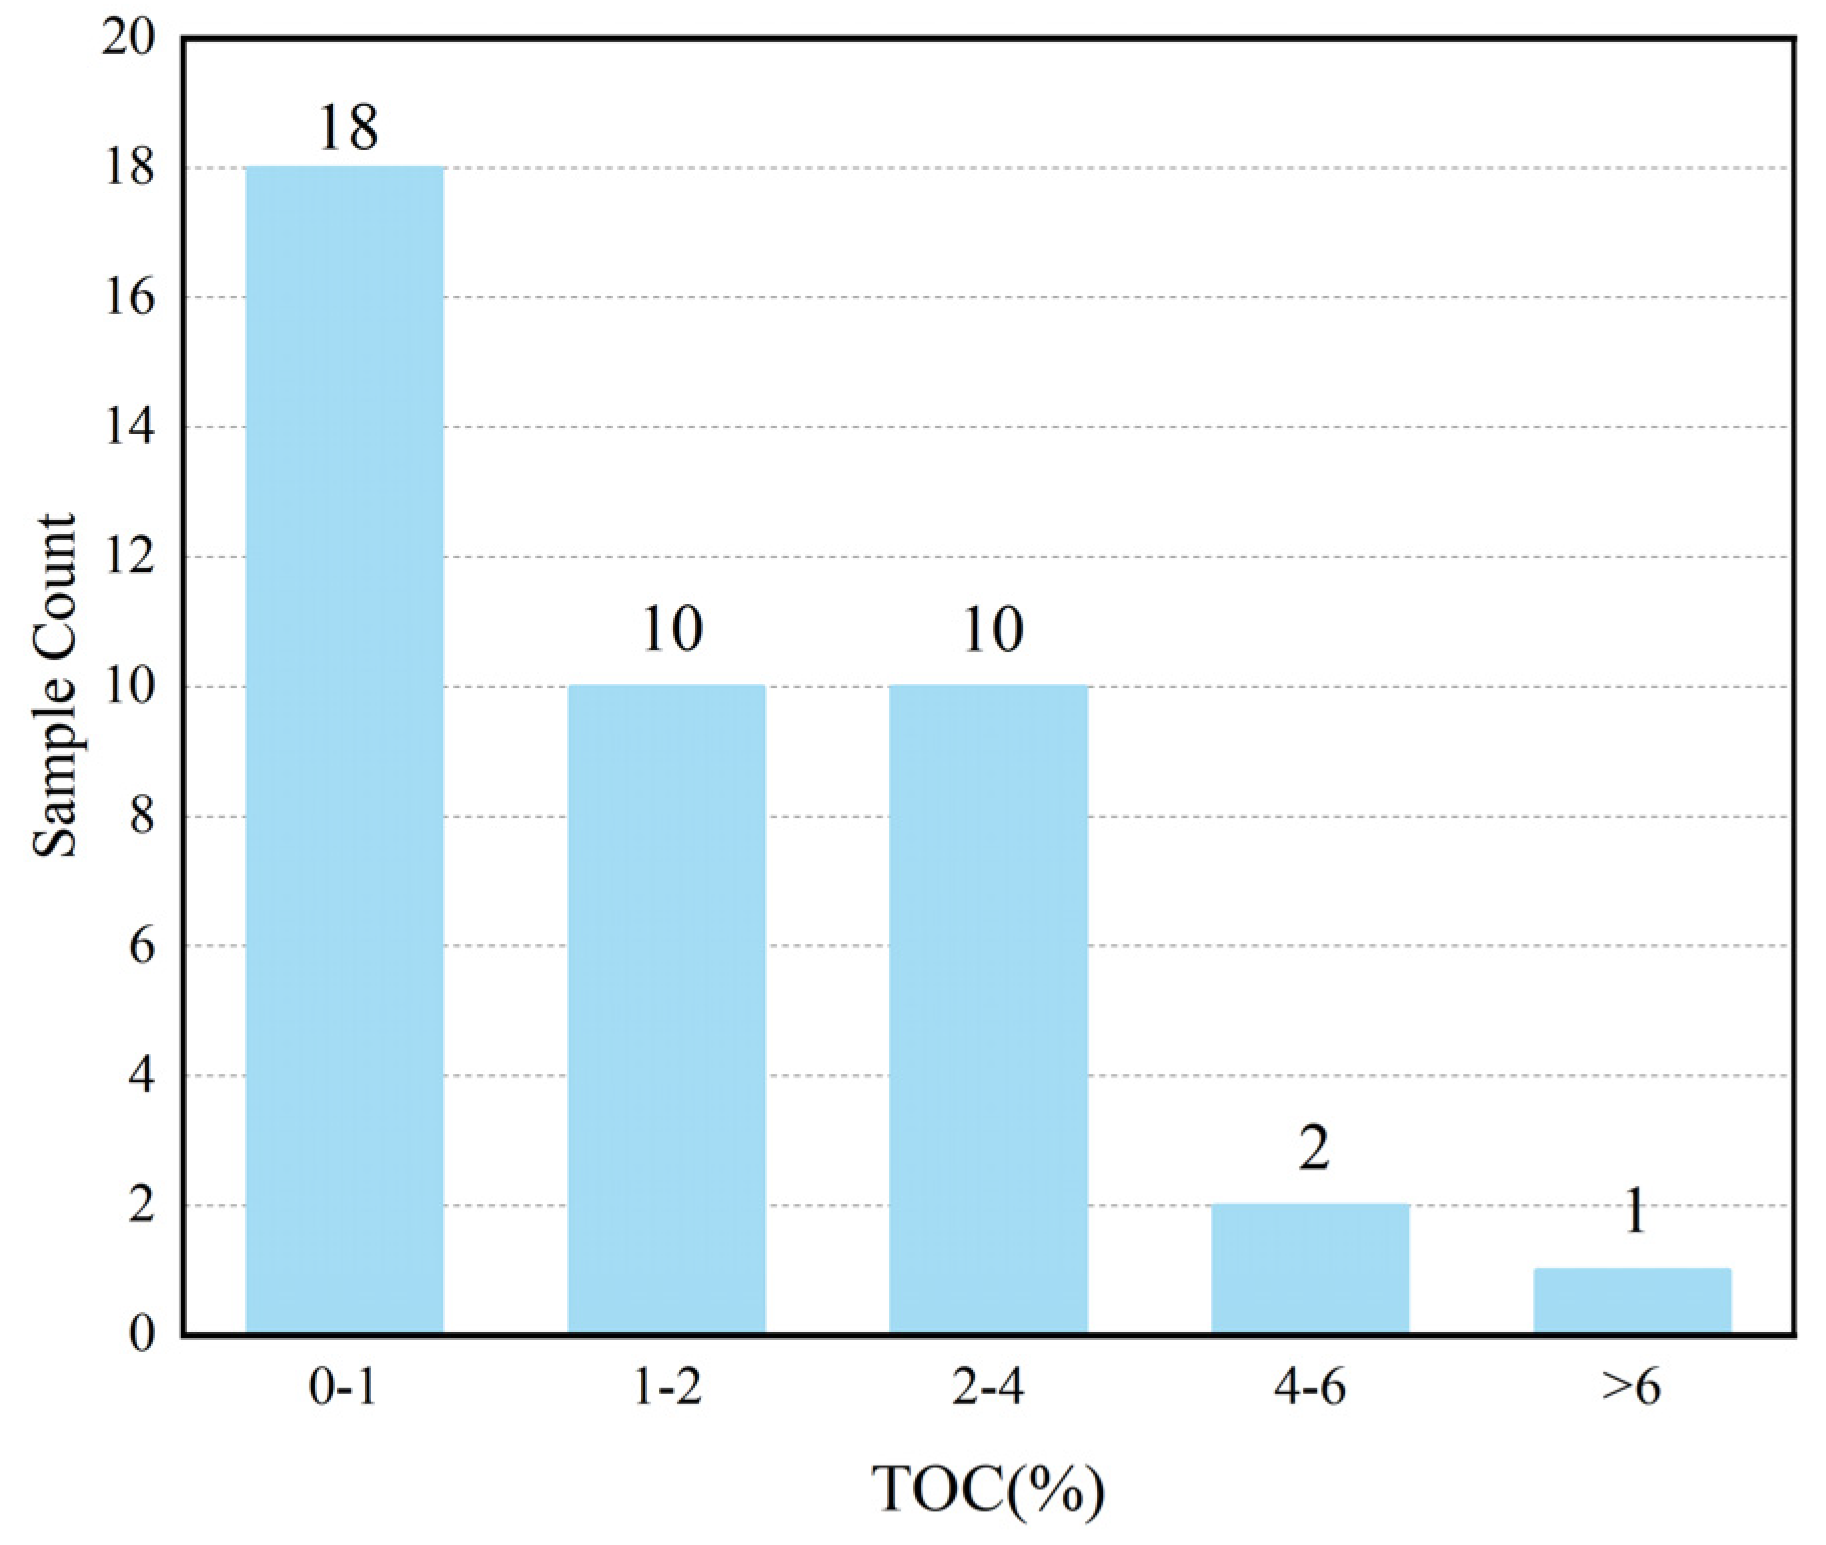
The measured total organic carbon (TOC) content of the analyzed source rock samples ranges from 0.61% to 6.15%, with an average of 1.69% (The complete dataset of TOC and Rock-Eval pyrolysis for all 41 samples is provided in Appendix A Table A2). Based on established TOC thresholds for source rock evaluation, the samples are classified as follows: 13 are high-quality source rocks (TOC > 2%), 10 are good source rocks (TOC 1–2%), and 18 are ordinary source rocks (TOC 0.5–1%). At the sub-member scale, the Chang 73 interval exhibits the highest organic richness, with an average TOC of 2.8%, meeting the criterion for high-quality source rocks. The Chang 72 sub-member also shows considerable organic matter abundance, with an average TOC of 2.23% (Figure 4).
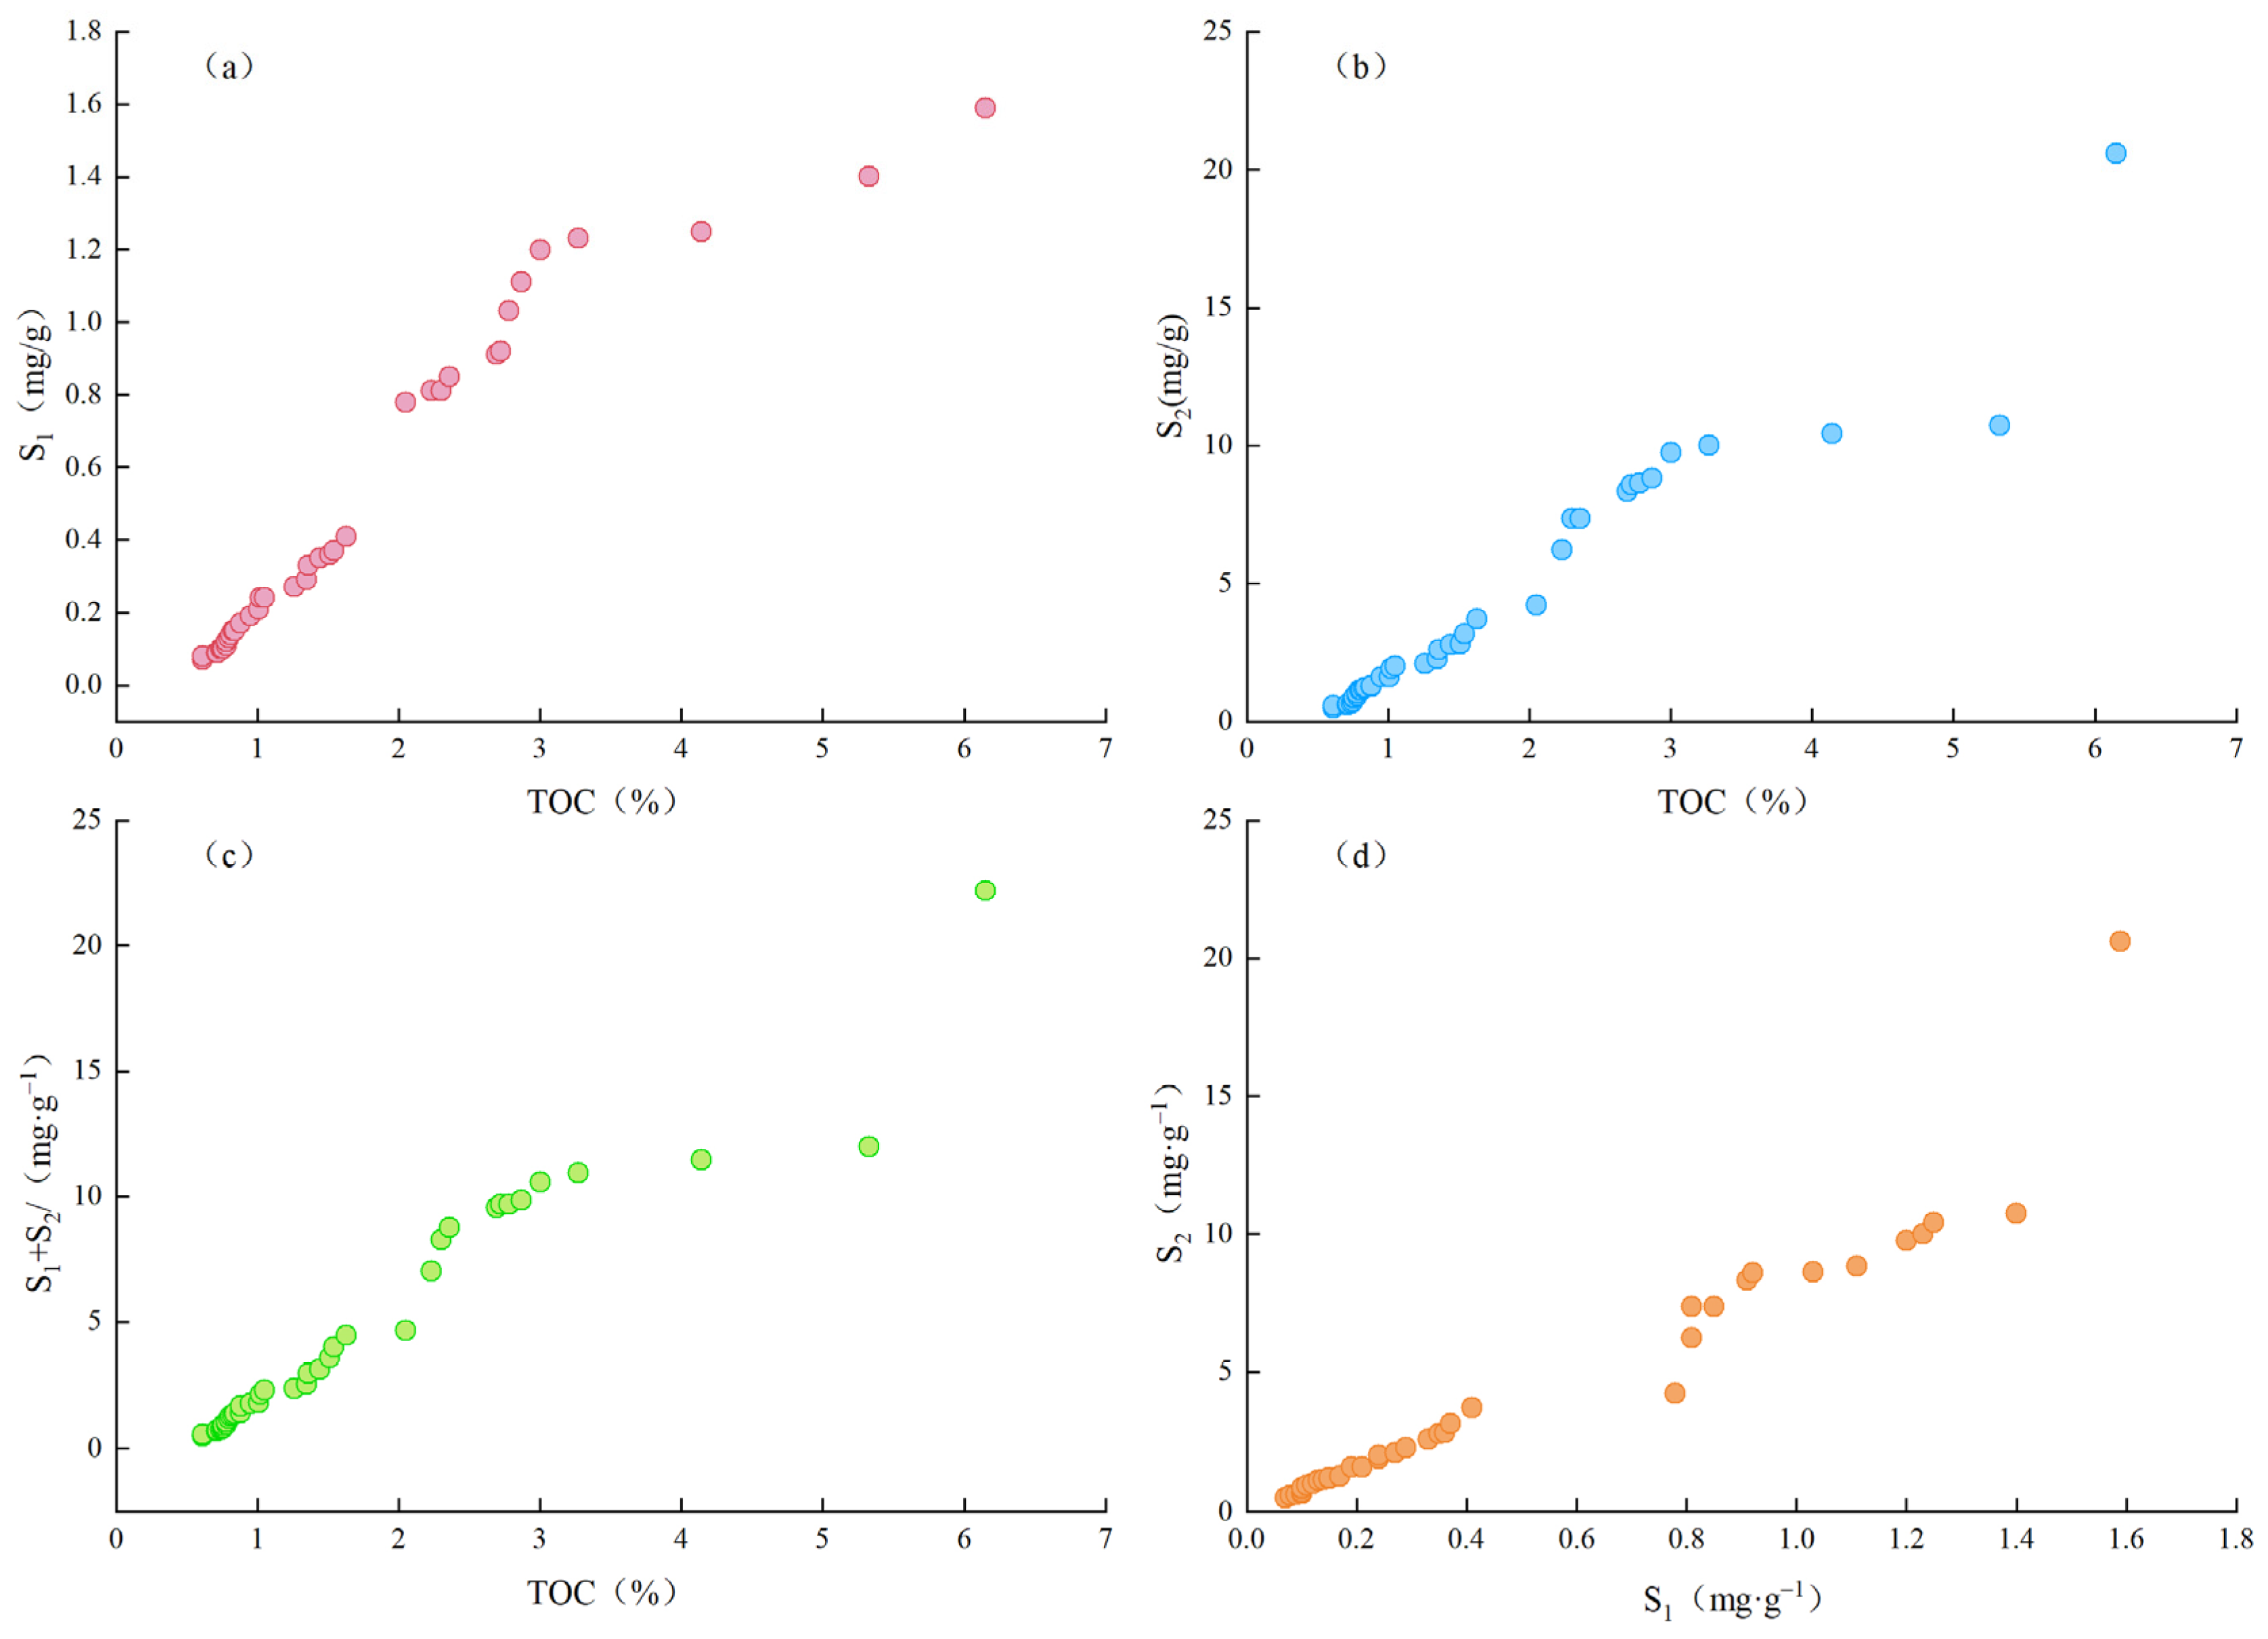
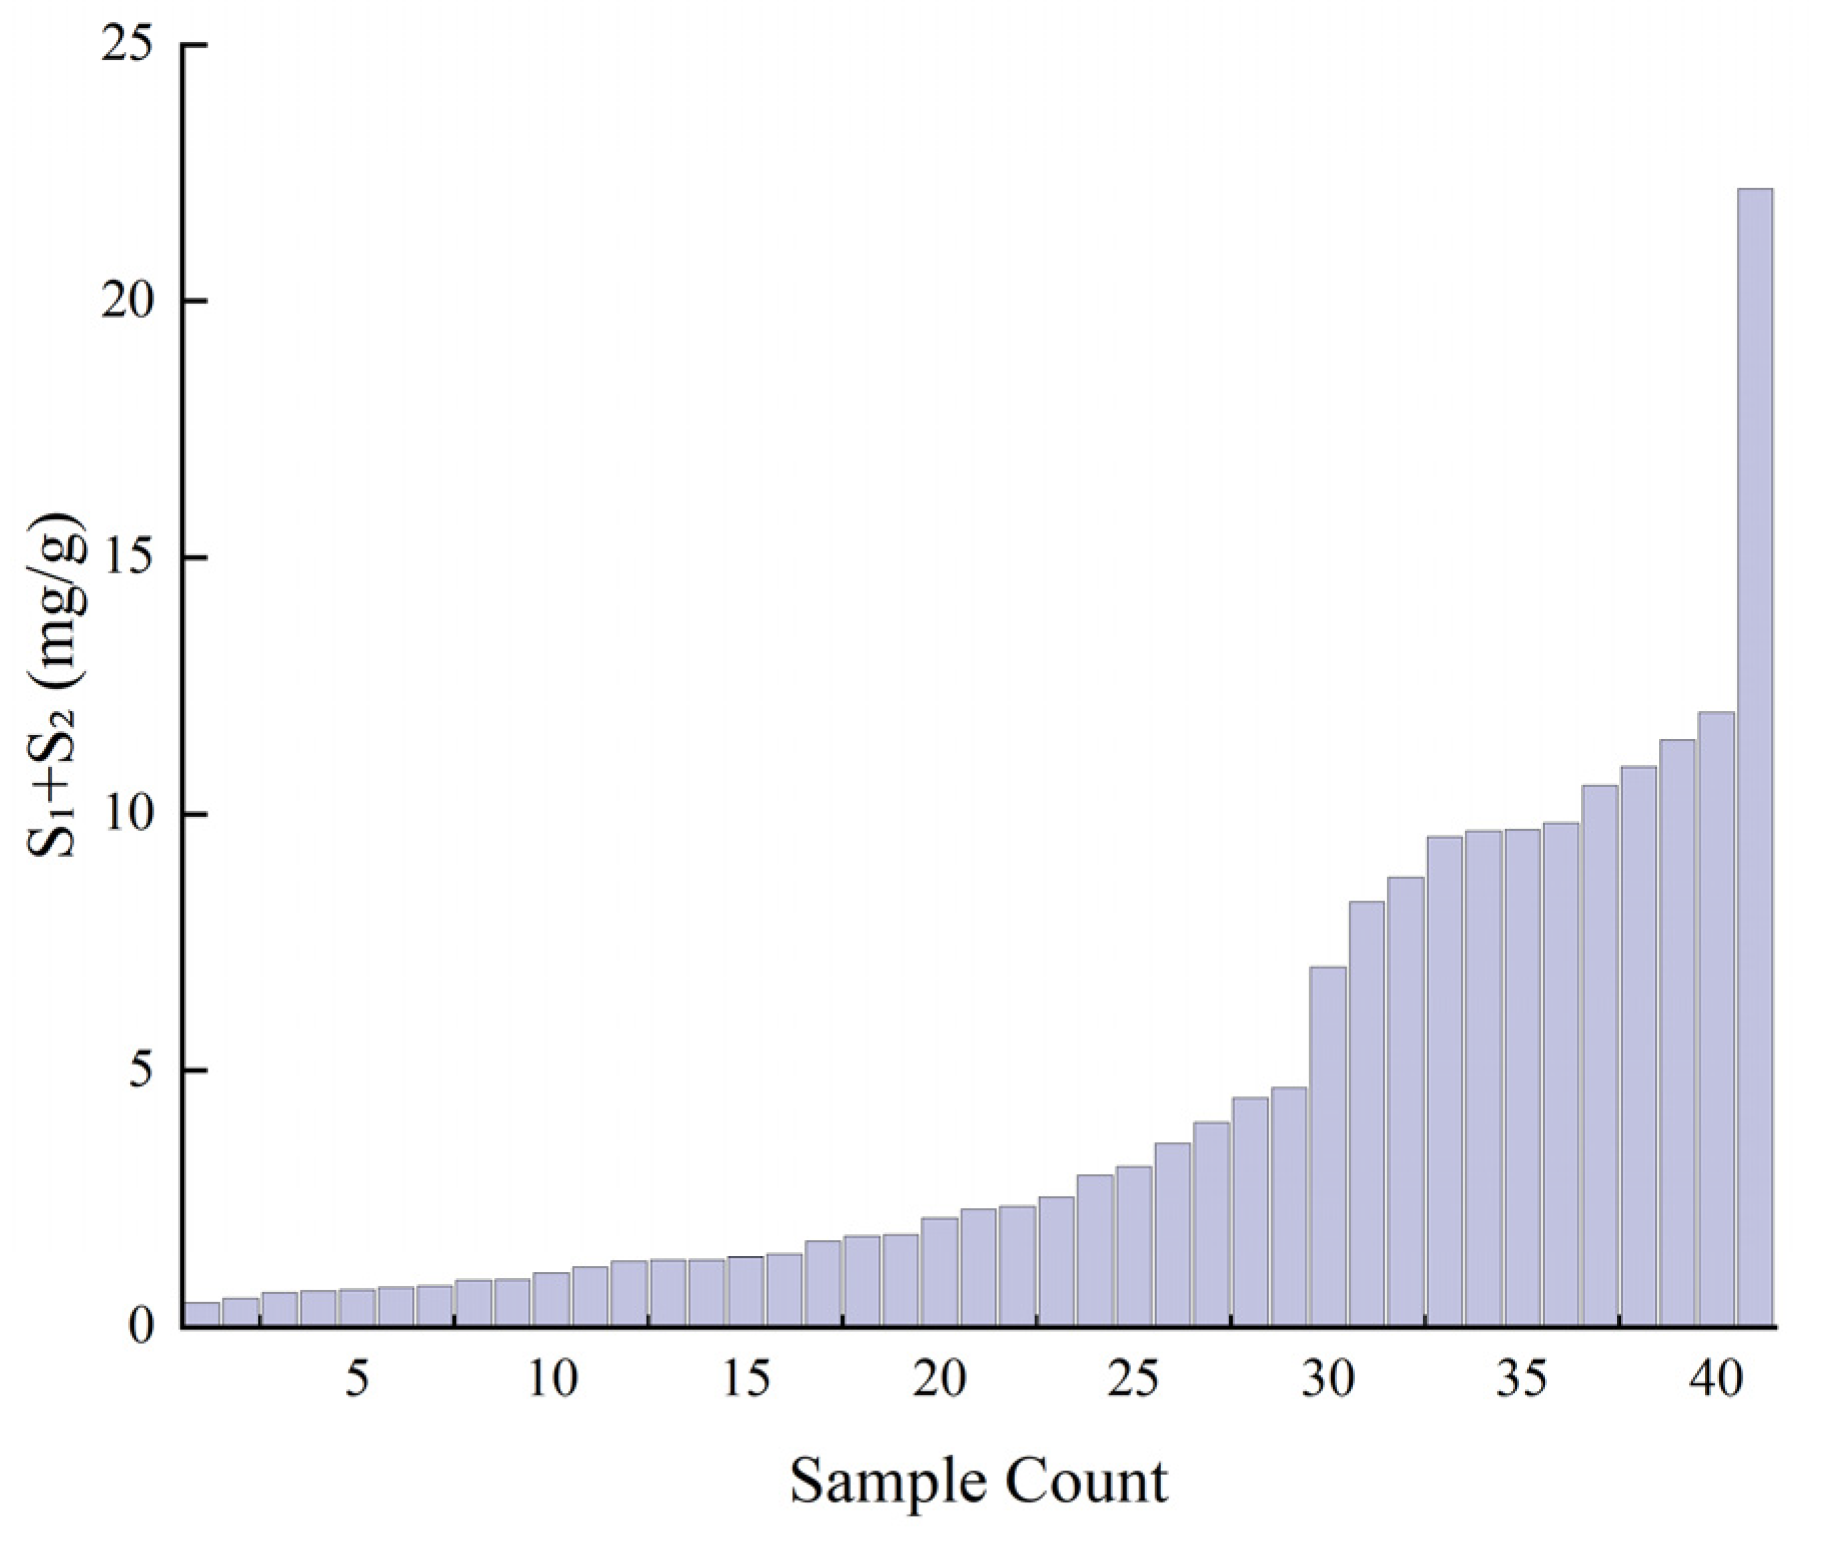
The hydrocarbon generation potential (S1 + S2) of the samples ranges from 0.48 to 22.19 mg/g, with an average of 4.45 mg/g (Figure 5). The TOC content exhibits a strong positive linear correlation with S1, S2, and the total S1 + S2 values (Figure 6). Specifically, the content of free hydrocarbons (S1) varies from 0.07 to 1.59 mg/g (average 0.47 mg/g), while the pyrolyzable hydrocarbon yield (S2) ranges from 0.49 to 20.6 mg/g (average 4.18 mg/g).
This confirms that the organic matter in the studied source rocks is the primary contributor to both the detectable hydrocarbons (S1) and the potential generative hydrocarbons (S2). This correlation indicates that organic matter abundance (TOC) directly controls the source rock’s hydrocarbon potential, and the conversion efficiency of organic matter is relatively consistent across samples. Variations in slopes may reflect minor differences in organic matter type or maturity, but the overall trend supports the use of TOC as a reliable proxy for evaluating the generative capacity of these source rocks.
As indicated in Table 1, significant variations exist in the average hydrocarbon generation potential among different sub-members. The Zhangjiatan shale exhibits superior hydrocarbon generation capacity compared to the other intervals, although its potential only meets the criteria for ordinary source rocks. The average values for the remaining layers fall below the threshold required for effective hydrocarbon generation.

4.1.3. Organic Matter Type

Organic matter types in this study were classified by integrating petrographic composition and geochemical parameters, following the kerogen classification scheme of Peters [28] and using maceral terminology defined by the International Committee for Coal and Organic Petrology (ICCP, 1994).
(1)
Type II1 (Oil-Prone Mixed Type): This type is characterized by a high hydrogen index (HI > 300 mg HC/g TOC) and a maceral composition dominated by alginite (aquatic algae, a liptinite maceral per ICCP 1994) and vitrinite (terrestrial plants). It represents excellent potential for generating liquid hydrocarbons and is typically deposited in suboxic lacustrine environments with significant contributions from both aquatic and terrestrial organic matter.
(2)
Type II2 (Oil–Gas Transitional Type): This type has a moderate hydrogen index (HI generally 200–300 mg HC/g TOC). Petrographically, it contains a lower proportion of alginite and a higher proportion of vitrinite compared to Type II1, indicating a greater terrestrial input. It possesses significant oil generation potential and appreciable gas generation potential upon higher maturity, often associated with shallow lacustrine or deltaic settings.
(3)
Type III (Gas-Prone Humic Type): This type is defined by a low hydrogen index (HI < 200 mg HC/g TOC). It is petrographically dominated by vitrinite and inertinite, with minimal liptinite (including alginite) content. It is primarily gas-generating and indicative of oxidizing terrestrial (e.g., swampy) depositional environments.
A total of four samples from the Chang 7 Member were analyzed for organic matter type. Due to the limited number of samples (n = 4) available for maceral analysis, the results presented here should be interpreted with caution and may not fully represent the heterogeneity of organic matter types across the entire Pingbei area. They are, however, considered indicative of the dominant kerogen type. Among these, three samples from the Chang 72 sub-member are classified as Type II (mixed-type) organic matter, while one sample from the Chang 73 sub-member is identified as Type III (humic type).
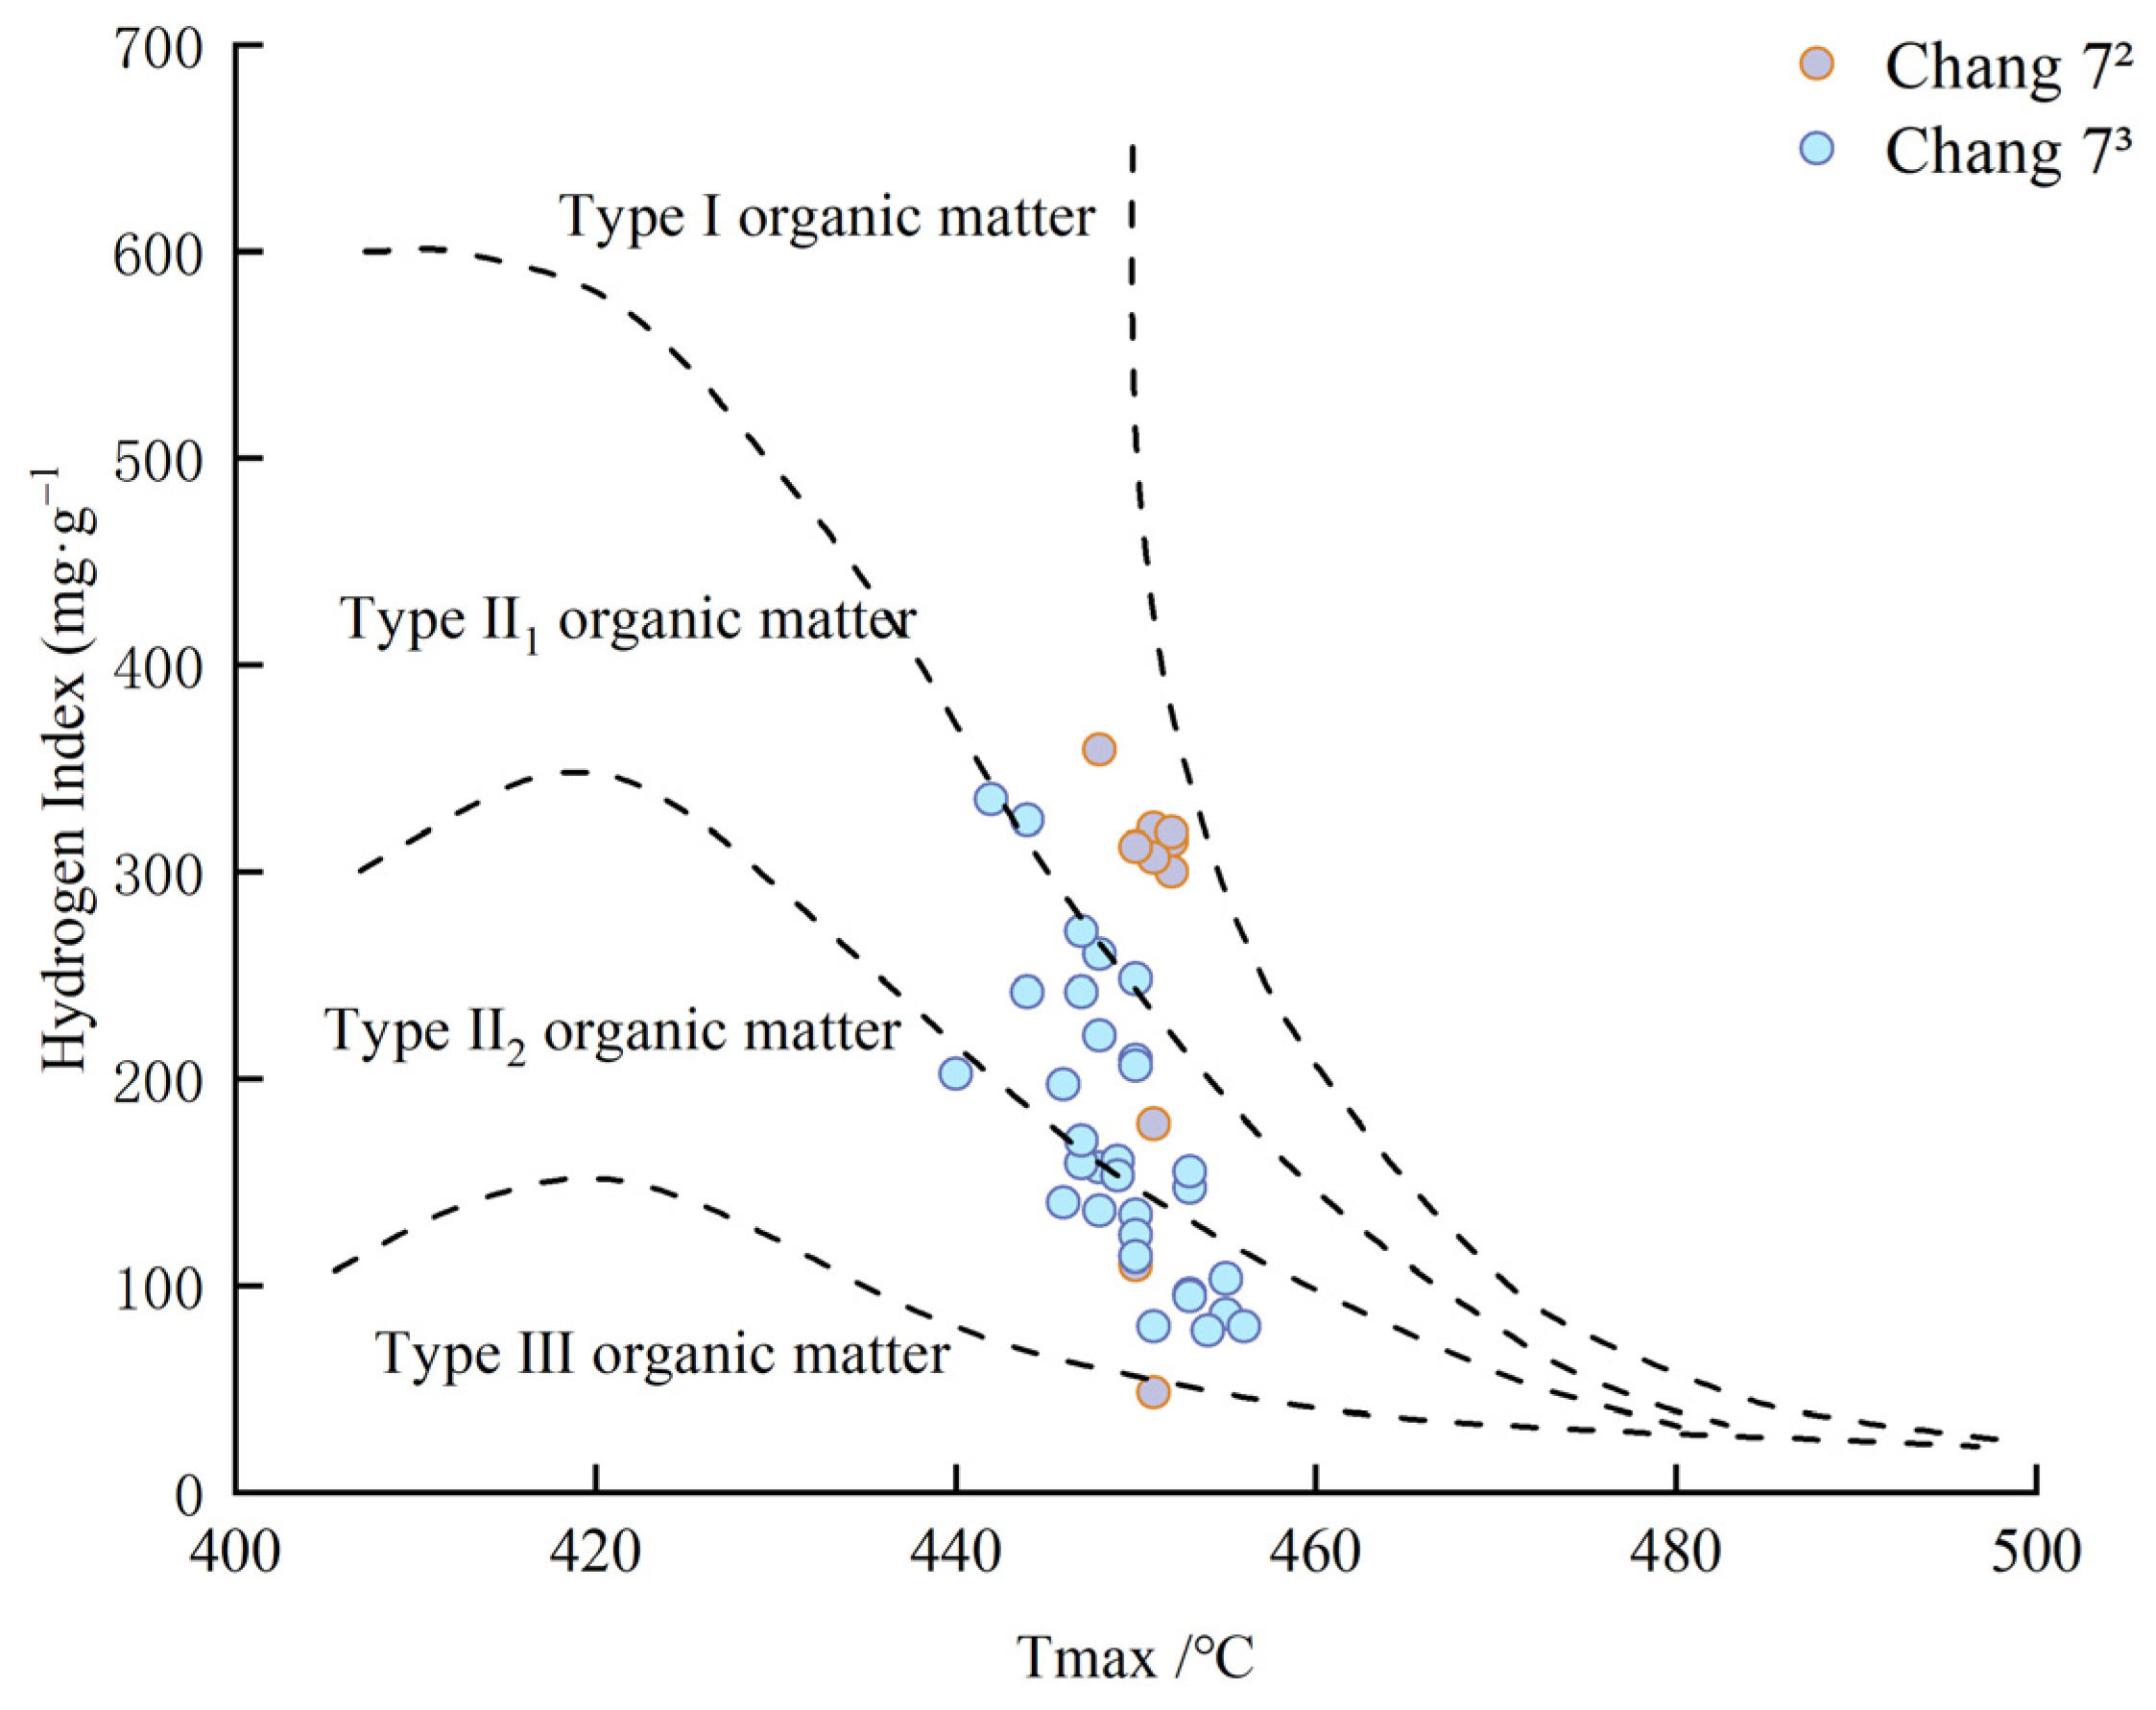
Microscopic identification of macerals yielded the following compositional ranges: alginite (35.7–65.7%), liptinite (36.4–67%), vitrinite (32.7–63.3%), and inertinite (0.3–0.7%). Based on maceral composition, the organic matter is predominantly Type II1, with minor contributions from Type II2 and Type III (Table 2). The HI of the Chang 72 sub-member ranges from 48.19 to 359 mg/g (average 257 mg/g); the HI of the Chang 73 sub-member ranges from 78 to 335 mg/g (average 172 mg/g). The HI-Tmax cross-plot confirms the organic matter type distribution (Figure 7).
Maceral identification based on four polished sections revealed a composition dominated by alginite and vitrinite (Table 2), consistent with Type II1 kerogen. The representativeness of this limited dataset is discussed in Section 5.7.

4.1.4. Organic Matter Maturity

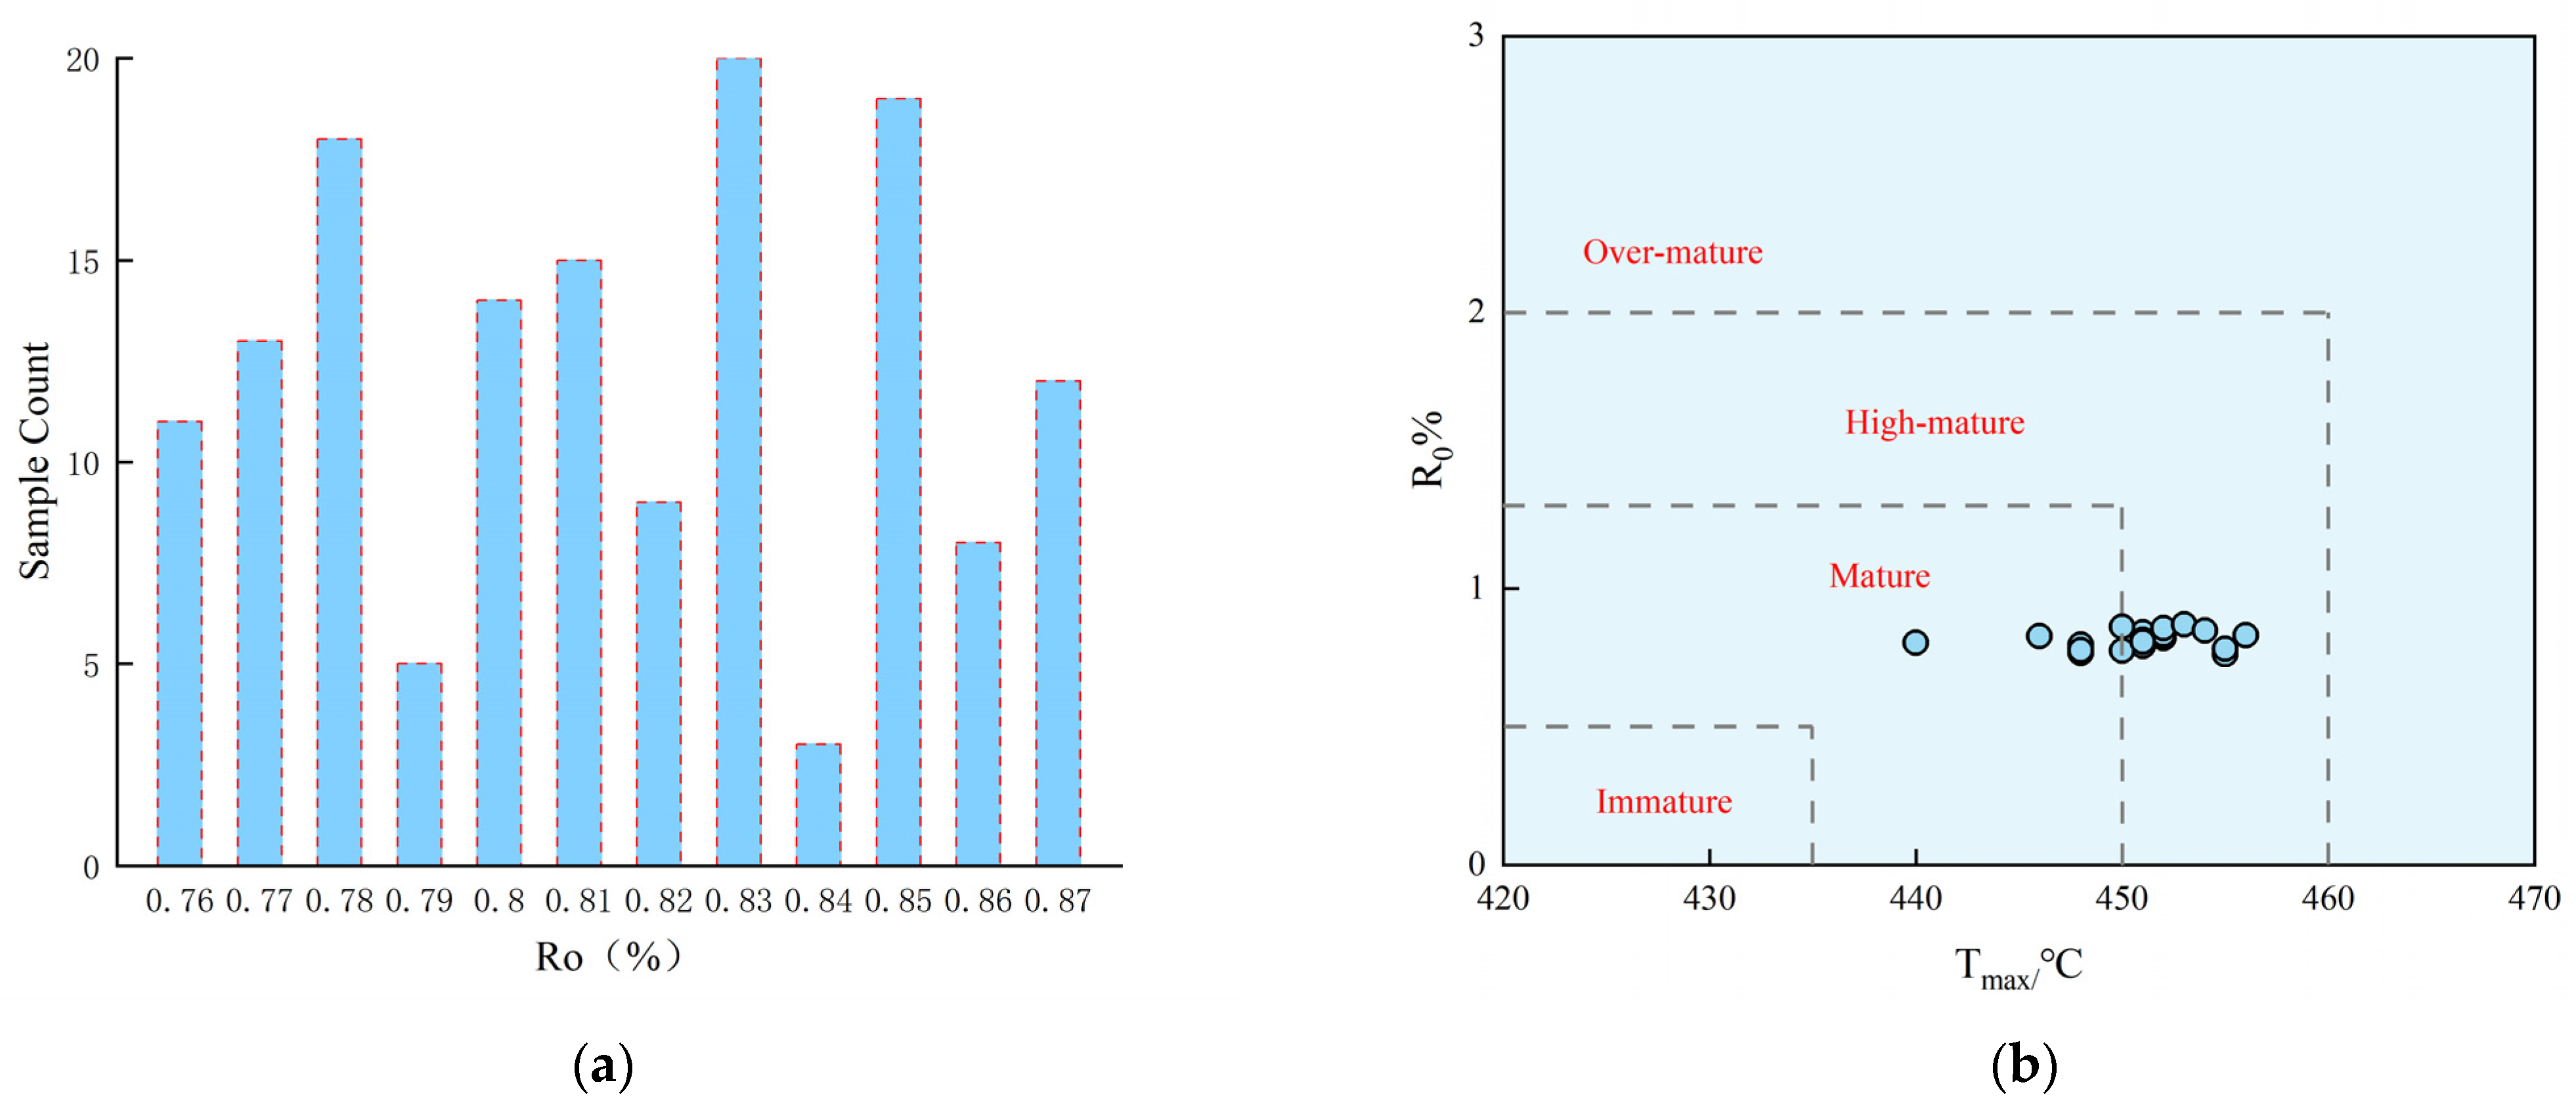
Organic matter maturity is a fundamental parameter for assessing the hydrocarbon generation potential of source rocks, as it directly governs the conversion efficiency of organic matter into hydrocarbons [29]. The measured maturity parameters for the studied samples are as follows: vitrinite reflectance (Ro) measurements on 20 representative samples yielded a range from 0.76% to 0.87% (detailed data, including mean, standard deviation, and measurement count for each sample, are provided in Table A1; see the distribution histogram in Figure 8a); the maximum pyrolysis temperature (Tmax) varies between 440 and 456 °C (Figure 8b); and the hydrocarbon conversion index (HCI) spans from 10 to 68 mg/g TOC, with an average of 23.8 mg/g TOC. In accordance with the petroleum industry standard SY/T 5735-2019, these collective indicators place the source rocks within the mature stage, corresponding to the peak window for liquid hydrocarbon generation.
Vitrinite reflectance measurements were conducted on 20 representative samples. Following the ASTM D7708 standard guideline, a minimum of 20 valid measurements were targeted per sample. Outliers, identified as values deviating by more than two standard deviations from the initial mean, were excluded prior to calculating the final mean Ro and standard deviation for each sample (see Table A1 for detailed data). Although the final number of valid measurements for some samples was slightly below 20, the consistency of Ro values with other maturity parameters (e.g., biomarker ratios) supports the reliability of the dataset (see Section 5.4).
Both Ro (Table A1) and Tmax (Appendix A Table A2) values for the corresponding set of 20 source rock samples indicate a mature stage. However, a plot of mean Ro versus Tmax for these paired samples does not show a strong linear correlation (Figure 8b). The potential reasons for this discrepancy, including organic matter type heterogeneity and potential methodological factors, are analyzed in Section 5.4.

4.2. Geochemical Characteristics and Classification of Crude Oils

4.2.1. Saturated Hydrocarbon Chromatographic Characteristics

Isoprenoid alkane assemblages were detected in all crude oil samples. In strongly reducing and hypersaline depositional settings, phytane typically shows distinct predominance with relatively high abundance, whereas pristane tends to dominate in more oxidizing environments such as swamps [30]. As shown in Table 3, the measured parameters for the studied oils are as follows: the pristane/C17 ratio (Pr/C17) ranges from 0.12 to 0.21, the phytane/C18 ratio (Ph/C18) from 0.07 to 0.25, and the pristane/phytane ratio (Pr/Ph) from 0.84 to 1.78. Notably, crude oils from the Chang 7 Member exhibit higher Pr/Ph values (1.77–1.78), suggesting their source rocks were deposited in a suboxic to weakly oxic environment, while those from shallow reservoirs show lower ratios (0.80–0.89) indicative of a more strongly reducing depositional setting. Variations in Pr/C17 and Ph/C18 ratios are related to organic matter input and maturity, with higher values often associated with greater terrestrial contribution or lower maturity.
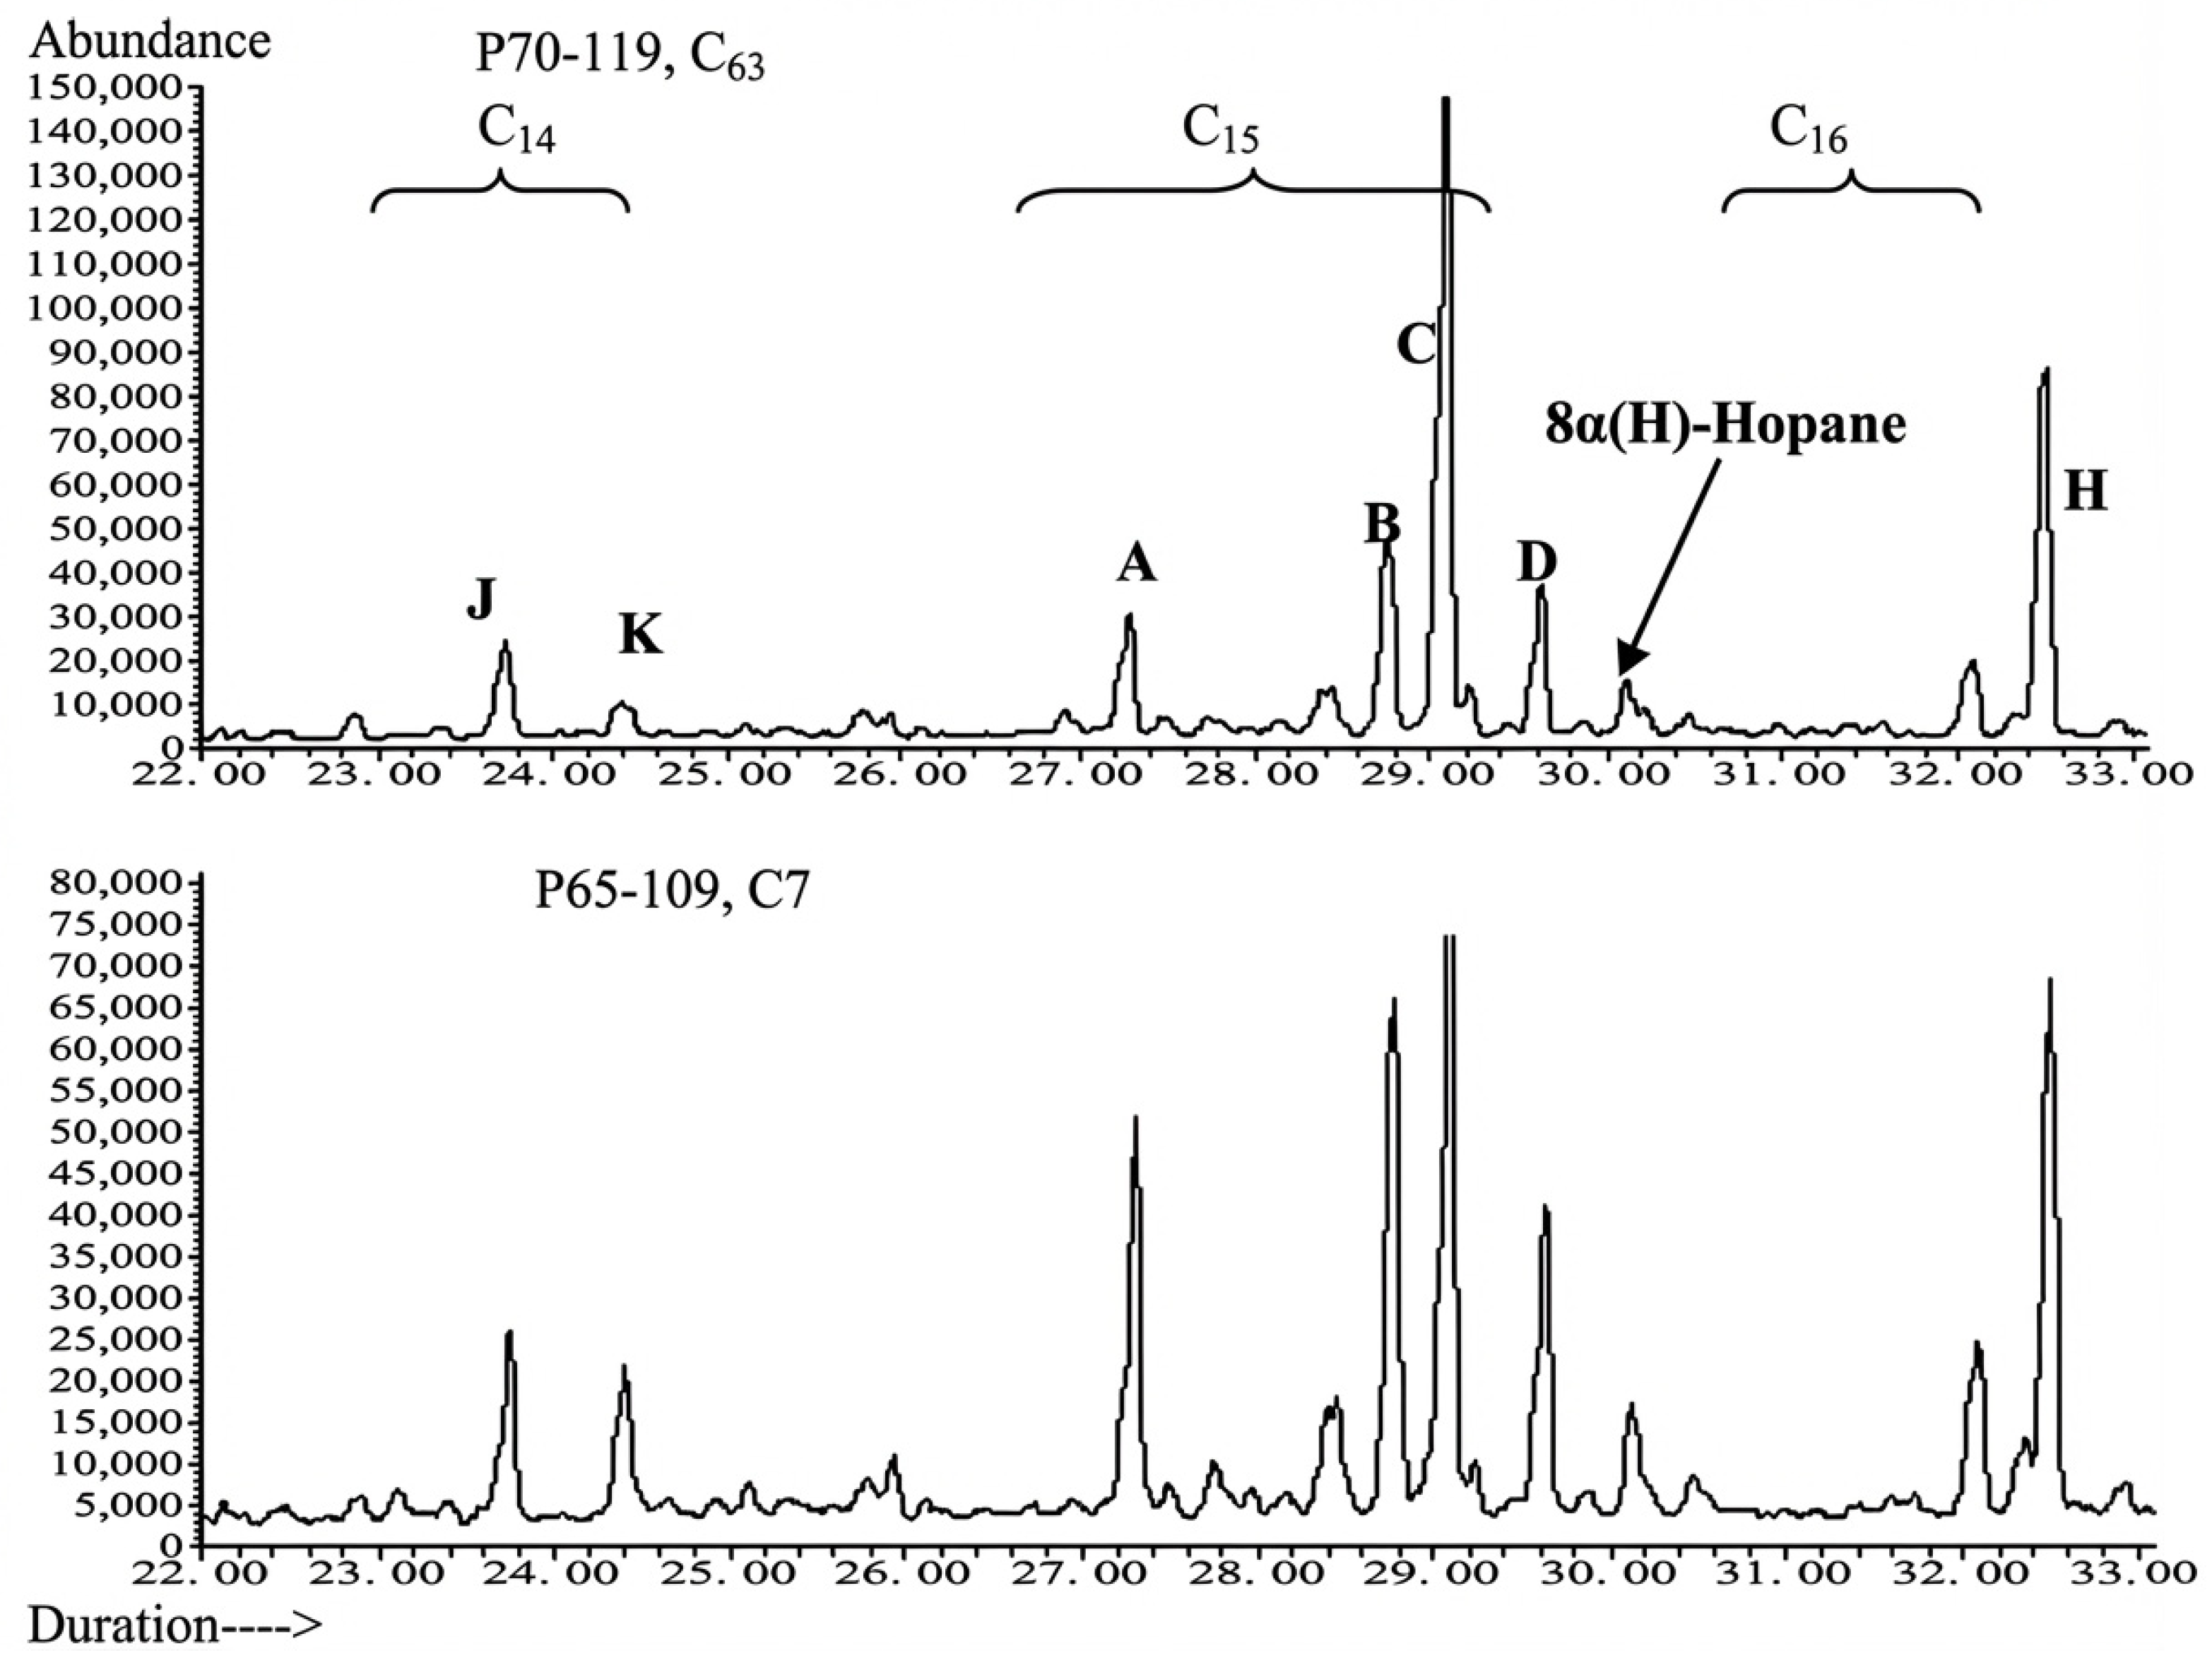
Figure 9 is an m/z 123 mass chromatogram showing the detection of bicyclic sesquiterpenoids, a typical terrestrial biomarker whose isomer distribution is controlled by maturity and source facies. It compares two key samples: the upper plot represents Type B crude oil from P70-119 (Chang 63, shallow reservoir) with higher J/K ratios (1.63–1.74) and lower (A + B)/C ratios (0.53–0.68), indicating relatively low maturity and distinct terrestrial organic matter input; the lower plot corresponds to Type A crude oil from P65-109 (Chang 7, deep reservoir) with lower J/K ratios (0.37–0.92) and significantly higher (A + B)/C ratios (1.40–5.00) (Table 4), reflecting higher thermal maturity consistent with the Chang 7 Member source rocks, showing greater affinity with the characteristics of the Chang 7 source rocks.
The Ts/Tm ratio is primarily controlled by two factors: the degree of thermal evolution and the characteristics of the sedimentary environment [31]. The measured Ts/Tm values for deep crude oils range from 3.47 to 7.18, while those for shallow crude oils are significantly lower, ranging from 0.48 to 0.51. Furthermore, other biomarker ratios, including C29Ts/C29 hopane, C23 tricyclic terpane/C30 hopane, and C30 rearranged hopane/C30 hopane, exhibit variation trends consistent with those of the Ts/Tm ratio (Table 5).

4.2.2. Composition and Distribution Characteristics of Steranes

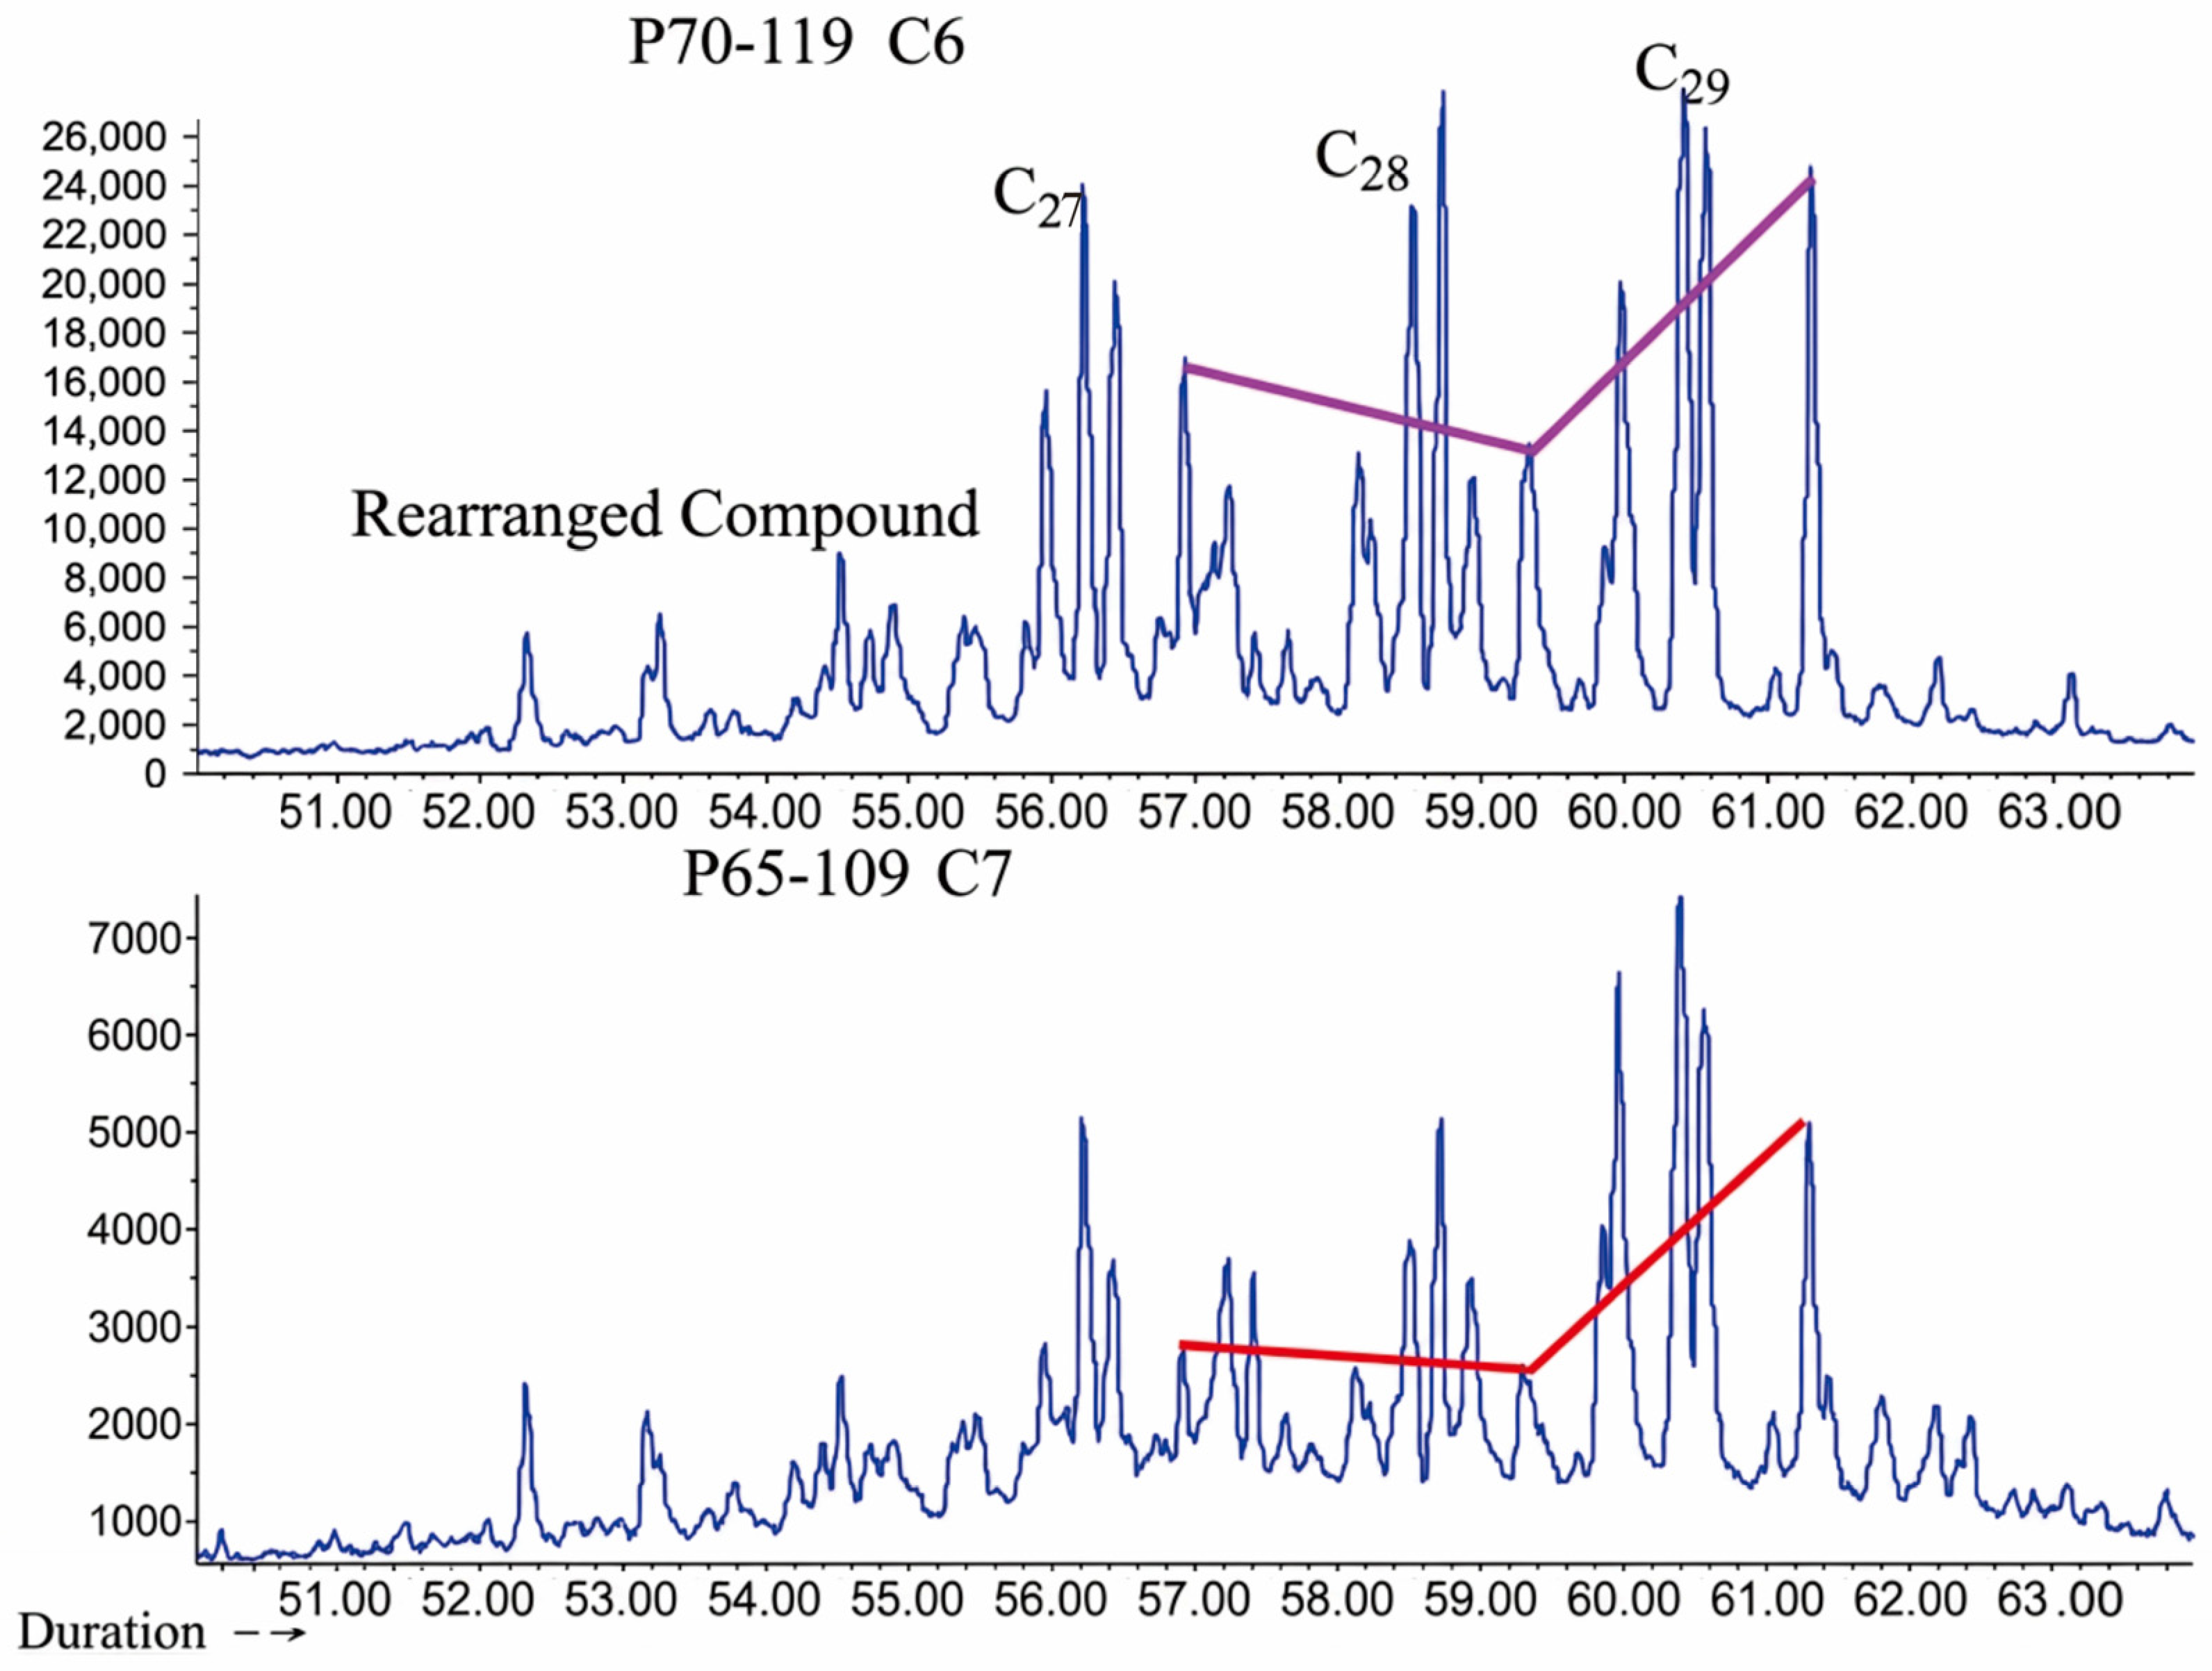
The relative abundances of C27, C28, and C29 regular steranes (ααα20R configuration) in crude oil serve as important indicators for reconstructing organic matter input [32]. It is widely recognized that C27 regular steranes primarily originate from lower aquatic organisms and algae, whereas C29 regular steranes are predominantly derived from terrestrial higher plants [33]. In the analyzed crude oils, regular steranes are overwhelmingly dominant, with their abundances significantly exceeding those of rearranged steranes. The distribution patterns of the ααα20R stereoisomers for C27, C28, and C29 regular steranes reveal distinct trends: shallow crude oils exhibit an asymmetric “V”-shaped pattern with C29 as the dominant peak, while deep crude oils display an inverted “L”-shaped distribution (Figure 10). This shift in sterane profile indicates a transition in the primary source of organic matter from terrestrial higher plants to aquatic algae with increasing burial depth [34].
Quantitative analysis of sterane parameters reveals distinct differences between deep and shallow crude oils. The ratio of C27 rearranged steranes to regular steranes ranges from 1.24 to 2.67 in deep crude oils, compared to a significantly lower range of 0.36–0.38 in shallow crude oils. Furthermore, maturity-sensitive sterane parameters indicate that all samples have entered the mature stage: the C29 sterane 20S/(20S + 20R) ratios range from 0.53 to 0.61, and the C29 sterane ββ/(αα + ββ) ratios range from 0.52 to 0.59 (Table 6).

4.2.3. Characteristics of Aromatic Hydrocarbon Compounds

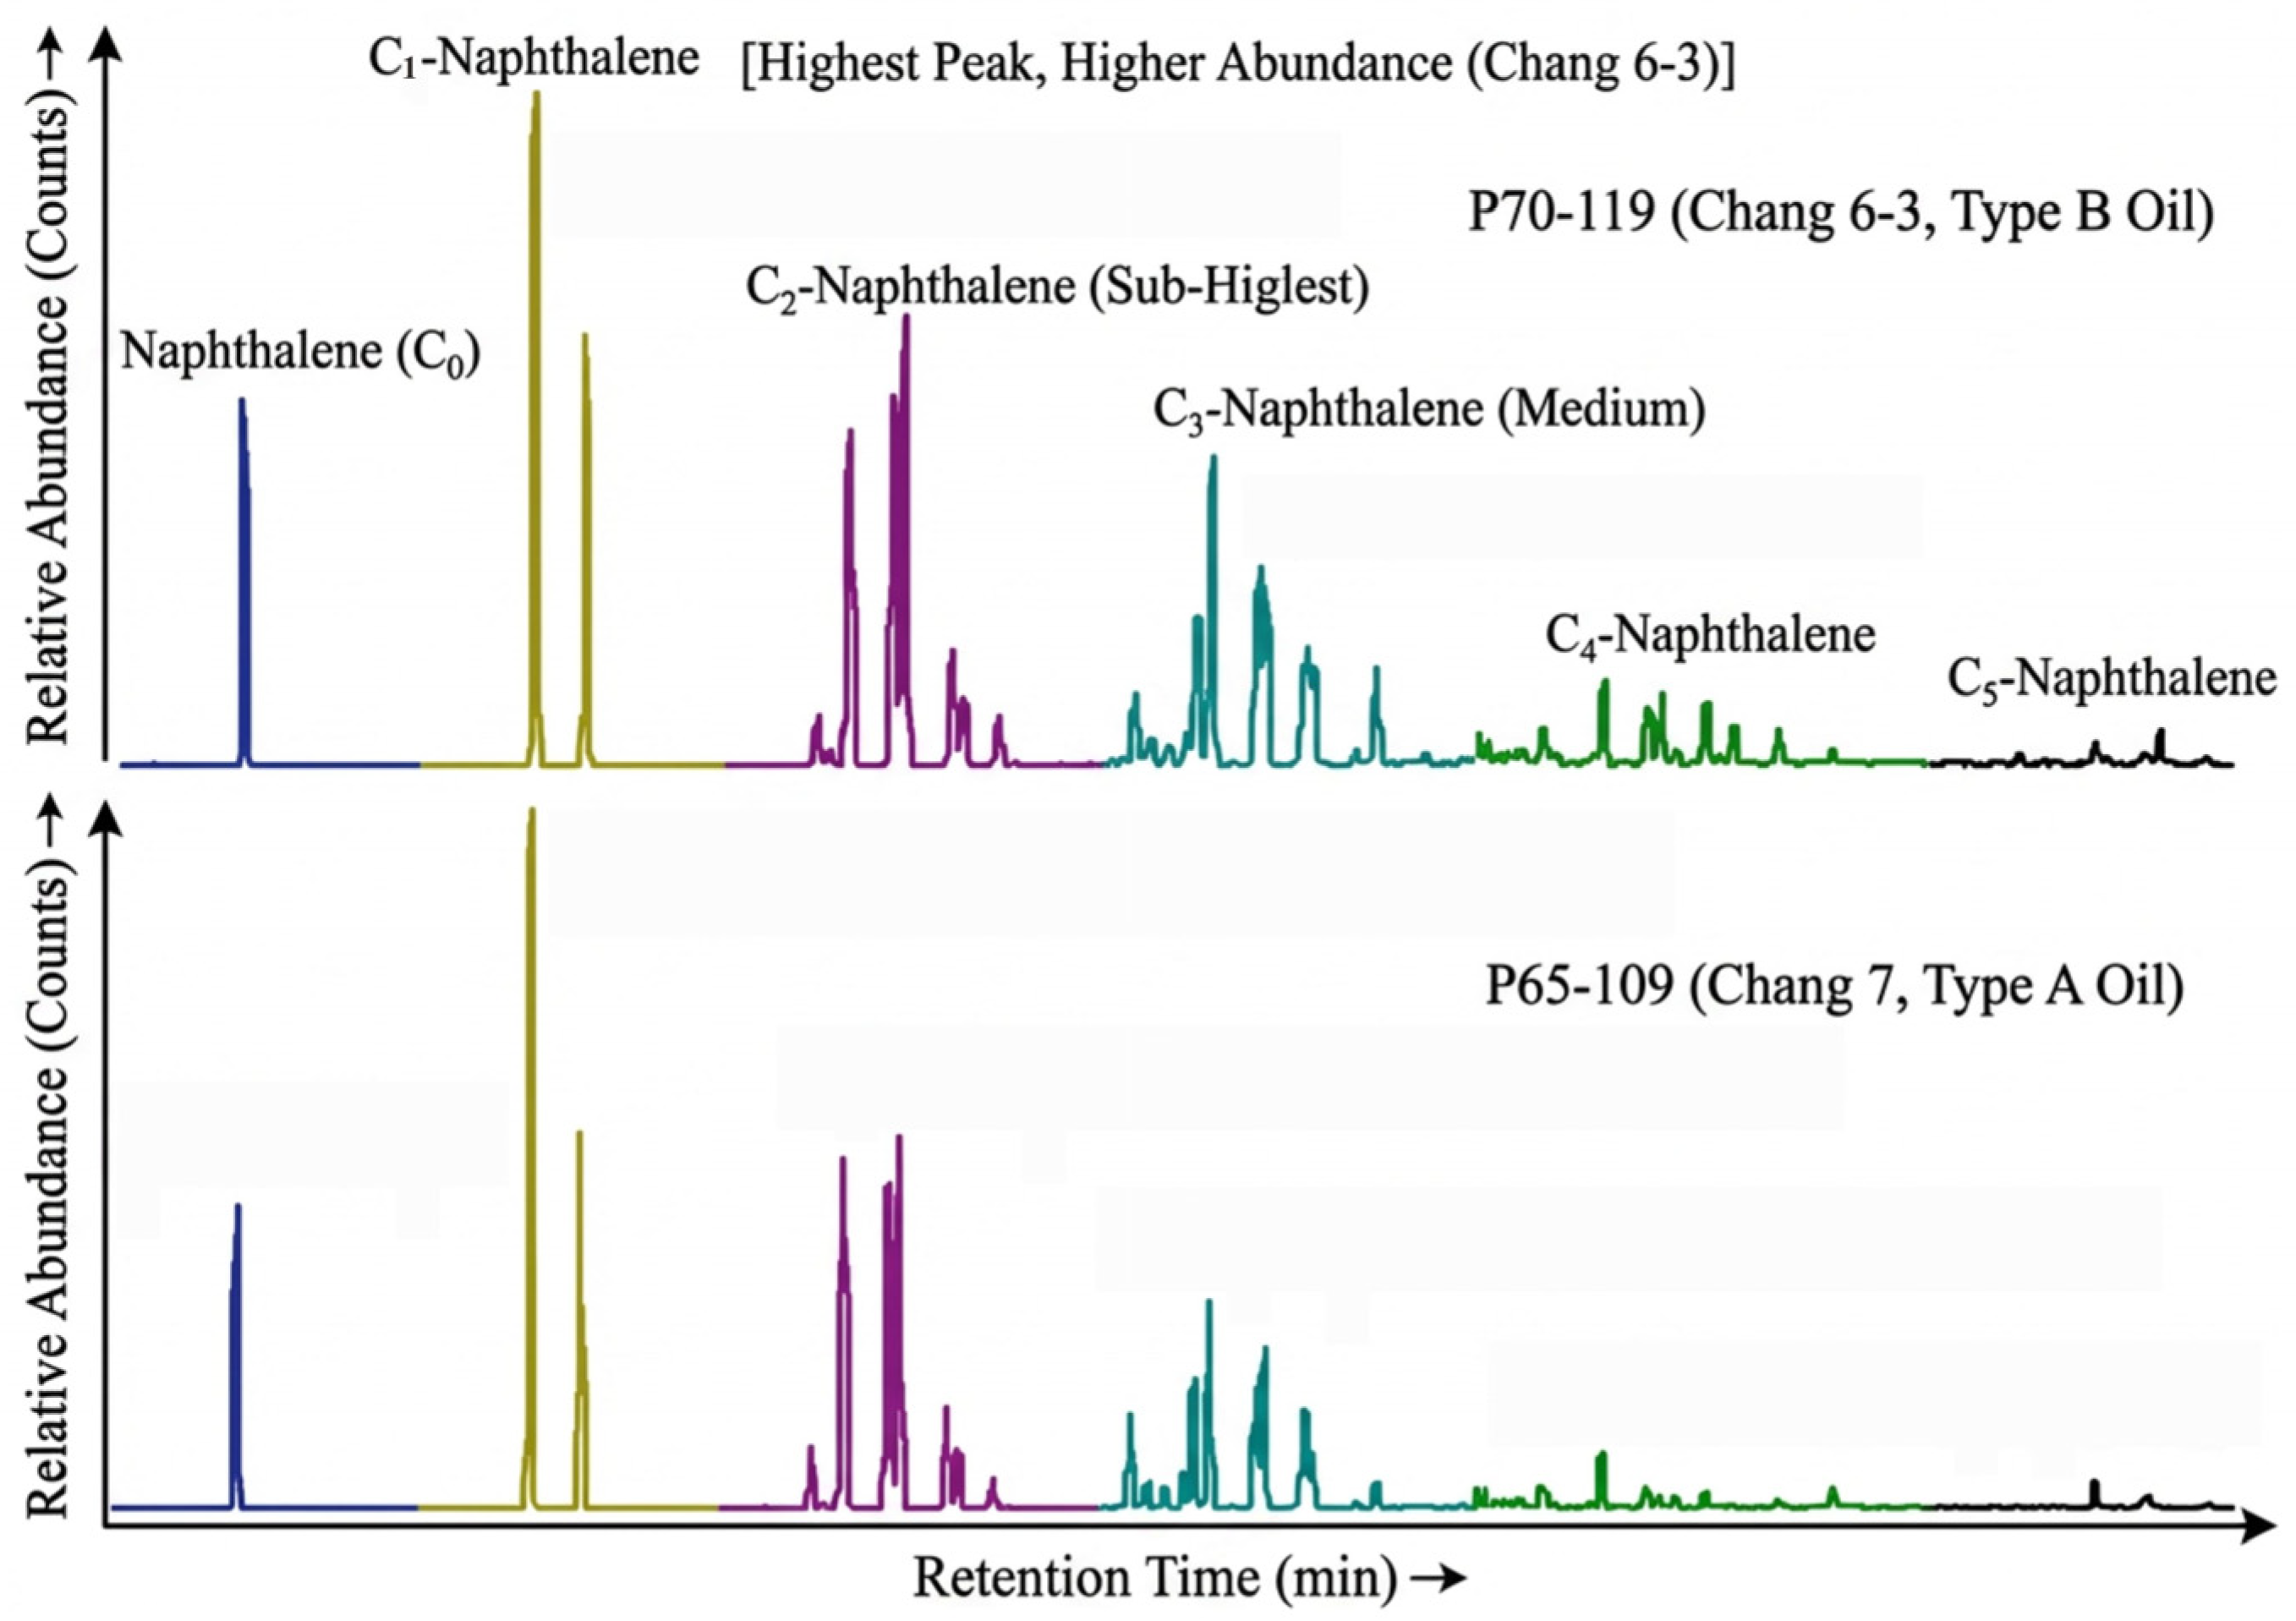
GC–MS analysis indicates that the aromatic hydrocarbon profiles of crude oils from the Chang 6 and Chang 7 Members exhibit systematic differences consistent with thermal maturation. Within the naphthalene series, methylnaphthalenes show the highest abundance, with a progressive decrease as the number of alkyl substituents increases. A comparative analysis between the two members reveals that the relative abundances of C1-, C2-, and C3-naphthalene homologs are significantly higher in Chang 7 crude oils than in Chang 6 crude oils (Figure 11). This distribution trend suggests the preferential enrichment of lower-ring-number aromatic compounds with increasing thermal maturity.
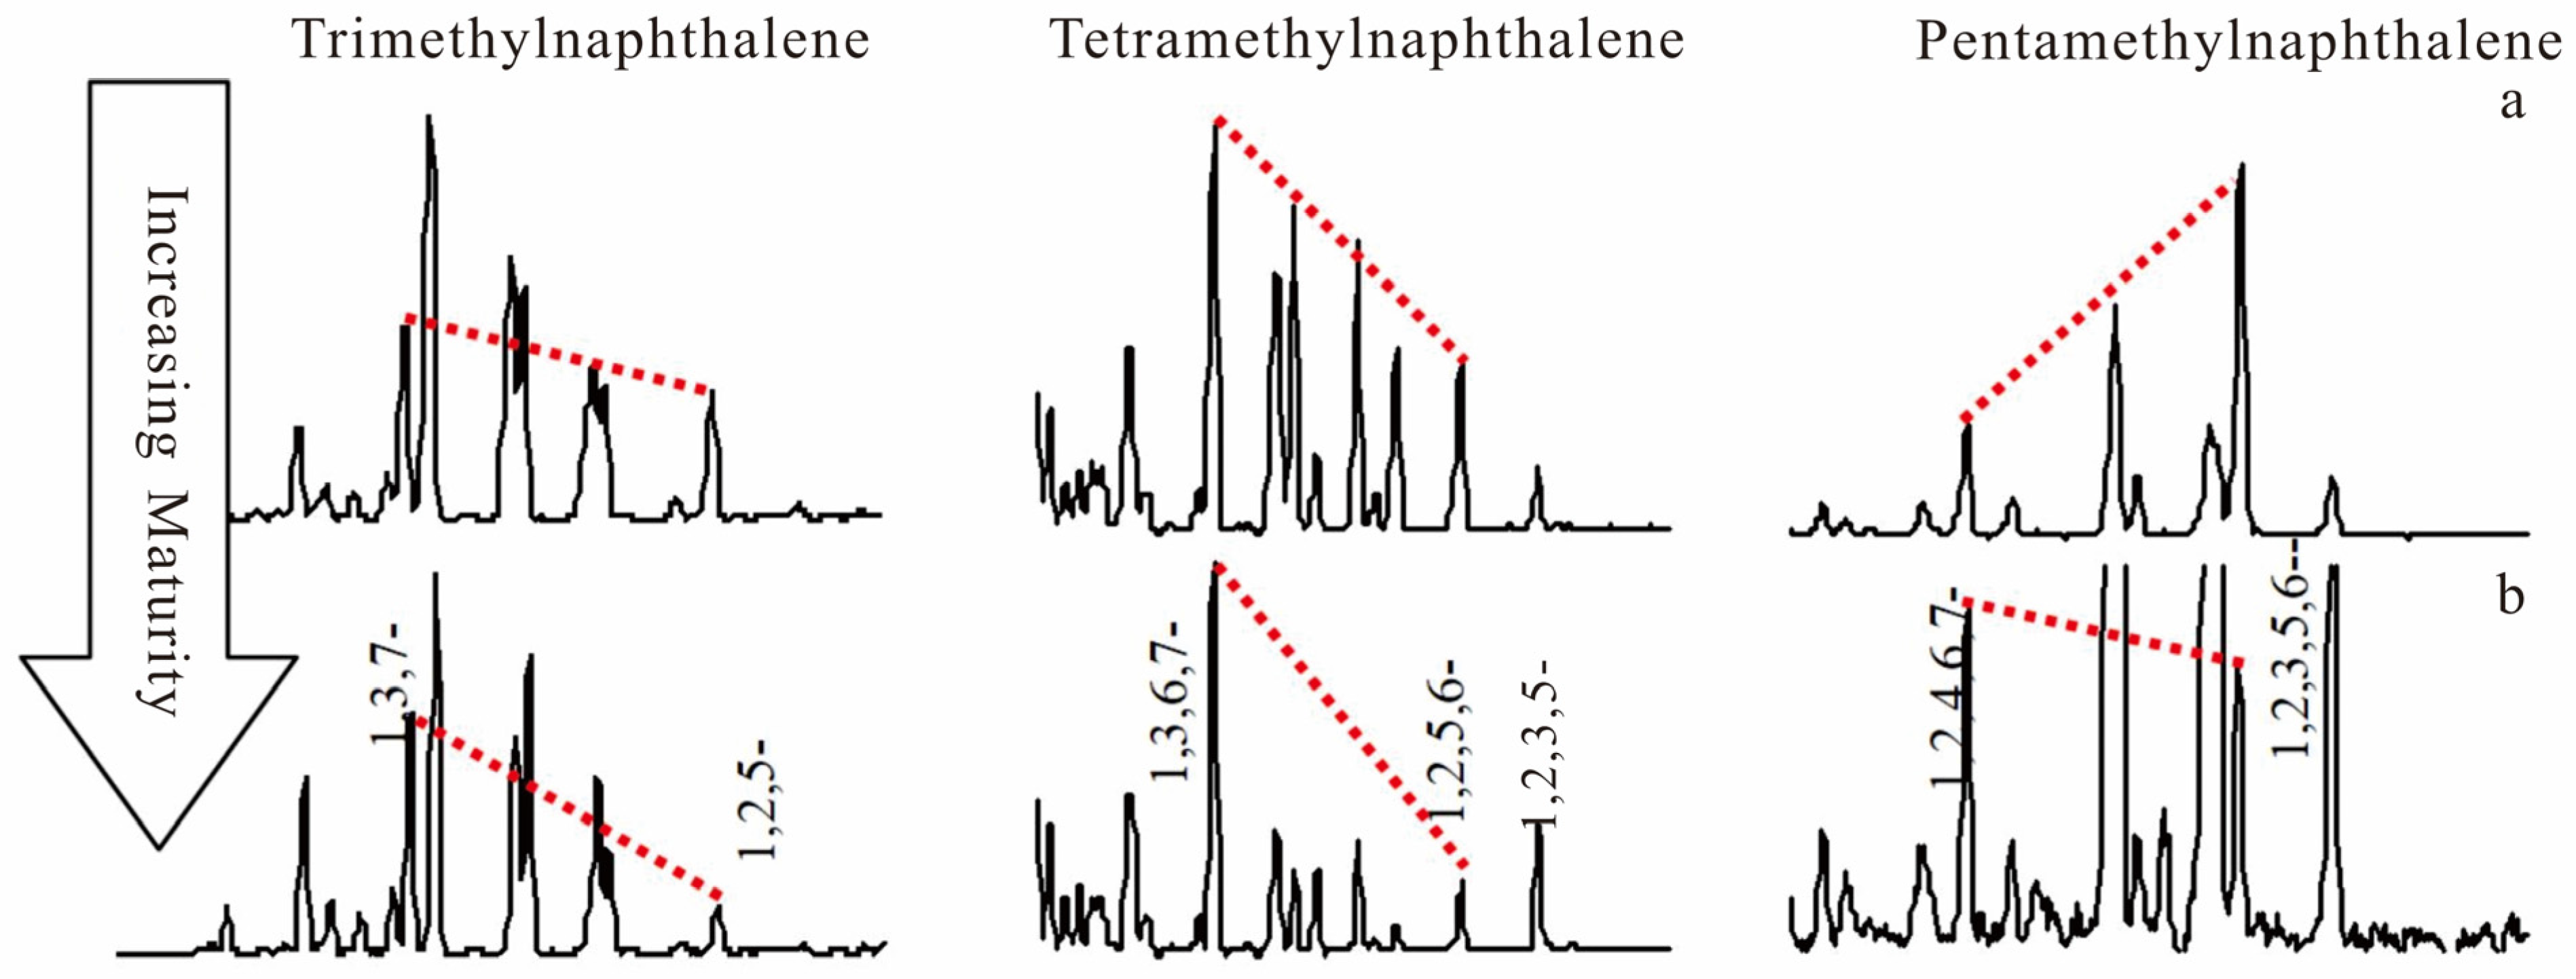
Parameters C, D, and E listed in Table 7 are maturity indicators derived from the distribution patterns of trimethylnaphthalene, tetramethylnaphthalene, and pentamethylnaphthalene, respectively. As illustrated in Figure 12, the relative abundances of these poly-methylated naphthalene isomers vary systematically with increasing thermal maturity. Specifically, Parameter C (defined as the ratio 1,3,7-/(1,3,7- + 1,2,5-trimethylnaphthalene)) exhibits relatively high values (0.77–0.84) in deep crude oils from the Pingbei area, while shallow crude oils show lower values (0.60–0.63). A comparison with oils from surrounding areas indicates that elevated values of this parameter are generally associated with deeper reservoirs, although some deep crude oils also display lower values.
The deep crude oils (Chang 7) show lower Ph/C18 ratios (Table 3). This could be attributed to several factors: Firstly, their higher Pr/Ph ratios suggest a relatively more oxic depositional environment, which is less favorable for the reductive conversion of phytol (the precursor of phytane) to phytane. Secondly, higher thermal maturity may promote the cracking or isomerization of phytane relative to n-alkanes. Additionally, it may reflect specific biological source compositions within the source rock organic matter.
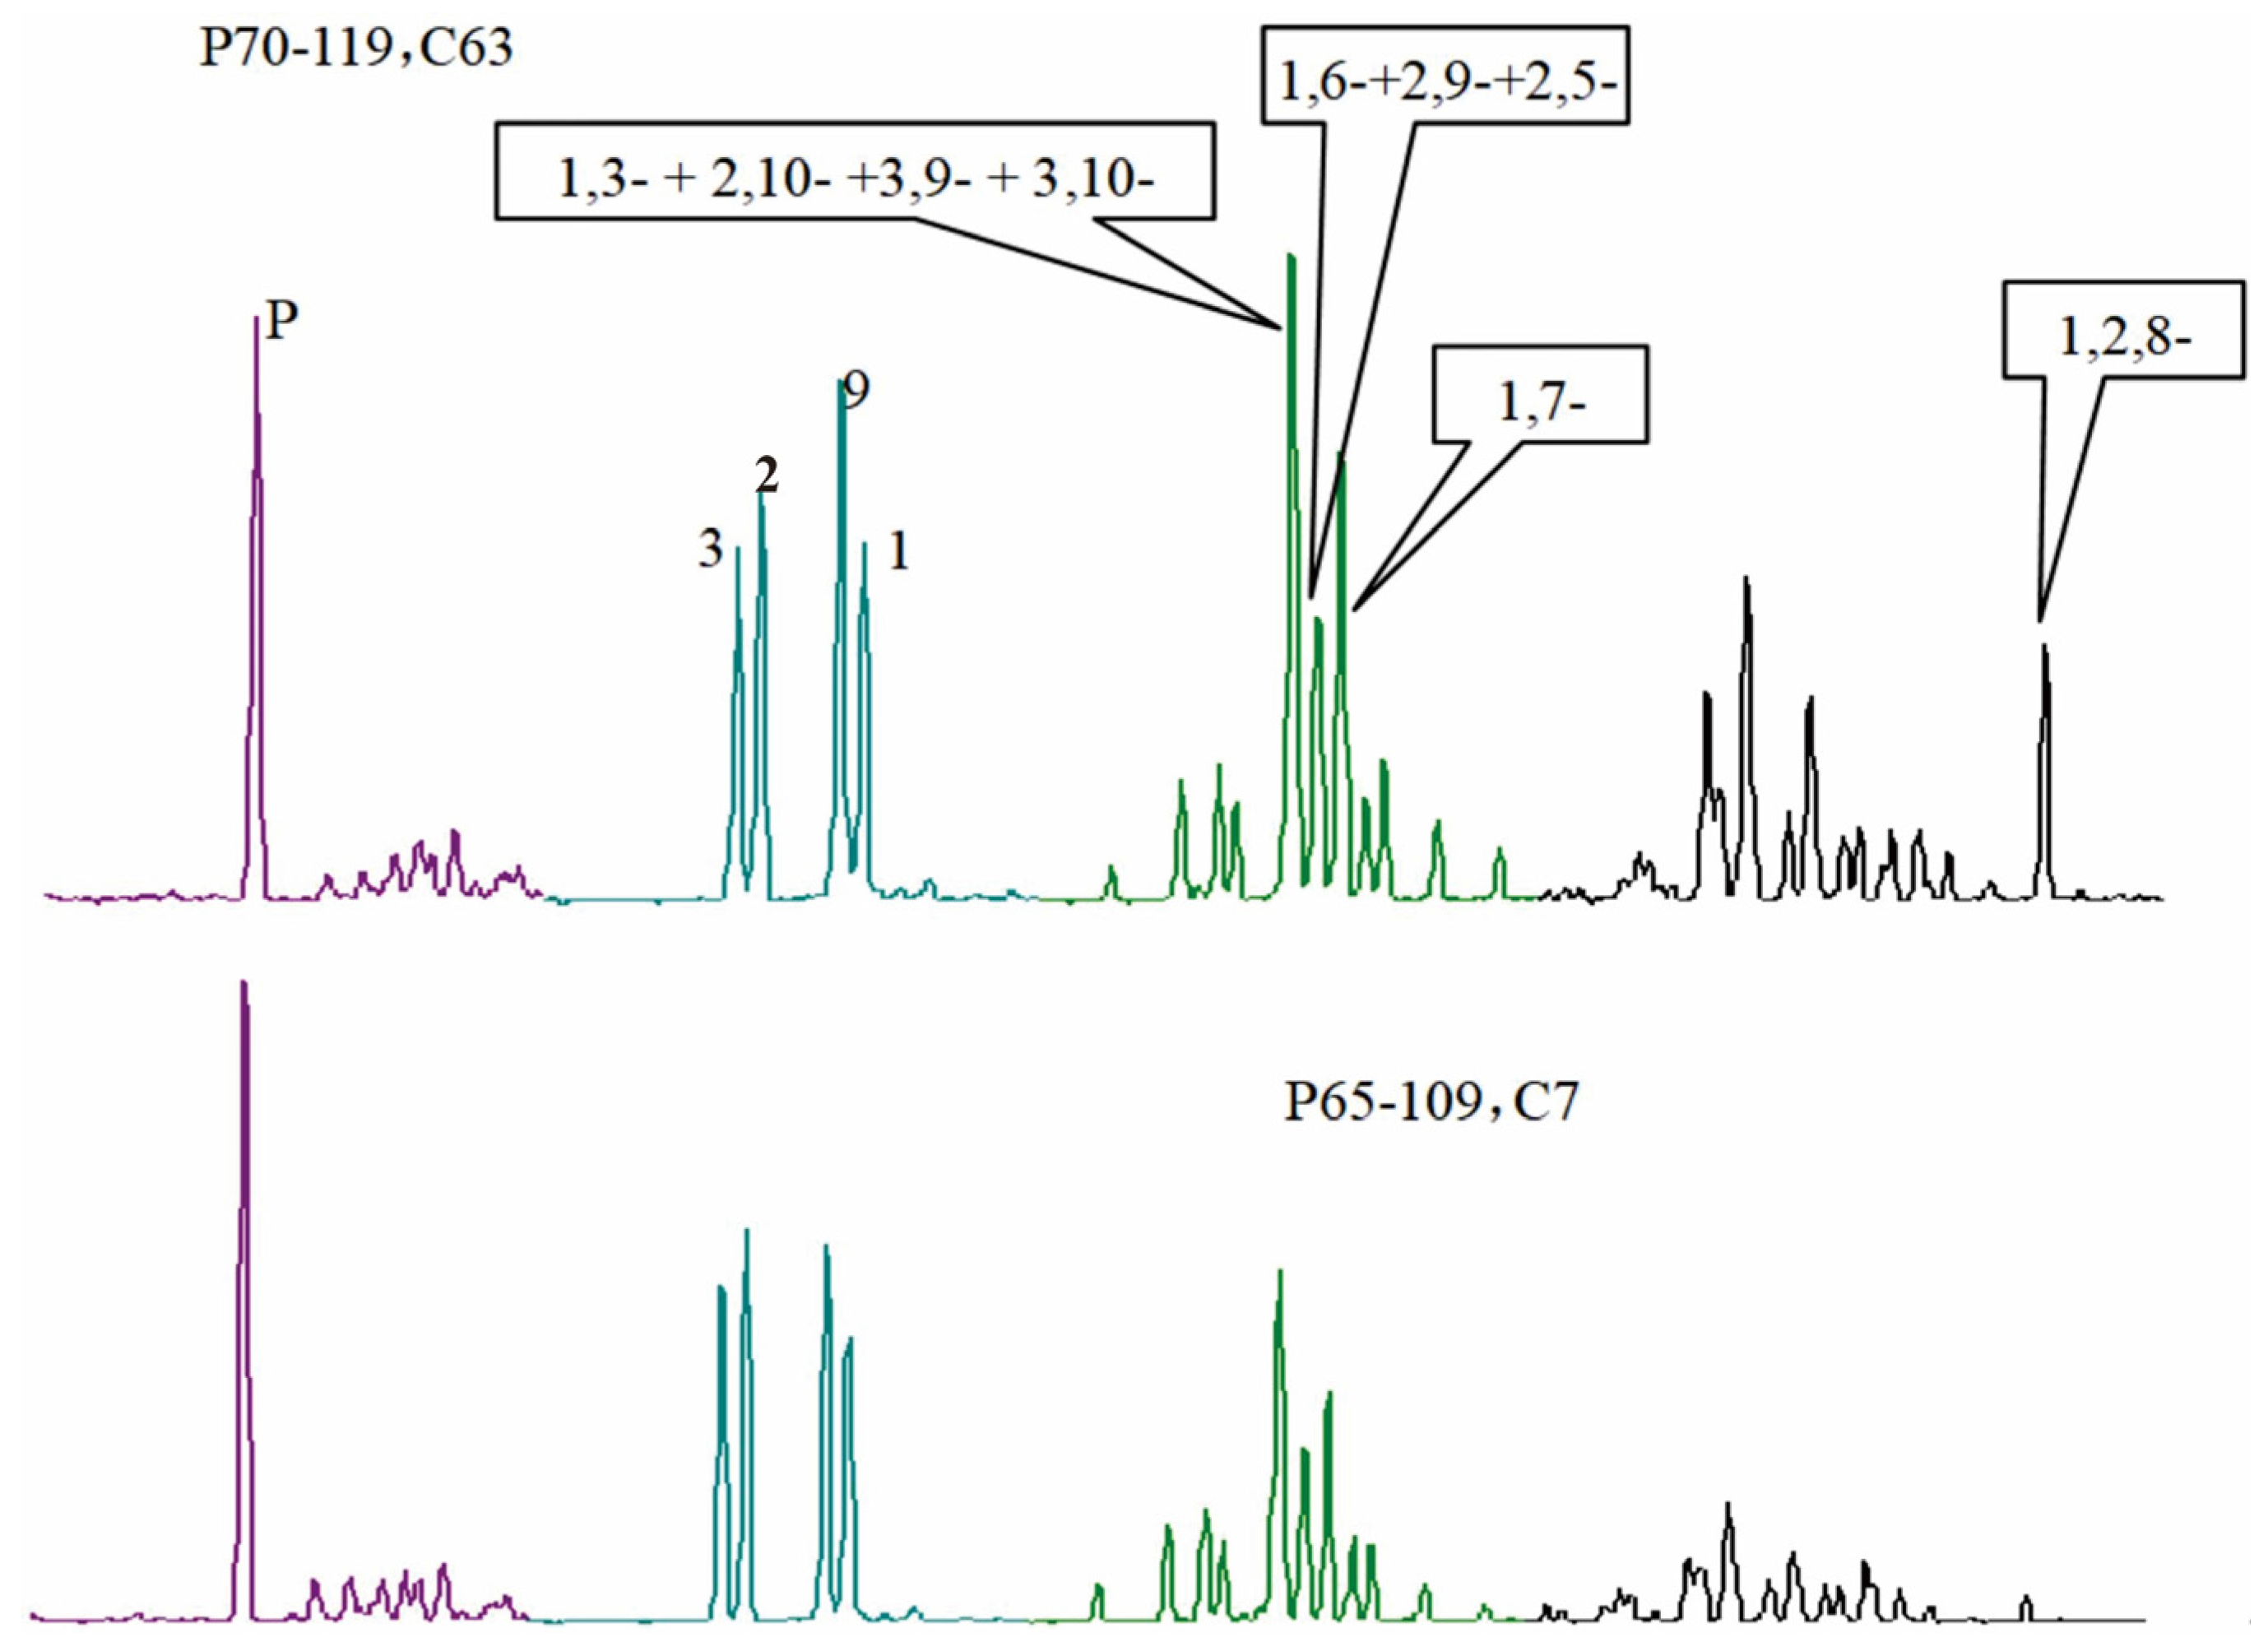
Comparative analysis of alkylphenanthrene compounds in the Chang 7 and Chang 6 crude oils reveals marked differences in their phenanthrene series distributions (Figure 13). The primary distinctions lie in the relative abundances of key dimethylphenanthrene isomers: 1,7-dimethylphenanthrene, the combined (1,6- + 2,9- + 2,5)-dimethylphenanthrene, and the combined (1,3- + 2,10- + 3,9- + 3,10)-dimethylphenanthrene. The abundance ratio of lower- to higher-molecular-weight compounds is notably higher in Chang 7 crude oils, indicating a relative enrichment of lower-carbon-number alkylphenanthrenes with increasing maturity. Furthermore, within the trimethylphenanthrene system, the relative abundance of 1,2,8-trimethylphenanthrene serves as a key discriminant. Parameter I (1,2,8-/(1,3,7- + 2,6,9- + 2,7,9-) trimethylphenanthrene) ranges from 0.54 to 0.58 in Chang 6 oils but drops sharply to approximately 0.14 in Chang 7 oils. This pronounced contrast in Parameter I values further suggests that the two oil groups may originate from different genetic sources or have experienced distinct hydrocarbon generation and expulsion histories.

4.2.4. Classification of Crude Oil Genetic Types

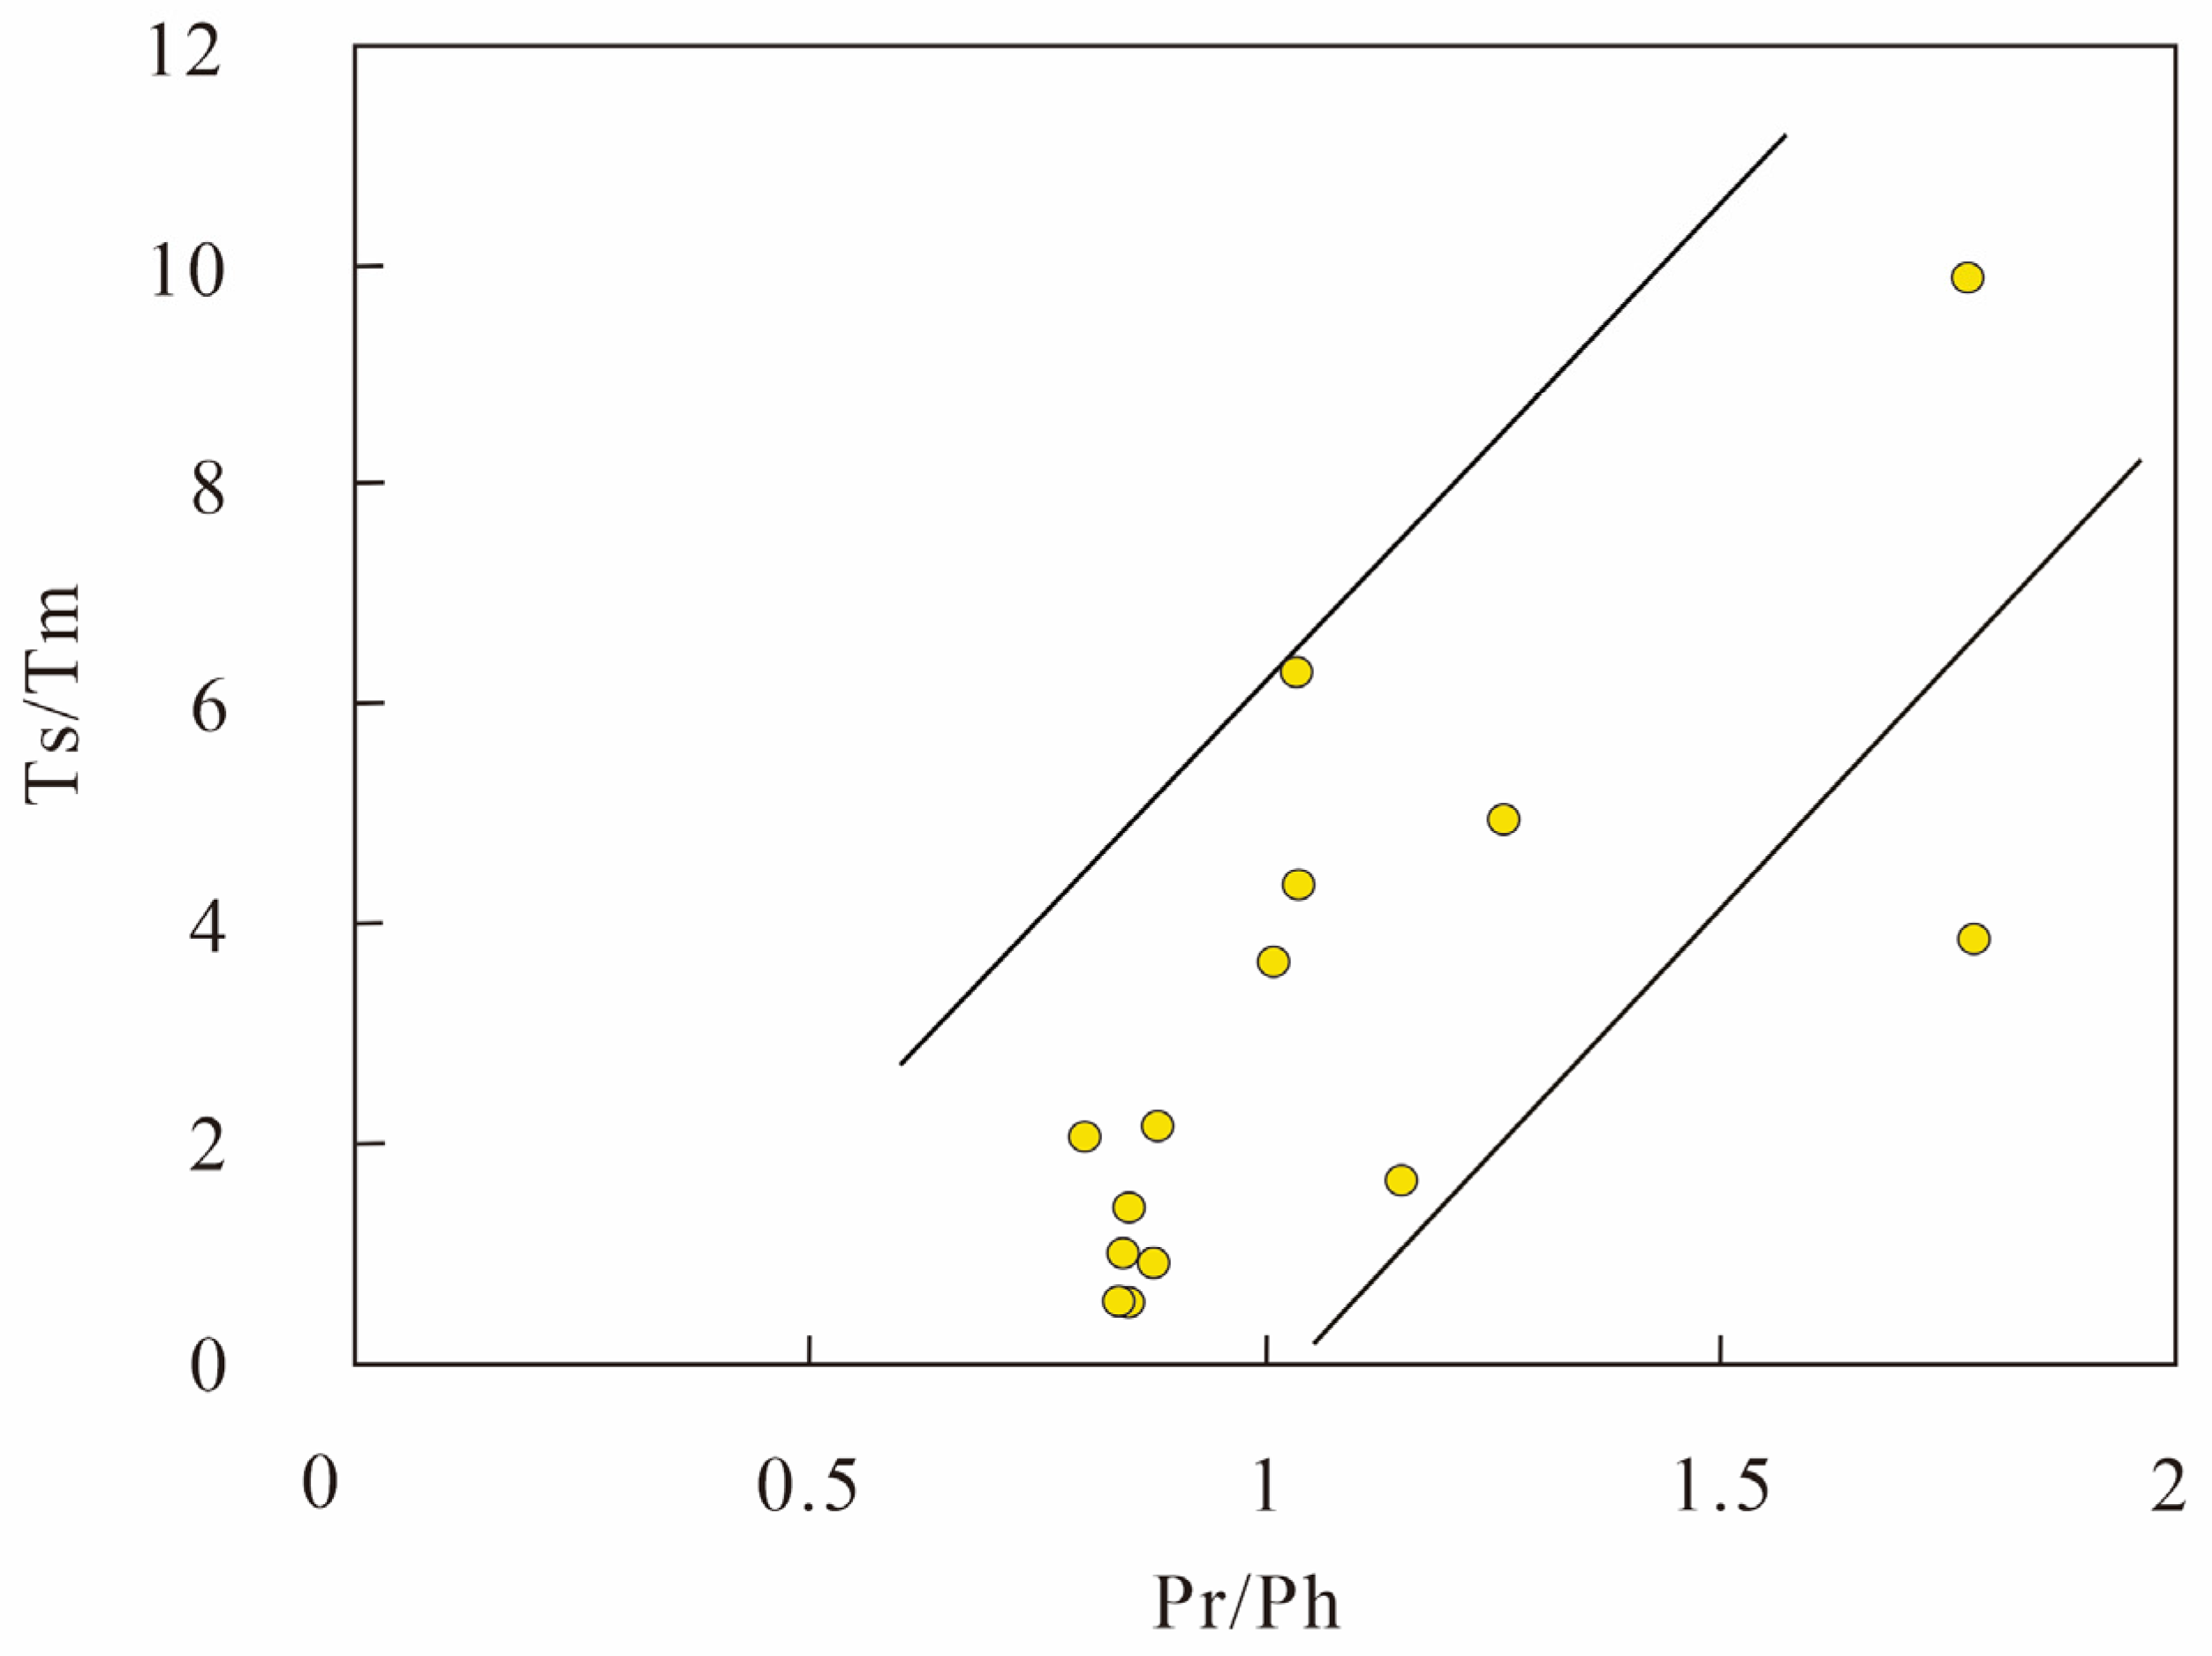
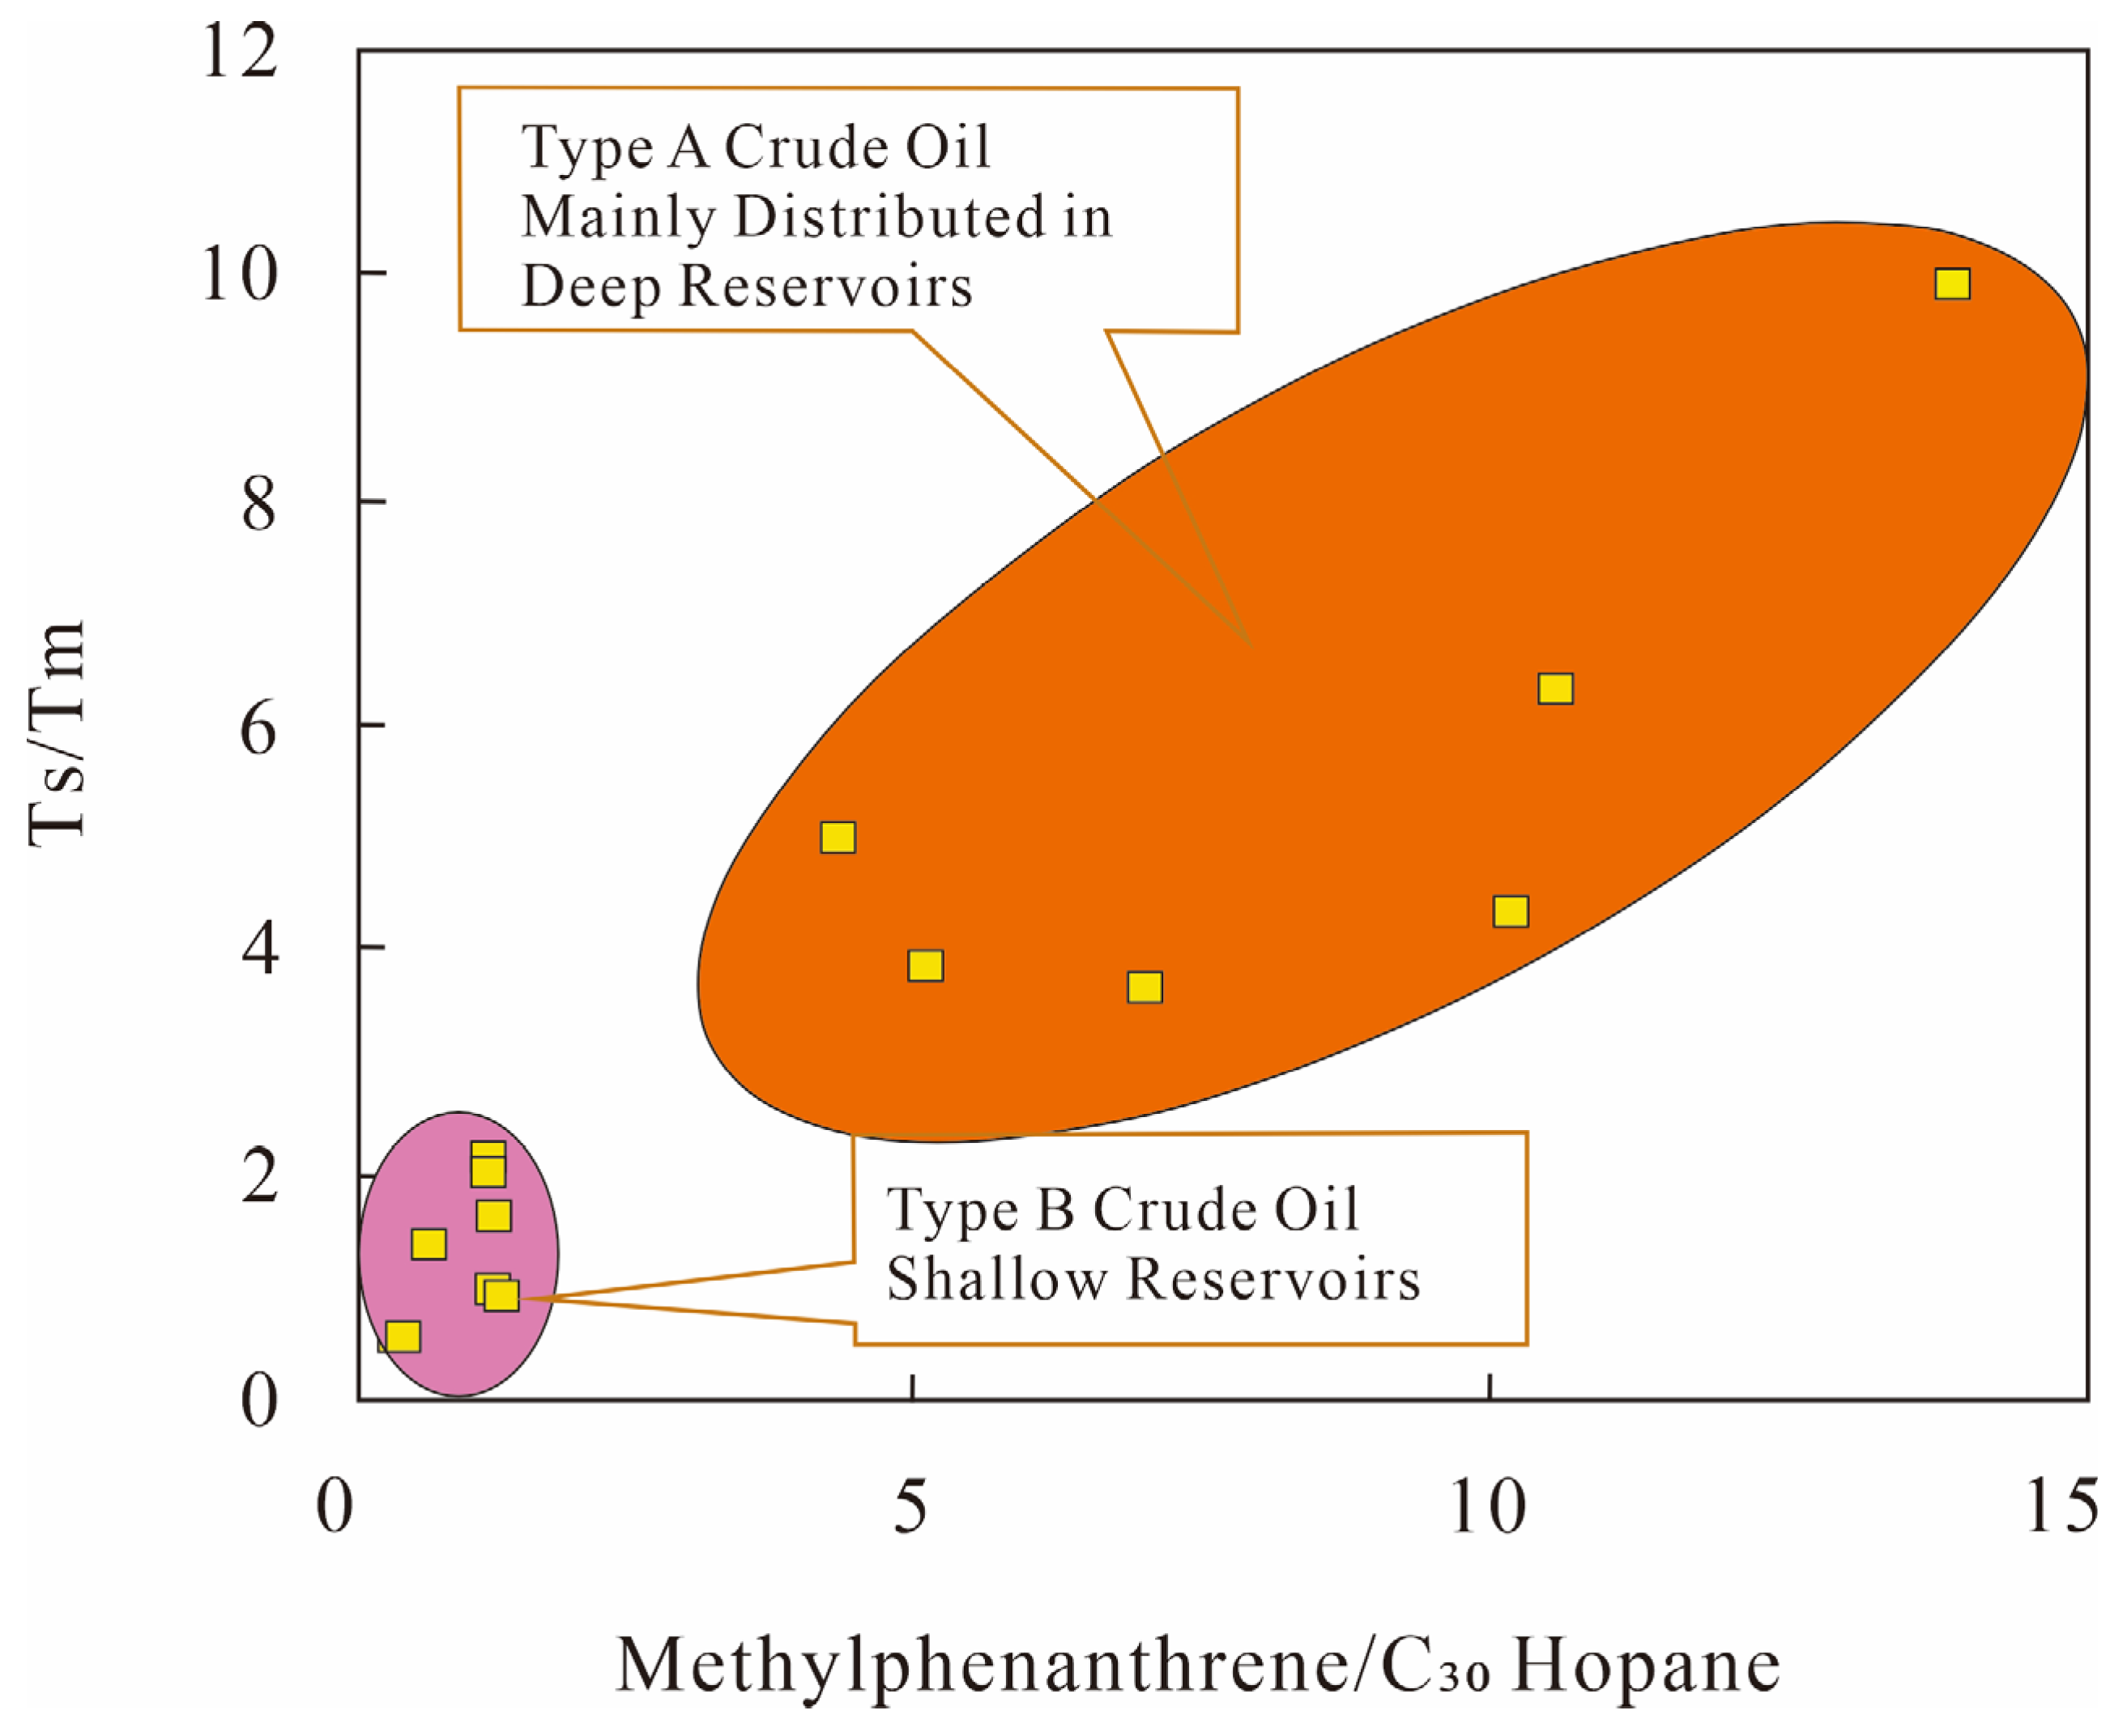
The Ts/Tm ratio is influenced by both sedimentary environment characteristics and thermal evolution degree [35]. Based on cross-plots of Ts/Tm versus Pr/Ph (Figure 14) and Ts/Tm versus methylphenanthrene/C30 hopane (Figure 15), the crude oils in the study area are classified into two distinct genetic types:
Type A oils are found in deep reservoirs of the Chang 7 Member. They are characterized by high Ts/Tm values (3.47–7.18), high Pr/Ph ratios (1.77–1.78), and elevated methylphenanthrene/C30 hopane ratios.
Type B oils are found in both shallow and deep reservoirs. They are characterized by low Ts/Tm values (0.48–0.51), low Pr/Ph ratios (0.84–0.85), and low methylphenanthrene/C30 hopane ratios.

4.3. Oil–Source Correlation Analysis

4.3.1. Correlation Between Type A Crude Oil and Chang 7 Member Source Rocks

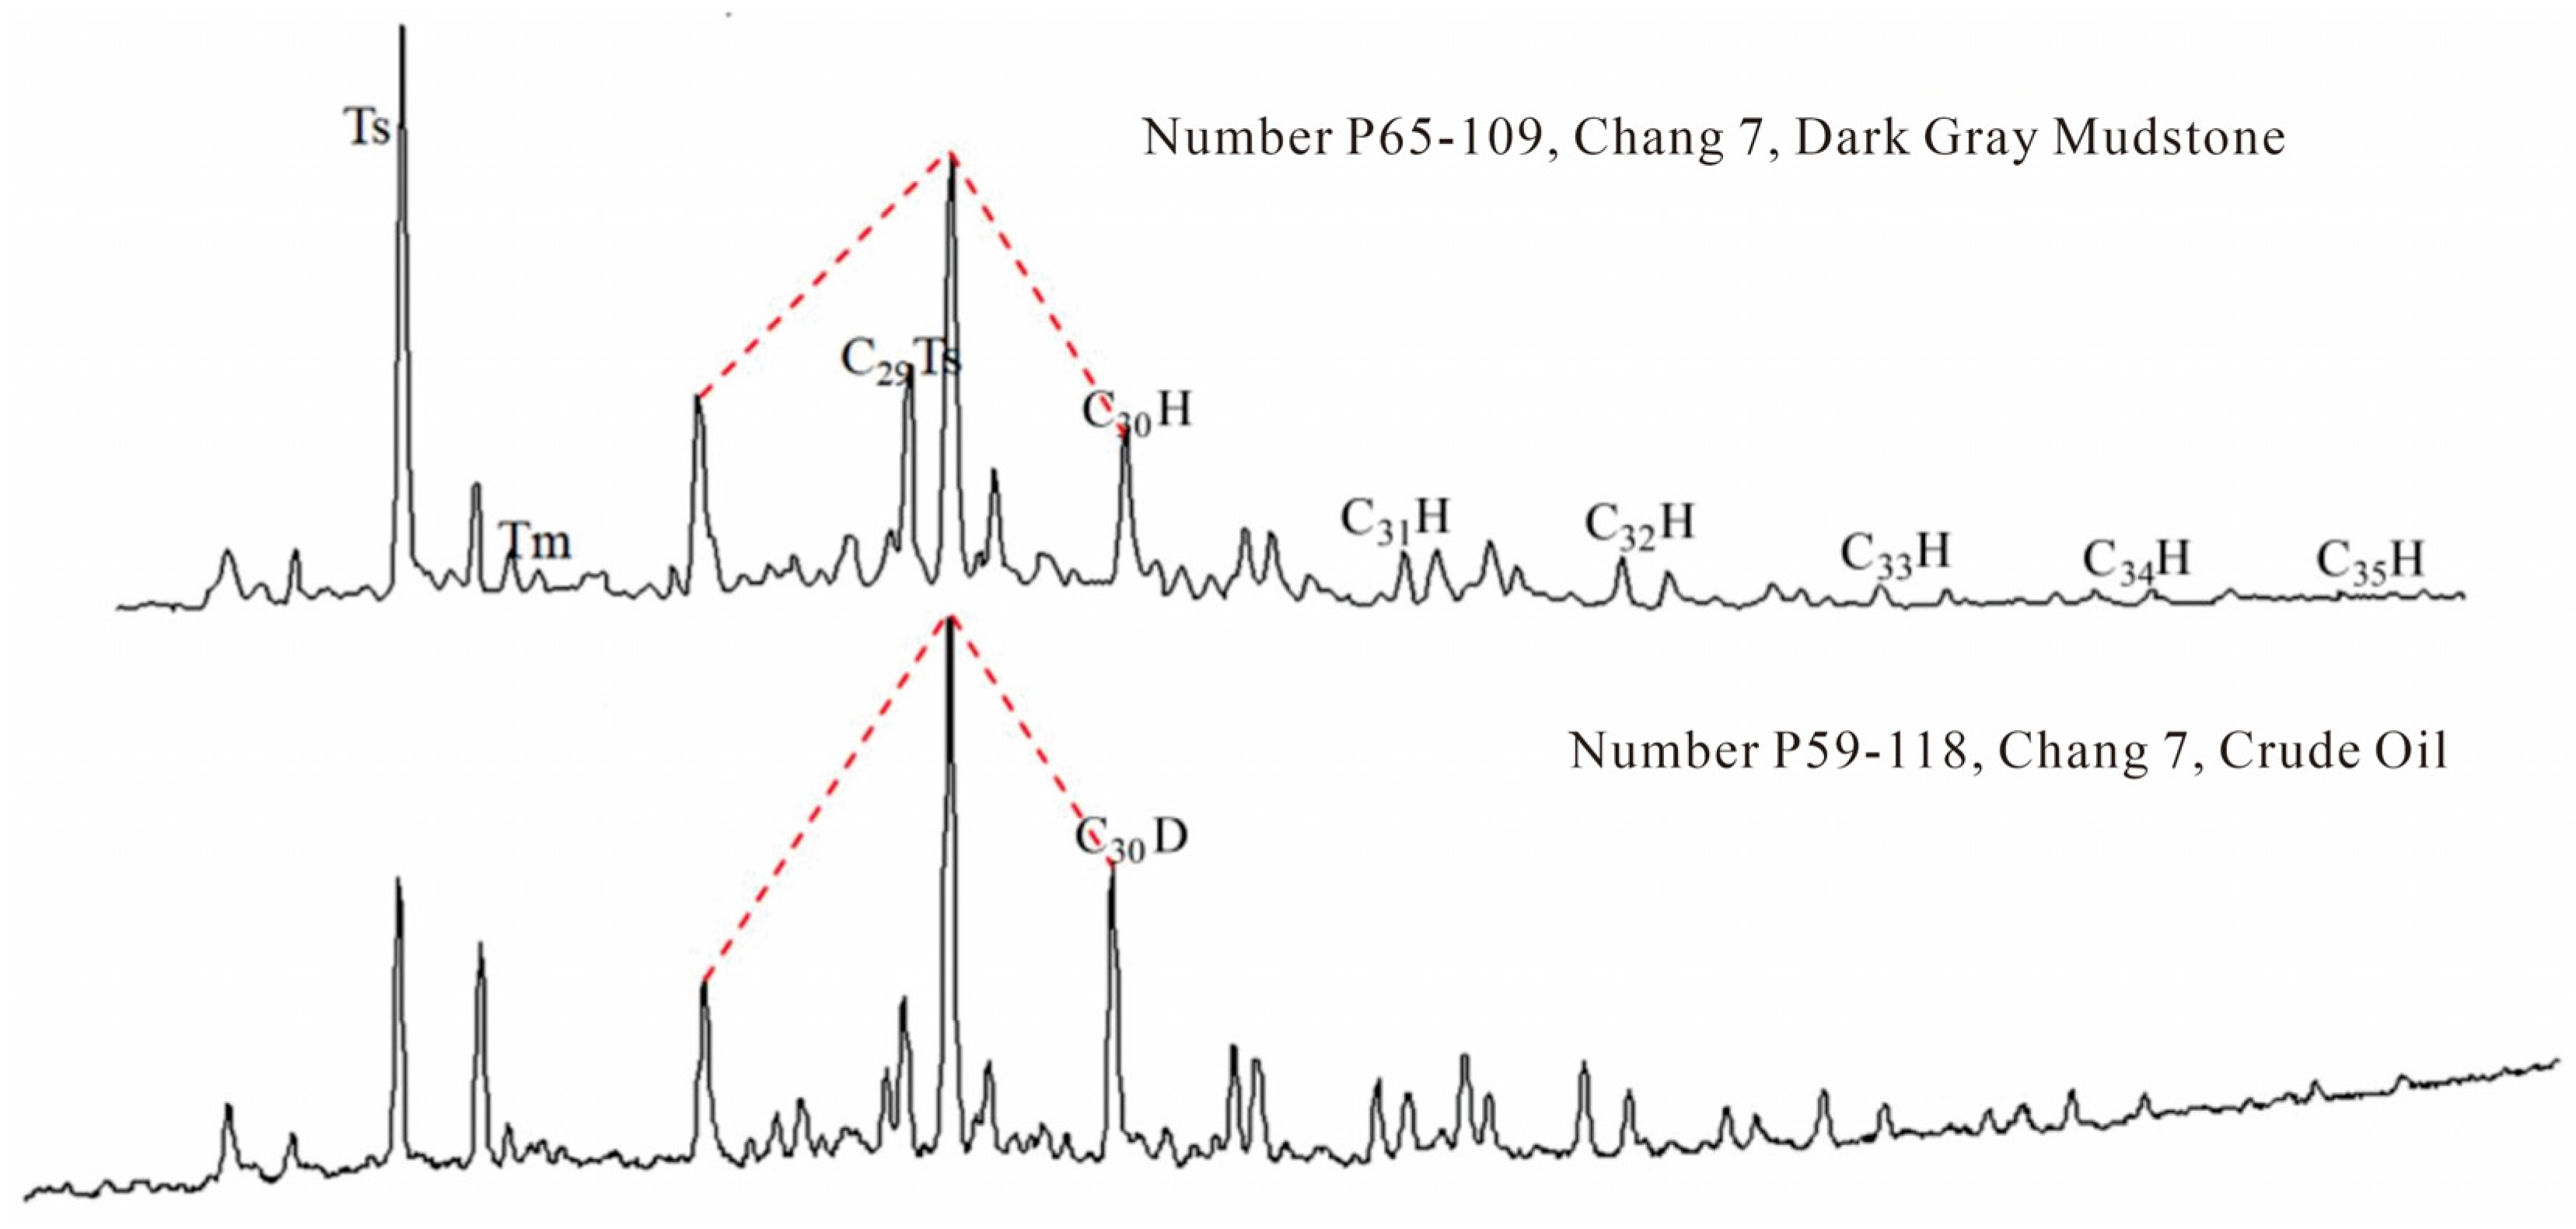
Type A crude oil exhibits a high degree of geochemical consistency with the dark mudstones of the Chang 7 Member. This affinity is demonstrated by their comparable Pr/Ph ratios, similar enrichment levels of rearranged hopanes, and congruent distribution patterns of pentacyclic triterpanes. Both the oil and the source rocks are notably enriched in C30 and C29 rearranged hopanes, the abundances of which exceed that of regular C30 hopane (Figure 16). The concentration of C30 rearranged hopanes is influenced primarily by sedimentary conditions (e.g., redox state), clay mineral content, and thermal maturity. Elevated abundances of these compounds are commonly indicative of a suboxic to oxic depositional environment [37].
The basic geochemical parameters, including n-alkanes and isoprenoids, for the Chang 7 Member source rocks are summarized in Table 8. Corresponding biomarker parameters, encompassing terpanes and steranes, are presented in Table 9. The Pr/Ph ratios of Type A crude oils (1.77–1.78) fall within the range observed for the Chang 7 Member source rock samples (1.47–4.21). This correspondence, along with the biomarker consistency noted above, confirms that the dark mudstones of the Chang 7 Member are the principal source rocks for the Type A oils. As potential source rocks, these dark gray mudstones display characteristic terpane and n-alkane distributions in their chromatographic profiles. These patterns directly reflect their hydrocarbon-generating potential and the types of organic parent materials [28].

4.3.2. Correlation Between Type B Crude Oil and Surrounding Chang 6 Member Source Rocks

The geochemical characteristics of Type B crude oils show no affinity with the local Chang 7 Member source rocks but closely resemble those of crude oils produced from the Chang 6 Member in surrounding oilfields. This similarity is evident in key biomarker ratios: the Pr/Ph ratios of Type B oils (0.84–0.85) and their Ts/Tm ratios (0.48–0.51) are consistent with the respective ranges observed in the surrounding Chang 6 oils (Pr/Ph: 0.80–0.89; Ts/Tm: 0.73–2.14).

5. Discussion

5.1. Effectiveness of the Chang 7 Member Dark Mudstones as Hydrocarbon Source Rocks

Geochemical and petrological analyses demonstrate that the Chang 7 dark mudstones in the Pingbei area possess fair to good organic matter abundance (avg. TOC 1.69%) and oil-prone Type II1 kerogen, collectively meeting the criteria for effective source rocks. The development of these good-quality source rocks aligns with the general characteristics of lacustrine source rocks in continental basins across China, where dark mudstones deposited in deep lake environments are primary contributors to hydrocarbon generation [1]. The maturity (Ro = 0.76–0.87%) of these rocks corresponds to the peak stage of liquid hydrocarbon generation [38]. Furthermore, the maceral composition is characterized by a high abundance of alginate (35.7–65.7%), which provides a substantial material foundation for large-scale hydrocarbon generation [39]. Consequently, the Pingbei area itself constitutes an independent, effective source rock kitchen. This fundamentally alters the petroleum system context of the area, transforming it from a “prospect” potentially reliant entirely on external sources into a viable exploration play with self-sourcing potential. Establishing the presence of local source rocks is the primary geological prerequisite for assessing tight oil resource potential and optimizing well placement in this region.

5.2. Genetic Mechanisms of the Two Types of Crude Oils

The formation of the two distinct crude oil types is primarily controlled by the sedimentary environment and thermal evolution history of their respective source rocks. Type A oils, sourced from the Chang 7 Member, are characterized by high Pr/Ph and Ts/Tm ratios. These features are consistent with a suboxic depositional setting and a mature stage of thermal evolution [36]. The enrichment of rearranged hopanes in these oils is further promoted by clay mineral catalysis within the source rock interval.
The classification into Type A and Type B oils is supported by established biomarker principles [32]. The Pr/Ph ratio serves as a proxy for paleo-redox conditions [40], with Type A oils (Pr/Ph = 1.77–1.78) indicating a weakly oxic–suboxic environment, and Type B oils (Pr/Ph = 0.84–0.85) suggesting a more strongly reducing setting. Similarly, the Ts/Tm and methylphenanthrene/C30 hopane ratios reflect thermal maturity [41]. The higher values of these parameters in Type A oils confirm their more advanced thermal evolution compared to Type B oils. These geochemical signatures are consistent with the depositional and thermal histories of their inferred source rocks, thereby validating the genetic classification [42].
In contrast, Type B oils are interpreted to originate from the surrounding Chang 6 Member source rocks. Their low Pr/Ph and Ts/Tm ratios correspond to a relatively strong reducing sedimentary environment and a slightly lower degree of thermal evolution. The systematic differences in aromatic hydrocarbon compositions between the two oil types further reflect this maturity contrast [43].
This reveals a “dual hybrid charging system” in the Pingbei area. This system comprises (1) locally sourced oil: derived from mature Chang 7 delta-front mudstones, primarily migrating short distances vertically/near-source and (2) externally sourced oil: derived from peripheral Chang 6 deep-lacustrine shales, potentially undergoing longer-distance lateral migration. This model breaks the simplistic view of the area as a single-source system and provides the essential framework for understanding complex hydrocarbon distribution, mixing phenomena, and predicting fluid properties across different intervals.

5.3. Implications of Oil–Source Correlation for Tight Oil Exploration

A robust oil–source correlation is established based on the consistent biomarker fingerprints between the crude oils and potential source rocks. The Type A oils (produced from the Chang 7 reservoirs in the Pingbei area) exhibit Ts/Tm ratios of 3.47–7.18 and C30 rearranged hopane/C30 hopane ratios of 0.32–1.92. These ranges show complete overlap with those of the Chang 72 sub-member source rocks (Ts/Tm: 3.47–7.15; C30 rearranged hopane/C30 hopane: 0.48–1.92), indicating a clear genetic relationship. In contrast, Type B oils possess significantly lower Ts/Tm ratios (0.48–0.51), which differ markedly from the values characteristic of the Chang 7 Member source rocks. This distinction, combined with the consistent low Pr/Ph and Ts/Tm ratios, low rearranged sterane/hopane abundances, and distinct aromatic hydrocarbon profiles, strongly indicates that Type B crude oil is derived from the Chang 6 Member source rocks developed in the peripheral regions of the basin.
The identification of two types of crude oils helps optimize exploration strategies: focusing on Chang 7 Member deep reservoirs for Type A crude oil and considering Chang 6 Member shallow reservoirs for Type B crude oil, providing a scientific basis for efficient development.

5.4. Analysis of Contradictions in Maturity Parameters

A robust assessment of thermal maturity necessitates the integration of multiple independent geochemical parameters. As synthesized in Table 10 (detailed biomarker data are provided in Table A2), the various maturity indicators for the Chang 7 source rocks collectively affirm an oil-generating window but reveal notable internal discrepancies.
Vitrinite Reflectance (Ro) and Rock-Eval Tmax uniformly indicate a mature stage (0.76–0.87% and 440–456 °C, respectively).
Hopane-based Maturity: The Ts/(Ts + Tm) ratios are exceptionally high (0.74–0.88), which in conventional interpretation suggests high to very high thermal maturity (main to late oil window).
Sterane-based Maturity: The C29 sterane 20S/(20S + 20R) ratios (0.51–0.61) for some samples approach the equilibrium range (0.52–0.55 for regular steranes; [44]), indicating mid-oil window maturity. In contrast, the C29 sterane ββ/(αα + ββ) ratios (0.52–0.59) remain significantly below their equilibrium endpoint (~0.67–0.71) [44], suggesting a maturity level spanning from late immature to the early oil window.
Therefore, a central paradox emerges: the hopane parameter (Ts/Tm) implies higher maturity than the sterane parameter (C29 ββ/(αα + ββ)). This discrepancy, coupled with the weak correlation between Ro and Tmax (Figure 8b), constitutes the focus of the following analysis. We evaluate four non-exclusive causative factors: (1) the differential geochemical behavior of biomarker parameters; (2) heterogeneity in organic matter type; (3) geological heterogeneity in thermal history; and (4) potential analytical artifacts or contamination.
Figure 8b indicates no clear positive correlation between Tmax and Ro, an observation that appears inconsistent with the general rule that both parameters increase with organic matter maturity. Considering the geological context and sample characteristics of the study area, the potential causes for this discrepancy are analyzed below:
Variations in Organic Matter Type: Maceral analysis (Table A2) reveals that some samples from the Chang 73 sub-member contain Type II2 organic matter, whereas most samples from the Chang 72 sub-member are Type II1. According to Peters et al. [28], Tmax is influenced not only by thermal maturity but also by organic matter type. Type II2 organic matter, which has a higher terrestrial input, tends to yield a higher Tmax than Type II1 at an equivalent maturity. For instance, sample P31-97-3 (Chang 73, Type II2) has an Ro of 0.78% but a Tmax of 454 °C, which is 8 °C higher than that of sample P65-109-1 (Chang 72, Type II1, Ro = 0.78%, Tmax = 446 °C). This type-dependent variation weakens the overall correlation between Tmax and Ro.
Heterogeneity in Thermal Evolution: The study area is situated within a delta-front distributary channel system where sand bodies are extensively developed and interbedded with dark mudstones. Sandstone possesses higher thermal conductivity than mudstone, leading to localized uneven heat flow. For example, the Chang 73 sub-member in the northern part contains intercalated distributary channel sandstones 5–8 m thick. This results in an Ro of 0.87% for sample P31-97-4 (near a sandstone–mudstone contact) and 0.76% for sample P31-97-5 (5 m away from the contact), a difference of 0.11%. Such spatial heterogeneity in thermal history causes non-parallel changes in Tmax and Ro.
Differential Response of Hopane and Sterane Maturity Parameters: The apparent contradiction between the high Ts/(Ts + Tm) ratios and the lower C29 ββ/(αα + ββ) ratios can be reconciled by understanding their distinct controlling factors. The Ts/(Ts + Tm) ratio is strongly influenced by sedimentary redox conditions and clay mineral catalysis, not solely by thermal maturity [45]. Deposition in suboxic to oxic environments (supported by high Pr/Ph ratios) favors Ts formation [46]. In contrast, sterane isomerization (C29 ββ/(αα + ββ)) is a more thermally driven process. Thus, high Ts/(Ts + Tm) likely reflects depositional setting, confirming a mid-oil window maturity level consistent with the Ro and sterane 20S/(20S + 20R) data.
Evaluation of Potential Contamination by Drilling Additives: Contamination from drilling additives (e.g., lignite) could artificially elevate Tmax and potentially alter biomarker distributions. We have rigorously evaluated this possibility. First, detailed petrographic examination of all polished sections used for Ro measurement revealed no visible extraneous particles under reflected light microscopy, which would be the primary method to identify particulate contaminants like lignite powder. Second, review of the gas chromatograms (m/z 85) for the saturated hydrocarbon fractions showed no anomalous unresolved complex mixtures (UCMs) or aberrant n-alkane distributions that are characteristic of severe contamination by drilling mud organic matter. While subtle molecular-level interference cannot be entirely ruled out, the internal consistency observed among the majority of independent parameters (e.g., the logical progression of Ro with depth and its correlation with sterane isomerization) suggests that contamination is not the predominant factor governing the dataset. Therefore, the elevated Tmax values in specific samples are more parsimoniously explained by the prevalence of Type II2/III organic matter, as discussed earlier.
To accurately determine source rock maturity, a comprehensive evaluation using multiple parameters is essential, rather than relying on a single index. Integrating the following three indicators confirms that the Chang 7 Member source rocks in the Pingbei area are generally within the mature stage: (1) Vitrinite Reflectance (Ro): Values range from 0.76% to 0.87%, consistent with the mature stage. (2) Biomarker Parameters: The C29 sterane 20S/(20S + 20R) ratio ranges from 0.53 to 0.61, typical of mature organic matter. (3) Hydrocarbon Generation Potential: S1 + S2 values range from 0.48 to 22.19 mg/g, indicating the rocks are within the peak liquid hydrocarbon generation window.
The vitrinite reflectance data, presented in Table A1, form the basis of our thermal maturity assessment. We acknowledge that for a subset of samples, the final number of valid measurements after outlier removal is below the 20–30 range recommended by international standards such as ASTM D7708 for optimal statistical precision in dispersed organic matter [27,47]. However, the reliability of our Ro dataset is strengthened by several factors: First, the measurement protocol itself followed strict quality control, including outlier rejection. Second, the calculated mean Ro values for all 20 samples are highly consistent, clustering within a narrow range (0.76–0.87%) typical for the oil window. Most importantly, the Ro values show a coherent relationship with independent maturity parameters. For instance, samples with higher mean Ro (e.g., >0.85%) generally correspond to higher Ts/Tm ratios and more advanced sterane isomerization values (e.g., C29 ααα 20S/(S + R) > 0.55). This multi-parameter consistency provides strong support that the Ro data, even with slightly reduced measurement counts in some cases, accurately reflect the thermal maturity level of the source rocks.

5.5. Analysis of the Discrepancy Between C29 Steranes and Maceral Composition

A notable discrepancy was observed: while the maceral composition of the Chang 7 source rocks is dominated by alginite (35.7–65.7%), indicating a predominant contribution from aquatic algae, biomarker data reveal that C29 regular steranes constitute the highest proportion (35–43%) among C27–C29 steranes—a pattern typically associated with terrestrial higher plant input. This apparent contradiction can be explained by two key factors, supported by geological and geochemical evidence:
Mixed Organic Matter Input and Differential Sterane Preservation: The Chang 7 source rocks are characterized by Type II1 organic matter, representing a mixture of aquatic algae and terrestrial higher plants. According to Volkman [34], C29 steranes derived from terrestrial plants are more stable during diagenesis and hydrocarbon generation than C27 steranes derived from aquatic algae, leading to their preferential preservation. Consequently, even with a lower initial input of terrestrial organic material relative to aquatic material, the C29 steranes from terrestrial sources are more likely to be retained in both source rocks and crude oils, resulting in their higher relative abundance in biomarker distributions [32].
Sedimentary Environment Controlling Terrestrial Input: The study area is situated within a delta-front setting of the Ordos Basin, where fluvial systems continuously transported terrestrial plant detritus into the lacustrine environment (Section 2). Delta-front environments are typically characterized by high fluxes of terrestrial organic matter, and this detrital material can be effectively preserved within the dark mudstones interbedded with sandy deposits [48,49]. This additional terrestrial input further amplifies the contribution of C29 steranes, thereby accentuating the observed divergence between maceral-based and sterane-based source assessments.
In summary, the apparent contradiction between C29 sterane predominance and alginite-rich maceral composition does not represent a true conflict. Instead, it reflects the interplay of mixed organic matter sources and the differential preservation of steranes within a delta-front sedimentary system. This interpretation further corroborates the mixed-source origin of the Chang 7 source rocks, a characteristic that is favorable for the generation of high-quality tight oil.

5.6. Implications of Mixed Kerogen Origin

The dominance of Type II1 kerogen, with significant contributions from both aquatic (alginite) and terrestrial (vitrinite) macerals, has important implications for hydrocarbon generation and fluid properties. This mixed organic matter input results in a broad spectrum of generated hydrocarbons, contributing to the medium to good overall hydrocarbon potential observed. The terrestrial component may enhance gas generation potential at higher maturities, while the aquatic algae-derived material is primarily responsible for the liquid hydrocarbon yield during the peak oil window. Furthermore, the mixed origin likely influences the geochemical fingerprint of the expelled oils, including the biomarker distributions (e.g., sterane patterns) discussed earlier. Understanding this duality is crucial for accurate basin modeling and predicting the phase behavior (oil vs. gas) of generated hydrocarbons in the study area.

5.7. Limitations of Maceral Analysis and Data Reliability

The organic petrographic data in this study are derived from only four samples, which limits their statistical representativeness for the entire heterogeneous Chang 7 Member. Furthermore, technical issues during sample handling precluded the acquisition of publishable photomicrographs. However, we assert the reliability of our maceral identifications based on the following: (1) Standardized procedure: Polished sections were used solely for non-destructive petrographic analysis (maceral counting and vitrinite reflectance). All subsequent destructive geochemical analyses (TOC, pyrolysis, GC-MS) were performed on separately prepared, homogenized rock powders to avoid any interference. (2) Rigorous quality control: Each sample was analyzed via duplicate sections with point counting of over 500 particles per section to ensure precision. (3) Regional consistency: The obtained maceral composition (alginite-rich) aligns well with established characteristics of Chang 7 source rocks in the Ordos Basin as reported in prior studies [12,25]. (4) Geochemical corroboration: The kerogen type inferred from macerals (Type II1) is supported by independent geochemical data (HI vs. Tmax plot; Figure 7).

6. Conclusions

(1)
The dark mudstones of the Chang 7 Member in the Pingbei area have the geological conditions to serve as effective source rocks. They have high organic matter abundance with an average TOC of 1.69%, among which the Chang 73 sub-member has an average total organic carbon (TOC) content of 2.8%, meeting the standard of high-quality source rocks. The organic matter is dominated by Type II1, mixed with a small amount of Type II2 and Type III, characterized by the input of both aquatic organisms and terrestrial organic matter. The vitrinite reflectance (Ro) ranges from 0.76% to 0.87%, indicating a mature stage corresponding to the peak period of liquid hydrocarbon generation. The overall hydrocarbon-generating potential is of medium to good level, which constitutes an important material basis for regional hydrocarbon accumulation.
(2)
The crude oils in the study area can be classified into two types (Type A and Type B). Type A crude oils are derived from the Chang 7 Member and are characterized by high Pr/Ph ratios (1.77–1.78), high Ts/Tm ratios (3.47–7.18), high abundances of rearranged hopanes, and relative enrichment of C1-, C2-, and C3-naphthalene series in saturated hydrocarbons. The geochemical differences between the two types of crude oils are mainly caused by the differentiation of sedimentary environments and thermal evolution degrees of source rocks.
(3)
The results of oil–source correlation show that Type A crude oils are extremely similar to the dark mudstones of the Chang 7 Member in terms of significant geochemical characteristics. Both are rich in C30 rearranged hopanes and C29 rearranged hopanes, with overlapping Pr/Ph ratio ranges and consistent pentacyclic triterpenoid distribution patterns, confirming that the dark mudstones of the Chang 7 Member are the main source rocks for Type A crude oils. In contrast, the geochemical characteristics of Type B crude oils are inconsistent with those of the local Chang 7 Member source rocks but are highly similar to the Chang 6 Member crude oils in oilfields surrounding the Pingbei area. Therefore, it is inferred that Type B crude oils belong to allochthonous reservoirs and are derived from the Chang 6 Member source rocks in surrounding areas.

Author Contributions

Conceptualization, Y.M. and S.Y.; methodology, Y.M. and C.C.; validation, Y.M., Y.S. and S.Y.; investigation, Y.M. and C.C.; resources, Q.C. and Q.D.; data curation, Y.S.; writing—original draft preparation, Y.M.; writing—review and editing, Q.C. and Q.D.; supervision, S.Y.; project administration, Z.H.; funding acquisition, Z.H. All authors have read and agreed to the published version of the manuscript.

Funding

1. National Science and Technology Major Project for New Oil and Gas Exploration and Development: “Total Petroleum System and New Domain Exploration Technologies in the Sichuan Basin” (Grant No. 2025ZD1400400). 2. Oil & Gas Major Project (2025ZD1400200).

Institutional Review Board Statement

Not applicable.

Informed Consent Statement

Not applicable.

Data Availability Statement

All data and materials are available on request from the corresponding author. The data are not publicly available due to ongoing research using a part of the data.

Conflicts of Interest

Author Yahui Sun was employed by the company Huabei Geophysical Exploration Branch, BGP Inc., CNPC, Renqiu 062550, China. The remaining authors declare that the research was conducted in the absence of any commercial or financial relationships that could be construed as a potential conflict of interest.

Appendix A

Table A1. Glossary.
Table A1. Glossary.
TermDefinition
TOC (Total Organic Carbon)The mass percentage of organic carbon in source rocks, a core indicator of organic matter abundance. Classified as: ordinary source rocks (0.5–1%), good source rocks (1–2%), high-quality source rocks (>2%).
Rock PyrolysisA thermal analysis method to evaluate hydrocarbon generation potential. Key parameters: S1 (free hydrocarbons, mg/g), S2 (pyrolyzable hydrocarbons, mg/g), Tmax (maximum pyrolysis temperature, °C).
Vitrinite Reflectance (Ro)The reflectance of vitrinite macerals under incident light (546 nm), a critical indicator of organic matter maturity. Stages: immature (<0.5%), mature (0.5–1.3%), highly mature (1.3–2.0%), over-mature (>2.0%).
GC-MS (Gas Chromatography–Mass Spectrometry)An analytical technique combining gas chromatography (separation) and mass spectrometry (detection) to identify and quantify organic compounds (e.g., saturated/aromatic hydrocarbons, biomarkers).
BiomarkerSpecific organic compounds preserved in geological samples (oils, source rocks) that reflect the origin, sedimentary environment, and thermal evolution of organic matter (e.g., steranes, terpanes, isoprenoids).
Pr/Ph Ratio
(Pristane/Phytane Ratio)
The ratio of two isoprenoid alkanes (pristane, Ph; phytane, Pr). Indicates paleo-redox conditions: Pr/Ph > 1 (oxic–suboxic environment), Pr/Ph < 1 (reducing environment).
Ts/Tm RatioThe ratio of 18α(H)-22,29,30-Trisnorneohopane (Ts) to 17α(H)-22,29,30-Trisnorhopane (Tm). Influenced by thermal maturity and sedimentary environment; higher values indicate higher maturity or oxic conditions.
SteranesCyclic biomarkers derived from eukaryotic cell membranes (algae, plants). C27 steranes (aquatic algae), C29 steranes (terrestrial plants); C29 sterane 20S/(20S + 20R) and ββ/(αα + ββ) ratios indicate maturity.
TerpanesCyclic biomarkers derived from prokaryotic cell membranes (bacteria) and plant resins. Tricyclic terpanes (source input), pentacyclic hopanes (sedimentary environment/maturity), rearranged hopanes (clay catalysis).
Organic Matter TypeClassified by origin and hydrocarbon generation potential: Type I (sapropelic, aquatic algae, high oil potential), Type II1 (mixed sapropelic–humic, aquatic + terrestrial, good oil potential), Type II2 (mixed humic–sapropelic, terrestrial + aquatic, oil–gas potential), Type III (humic, terrestrial plants, high gas potential).
MaturityThe degree of thermal transformation of organic matter under burial. Mature stage (Ro = 0.7–1.3%) corresponds to peak liquid hydrocarbon generation; controlled by burial depth, geothermal gradient, and heating time.
Oil–Source CorrelationA method to link crude oils to their parent source rocks using consistent geochemical signatures (biomarker ratios, isotope compositions, molecular distributions).
TmaxThe temperature at which the maximum pyrolysis yield (S2 peak) occurs in rock pyrolysis, reflecting organic matter type and maturity (higher values indicate higher maturity or terrestrial organic matter input).
HI (Hydrogen Index)The ratio of pyrolyzable hydrocarbons (S2) to TOC (mg HC/g TOC), indicating organic matter type (higher values = more oil-prone Type I/II1).
S1 + S2The sum of free and pyrolyzable hydrocarbons, a direct indicator of source rock hydrocarbon generation potential (effective source rocks: S1 + S2 > 2 mg/g).
Table A2. Complete data table of Source rock TOC and rock pyrolysis.
No.Well NumberDepth/mStratigraphic HorizonLithologyTOC%Tmax°CS1 (mg/g)S2 (mg/g)S1 + S2
(mg/g)
HI/gTOC
1P45-9031488.05Chang 72Dark gray mudstone2.784521.238.339.56300
2P45-9031488.76Chang 72Dark gray mudstone2.724521.118.589.69315
3P45-9031489.02Chang 72Dark gray mudstone2.694511.28.639.83321
4P45-9031489.46Chang 72Dark gray mudstone2.054481.47.368.76359
5P45-9031489.62Chang 72Dark gray mudstone2.874510.858.829.67307
6P45-9031489.79Chang 72Dark gray mudstone2.364500.917.378.28312
7P45-9031490.06Chang 72Dark gray mudstone3.274521.0310.4211.45319
8P65-1091413.5Chang 72Dark gray silty mudstone0.724500.812.80.92109.72
9P65-1091416Chang 72Dark gray mudstone2.234510.360.874.66178.03
10P65-1091420.5Chang 72Gray silty mudstone0.834510.11.20.4848.19
11P45-9031492.37Chang 73Dark gray mudstone0.714550.10.610.7186
12P45-9031509.42Chang 73Dark gray mudstone0.884530.371.291.66147
13P45-9031510.05Chang 73Dark gray mudstone1.634480.244.234.47260
14P45-9031510.5Chang 73Dark gray mudstone0.954480.192.12.29221
15P45-9031510.77Chang 73Dark gray mudstone5.334401.2510.7411.99202
16P45-9031512.12Chang 73Dark gray mudstone0.834560.120.660.7880
17P45-9031512.89Chang 73Dark gray mudstone0.614550.10.630.73103
18P45-9031513.16Chang 73Dark gray mudstone0.814480.141.271.41157
19P45-9031513.44Chang 73Dark gray mudstone0.744540.090.580.6778
20P45-9031515.48Chang 73silty mudstone1.444460.292.833.12197
21P45-9031515.9Chang 73silty mudstone1.054500.352.62.95248
22P45-9031516.58Chang 73silty mudstone1.024470.171.621.79159
23P45-9031516.9Chang 73silty mudstone1.264490.332.022.35160
24P45-9031517.3Chang 73silty mudstone1.514500.413.163.57209
25P45-9031518.52Chang 73Dark gray mudstone1.544470.273.723.99242
26P45-9031518.72Chang 73Dark gray mudstone1.354470.242.292.53170
27P45-9031519.1Chang 73Dark gray mudstone0.754530.080.720.896
28P45-9031520.28Chang 73Dark gray mudstone0.84490.151.221.37153
29P45-9031520.77Chang 73Dark gray mudstone0.784500.151.611.76206
30P45-9031521.92Chang 73silty mudstone0.844480.171.141.31136
31P45-9031522.2Chang 73Dark gray mudstone0.764500.151.021.17134
32P45-9031523.99Chang 73Dark gray mudstone0.614510.070.490.5680
33P45-9031525.69Chang 73Dark gray mudstone0.764500.110.941.05124
34P45-9031526.84Chang 73Dark gray mudstone1.014500.131.151.28114
35P45-9031527.52Chang 73Dark gray mudstone4.144440.921010.92242
36P45-9031527.6Chang 73Dark gray mudstone6.154421.5920.622.19335
37P45-9031527.84Chang 73Dark gray mudstone0.784530.11.211.31155
38P45-9031528Chang 73Dark gray mudstone34440.819.7510.56325
39P45-9031530.73Chang 73Dark gray mudstone0.884530.090.840.9395
40P45-9031530.94Chang 73Dark gray mudstone2.34470.786.237.01271
41P45-9031531.22Chang 73Dark gray mudstone1.364460.211.912.12140

References

  1. Zou, C.N.; Yang, Z.; Cui, J.W.; Zhu, R.K.; Hou, L.H.; Tao, S.Z.; Yuan, X.J.; Wu, S.T.; Lin, S.H.; Wang, L.; et al. Formation mechanism, geologi cal characteristics and development strategy of nonmarine shale oil in China. Pet. Explor. Dev. 2013, 40, 15–27. [Google Scholar] [CrossRef] [Scilit]
  2. Fu, J.H.; Zhao, H.T.; Dong, G.D.; Han, T.Y.; Ren, J.F.; Huang, Z.L.; Lu, Z.X.; Zhu, B.D.; Zhu, J.; Yin, L.L.; et al. Discovery and Prospect of Oil and Gas Exploration in New Domains of the Ordos Basin. Nat. Gas Geosci. 2023, 34, 1289–1304. [Google Scholar]
  3. Fu, J.H.; Niu, X.B.; Dan, W.D.; Feng, S.B.; Liang, X.W.; Xin, H.G.; You, Y. Geological Characteristics and Exploration-Development Progress of Shale Oil in the 7th Member of the Mesozoic Yanchang Formation, Ordos Basin. China Pet. Explor. 2019, 24, 601–614. [Google Scholar]
  4. Hua, Y.A.N.G.; Xiaobing, N.I.U.; Liming, X.U.; Shengbin, F.; Yuan, Y.; Fang, W.A.N.G. Exploration potential of shale oil in Chang7 member, upper Triassic Yanchang formation, Ordos Basin, NW China. Pet. Explor. Dev. 2016, 43, 560–569. [Google Scholar] [CrossRef] [Scilit]
  5. Cui, J.W.; Zhu, R.K.; Luo, Z.; Li, S. Sedimentary and geochemical characteristics of the Triassic Chang 7 member shale in the southeastern Ordos Basin, Central China. Pet. Sci. 2019, 16, 285–297. [Google Scholar] [CrossRef] [Scilit]
  6. Jarvie, D.M. Shale resource systems for oil and gas: Part 2—shale-oil resource systems. In Shale Reser Voir-Giant Resources for the 21st Century; AAPG Memoir; Breyer, J.A., Ed.; American Association of Petroleum Geologists: Tulsa, OK, USA, 2012; Volume 97, pp. 89–119. [Google Scholar] [CrossRef] [Scilit]
  7. Miller, B.A.; Paneitz, J.M.; Yakeley, S.; Evans, K.A. Unlocking tight oil: Selective multistage fracturing in the Bakken Shale. In Proceedings of the SPE Annual Technical Conference and Exhibition, Denver, CO, USA, 21–24 September 2008. [Google Scholar] [CrossRef] [Scilit]
  8. Donovan, A.D.; Staerker, T.S.; Pramudito, A.; Li, W.G.; Gorbett, M.J.; Lowery, C.M.; Romero, A.M.; Gardner, R.D. The Eagle Ford outcrops of West Texas: A laboratory for understanding heterogeneities within unconventional mudstone reservoirs. GCAGS J. 2012, 1, 162–185. [Google Scholar]
  9. Han, Z.H.; Zhao, J.Z.; Meng, X.G.; Shen, Z.Z.; Yang, R.G.; Zhang, H.; Gao, F.L. Discovery and geochemical characteristics of chang 7 source rocks from the eastern margin of a triassic lacustrine basin in the ordos basin. Pet. Geol. Exp. 2020, 42, 991–1000. [Google Scholar]
  10. Liu, H.L.; Zou, C.N.; Qiu, Z.; Yin, S.; Yang, Z.; Wu, S.T.; Zhang, G.S.; Chen, Y.P.; Ma, F.; Li, S.X.; et al. Sedimentary environment and organic matter enrichment mechanism of continental black shales: A case study of the chang 7 member in the ordos basin. Acta Sedimentol. Sin. 2023, 41, 1810–1829. [Google Scholar] [CrossRef]
  11. Wang, Q.C.; Li, W.H.; Zhao, J.Z.; Luo, J.L. Organic geochemistry characteristics of hydrocarbon source rocks in the member 1 of upper triassic yanchang formation, in ordos basin. Coal Geol. Explor. 2006, 34, 26–30. [Google Scholar]
  12. Yang, H.; Zhang, W.Z. On the dominant role of high-quality source rocks in the chang 7 member of the ordos basin in the accumulation and enrichment of low-permeability oil and gas: Geological and geochemical characteristics. Geochimica 2005, 34, 147–154. [Google Scholar] [CrossRef]
  13. Xiao, Z.L.; Li, Y.; Yu, J.; Zhang, H.; Lu, J.G.; Yin, X.D.; Han, M.M. Key geochemical evidence for “near-source accumulation” of tight oil: A case study of near-source assemblages in the yanchang formation of the ordos basin. Pet. Geol. Exp. 2023, 45, 517–527. [Google Scholar] [CrossRef]
  14. Xie, Y.Y.; Liu, X.F.; Wang, J.; Wu, N.; Hu, C.; Wang, Y.B. Characteristics and main controlling factors of tight oil reservoirs in chang 7 member of yanchang formation in ordos basin, north shaanxi. Mar. Geol. Quat. Geol. 2022, 42, 149–159. [Google Scholar] [CrossRef]
  15. Xue, Y.C.; Tian, X.F. Characteristics of Chang 7 Tight Oil Reservoirs in the Ordos Basin. Spec. Oil Gas Reserv. 2014, 21, 111–115+156. [Google Scholar]
  16. Li, W.H.; Pang, J.G.; Cao, H.X.; Xiao, L.; Wang, R.G. Sedimentary systems and lithofacies palaeogeographic evolution during the late triassic yanchang period in the ordos basin. J. Northwest Univ. (Nat. Sci. Ed.) 2009, 39, 501–506. [Google Scholar]
  17. Li, S.H.; Chen, X.M.; Yao, F.Y.; Zhang, S.F. Study on intra-reservoir heterogeneity of the chang 6 oil member of the yanchang formation in the pingbei oilfield. Sediment. Geol. Tethyan Geol. 2006, 26, 55–58. [Google Scholar]
  18. Jiang, Y.; Gong, H.J.; Pu, R.H. Geochemical characteristics of source rocks in the chang 9–chang 7 members and their correlation with the tight oil sources of chang 8 member in the ganquan-fuxian area, ordos basin. Sediment. Geol. Tethyan Geol. 2024, 44, 656–670. [Google Scholar] [CrossRef]
  19. Zou, S.; He, D.F.; Cheng, X.; Mao, D.F. Analysis of the large-scale structural geological section in the northern segment of the western margin of the ordos basin and a new interpretation of the genesis of the qipanjing syncline. Chin. J. Geol. 2024, 59, 712–722. [Google Scholar]
  20. Wang, F.; Chen, H.D.; Zhao, J.X.; Chen, A.Q.; Su, Z.T.; Li, J. Types and characteristics of sequence boundaries of the cambrian-permian in the ordos basin and their petroleum geological significance. Sediment. Geol. Tethyan Geol. 2011, 31, 6–12. [Google Scholar]
  21. Wang, X.L.; Wang, C.L.; Chen, Z.L.; Tian, J.J. Study on ordovician weathering crust karst reservoirs in the ordos basin. Spec. Oil Gas Reserv. 2005, 12, 32–35+108. [Google Scholar]
  22. Yang, H.; Li, S.X.; Liu, X.Y. Characteristics and resource potential of tight oil and shale oil in the ordos basin. Acta Pet. Sin. 2013, 34, 1–11. [Google Scholar]
  23. Fu, J.; Li, S.; Liu, X.; Deng, X.Q.; Lv, J.W.; Pang, J.L. Sedimentary fa cies and its evolution of the Chang 9 interval of Upper Triassic Yanchang Formation in Ordos Basin. J. Palaeo Geogr. 2012, 14, 269–284. [Google Scholar]
  24. Fu, J.; Li, S.; Liu, X. Geological theory and practice of petroleum exploration in the Ordos Basin. Nat. Gas Geosci. 2013, 24, 1091–1101. [Google Scholar]
  25. Zhang, W.Z.; Yang, H.; Yang, Y.H.; Kong, Q.F.; Wu, K. Petrological and elemental geochemical characteristics and development environment of high-quality source rocks in the chang 7 member of the ordos basin. Geochimica 2008, 37, 59–64. [Google Scholar] [CrossRef]
  26. Pickel, W.; Kus, J.; Flores, D.; Kalaitzidis, S.; Christanis, K.; Cardott, B.J.; Misz-Kennan, M.; Rodrigues, S.; Hentschel, A.; Hamor-Vido, M.; et al. Classification of liptinite–ICCP System 1994. Int. J. Coal Geol. 2017, 169, 40–61. [Google Scholar] [CrossRef] [Scilit]
  27. Gonçalves, P.A.; Flores, D.; Rodrigues, S.; Suárez-Ruiz, I.; Marques, M.; De La Torre, M.L.; Klimentidis, R. An updated review of correct terminology and references regarding organic components in dispersed organic matter. Int. J. Coal Geol. 2024, 294, 104604. [Google Scholar] [CrossRef] [Scilit]
  28. Peters, K.E.; Walters, C.C.; Moldowan, J.M. The Biomarker Guide: Volume 2, Biomarkers and Isotopes in Petroleum Exploration and Earth History, 2nd ed.; Cambridge University Press: Cambridge, UK, 2005. [Google Scholar] [CrossRef] [Scilit]
  29. Zuo, Z.; Cao, J.; Hu, W.; Shi, C.; Wang, X.; Yao, S.; Luo, B. Characterizing the maturity of highly evolved organic matter based on aromatic hydrocarbons and optimization with pyrobitumen reflectance and Raman spectral parameters. Sci. China Earth Sci. 2022, 65, 2335–2357. [Google Scholar] [CrossRef] [Scilit]
  30. Hughes, W.B.; Holba, A.G.; Dzou, L.I. The ratios of dibenzothiophene to phenanthrene and pristane to phytane as indicators of depositional environment and lithology of petroleum source rocks. Geochim. Cosmochim. Acta 1995, 59, 3581–3598. [Google Scholar] [CrossRef] [Scilit]
  31. Liu, Z.R.; Wang, Z.W.; Wang, J.; Fu, X.G.; Fan, Z.W.; He, Z.Y.; Zeng, S.Q.; Yi, J.Q. Organic Geochemical Characteristics and Hydrocarbon Generation Potential of Upper Triassic Black Shales in the North Qiangtang Depression. Geol. China 2025, 52, 61–77. Available online: http://geochina.cgs.gov.cn/article/doi/10.12029/gc20230902001?viewType=citedby-info (accessed on 9 February 2026).
  32. Peters, K.E.; Moldowan, J.M. The Biomarker Guide: Interpreting Molecular Fossils in Petroleum and Ancient Sediments; Prentice Hall: Englewood Cliffs, NJ, USA, 1993. [Google Scholar]
  33. Huang, W.Y.; Meinschein, W.G. Sterols as ecological indicators. Geochim. Cosmochim. Acta 1979, 43, 739–745. [Google Scholar] [CrossRef] [Scilit]
  34. Volkman, J.K. A review of sterol markers for marine and terrigenous organic matter. Org. Geochem. 1986, 9, 83–99. [Google Scholar] [CrossRef] [Scilit]
  35. Li, E.T.; Chen, J.; Cao, J.; Wei, X.; Zhang, Y.; Zhang, X.G.; Wang, H.J. Geochemical characteristics and genetic analysis of crude oils in the mosowan area of the junggar basin. Pet. Geol. Exp. 2022, 44, 112–120. [Google Scholar]
  36. Didyk, B.M.; Simoneit, B.R.T.; Brassell, S.C.; Eglinton, G. Organic geochemical indicators of palaeoenvironmental conditions of sedimentation. Nature 1978, 272, 216–222. [Google Scholar] [CrossRef] [Scilit]
  37. Dong, J.Y.; Chen, S.J.; Zou, X.L.; Yao, J.L.; Li, Y.; Su, K.M. Distribution characteristics and genesis of rearranged hopanes in the yanchang formation of the wuqi-gaoqiao area, ordos basin. Pet. Geol. Exp. 2017, 39, 834–841. [Google Scholar]
  38. Hunt, J.M. Petroleum Geochemistry and Geology, 2nd ed.; W. H. Freeman and Company: New York, NY, USA, 1996. [Google Scholar]
  39. Hackley, P.C.; Cardott, B.J. Application of organic petrography in North American shale petroleum systems: A review. Int. J. Coal Geol. 2016, 163, 8–51. [Google Scholar] [CrossRef] [Scilit]
  40. ten Haven, H.L.; de Leeuw, J.W.; Rullkötter, J.; Sinninghe Damsté, J.S. Restricted utility of the pristane/phytane ratio as a palaeoenvironmental indicator. Nature 1987, 330, 641–643. [Google Scholar] [CrossRef] [Scilit]
  41. Seifert, W.K.; Moldowan, J.M. Use of biological markers in petroleum exploration. In Methods in Geochemistry and Geophysics; Elsevier: Amsterdam, The Netherlands, 1986; Volume 24, pp. 261–290. [Google Scholar]
  42. Waples, D.W. Geochemistryin Petroleum Exploration; Springer: Berlin/Heidelberg, Germany, 1985. [Google Scholar] [CrossRef] [Scilit]
  43. Radke, M.; Welte, D.H.; Willsch, H. Maturity parameters based on aromatic hydrocarbons: Influence of the organic matter type. Org. Geochem. 1986, 10, 51–63. [Google Scholar] [CrossRef] [Scilit]
  44. Seifert, W.K.; Moldowan, J.M. The effect of thermal stress on source-rock quality as measured by hopane stereochemistry. In Advances in Organic Geochemistry 1979; Douglas, A.G., Maxwell, J.R., Eds.; Physics and Chemistry of the Earth; Pergamon: Oxford, UK, 1980; Volume 12, pp. 229–237. [Google Scholar]
  45. van Kaam-Peters, H.M.E.; Köster, J.; van der Gaast, S.J.; Dekker, M.; de Leeuw, J.W.; Sinninghe Damsté, J.S. The effect of clay minerals on diasterane/sterane ratios. Geochim. Et Cosmochim. Acta 1998, 62, 2923–2929. [Google Scholar] [CrossRef] [Scilit]
  46. Pancost, R.D.; Boot, C.S. The palaeoclimatic utility of terrestrial biomarkers in marine sediments. Mar. Chem. 2004, 92, 239–261. [Google Scholar] [CrossRef] [Scilit]
  47. Barker, C.E.; Pawlewicz, M.J. The correlation of vitrinite reflectance with maximum temperature in humic organic matter. In Lecture Notes in Earth Sciences; Springer: Berlin/Heidelberg, Germany, 1993; Volume 40, pp. 79–93. [Google Scholar]
  48. Tyson, R.V. Sedimentary Organic Matter: Organic Facies and Palynofacies; Chapman & Hall: London, UK, 1995. [Google Scholar]
  49. Demaison, G.J.; Moore, G.T. Anoxic environments and oil source bed genesis. Org. Geochem. 1980, 2, 9–31. [Google Scholar] [CrossRef] [Scilit]
Figure 1. Tectonic location of the Pingbei area in the Ordos Basin (a) and comprehensive stratigraphic column of the Chang 7 Member (b).
Applsci 16 01939 g001
Figure 2. Plane map of dark mudstone in the Chang 72 sublayer.
Applsci 16 01939 g002
Figure 3. Plane map of dark mudstone in the Chang 73 sublayer.
Applsci 16 01939 g003
Figure 4. Distribution histogram of TOC content (%) of source rocks in the Chang 7 Member.
Applsci 16 01939 g004
Figure 5. Distribution histogram of S1 + S2 of source rocks in the Chang 7 Member.
Applsci 16 01939 g005
Figure 6. Cross-plot of S1, S2 and TOC of source rocks in the Chang 7 Member, Pingbei area. (a) TOC vs. S1: Correlation between total organic carbon (TOC, %) and free hydrocarbon content (S1, mg/g), showing the relationship between organic richness and extractable free hydrocarbons. (b) TOC vs. S2: Relationship between TOC (%) and pyrolytic hydrocarbon yield (S2, mg/g), reflecting the hydrocarbon generation potential of kerogen. (c) TOC vs. S1 + S2: Variation of total hydrocarbon potential (S1 + S2, mg·g−1) with TOC (%), indicating the overall hydrocarbon generation capacity of the source rocks. (d) S1 vs. S2: Correlation between free hydrocarbon (S1, mg·g−1) and pyrolytic hydrocarbon (S2, mg·g−1), used to assess thermal maturity and hydrocarbon expulsion efficiency.
Applsci 16 01939 g006
Figure 7. Cross-plot of HI vs. Tmax (°C).
Applsci 16 01939 g007
Figure 8. (a) Histogram of Ro of source rocks in the Chang 7 Member, Pingbei area; (b) correlation plot of Tmax vs. Ro of source rocks in the Chang 7 Member, Pingbei area.
Applsci 16 01939 g008
Figure 9. Detection of bicyclic sesquiterpenoids (m/z123).
Applsci 16 01939 g009
Figure 10. Mass chromatogram of m/z217 (showing the distribution characteristics of regular steranes).Purple line (upper panel, P70-119 C6): This line indicates the abundance trend of key biomarker peaks (e.g., C27, C28, C29 steranes) associated with rearranged compounds, reflecting the distribution characteristics of rearranged steranes in this sample. This trend can be used to infer the depositional environment and thermal maturity of the source rock. Red line (lower panel, P65-109 C7): This line represents the abundance trend of corresponding biomarker peaks in this sample. By comparing with the purple line in the upper panel, it helps to analyze the differences in biomarker distribution between different samples, providing geochemical evidence for source rock evaluation.
Applsci 16 01939 g010
Figure 11. Mass chromatogram of m/z128 + 142 + 156 + 170 + 184 + 198.
Applsci 16 01939 g011
Figure 12. Mass chromatogram of m/z170, 184, 198 for crude oil samples from Chang 6 and Chang 7 Members. Letters a and b: Represent two source rock samples with different thermal maturities. a: Sample with relatively low thermal maturity. b: Sample with relatively high thermal maturity (consistent with the “Increasing Maturity” arrow on the left). Red dashed lines: Indicate the relative abundance trends of specific thermally stable methylnaphthalene isomers (e.g., 1,3,7-trimethylnaphthalene, 1,3,6,7-tetramethylnaphthalene, 1,2,4,6,7-pentamethylnaphthalene). These lines highlight that as thermal maturity increases, the relative abundance of these stable isomers increases, which serves as a key geochemical indicator for evaluating the thermal maturity of organic matter.
Applsci 16 01939 g012
Figure 13. Comparison of mass chromatograms of alkylphenanthrene series in crude oils.Purple line: Internal standard peak for quantitative calibration and retention time reference. Cyan lines: Specific aromatic isomers (labeled with numbers 1, 2, 3, 9, etc.). Green lines: Thermally stable methylnaphthalene isomer groups (e.g., 1,3-; 2,10-; 3,9-; 3,10-; 1,6-; 2,9-; 2,5-; 1,7-), used to evaluate organic matter thermal maturity. Black line: 1,2,8-substituted aromatic isomer, providing supplementary evidence for depositional environment and maturity assessment.
Applsci 16 01939 g013
Figure 14. Cross-plot of Ts/Tm vs. Pr/Ph. Note: Two parallel dashed lines define the optimal empirical dividing lines for classifying crude oils into two types. Crude oils above the upper line are classified as Type A, characterized by high Ts/Tm and high Pr/Ph ratios; those below the lower line are classified as Type B, characterized by low Ts/Tm and low Pr/Ph ratios [36].
Applsci 16 01939 g014
Figure 15. Cross-plot of Ts/Tm vs. methylphenanthrene/C30 hopane.
Applsci 16 01939 g015
Figure 16. Correlation plot between Chang 7 Member source rocks and Type A crude oils in the Pingbei area (H = hopane series; D = rearranged hopane series). Red dashed lines: These lines highlight the relative abundance trend of key terpane biomarkers, specifically the ratio of C29 Ts/C30 hopane (H) in the upper source rock sample (P65-109) and the ratio of C30 diahopane (D)/C30 hopane in the lower crude oil sample (P59-118). These ratios are critical geochemical parameters used to assess the thermal maturity and depositional environment of the source rock, as well as to establish oil-source correlations.
Applsci 16 01939 g016
Table 1. Statistical table of average hydrocarbon generation potential of source rocks in the Chang 7 Member, Pingbei area.
Stratigraphic HorizonTOC%S1 (mg/g)S2 (mg/g)S1 + S2 (mg/g)
Chang 722.251.18.59.6
Chang 731.50.333.23.53
Average1.690.474.184.45
Table 2. Summary of organic matter types of dark mudstones in the Pingbei area.
Well NumberDepth/mStratigraphic HorizonLithologyAlginite/%Liptinite/%Vitrinite/%Inertinite%Type IndexOrganic Matter Type
P65-1091415.0Chang 72Dark gray silty mudstone65.76732.70.341.5TypeII1
P65-1091417.5Chang 72Dark gray mudstone60.761.737.70.732.2TypeII2
P65-1091422.0Chang 72Gray silty mudstone62.763.436.30.335.5TypeII2
P31-971558.3Chang 73Dark gray mudstone35.736.463.30.3−11.7Type III
Table 3. Distribution characteristics and related parameters of normal and isoalkanes in crude oils from different blocks (M/z85, whole oil GC-MS quantification).
AreaWell NumberStratigraphic HorizonPr/PhPr/C17Ph/C18R29C21−/C2+0EP
19–23
Carbon Number RangeDominant Carbon Peak
PingbeiP53-99Chang 630.840.200.241.111.651.04<C10–C40C20
P70-119Chang 630.850.210.251.141.401.05<C10–C40C20
P59-120Chang 4 + 520.850.210.251.111.751.04<C10–C40C20
P59-118Chang 71.770.120.071.111.351.03<C10–C40C20
P65-109Chang 71.780.160.091.111.301.03<C10–C40C21
PeripheralQi 3-341Chang 61+20.870.210.241.101.611.03<C10–C40C20
Liu 139-14Chang 61+20.800.170.211.121.361.06<C10–C40C21
Liu 140-12Chang 6120.890.200.221.151.161.05<C10–C40C20
Qi 73-62Chang 610.850.200.241.101.591.01<C10–C40C19
Pan 08-46Chang 71.010.180.181.111.701.03<C10–C28C17
Pan 38-24Chang 71.260.150.111.111.361.05<C10–C40C19
Xing 85Chang 71.150.180.151.131.391.04<C10–C40C20
Table 4. Distribution characteristics of bicyclic sesquiterpenoids (m/z123; ABCHJK see Figure 9; quantified by saturated hydrocarbon GC-MS).
AreaWell
Number
Stratigraphic HorizonJ/K(A + B)/CA/BC/H
PingbeiP53-99Chang 631.630.570.631.73
P70-119Chang 631.630.680.731.66
P59-120Chang 4 + 521.740.530.581.76
P59-118Chang 70.375.002.241.42
P65-109Chang 70.921.400.801.19
PeripheralQi 3-341Chang 61+21.031.441.051.64
Liu 139-14Chang 6121.031.560.941.35
Qi 73-62Chang 611.041.280.951.50
Liu 140-12Chang 6121.211.580.981.28
Xing 85Chang 71.311.330.841.13
Pan 38-24Chang 70.933.201.670.82
Pan 08-46Chang 70.702.961.641.23
Table 5. Distribution characteristics of long-chain tricyclic terpanes and pentacyclic triterpanes in crude oils.
AreaWell NumberStratigraphic HorizonTricyclic Terpane
C21/C23
C24
Tetracyclic
/C26Tricyclic Terpane
C23
Tricyclic Terpane
/C30
Hopane
Ts/TmC29 Rearranged Hopane/C29 HopaneC29Ts
/C29
Hopane
C30
Rearranged Hopane/C30Hopane
Gammacerane
/C31Hopane
Ping
bei
P53-99Chang 630.832.460.030.480.080.230.080.34
P70-119Chang 630.822.340.030.510.080.220.080.34
P59-120Chang 4 + 520.812.480.040.500.070.220.080.32
P59-118Chang 70.822.880.117.182.321.891.920.41
P65-109Chang 70.992.630.123.470.390.930.320.37
PeripheralQi 3-341Chang61+20.821.570.060.890.160.330.130.50
Liu
139-14
Chang 6120.801.940.042.080.190.450.140.32
Qi 73-62Chang 610.801.630.060.730.140.320.120.45
Liu
140-12
Chang 6120.771.790.052.140.210.510.170.38
Xing 85Chang 70.841.410.086.530.861.490.480.43
Pan 38-24Chang 70.741.450.096.750.901.360.400.36
Pan 08-46Chang 70.720.870.186.340.761.140.510.46
Table 6. Sterane distribution characteristics and selected parameters in crude oils.
AreaWell
Number
Stratigraphic HorizonC27Rearranged Sterane/
C27Sterane
C29Sterane S/(S + R)C29Sterane ββ/(αα + ββ)C29Sterane ββ20R/αα20RC29 Sterane 5α20S/20RC27%C28%C29%
PingbeiP53-99Chang 630.360.530.521.261.13243541
P70-119Chang 630.380.530.531.241.13253640
P59-120Chang 4 + 520.360.530.521.151.12243541
P59-118Chang 72.670.590.591.691.47283736
P65-109Chang 71.240.610.541.541.53182854
PeripheralQi 3-341Chang 61+20.680.540.561.431.19233641
Liu 139-14Chang 61+20.680.570.541.361.30263341
Qi 73-62Chang 610.650.550.561.451.24243640
Liu 140-12Chang 6120.770.570.551.481.35253541
Xing 85Chang 70.600.560.561.451.26213642
Pan 38-24Chang 71.420.630.551.641.71223642
Pan 08-46Chang 71.190.600.571.611.53243937
Table 7. Distribution characteristics and selected geochemical parameters of aromatic hydrocarbon compounds in crude oils (based on GC–MS analysis of the aromatic fraction). The methylphenanthrene/C30 hopane ratio is included as a maturity-sensitive parameter for oil classification.
AreaWell
Number
Stratigraphic HorizonABCDEFRcGHIJKLMNOP
PingbeiP59-120Chang 4 + 521.420.820.600.690.220.710.830.830.860.542.991.060.820.490.830.090.70
P70-119Chang 631.520.860.620.700.240.740.850.840.860.564.001.200.990.670.550.090.68
P53-99Chang 631.520.830.630.710.240.720.830.840.860.583.501.141.030.590.750.080.69
P59-118Chang 71.641.240.770.730.610.750.850.911.360.144.231.371.330.700.520.121.45
P65-109Chang 71.841.340.840.840.540.820.891.100.980.146.301.601.371.000.160.061.38
PeripheralQi 73-62Chang 611.481.030.760.770.280.830.900.920.960.284.841.571.181.170.370.0880.65
Liu 140-12Chang 6121.530.990.680.640.290.700.820.850.900.423.761.180.990.610.370.0760.63
Liu 139-14Chang 6121.491.000.700.680.250.760.860.890.930.384.602.191.700.690.370.0720.61
Qi 3-341Chang 61+21.621.100.780.770.290.820.890.931.000.254.941.721.191.020.340.0910.67
Xing 85Chang 71.360.870.700.680.320.660.800.740.800.413.841.130.950.790.470.0770.89
Pan 38-24Chang 71.651.080.710.650.550.710.820.821.090.414.201.261.010.610.360.0800.92
Pan 08-46Chang 71.681.250.870.800.570.840.910.950.930.126.041.731.291.040.230.0730.95
A: 2-/1-Methylnaphthalene; B: (2,7- + 2,6-)/(1,3- + 1,6-) Dimethylnaphthalene; C: 1,3,7-/(1,3,7- + 1,2,5-) Trimethylnaphthalene; D:1,3,6,7-/(1,3,6,7- + 1,2,5,6- + 1,2,3,5-) Tetramethylnaphthalene; E: 1,2,4,6,7-/(1,2,4,6,7- + 1,2,3,5,6-) Pentamethylnaphthalene; F: MPI1 = 1.5 × (2- + 3-Methylphenanthrene)/(Phenanthrene + 9-Methylphenanthrene + 1-Methylphenanthrene); Rc: Rc = 0.6 × MPI1 + 0.40; (3- + 2-)/(9- + 1-) Methylphenanthrene; G: (3- + 2-)/(9- + 1-) Methylphenanthrene; H: (1,6- + 2,9- + 2,5-)/1,7-Dimethylphenanthrene; I: 1,2,8-/(1,3,7- + 2,6,9- + 2,7,9-) Trimethylphenanthrene; J: 4-/1-Methyldibenzothiophene; K: 4,6-/1,4-Dimethyldibenzothiophene; L: 2,4-/1,4-Dimethyldibenzothiophene; M: Dibenzothiophene/Dibenzofuran; N: Dibenzofuran/Fluorene; O: Dibenzothiophene/Phenanthrene; P: Methylphenanthrene/C30 Hopane = (1- + 2- + 3- + 9-Methylphenanthrene)/C30 Hopane (calculated from GC–MS peak area ratios).
Table 8. Hydrocarbon source rock basic geochemical parameters (n-alkanes and isoprenoids).
No.Well NumberStratigraphic HorizonSample
Name
Carbon Number RangeDominant Carbon Peak0EPPr/PhPr/n
-C17
Ph/n
-C18
(C21 + C22)/
(C28 + C29)
∑C21−/∑C22+
1P31-97Chang 73Dark Gray MudstoneC15–C38C191.030.510.480.483.921.14
2P65-109Chang 72Dark Gray Siltstone MudstoneC13–C40C191.053.780.620.152.010.96
3P65-109Chang 72Dark Gray MudstoneC13–C40C191.064.210.850.171.990.80
4P65-109Chang 72Gray Siltstone MudstoneC13–C40C191.001.470.320.191.720.75
5P31-97Chang 73Dark Gray MudstoneC14–C36C251.252.540.850.291.960.84
6P31-97Chang 73Dark Gray MudstoneC14–C38C191.002.320.890.255.781.43
7P31-97Chang 73Dark Gray MudstoneC14–C39C191.033.951.560.344.671.42
8P65-109Chang 72Dark Gray MudstoneC14–C40C201.001.770.230.111.990.85
9P65-109Chang 72Dark Gray MudstoneC14–C40C201.001.810.210.092.430.94
Table 9. Hydrocarbon source rock biomarker parameters (triterpanes and steranes).
No.Well NumberStratigraphic HorizonTs/
Tm
C23 Tricyclic Terpane/C30 HopaneC30 Rearranged Hopane/C30 HopaneC29Ts/
C29 Hopane
Gammacerane/C31 HopaneC27%C28%C29%C29 Sterane S/(S + R)C29 Steraneββ/(αα + ββ)C27 Rearranged Sterane/C27 Sterane
1P31-97Chang 732.850.090.350.890.322634400.520.530.87
2P65-109Chang 726.820.121.871.820.362835370.580.572.54
3P65-109Chang 727.150.131.921.890.382936350.600.592.67
4P65-109Chang 723.510.100.420.930.332534410.530.540.92
5P31-97Chang 732.970.080.380.910.312433430.510.520.83
6P31-97Chang 733.020.090.400.950.342735380.530.530.89
7P31-97Chang 733.180.100.451.020.352634400.540.540.95
8P65-109Chang 723.470.110.481.050.372836360.550.551.01
9P65-109Chang 723.620.120.511.120.392735380.560.561.08
Ts = 18α(H)-22,29,30-Trisnorneohopane; Tm = 17α(H)-22,29,30-Trisnorhopane; all parameters were analyzed by Agilent 7890A-5975C GC-MS.
Table 10. Summary of key thermal maturity parameters for the Chang 7 Member source rocks in the Pingbei area.
ParameterValue Range (This Study)Interpretation (Maturity Stage)
Vitrinite Reflectance (Ro, %)0.76–0.87Mature (Main Oil Window)
Tmax from Rock-Eval (°C)440–456Mature (Main Oil Window)
Ts/(Ts + Tm) Ratio0.74–0.88High to Very High Maturity (Main–Late Oil Window)
C29 Sterane 20S/(20S + 20R)0.51–0.63Early to Mid-Oil Window (Approaching Equilibrium)
C29 Sterane ββ/(αα + ββ)0.52–0.59Immature to Early Oil Window (Below Equilibrium)
Disclaimer/Publisher’s Note: The statements, opinions and data contained in all publications are solely those of the individual author(s) and contributor(s) and not of MDPI and/or the editor(s). MDPI and/or the editor(s) disclaim responsibility for any injury to people or property resulting from any ideas, methods, instructions or products referred to in the content.