Article

Influence of Wave Source Parameters on Stress Wave Propagation and Damage Distribution Induced by Cylindrical Charge Blasting

1
School of Resources and Safety Engineering, Central South University, Changsha 410083, China
2
Guangxi Zhongjin Lingnan Mining Co., Ltd., Laibin 545900, China
*
Author to whom correspondence should be addressed.
Appl. Sci. 2026, 16(4), 1938; https://doi.org/10.3390/app16041938
Submission received: 13 January 2026 / Revised: 29 January 2026 / Accepted: 9 February 2026 / Published: 14 February 2026
(This article belongs to the Section Earth Sciences)

Abstract

Cylindrical charges are widely used in engineering blasting, yet the three-dimensional propagation mechanism of the associated stress waves remains inadequately understood. This study aims to investigate the effects of key wave source parameters on stress wave propagation and rock damage in cylindrical charge blasting. A semi-analytical solution for spherical stress wave propagation in a full elastic space is developed to theoretically describe the stress field, and a computational model for cylindrical charges is established based on the superposition principle of equivalent spherical charges. Numerical simulations using the RHT constitutive model are then performed to verify the theoretical predictions and further investigate stress wave propagation and rock damage. The results show that the attenuation index of radial stress decreases from 1.5 to 1 as the loading rate increases. Higher loading rates produce more but shorter cracks, whereas lower rates result in fewer but longer cracks. The blast-induced damage region shifts from the detonation direction toward the horizontal plane with increasing detonation velocity, and the resulting rock damage exhibits a conical distribution controlled by the initiation point. These findings provide practical guidance for optimizing cylindrical charge blasting and controlling crack patterns in engineering applications.

1. Introduction

The drilling and blasting method remains a foundational technique in underground excavation and mining operations [1,2,3]. The detonation of explosives releases an immense amount of energy, generating a high-pressure load on the borehole wall that rapidly propagates through the surrounding rock in the form of stress waves. Among various charge configurations, cylindrical charges are predominant in practical blasting engineering due to their adaptability to borehole geometry [4,5,6]. Therefore, developing an appropriate theoretical model for the stress wave field induced by cylindrical charges is essential for analyzing the propagation behavior and attenuation characteristics of stress waves generated by such charge configurations.
Theoretical models of stress wave propagation induced by spherical and cylindrical sources have been extensively studied. In such models, the action of blasting on the borehole wall is typically idealized as a time-dependent pressure load P ( t ) . Numerous researchers have investigated the dynamic response of rock to blasting by constructing various pressure-time functions and applying wave dynamics theories. Blake [7] introduced an exponential source function that instantaneously peaks, and through Fourier transform analysis, derived analytical displacement solutions for the far field ( r > > a ). Building upon this, Duvall [8], Jiang [9], Blair [10], and others developed analytical solutions for spherical stress wave radiation using various pressure functions that account for different loading durations. Xu [11] derived an analytical solution for stress wave propagation under triaxial stress states using Blair’s source function, aiming to investigate the yield mechanisms of rock blasting under different stress conditions. However, analytical solutions are unattainable for certain source functions. Yi [12] conducted a systematic comparison of commonly used borehole pressure source functions and highlighted their inherent limitations. The single-exponential decay source neglects the pressure rise stage, while the double-exponential source introduces a discontinuity in its derivative at the initial loading moment, which is physically unrealistic. Although Blair’s source function ensures continuity of higher-order derivatives by adopting a sufficiently large exponent, it does not permit independent control of the loading and decay processes. Among the existing models, Trivino’s source formulation was shown to provide a more realistic representation of the borehole wall pressure history; however, its analytical solution is difficult to derive, limiting its direct application in theoretical stress wave analyses. To address this issue, numerical inversion of the Laplace transform was employed to compute the stress wave potential function, enabling an investigation of the influence of in situ stress on blasting effectiveness. In practical scenarios, cylindrical charges exhibit finite lengths and fixed detonation velocities, leading to stress wavefronts that deviate from classical spherical symmetry and thereby complicating theoretical modeling. Starfield [13] proposed approximating the stress wave field induced by a cylindrical charge as a superposition of waves from multiple equivalent spherical sources, with stress attenuation from each charge described by empirical formulas. Heelan [14] derived a theoretical solution for stress wave radiation from a finite-length cylindrical charge. Blair noted that while Heelan’s solution is not suitable for near-field analysis, it performs well for far-field problems. Building upon Heelan’s formulation, Blair [10] and others utilized a superposition approach to assess the effects of cylindrical charge blasting with finite detonation velocity on far-field vibration near a free surface. Stress wave propagation models for cylindrical charges are generally classified into two categories: those based on equivalent spherical charge superposition, and those based on a series of short cylindrical charges. In the former, attenuation behavior is typically determined by empirical formulas, while the latter approach—though rooted in Heelan’s analytical solution—faces limitations in accurately capturing near-field stress attenuation. The choice of source pressure function is a critical factor in modeling the dynamic response of rock to blasting, as it serves as the primary excitation input. Due to the complex and varied characteristics of these functions, their solutions often require advanced mathematical techniques, and in some cases, closed-form analytical solutions may be unattainable.
The amplitude of stress waves generated by blasting decays progressively with propagation distance, primarily due to two mechanisms: geometric spreading and material damping [15,16,17]. Geometric attenuation arises from the continual expansion of the wavefront, which disperses wave energy over an increasingly larger area, whereas material damping is associated with the intrinsic nonlinear characteristics of the rock medium. Jiang [9] theoretically demonstrated that the amplitude of stress waves decays proportionally to 1 / r 2 in the near field of the borehole and to 1 / r in the far field, indicating more rapid attenuation in the near-field region. Ahn [18] employed analytical solutions for spherical charge-induced stress waves to validate axisymmetric dynamic finite difference simulations of near-field wave attenuation. and further highlighted the correlation between wave attenuation characteristics and the rise time of the stress wave. Cho [19] and Ma [20] conducted numerical simulations to investigate the dynamic fracture processes in rock blasting under different loading rates of source pressure function. Similarly, Liu [21] investigated the effect of different loading rates on single-hole blast-induced crack propagation using the ordinary state-based peridynamic (OSBPD) method, demonstrating that higher loading rates produce a greater number of cracks but with shorter propagation lengths. Considering wave superposition and finite detonation velocity, Liu [22] modeled strain wave generation from cylindrical charges using equivalent spherical charge superposition and analyzed strain wave variation under different VODs. Huo [23] further investigated the effects of wave source characteristics—such as loading rate, VOD, and initiation point—on the stress field distribution and attenuation characteristics surrounding the stress waves induced by cylindrical charges. Gou [24] and Zuo [2] studied the evolution and spatial distribution of stress fields induced by cylindrical charges through experiments and numerical simulations, and found that the stress field exhibits pronounced non-uniformity, with peak stresses increasing along the detonation direction and remaining consistently higher at the detonation front than at the initiation end. Although the equivalent spherical charge superposition method, as proposed by Liu [22], Huo [23], and others, accounts for the temporal superposition of stress waves from equivalent spherical charges, it does not fully consider the attenuation effects that arise due to the specific characteristics of the wave source pressure function of these equivalent spherical charges as the waves propagate. Moreover, existing studies predominantly focus on numerical or experimental observations of stress field non-uniformity and damage patterns, yet a unified theoretical framework capable of explaining the three-dimensional spatiotemporal evolution of stress wave fields induced by cylindrical charge blasting remains lacking. In particular, the coupling between wave source parameters and stress wave attenuation within the equivalent superposition framework has not been rigorously addressed, which limits the predictive capability of current cylindrical charge blasting models.
In existing models of stress wave propagation induced by cylindrical charge blasting based on Starfield’s equivalent superposition theory, the attenuation exponent of stress waves generated by the equivalent spherical charges is commonly assumed to be 1, and the attenuation behavior associated with wave source characteristics is not theoretically considered. This paper introduces a semi-analytical solution for the propagation of spherical waves in an elastic full space, applicable to any wave source function. Building on Starfield’s equivalent superposition theory, a computational model for the stress wave field generated by cylindrical charge blasting is developed. The theoretical analysis characterizes the three-dimensional stress field by transforming the stress tensor into the principal-stress space, where the maximum and minimum principal stresses are used to describe the spatial evolution of compressive and tensile stress concentrations. In parallel, numerical simulations are conducted to further examine the influence of wave-source parameters—including loading rate, detonation velocity, and initiation position—on blasting-induced rock damage. The simulation results interpret the stress-wave effects in terms of crack propagation patterns and the spatial distribution of damage, thereby complementing and validating the theoretical predictions. The model presented here provides a theoretical explanation for the propagation and attenuation of stress waves in cylindrical charge blasting under three-dimensional conditions, and serves as a theoretical foundation for exploring the dynamic fracturing characteristics of rock blasting.

2. Model Formulation

2.1. Semi-Analytical Solution for Spherical Stress Wave Propagation

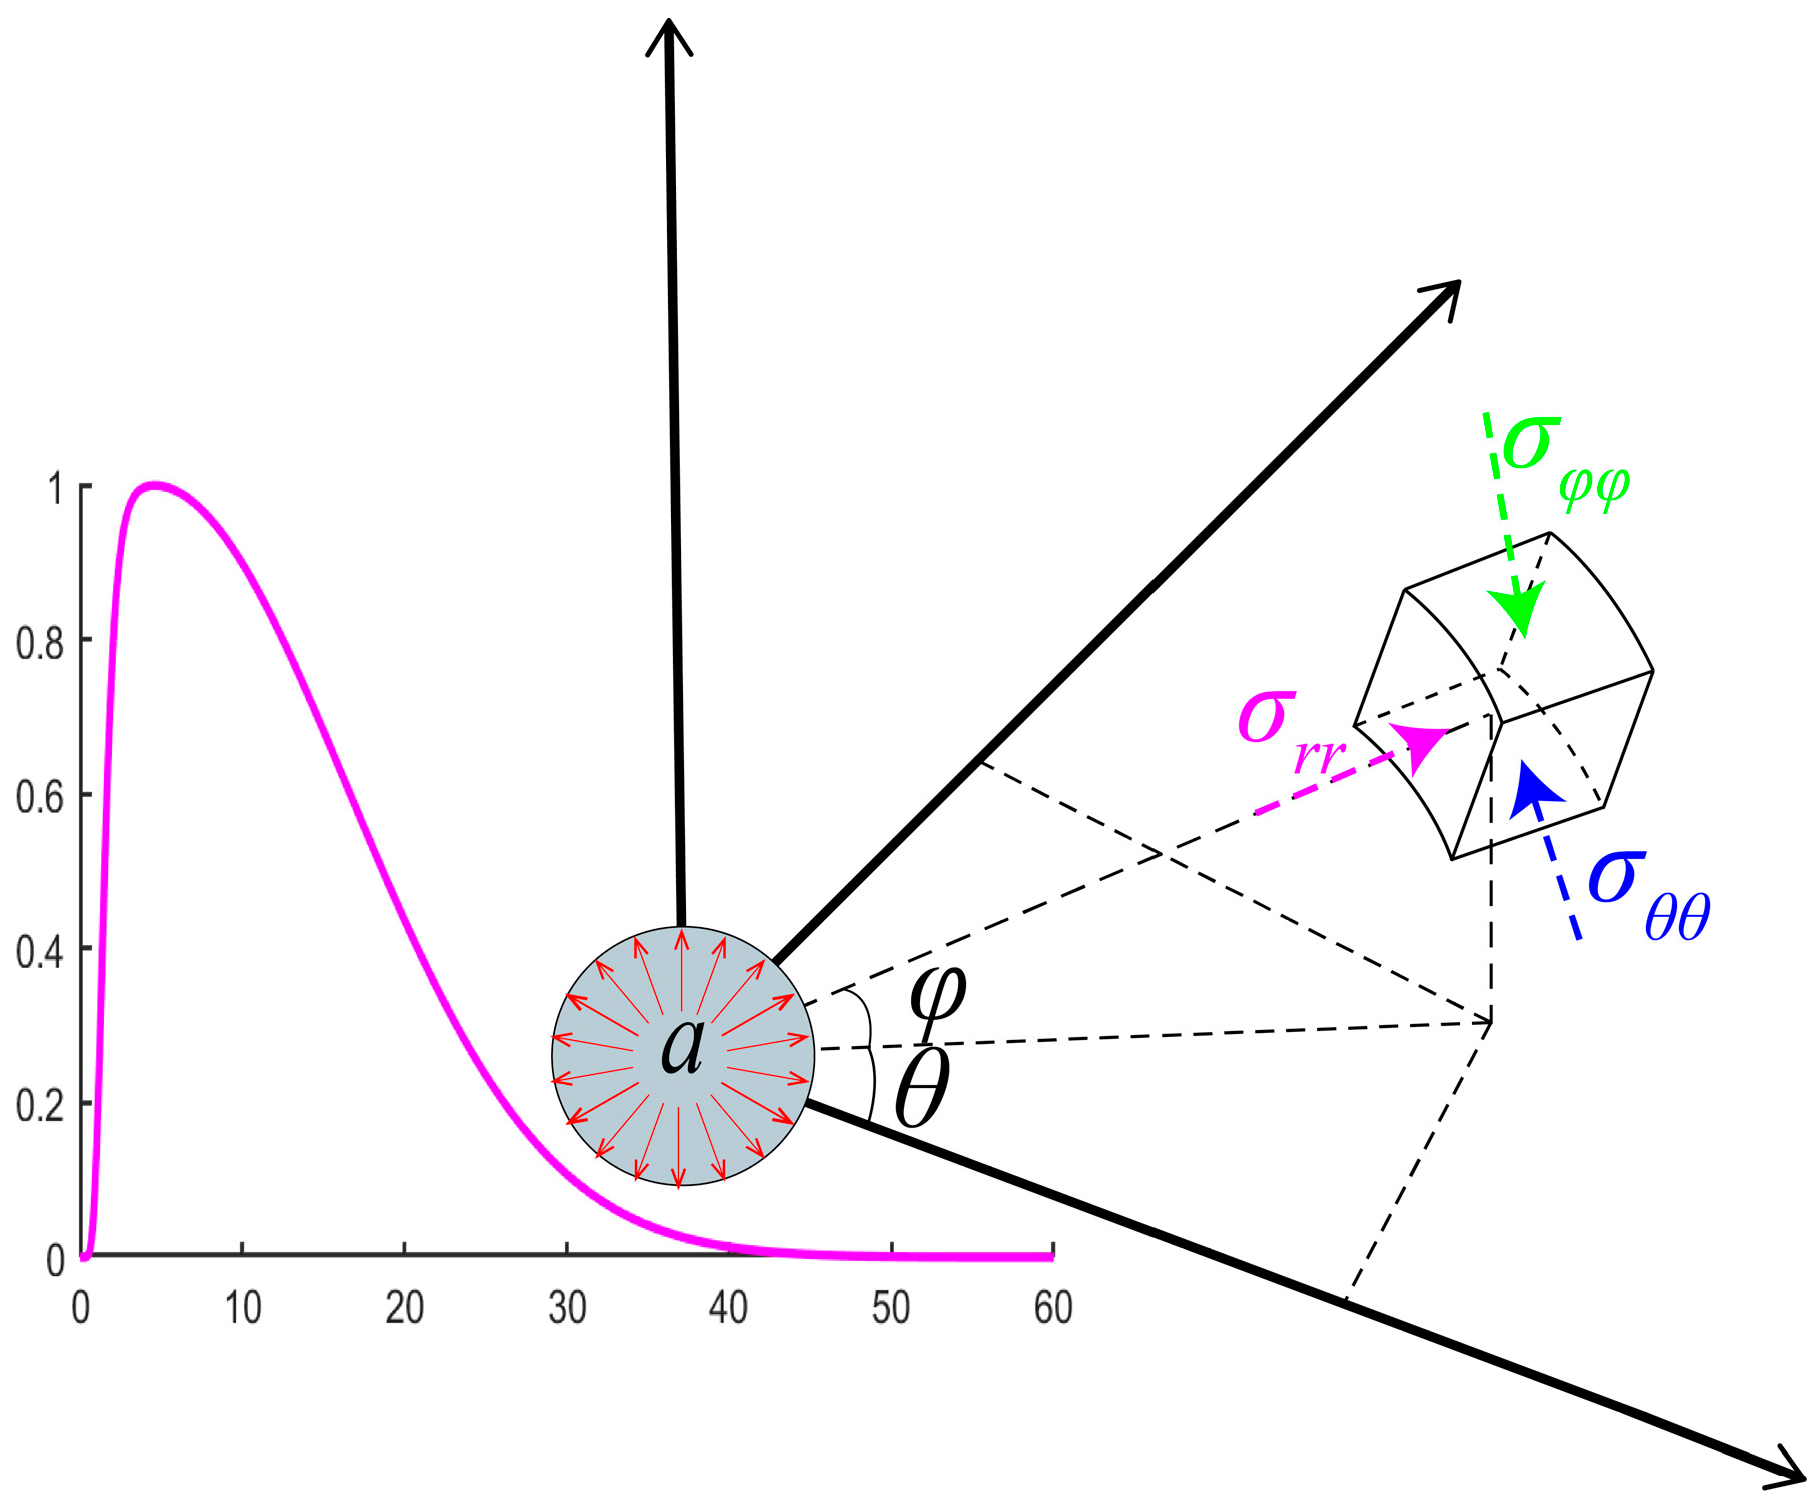
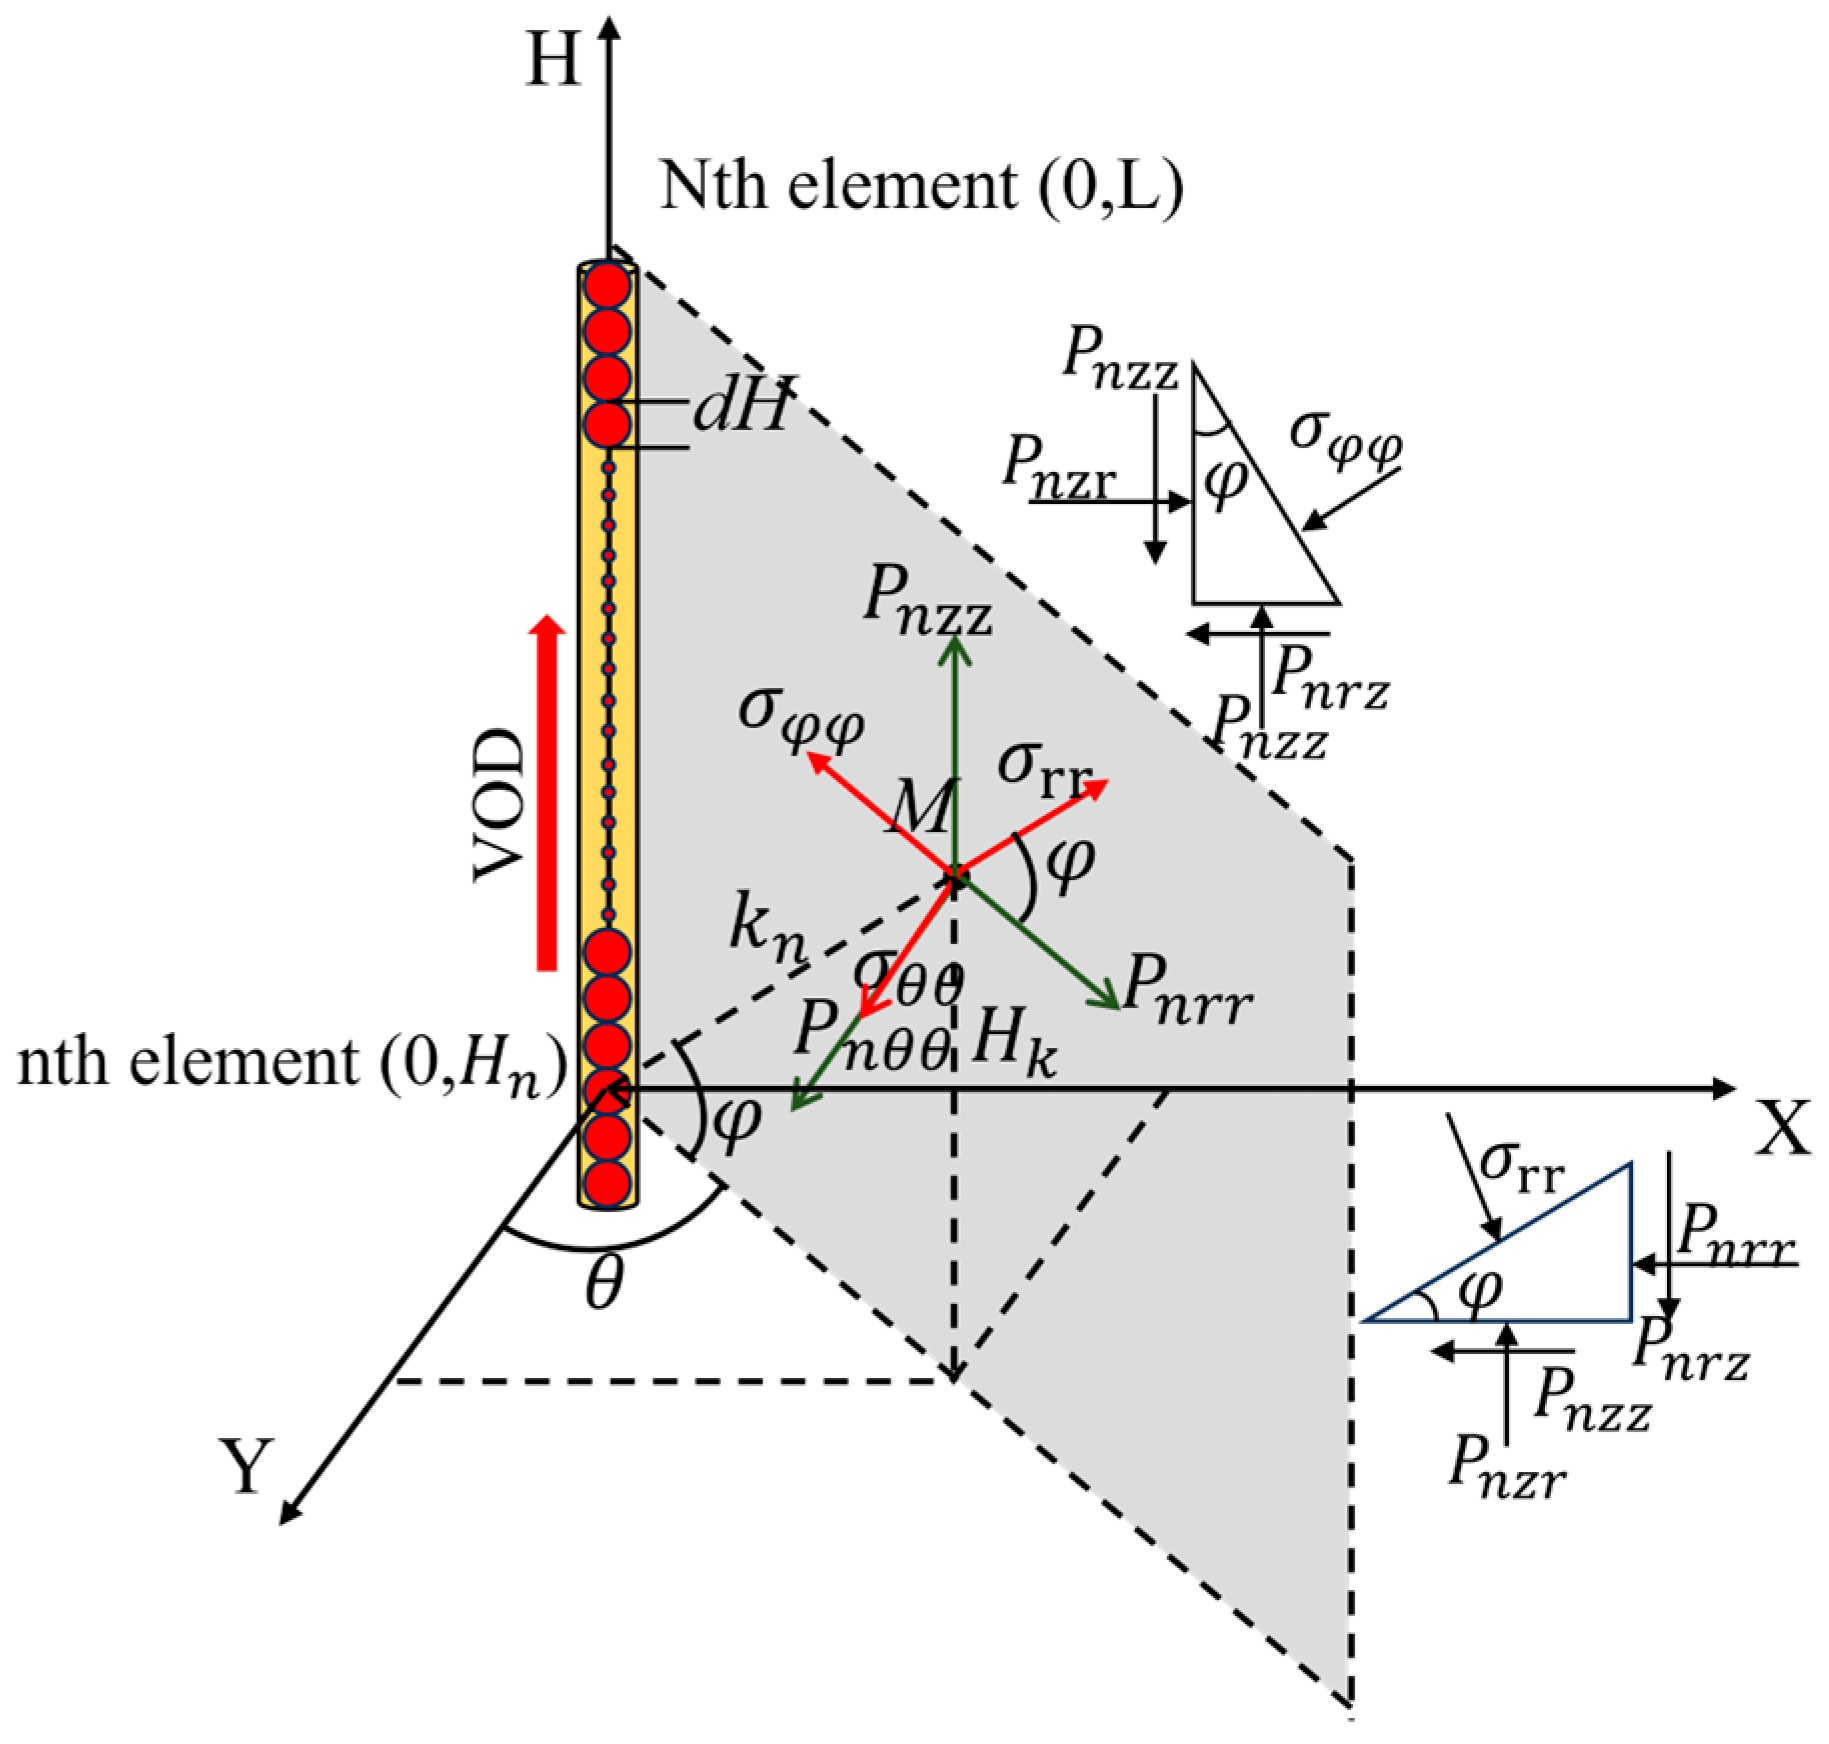
The semi-analytical solution developed in this study is based on the assumptions of linear elastic behavior, an infinite elastic full space, the absence of material damping, and the neglect of the pre-existing in situ stress field. An idealized diagram of the problem is presented in Figure 1. Consider a spherical explosive charge with radius a embedded in an infinite, homogeneous, and isotropic rock mass. A spherical coordinate system ( r , θ , φ ) is established with the center of the spherical charge taken as the origin. Upon detonation, the explosive charge generates a uniform, time-dependent pressure P ( t ) acting on the borehole wall at r   =   a . Due to the spherical symmetry of the wavefront, particle motion is purely radial, and all motion-related quantities are independent of the angular coordinates θ and φ . Under these conditions, only longitudinal (P) waves are generated, while shear wave components are absent. Based on the principles of elastodynamic wave theory, the relationship between radial σ ( r , t ) and radial displacement μ ( r , t ) induced by the spherical source is given as follows:
σ r r = ( λ + 2 μ ) u ( r , t ) r + 2 λ r u ( r , t )
σ θ θ = σ φ φ = λ u ( r , t ) r + 2 ( λ + μ ) r u ( r , t )
where λ and are u the Lamé constants, r denotes the radial distance from the charge center, σ r r is the radial stress, and σ θ θ , σ φ φ are the hoop stresses in the θ and ϕ directions, respectively.
Assuming the rock mass behaves as an ideal elastic medium, the governing equation for stress wave propagation induced by a uniform pressure P ( t ) applied to a spherical cavity can be expressed in spherical coordinates as follows [25]:
2 φ ( r , t ) r 2 + 2 φ ( r , t ) r r = 2 φ ( r , t ) t 2 1 C p 2 ( r > a , t > 0 ) φ ( r , 0 ) = φ ( r , t ) r t = 0 = 0 ( r a ) lim r 0 φ ( r , t ) = 0 ( t > 0 ) σ r r = ( a , t ) = p ( t )
where φ is the displacement potential function, a is the radius of the spherical charge, C p 2 = λ + 2 μ ρ is the longitudinal wave velocity, and ρ is the rock density.
Applying the Laplace transform to the first term in Equation (3) yields
2 φ ¯ ( r , s ) r 2 + 2 φ ¯ ( r , s ) r r = φ ¯ ( r , s ) k d 2
where φ ¯ ( r , s ) denotes the Laplace transform of φ ( r , t ) , s denotes the Laplace transform variable, and k d = s / C p is the Laplace transform parameter.
By applying the initial and boundary conditions to Equation (3), the following expression can be obtained:
φ ¯ ( r , s ) = a p ¯ ( s ) r ρ ( s 2 + b s + c ) e k d ( r a )
where b = 4 C s 2 a C p , c = 4 C s 2 a 2 , C s 2 = μ ρ represents the shear wave velocity, and p ¯ ( s ) is the Laplace transform of the source pressure function.
Applying the Laplace transform to Equation (1), and substituting Equation (5) into the result, yields
σ r r ¯ ( k , s ) = p ¯ ( s ) [ 1 k s 2 + ( 1 k ) 2 b s + ( 1 k ) 3 ] ( s 2 + b s + c ) e k d a ( k 1 )
where k = a / r represents the normalized distance.
In this context, obtaining a closed-form analytical expression for σ r r ( k , t ) is generally challenging. As a result, various numerical Laplace inversion techniques have been employed to compute σ r r ( k , t ) [12,26]. However, these numerical methods often exhibit significant variability in parameter selection, which is typically subjective and lacks standardized guidelines.
According to the convolution theorem of the Laplace transform:
L [ f 1 ( t ) * f 2 ( t ) ] = F 1 ¯ ( s ) · F 2 ¯ ( s )
where * denotes the convolution operator, and f 1 ( t ) , f 2 ( t ) are time-domain functions.
Let F 1 ¯ ( k , s ) = p ( s ) , F 2 ¯ ( k , s ) = 1 k s 2 + ( 1 k ) 2 b s + ( 1 k ) 3 c ( s 2 + b s + c ) then:
σ r r ( k , t ) = f 1 ( k , t ) * f 2 ( k , t ) * e s ( k 1 ) a C p
Taking the inverse Laplace transform of F 1 ¯ ( k , s ) and F 2 ¯ ( k , s ) gives:
f 1 ( t ) = p ( t )
f 2 ( k , t ) = δ t k + e b t 2 b b k cos t g sin t g b 2 c ( 1 + k ) b k g k 2
where t 0 = ( k 1 ) a C p , g = b 2 4 c , δ t denotes the Dirac delta function. Applying the time-shifting property of the Laplace transform and combining Equations (8)–(10), we obtain
σ r r ( k , t ) = p ( t t 0 ) k + [ p ( t t 0 ) ] * e b ( t t 0 ) 2 b b k cos ( t t 0 ) g sin ( t t 0 ) g b 2 c ( 1 + k ) b k g k 2
σ θ θ ( k , t ) = σ φ φ ( k , t ) = p ( t t 0 ) v k ( v 1 ) [ p ( t t 0 ) ] * e b ( t t 0 ) 2 b b k cos ( t t 0 ) g sin ( t t 0 ) g b 2 2 c v k 2 + c c v b k + 2 b k 2 v b k v g ( b + 2 b k v b v ) 2 k 2 ( v 1 )
t 0 = ( k 1 ) a / c p , where t 0 represents the travel time of the stress wave to the position k a .
When the form of the source function P ( t ) is simple, the inverse Laplace solutions in Equations (9) and (10) can be obtained analytically. For more complex source functions, the convolution integral can be computed numerically using MATLAB R2020b, thereby circumventing the difficulties associated with parameter selection in numerical Laplace inversion methods [27,28,29]. The semi-analytical solution consists of two principal terms: the first term is proportional to k 1 ( k = r / a ) , and the second to k 2 , which is consistent with theoretical models proposed by Sharp [30] and Jiang [9]. The first term represents the attenuation pattern of the stress wave amplitude in the far field ( r a ), where the 1 / r dependence dominates the amplitude decay. The second term reflects the amplitude attenuation in the near field, which is closely related to the temporal characteristics of the source function. When k   =   1 the solution exactly satisfies the radial stress boundary condition at the cavity wall, σ r r ( 1 , t ) = P ( t ) .

2.2. Validation of the Semi-Analytical Solution

As summarized in Table 1, various source functions have been proposed to more accurately reflect the pressure loading on the borehole wall. In practical blasting, the pressure–time history acting on the borehole wall is generally characterized by an extremely short rising phase associated with detonation and a relatively longer decaying phase governed by gas expansion and unloading. Sharpe [30] modeled the pressure history using an exponentially decaying function, in which the pressure reaches its peak instantaneously at the onset of detonation. While this form simplifies the representation of the explosive loading, it fails to define a distinct rise time. Duvall [8] simulated the borehole wall pressure by linearly superimposing two exponential functions. Jiang [9] and Blair [31] introduced higher-order decay curves to better capture the pressure-time profile of the borehole wall; however, these functions cannot independently define both the loading rate and decay rate. Trivion [32] attempted to address this limitation by using separate functions for the rising and decaying phases to control the loading and decay rates, respectively, but the Laplace inverse transformation involved is highly complex.
Aldridge [35] derived an analytical solution for the dynamic radial displacement response of a spherical cavity subjected to a pressure loading of the form P ( t ) = P 0 e β t :
u ( r , t ) = 1 ρ α 1 ( C S C P ) 2 p 0 α d β 2 + ω d 2 a r × e α d [ t t 0 ] sin ω d [ t t 0 ] + ϕ θ a 2 γ r cos ω d [ t t 0 ] θ e κ [ t t 0 ] sin ( ϕ θ ) a 2 γ r cos ( θ )
where C P C S = 2 ( 1 υ ) 1 2 υ , α d = C p ( 1 2 υ ) a ( 1 υ ) , ω d = C p a 1 2 υ 1 υ , θ = arctan ( α d β ω d ) , ϕ = arctan ( α d ω d ) . By substituting Equation (13) into Equation (1), the analytical solution for σ r r ( k , t ) under this form of pressure loading can be obtained.
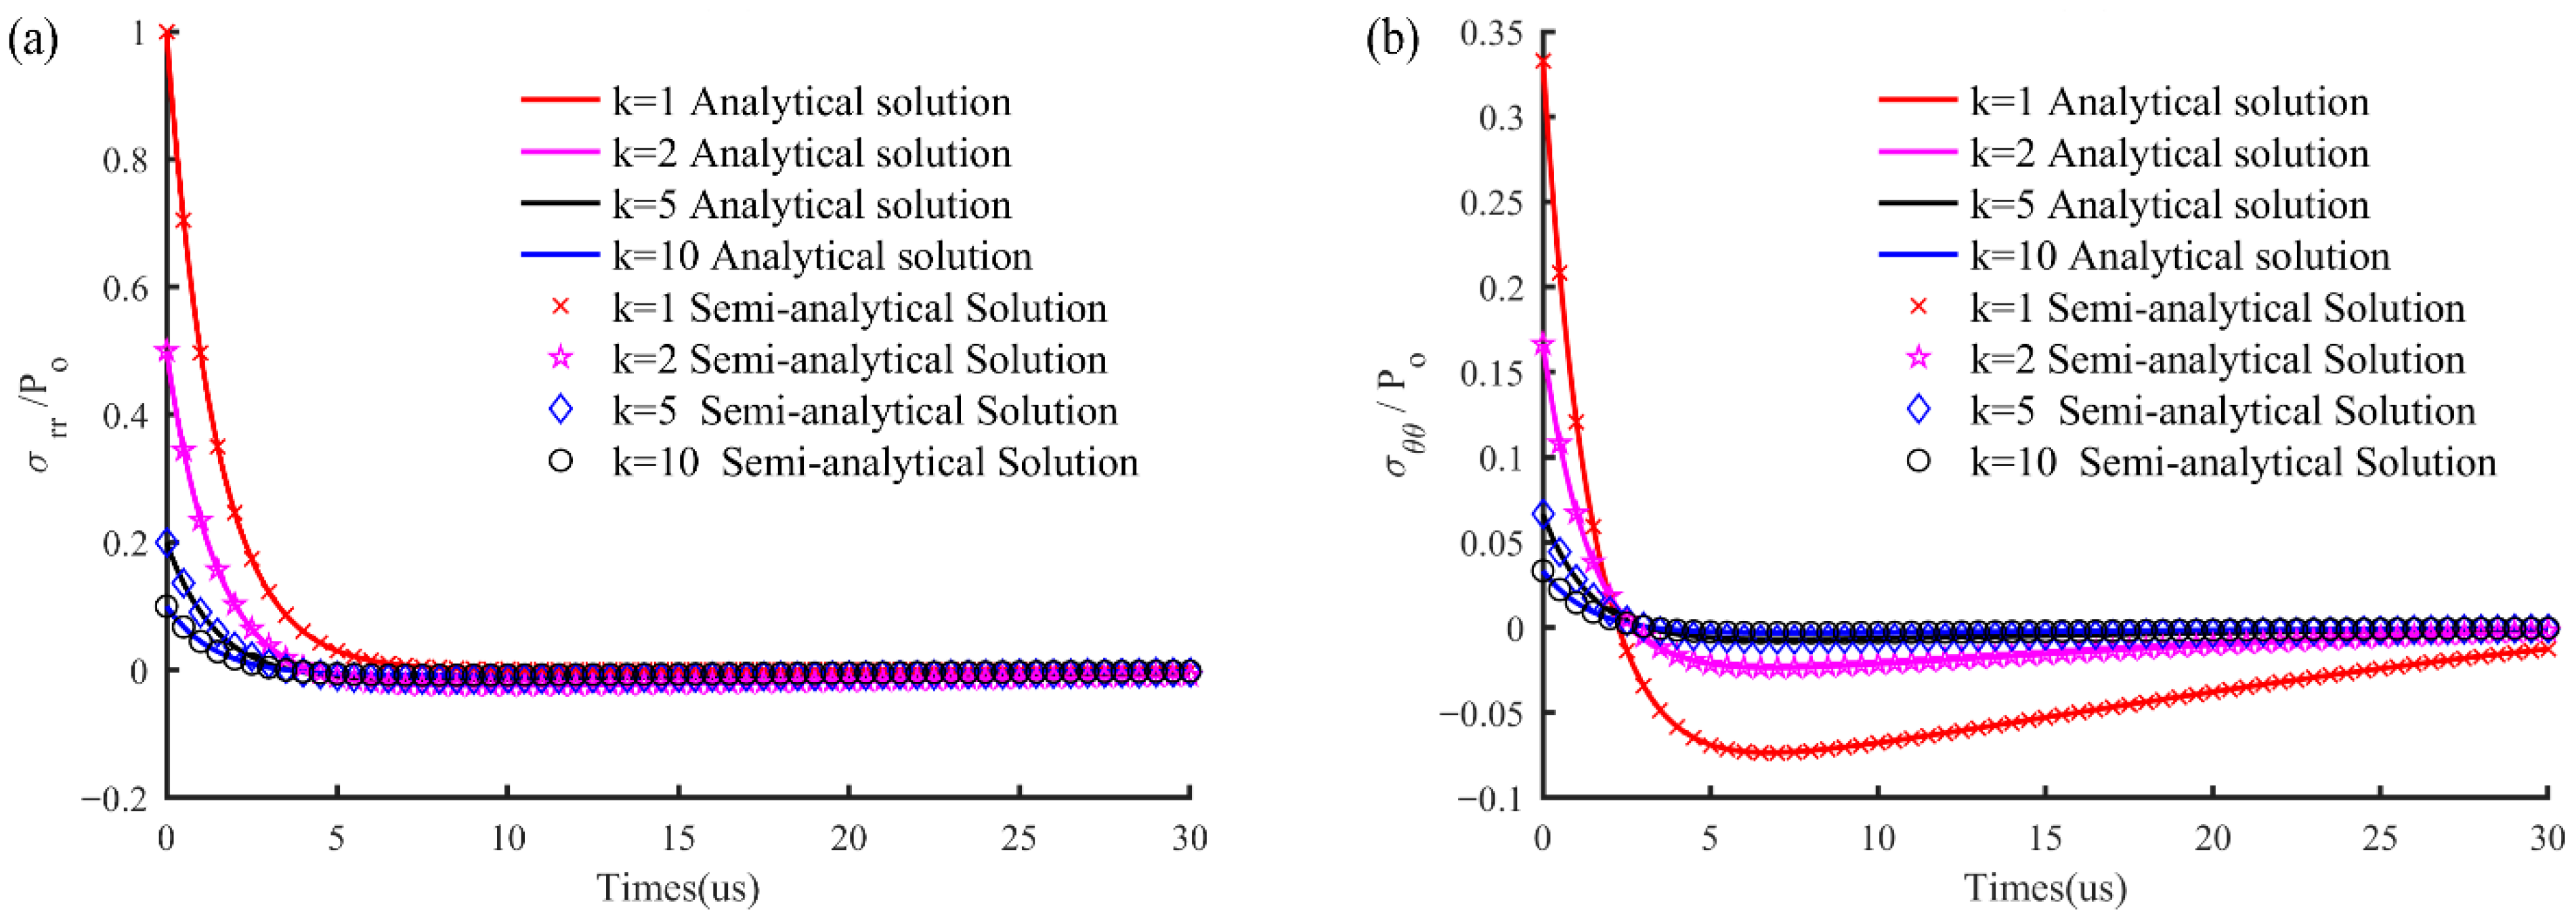
Figure 2 shows the radial and hoop stresses at various positions resulting from the specified source function, comparing the analytical and semi-analytical solutions. The two solutions exhibit excellent agreement, demonstrating the validity of the semi-analytical approach. In this case, ρ = 2.7   kg / m 3 , C p = 5000   m / s , C s = 2887   m / s , β = 0.7 . The stress values have been normalized for comparison purposes.
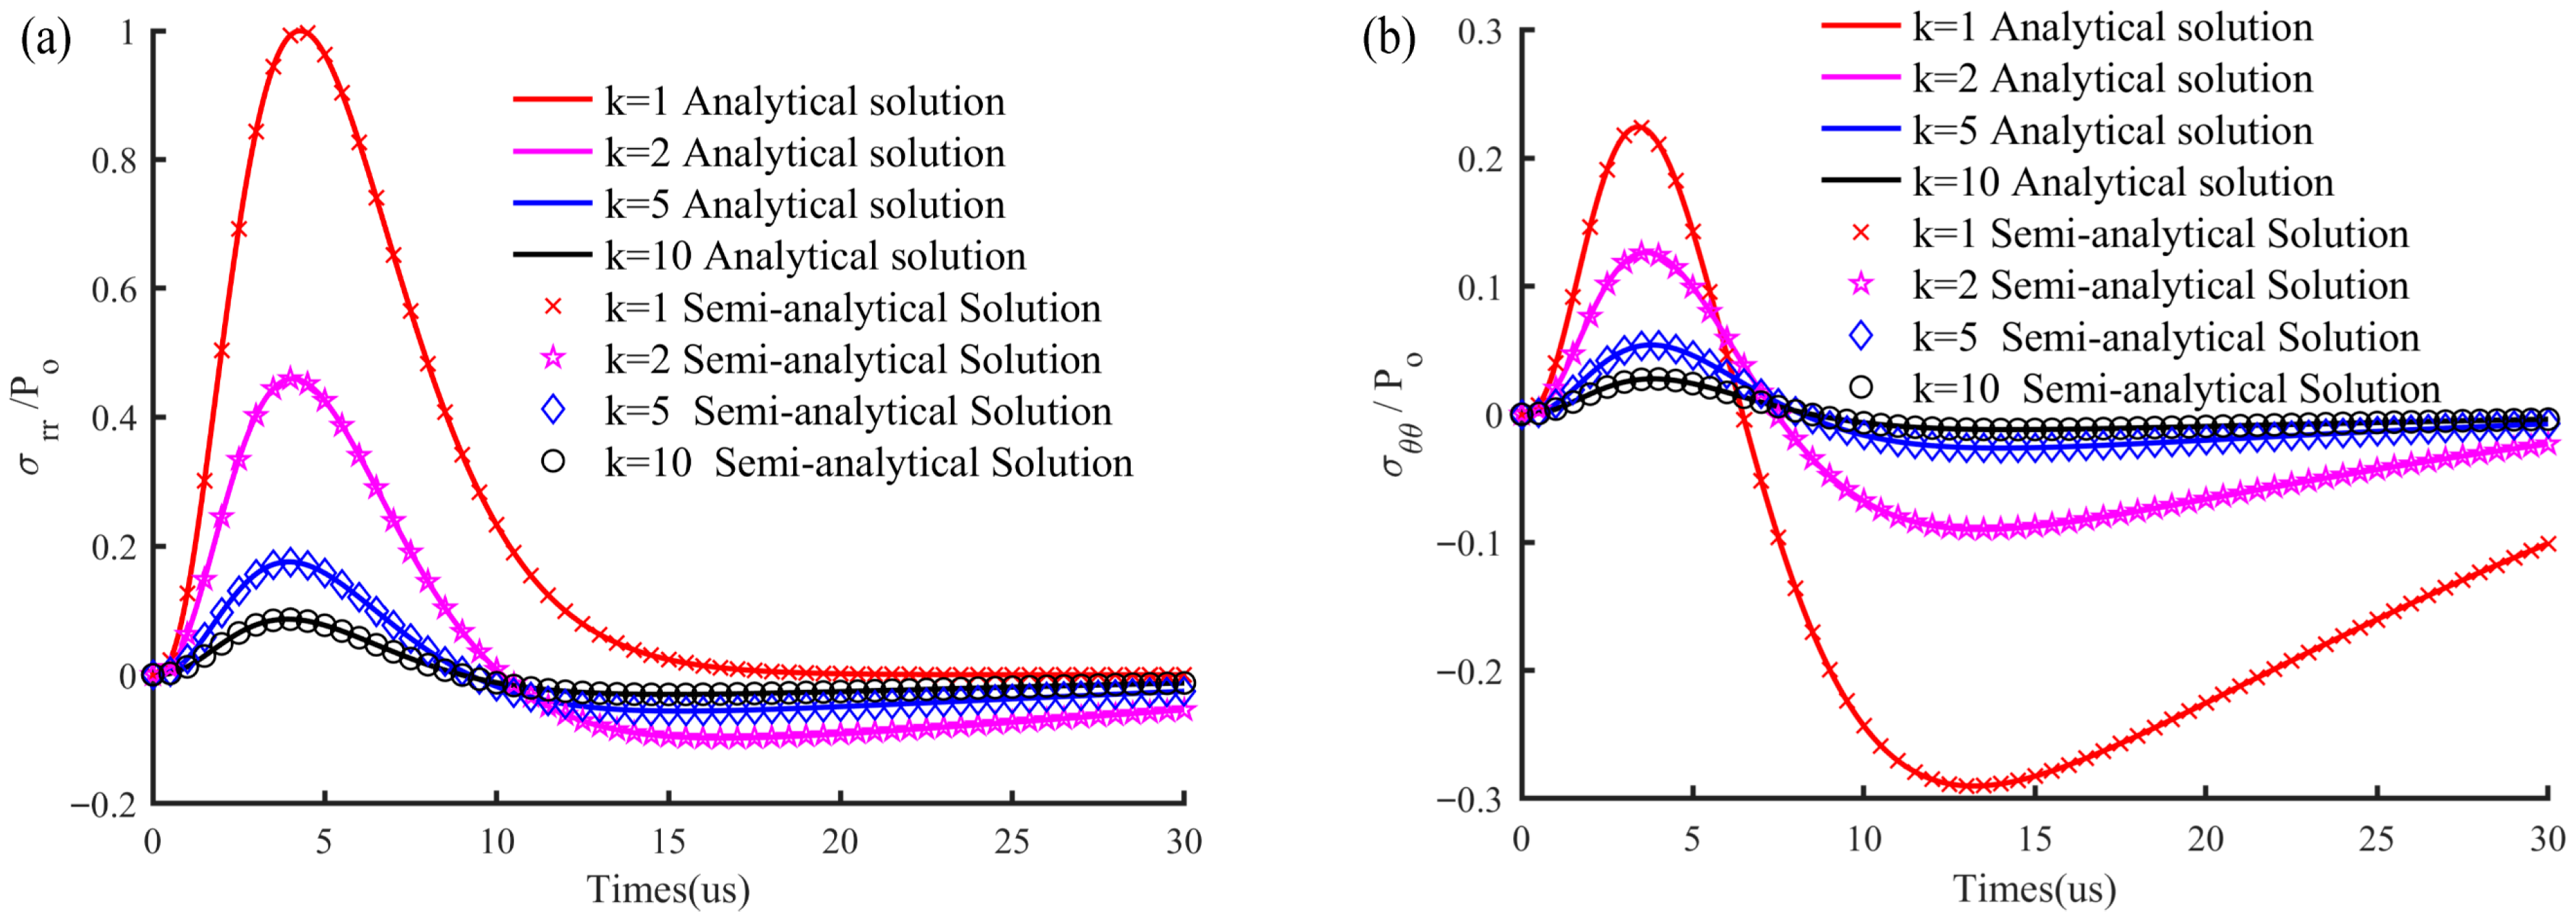
For the more complex source function proposed by Blair [31], Figure 3 demonstrate excellent agreement between the analytical and semi-analytical solutions. Trivion [32] pointed out that Blair’s pressure-time function has certain limitations in controlling the loading and decay rates independently. For example, when n = 6 the loading and attenuation phases of the source function become nearly identical—an unrealistic representation of actual blasting conditions. To address this, Trivino proposed an alternative source function that allows independent definition of the loading and decay rates:
P ( t ) = P V N P u ( t ) P d ( t )
P u ( t ) = e b u ( t t u ) 2 n
P d ( t ) = e b d ( t t d ) 2
b d = 2 / 2 e 1 / 2 m d
b u e / 2 n m u
n = r o u n d ( 2 / 2 e 1 / 2 b r a t i o m u / m d )
t u = I n ( α 1 ) 1 / 2 n / b u
t d = I n ( α 1 ) 1 / 2 n I n ( 1 α 2 ) 1 / 2 n / b u
where P V N is the von Neumann borehole pressure at the detonation front produced by the explosive, P u ( t ) and P d ( t ) are the functions controlling the loading and decay phases, respectively. The parameters b u , b d , b r a t i o , n define the shape of the pressure-time curve. m u and m d represent the maximum slope of the loading and decay stages, respectively. t u is the duration of the loading phase, and t d is the duration of the decay phase.
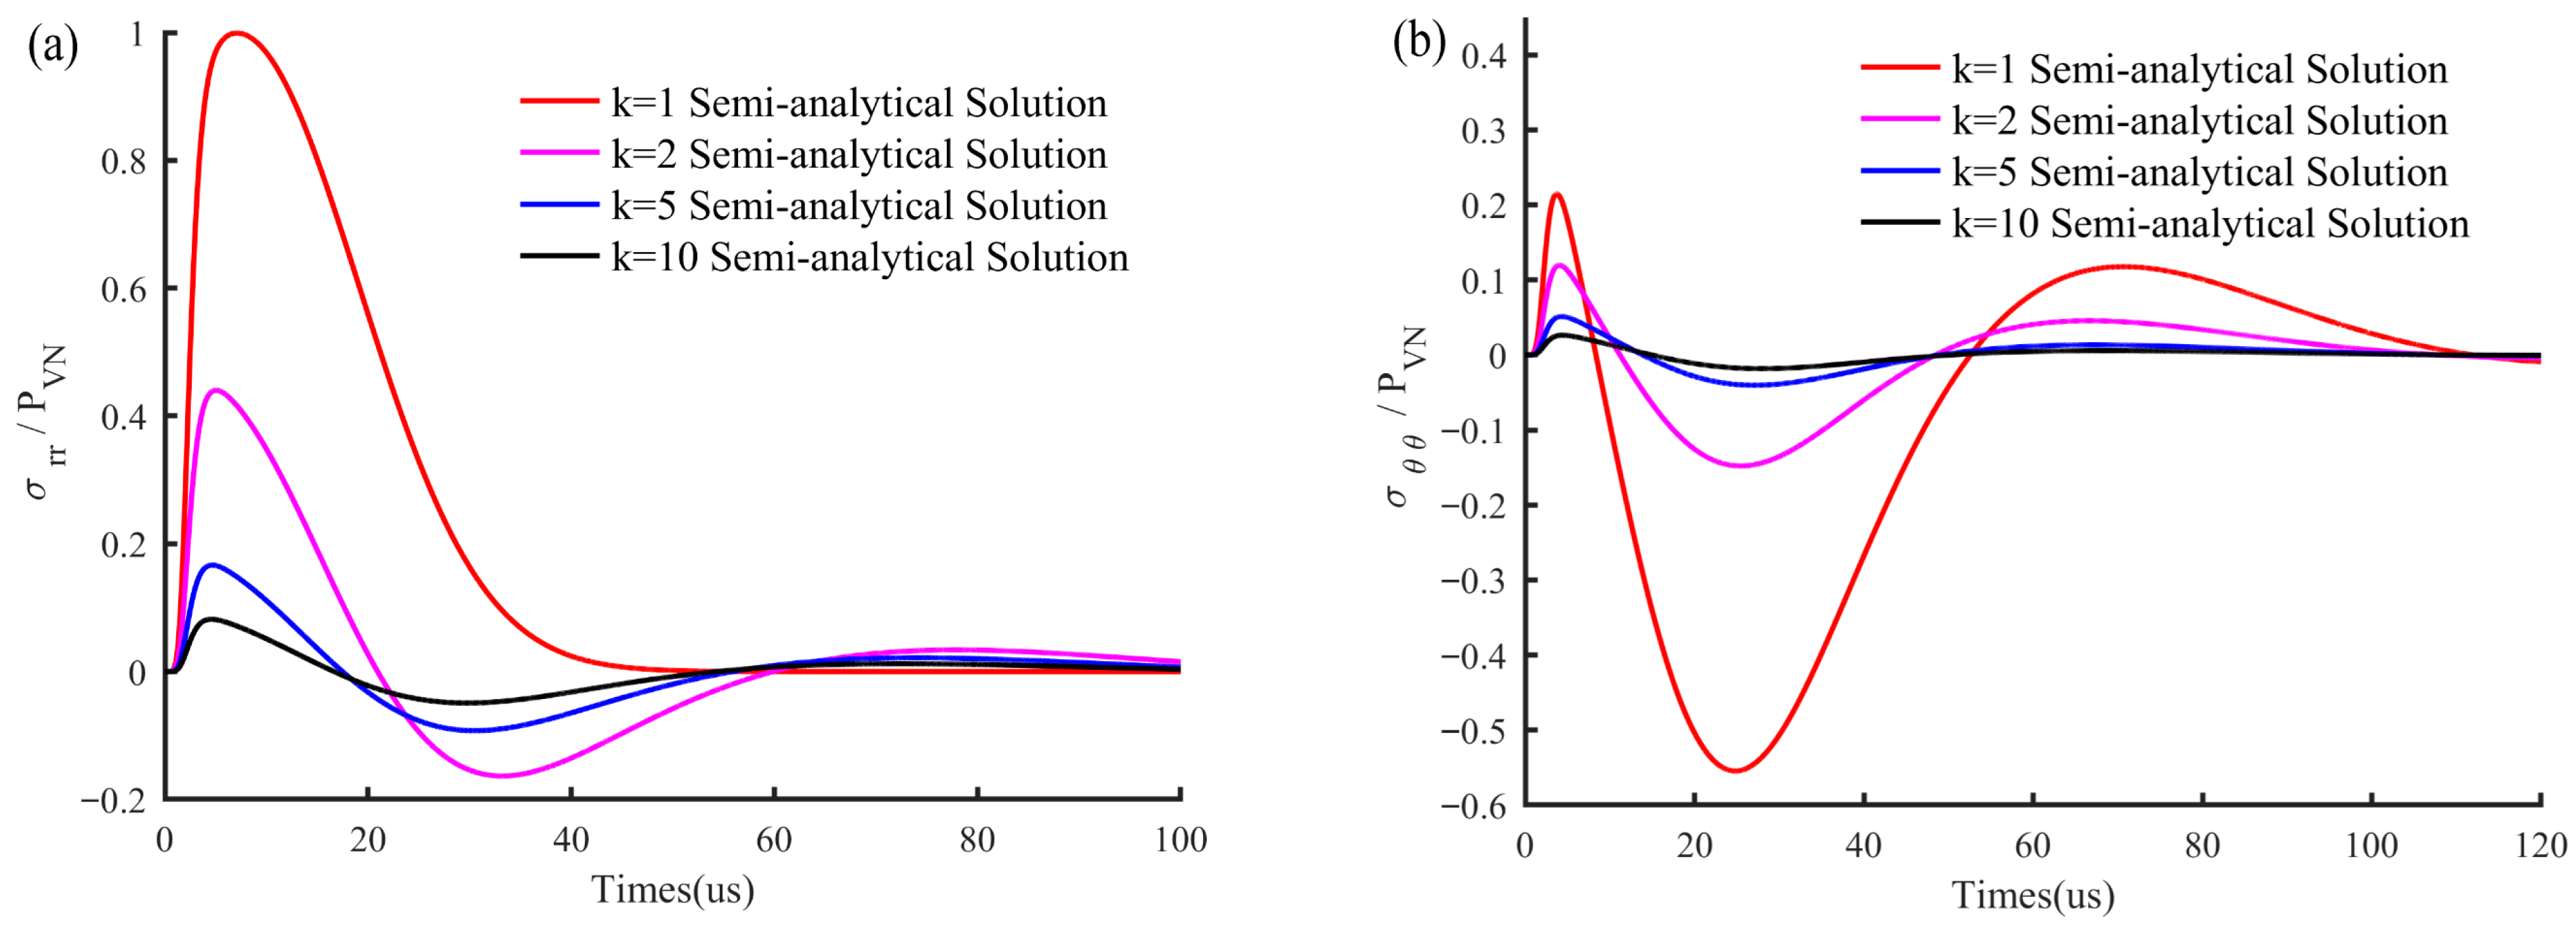
Figure 4 illustrates the time-history curves of stress waves at various locations induced by the Trivino’s pressure function acting on a spherical cavity. As the propagation distance increases, the amplitude of the stress waves decays rapidly. The radial stress exhibits a tensile tail following its compressive decay. The hoop stress first reaches its peak compressive value, followed by a tensile peak that is significantly greater than the tensile tail of the radial stress at the same location. For rocks that are prone to tensile failure, this elevated hoop tensile stress is a key factor contributing to the initiation of radial cracking. These observations are consistent with the theoretical analyses reported by Rossmanith [36], Xu [11], and Yi [26].

2.3. Theoretical Model for Cylindrical Charge

A cylindrical charge can be modeled as a superposition of multiple equivalent spherical charges. As illustrated in Figure 5, a cylindrical explosive with length L and radius a can be considered as composed of N equivalent spherical charges, each with a length of d H . When the cylindrical charge is initiated from the bottom, the detonation front propagates upward at a velocity of VOD. As a result, the stress waves emitted from different sub-charges do not arrive simultaneously, causing a staggered superposition pattern in space. Since the stress field generated by an equivalent spherical charge at point M is expressed in spherical coordinates, a coordinate transformation is performed to convert it into a unified cylindrical coordinate system for consistent superposition. Based on the previously derived semi-analytical solution for stress wave radiation from a single spherical charge, the stress at point M induced by the cylindrical charge can be expressed as follows:
[ σ ( k n , t n ) ] = σ r r ( k n , t n ) 0 0 0 σ θ θ ( k n , t n ) 0 0 0 σ φ φ ( k n , t n )
[ T ] = cos φ 0 sin φ 0 1 0 sin φ 0 cos φ
P n = P 0 d H [ β ] [ σ ( k n , t n ) ] [ β ] T
P 0 = P 0 / d H
H n = ( n 1 / 2 ) d H
k n = ( H k H n ) 2 + ( k a ) 2 / ( a )
t n = t 1 n + t 2 n = H n / v d + k n / c p
[ P N ] = n = 1 N P n
In the above equation, [ σ ( k n , t n ) ] denotes the stress tensor generated by the nth equivalent spherical charge, [ T ] is the transformation matrix used to convert the stress tensor from the spherical coordinate system to the cylindrical coordinate system, P n denotes its expression in cylindrical coordinates, while P 0 represents the peak pressure per unit length d H , which can be treated as a constant when d H is sufficiently small. P 0 is the peak borehole pressure of the equivalent spherical charge. The parameter H n denotes the distance from the center of the nth spherical charge to the bottom of the cylindrical charge, and k n is the normalized distance from the monitoring point to the center of the nth charge. t n is the time required for the stress wave generated by the nth spherical charge to reach the monitoring point M . H k indicates the vertical distance from point M to the bottom of the cylindrical charge. P N is the total stress tensor at point M resulting from the superposition of all equivalent spherical charge contributions.
Starfield [13] employed empirical formulations to characterize stress wave attenuation from equivalent spherical charges. Liu [22] and Huo [23] simplified the wave amplitude attenuation index to 1. In contrast, this study calculates the attenuation index of stress waves from equivalent spherical charges using the proposed semi-analytical solution, rather than assuming a fixed value, which explains why the theoretical attenuation differs from empirical Starfield models. For the stress at a specific point M , the effect of the detonation velocity (VOD) is considered, as the stress waves from different equivalent spherical charges arrive at M at different times. Therefore, the superposition of stress waves from a cylindrical charge is influenced both by the spatial attenuation of individual spherical charge stress waves and by the differences in their arrival times due to the propagation delay of each spherical source. For the semi-analytical solution, stress curves along the wall of the cylindrical charge hole were evaluated using different values of dH. It was observed that at dH = 1 mm, the stress curves are already well converged for the purpose of the present analysis, while smaller values of dH do not produce noticeable differences. Accordingly, dH = 1 mm was selected.

3. Effects of Source Parameters on Stress Wave Propagation

3.1. Effect of Loading Rate on Stress Wave Propagation

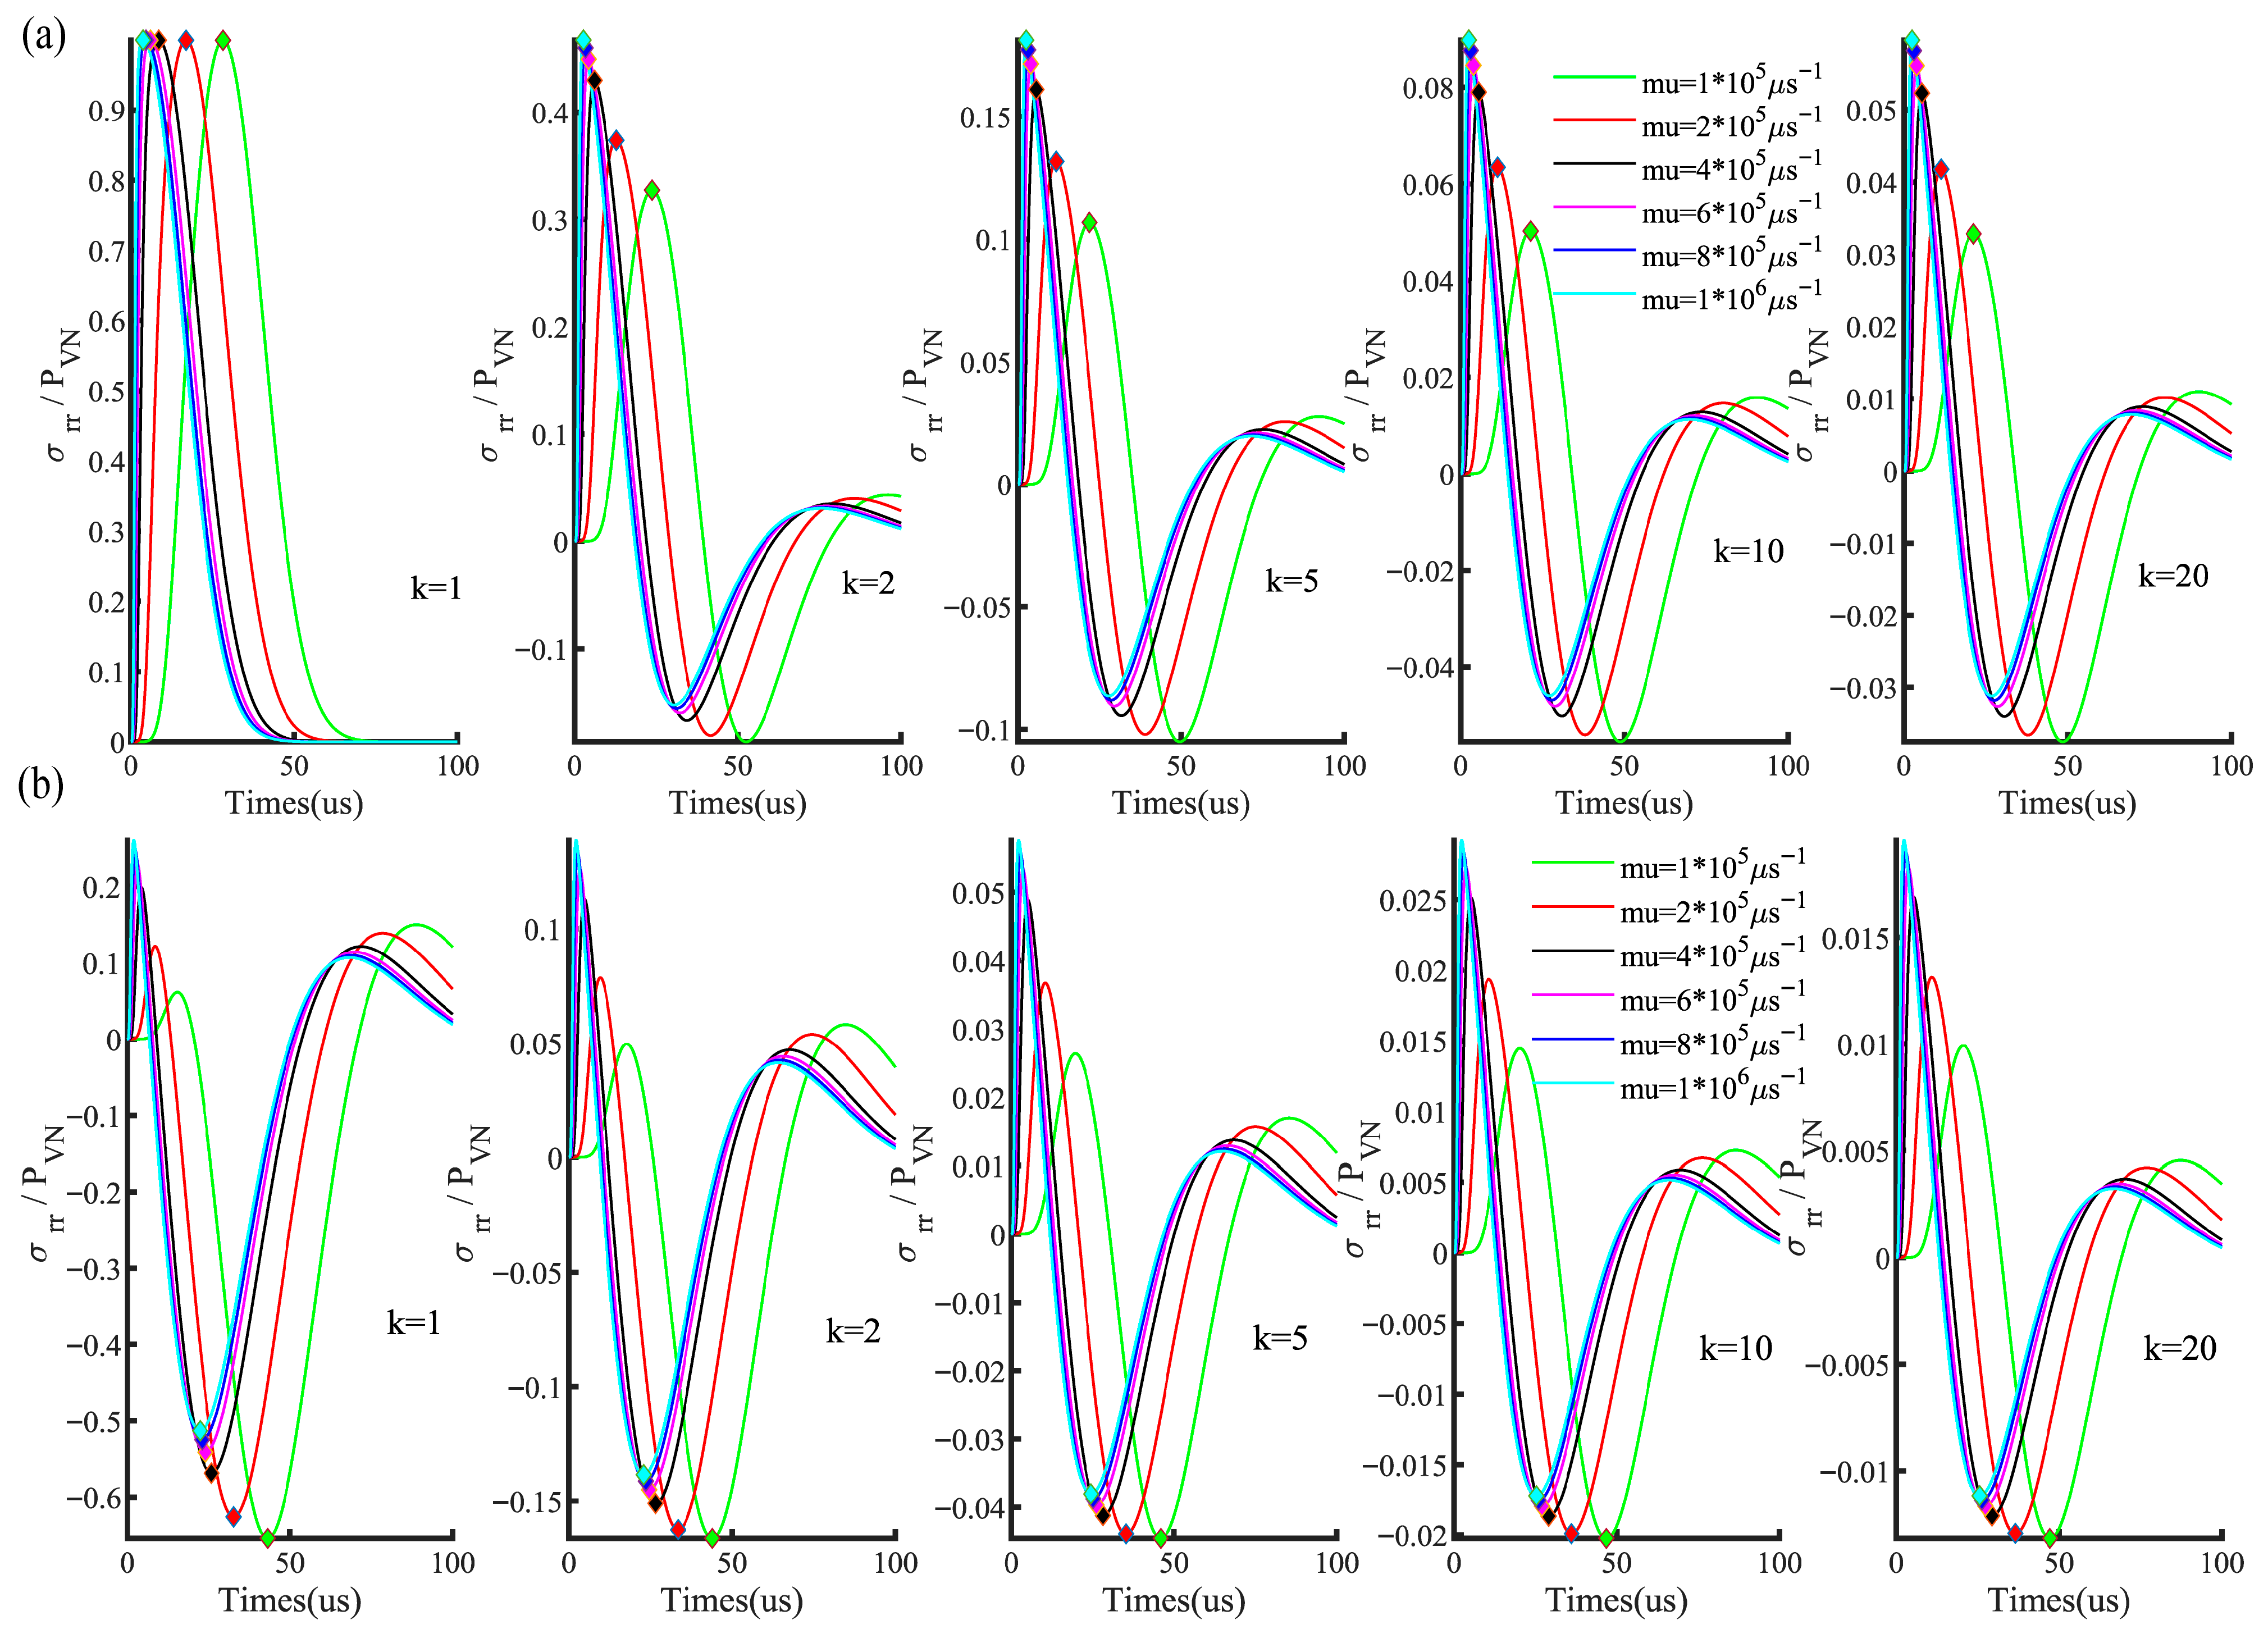
Huo [24] demonstrated that variations in the uncoupling coefficient and the borehole filling medium (air versus water) lead to differences in the peak and rise time of the borehole wall pressure history, which in turn affect the attenuation of the resulting stress waves. In the wave source pressure load function proposed by Trivino, the parameter m u governs the maximum slope of the rising phase, allowing for modification of the loading time (rise time) while keeping the decay phase of the function unchanged. To investigate the effect of the source function loading rate on blast stress wave propagation, theoretical solutions for stress waves from a spherical charge were utilized. Holding the decay rate of the source function m d = 5 × 10 4   μ s 1 constant, calculations were performed for m u values of 1 × 10 5   μ s 1 , 2 × 10 5   μ s 1 , 4 × 10 5   μ s 1 , 6 × 10 5   μ s 1 , 8 × 10 5   μ s 1 , and 1 × 10 6   μ s 1 . The radial and hoop stress were computed at scaled distances (k) of 1, 2, 5, 10, and 20 from the charge center. All other calculation parameters were consistent with those defined earlier.
Figure 6 depicts the pressure-time histories on the borehole wall for different loading rates. Notably, the peak pressure of the source function is identical across all m u values. The peak values of compressive radial stress and tensile hoop stress, which are the primary focus of this analysis, are explicitly marked in the figure. Figure 6 clearly shows the rapid attenuation of stress wave peaks with increasing propagation distance. By a scaled distance of k = 5, the radial stress peak attenuates to approximately 10% of its value at the borehole wall. A key finding is the distinct influence of the loading rate on stress peaks at a given location. The peak compressive radial stress increases with higher loading rates. In contrast, the hoop stress exhibits a brief compressive phase followed by a tensile phase. Importantly, the peak tensile hoop stress decreases as the loading rate increases.
Rock damage under blasting is typically categorized into three zones: the crushing zone, the fracture zone, and the elastic vibration zone [37,38]. Within the crushing zone near the borehole, the compressive stress peak substantially exceeds the tensile stress peak, leading to compressive-shear failure. As the stress wave propagates outward and the compressive stress attenuates rapidly, tensile failure becomes dominant in the fracture zone. Consequently, a higher loading rate produces a greater compressive stress peak in the near-field, promoting more intense crushing. Conversely, a lower loading rate generates a higher tensile stress peak in the far-field, facilitating longer crack propagation. Therefore, the loading rate fundamentally governs the resultant damage distribution pattern in rock blasting.
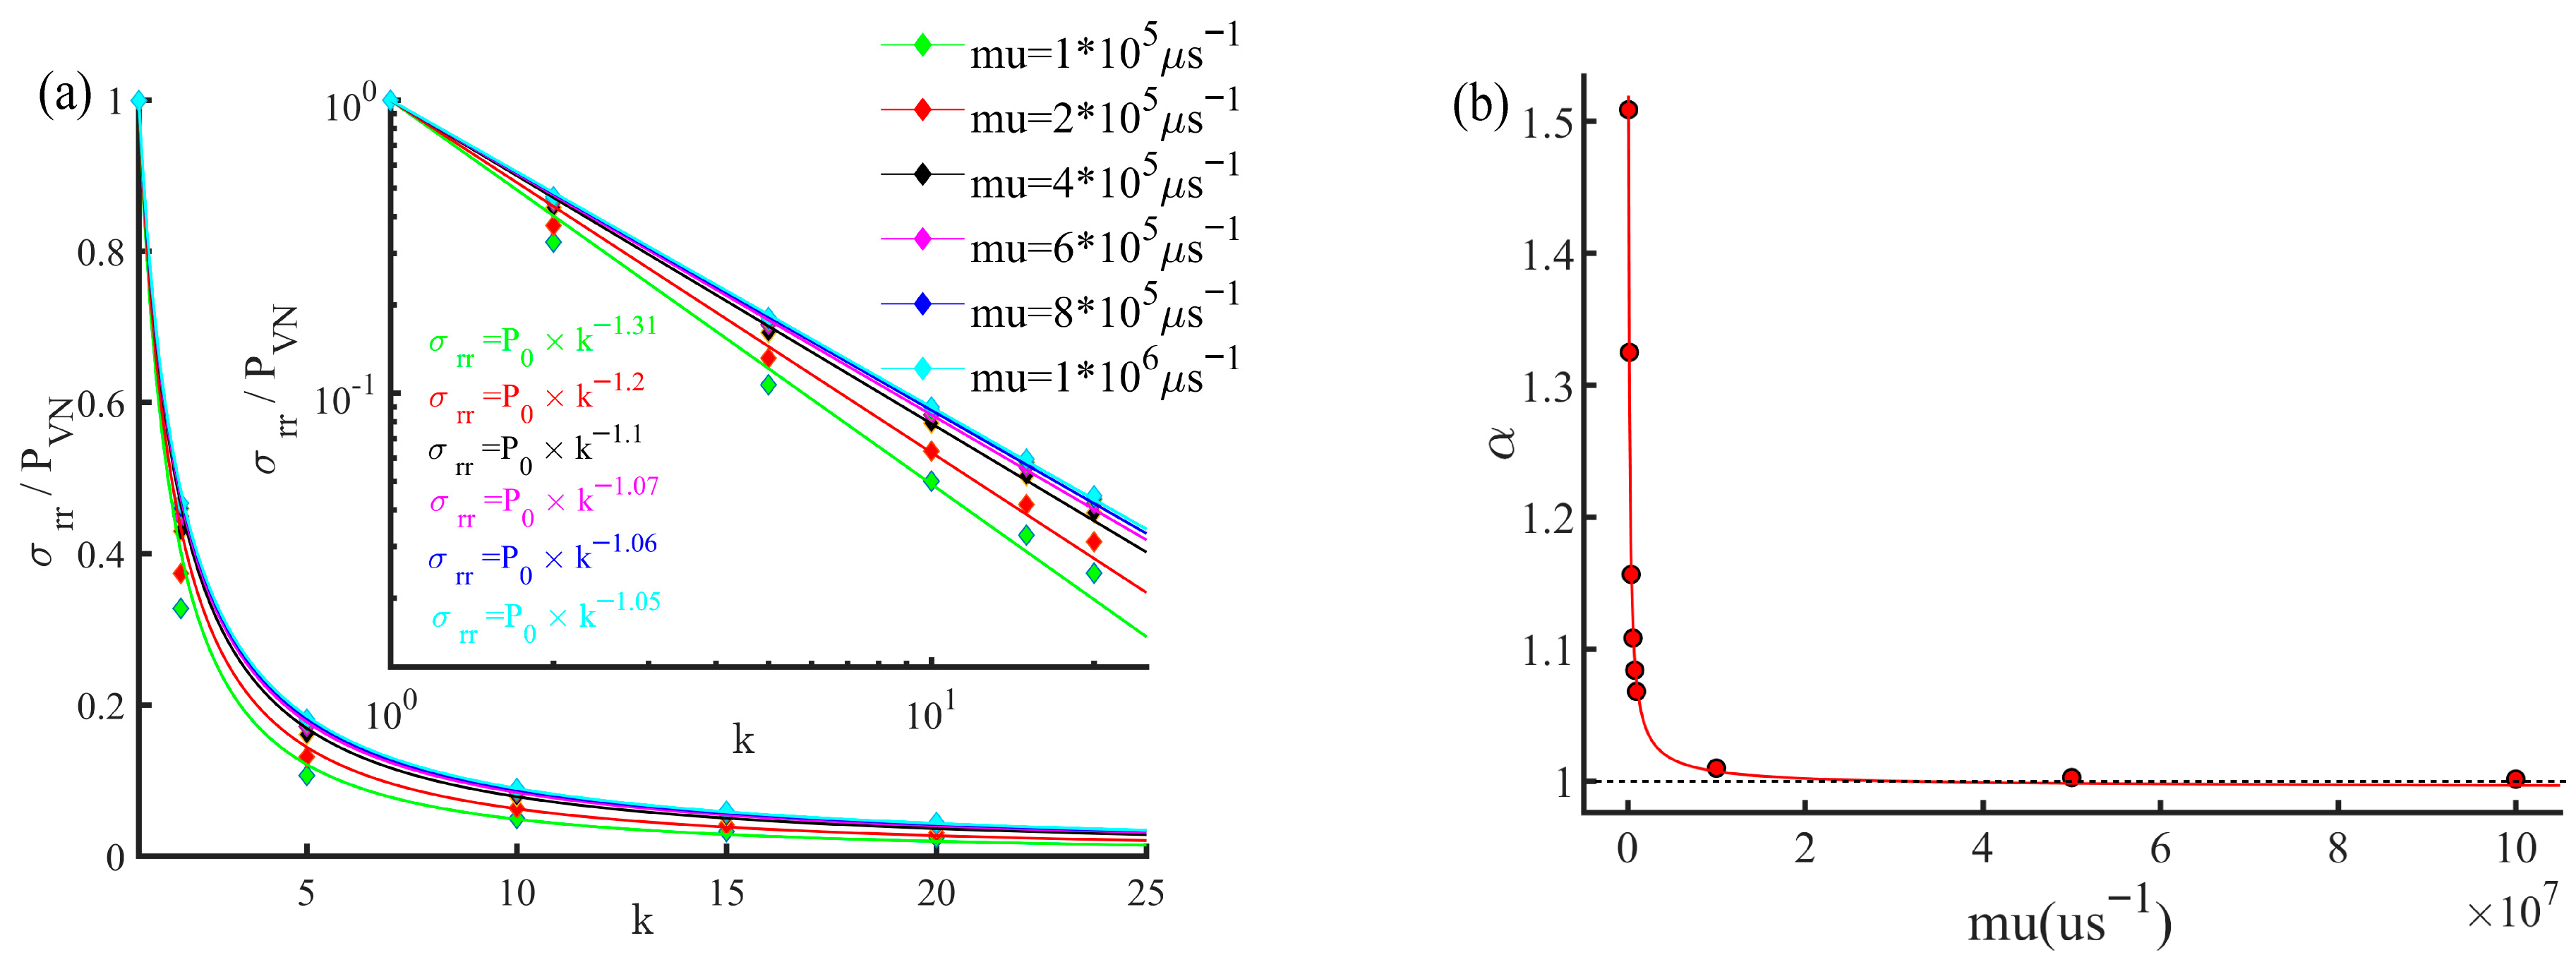
To facilitate comparison, the empirical formula σ r r = P 0 k α is commonly used to fit the attenuation of radial stress peaks under different loading rates. Here, P 0 denotes the radial stress peak at the borehole wall, k = r / a is the normalized distance, where a is the radius of the explosive, and α represents the attenuation index. In Figure 7a, the attenuation of radial stress peaks at different locations was fitted using a logarithmic transformation of the coordinate axes. The results indicate that the attenuation exponent α decreases with increasing loading rate. This suggests that the stress wave generated by a source pressure function with a higher loading rate attenuates more slowly within the rock medium. When the loading rate is sufficiently high such that the rise time of the source function becomes negligible, the attenuation exponent α approaches 1. This limit corresponds to the theoretical solution for stress wave propagation under a source function in the form of P ( t ) = P 0 e β t , where the radial stress decays proportionally to 1 / r . Therefore, when substituting a cylindrical charge with an equivalent spherical charge for analytical purposes, the intrinsic characteristics of the pressure-time function must be considered. Simply assuming an attenuation index of α = 1 may lead to inaccuracies, particularly when the loading rate deviates from the instantaneous-rise assumption.

3.2. Effect of VOD on Stress Field Evolution and Attenuation Behavior

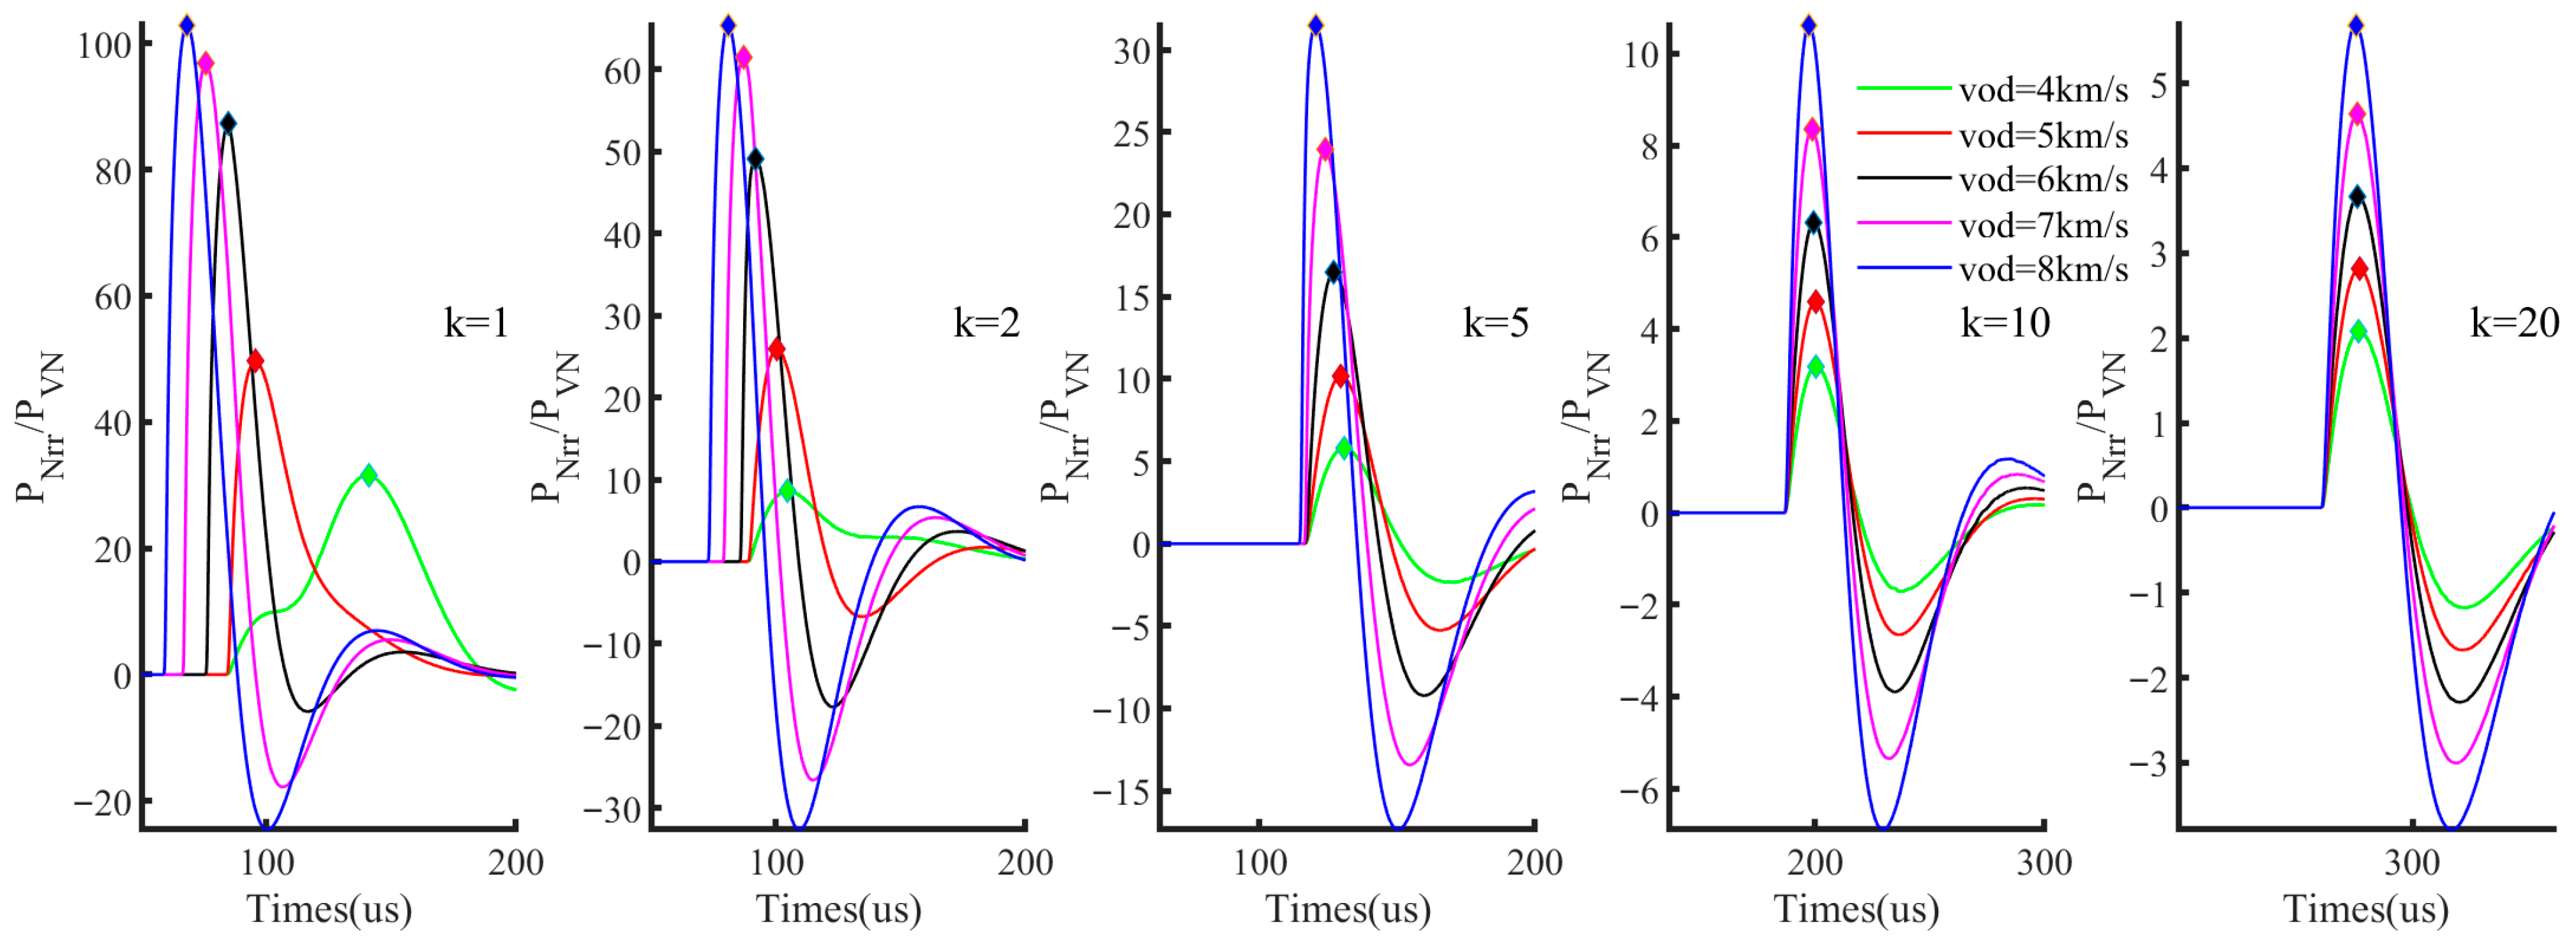
To investigate the influence of VOD on the stress wave attenuation of cylindrical charges, five representatives VOD values were selected: 4000 m/s, 5000 m/s, 6000 m/s, 7000 m/s, and 8000 km/s. As shown in Figure 8, the time histories of radial stress P N r r at selected monitoring points are presented. These points are located on the horizontal plane through the center of the cylindrical charge, at a distance of k from its center. It can be observed that with increasing VOD, the peak stress at the borehole wall increases significantly, the arrival time of the peak stress becomes earlier, and the duration of the stress wave becomes shorter. These results suggest that at lower detonation velocities, the arrival times of stress waves generated by different equivalent spherical charges at the same location are more dispersed, leading to insufficient wave superposition, resulting in reduced peak stress amplitudes.
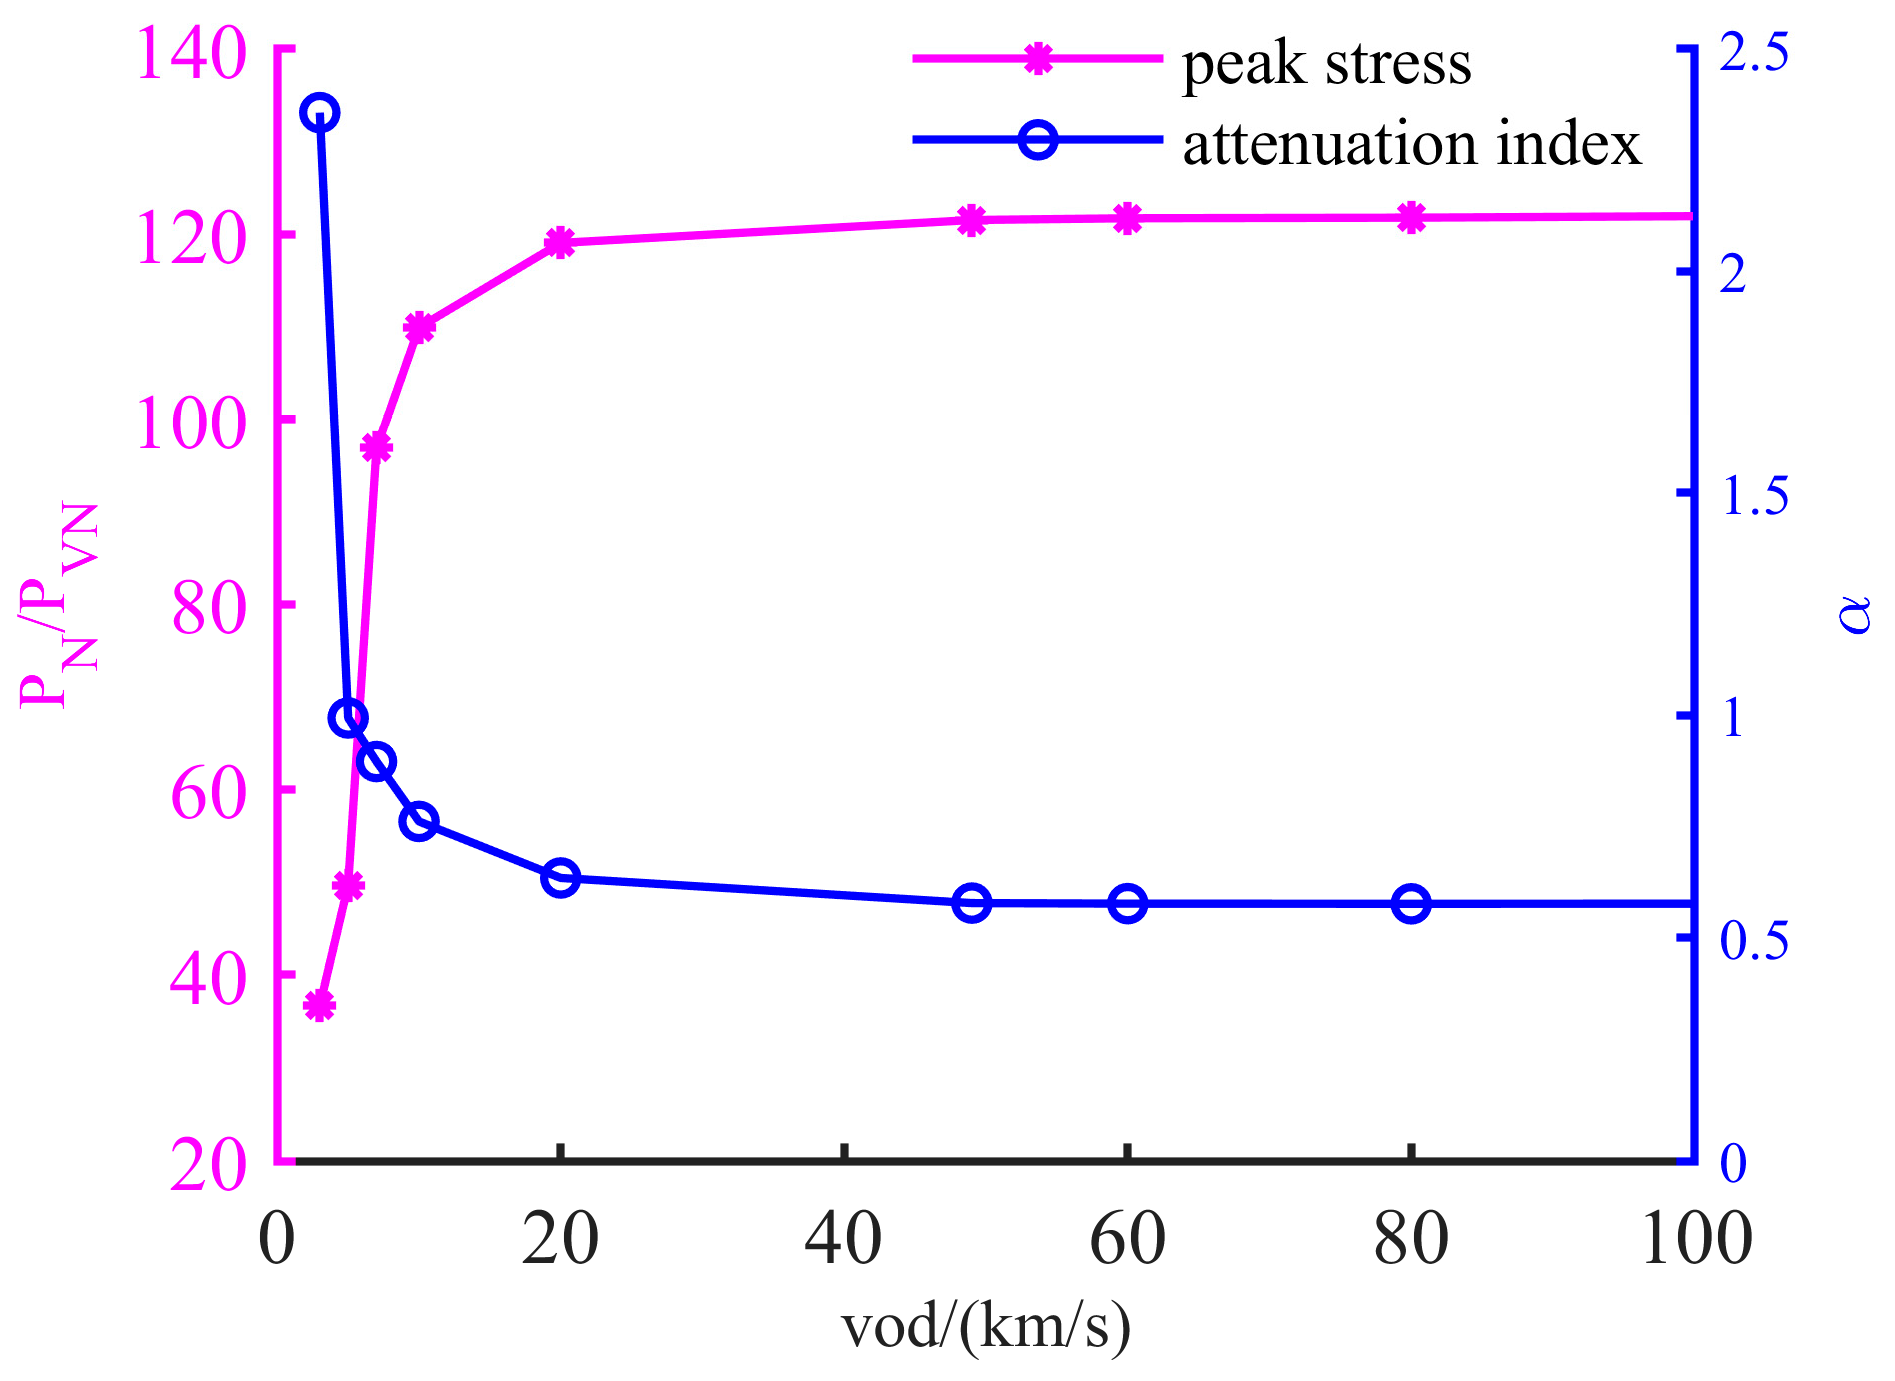
As shown in Figure 9, the radial stress peak at the borehole wall increases with the VOD, while the attenuation index decreases accordingly. A higher VOD enables stress waves from the surrounding charges to superimpose more rapidly, resulting in higher peak stresses and slower attenuation. When the VOD reaches a sufficiently high value, the time differences between the initiation of equivalent spherical charges become minimal, and the superposition model tends to stabilize.
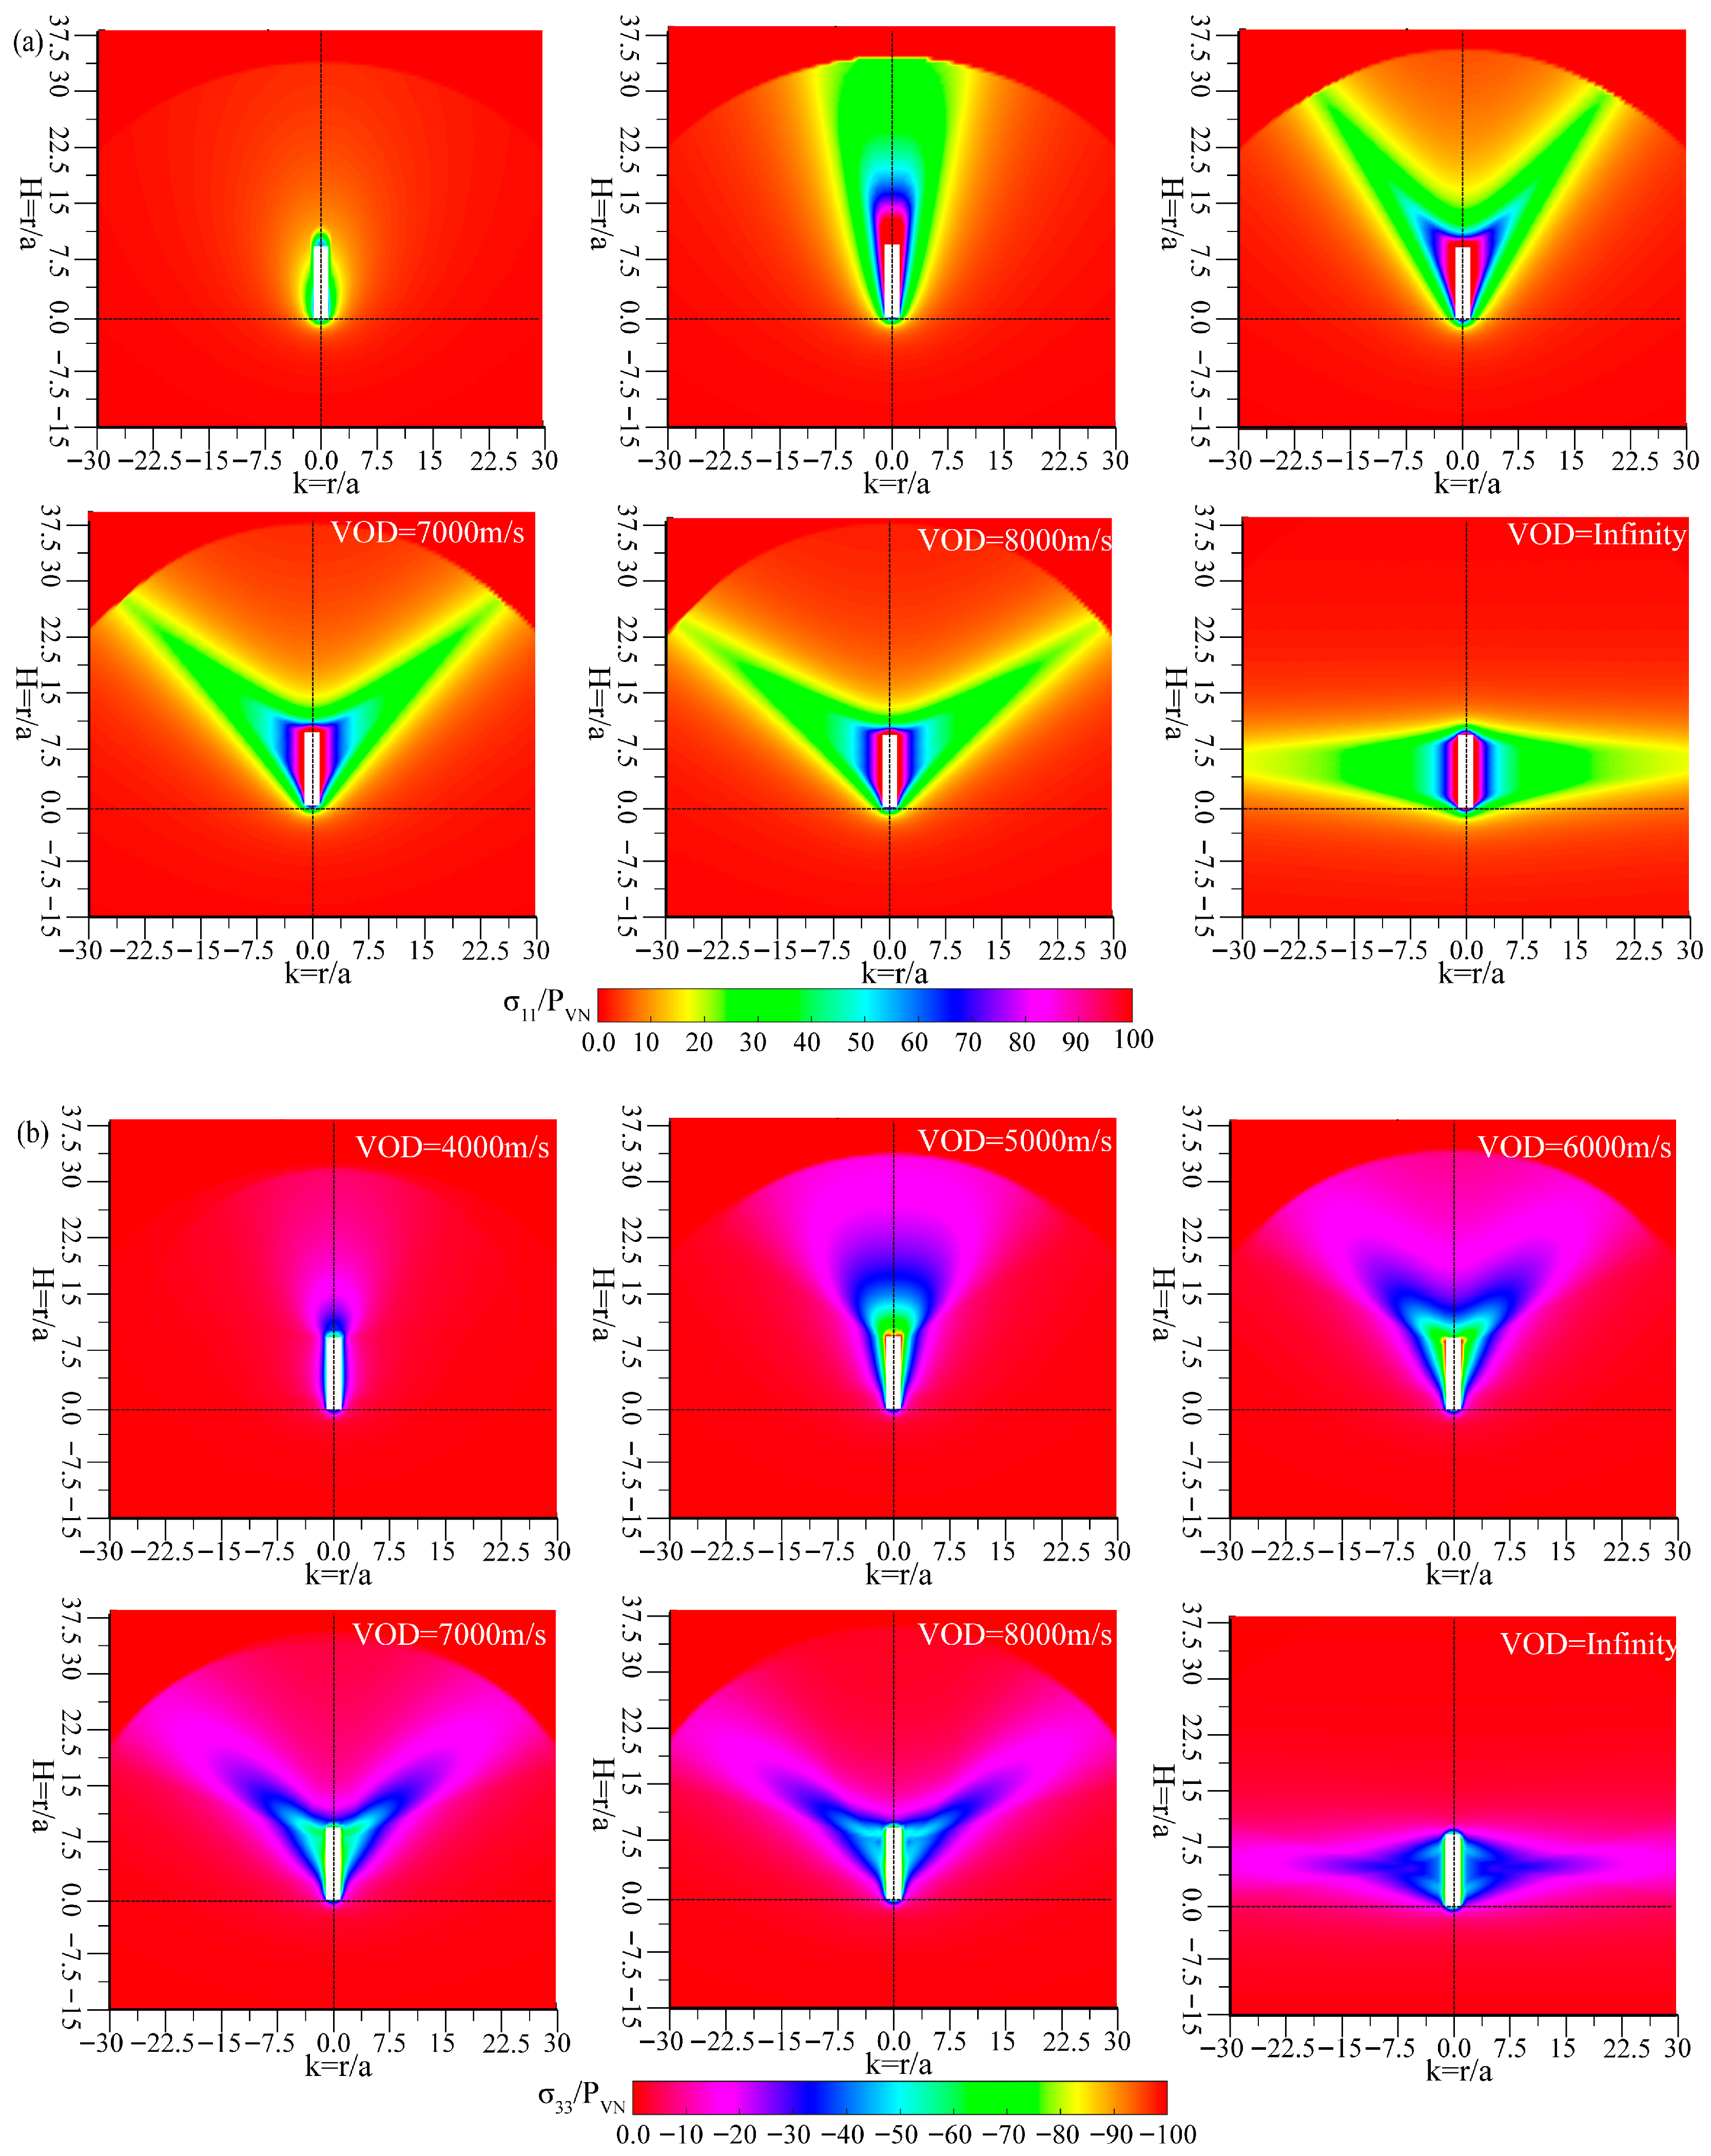
To more clearly describe the stress-field distribution under different VOD conditions, the principal stresses ( σ 11 , σ 33 ) were extracted by transforming the stress tensor within selected radial and axial ranges, based on the radial symmetry of the cylindrical charge. Here, σ 11 denotes the maximum compressive stress and σ 33 the maximum tensile stress. Given a longitudinal wave velocity C p = 5000   m / s , Figure 10 shows that when the VOD was less than C p , only localized high-stress regions appeared around the explosive charge and near the detonation-end. When the VOD was equal to C p , the high-stress concentration was primarily aligned along the detonation direction. As the VOD increased beyond C p , the high-stress zones evolved into a distinct “V”-shaped pattern, extending from the detonation-end toward the lateral directions. When the VOD tended to infinity, the cylindrical charge behaved as if it were initiated simultaneously along its entire length, and the high-stress concentration shifted to a horizontally oriented region around the charge.
These results demonstrate that the VOD significantly alters the spatial distribution of stress concentration zones in cylindrical charge blasting, thereby influencing the propagation direction and effective range of explosive energy.

3.3. Effect of Initiation Position on Stress Field Distribution in Cylindrical Charges

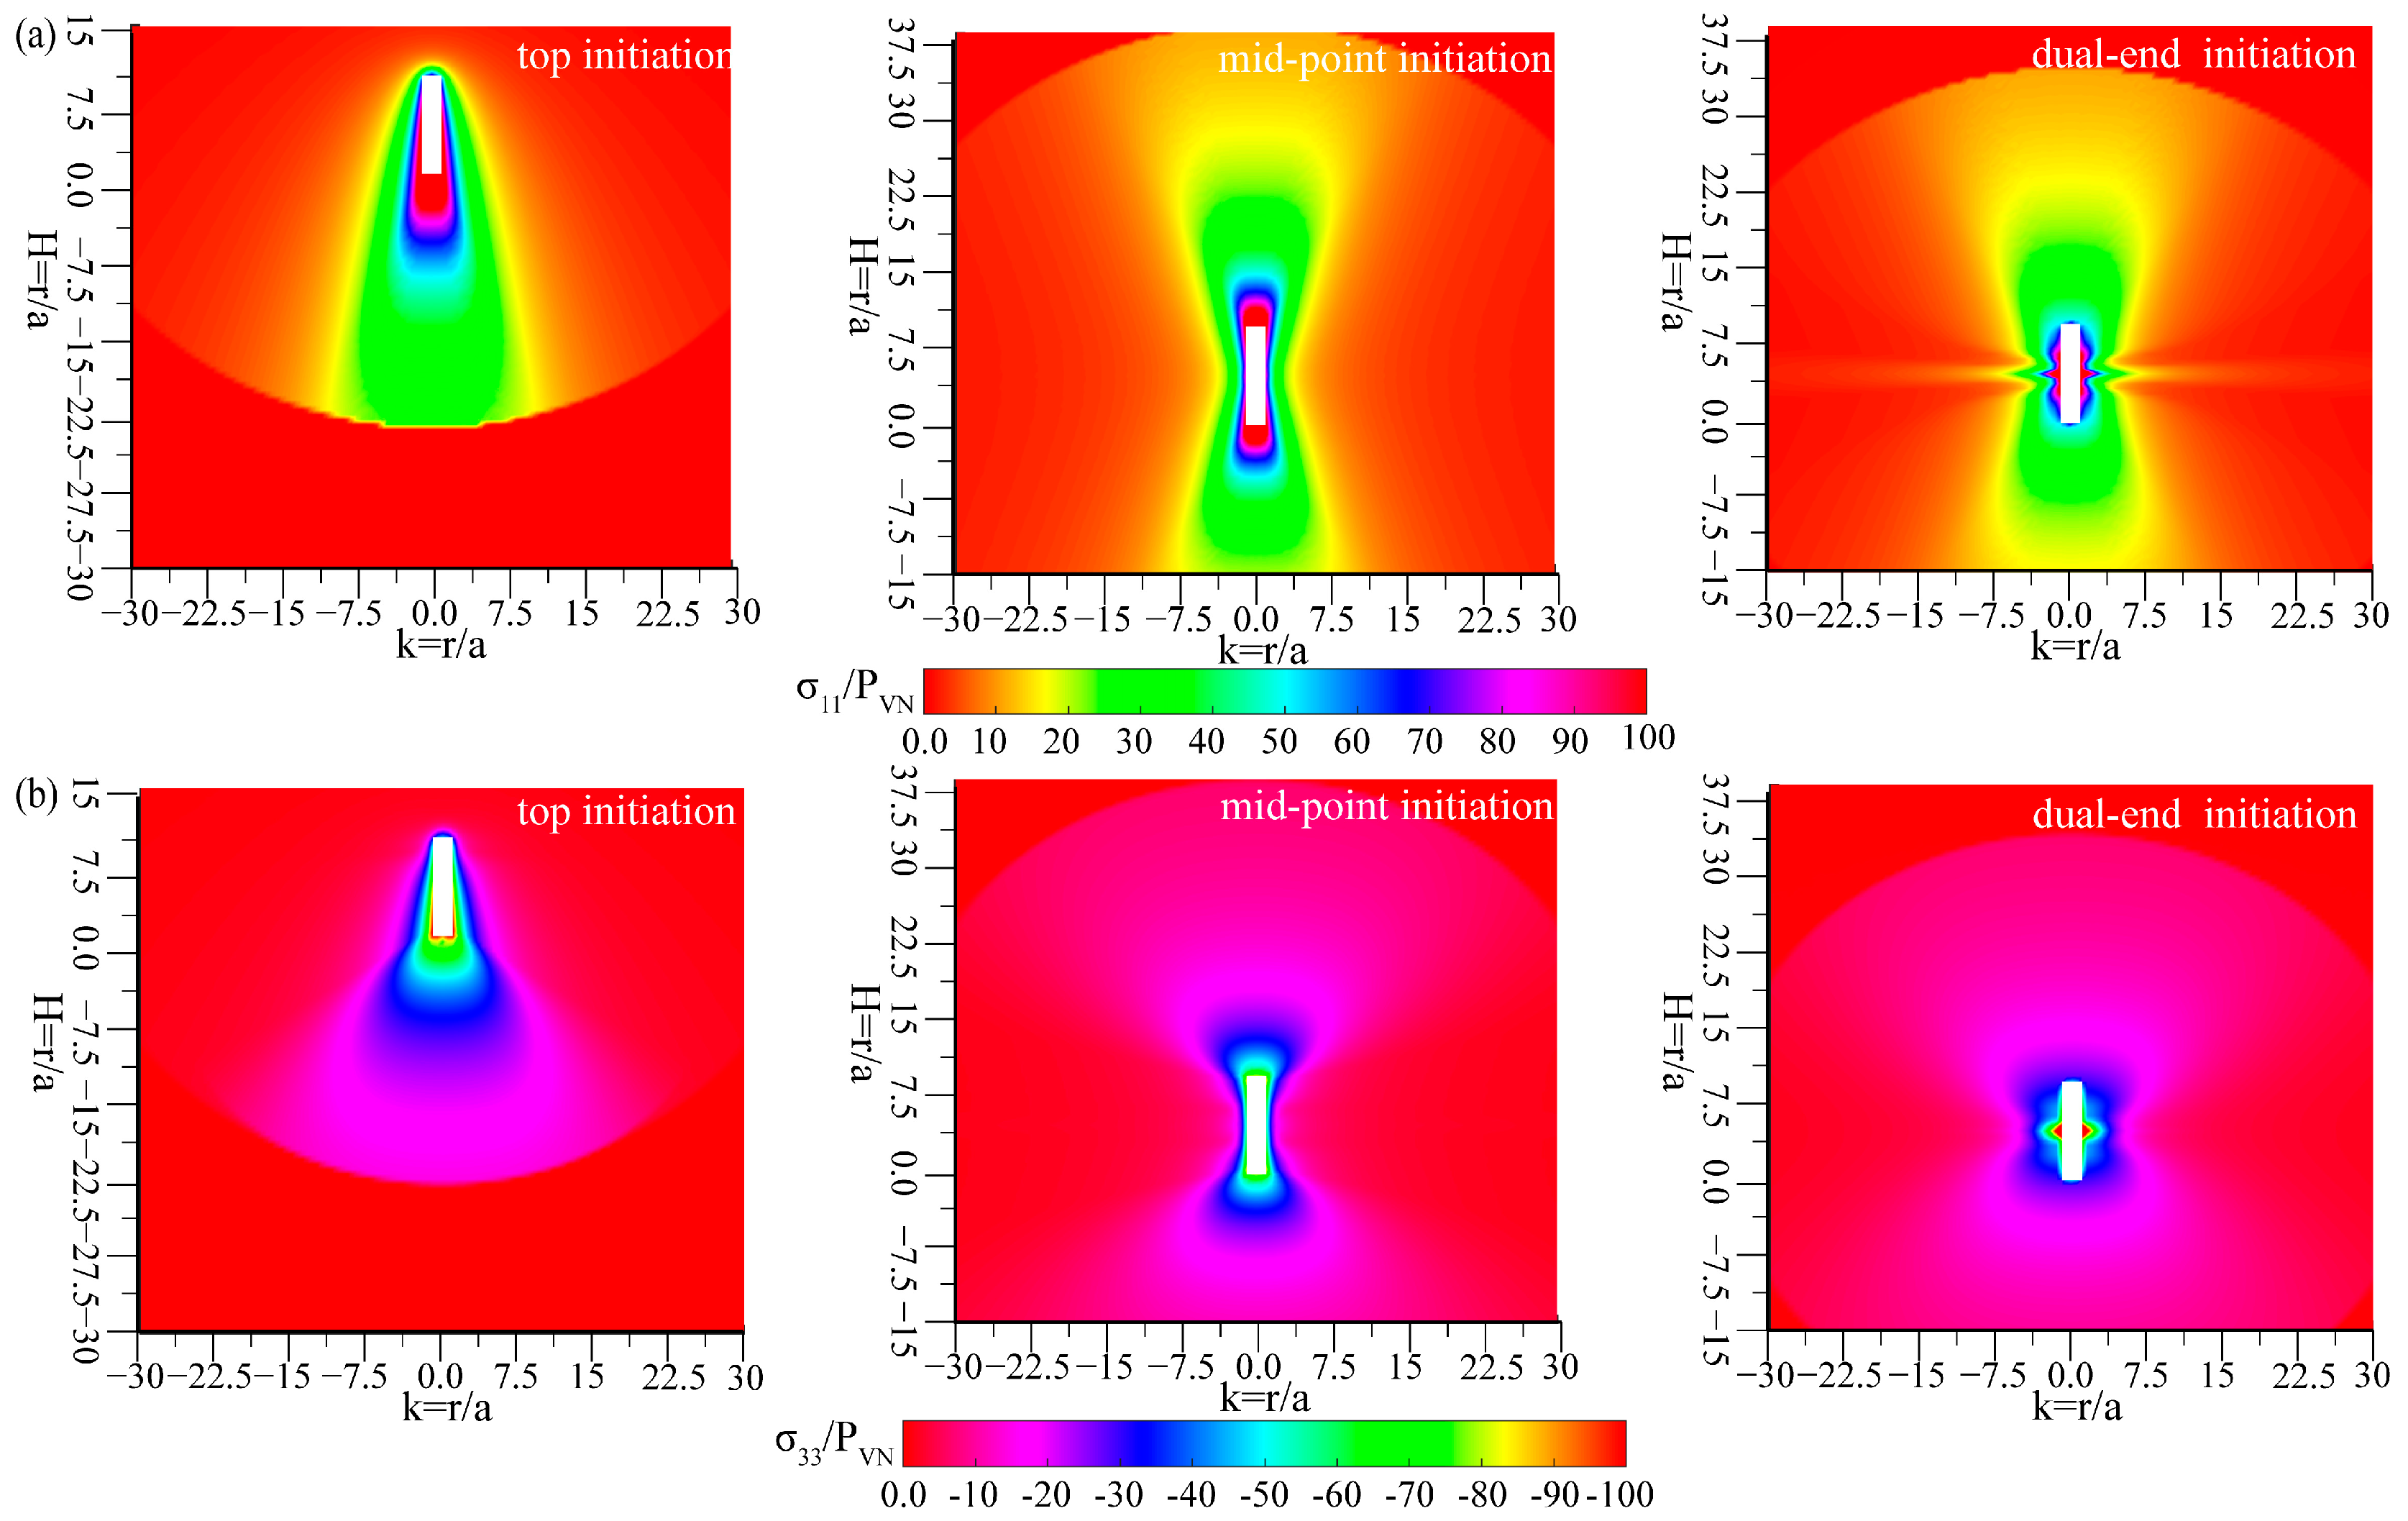
Figure 11 presents contour maps of the maximum and minimum principal stresses under various initiation positions. The top and bottom initiation configurations exhibit complete symmetry, the stress distribution for bottom initiation has already been shown in Figure 10. When detonation is initiated at the bottom or top of the cylindrical charge, high-stress concentrations primarily occur at the detonation-end. For mid-point initiation, the stress waves propagate simultaneously toward both ends, and high-stress regions gradually expand from the center toward both ends of the charge. In the case of dual-end initiation, detonation waves propagate inward from both ends and superimpose near the center of the charge. This interaction generates a concentrated high-stress region at the mid-length of the borehole, with stress magnitude gradually decreasing toward both ends. Due to the time-dependent nature of detonation in cylindrical charges, the resulting stress field is inherently non-uniform. The choice of initiation position significantly influences the location of stress concentration zones. Stress waves tend to constructively superimpose along the propagation path of the detonation wave.

4. Numerical Modeling

It should be noted that the theoretical model proposed in this study is developed within an elastic full-space framework and does not incorporate rock damage or failure criteria. Therefore, LS-DYNA numerical simulations are employed to investigate the damage distribution characteristics of cylindrical charges under different source parameters, in order to validate the theoretical stress-field analysis and to complement its limitations in damage prediction.

4.1. Modeling

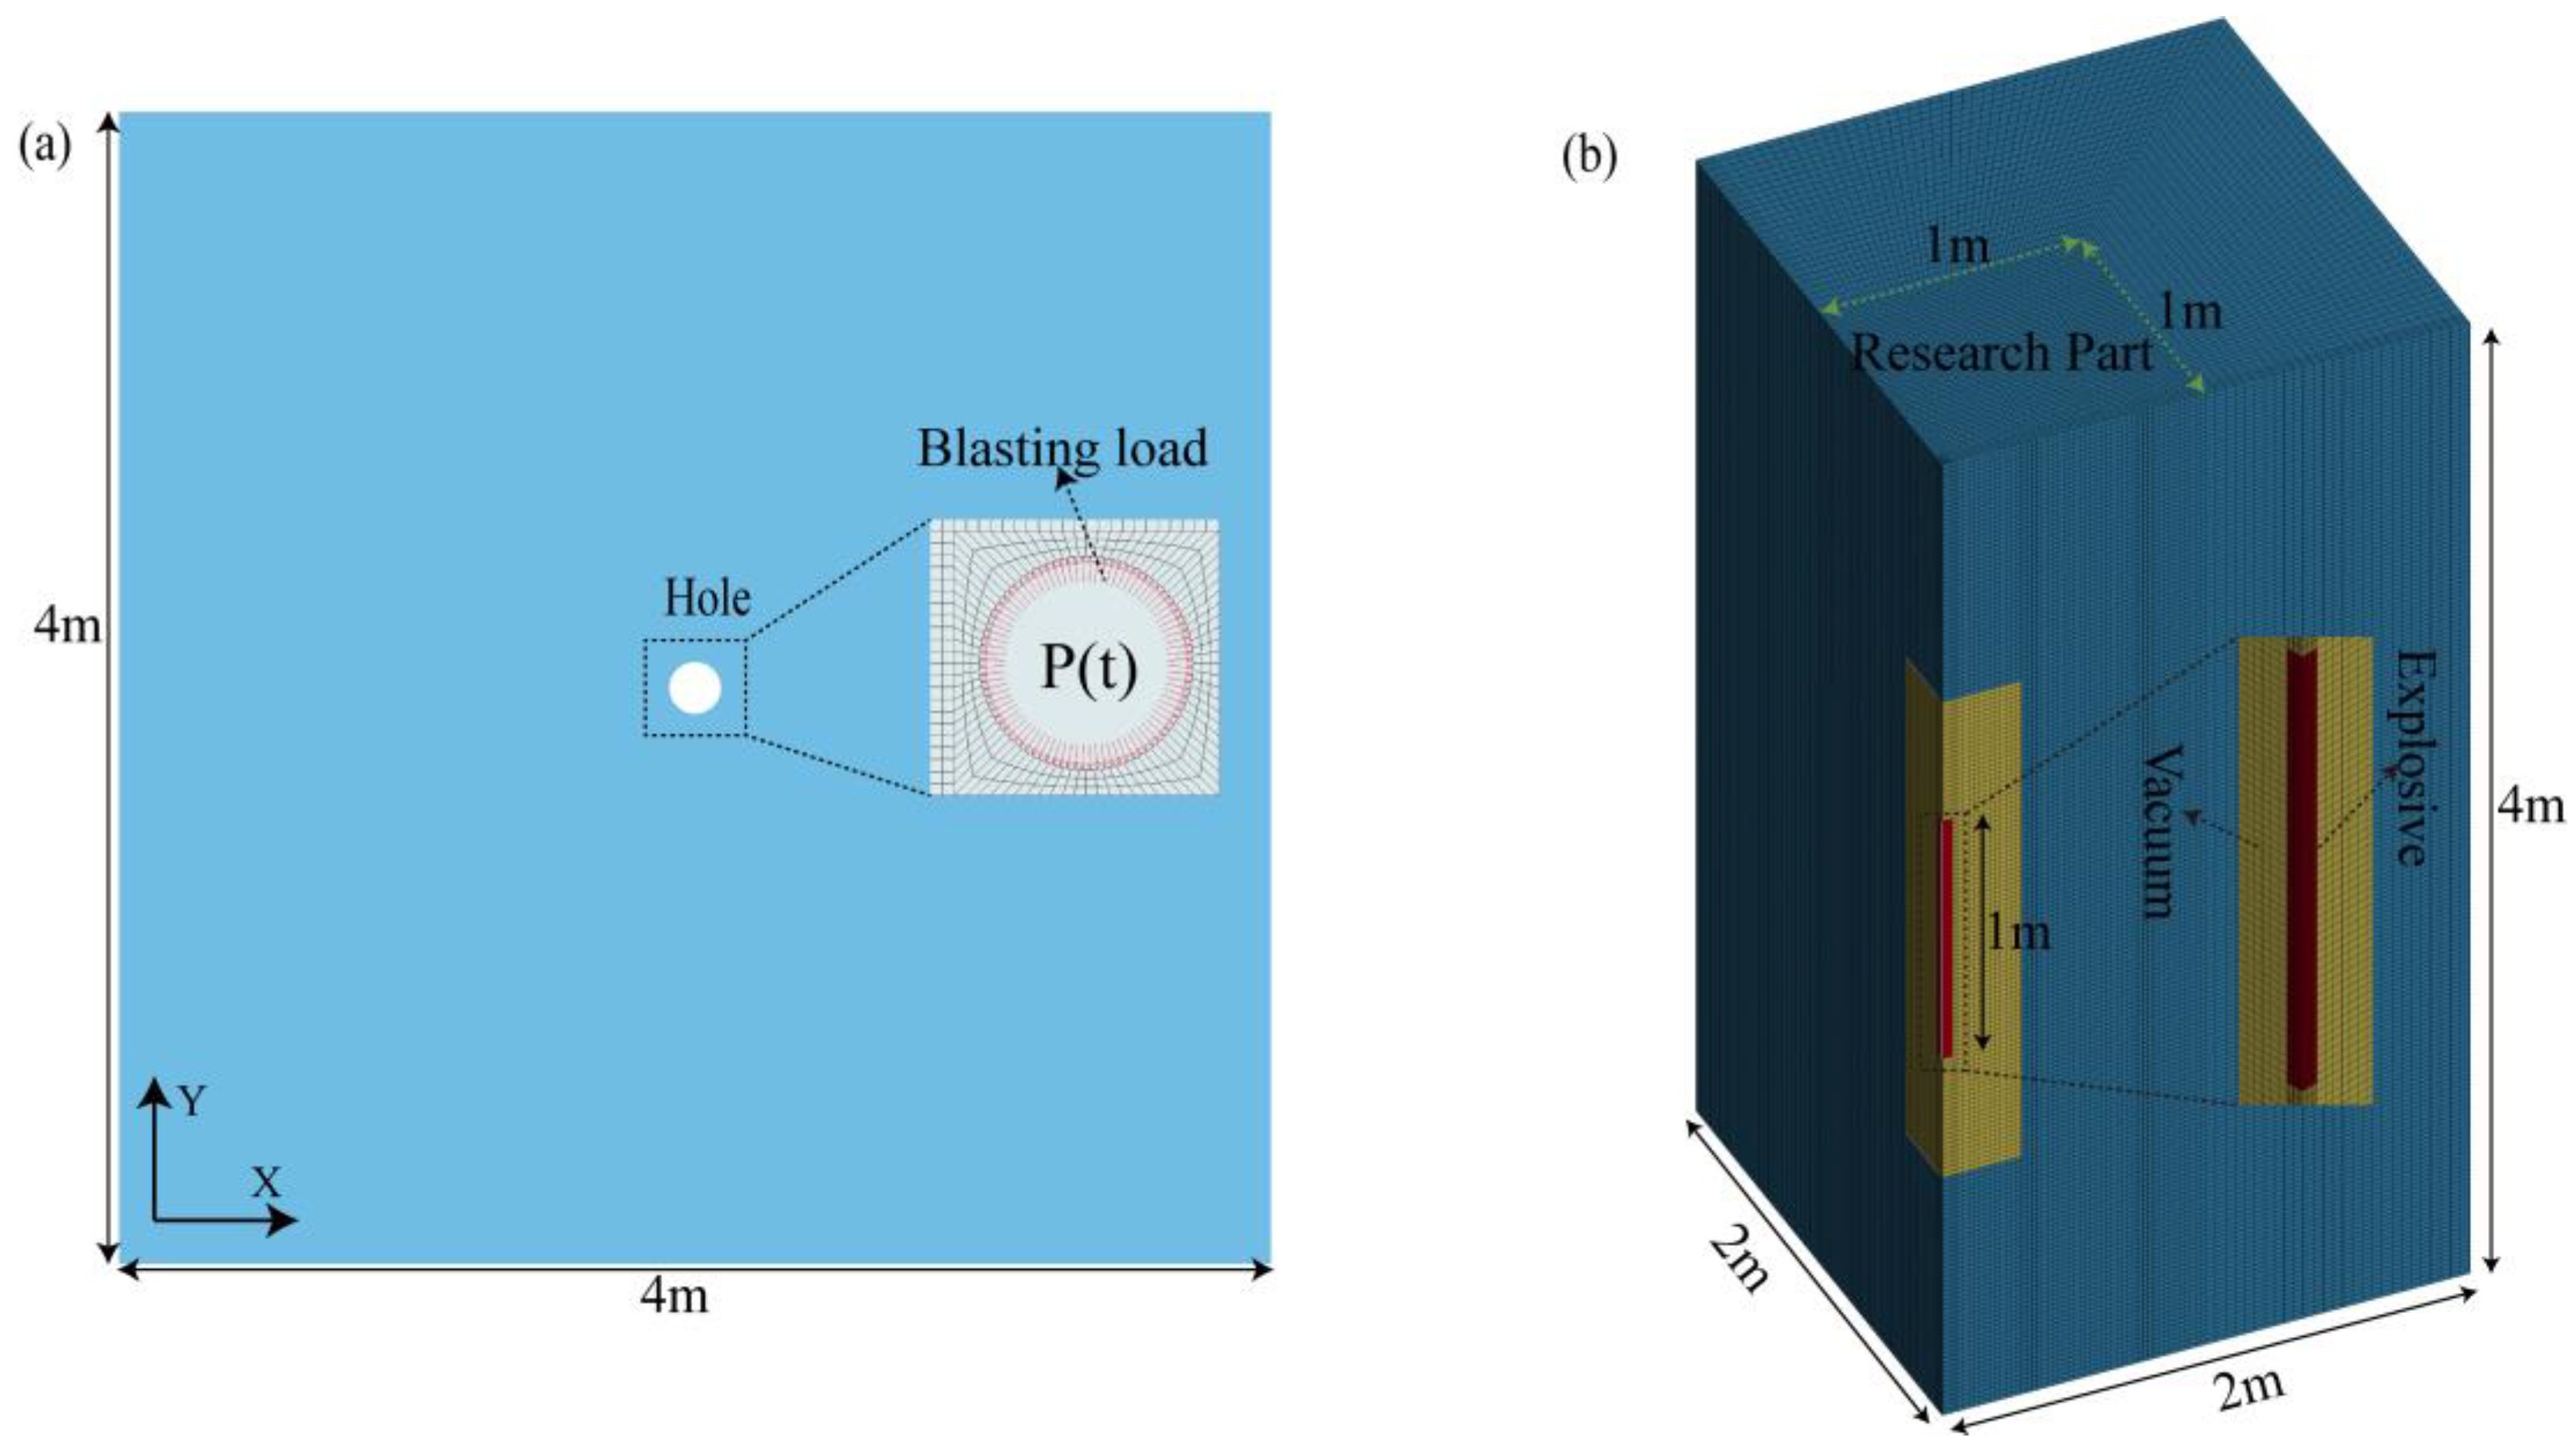
A quasi-two-dimensional finite element model in Figure 12a, measuring 4 m × 4 m, was developed to examine the effect of the loading rate defined in the borehole wall wave source function on both stress wave propagation and crack development. The borehole radius was 0.04 m, and the element size was 0.02 m, resulting in a total of 159,780 elements. Non-reflecting boundaries were applied along all lateral sides, while the top and bottom surfaces were constrained in the Z-direction to satisfy the plane strain condition. Since the user-defined load curve in LS-DYNA can only represent radial blast loading, an additional quarter-symmetry model with dimensions 2 m × 2 m × 4 m was developed to investigate the three-dimensional stress field distribution induced by cylindrical charges. The charge length and radius were 1 m and 0.04 m, respectively. To further minimize the influence of reflected waves, an extended domain was added outside the 1 m × 1 m × 4 m core research part, as shown in Figure 12b. The element size in the core region was 0.02 m, while that in the extended part was 0.04 m, yielding a total of 1,099,800 elements. For the numerical simulations, the element size has a significant impact on the results. A convergence study was conducted using smaller element sizes, showing that the simulation results were nearly identical, while the computational time increased substantially. In the numerical simulations of this paper, the explosive was modeled using the ALE method, while the rock was described using the Lagrange algorithm. The *CONSTRAINED_LAGRANGE_IN_SOLID keyword was employed to achieve the fluid–structure interaction between the rock and the explosive.

4.2. Material Model

The RHT model in LS-DYNA is extensively employed to simulate rock damage induced by blasting [39,40,41,42]. This model is particularly well-suited for analyzing the tensile and compressive damage of brittle materials like rock under blast loading, as it incorporates a dynamic strain rate enhancement factor to account for strain rate effects. Damage in the RHT model is characterized by the parameter D, which accumulates with plastic strain and is defined as D = ε p ε f ; here ε p is the incremental plastic strain and ε f is the failure strain. The specific parameters for the RHT material used in this study are listed in Table 2 [41]. To clearly observe the spatial distribution of rock damage, a damage threshold of D = 0.2 is adopted to represent a significantly damaged state of the material. Parametric numerical tests indicate that damage levels below D = 0.2 do not lead to noticeable changes in the overall damage pattern or its comparative trends under different blasting conditions. Moreover, the selected threshold is consistent with values commonly adopted in previous numerical studies using the RHT model to characterize severe damage zones in rock blasting simulations [23,39,42]. Therefore, D = 0.2 is employed in this study primarily to enhance the clarity and comparability of damage visualization.
The explosive detonation process was simulated using the Jones-Wilkens-Lee (JWL) equation of state coupled with the MAT_HIGH_EXPLOSIVE_BURN material model. The JWL equation describes the relationship between the detonation pressure and the specific volume of the explosion products, expressed as
P = A 1 ω R 1 V e R 1 V + B 1 ω R 2 V e R 2 V + ω E 0 V
where P is the detonation pressure; V is the relative specific volume of the explosive products; E 0 is the internal energy per unit initial volume; and A , B , R 1 , R 2 , and ω are the relevant parameters. The parameters for the JWL equation, listed in Table 3, are adopted from Banadaki and Mohanty [43], whose experimental tests and numerical validations have been widely used in LS-DYNA simulations of explosive detonation [40,41,44]. However, since the LS-DYNA explosive models do not allow direct manipulation of the loading rate of the borehole-wall pressure function, a user-defined pressure–time history was applied to the borehole wall to replace the explosive model and achieve controlled loading-rate conditions.

4.3. Effect of Loading Rate on Blast-Induced Crack Propagation

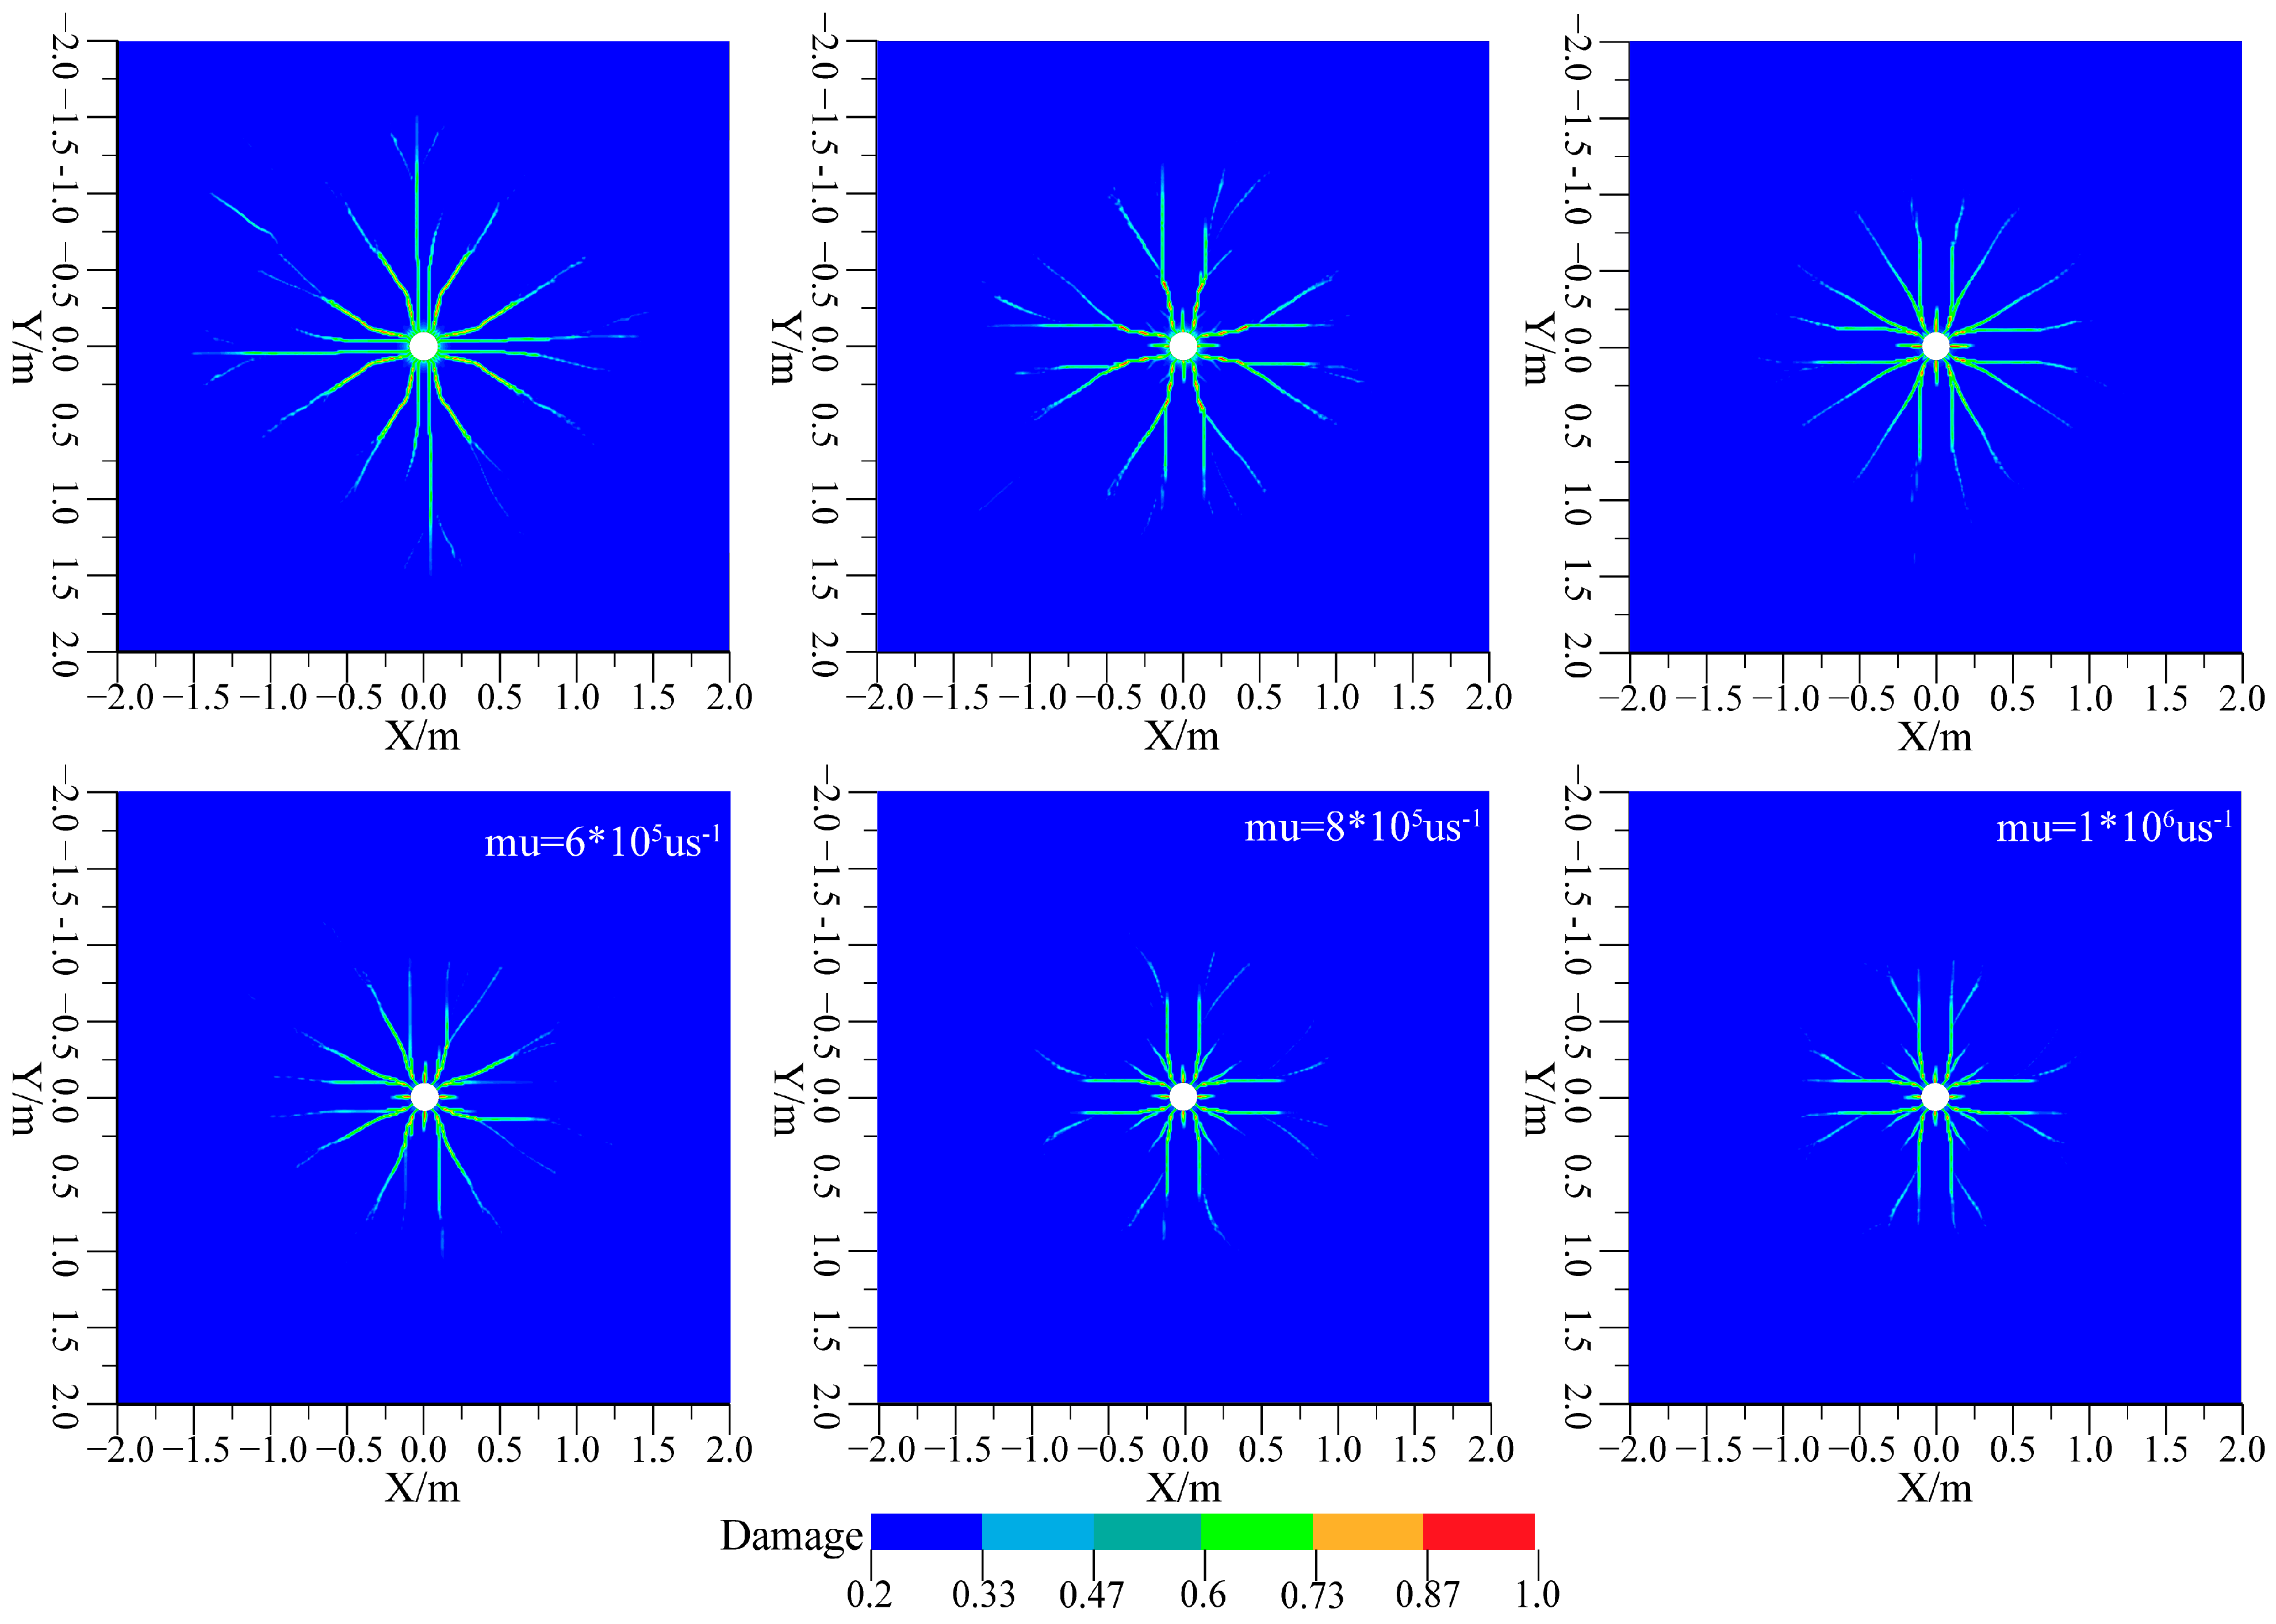
Based on the wave source pressure load equation proposed by Trivino, simulations were conducted for various loading rates (from 1 × 10 5   μ s 1 to 1 × 10 6   μ s 1 ). The resulting damage contours for the rock under these different loading rates are presented in Figure 13. The simulation results reveal a distinct influence of the loading rate on crack propagation. As the loading rate on the borehole wall increases, the propagation length of the major cracks decreases, while the number of cracks around the borehole increases. This observed trend indicates that higher loading rates tend to generate a greater number of shorter cracks, whereas lower loading rates produce fewer but longer cracks.
The theoretical framework developed in this study provides a mechanistic explanation for this behavior. As illustrated in Figure 6, the peak radial compressive stress increases with loading rate, whereas the peak hoop tensile stress decreases correspondingly. Given the rapid attenuation of stress waves in rock and the high sensitivity of brittle materials to tensile failure, lower loading rates promote larger far-field tensile stresses, facilitating longer tensile crack propagation. In contrast, higher loading rates induce substantially greater compressive stresses in the near-field region adjacent to the borehole wall, enhancing compressive–shear failure and resulting in a greater number of short cracks.

4.4. Stress Evolution and Damage Patterns Under Different VODs

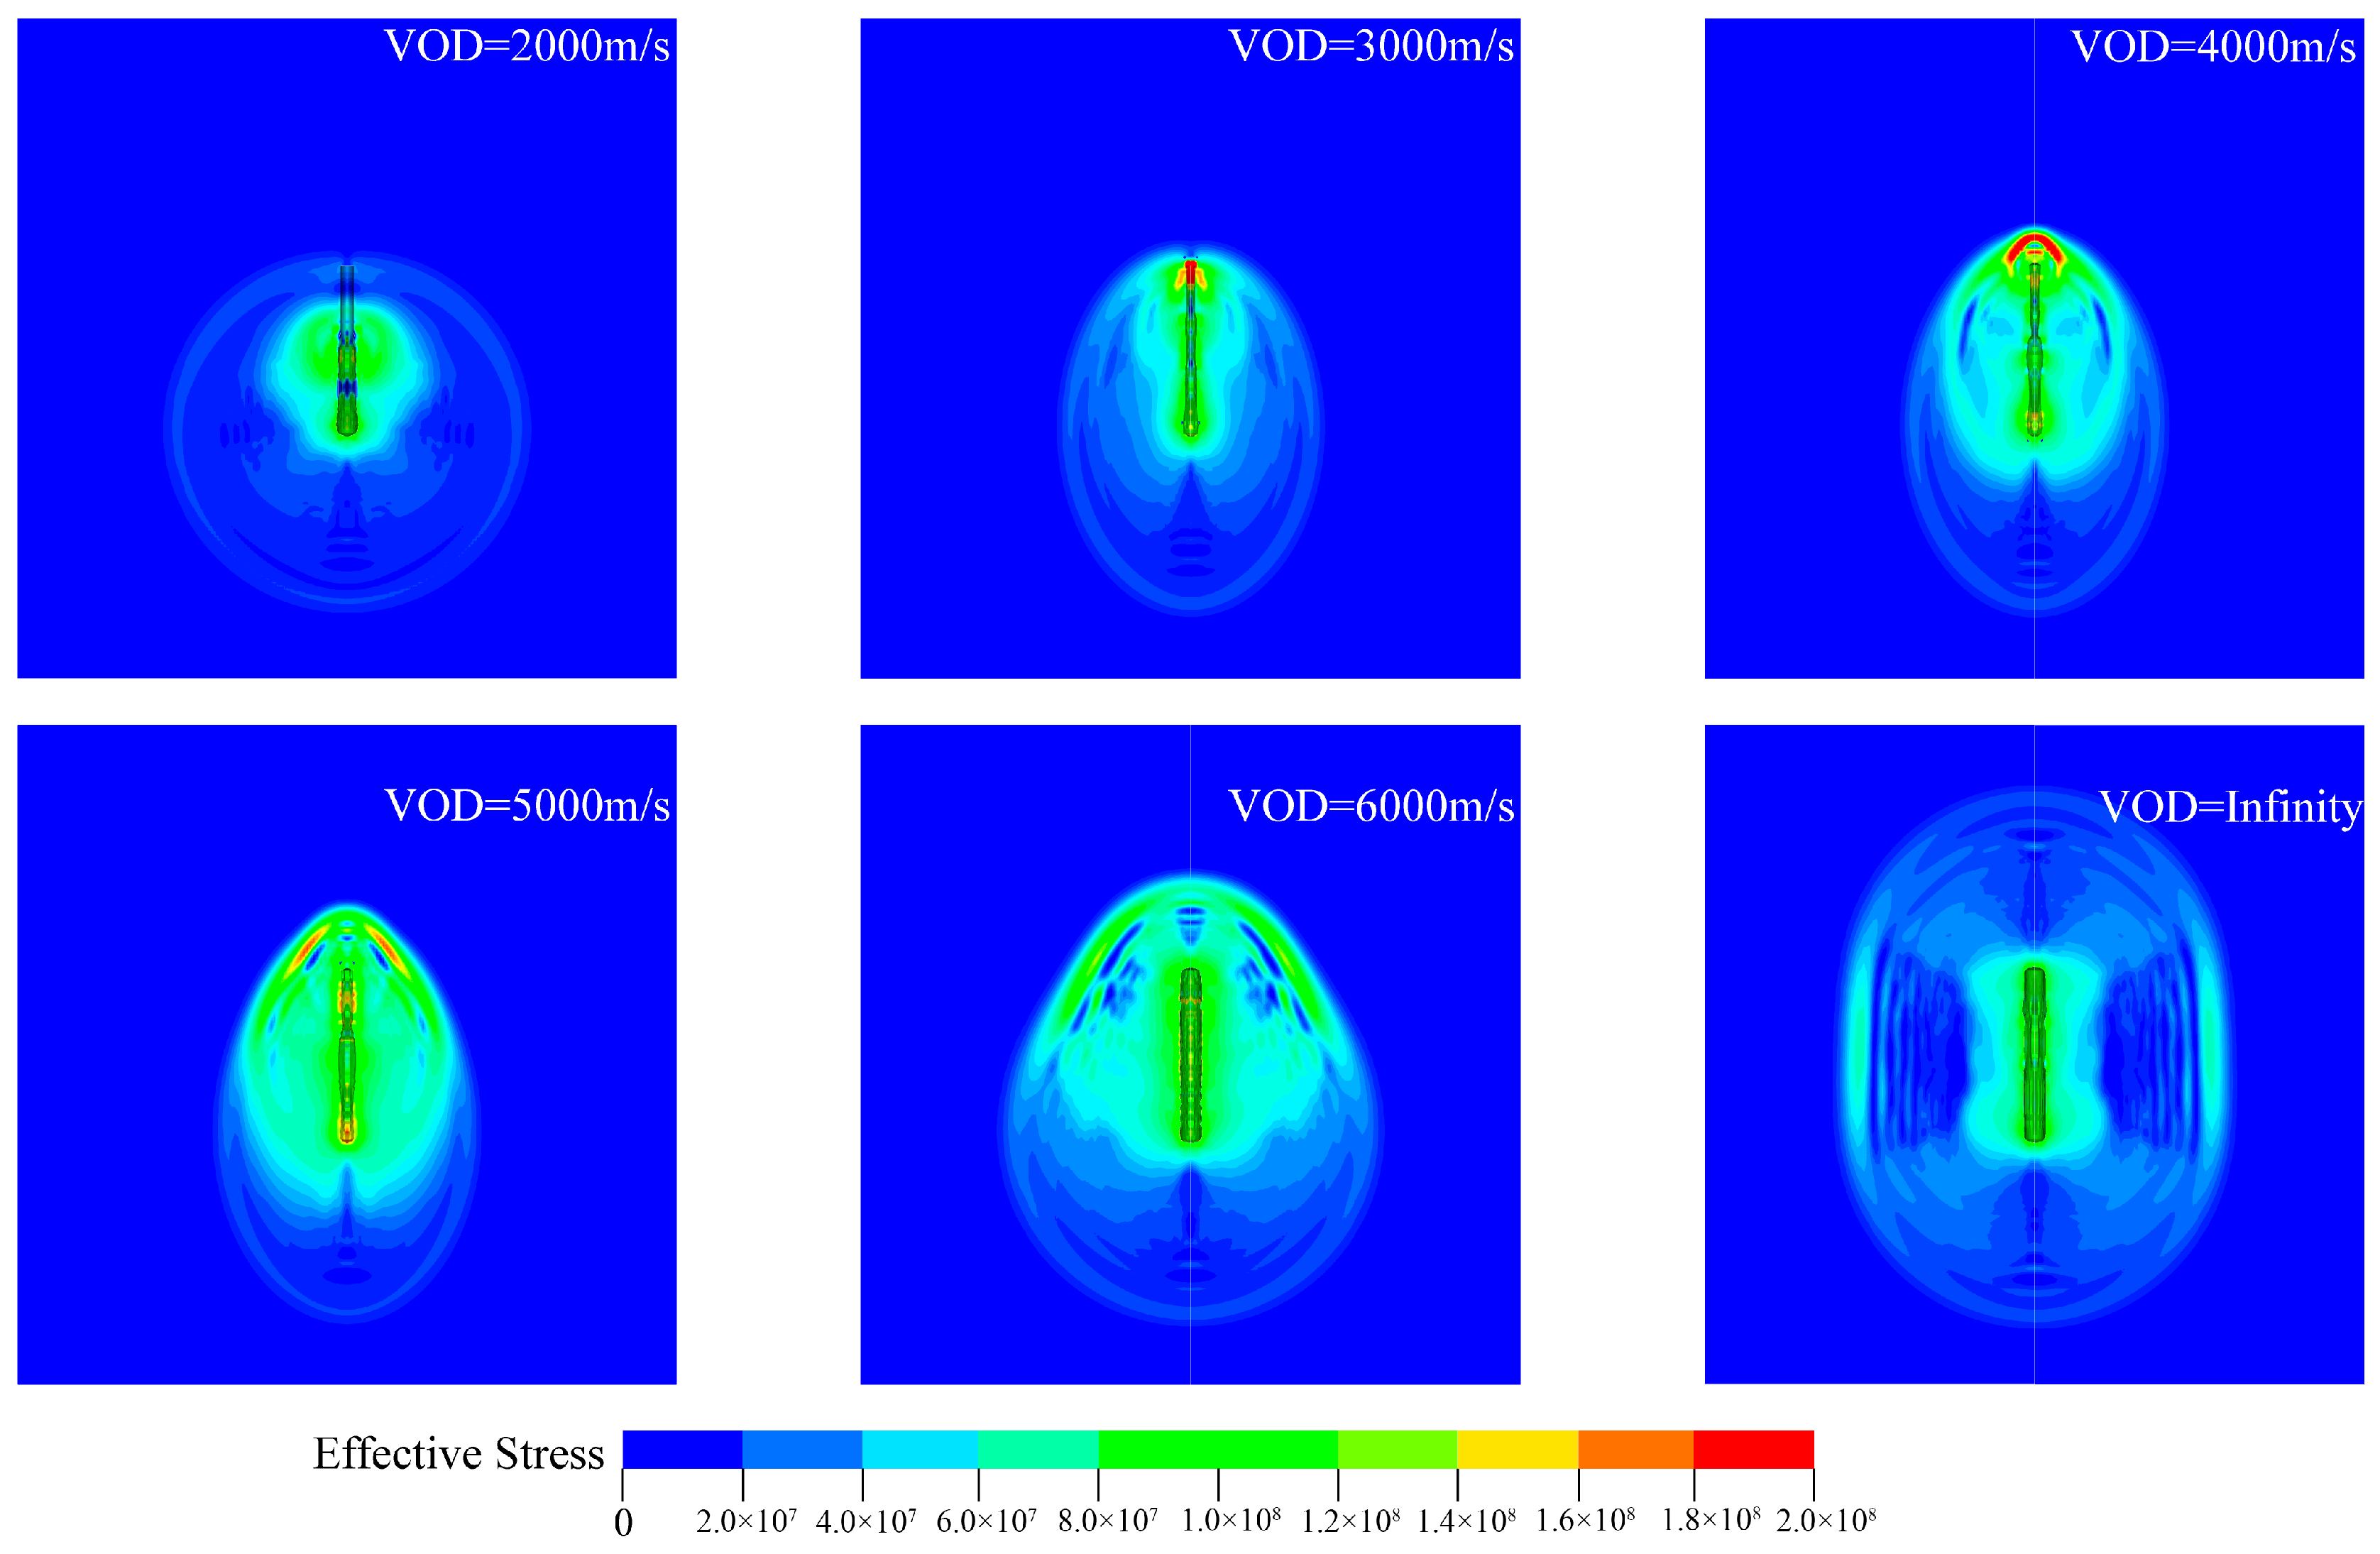
For all selected RHT material parameters, the calculated P-wave velocity is approximately 3316 m/s. Accordingly, numerical simulations were performed using detonation velocities (VOD) of 2000 m/s, 3000 m/s, 4000 m/s, 5000 m/s, 6000 m/s, as well as an idealized case approaching infinity. Figure 14 presents the equivalent stress contours at t = 300   μ s for different VODs. As VOD increases, the rock medium responds more rapidly, and the stress waves propagate over a larger spatial extent. When the VOD is lower than the P-wave velocity, the stress waves cannot effectively superimpose in the detonation direction, resulting in a localized high-stress zone confined to the vicinity of the cylindrical charge. As VOD approaches the P-wave velocity, pronounced wave superposition occurs along the detonation axis, generating a distinct high-stress concentration region. Once VOD exceeds the P-wave velocity, the axial superposition effect gradually diminishes. In addition to the high-stress region around the charge, a prominent Mach P-wave conical superposition zone forms on both sides of the explosive. The stress magnitude within this cone is substantially higher than in surrounding regions. As the stress waves propagate outward, this Mach-type conical zone becomes the dominant driver of rock failure. With further increases in VOD, the cone axis progressively shifts toward the horizontal direction.
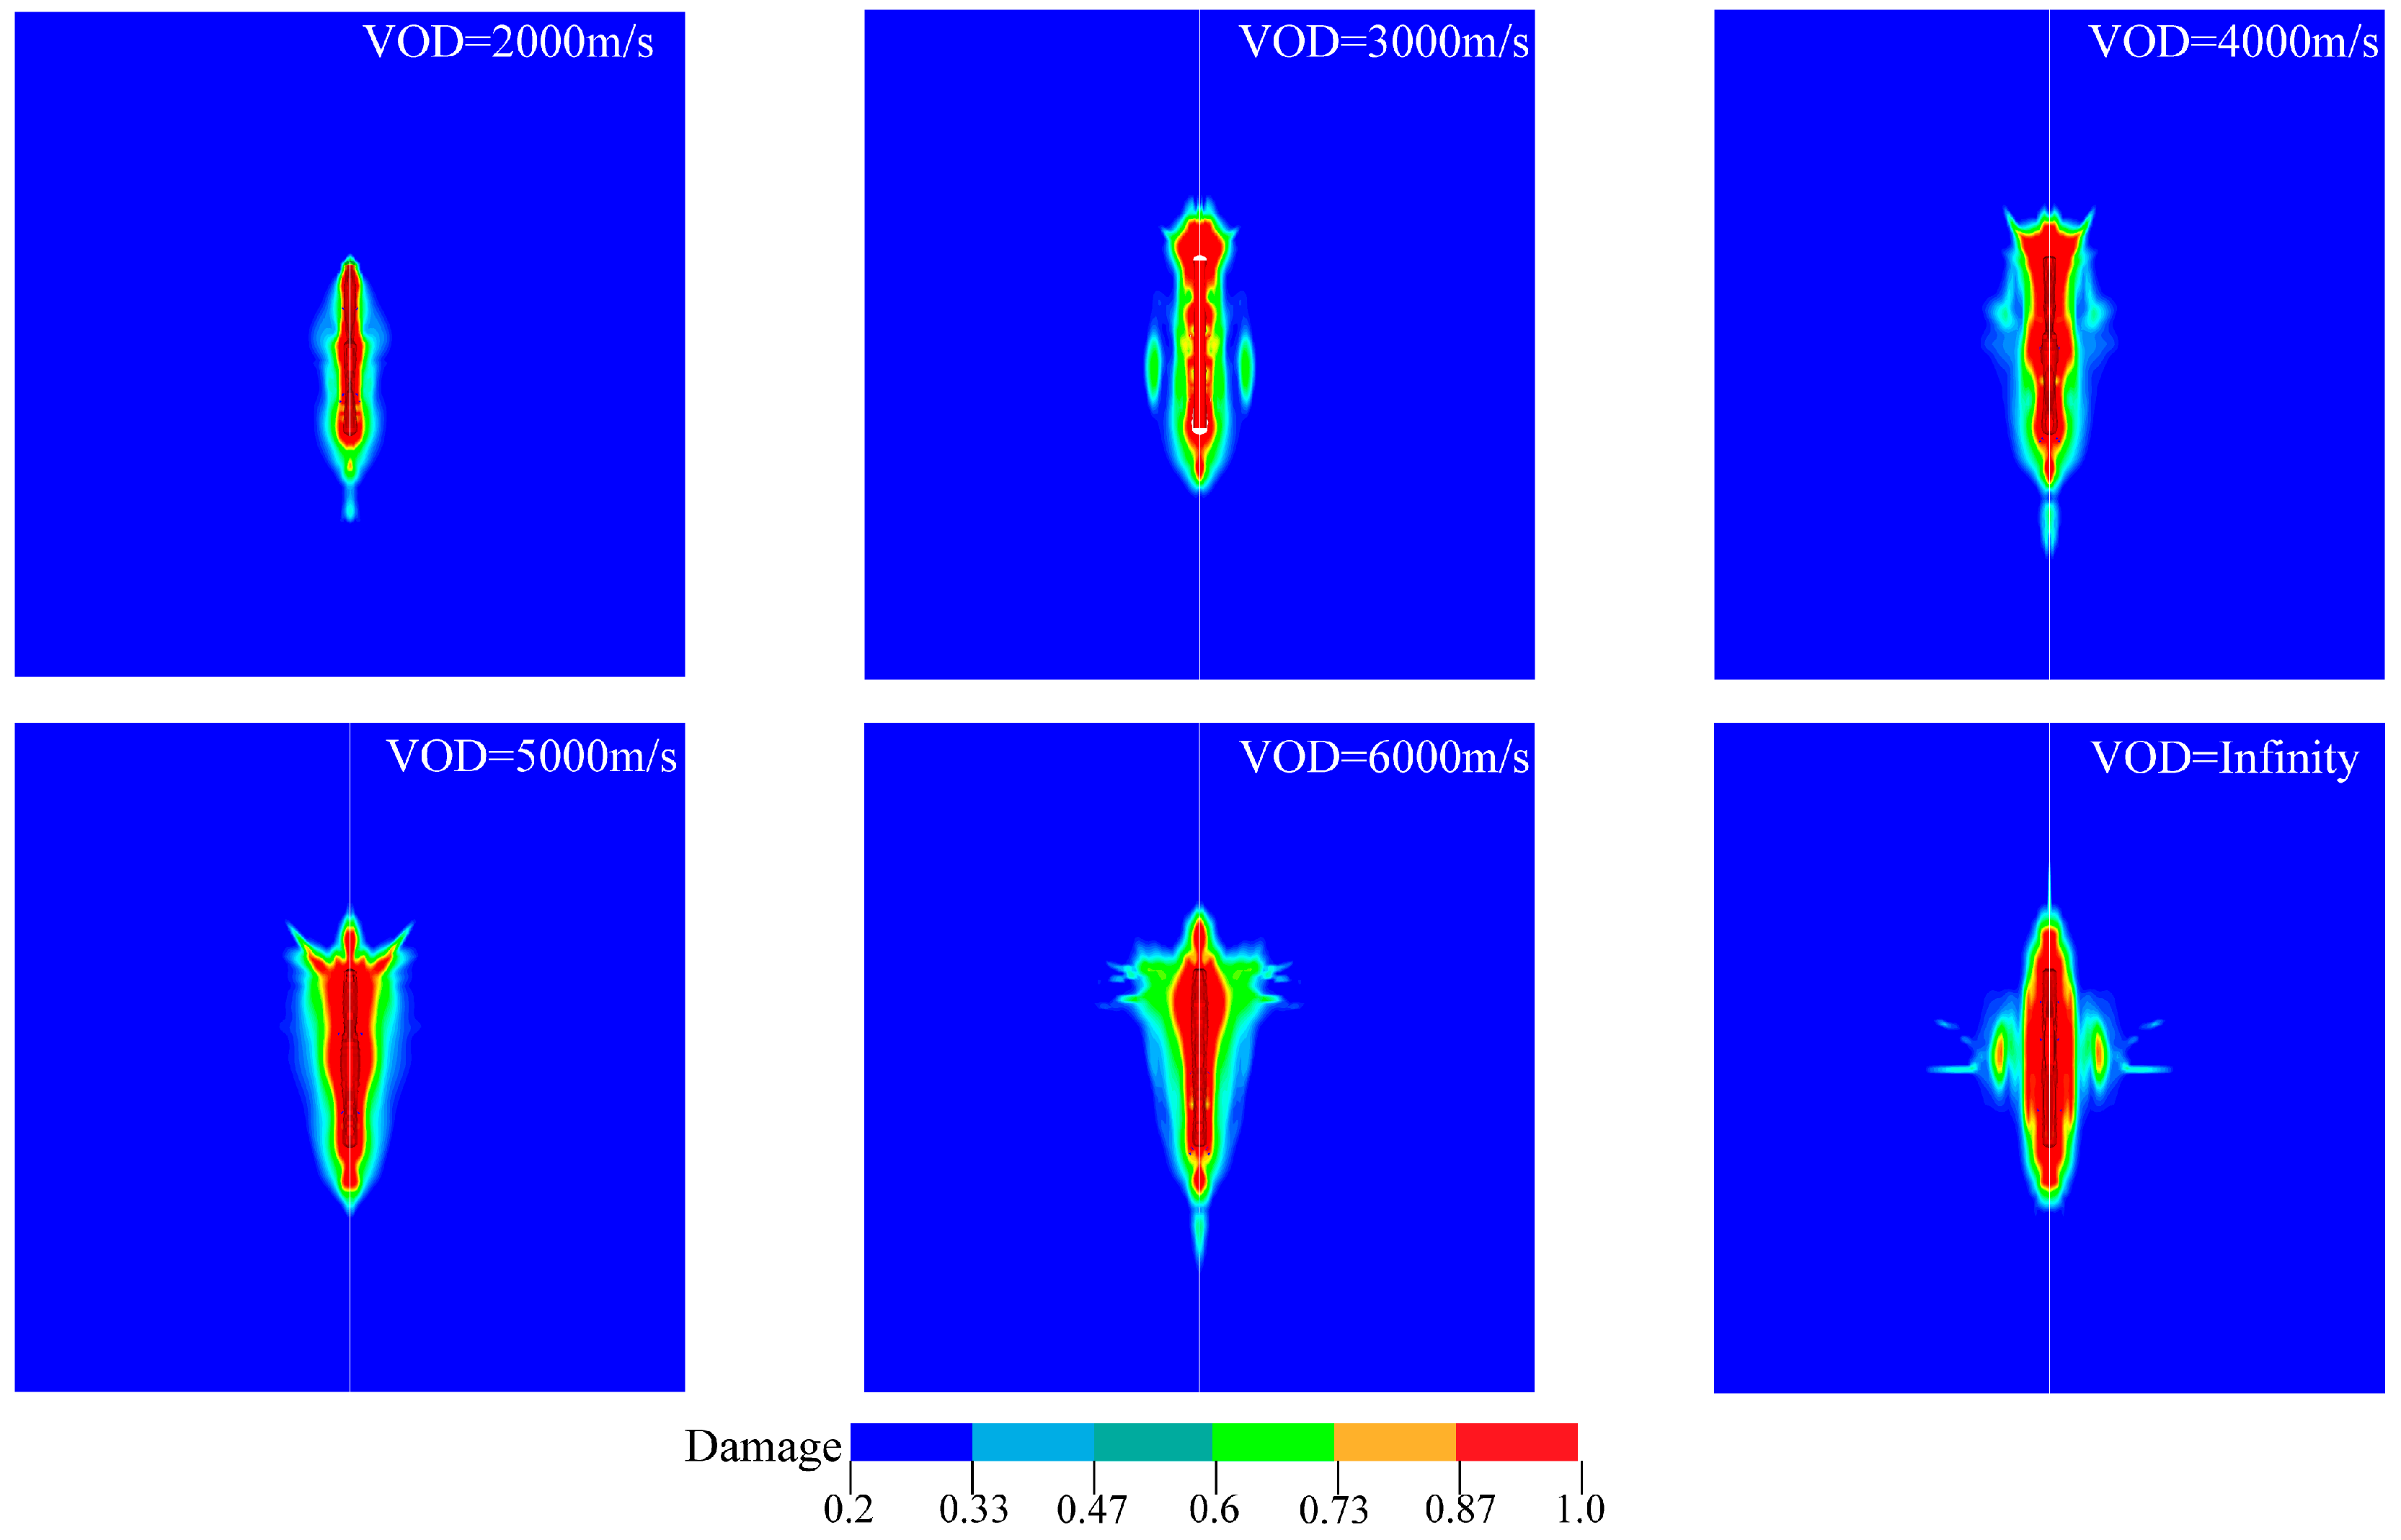
Figure 15 illustrates the distribution of blast-induced damage around the cylindrical charge under different VODs. The results show that when the detonation velocity is explicitly considered, the damage pattern becomes highly non-uniform. Along the detonation direction, both the damage level and the extent of the damaged zone progressively increase with VOD. When the VOD is equal to the P-wave velocity, the damage concentration along the detonation axis becomes most pronounced, as indicated by the dominant red regions in the contour map. As VOD continues to increase, concentrated damage region gradually shifts from the detonation axis toward the horizontal direction. In the idealized case where the detonation velocity approaches infinity—corresponding to simultaneous initiation of the entire charge—the damage distribution becomes symmetric, with the highest damage occurring at the mid-height of the cylindrical charge and diminishing toward both ends.

4.5. Damage Distribution Characteristics Under Different Initiation Points

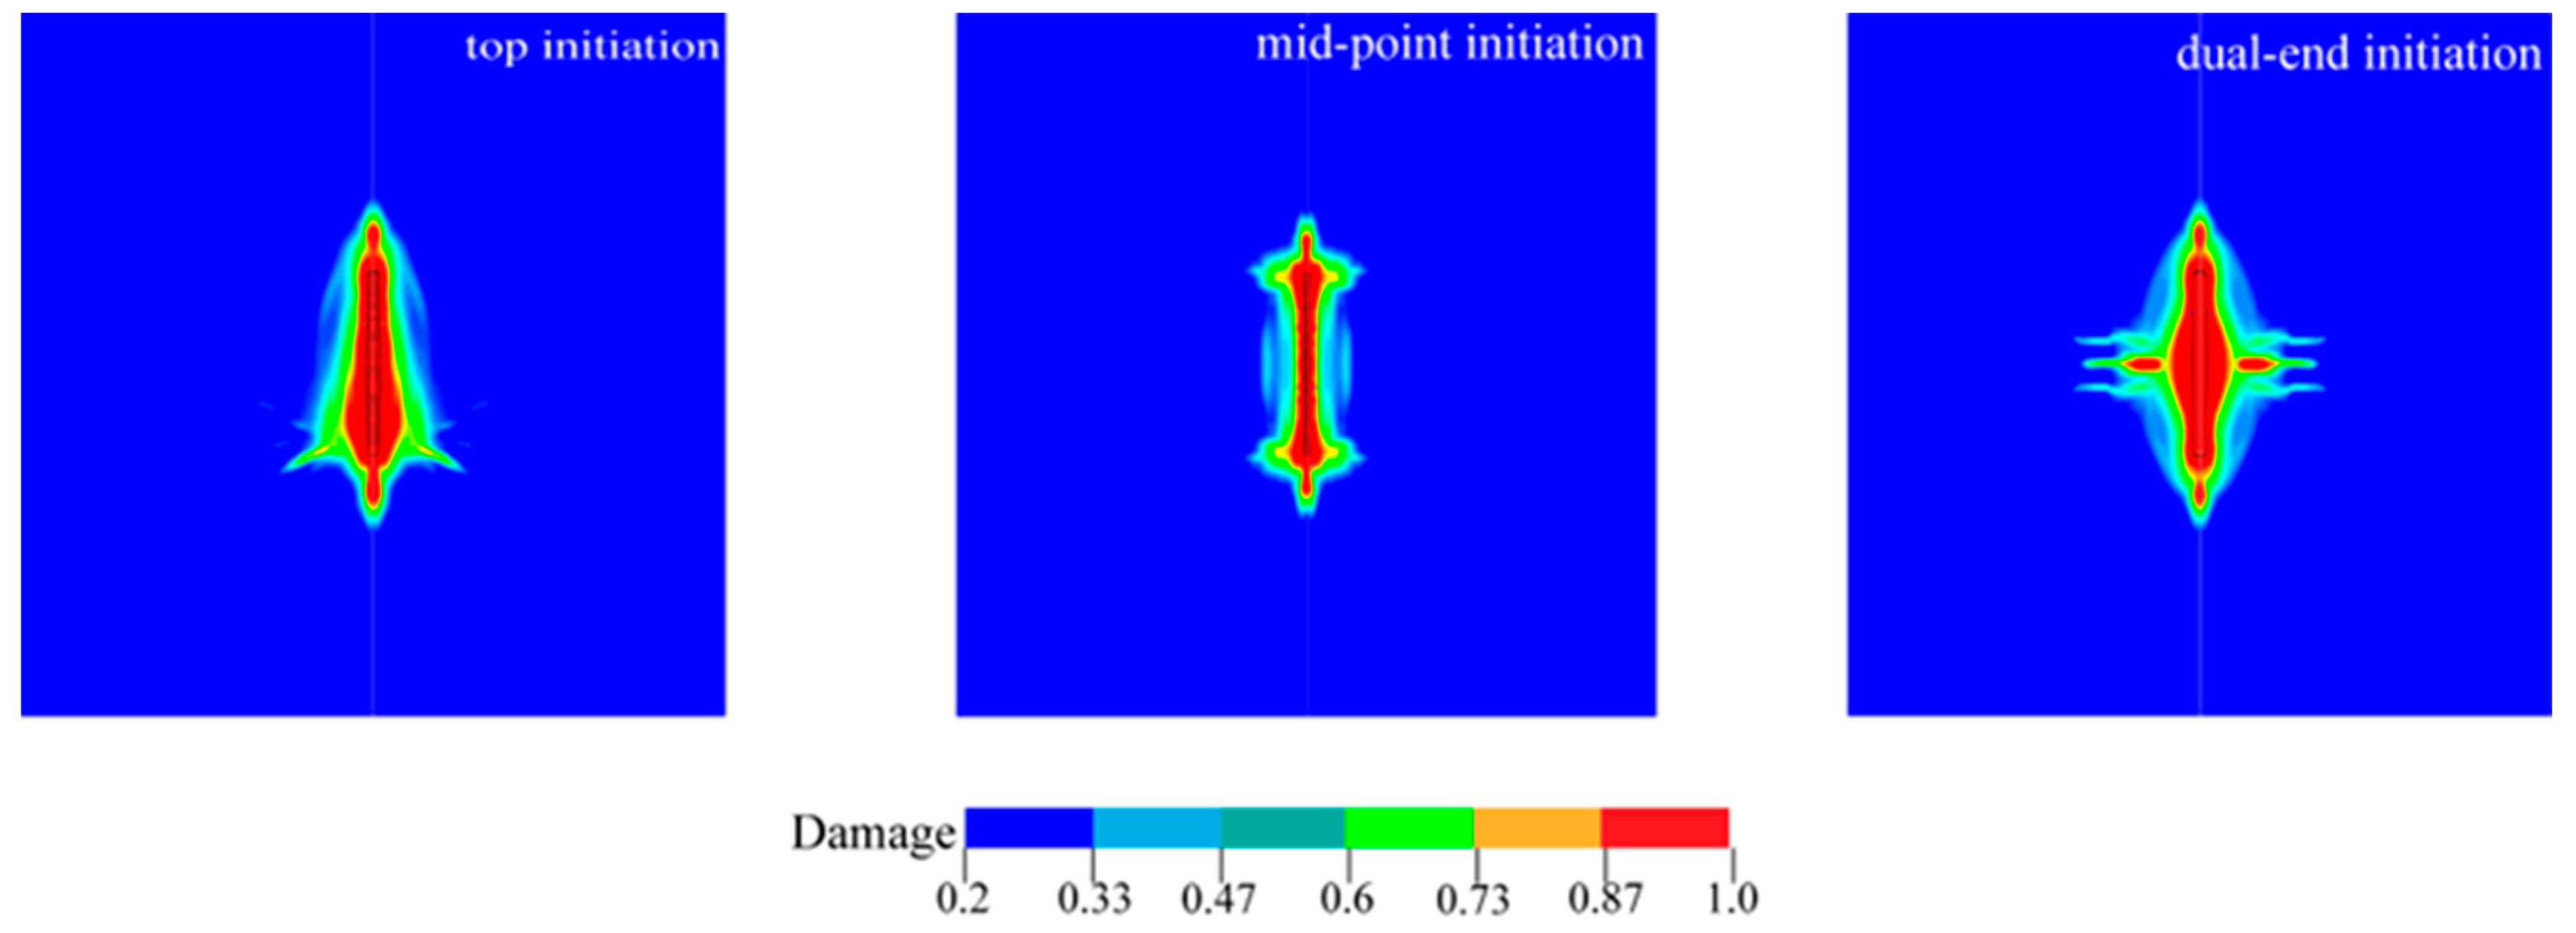
Figure 16 presents the damage distribution contours resulting from cylindrical charges with different initiation points: top initiation, center initiation, and simultaneous dual-end initiation. In the case of top initiation, the damage zone exhibits a distinct conical profile. The stress waves superimpose constructively in the detonation direction, leading to a considerably larger and more intense damage area at the far end of the charge compared to the initiation end. When the charge is initiated at the center, stress waves propagate symmetrically towards both ends. The damage accumulates along these propagation paths, resulting in a relatively uniform and symmetric damage distribution along the entire charge length. For simultaneous dual-end initiation, the damage pattern approximates a spindle shape, with the most extensive and severe damage concentrated at the center of the charge.
These patterns have direct implications for rock fragmentation. With top or bottom initiation, the rock mass in the detonation direction is more intensely fractured than near the initiation end, which may lead to inadequate fragmentation near the initiation point. Center initiation promotes more uniform fragmentation; however, the shorter superposition distance of stress waves limits the overall extent of the damage zone. Conversely, dual-end initiation can cause over-crushing at the charge center, but it generates a larger damage volume compared to the other two methods. From an engineering perspective, bottom initiation can be preferred when stronger rock throw or breakage along the detonation direction is required, whereas top initiation is more suitable vibration control or preventing excessive underbreak near the charge bottom.

5. Conclusions

This paper proposes a semi-analytical solution for the propagation of spherical stress waves and develops a computational model for the stress field of cylindrical charge blasting based on the equivalent spherical charge superposition theory. Using the wave source pressure function introduced by Trivino, the effects of source parameters—such as loading rate, detonation velocity (VOD), and initiation point on blast stress wave propagation and stress field distribution are investigated through theoretical analysis and numerical simulation. The main conclusions are summarized as follows:
(1) The semi-analytical solution reveals that the propagation of spherical stress waves is governed not only by geometric attenuation with distance r , but also by the temporal characteristics of the pressure loading function P ( t ) . The analysis shows that the fitted attenuation index of radial stress decreases from approximately 1.5 to 1 and gradually stabilizes, indicating that when the rise time of the loading function becomes negligible, stress amplitude decays approximately in proportion to 1 / r . A higher loading rate generates stronger near-field compressive stresses, whereas a lower loading rate produces larger far-field tensile stresses.
(2) For cylindrical charge blasting, the stress field exhibits a distinct non-uniform distribution, which is quantitatively governed by both detonation velocity (VOD) and initiation location. The initiation point governs the overall direction of stress wave superposition, while the VOD dictates the degree to which this superposition deviates from the detonation axis. With increasing VOD, the radial stress peak at the borehole wall rises, and the corresponding attenuation index decreases. Concurrently, the zones of high-stress concentration gradually shift from an axial alignment toward the lateral regions. The spatial distribution of these high-stress zones is significantly influenced by the initiation position, as stress waves preferentially propagate and reinforce along the detonation path.
(3) Numerical simulations based on the RHT constitutive model show strong consistency with the theoretical predictions, providing validation of the proposed semi-analytical framework. As the loading rate increases, the main crack propagation length decreases while the number of short cracks around the borehole increases, indicating a transition toward compressive–shear dominated failure. The VOD alters the superposition region of the Mach P-wave; as the VOD increases, the damage zone of cylindrical charge blasting gradually shifts from the axial direction toward the horizontal plane. The initiation location determines the detonation direction and the superposition path of the stress waves, resulting in a characteristic conical distribution of blast damage along the direction of detonation wave propagation.
It should be noted that the proposed semi-analytical model is developed under idealized assumptions, including linear elastic behavior, an infinite full space, the absence of material damping and in situ stresses, and the representation of a cylindrical charge through the superposition of equivalent spherical sources. Consequently, the model is mainly applicable to elastic stress wave propagation and axial stress field characteristics, while near-field crushing, early gas–rock interaction, and complex fracture processes are not fully captured. Future work will focus on extending the framework to account for material damping, three-dimensional in situ stress conditions, and more realistic source representations, so as to improve its applicability to highly confined rock masses.

Author Contributions

C.Z.: Conceptualization, Methodology, Formal analysis, Writing—original draft, Writing—review & editing. X.S.: Supervision. X.Q.: Funding acquisition, Writing—original draft. S.Z.: Formal analysis, Software X.L.: Investigation, Validation. All authors have read and agreed to the published version of the manuscript.

Funding

This study is supported by the National Natural Science Foundation Project of China (Grant Nos. 52374152), the Guangxi Key Research and Development Program (Grant Nos. 2022AB31023). The authors also thank the reviewers for their valuable comments and suggestions.

Institutional Review Board Statement

Declaration of generative AI and AI-assisted technologies in the writing process. During the preparation of this work, the authors used generative AI to improve language. After using this tool, the authors reviewed and edited the content as needed and took full responsibility for the publication’s content.

Data Availability Statement

The original contributions presented in this study are included in the article. Further inquiries can be directed to the corresponding author.

Conflicts of Interest

Xiaoyuan Li was employed by the company Guangxi Zhongjin Lingnan Mining Co., Ltd. The remaining authors declare that the research was conducted in the absence of any commercial or financial relationships that could be construed as a potential conflict of interest.

References

  1. Yi, C.; Sjöberg, J.; Johansson, D.; Petropoulos, N. A numerical study of the impact of short delays on rock fragmentation. Int. J. Rock Mech. Min. Sci. 2017, 100, 250–254. [Google Scholar] [CrossRef]
  2. Zuo, J.; Yang, R.; Ma, X.; Yang, L.; Zhao, Y. Explosion wave and explosion fracture characteristics of cylindrical charges. Int. J. Rock Mech. Min. Sci. 2020, 135, 104501. [Google Scholar] [CrossRef]
  3. Ding, C.; Yang, R.; Lei, Z.; Wang, M.; Zhao, Y.; Lin, H. Fractal damage and crack propagation in decoupled charge blasting. Soil Dyn. Earthq. Eng. 2021, 141, 106503. [Google Scholar] [CrossRef]
  4. Ding, C.; Yang, R.; Chen, C.; Zhu, X.; Feng, C.; Xie, Q. Space-time effect of blasting stress wave and blasting gas on rock fracture based on a cavity charge structure. Int. J. Rock Mech. Min. Sci. 2022, 160, 105238. [Google Scholar] [CrossRef]
  5. Zhang, Z.-X.; Chi, L.Y.; Qiao, Y.; Hou, D.-F. Fracture initiation, gas ejection, and strain waves measured on specimen surfaces in model rock blasting. Rock Mech. Rock Eng. 2021, 54, 647–663. [Google Scholar] [CrossRef]
  6. Zhendong, L.; Wenbo, L.; Ming, C.; Yong, F.; Peng, Y.; Gaohui, W. Explosion energy transmission under side initiation and its effect on rock fragmentation. Int. J. Rock Mech. Min. Sci. 2016, 86, 245–254. [Google Scholar] [CrossRef]
  7. Blake, F., Jr. Spherical wave propagation in solid media. J. Acoust. Soc. Am. 1952, 24, 211–215. [Google Scholar] [CrossRef]
  8. Duvall, W.I. Strain-wave shapes in rock near explosions. Geophysics 1953, 18, 310–323. [Google Scholar] [CrossRef]
  9. Jiang, J.; Blair, D.; Baird, G. Dynamic response of an elastic and viscoelastic full-space to a spherical source. Int. J. Numer. Anal. Methods Geomech. 1995, 19, 181–193. [Google Scholar] [CrossRef]
  10. Blair, D.; Minchinton, A. Near-field blast vibration models. In Proceedings of the 8th International Symposium of Rock Fragmentation by Blasting, Santiago, Chile, 7–11 May 2006; pp. 152–159. [Google Scholar]
  11. Xu, H.; Yang, X.; Zhang, J.; Zhou, J.; Tao, J.; Lu, G. A closed-form solution to spherical wave propagation in triaxial stress fields. Int. J. Rock Mech. Min. Sci. 2020, 128, 104266. [Google Scholar] [CrossRef]
  12. Yi, C.; Johansson, D.; Greberg, J. Effects of in-situ stresses on the fracturing of rock by blasting. Comput. Geotech. 2018, 104, 321–330. [Google Scholar] [CrossRef]
  13. Starfield, A.M.; Pugliese, J.M. Compression waves generated in rock by cylindrical explosive charges: A comparison between a computer model and field measurements. Int. J. Rock Mech. Min. Sci. Geomech. Abstr. 1968, 5, 65–77. [Google Scholar] [CrossRef]
  14. Heelan, P.A. Radiation from a cylindrical source of finite length. Geophysics 1953, 18, 685–696. [Google Scholar] [CrossRef]
  15. Tian, X.; Song, Z.; Wang, J. Study on the propagation law of tunnel blasting vibration in stratum and blasting vibration reduction technology. Soil Dyn. Earthq. Eng. 2019, 126, 105813. [Google Scholar] [CrossRef]
  16. Ye, Z.; Yang, J.; Yao, C.; Zhang, X.; Jiang, S.; Zhou, C. Attenuation characteristics of shock waves in drilling and blasting based on viscoelastic wave theory. Int. J. Rock Mech. Min. Sci. 2023, 171, 105573. [Google Scholar] [CrossRef]
  17. Bai, X.; Cao, A.; Zhang, X.; Qin, X.; Gu, Y.; Li, G.; Xue, C.; Wen, Y. Attenuation and disturbances of surface and coal seam seismic waves caused by ground deep-hole blasting. Soil Dyn. Earthq. Eng. 2026, 200, 109913. [Google Scholar] [CrossRef]
  18. Ahn, J.-K.; Park, D. Prediction of near-field wave attenuation due to a spherical blast source. Rock Mech. Rock Eng. 2017, 50, 3085–3099. [Google Scholar] [CrossRef]
  19. Cho, S.H.; Kaneko, K. Influence of the applied pressure waveform on the dynamic fracture processes in rock. Int. J. Rock Mech. Min. Sci. 2004, 41, 771–784. [Google Scholar] [CrossRef]
  20. Ma, G.W.; An, X.M. Numerical simulation of blasting-induced rock fractures. Int. J. Rock Mech. Min. Sci. 2008, 45, 966–975. [Google Scholar] [CrossRef]
  21. Liu, J.; Zhang, J. Effect of loading waveform on the blasting crack propagation mechanism in single-hole and dual-hole blasting. Eng. Fract. Mech. 2024, 307, 110300. [Google Scholar] [CrossRef]
  22. Liu, K.; Li, X.; Li, X.; Yao, Z.; Shu, Z.; Yuan, M. Characteristics and mechanisms of strain waves generated in rock by cylindrical explosive charges. J. Cent. South Univ. 2016, 23, 2951–2957. [Google Scholar] [CrossRef]
  23. Huo, X.; Qiu, X.; Shi, X.; Chen, H.; Zong, C.; Xie, C. Attenuation characteristics of blasting stress under decoupled cylindrical charge. Rock Mech. Rock Eng. 2023, 56, 4185–4209. [Google Scholar] [CrossRef]
  24. Yang, G.; Qing, L.; Renshu, Y.; Peng, X.; Yong, Z.; Yu, W. Evolution of stress field in cylindrical blasting with bottom initiation. Opt. Lasers Eng. 2020, 133, 106153. [Google Scholar] [CrossRef]
  25. Miklowitz, J. The Theory of Elastic Waves and Waveguides; North Holland: Amsterdam, The Netherlands, 2012. [Google Scholar]
  26. Yi, C.; Johansson, D.; Nyberg, U.; Beyglou, A. Stress wave interaction between two adjacent blast holes. Rock Mech. Rock Eng. 2016, 49, 1803–1812. [Google Scholar] [CrossRef]
  27. Durbin, F. Numerical inversion of Laplace transforms: An efficient improvement to Dubner and Abate’s method. Comput. J. 1974, 17, 371–376. [Google Scholar] [CrossRef]
  28. Jacquot, R.; Steadman, J.; Rhodine, C. The Gaver-Stehfest algorithm for approximate inversion of Laplace transforms. IEEE Circuits Syst. Mag. 1983, 5, 4–8. [Google Scholar] [CrossRef]
  29. Valsa, J.; Brančik, L. Approximate formulae for numerical inversion of Laplace transforms. Int. J. Numer. Modell. Electron. Netw. Devices Fields 1998, 11, 153–166. [Google Scholar] [CrossRef]
  30. Sharpe, J.A. The production of elastic waves by explosion pressures. I. Theory and empirical field observations. Geophysics 1942, 7, 144–154. [Google Scholar] [CrossRef]
  31. Blair, D.P. A comparison of Heelan and exact solutions for seismic radiation from a short cylindrical charge. Geophysics 2007, 72, E33–E41. [Google Scholar] [CrossRef]
  32. Triviño, L.; Mohanty, B.; Munjiza, A. Seismic radiation patterns from cylindrical explosive charges by analytical and combined finite-discrete element methods. In Rock Fragmentation by Blasting-Proceedings of the 9th International Symposium on Rock Fragmentation by Blasting, FRAGBLAST 9; Francis: London, UK, 2009; pp. 415–426. [Google Scholar]
  33. Jong, Y.; Lee, C.-I.; Jeon, S.; Cho, Y.-D.; Shim, D.-S. Performance assessment of the circular-cut blasting by numerical analysis. Geosyst. Eng. 2004, 7, 75–82. [Google Scholar] [CrossRef]
  34. Blair, D. Wall control blasting. In Proceedings of the 11th International Symposium on Rock Fragmentation by Blasting, Sydney, Australia, 24–26 August 2015; pp. 13–26. [Google Scholar]
  35. Aldridge, D.F. Elastic Wave Radiation from a Pressurized Spherical Cavity; Sandia National Lab. (SNL-NM): Albuquerque, NM, USA; Sandia National Lab. (SNL-CA): Livermore, CA, USA, 2002. [Google Scholar]
  36. Rossmanith, H.; Uenishi, K.; Kouzniak, N. Blast wave propagation in rock mass—Part I: Monolithic medium. Fragblast 1997, 1, 317–359. [Google Scholar] [CrossRef]
  37. Silva, J.; Worsey, T.; Lusk, B. Practical assessment of rock damage due to blasting. Int. J. Min. Sci. Technol. 2019, 29, 379–385. [Google Scholar] [CrossRef]
  38. Zhang, S.; Shi, X.; Qiu, X.; Zong, C.; Yu, Z. Influence of free surface width on blasting damage in open stope mining in narrow vein orebodies. Int. J. Rock Mech. Min. Sci. 2025, 194, 106194. [Google Scholar] [CrossRef]
  39. Huo, X.; Yu, Z.; Qiu, X.; Shi, X. Investigation of water-coupling presplit blasting considering the role of stress wave parameters. Eng. Fract. Mech. 2025, 321, 111067. [Google Scholar] [CrossRef]
  40. Li, X.; Liu, K.; Qiu, T.; Sha, Y.; Yang, J. Study of presplit blasting under high in-situ stress. Eng. Fract. Mech. 2023, 288, 109360. [Google Scholar] [CrossRef]
  41. Ding, J.; Yang, J.; Ye, Z.; Leng, Z.; Zhou, C. Numerical study on rock blasting assisted by in-situ stress redistribution. Tunn. Undergr. Space Technol 2024, 153, 106022. [Google Scholar] [CrossRef]
  42. Liu, W.; Jia, Y.; Yuan, F.; Jiang, N.; Xie, Q.; Liu, X. Dynamic evolution mechanism of cracks in eccentric decoupled charge blasting under high in-situ stress in rock mass. Eng. Fail. Anal. 2025, 180, 109909. [Google Scholar] [CrossRef]
  43. Dehghan Banadaki, M.M.; Mohanty, B. Numerical simulation of stress wave induced fractures in rock. Int. J. Impact Eng. 2012, 40–41, 16–25. [Google Scholar] [CrossRef]
  44. Ding, J.; Yang, J.; Ye, Z.; Leng, Z.; Yao, C.; Zhou, C. Cut-Blasting Method Selection and Parameter Optimization for Rock Masses under High In Situ Stress. Int. J. Geomech. 2023, 23, 04023211. [Google Scholar] [CrossRef]
Figure 1. Stress wave propagation in spherical coordinates.
Applsci 16 01938 g001
Figure 2. Comparison between the semi-analytical solution and Aldridge’s analytical solution: (a) radial stress-time history; (b) hoop stress stress-time history.
Applsci 16 01938 g002
Figure 3. Comparison between the semi-analytical solution and Blair’s analytical solution: (a) radial stress-time history; (b) hoop stress stress-time history.
Applsci 16 01938 g003
Figure 4. The semi-analytical solution of Trivino’s pressure function: (a) radial stress-time history; (b) hoop stress stress-time history.
Applsci 16 01938 g004
Figure 5. Construction of the cylindrical charge stress field calculation model.
Applsci 16 01938 g005
Figure 6. Stress wave time histories at different positions under various loading rates: (a) radial stress; (b) hoop stress.
Applsci 16 01938 g006
Figure 7. Attenuation exponent under different loading rates: (a) fitting of the attenuation exponent; (b) variation trend of the attenuation exponent with loading rate.
Applsci 16 01938 g007
Figure 8. Radial stress time histories at different positions under varying detonation velocities.
Applsci 16 01938 g008
Figure 9. Peak radial pressure at the blasthole wall and attenuation index of peak radial pressure under varying detonation velocities.
Applsci 16 01938 g009
Figure 10. Contour plots of principal stress under different V O D s : (a) maximum principal stress (positive); (b) minimum principal stress (negative).
Applsci 16 01938 g010
Figure 11. Distributions of principal stresses under different initiation positions: (a) maximum principal stress (positive); (b) minimum principal stress (negative).
Applsci 16 01938 g011
Figure 12. Numerical simulation models: (a) loading rate model; (b) single-hole cylindrical charge model.
Applsci 16 01938 g012
Figure 13. Numerical simulation results of blast induced crack propagation under different loading rates.
Applsci 16 01938 g013
Figure 14. Equivalent stress contours at t = 300   μ s under different VODs.
Applsci 16 01938 g014
Figure 15. Damage distribution contours for cylindrical charge blasting under different VODs.
Applsci 16 01938 g015
Figure 16. Damage distribution contours for cylindrical charge blasting under different initiation points.
Applsci 16 01938 g016
Table 1. Multiple wave source pressure functions and their literature sources.
FunctionsReferences
P ( t ) = P 0 e α t Blake [7]
P ( t ) = P 0 e α t e β t Duvall [8]
P ( t ) = P V N e γ / n n H t t n e γ t Blair [32]
P ( t ) = P V N P u t P d t Trivino [33]
P ( t ) = 4 P 0 e δ t / 2 e 2 δ t Jong [34]
P ( t ) = P 0 e / n n 1 1 + 1000 m β t n m 1 β t e β t Blair [35]
Table 2. The RHT model parameters.
ParameterValueParameterValue
Density ρ 0 (kg/m3)2630Lode angle dependence factor B 0.01
Elastic shear Modulus G (GPa)10.68Failure surface parameter A 1.6
Parameter for polynomial EOS B 0 1.68Failure surface parameter N 0.61
Parameter for polynomial EOS B 1 1.68Compressive strain rate dependence exponent 0.032
Parameter for polynomial EOS T 1 (GPa)2.41Tensile strain rate dependence exponent 0.036
Parameter for polynomial EOS T 2 (GPa)0Compressive yield surface parameter 0.53
Hugoniot polynomial coefficient A 1 (GPa)24.1Tensile yield surface parameter 0.7
Hugoniot polynomial coefficient A 2 (GPa)40.5Shear modulus reduction factor 0.5
Hugoniot polynomial coefficient A 3 (GPa) 24.8Residual surface parameter A F 1.6
Crush pressure (MPa) 115.6Residual surface parameter N F 0.61
Compaction pressure (GPa)6Damage parameter D 1 0.04
Compressive strength f c (MPa) 34.7Damage parameter D 2 1.0
Relative shear strength f s * 0.18Minimum damaged residual strain epnn0.01
Relative tensile strength f t * 0.03Porosity exponent N P 3
Lode angle dependence factor Q 0 0.68Initial porosity1.0
Table 3. The JWL equation parameters of explosive.
DensityVOD (m/s) PCJ (GPa)A (GPa)B (GPa)R1R2 ω E0 (KJ/m2)
132066901658621.65.811.770.2827.38 × 106
Disclaimer/Publisher’s Note: The statements, opinions and data contained in all publications are solely those of the individual author(s) and contributor(s) and not of MDPI and/or the editor(s). MDPI and/or the editor(s) disclaim responsibility for any injury to people or property resulting from any ideas, methods, instructions or products referred to in the content.