Article

LED Illumination for Fluorescence-Based Lesion Observation Using a Balanced Beam Diffusion and Concentration Approach

1
Department of Radiological Science, Dongnam Health University, 50 Cheoncheon-ro 74 gil, Jangan-gu, Suwon 16328, Republic of Korea
2
Division of Medical Oncology, Gachon Biomedical Convergence Institute, Gachon University Gil Medical Center, Incheon 21565, Republic of Korea
3
Medical Devices R&D Center, Gachon University Gil Medical Center, 21, 774 beon-gil, Namdong-daero, Namdong-gu, Incheon 21565, Republic of Korea
4
Department of Surgery, Gachon University Gil Medical Center, 21, 774 beon-gil, Namdong-daero, Namdong-gu, Incheon 21565, Republic of Korea
5
Department of Electronic Engineering, Gyeonggi University of Science and Technology, 269 Gyeonggigwagi-dearo, Siheung City 15073, Republic of Korea
6
KMAIN Co., Ltd., Seongnam 13355, Republic of Korea
7
Department of Surgery, College of Medicine, Gachon University, #38-13, Dokjom-ro 3 bean-gil, Namdong-gu, Incheon 21565, Republic of Korea
8
Department of Biomedical Engineering, Gachon University, 1342 Seongnamdaero, Sujeong-gu, Seongnam 13120, Republic of Korea
9
Department of Health Sciences and Technology, Gachon Advanced Institute for Health Sciences and Technology (GAIHST), Gachon University, 38-13, 3 Dokjom-ro, Namdong-gu, Incheon 21565, Republic of Korea
*
Authors to whom correspondence should be addressed.
These authors contributed equally to this work.
Appl. Sci. 2026, 16(4), 1753; https://doi.org/10.3390/app16041753
Submission received: 18 December 2025 / Revised: 4 February 2026 / Accepted: 5 February 2026 / Published: 10 February 2026

Abstract

Fluorescence emission-guided blood flow and lymph node location detection are important observation methods in cancer removal surgery, where near-infrared LED illumination is used to induce fluorescence emission. However, conventional LED light sources have narrow beam widths, resulting in a limited excitation area and a restricted field of view (FOV). In this study, we propose a balanced optical illumination module that combines a beam-focusing condenser lens and a beam-diffusing lens to expand the beam width while efficiently redistributing optical energy. When only the LED was used, the beam diameter and central irradiance were 4.0 cm and 1.43 mW/cm2, respectively. With the condenser lens, the beam diameter remained nearly unchanged (3.98 cm), while the central irradiance decreased to 0.91 mW/cm2. When the condenser was combined with the proposed diffuser structure, the beam diameter increased to 14.1 cm, corresponding to an approximately 3.5-fold expansion, while the central irradiance was measured at 0.72 mW/cm2, reflecting the redistribution of optical energy from an initially Gaussian-like irradiance distribution into a wider and more uniform illumination area. This irradiance level exceeds the minimum threshold of 0.6 mW/cm2 required to induce fluorescence emission, as defined for the experimental working distance of 30 cm and LED power of 200 mW. By integrating the irradiance distributions of both the bare LED and the proposed structure over their respective illuminated surfaces, the measured total power is physically consistent with energy conservation, showing an expected transmission loss of 18.8% due to optical absorption and scattering. These results demonstrate that the proposed beam diffusion-concentration approach provides an effective and practical solution for wide-field fluorescence-guided lesion observation during cancer removal surgery.

1. Introduction

Clear discrimination of blood vessels, lymph nodes, and cancerous tissue is essential for safe and accurate cancer surgery. However, because these tissues exhibit similar colors under normal illumination, reliable visual differentiation is difficult. As a result, fluorescence emission-guided camera imaging and monitoring have been widely adopted as a representative visual observation method [1].
A fluorescent contrast agent, indocyanine green (ICG), is used, and the lesion (identification of blood circulation status of blood vessels or location and quantity of lymph nodes) is stained through intravascular injections. When a light source with an excitation wavelength (λext: 780–785 nm) is irradiated onto the stained lesion, fluorescence emission (λem: 805–860 nm) is generated from the stained lesion, allowing for monitoring of the lesion in fluorescent color using a near-infrared (NIR) camera (Lumenera Lt-225M-NIR, Lumenera Corporation, Ottawa, ON, Canada) [2]. However, inducing fluorescence emission requires not only a high-resolution camera but also sufficient irradiance of the excitation light at the tissue surface. An irradiance of at least 80 mW/cm2, with an average value of approximately 200 mW/cm2, is required to effectively excite the fluorescently stained lesion [3]. Finally, the light source must illuminate the entire lesion to ensure a clear field of view for monitoring through fluorescence emission.
The most crucial factor here is a wide beam width and sufficient irradiance (mW/cm2) at the lesion surface to enable fluorescence emission [4]. However, most light sources used to induce fluorescence emission utilize light-emitting diodes (LEDs). These light sources offer a wide beam width but relatively low light intensity. Therefore, even LEDs with relatively narrow beams can often provide sufficient intensity to induce fluorescence emission [3,4].
Accordingly, this study focuses on methods to minimize beam intensity reduction while widening the beam width, thereby expanding the fluorescence-based monitoring field of view.
Various methods for widening the beam width have been introduced [5,6,7,8,9,10,11,12,13,14]. Minimizing beam intensity and widening the beam width by increasing the number of LEDs can cause unpredictable phenomena in the overlapping and non-overlapping areas of the LED beams due to the large number of LEDs [5]. Specifically, the LED beam irradiation process generates stepped light, less bright light, and resulting shadow areas, resulting in inconsistent brightness differences that interfere with the lesion field of view. Furthermore, the increased power consumption, size, and unit price associated with a large number of LEDs necessitate improvements [6]. It is believed that matrix-arranged LEDs exceed the power level required for surgery [6]. This is because they present a challenge for operating room applications due to unnecessary energy consumption and high manufacturing costs, making it difficult to control the light source movement radius and WD. A method to reflect the geometric structural analysis to secure a monitoring area by irradiating a wide beam intensity can be done by applying a precise analysis (Monge-Ampère type first-order partial differential equation and second-order nonlinear partial differential equation) to the curvature located on the LED surface [11,12]. However, the precise analysis method may be difficult to recommend due to the complexity of the structural analysis method and design method [8]. The method of applying a total internal reflection lens can expand the beam width by more than about 90% through ray mapping [13]. However, the mathematical analysis process is complicated. In addition, the LED beam distribution only occurs in a specific irradiation area [8]. For this reason, a very delicate manufacturing process will be required.
A design method that induces a beam distribution in all directions by combining a Fresnel lens and a micro lens has the advantage of not requiring a change in the LED design method or a separate semiconductor process because the Fresnel lens and the micro lens are individually connected [14]. However, the process of connecting components can be complex, and external light can enter the system through the gaps between the components, which can degrade the beam distribution performance of the LED [8]. Coupling loss can occur between the gaps between the components, which can reduce the intensity of the beam [8]. These problems need to be sufficiently considered to achieve the purpose of this study. In addition, if it is to be used in the operating room, only the necessary area needs to be monitored, so the beam intensity and beam width can be increased as needed. This paper contributes to ensuring sufficient effectiveness of fluorescence emission power by widening the beam width and minimizing the beam intensity loss as the beam width is widened. In other words, we analyze the method of widening the beam intensity region by combining diffusion and focusing phenomena for combining a diffuser and a beam condenser, and elucidate the principle.

2. Methods of Beam Spreading and Intensity Increasing

2.1. Fluorescence Emission Guided Tissue Observation

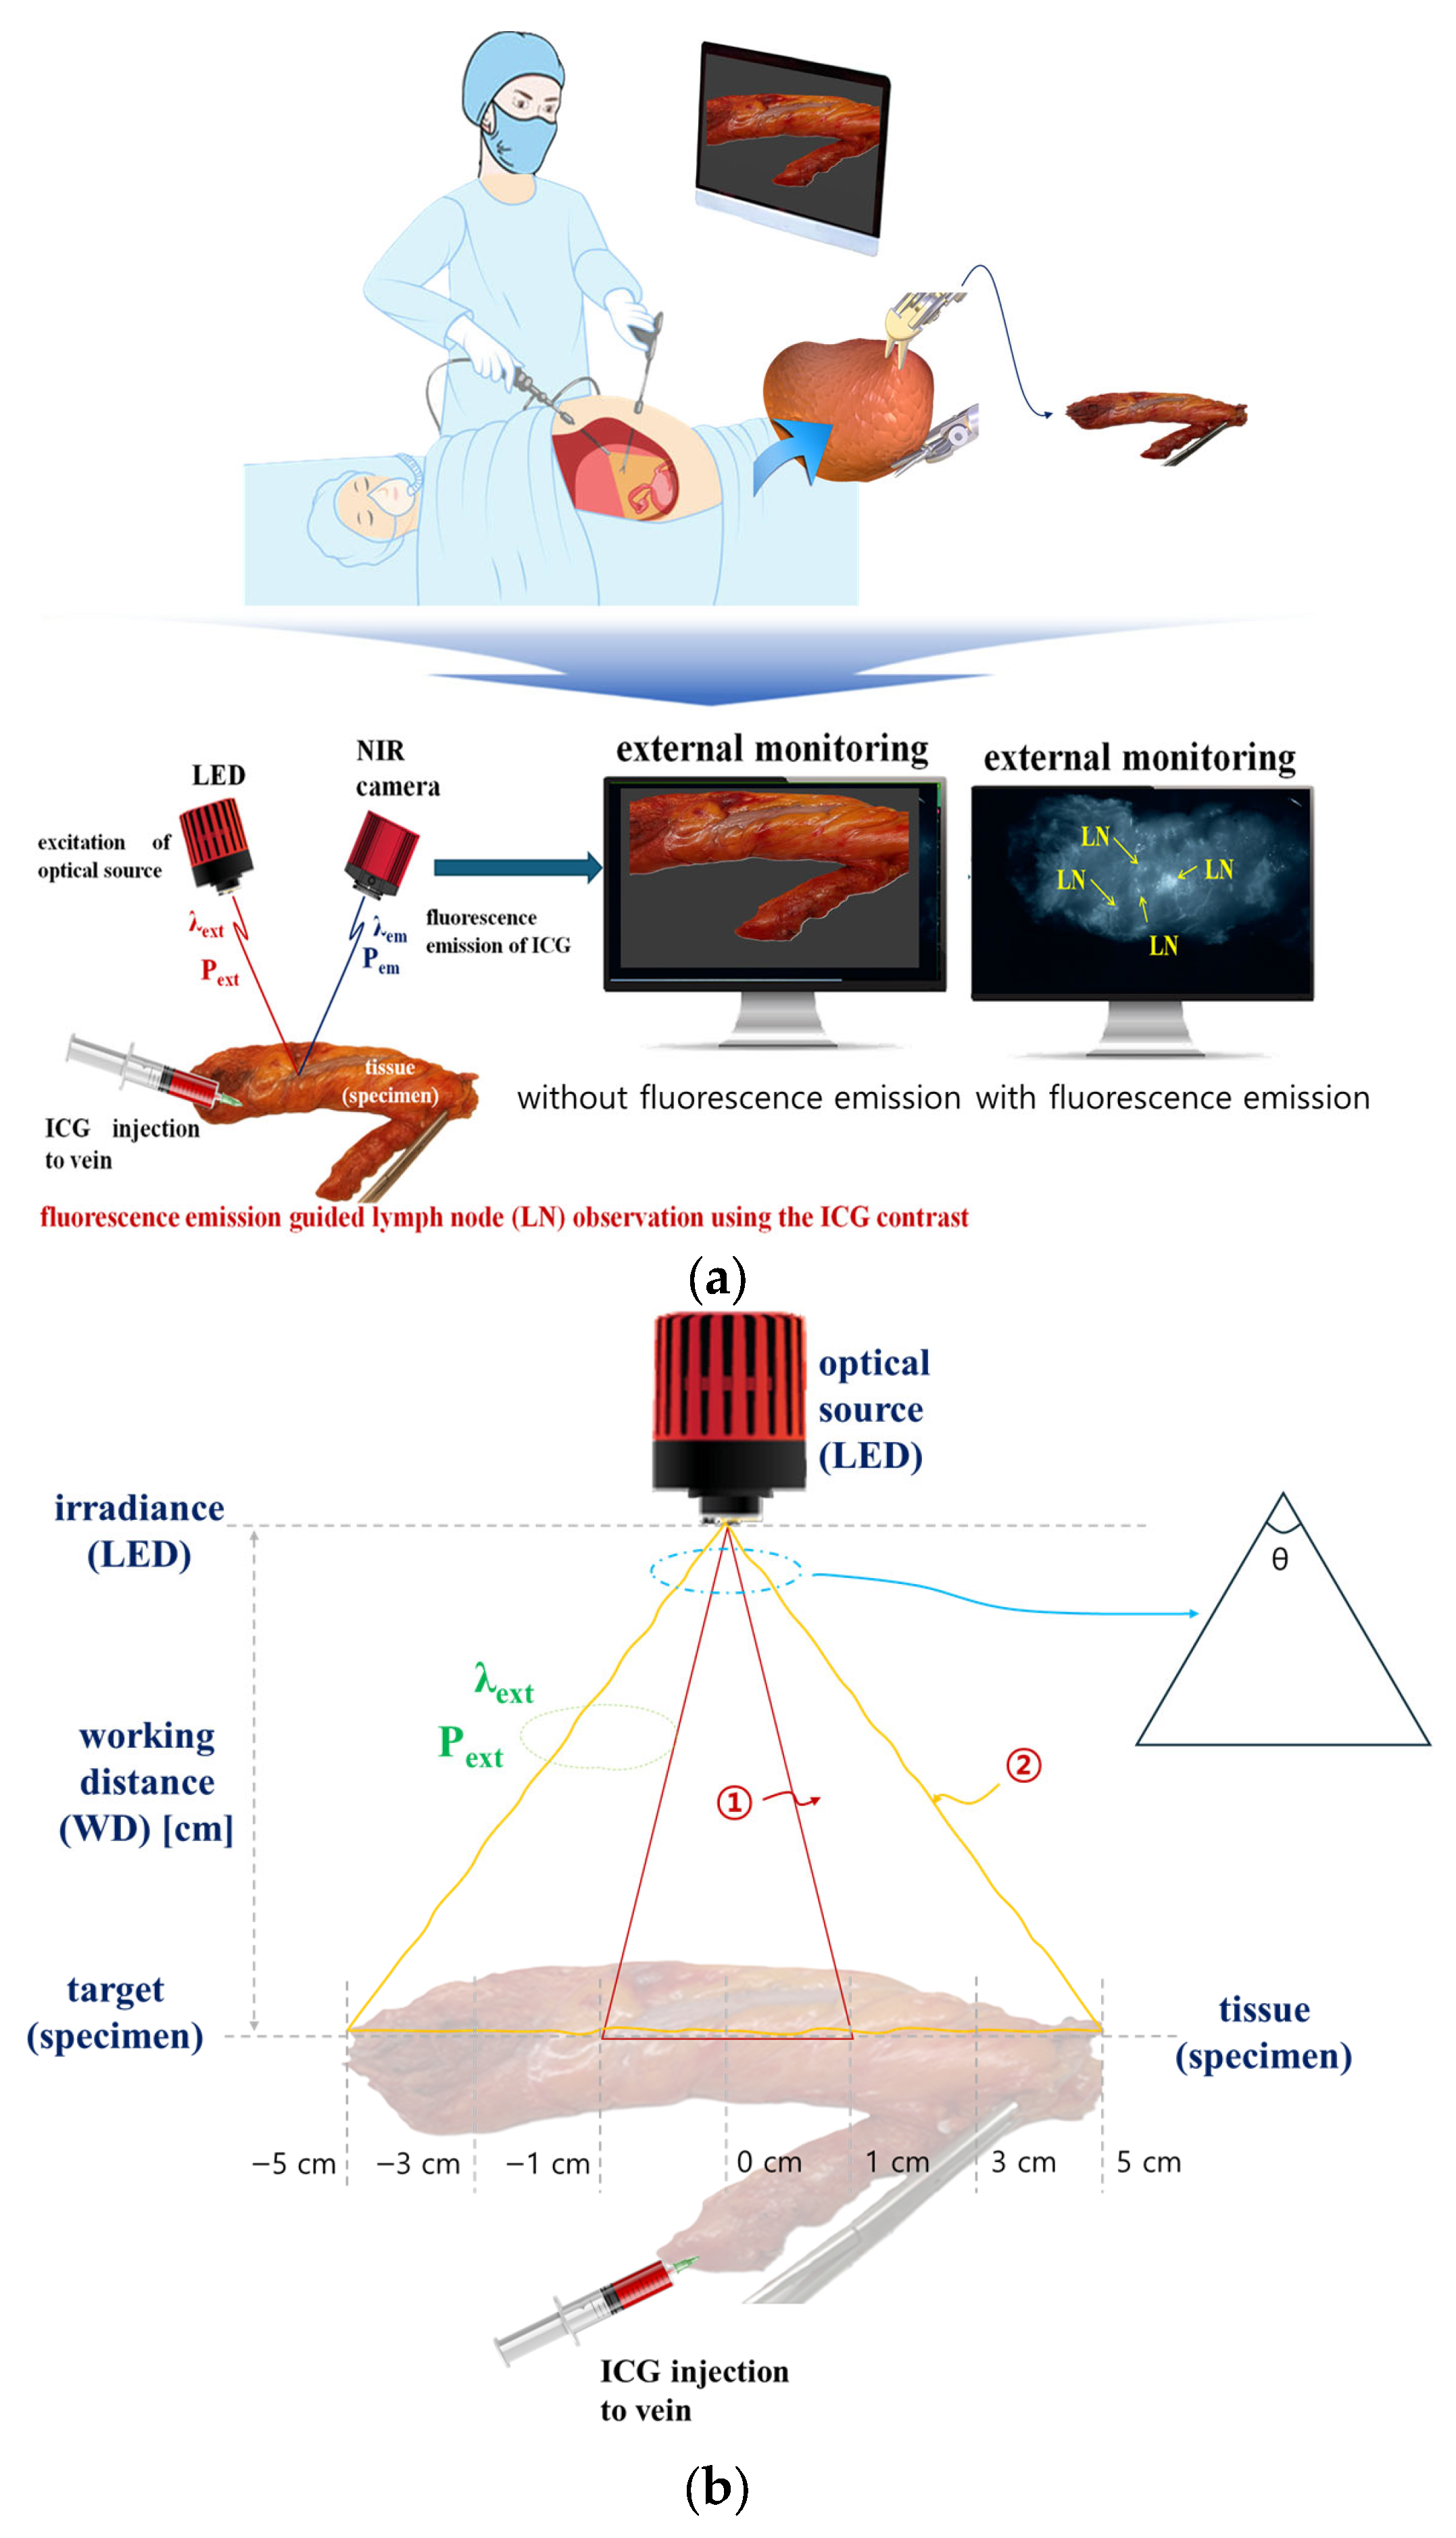
In colorectal cancer resection surgery, the excised specimen is illuminated with an LED (M780L3, Thorlabs, Inc., Newton, NJ, USA), as shown in Figure 1a, to identify lymph nodes. Fluorescence emission-guided camera imaging is then performed using a near-infrared camera (Lt-225M-NIR, Lumenera Corporation, Ottawa, ON, Canada), and the images are displayed on a monitor (NT350XCR laptop, Samsung Electronics Co., Ltd., Suwon, Gyeonggi-do, Republic of Korea) for external monitoring, enabling color-based visualization of lymph node morphology and location. Indocyanine green (25 mg, CellBion Co., Ltd., Seoul, Republic of Korea) was used as the fluorescent contrast agent.
In colorectal cancer resection surgery, the excised specimen is illuminated with an LED (M780L3, Thorlabs, Inc., Newton, NJ, USA), as shown in Figure 1a, to identify lymph nodes. Fluorescence emission guided camera imaging is then performed for external monitoring, enabling color-based visualization of lymph node morphology and location.
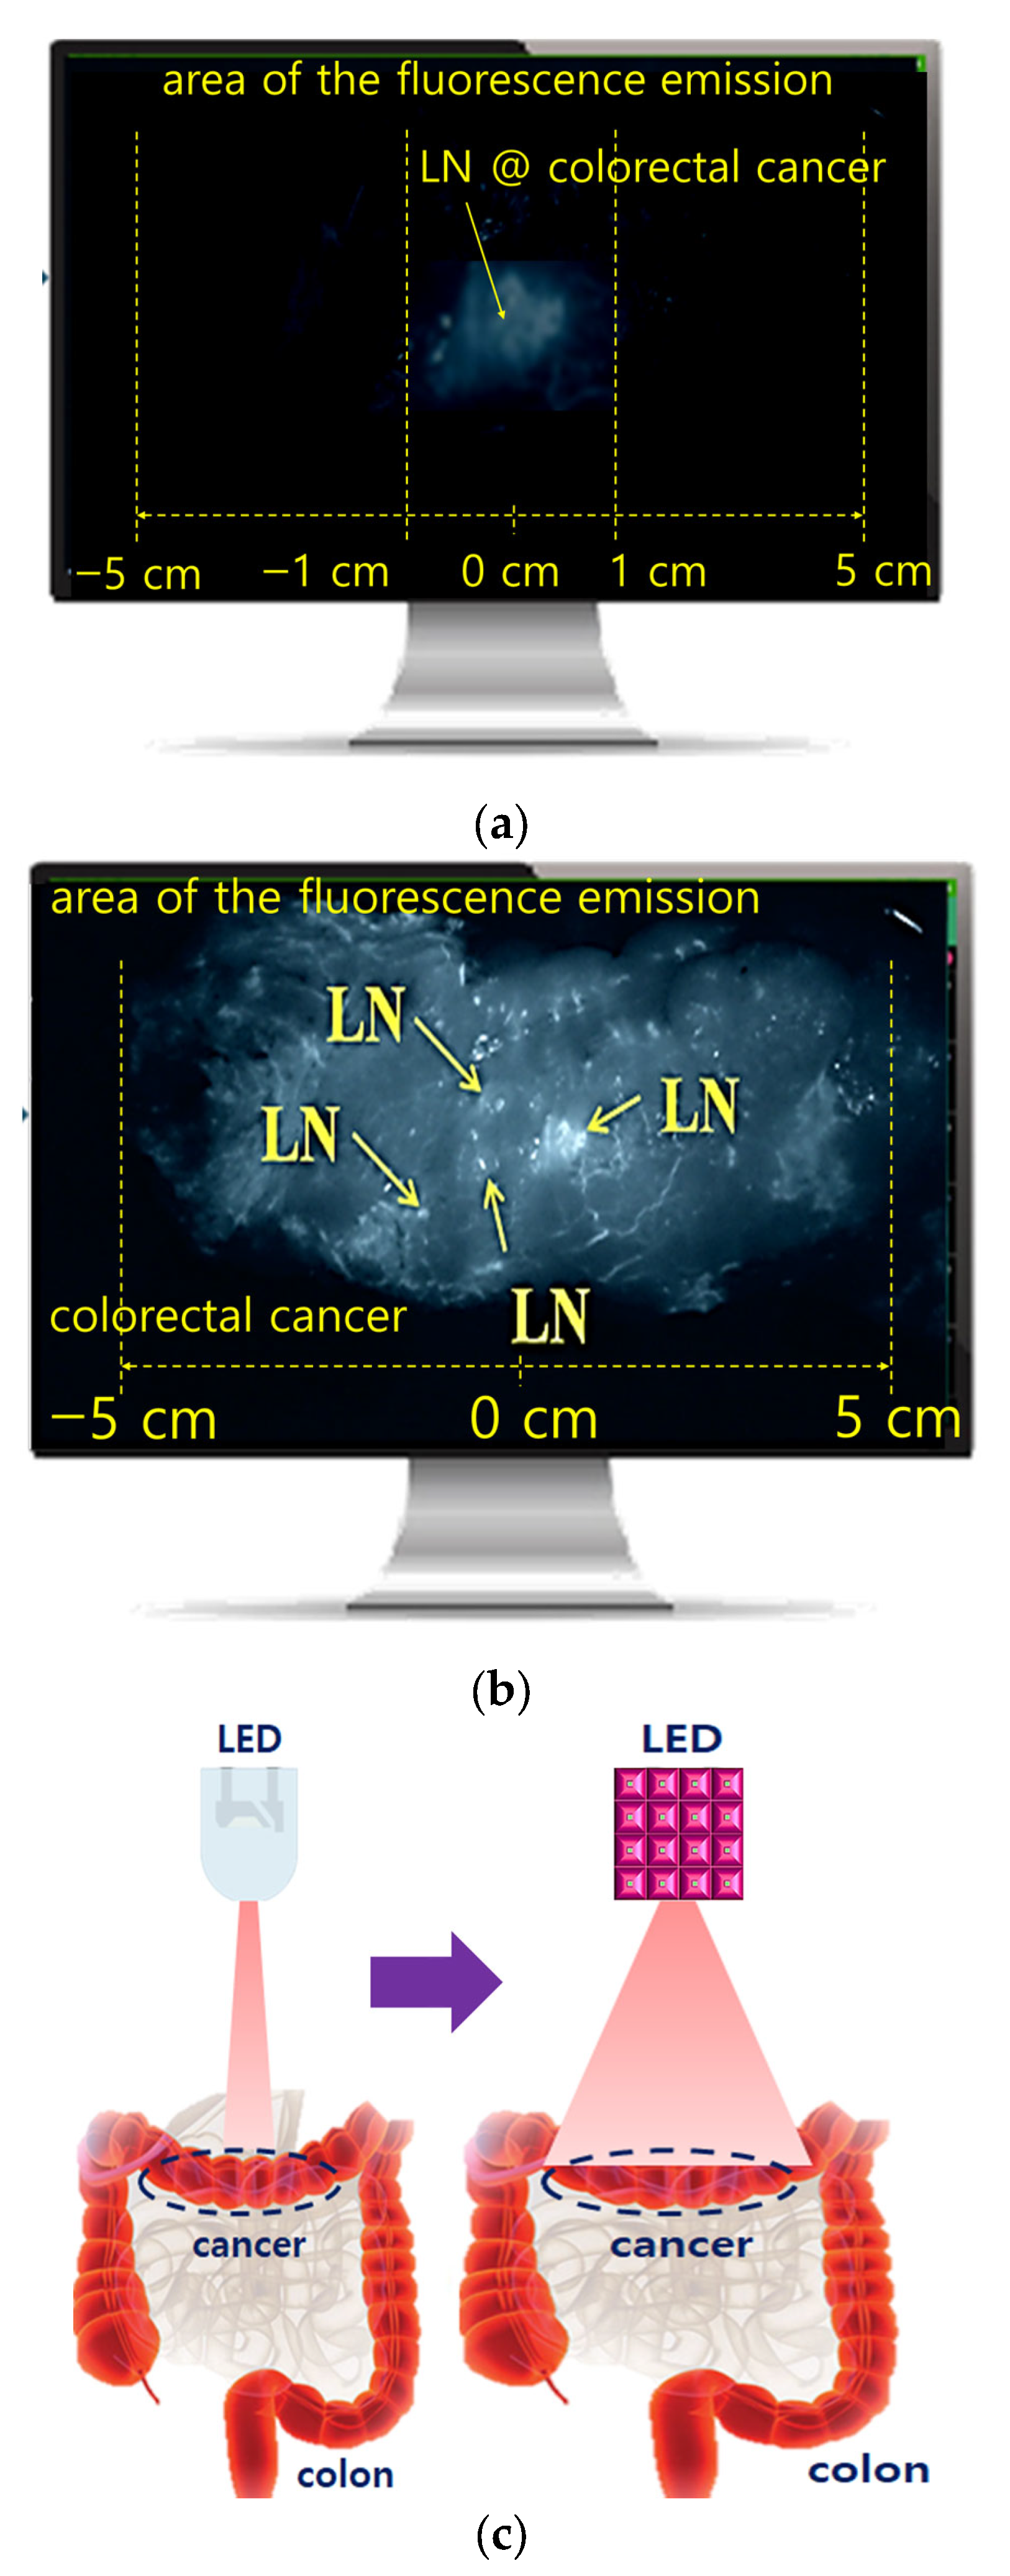
As shown in Figure 1b, under the same working distance (WD), lymph node observation is possible within a range proportional to the LED illumination angle due to fluorescence emission. When the irradiation angle (θ) is 10°, as indicated by ①, the observable area is limited to approximately 2 cm. In contrast, increasing the irradiation angle (θ) to 60° expands the observable area to approximately 10 cm, as indicated by ②. Therefore, as shown in Figure 2a, the observation field of view for fluorescence emission-guided lymph node imaging is limited to approximately 2 cm.
Conversely, increasing the LED illumination angle expands the observable area to approximately 10 cm, as shown in Figure 2b, enabling a field of view more than five times larger. However, this approach results in weakened fluorescence emission due to a decrease in beam intensity associated with the increased illumination angle.
Furthermore, increasing the number of LEDs, as shown in Figure 2c, leads to higher unit costs and increased power consumption. Therefore, a new approach is required to expand the fluorescence emission-guided observation field of view without increasing either the number of LEDs or the illumination angle.

2.2. Increasing of Beam Width and Beam Intensity

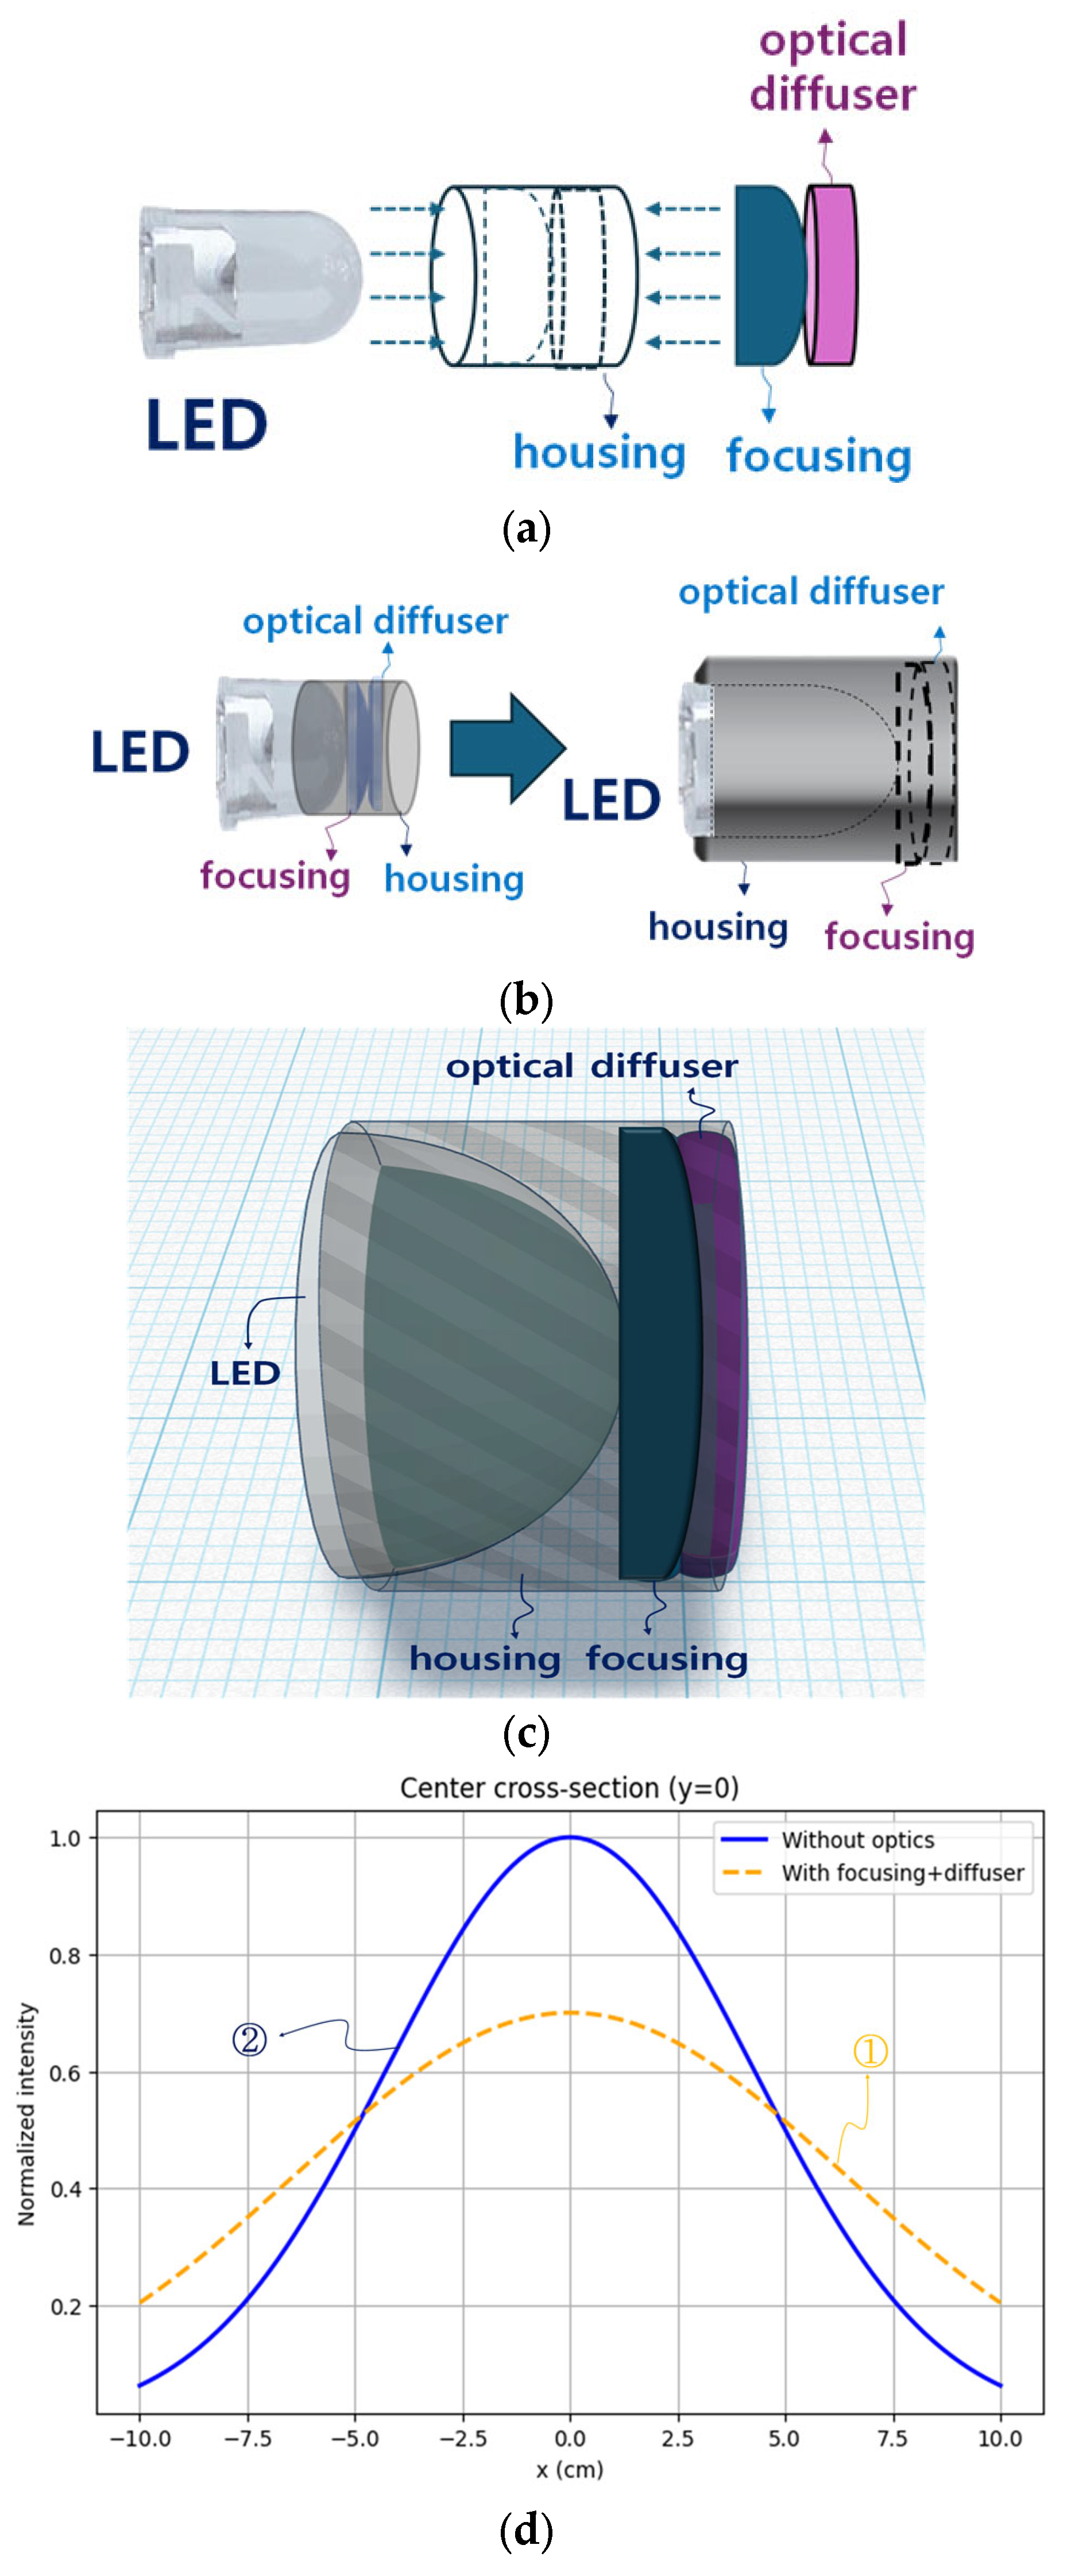
Methods to increase the beam width while minimizing the decrease in local intensity are shown in Figure 3. These methods include a structure for widening the LED beam width through controlled beam spreading via optical refraction and focusing effects, a structure for minimizing intensity loss through a focusing effect, and a housing structure. The housing is fabricated using 3D printing.
Figure 3a shows the process of connecting the LED, focusing element, and diffuser through the housing. Figure 3b illustrates the assembled state after the connections are completed, and Figure 3c presents the fully assembled 3D structure.
Figure 3d compares the beam distribution of a single LED before and after applying the optical components. As the beam divergence angle increases, the illuminated area A on the target plane increases proportionally, resulting in a decrease in irradiance according to Equation (1) [15].
E = Φ e A
where Φe is the total radiant flux of the LED and A is the illuminated area determined by the working distance and divergence angle. Thus, beam widening redistributes the same radiant flux over a larger area rather than increasing the optical power. In contrast, the dashed line (orange, ①) shows the beam width of the LED combined with a beam focusing lens and a diffuser lens. The peak intensity is approximately 0.7, which is lower than that of the LED alone, but the beam spreads more widely. However, as long as sufficient fluorescence emission is generated, the beam intensity remains adequate to induce broad fluorescence, thereby securing a wider field of view for lesion observation, which can be advantageous in clinical applications.
In this study, all optical quantities are described using radiometric definitions, as the excitation wavelength (780 nm) lies outside the visible range. Radiant flux (Φe, mW) denotes the total optical power emitted by the LED. Irradiance (E, mW/cm2) denotes the radiant flux incident per unit area on the target plane. Radiance (Le, mW·sr−1·cm−2) is a conserved quantity in lossless optical systems and governs the redistribution of optical power through lenses and diffusers.
The term “intensity” is avoided throughout this manuscript to prevent ambiguity, except where otherwise stated. For clarity, the relationship between radiometric and photometric quantities is briefly summarized. In general, luminous flux (Φv) is related to radiant flux (Φe) by Equation (2) [16].
Φ v = K m Φ e λ d λ
where Km = 683 lm/W is the maximum luminous efficacy and   V ( λ ) is the photopic luminous efficiency function. This equation shows that photometric quantities are weighted by the human eye sensitivity function. Because the excitation wavelength used in this study (780 nm) lies outside the photonic response range, photometric quantities such as lumen, candela, and luminance are not physically meaningful in this context. Therefore, all analyses in this work are strictly based on the radiometric quantities listed in Table 1.
In conventional lighting engineering, the angular emission of a light source is commonly described using luminous intensity distribution curves (LIDC), which represent the variation in luminous intensity (cd) as a function of angle. However, since the present system operates in the near-infrared region, a radiometric beam profile, including irradiance and radiance distributions, is used instead of LIDC, as summarized in Table 2.
Radiometric quantities used in this study are defined as follows. Radiant flux (Φe, mW) represents the total optical power emitted by the LED. Irradiance (E, mW/cm2) represents the radiant flux incident per unit area on the target plane. In this study, all experimental results are reported in terms of irradiance rather than luminous intensity, as the excitation wavelength (780 nm) lies outside the photonic response range.
To quantitatively describe the angular spread and irradiance distribution of the beam formed when light emitted from an LED passes through a diffuser and a lens with light-collecting and diffusing properties, a step-by-step analytical procedure is presented based on Equations (3)–(8). In Equation (3), the LED emitting plane is modeled as an ideal Lambertian emitter, which serves as a key assumption for determining the beam divergence by relating the radiant luminance to cos (θ).
For a Lambertian LED source, the angular radiance distribution is given by Equation (3).
L ( θ ) = L 0 c o s   θ
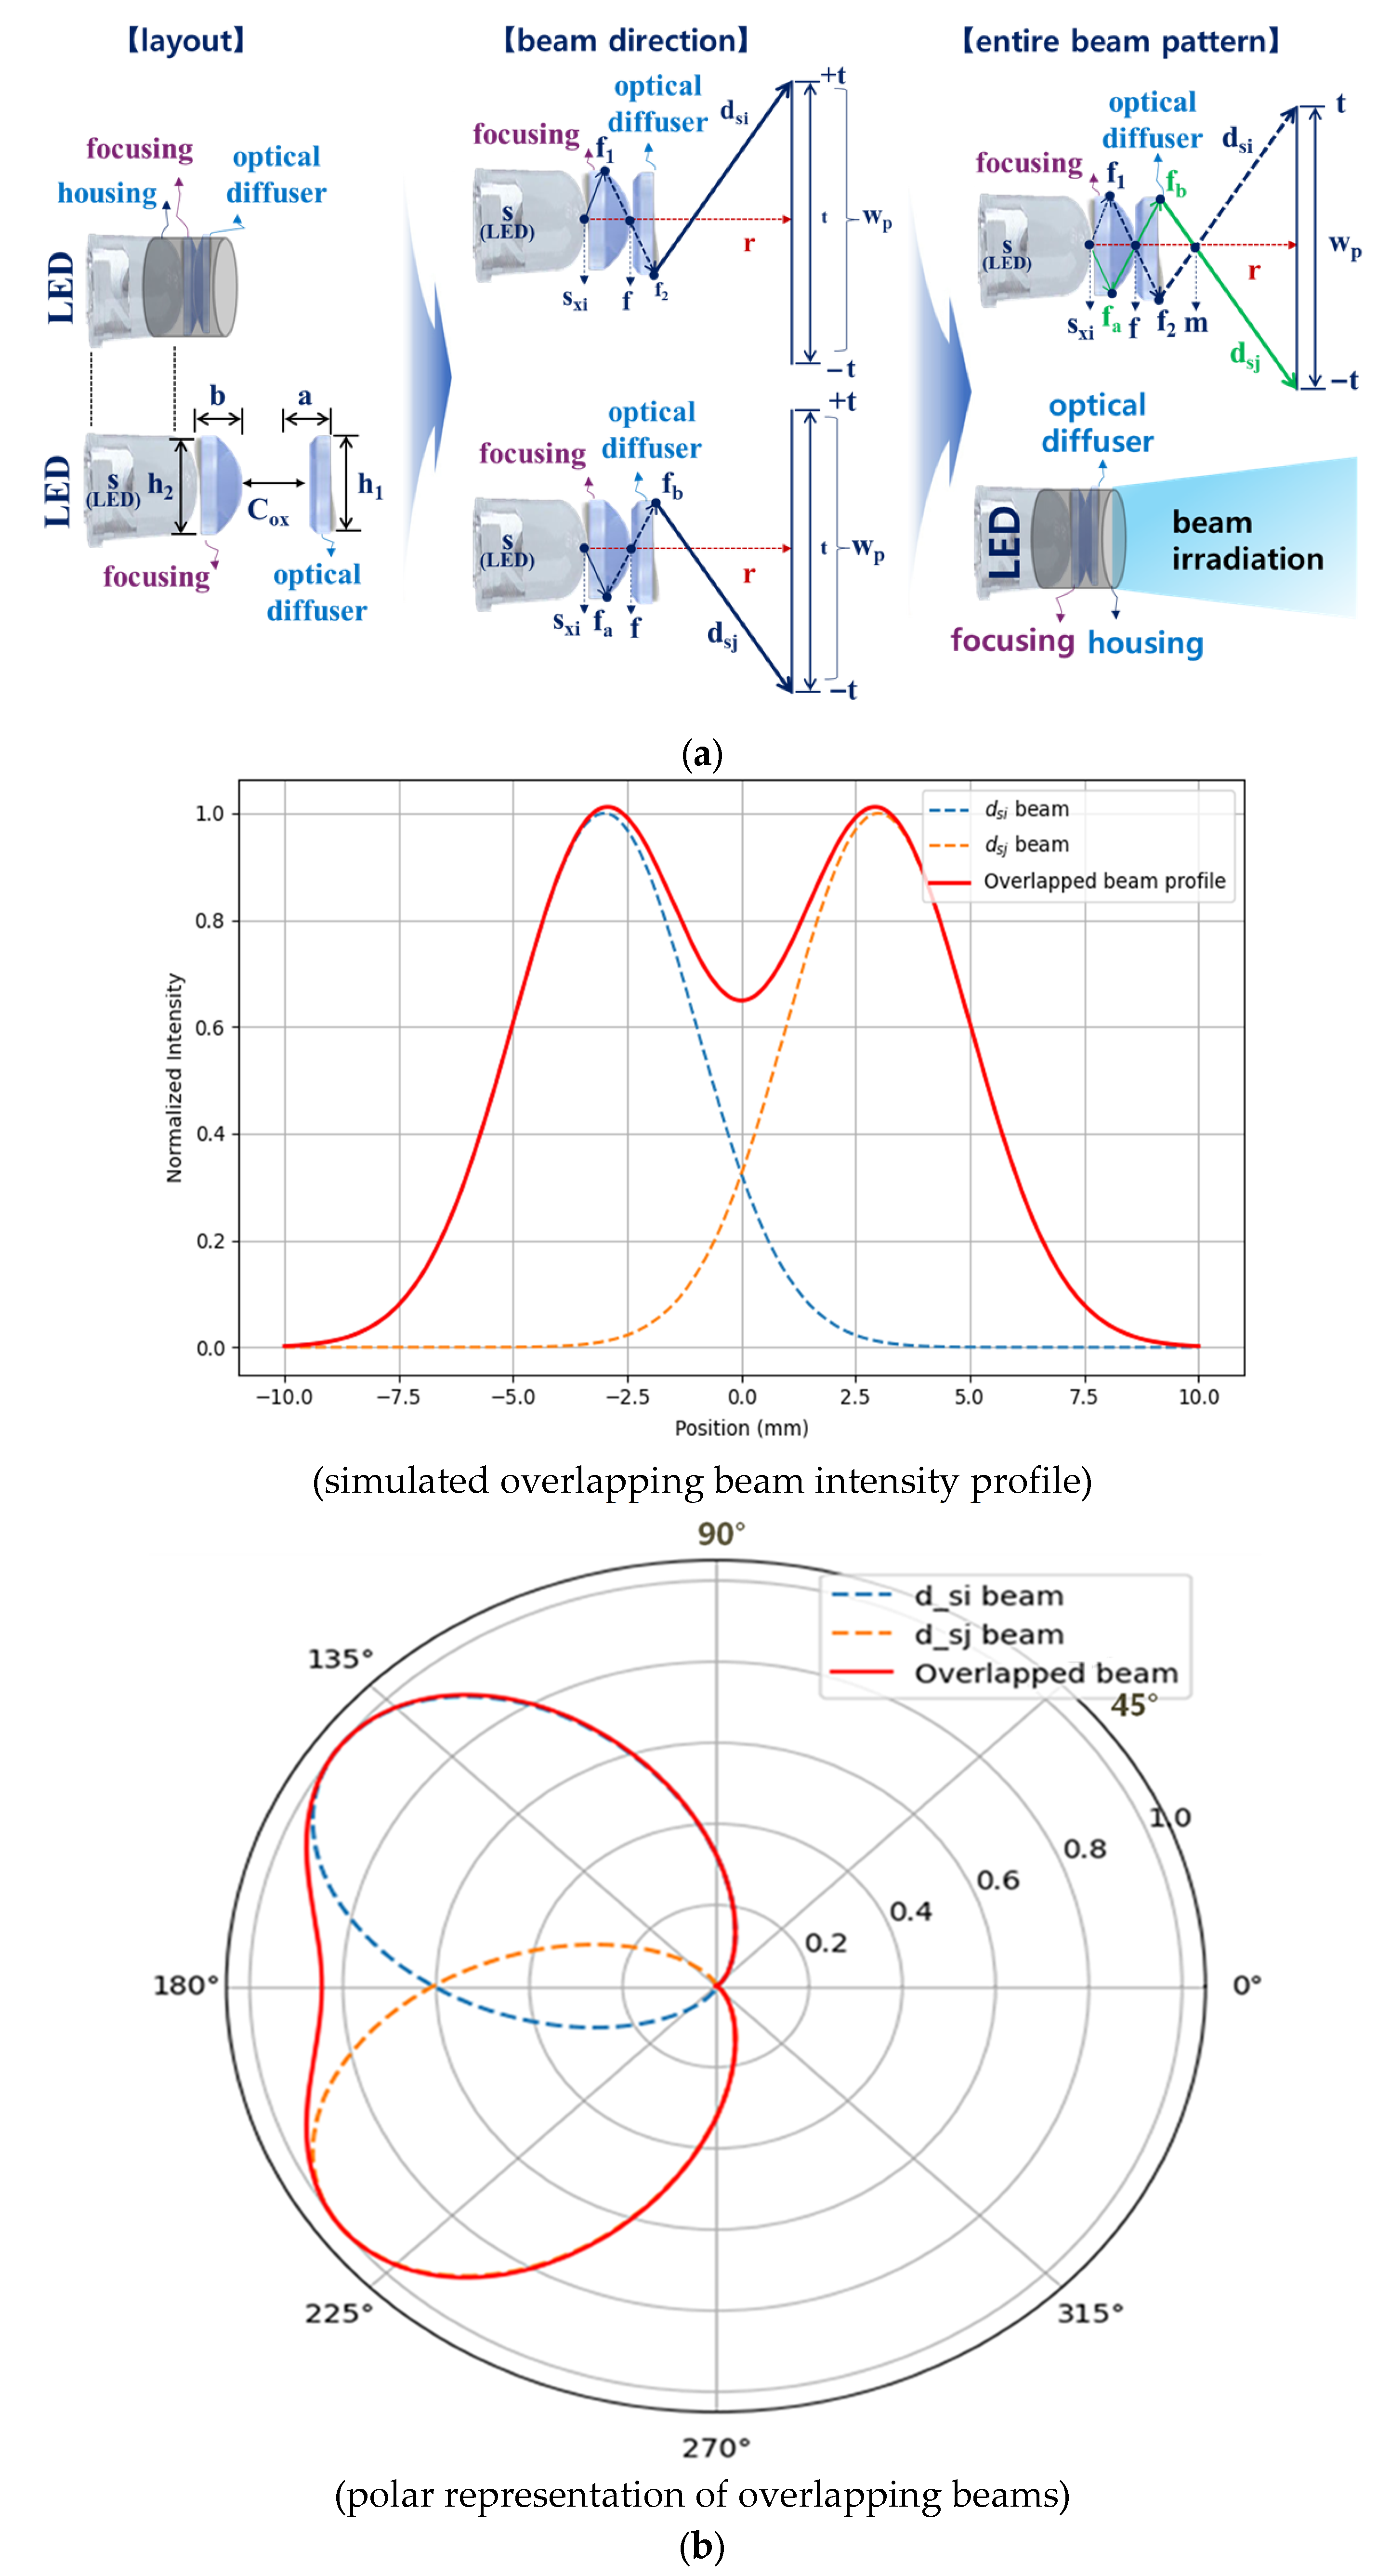
The irradiance on the target plane is calculated from the projected radiant flux and the illuminated area, rather than from luminous intensity. This phenomenon is also an important factor in setting the initial conditions for angular expansion in optical systems. As shown in Figure 4a and Equation (4), the beam sxi emitted from the LED propagates in the +t direction with half of its initial intensity and converges at the focal point f1 of the condenser lens, as illustrated in Figure 4b. The corresponding object distance sxi is listed in Table 3 [4].
1 f i = 1 s x i + 1 s i
As shown in Figure 4a,b, the beam passes through the lens-diffuser overlap plane f is reflected at f1 and then propagates toward f2 of the diffuser. After passing through f2, the beam dsi spreads in the +t direction. Conversely, the beam Sxj propagates in the +t direction with half of its initial intensity, converges at the focal point fa, passes through f, and is reflected at fa. The beam then propagates toward fb of the diffuser and spreads in the −t direction.
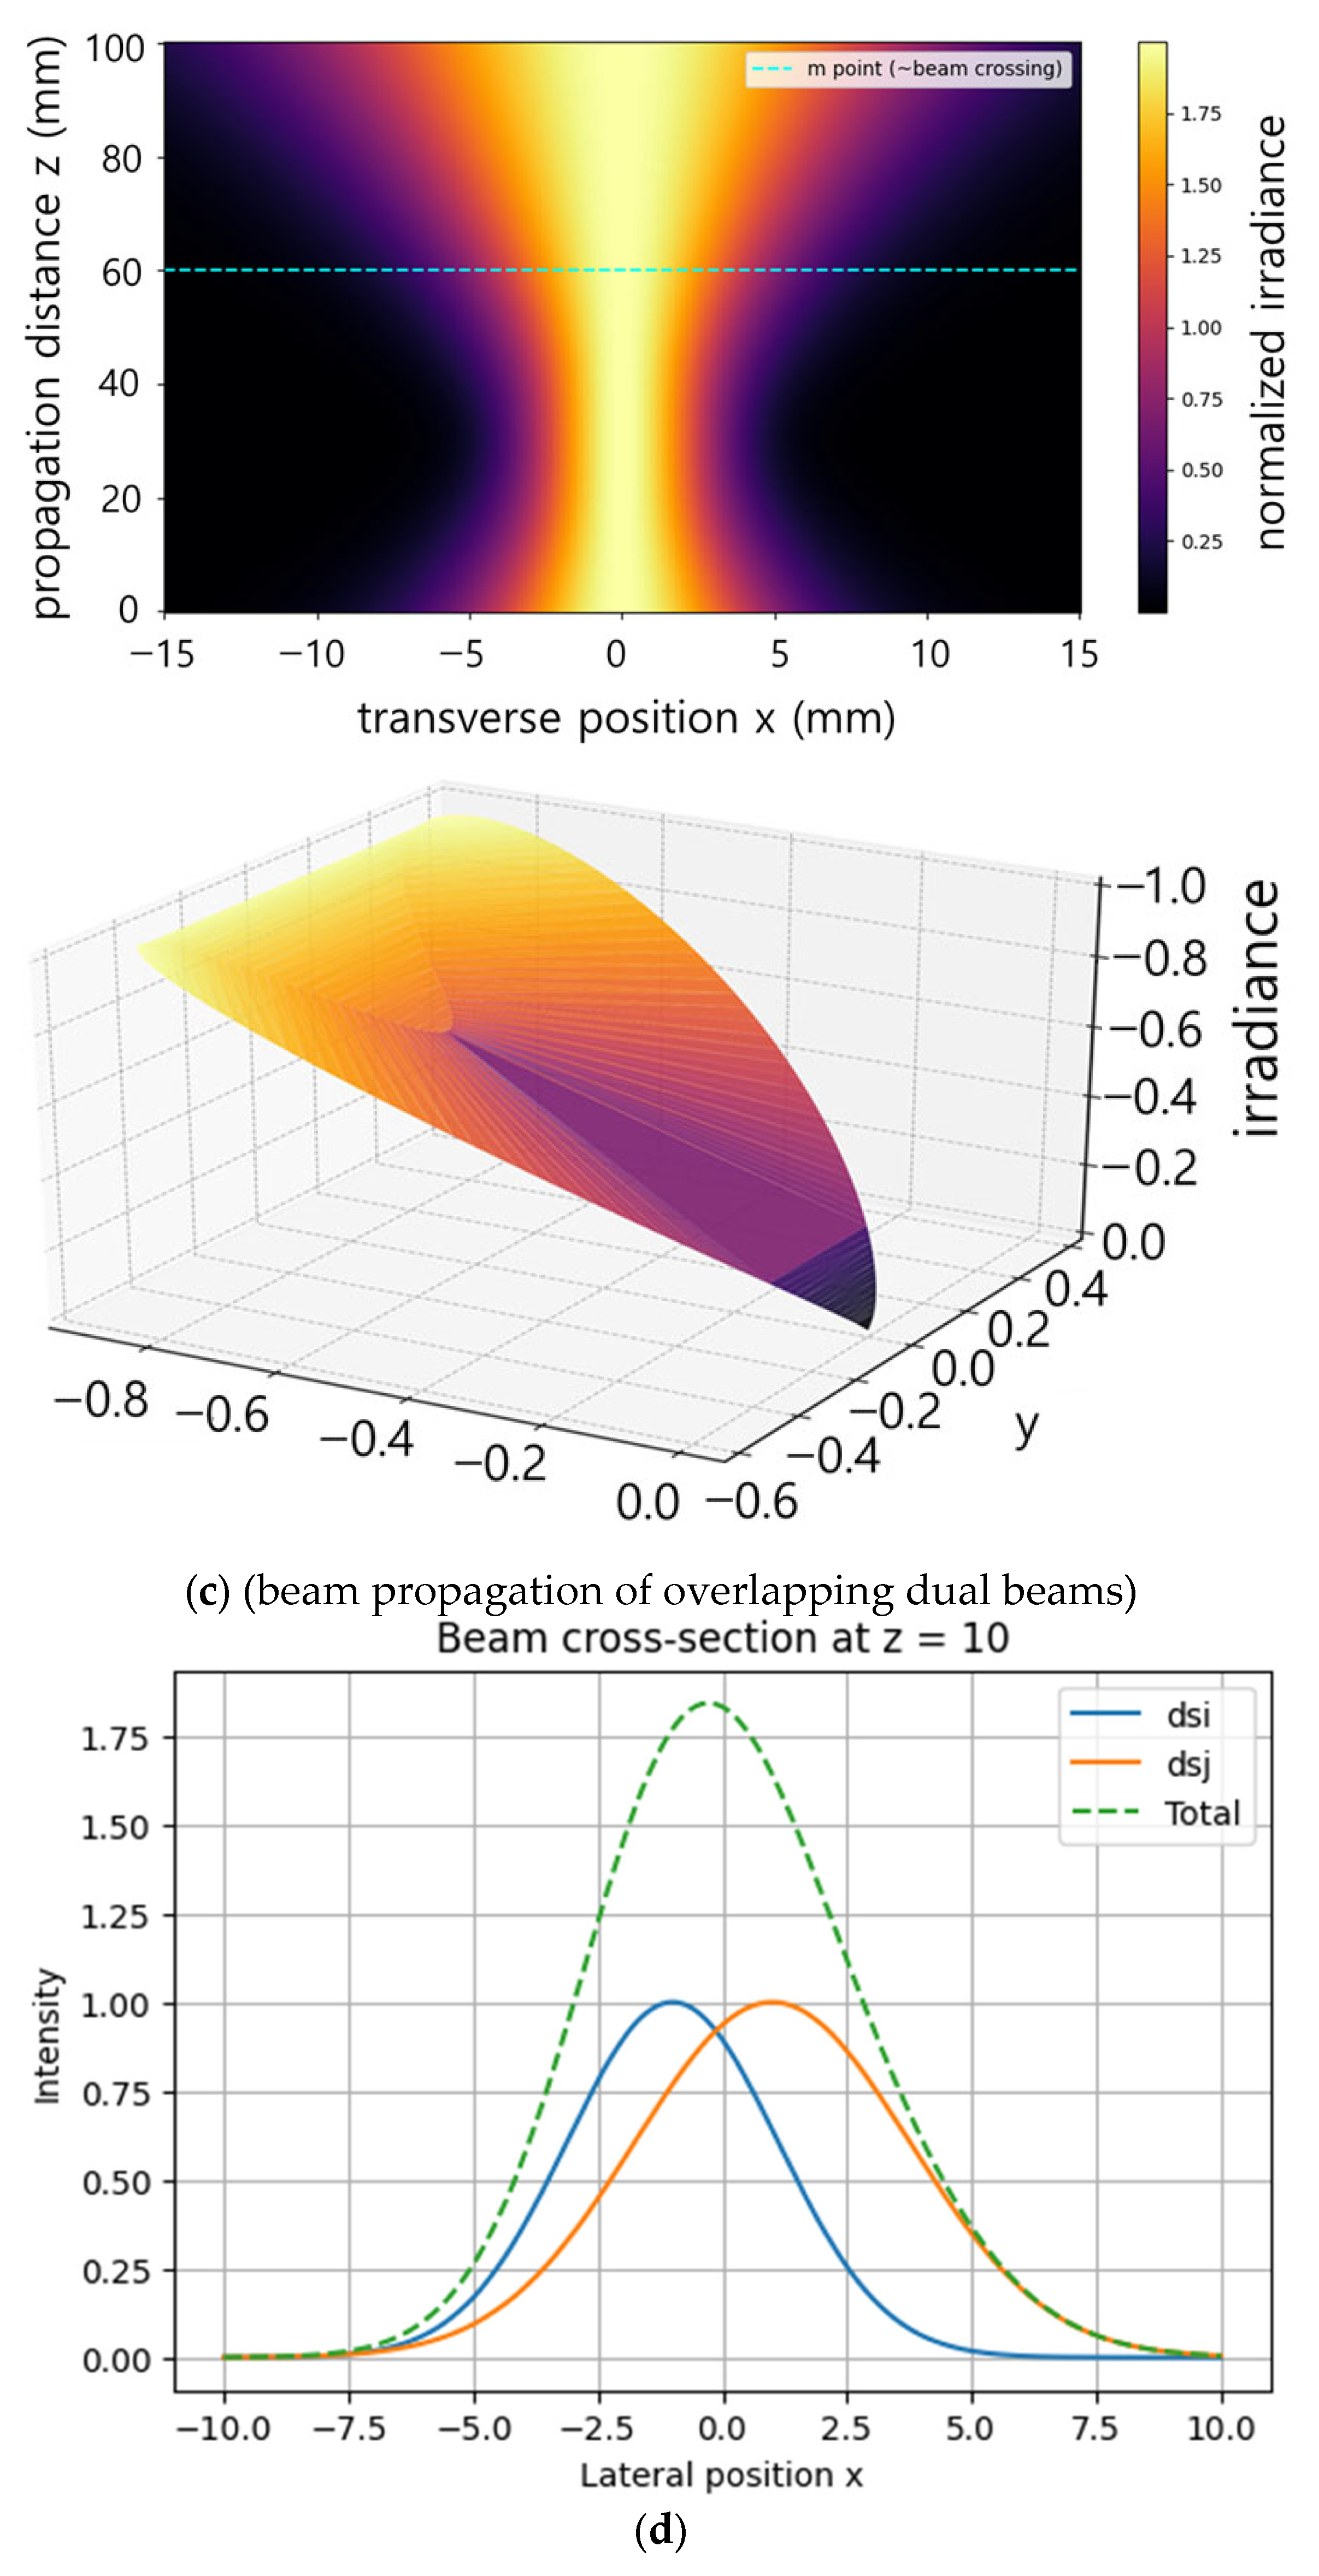
The two optical paths overlap at the focal plane (f), as illustrated in Figure 4a,b. According to the conservation of radiance, the total radiant flux Φe emitted by the LED is conserved in a lossless optical system, while the irradiance on the target plane decreases as the illuminated area expands along the propagation direction from +t to −t. In Figure 4b, the color map represents the variation in irradiance as a function of the propagation distance (z) and lateral position (x). The two Gaussian beams, dsi and dsj, converge at separate focal points and are reflected to overlap at plane f, forming an expanded top h at shaped beam on the working plane. Beyond the intersection point m , the overlapped beams maintain a nearly constant width wp as intended in the design. At point m, the crossing of dsi and dsj further extends the beam width, which is subsequently maintained at wp over the propagation distance r.
The beam width is determined by the ratio of a and b listed in Table 3, as expressed in Equation (5) [17,18]. Through this stepwise analysis, the geometric relationship between the incident angle and the emitted beam is established, enabling determination of the focal length of the primary lens and the spacing between the LED lenses. This relationship also provides a basis for analyzing off-axis aberrations arising from source misalignment or distance errors.
The beam divergence half angle is defined as the ratio of beam width to propagation distance, as illustrated in Figure 4c and expressed in Equation (6). After passing through the diffuser, the angular spread analysis identifies key beam-widening parameters, including diffuser roughness, scattering coefficient, and diffusion angle (θd). These parameters are essential for predicting the resulting field of view (FOV) for different diffuser angles (e.g., 20°, 40°, and 60°).
The beam centers for each optical path satisfy Equation (7) on the target plane and are adjusted according to Equation (8) to maintain uniform irradiance across the expanded illumination area [19]. Applying Equation (7) to the combined optical system (diffuser and secondary lens) enables prediction of the final beam divergence. This approach is effective for analyzing irradiance fall off and field uniformity, and for evaluating whether the fluorescence excitation threshold (e.g., a minimum irradiance of n mW/cm2) can be maintained as the illumination FOV increases.
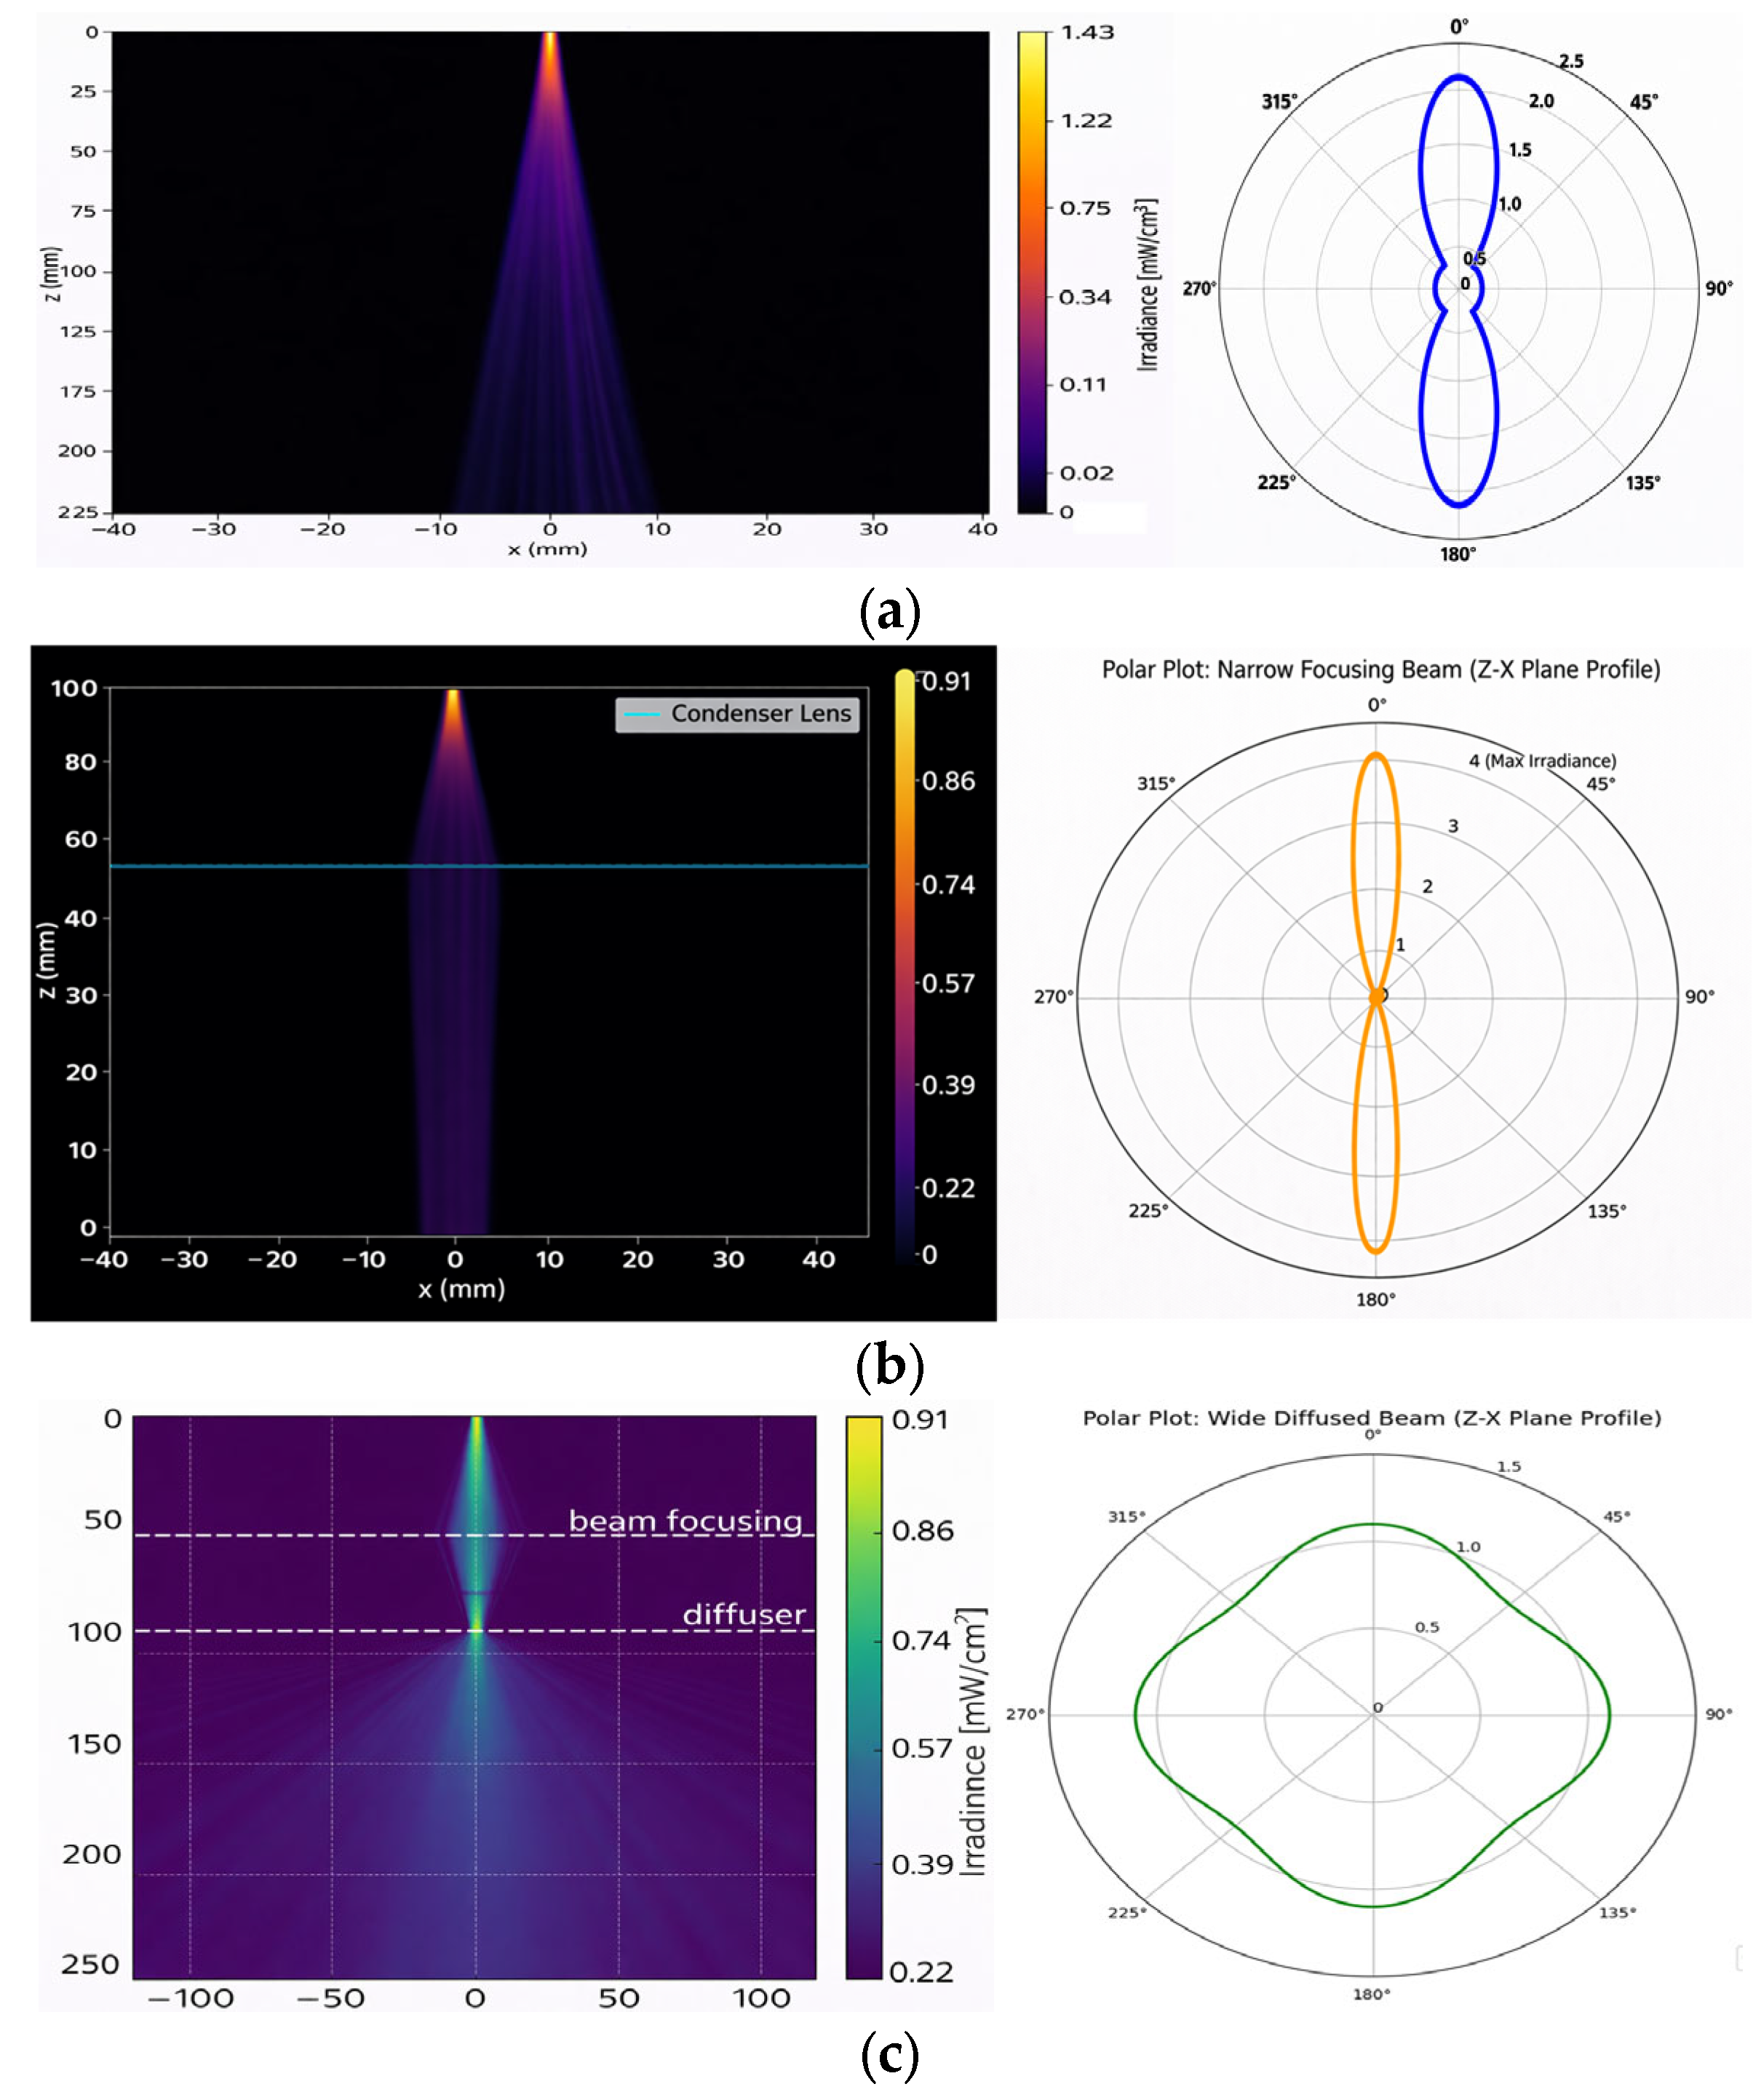
Simulation results confirm that the Gaussian beams dsi and dsj constructively overlap at plane f and preserve a nearly constant beam width wp up to the working plane beyond point m. These results verify that the intended divergence suppression and beam width stability are achieved in the proposed propagation model. The beam overlap mechanism can be described by linear superposition of coherent source beams and is consistent with the conservation of radiance [20,21].
w p = a b r
d i v b e a m s i z e w p
r i r j m i n σ r , i ,   σ r , j
d σ r , k b z w p 0
Figure 4d shows the transverse irradiance distributions of the two Gaussian beams, dsi and dsj, at z = 10, derived from Equations (5)–(8). The dsi and dsj curves represent the irradiance profiles of each beam as a function of beam width. The combined distribution (total: dotted line) corresponds to the irradiance profile across the entire beam width formed by the constructive overlap of dsi and dsj.
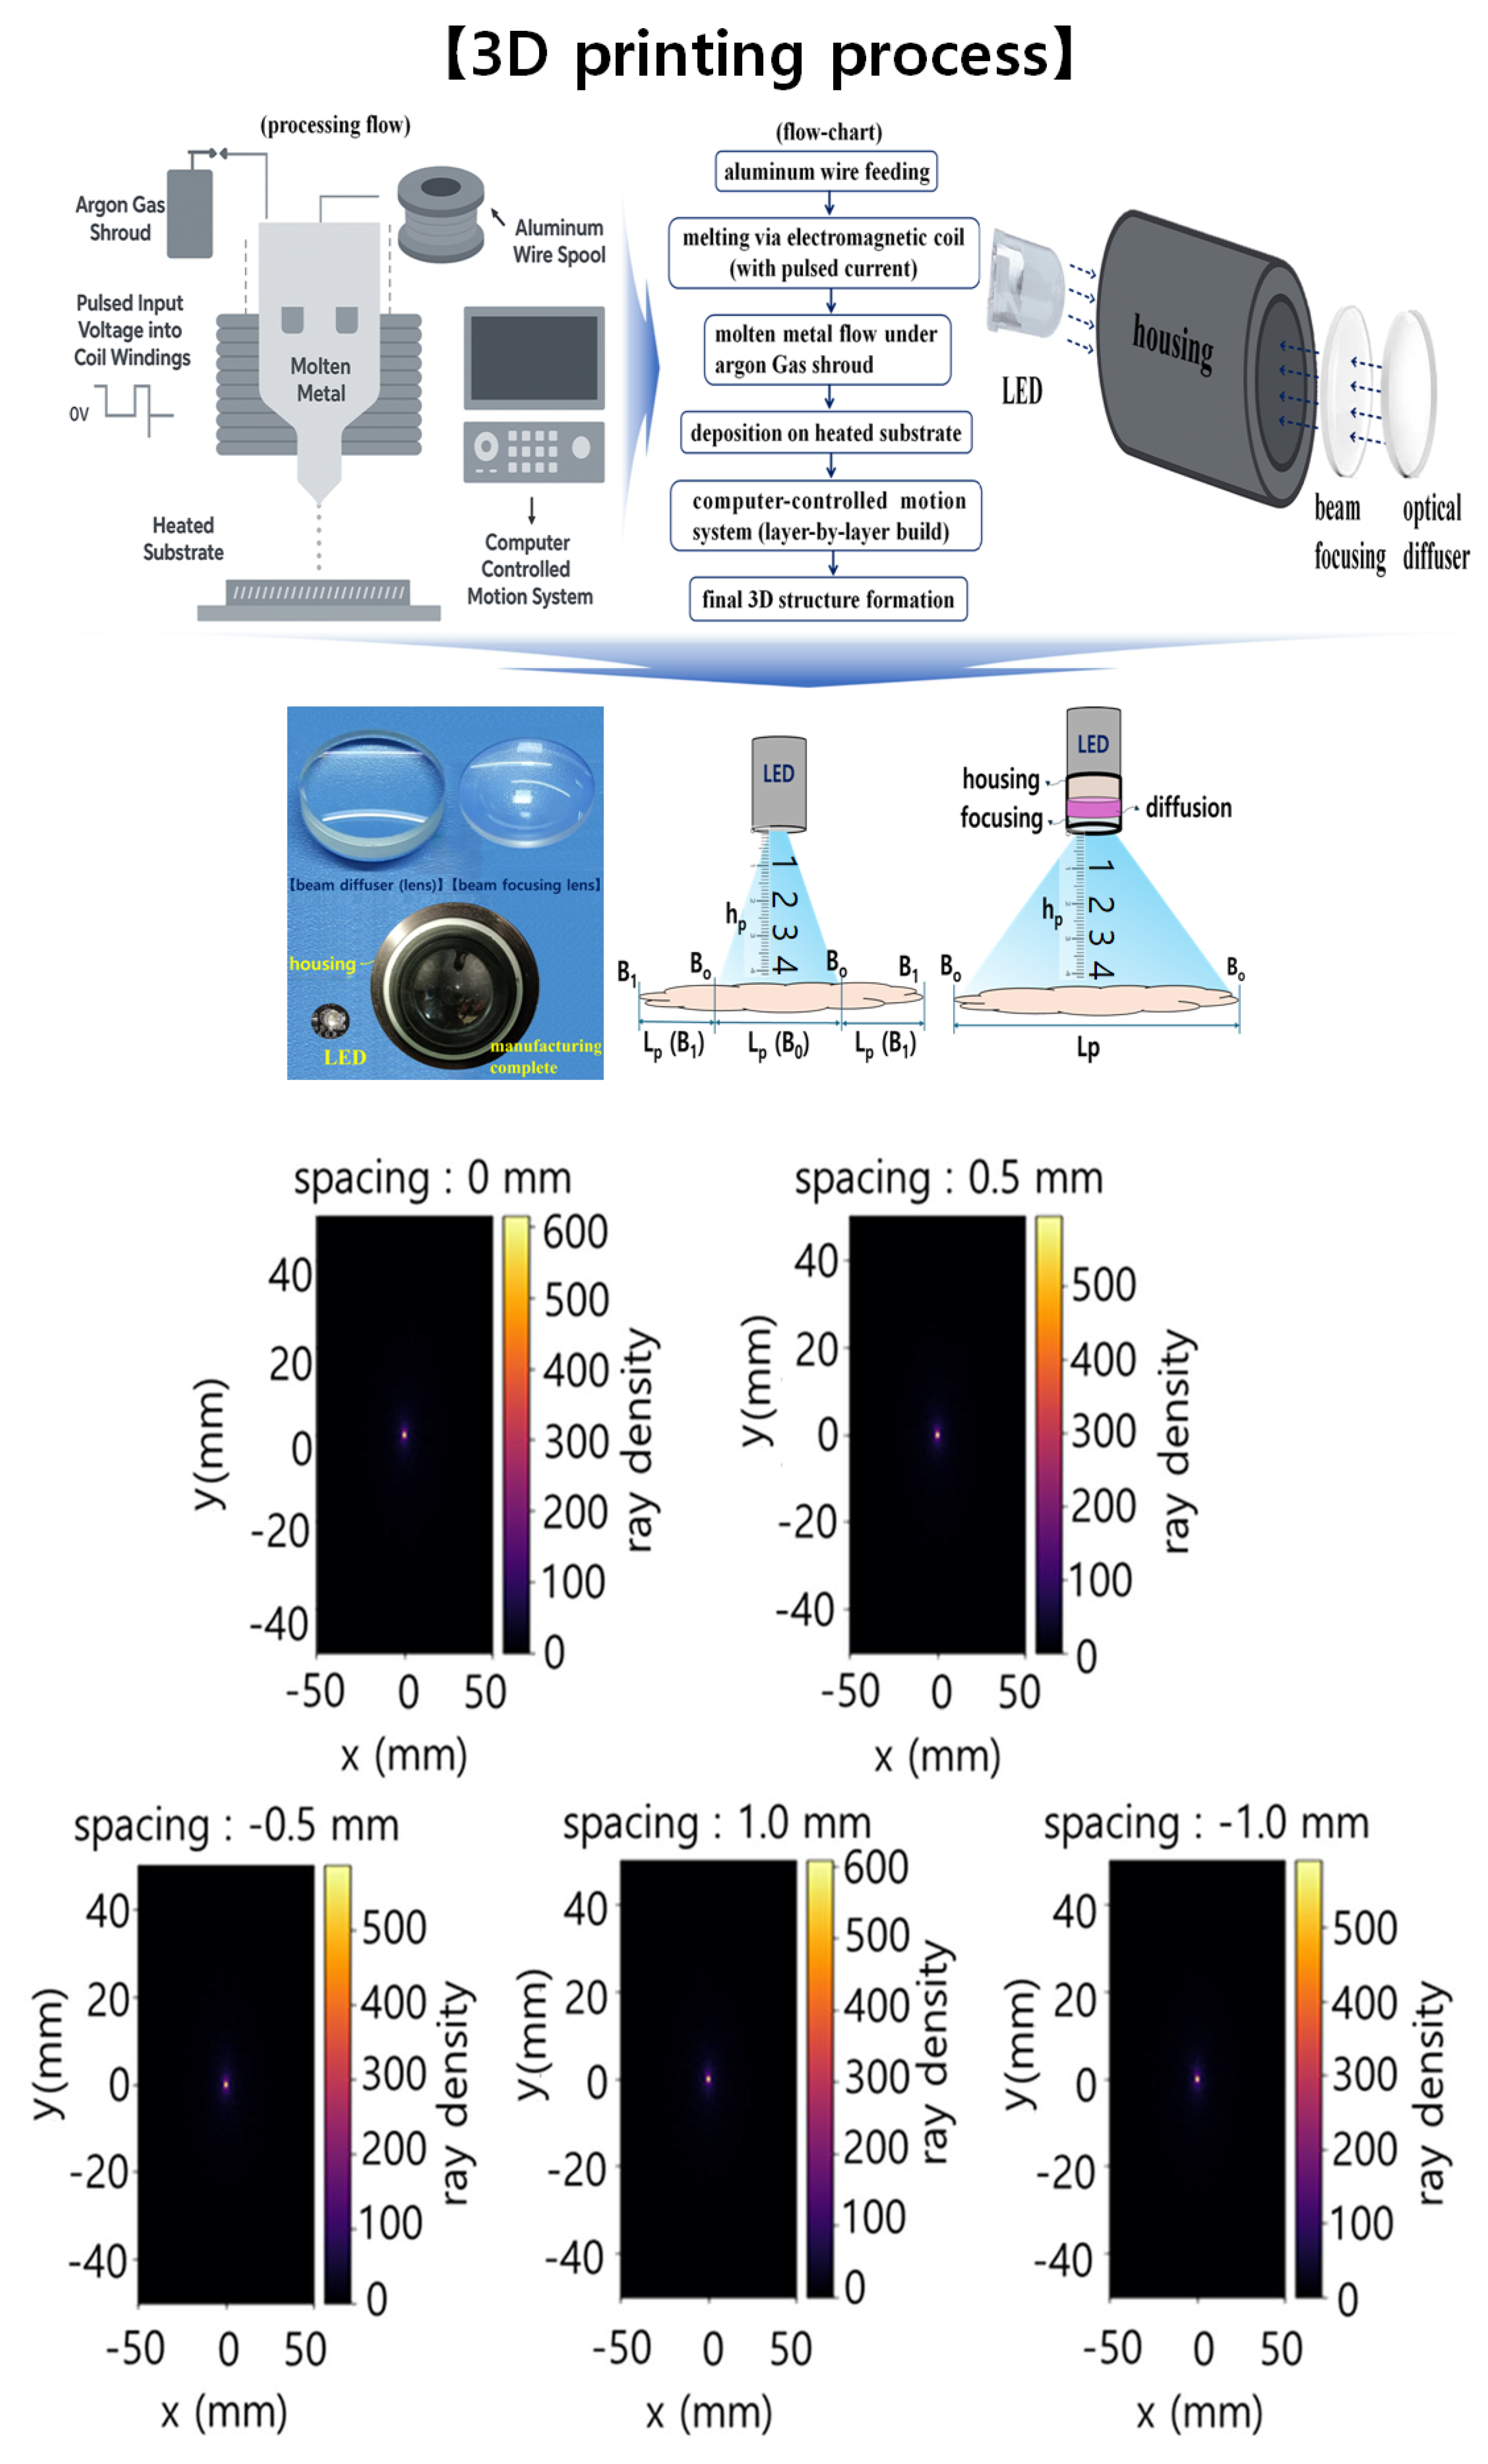
The optical structure was designed using a 3D layout (SOLIDWORKS CAD 2025, Dassault Systèmes, Vélizy-Villacoublay, near Versailles, France) and fabricated using metal 3D-printing techniques, as shown in Figure 5. The cylindrical housing was printed as a single structure, and the lenses responsible for controlled beam spreading through optical refraction and focusing were subsequently inserted into the housing.
Since the fabrication process of the housing does not directly affect the optical performance evaluation, detailed descriptions of the metal additive manufacturing procedure are omitted for clarity. The proposed housing primarily serves as a mechanical platform to ensure stable alignment of the optical components and reproducible beam characteristics. The proposed design method is fundamentally different from conventional beam expanders.
In the analysis of Equations (1)–(8), the distance between the diffuser and the lens is fixed to minimize tolerances among the light source elements. However, changes in this distance can lead to variations in the light transmission characteristics.
As the distance between the two elements increases, some of the angular light components generated by the diffuser may be excessively refracted by the secondary lens, as shown in Figure 5 (bottom). This results in a decrease in central irradiance and a relative increase in peripheral irradiance. Consequently, excessive beam spreading can reduce irradiance in both the central and peripheral regions and degrade uniformity at the edges of the field of view.
Conversely, when the distance decreases, the diffusion effect of the diffuser can be weakened by the lens itself, resulting in a gradual reduction in angular spread. In this case, the central irradiance may increase, while the overall field of view (FOV) decreases. When the gap variation is within ±0.5 mm, changes in the overall FOV remain limited. However, when the variation exceeds ±1 mm, beam shape asymmetry and irradiance imbalance become clearly observable. This behavior is confirmed by changes in the center-to-edge irradiance ratio, indicating that the LED diffuser gap directly affects beam uniformity and observation FOV.
Stable maintenance of the overall beam shape and irradiance uniformity is therefore achieved with precision control within ±0.5 mm. In contrast, fluctuations of ±1 mm or greater lead to a decrease in central irradiance and an increase in peripheral irradiance, thereby degrading illumination uniformity.
The housing into which the lenses are inserted is designed as a single integrated module that interfaces with the LED. In this configuration, the emitted LED beam exhibits both high irradiance and a wide beam width. To achieve this, the LED must provide both beam spreading and uniform intensity. As shown in Figure 5, simulations were conducted to compare a conventional LED configuration with an LED integrated with lenses through the housing. While a conventional LED exhibits a fixed beam angle (B0) for a given beam width, the proposed configuration significantly expands B0 and produces a more uniform beam distribution [22,23].
Optical alignment errors within the housing were further evaluated by considering lateral (XY) misalignment, angular error, and Z-axis distance variation between the LED package and the lens system. If lateral misalignment in the XY plane exceeds 0.1 to 0.2 mm, off-axis tilt occurs, shifting the beam center and causing directional brightness bias. Therefore, lateral alignment errors must be maintained below 0.1 mm during manufacturing.
For angular errors, the overall divergence variation remains below 5% within an angular tolerance of ±1°. However, when the angular error exceeds ±2°, an irradiance hot spot forms at one edge of the beam. Similarly, stable performance is maintained for Z-axis LED lens distance errors within ±0.2 mm, whereas larger deviations corresponding to FWHM divergence variations exceeding ±0.5 mm can cause significant performance degradation. Analysis of these alignment and spacing tolerances is therefore essential for housings fabricated using 3D printing and extrusion molding processes.
In this study, beam coverage characteristics, including beam width, divergence angle, and irradiance distribution, were analyzed using a combination of analytical calculations and numerical simulations. First, the initial beam divergence and irradiance behavior were estimated analytically based on a Lambertian LED source model and geometric optics relationship, as described in Equations (1)–(8). These calculations were used to establish the design parameters of the optical system, such as focal length, propagation distance, and beam overlap conditions.
Subsequently, numerical simulations were performed to predict the spatial and angular beam distribution. Beam propagation and irradiance maps were analyzed using COMSOL Multiphysics® (ALTSOFT, Seoul, Republic of Korea), as shown in Figure 4, to evaluate dual path beam overlap and beam width stabilization. In addition, Python (ver. 3.15) -based ray tracing and Monte Carlo simulations were conducted to model angular divergence expansion and irradiance redistribution caused by the combined effects of LED emission, condenser lens refraction, and diffuser scattering, as shown in Figure 3, Figure 4 and Figure 5.
Finally, the simulation results were validated experimentally by measuring beam diameter and irradiance under different optical configurations. Through this combined analytical, numerical, and experimental approach, the beam coverage characteristics of the proposed optical module were systematically evaluated.

3. Experimental Results

The experiment was conducted using three different device configurations, and the results were obtained and compared to demonstrate the superiority of the proposed method. All experimental results are reported using absolute radiometric units, specifically irradiance (mW/cm2) and radiant flux (mW), rather than relative values.
Irradiance was measured using a calibrated optical power meter and calculated as the collected radiant flux divided by the effective sensing area of the detector. The evaluation was carried out by directly irradiating graph paper with an LED delivering a radiant flux of 18 mW (nominal divergence angle: 10°) and capturing the resulting beam pattern using a camera (Lt-225M-NIR, Lumenera Corporation, Ottawa, ON, Canada). The beam irradiation working distance (WD) was set to 10 cm for the measurements.
The measurement equipment included a power meter (Thorlabs S121C, Thorlabs, New York, NY, USA) and a ruler. In this experiment, the characteristics of the epoxy lens inherent to the LED package were not modeled separately. Instead, irradiance (mW/cm2) and beam width variations with distance were experimentally measured using the same LED in order to inherently reflect the effect of the built-in lens. Furthermore, changes in beam spread and irradiance distribution were experimentally verified by comparing cases with and without a diffuser. Therefore, the results presented in this paper are compared and analyzed based on experimental data that include the combined effects of the LED lens, the optical condenser, and the diffuser. These effects were not modeled analytically but were obtained directly through experiments.
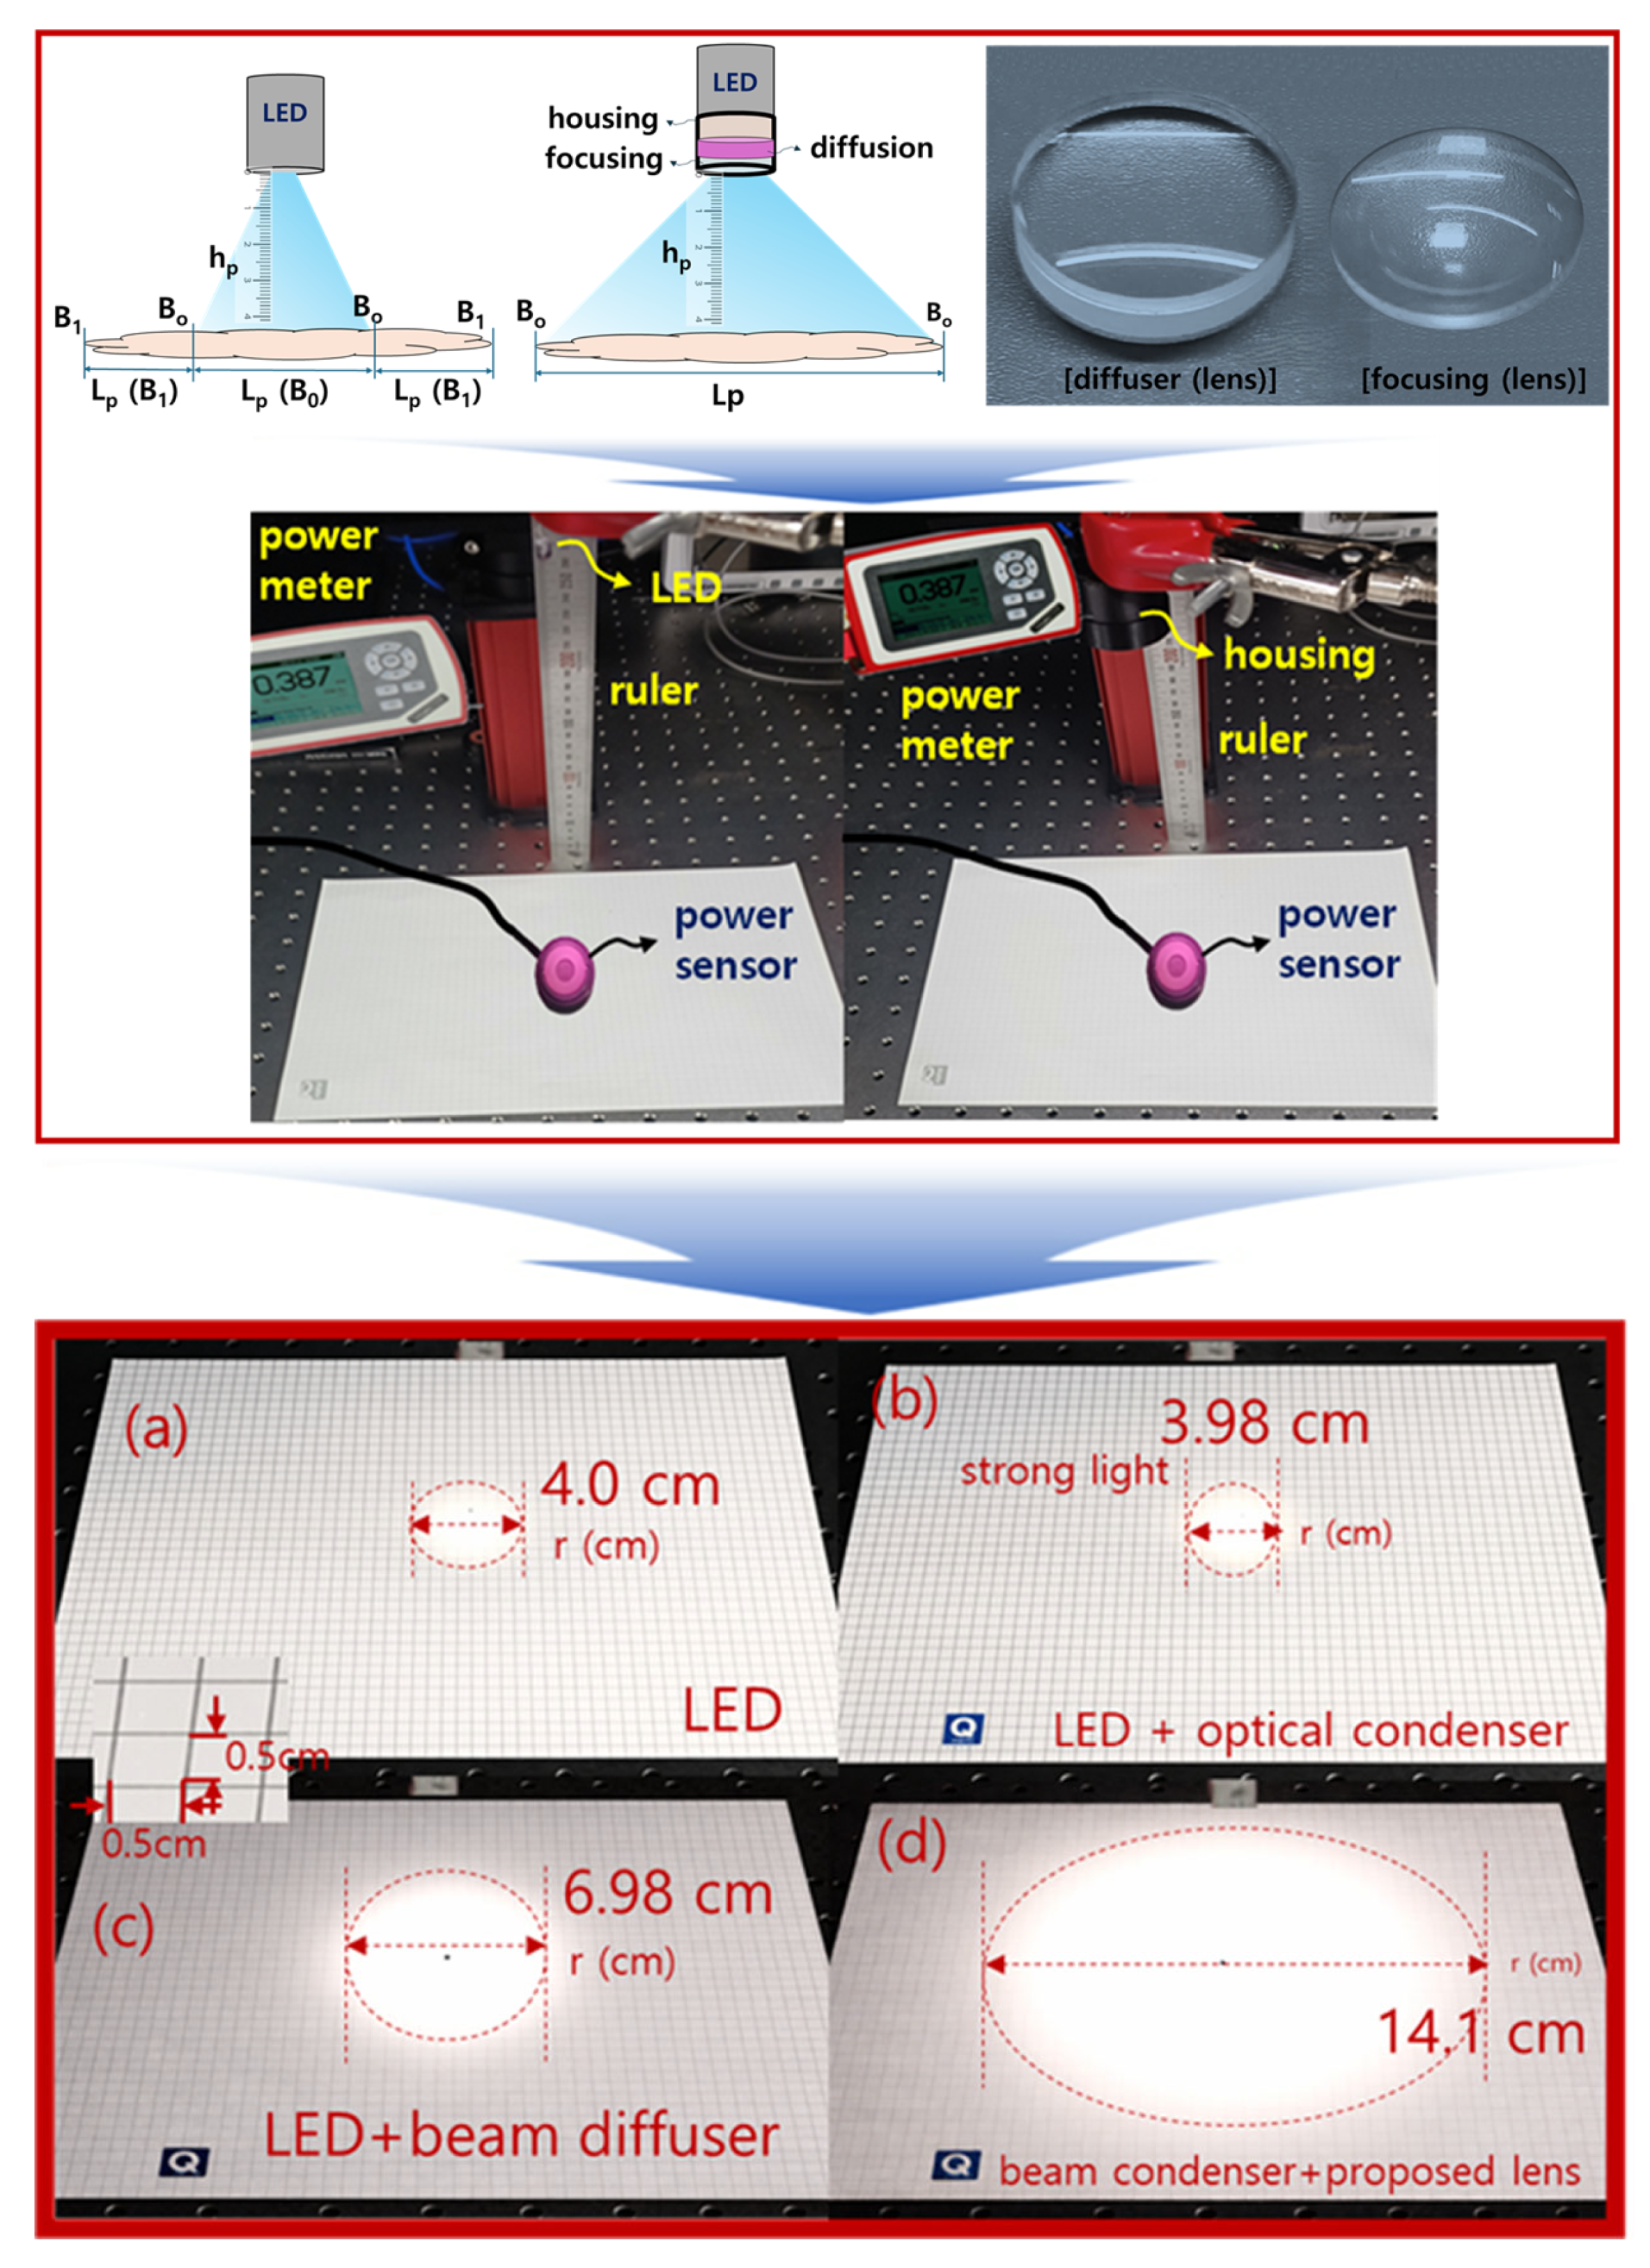
As shown in Figure 6, each grid square on the graph paper corresponds to 0.5 × 0.5 cm2. The evaluation compares direct LED irradiation (Thorlabs 780E), the LED combined with an optical condenser, and the LED combined with both an optical condenser and the proposed structure consisting of beam focusing and a diffuser. The results are presented in Figure 6 and Table 4. In the case shown in Figure 6a, where the LED beam spreads widely, the measured irradiance is 1.43 mW/cm2 and the captured beam diameter is 4.0 cm.
The irradiance and beam diameter measured using only the LED were 1.43 mW/cm2 and 4.0 cm, respectively, as shown in Figure 6a.
The insertion of a beam focusing condenser lens reduced the irradiance and beam diameter to 0.91 mW/cm2 and 3.98 cm, respectively, as shown in Figure 6b. The further addition of the proposed diffuser structure resulted in a significant expansion of the beam diameter, while the average irradiance decreased to 0.72 mW/cm2, as shown in Figure 6c and summarized in Table 5.
Based on the results summarized in the Table, Figure 6a shows that the beam diameter is approximately 4.0 cm for the LED-only configuration. As shown in Figure 6b, the beam diameter remains nearly unchanged at 3.98 cm, while the average irradiance decreases from 1.43 mW/cm2 to 0.91 mW/cm2 compared to Figure 6a. In Figure 6c, relative to Figure 6b, the beam diameter expands by a factor of approximately 3.5, whereas the average irradiance decreases from 0.91 mW/cm2 to 0.72 mW/cm2. Figure 6c demonstrates that combining the condenser and diffuser expands the beam diameter by a factor of approximately 3.5, while reducing irradiance by less than 50%. This tradeoff is favorable for fluorescence-guided surgery, where a wider excitation field with sufficient irradiance is more critical than peak irradiance.
In Figure 6d, the LED combined with both the beam condenser and the proposed diffuser structure achieves the maximum beam spreading, with a beam diameter of 14.1 cm, representing an approximately 3.5-fold expansion compared to the baseline LED configuration in Figure 6a.
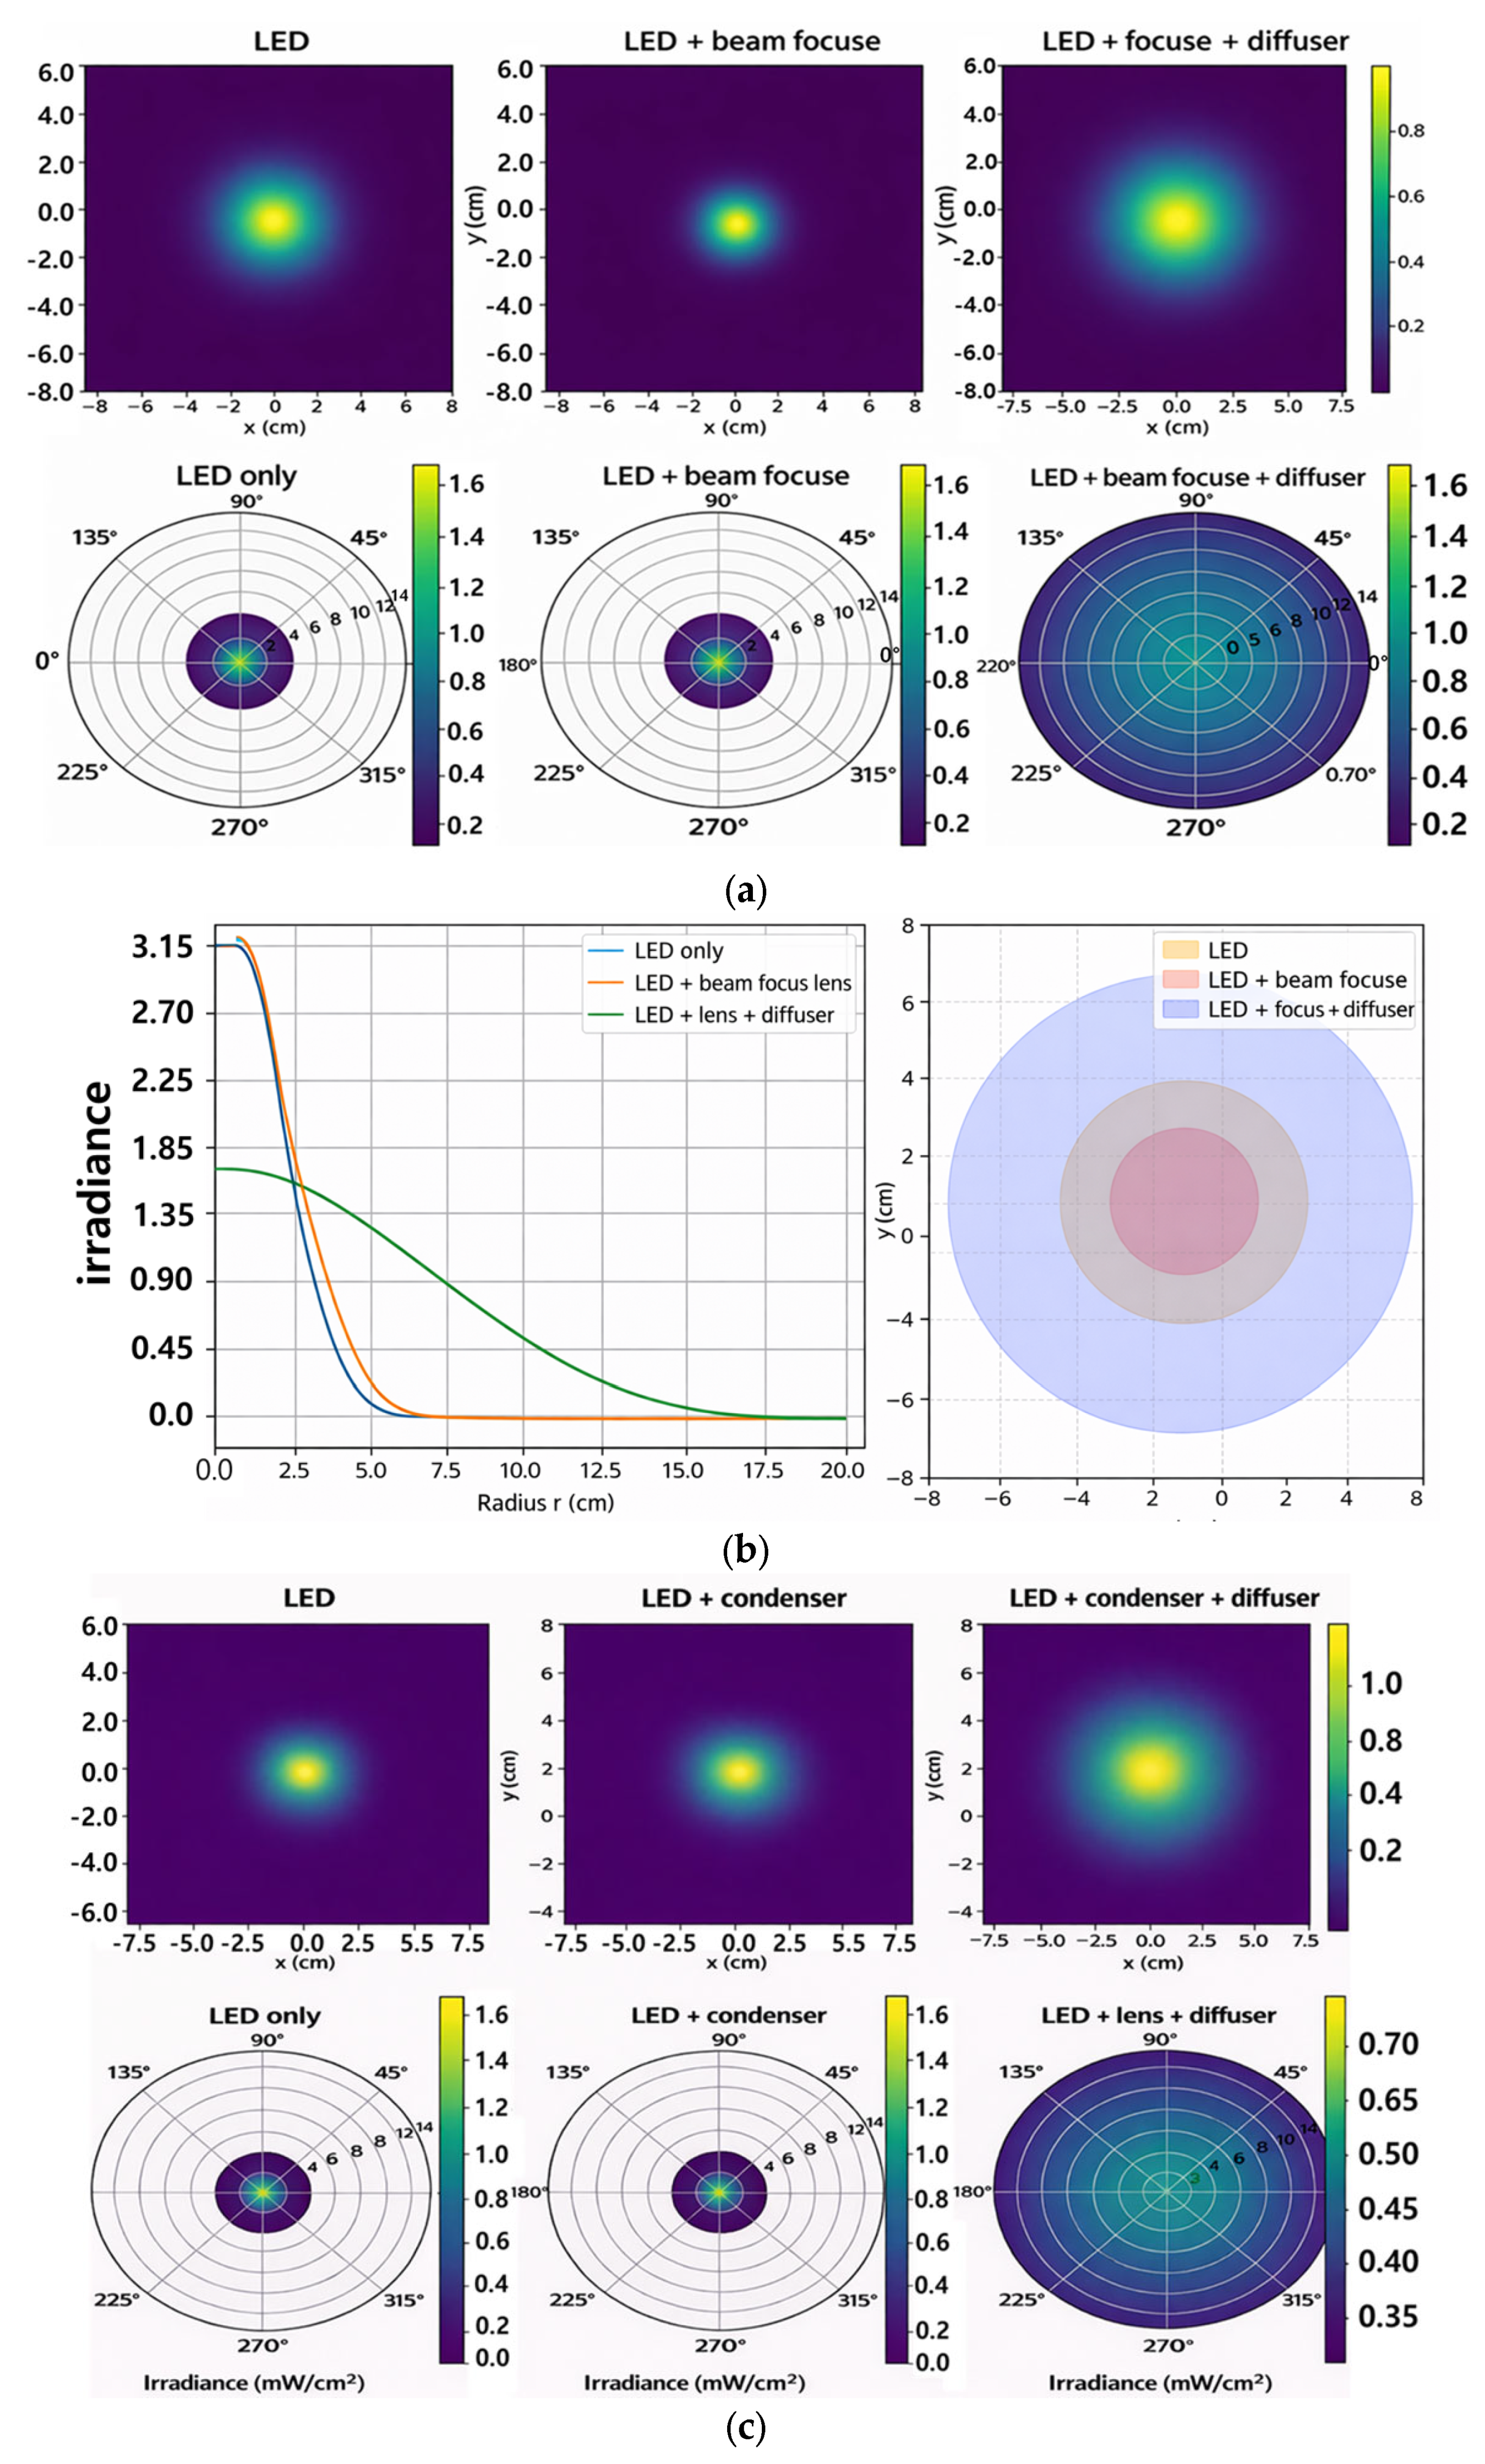
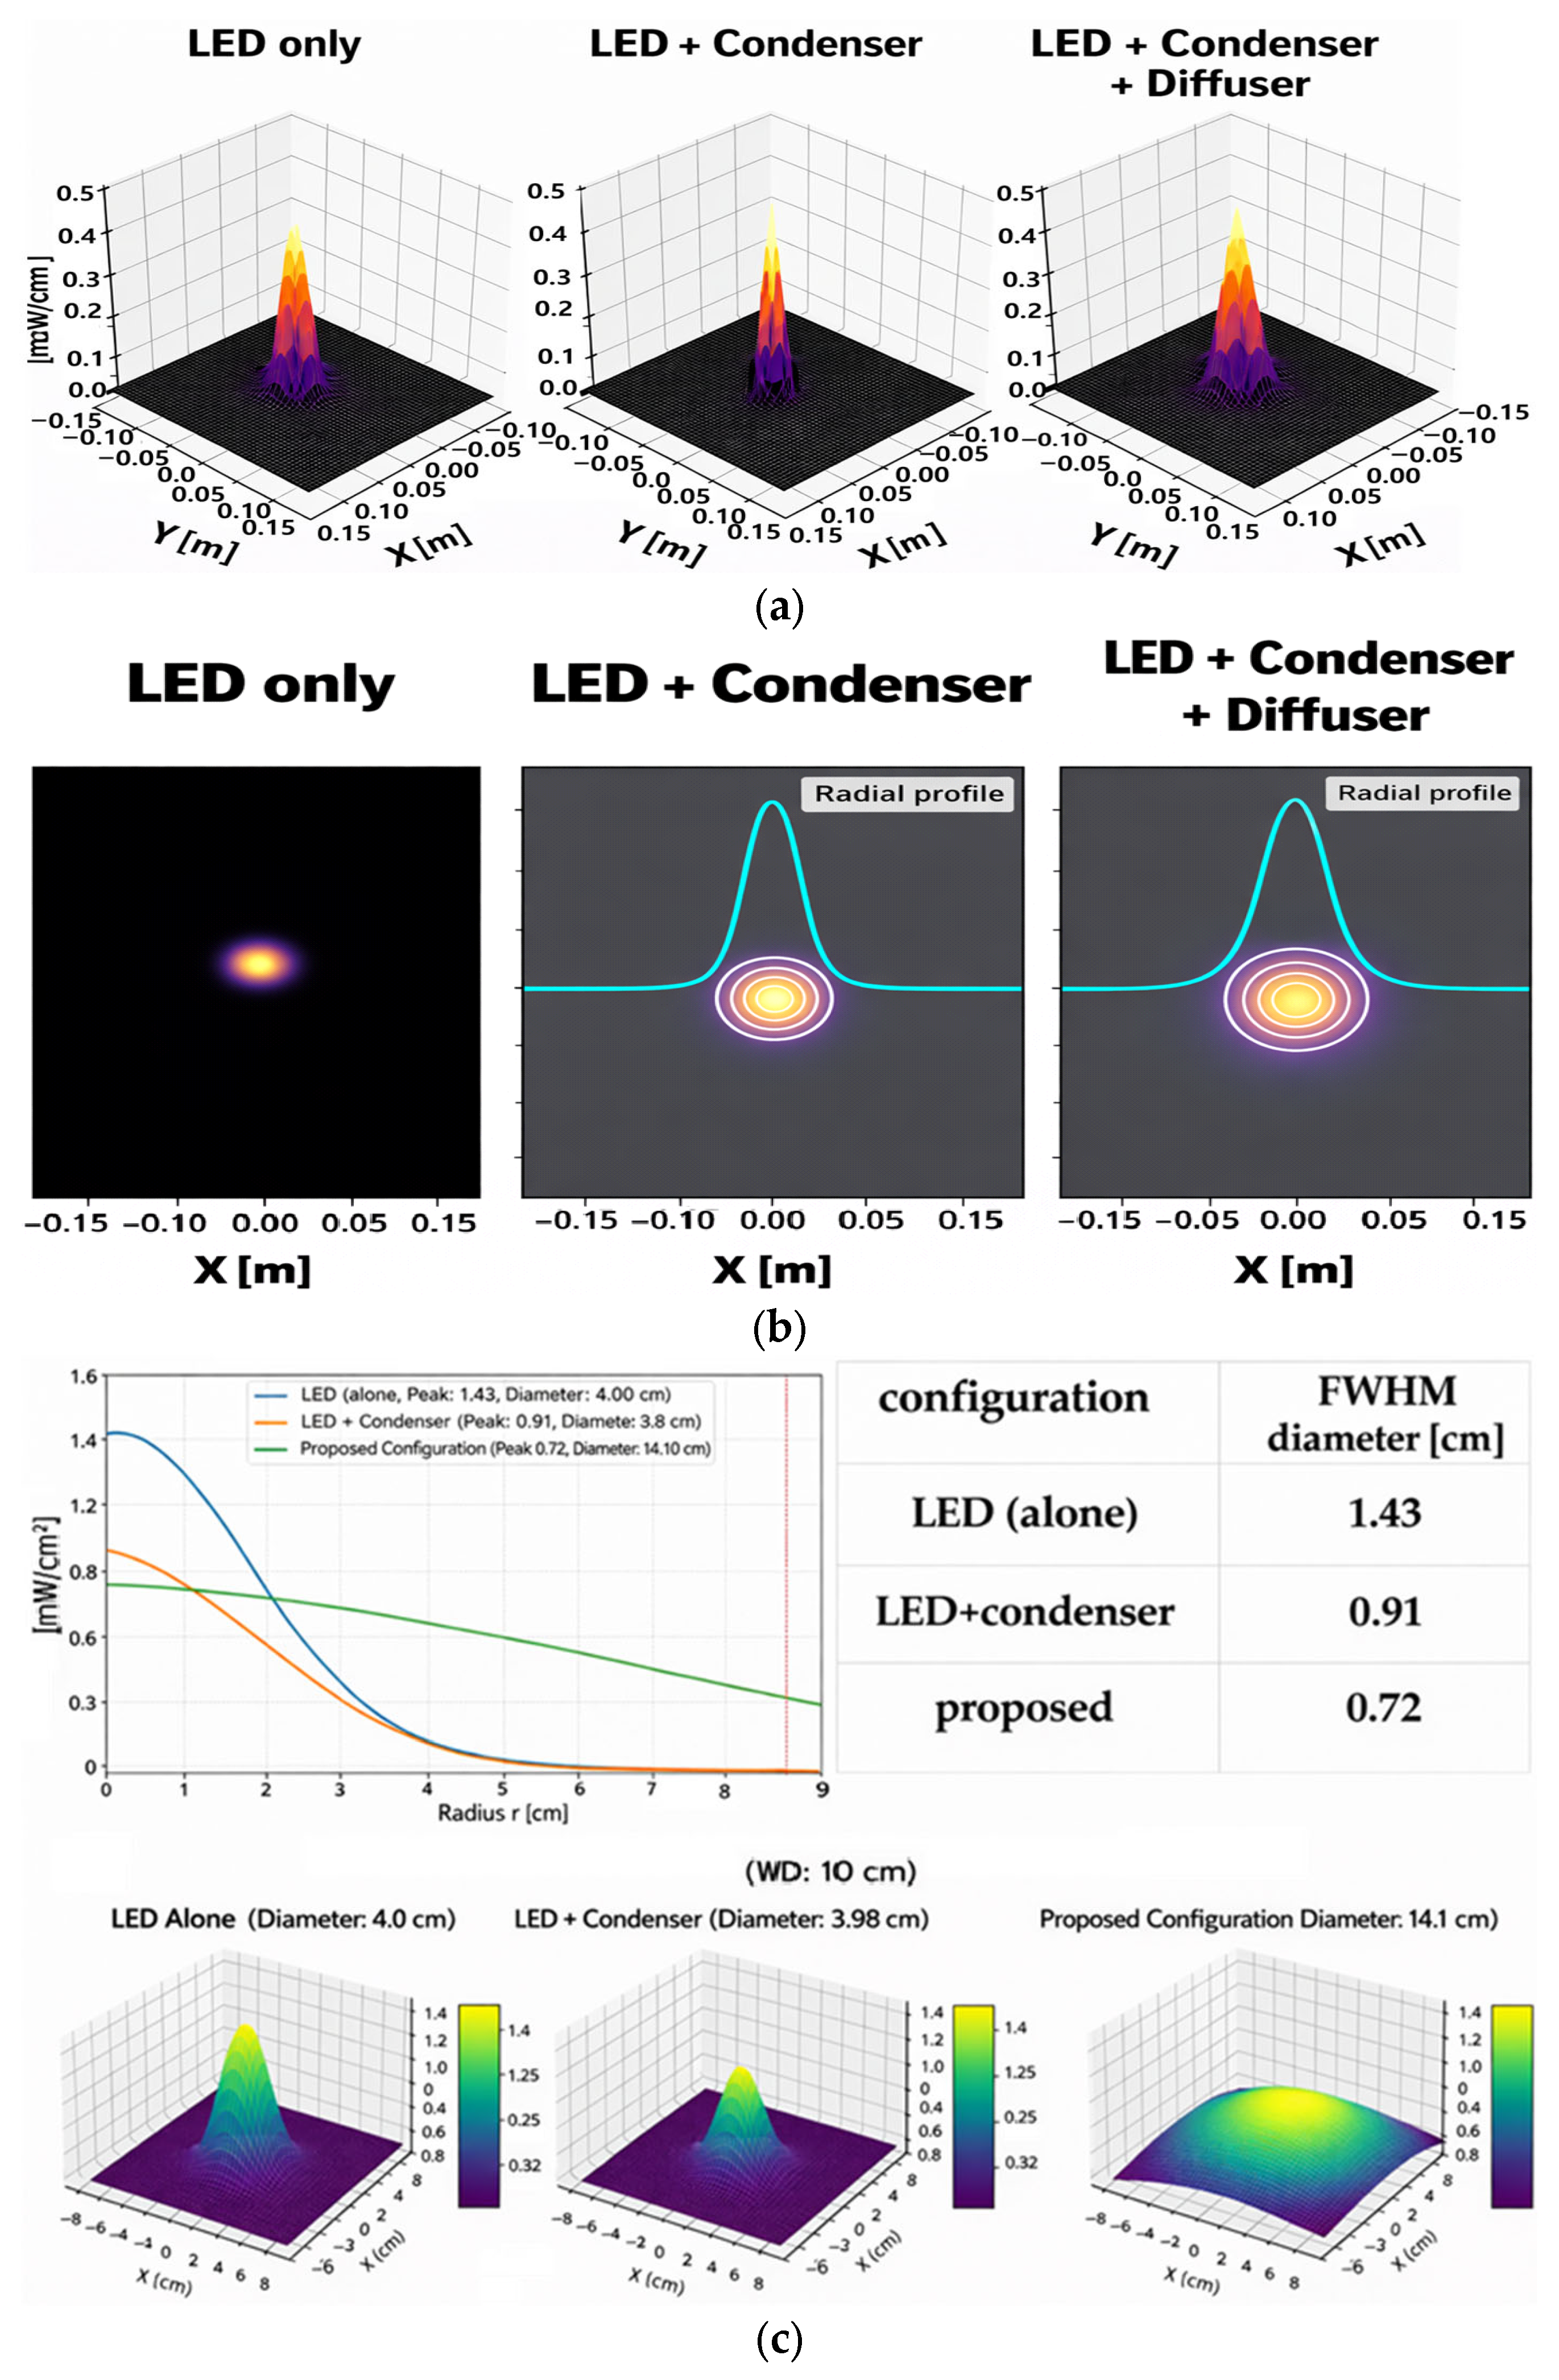
Figure 7 shows the illuminance distribution under different LED illumination conditions. Figure 7 shows the illuminance distribution under different LED illumination conditions. Figure 7a–d illustrate the numerical visualization of the beam profile and radial intensity distribution for different LED optical configurations.
Figure 7a shows the illuminance distribution under different LED illumination conditions. Single LED illumination produces a limited illumination area. The use of a condenser lens concentrates the LED illumination toward the center, thereby reducing the illuminated area. In contrast, adding a diffusing lens expands the illumination area and distributes the illuminance more evenly.
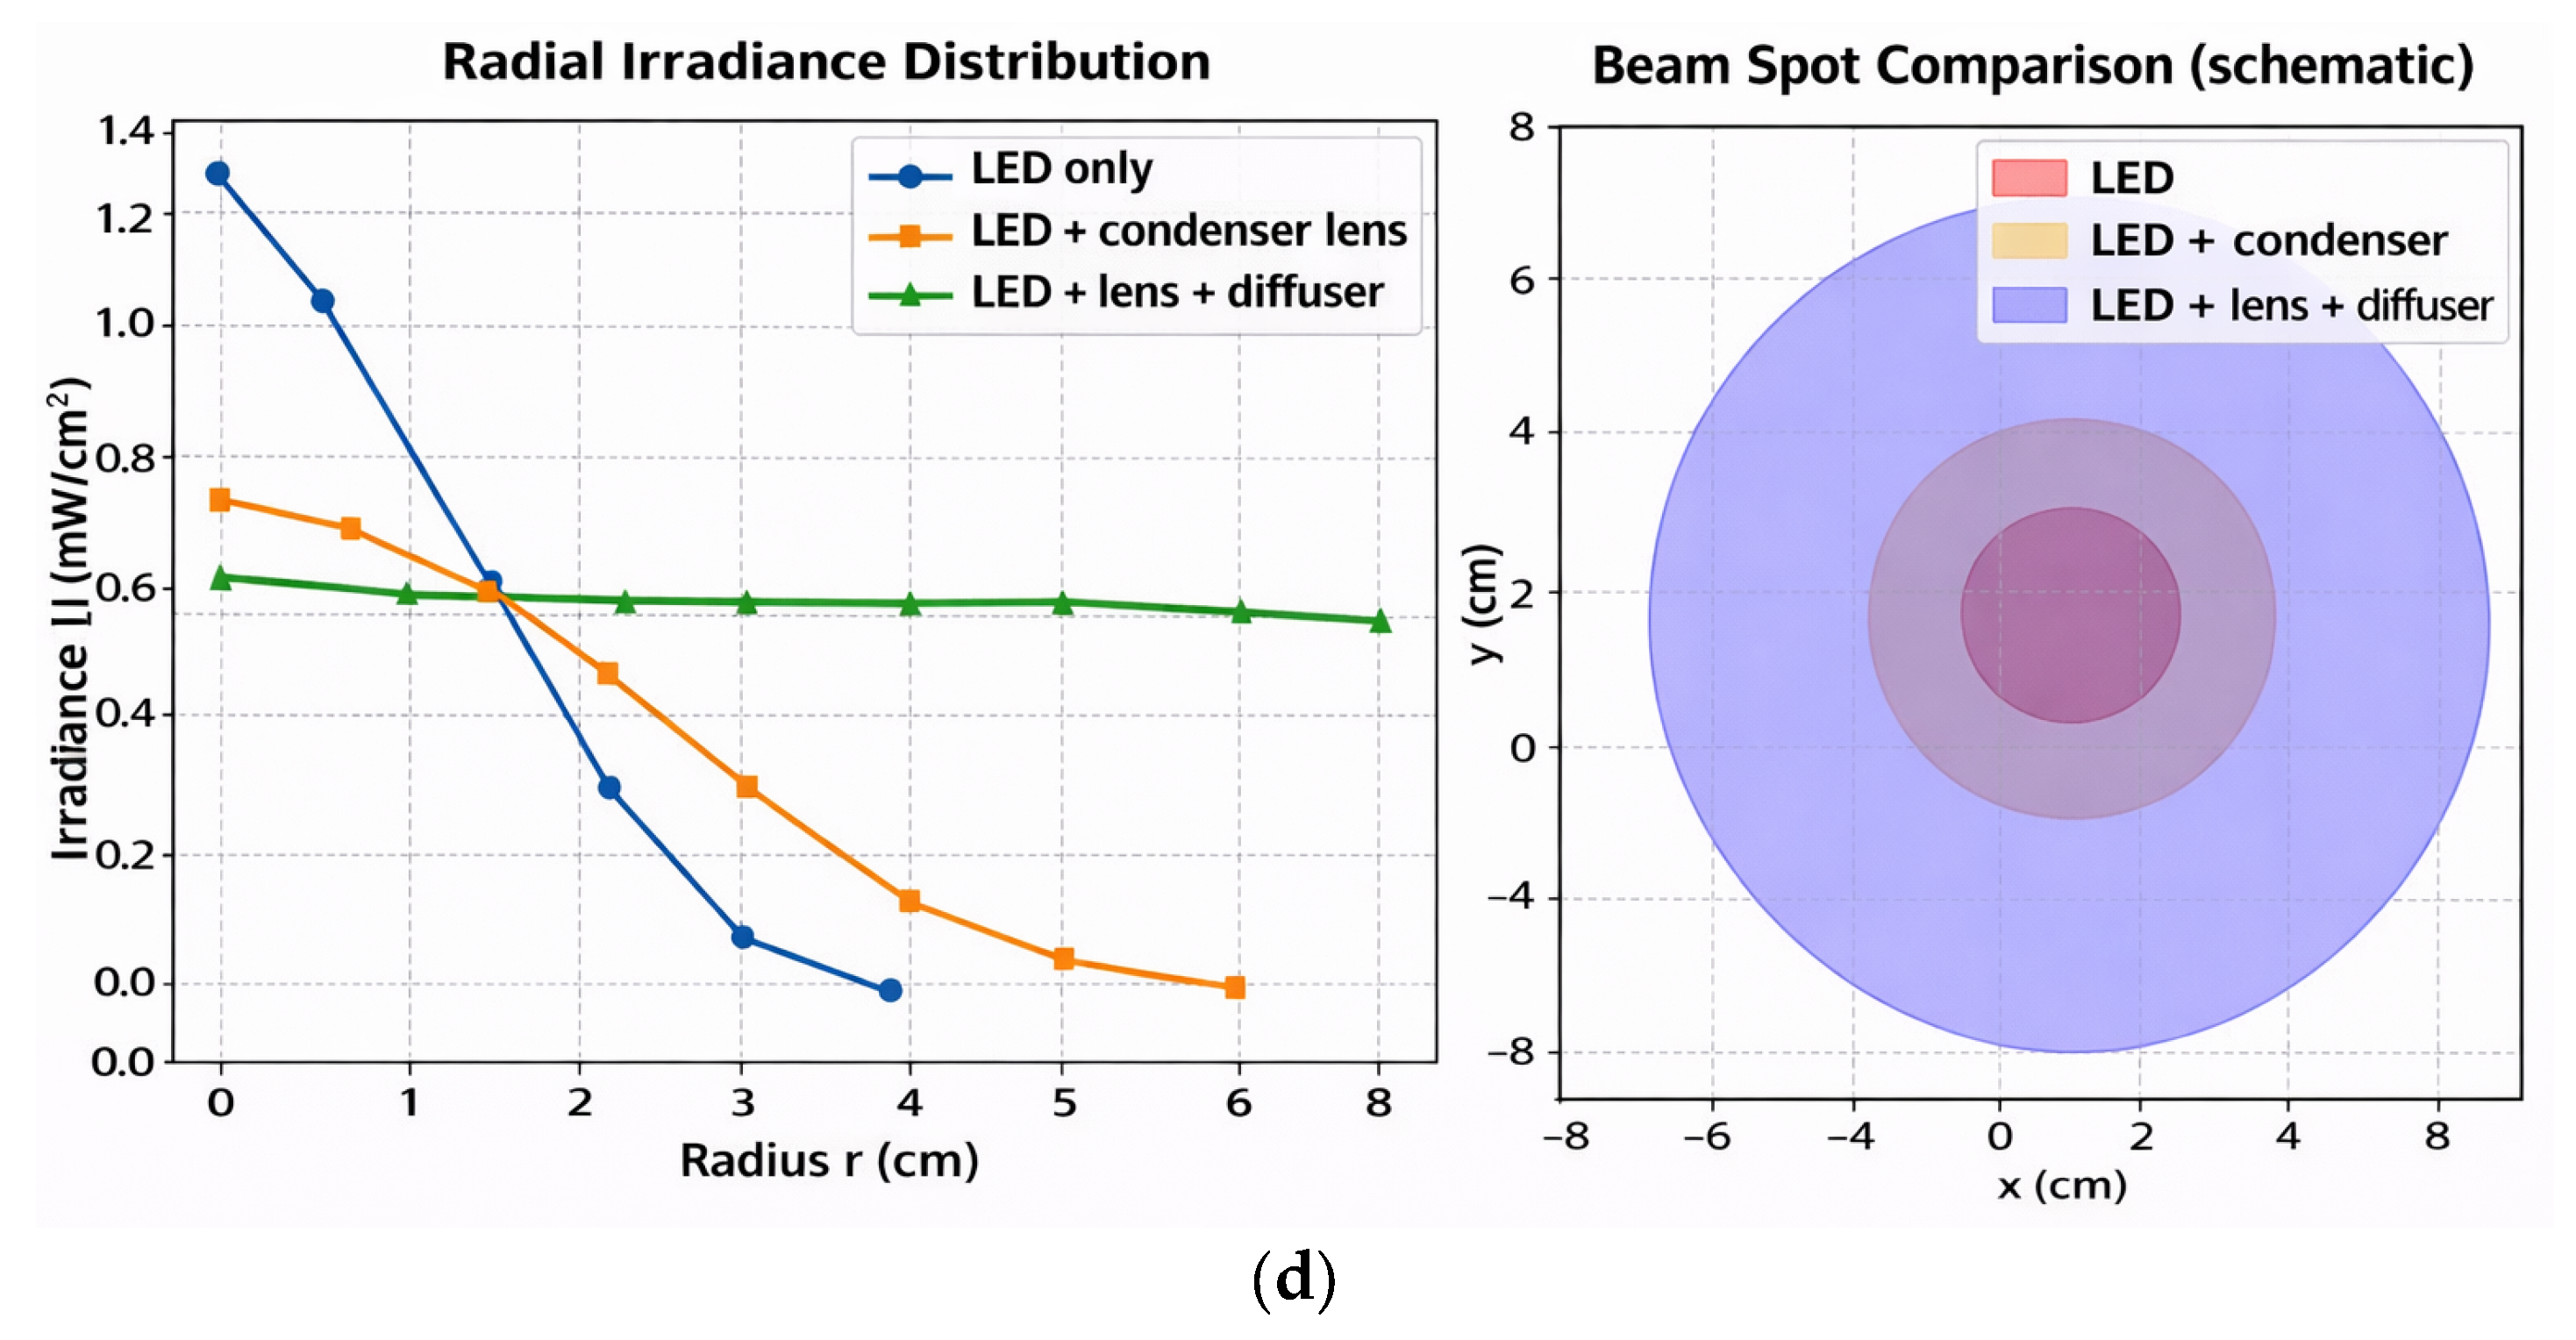
Examination of the radial illuminance distribution shows that LED illumination using a condenser lens increases the central illuminance, as shown in Figure 7b, but decreases rapidly as the radius increases. In contrast, LED illumination with a diffusing lens maintains illuminance over a wider radius, demonstrating an effective beam expansion. As summarized in Table 6, the condenser lens enhances central illuminance compared to single LED illumination. However, the rapid decrease in illuminance with increasing radius limits the usable illumination area.
Figure 7c further demonstrates the effect of the condenser lens on LED irradiation characteristics. The condenser lens directs the LED irradiation toward the optical axis, resulting in high central illuminance but a narrow irradiation range. As shown in the beam spot comparison in Figure 7d, LED irradiation using both a condenser lens and a diffusing lens provides the widest irradiation range.
Table 7 summarizes the illuminance distributions for all LED irradiation conditions. Unlike the case without a diffusing lens, LED irradiation using both a condenser lens and a diffusing lens maintains relatively uniform illuminance over a wide area. Although the central illuminance is reduced, the irradiation range and uniformity are significantly improved, making this configuration more suitable for fluorescence-guided observation of lesions.
The LED emission was approximated by a Gaussian distribution, as shown in Figure 8, and its angular distribution was analyzed according to Equation (9).
I ( θ ) = I 0 e x p 2 θ 2 θ 0 2
Here, E(θ) denotes the angular irradiance distribution (mW/cm2), derived from the Lambertian radiance of the LED, and θ0 represents the nominal half divergence angle of the LED (10°). Although the diffusion lens has a specified divergence angle of 20°, the experimentally measured final divergence angle expanded to approximately 50°. This broadening results from a combination of intrinsic LED divergence, refraction by the aspheric lens, scattering at the diffusion lens, and multipath overlap effects within the housing.
At a working distance of 10 cm, the beam diameter and irradiance were measured using a Thorlabs S121C power meter. Figure 6 shows the beam patterns obtained under three conditions: the LED alone, the LED with a condenser, and the LED with both a condenser and a diffusion lens. The divergence angle was calculated from the full width at half maximum of the radial irradiance profile.
In addition, Python-based ray tracing and irradiance distribution simulations were performed, as shown in Figure 7, to reproduce the experimental results, and the outcomes are summarized in Figure 8. In the simulation, the LED was modeled as a Gaussian source with a half divergence angle of 10°, the condenser as a focusing element, and the diffusion lens as a 20° scattering element. The results show that the LED alone produces a relatively narrow divergence of approximately 10°, whereas the complete optical system exhibits an expanded divergence of approximately 50°, consistent with the experimental observations.
Therefore, the discrepancy between the nominal divergence angle of the diffuser (20°) and the measured divergence angle (50°) is not attributable to the diffuser alone, but rather to the combined optical effects of LED emission, condenser refraction, diffuser scattering, and beam overlap within the housing.
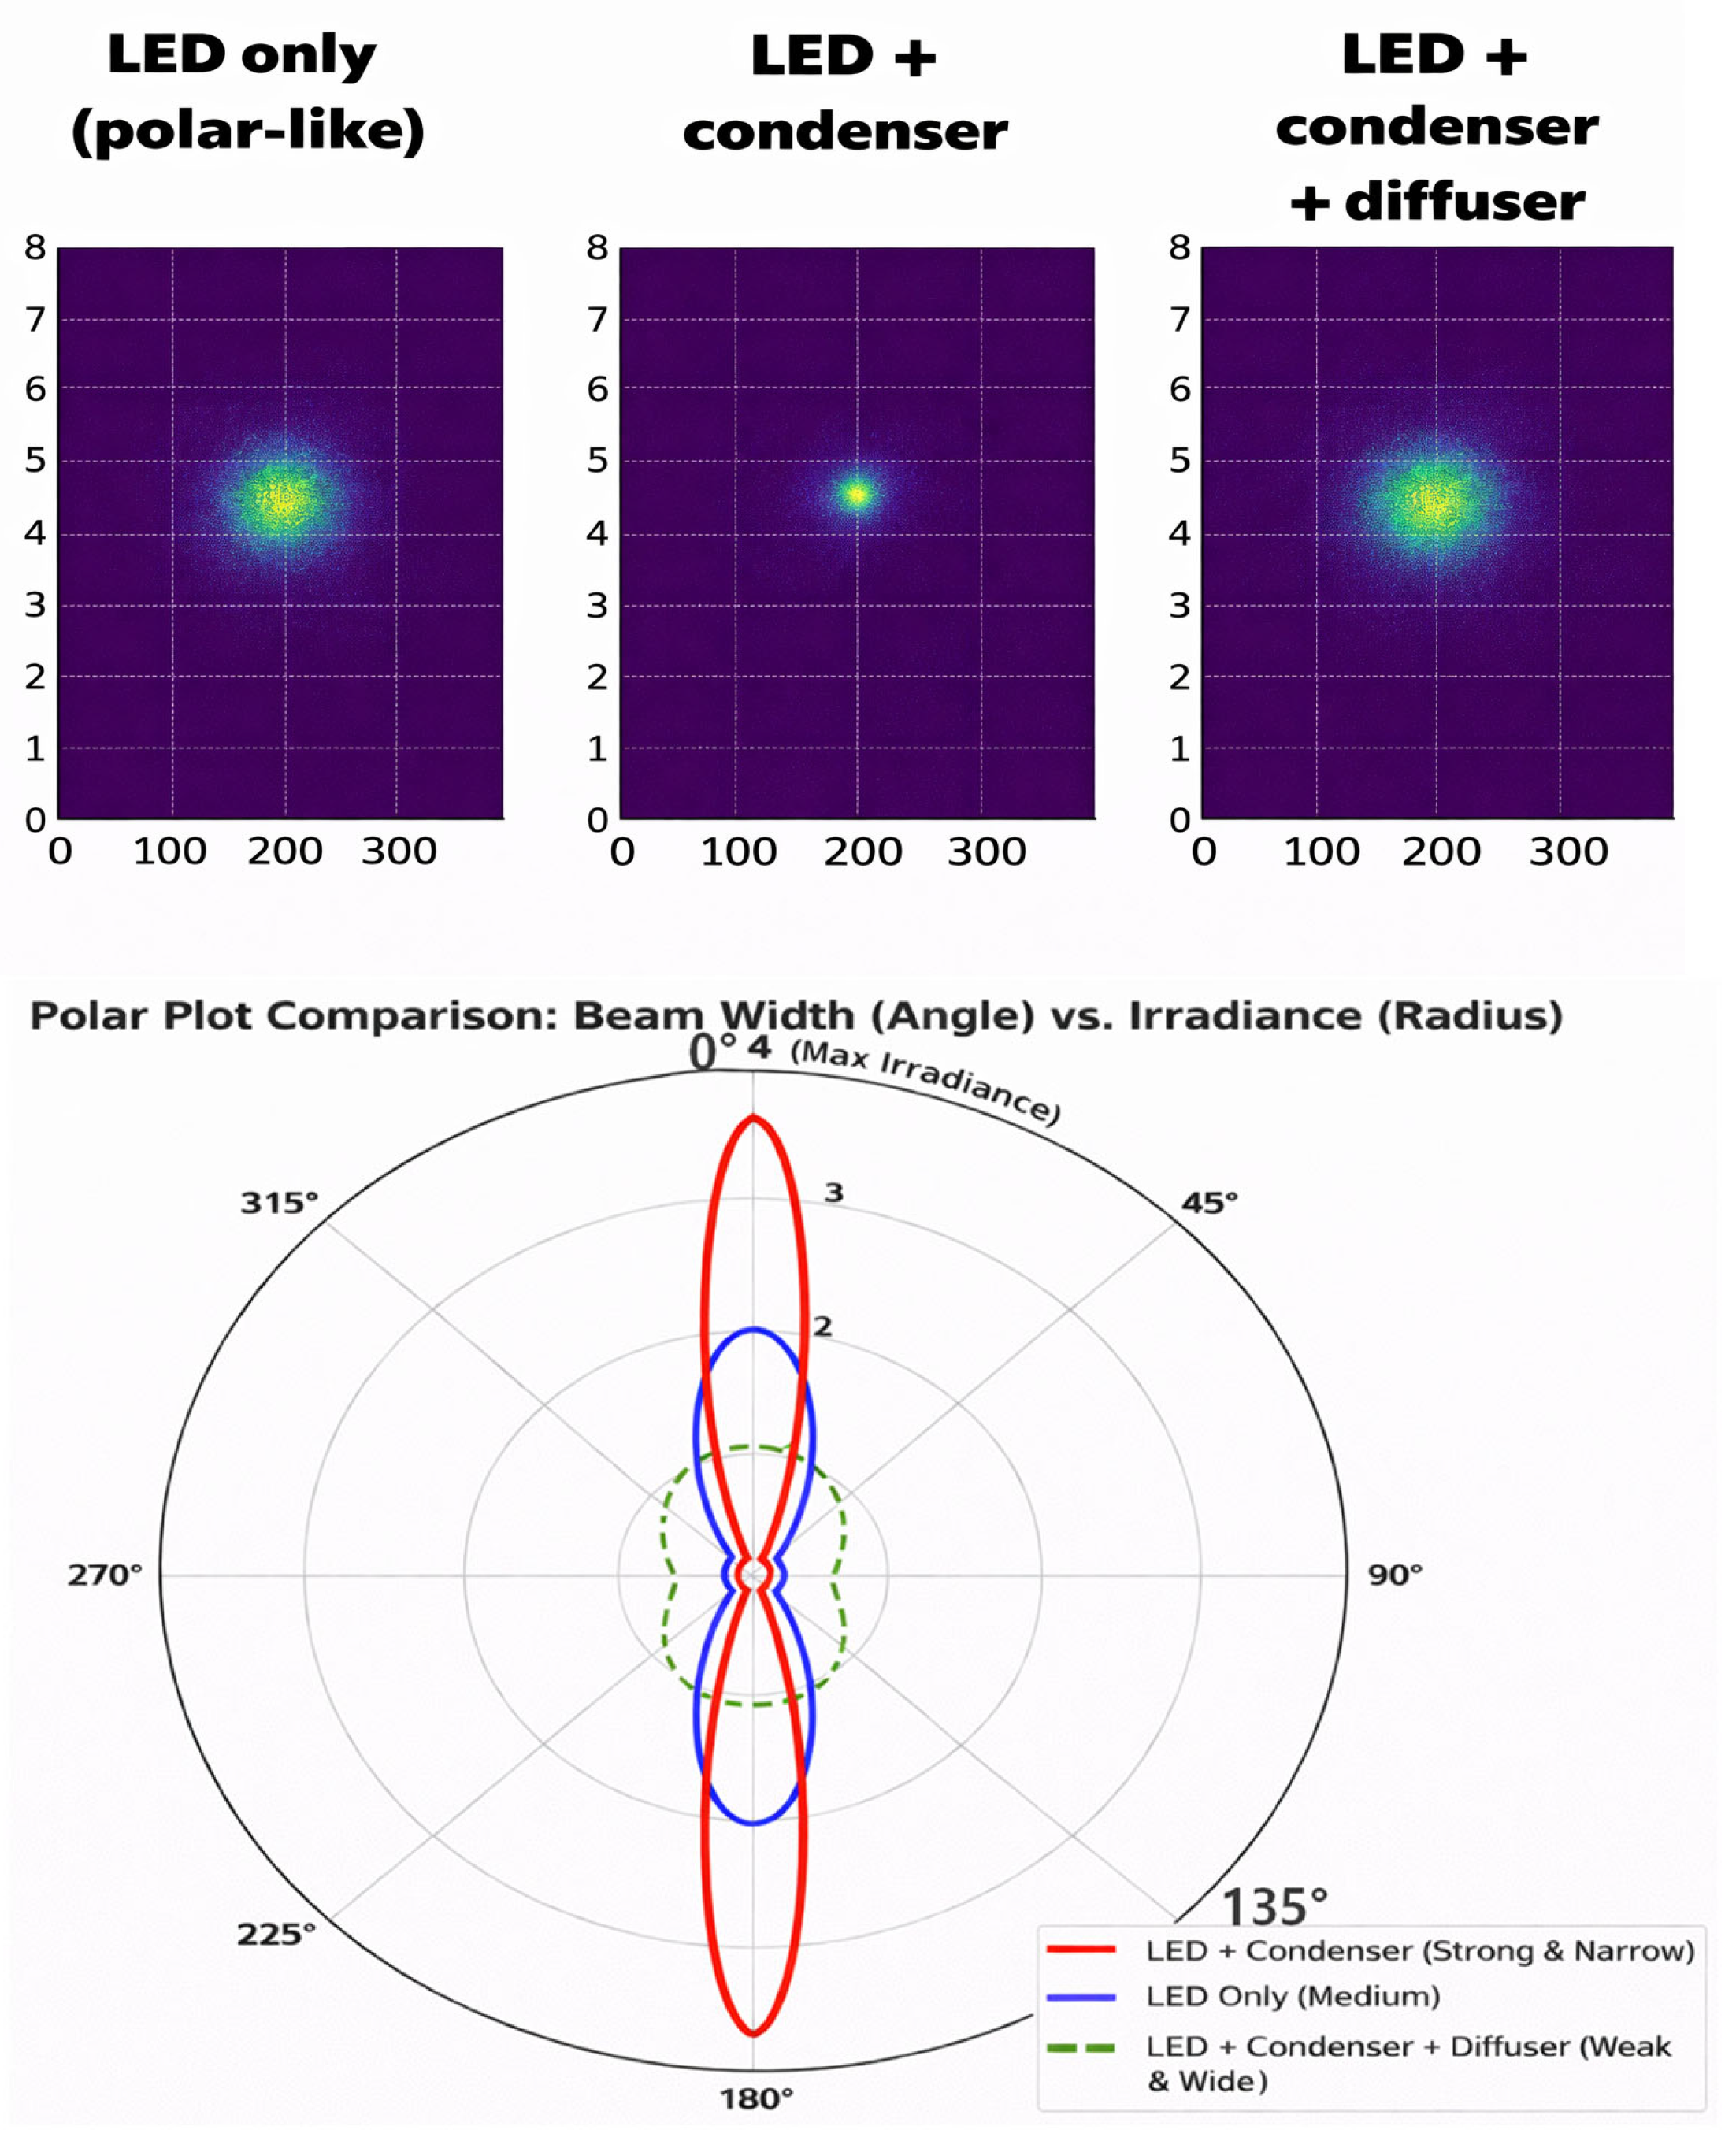
Python-based ray tracing and intensity distribution simulation results are shown in Figure 8. Figure 8 presents the simulated optical characteristics of the system (top). The beam cross-sectional intensity distributions for the LED alone, the LED with a condenser, and the LED with both a condenser and a diffusion lens are compared (middle left). The radial intensity profiles (middle right) and a schematic comparison of the beam spots are also presented (bottom). The polar coordinate representation illustrates the divergence characteristics. The table within the figure lists the intensity values measured at each radius.
The simulation confirms a divergence angle of 10° for the LED alone and 50° for the full optical system, which is consistent with the experimental results. These findings demonstrate that the divergence expansion arises from the combined effects of the LED, condenser, and diffuser, rather than from any single optical element.
To interpret the observed beam divergence of up to 50°, a Python-based ray tracing simulation was performed. The LED was modeled as a point source with a Gaussian angular distribution with a half divergence angle of 10°. The aspheric condenser lens was implemented using the thin lens approximation, while the diffuser was modeled by applying an additional Gaussian scattering distribution based on the manufacturer’s specification of 20°. The aperture limiting effect of the lens diameter (30 mm) and the actual spacing between the LED, lens, and diffuser were also incorporated into the model. The simulation results showed that, due to refraction and scattering, a portion of the rays diverged beyond the nominal 20°, producing a broadened beam with an overall divergence of approximately 50°. This result qualitatively agrees with the experimental observations and supports the proposed mechanism of beam expansion in the optical module.
Figure 9a shows the simulated spatial distribution of the beam emitted by the LED alone, obtained using a Monte Carlo ray tracing method. The divergence angle was estimated to be 10°, and spatial broadening was observed beyond z = 200 mm. Outside the ±5° range, the beam intensity decayed rapidly and was therefore neglected in the analysis. Figure 9b illustrates the back-traced optical ray paths when the LED was combined with a beam focusing condenser lens. Starting from a divergence angle of 10° at the LED, the beam passed through the condenser lens, resulting in increased intensity while the divergence angle slightly decreased to 9.89°.
Finally, Figure 9c presents the results for the proposed configuration consisting of the LED, condenser lens, and diffuser. In this case, the LED emission with a 10° divergence was first converged by the condenser lens and subsequently scattered by the diffuser, producing a substantially broader angular spread. The divergence expanded to nearly 50°, while the overall beam intensity decreased slightly. The propagation distance of the broadened beam was estimated to be 250 mm. Beyond ±25°, the beam intensity was sufficiently low to be neglected. To further analyze the beam characteristics, the ray tracing results were reconstructed in a three-dimensional environment, as shown in Figure 10.
Figure 10a compares the three-dimensional beam distributions for the LED only, LED + condenser, and LED + condenser + diffuser configurations. Under the third condition, the beam width expanded with only a slight reduction in beam intensity. This behavior is further illustrated by the cross-sectional beam profiles shown in Figure 10b. The results summarized in Figure 10c clearly show differences in beam width and intensity for each LED. As the beam width increased, the beam intensity exhibited a slight decreasing trend rather than an increase. Therefore, if the intensity is sufficient to secure an observation field through fluorescence emission induction, the configuration can be considered suitable for clinical use.
The proposed LED + optical condenser + beam focusing + diffuser structure was experimentally verified to maintain sufficient irradiation intensity while widening the beam width. This allows for uniform illumination of the entire lesion with a single LED, thereby enhancing the accuracy of blood flow assessment and lymph node observation during clinical fluorescence-guided surgery. In particular, the use of an engineered diffuser enables a wider irradiation range while reducing the number of LEDs, which in turn lowers equipment costs and power consumption, and minimizes overheating and shadowing during surgery. This structure supports safe and efficient fluorescence observation while maintaining simple surgical equipment. Therefore, the proposed design not only offers technological improvements but also enhances the convenience and efficiency of fluorescence-guided surgery in real clinical settings.
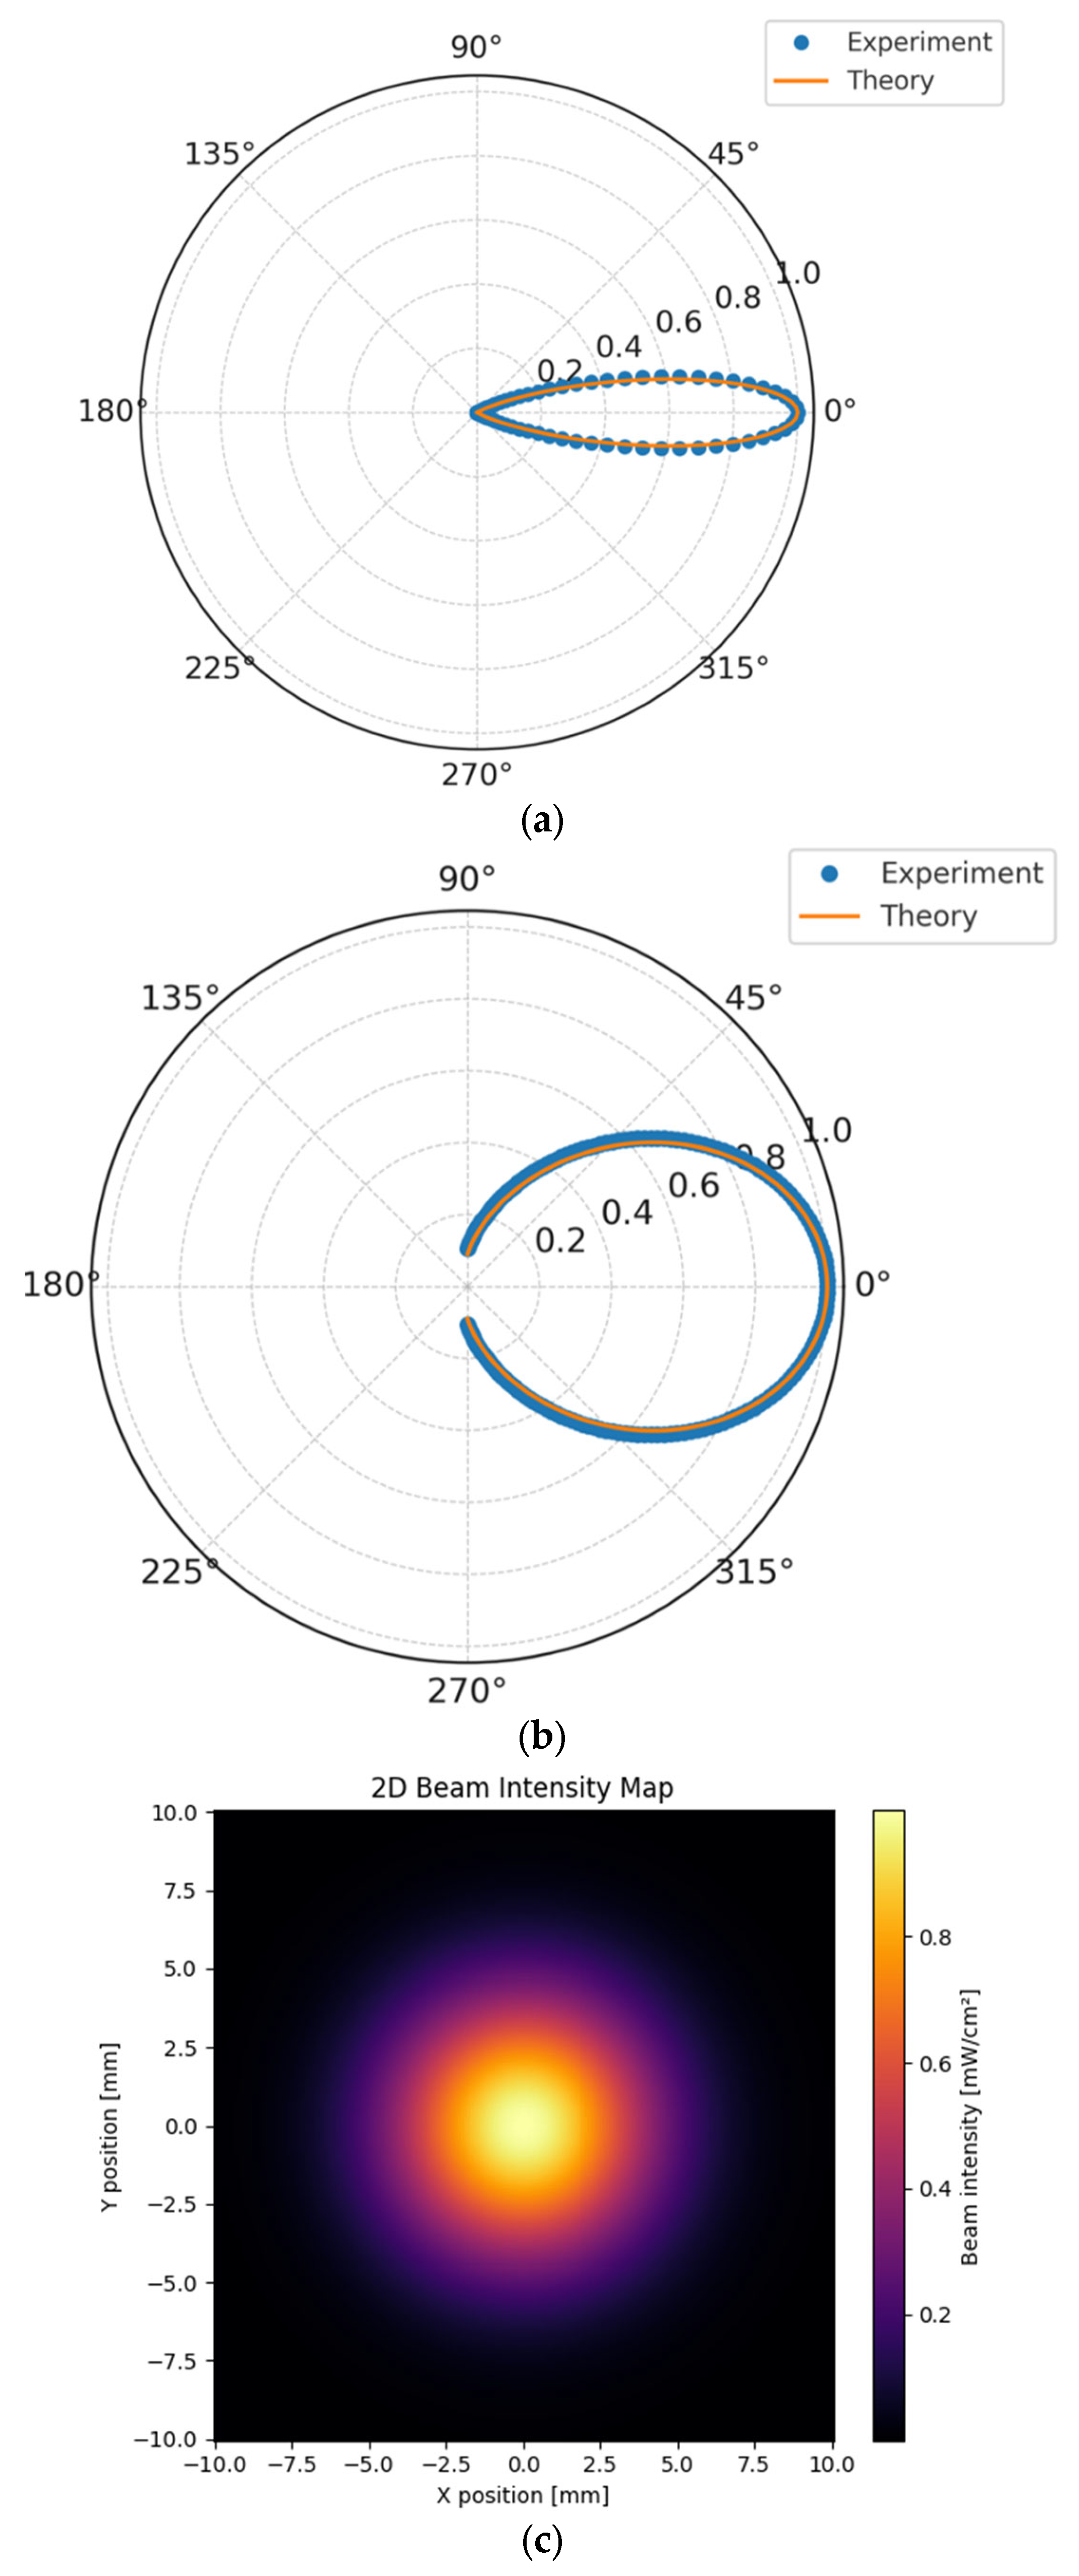
To visually assess the beam width, polar charts were reconstructed and analyzed, as shown in Figure 11a,b. The analysis indicated that the beam width of the LED without a lens was 15° (θ = 15°), whereas the beam width of the LED with a lens was 60° (θ = 60°)
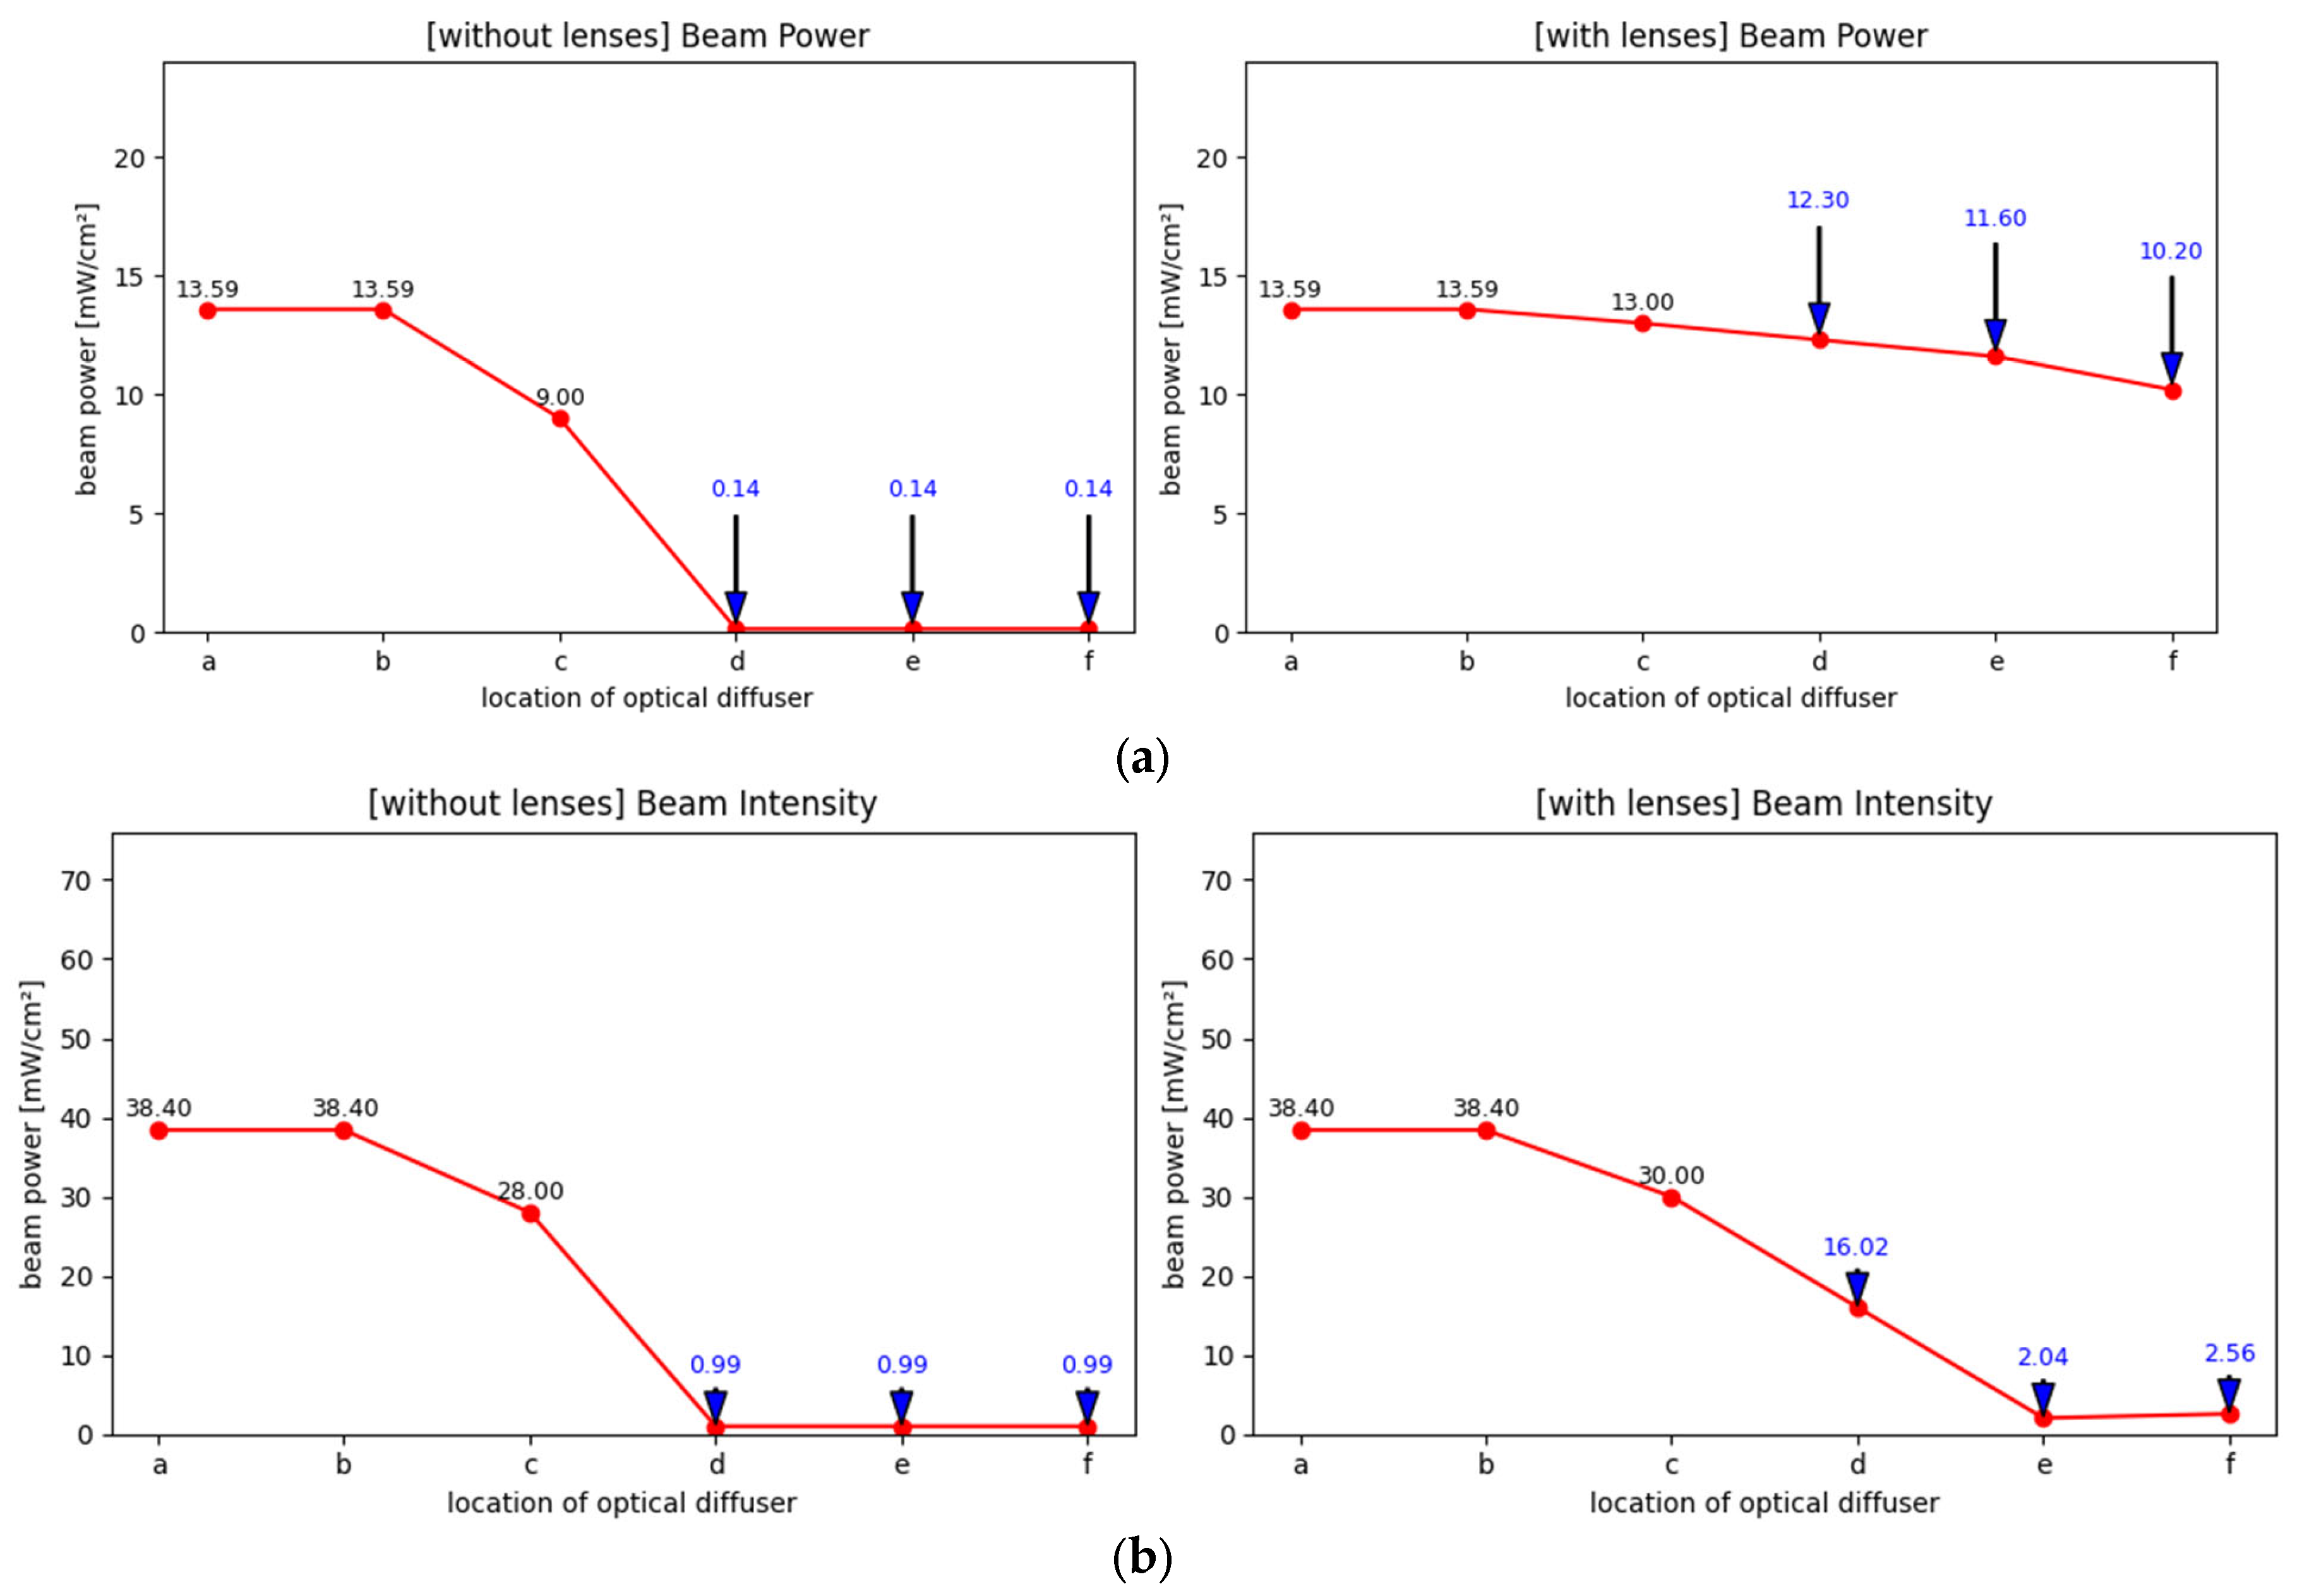
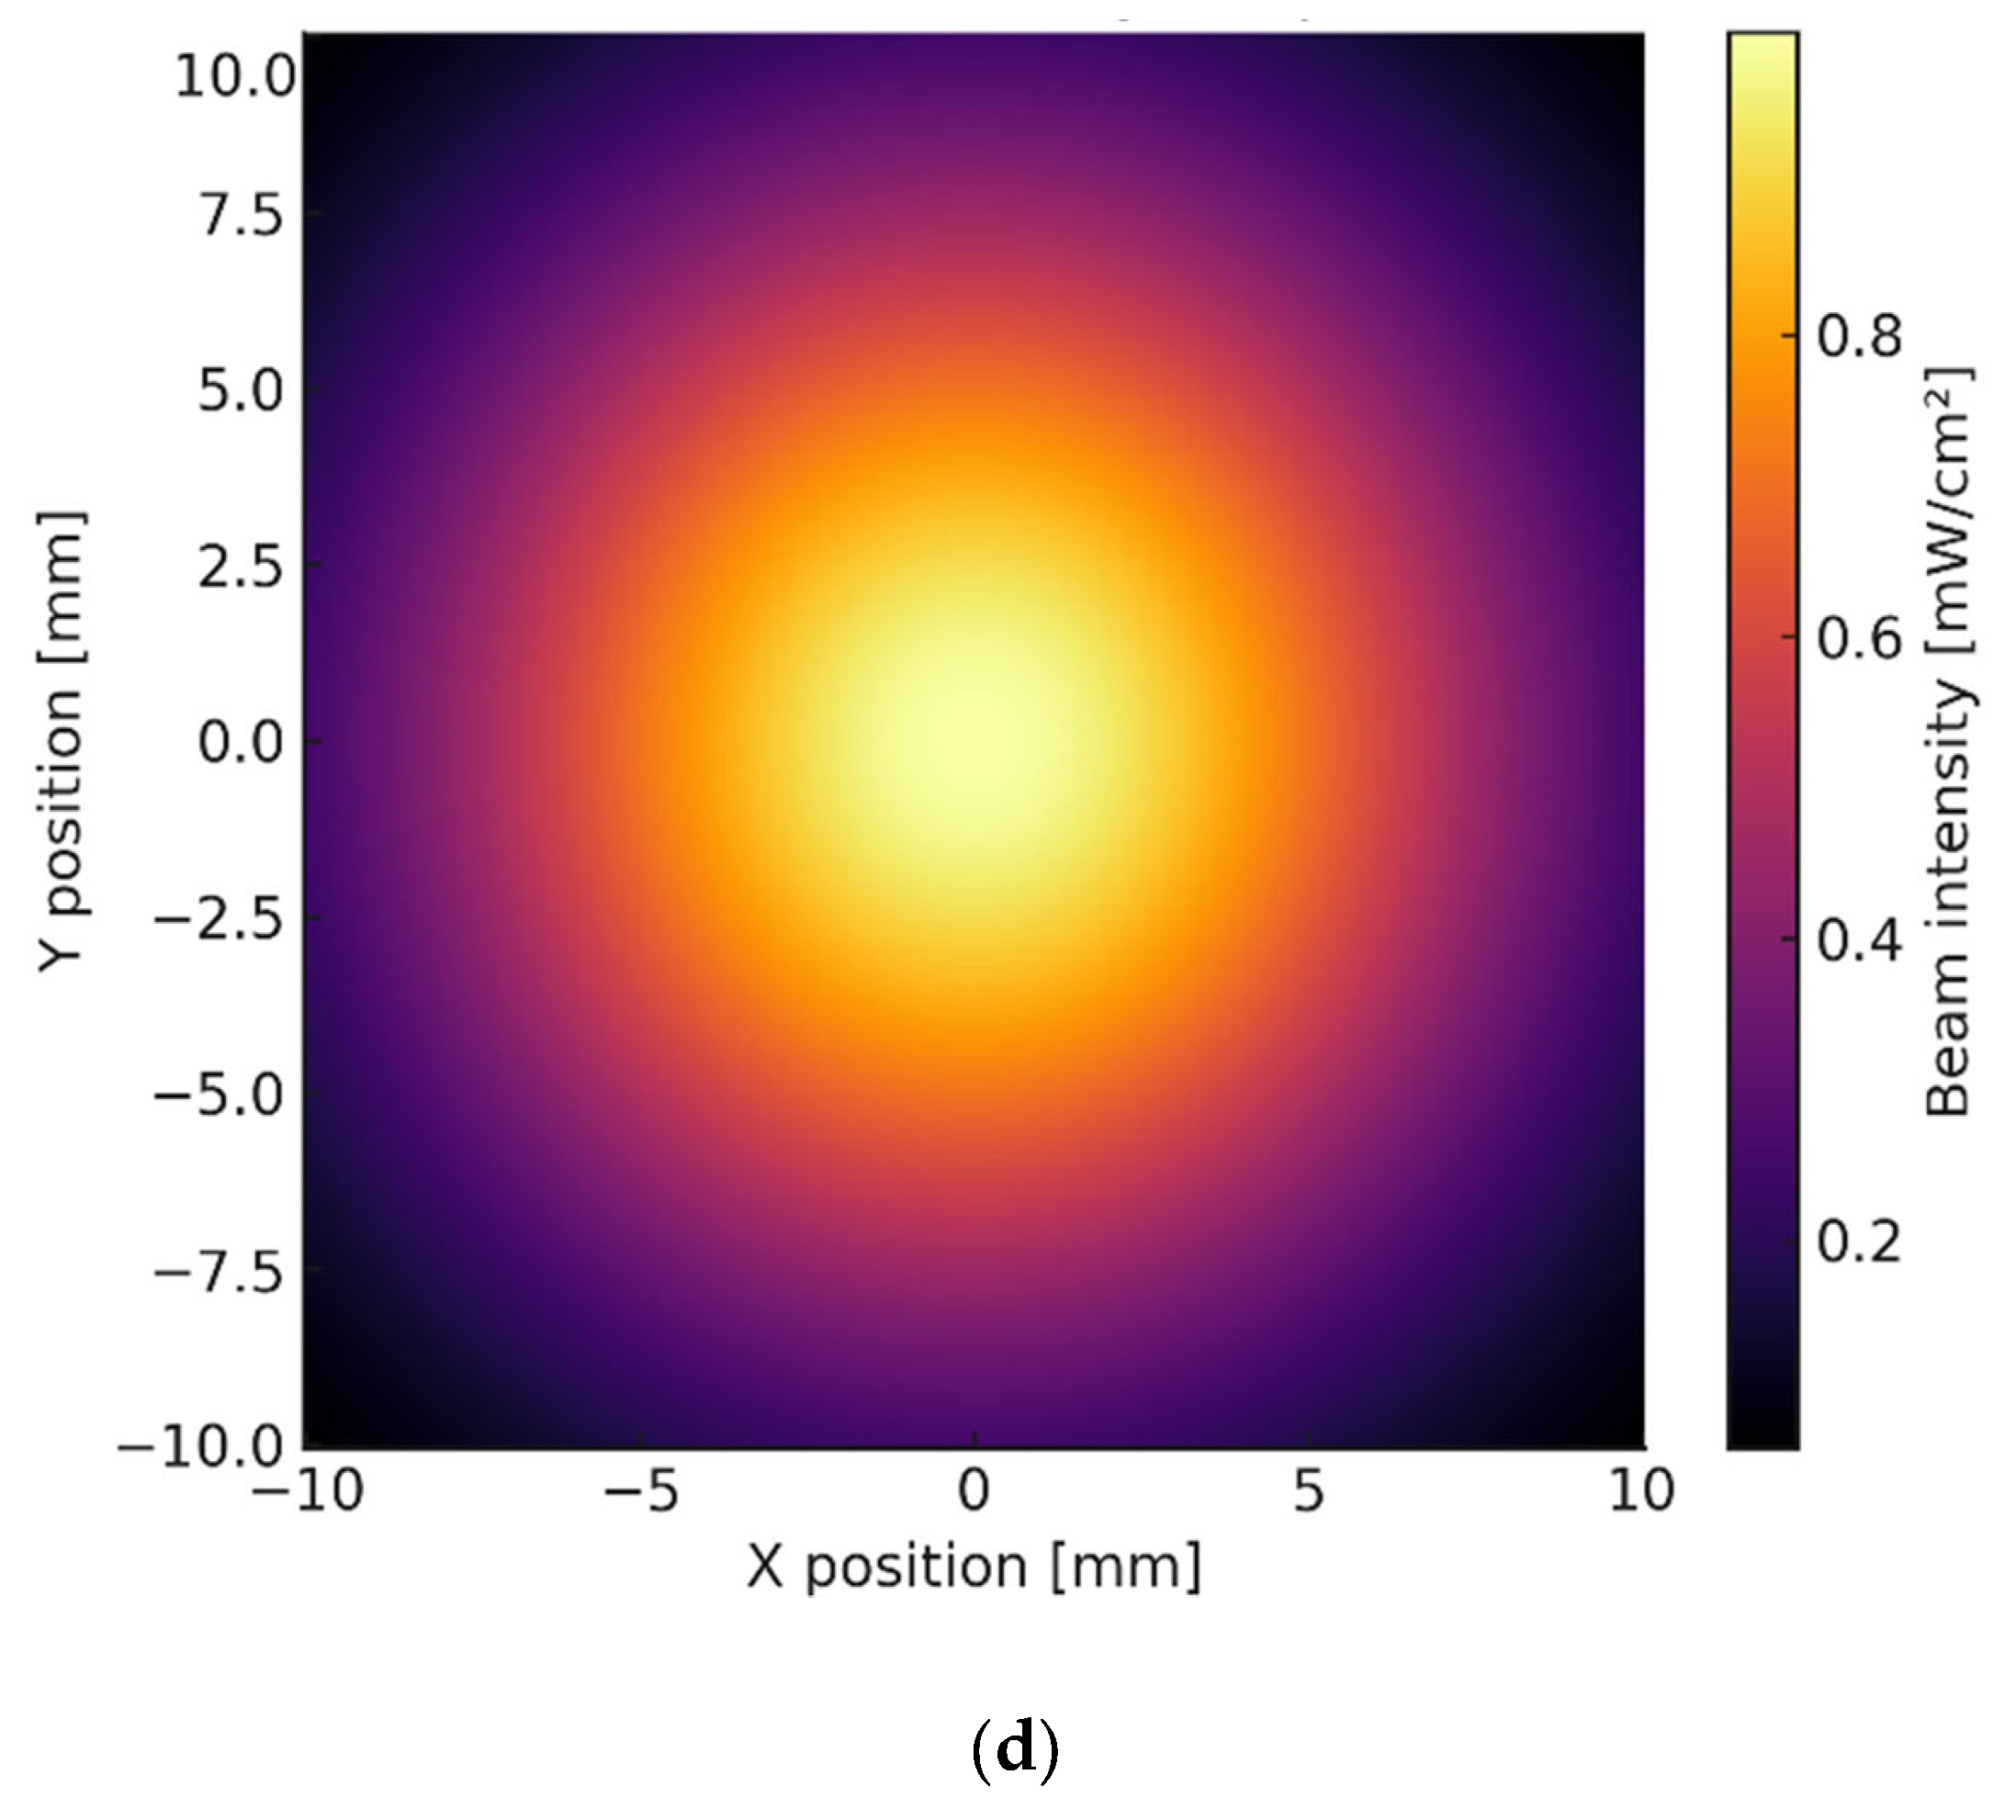
Figure 11c visualizes the LED beam intensity distribution on a 2D plane. Coordinates from −10 mm to +10 mm were generated on the X–Y plane, and a Gaussian beam model was applied to calculate the relative beam intensity at each position. The beam radius w0 was set to 3.0 mm, allowing simulation of the focused beam without a lens. The analyzed beam intensity was visualized using a color map (inferno), with the color bar providing a quantitative representation of intensity at each position. This visualization clearly shows a typical Gaussian beam profile, with maximum intensity at the center and exponentially decreasing intensity toward the periphery. Figure 11d shows the radiation pattern when a focusing lens is applied. Experimental results (symbols) and the theoretical model (solid lines) are presented in a polar format to display the omni directional angular distribution. With the lens, the half-power beamwidth (HPBW) expanded to approximately ±60°, which is about four times wider than the ±15° observed under the no-lens condition. This beam expansion results from the lens concentrating and redistributing light emitted from the LED surface. Overall, the experimental data and theoretical model show excellent quantitative agreement across the entire angular range. The measured LED beam at the target was characterized separately in terms of power (P, total radiant flux, mW) and intensity (I, radiant flux per unit area, mW/cm2), which is shown in Figure 12a,b. At the center of the beam, the peak intensity reached 38.4 mW/cm2 , while the total collected power at the sensor was 13.59 mW. This indicates that the total emitted power of the LED remained essentially constant, whereas the local intensity varied depending on beam focusing and spreading. The results of this analysis are summarized in Table 8. Radiant flux (mW) and irradiance (mW/cm2) were measured to evaluate the optical performance of the LED module, as the excitation wavelength lies outside the visible spectrum.
Additional metrics include brightness, illuminance, and irradiance. The illumination area serves as a reference for analyzing the beam width. Note that point a in the illumination area is at 0.00 cm2, as it corresponds to the origin, making distance measurement impossible. However, since each square measures 1 cm, the distance from a to both sides of b is 2 cm. Similarly, the distance from a to c (on both sides) corresponds to 4 cm. The reason that d (without a lens) is 0.00 is that the LED beam does not reach the dark area, making measurement impossible; therefore, it is regarded as zero.
The measured power at the origin (point a) in Table 8 was the same regardless of the presence of a lens, confirming that the total optical output of the LED remains constant. Theoretically, expanding the beam width by a factor of 2.5 would reduce the average intensity by approximately 6.25 times. However, the lens simultaneously introduces controlled beam refraction and focusing, redistributing the light in a way that minimizes the reduction in central intensity while broadening the overall illumination area. Moreover, since the sensor’s measurement area is constant, small differences in intensity may appear numerically identical. Analysis of the actual beam profile confirmed that, even with the lens inserted, the central intensity remained relatively stable while the beam width expanded.
Therefore, the experimental results and theoretical calculations in Figure 13 are presented using different colors and markers for clarity. The integrated value of the calculated beam intensity exceeding the LED’s maximum output (200 mW, Table 8) results from applying the central intensity uniformly across the entire area without considering sensor calibration factors or reflection and scattering losses. Thus, the actual LED output remains within the specified range, and central and average intensities should be interpreted separately.
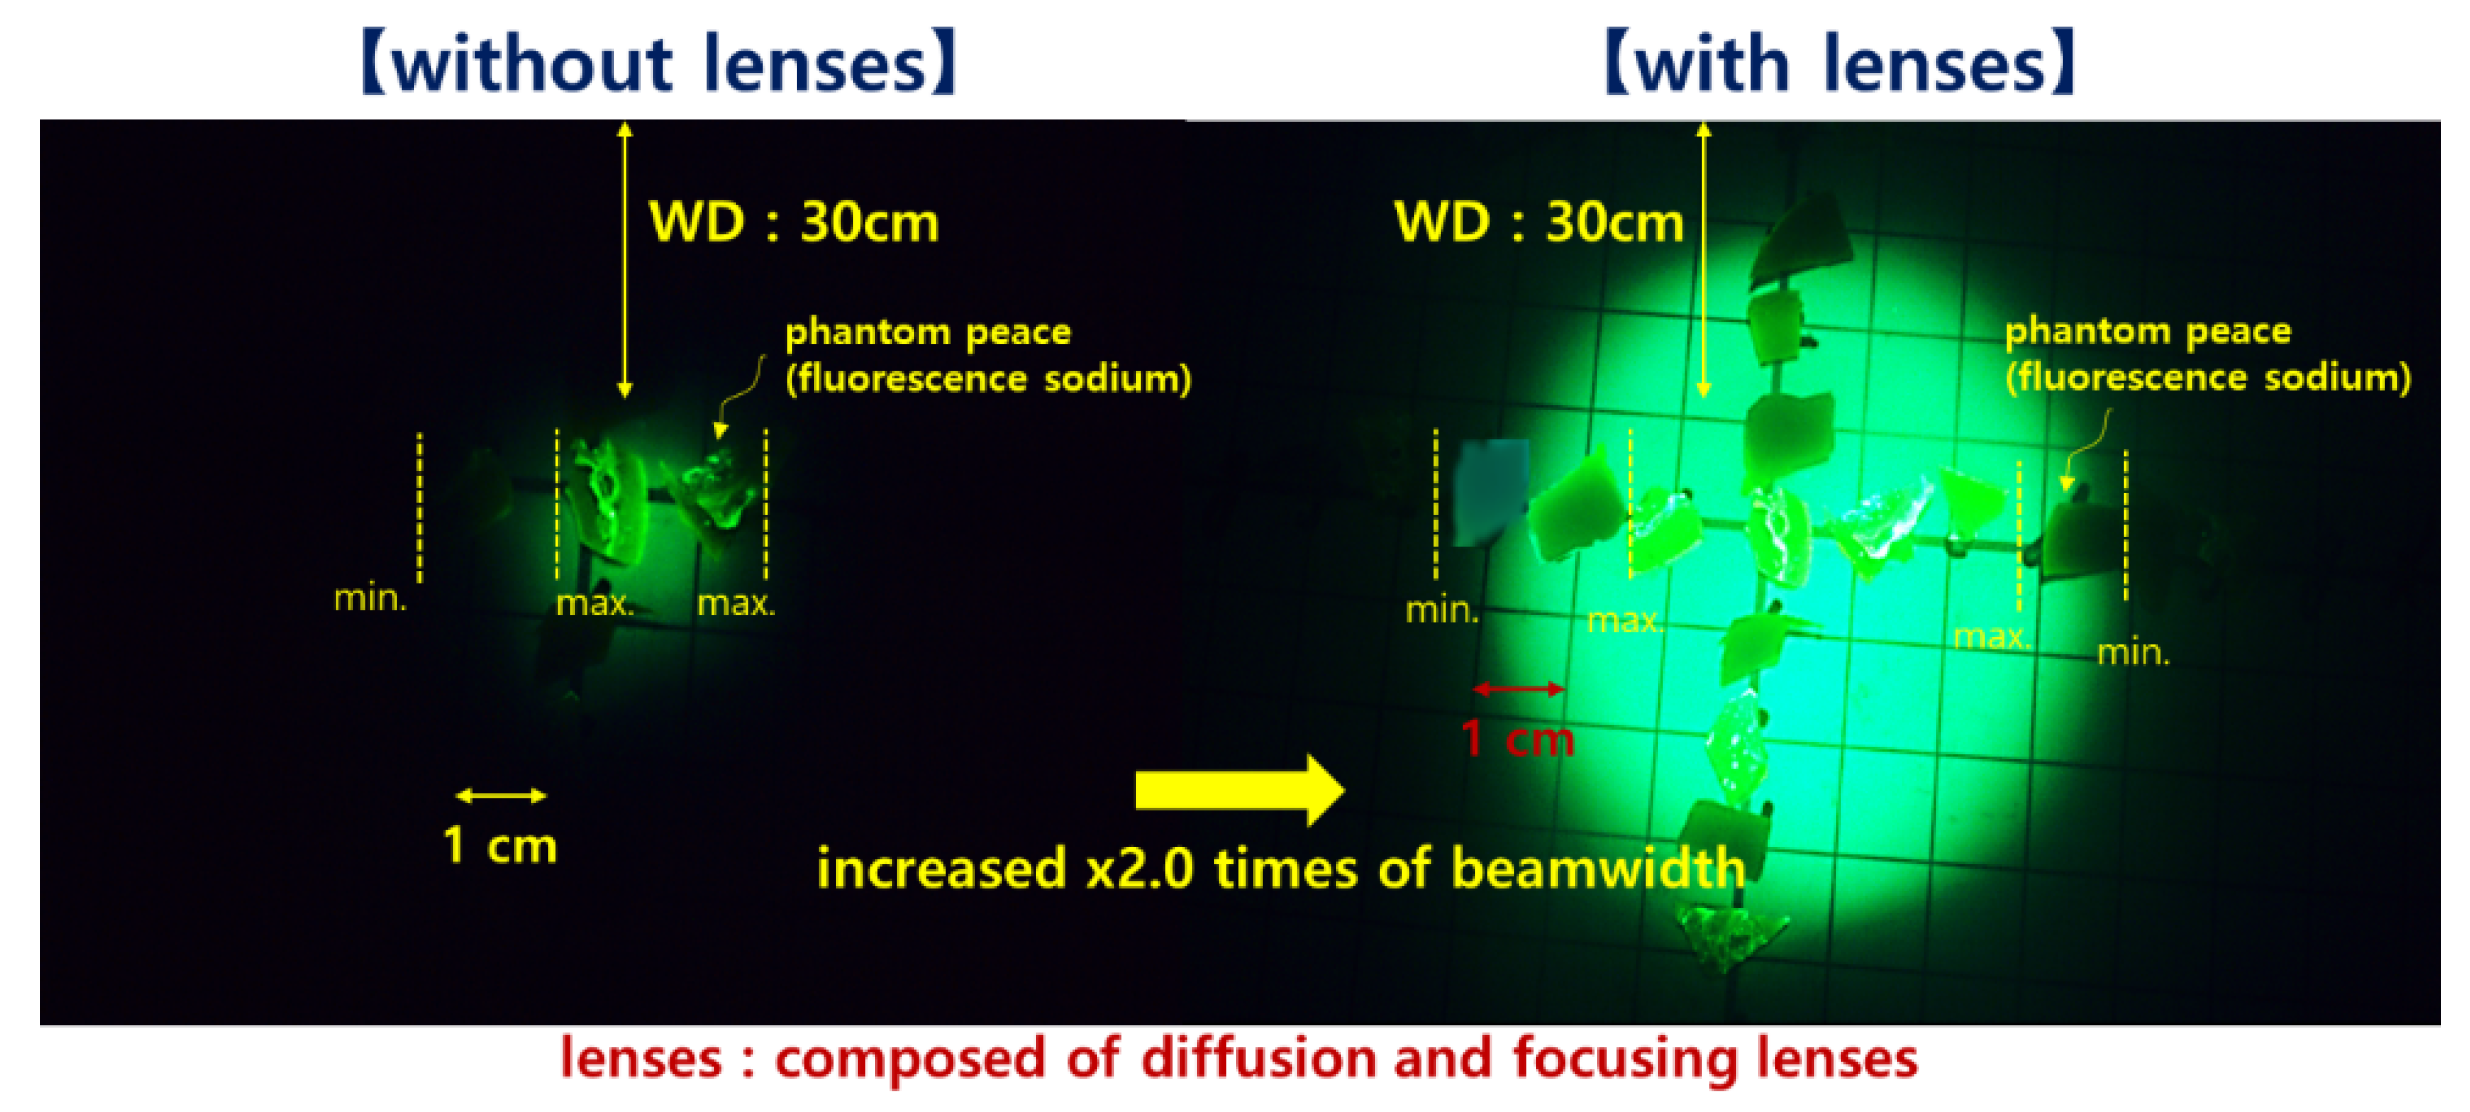
To comparatively evaluate the effect of beam spreading, Figure 13 presents fluorescence images captured by an NIR camera using a phantom injected with a fluorescent contrast agent. Because fluorescence emission intensity is directly dependent on the excitation light intensity, the observed increase in fluorescence area with the lens-equipped LED indicates a wider and more uniform distribution of excitation light while maintaining sufficient local intensity for fluorescence excitation.
Measurements were conducted to evaluate the emission performance. The LED light was projected onto a paper surface to observe the extent of light spreading across a grid. Small pieces of fluorescent phantom were placed at each grid point to determine the maximum range of detectable fluorescence. Since the background paper was non fluorescent, the measured fluorescence signal originated solely from the phantom pieces. After placing fluorescent phantom samples at each coordinate and monitoring them using camera imaging, a more than twofold increase in fluorescence emission was observed for the LED with a lens compared to the LED without a lens. To further evaluate the light source performance of the proposed method, a phantom made of liquid latex rubber was injected with a fluorescent contrast agent, sodium fluorescein (Alcon, Seoul, Republic of Korea, 5 mL of fluorescein injection 10%), at a concentration of 0.02 mM [23]. This phantom represented lesions and had an approximate size of 0.5 cm. For the LED without a lens, the fluorescence emission range in its brightest state was approximately 2 cm (from point a to b), and the fluorescence signal became undetectable at approximately 4 cm (from point a to c). At this distance, the fluorescence intensity was very weak. Therefore, a conventional LED can visualize lesions within an area of approximately 2 cm. In contrast, when a lens was inserted, the beam width more than doubled, allowing bright and uniform fluorescence emission to be observed over a range of approximately 3 cm (from point a to c). The area with strong fluorescence emission extended to approximately 4 cm, and detectable fluorescence was observed up to approximately 6 cm (point d), where the signal began to weaken. Even at reduced intensity, the fluorescence signal remained sufficient for observation, indicating that further improvement in fluorescence emission detection is unnecessary.
In this figure, fluorescence from the phantom was induced using LED illumination and captured with an NIR camera. Fluorescence is best observed under dark conditions; however, under such conditions, the paper background is barely visible. Therefore, when viewing the captured images on a computer, false color mapping was applied to display the phantom in green. The green color is used solely for visual emphasis of the phantom and does not affect data interpretation. Observation of lesion color classification through induced fluorescence emission is limited by the LED beam width, which restricts the ability to assess the entire lesion. This limitation prevents full lesion observation during monitoring and highlights the need for a method to expand the beam width. Although widening the beam is essential, it inevitably reduces the average excitation intensity (mW/cm2) because the same total optical power is distributed over a larger area. Therefore, the design must minimize this reduction in intensity while increasing the beam width to ensure effective fluorescence excitation [3,4]. Accordingly, without requiring additional circuit modifications or a new semiconductor fabrication process, a lens providing both beam diffusion and focusing effects can be hybrid-mounted onto an existing LED and integrated into a housing fabricated using 3D printing. This configuration enables sufficient performance for clinical applications while reducing technological complexity and lowering unit costs associated with semiconductor processing.
Figure 6c shows a 2.5-fold increase in beam width, whereas Figure 13 demonstrates a 2.0-fold increase. This 0.5-fold discrepancy is attributed to differences in the experimental setup. In Figure 6c, the LED directly irradiated the target, resulting in unchanged beam spreading characteristics. In contrast, Figure 13 employed a long-pass filter (FELH-0800, Thorlabs, New York, NY, USA) to isolate fluorescence emission wavelengths for imaging. This filter ensures that only fluorescence emission reaches the camera sensor while suppressing residual LED wavelengths and background noise. As a result, the observed beam width appears approximately 0.5 times narrower due to filter-induced attenuation. Future studies are required to compensate for this beam width reduction.

4. Discussion

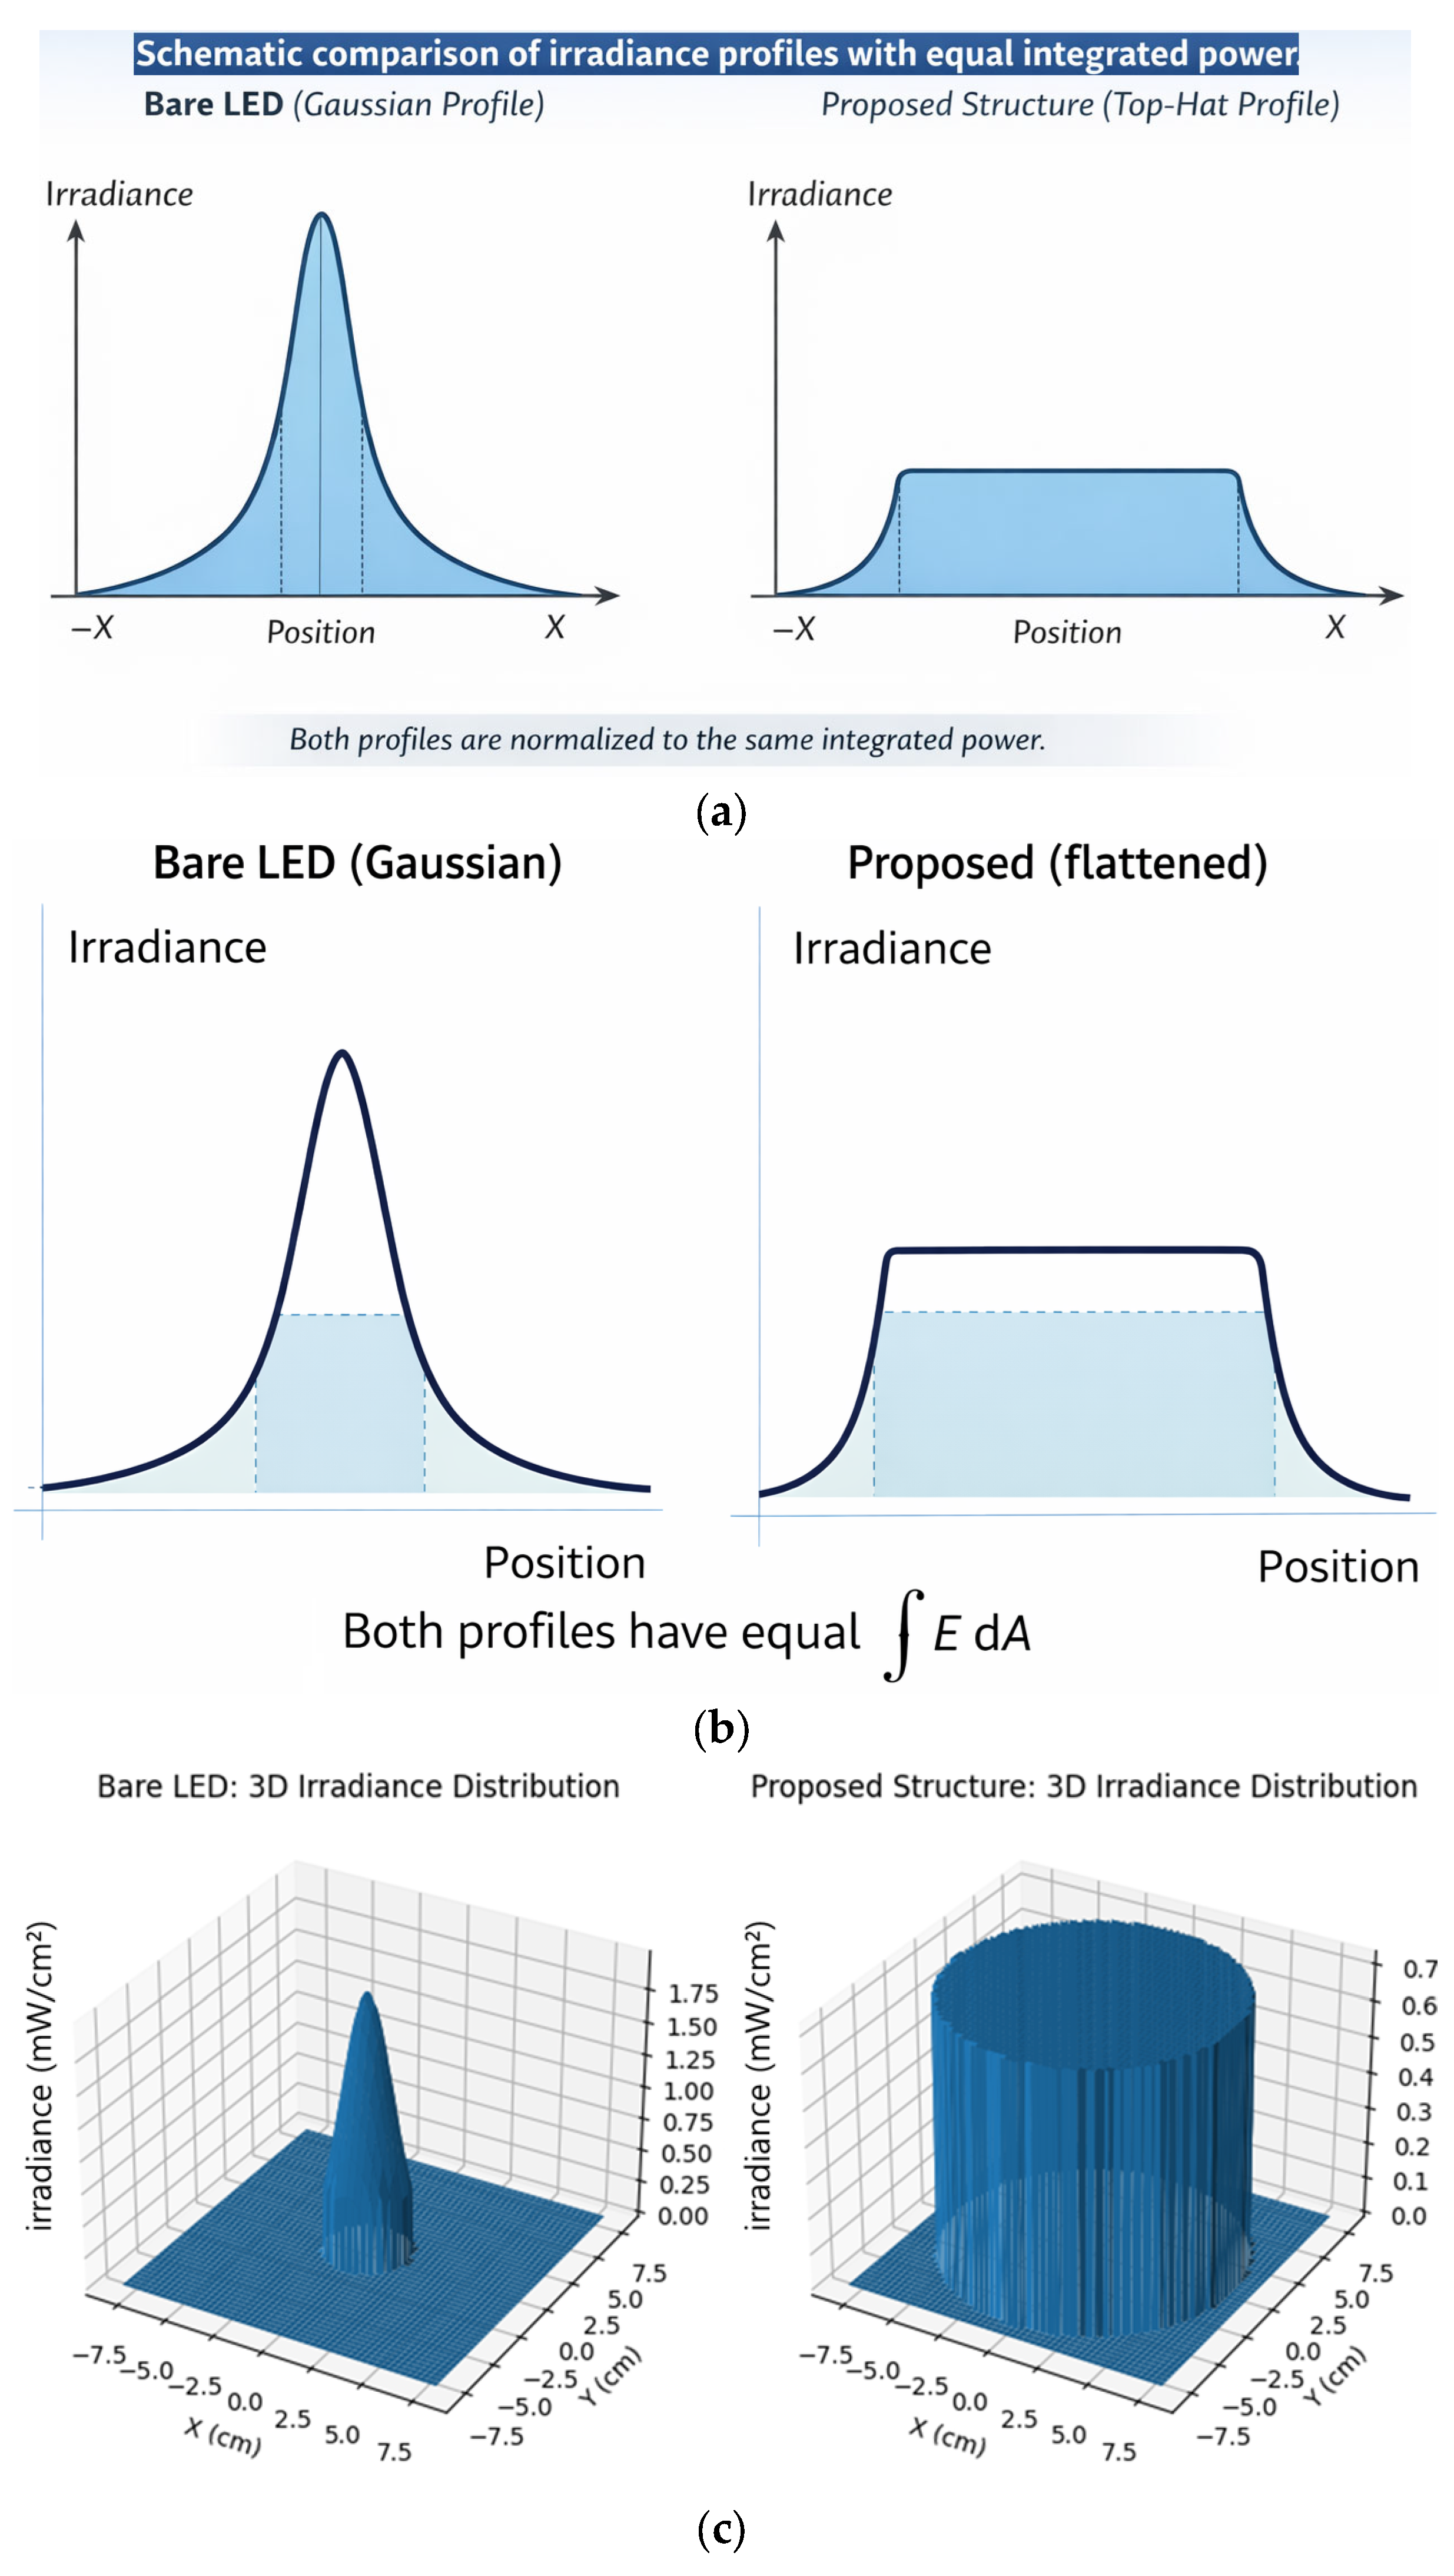
In this experiment, the working distance (WD) between the LED and the target was 30 cm, the illumination wavelength was 780 nm, and the LED output power was 200 mW. To induce fluorescence emission, the LED must provide an irradiance of at least 0.6 mW/cm2 at the lesion surface [3,4]. Based on the experimental results, a central irradiance of 0.72 mW/cm2 was maintained, which was sufficient to achieve effective fluorescence excitation. Because the bare LED exhibits a strongly peaked Gaussian distribution, its peak irradiance is significantly higher than its spatially averaged value. For a 2D Gaussian beam, the peak irradiance E0 is related to total power P by P = (π w2/2) E0, which explicitly shows that peak irradiance and total energy are not linearly proportional. This expansion was achieved by redistributing the highly concentrated energy from the center of the bare LED toward the periphery. These findings are summarized in Table 9 and show significant improvements compared to previous studies. To verify the conservation of energy, we calculated the volume under the irradiance surfaces—representing the total optical power (Ptotal)—by integrating the irradiance distribution across the entire spot area ( P = E d A ) using the following relationship given in Equation (10).
P = 0 R E ( r ) · 2 π r d r
Energy conservation is evaluated through spatial integration of the irradiance distributions, as shown in Table 9 and Figure 14, rather than by direct comparison of peak irradiance values. For the bare LED, the integrated power was 138.4 mW, while the proposed structure yielded 112.3 mW. This indicates that the total optical power was largely conserved, with a 18.8% transmission loss attributed to the absorption and scattering within the condenser and diffuser lenses, as shown in Figure 14a,b and Table 9, and the volume under each surface corresponds to the spatially integrated radiant power.
The bare LED shows a concentrated Gaussian distribution with high peak irradiance but a limited illumination area, and the proposed optical structure redistributes the central energy to the periphery, creating a wider and more uniform profile. Although the peak irradiance decreases, the total volume under the surface (spatially integrated irradiance) remains physically consistent with the principle of energy conservation, within the expected optical transmission losses introduced by the optical components.
The numerical integration was performed over the full measured irradiance map using discrete summation of pixel-wise irradiance values multiplied by the corresponding area elements.
Energy conservation is evaluated through spatial integration of irradiance distributions, as shown in Table 9 and Figure 14, rather than by comparing peak irradiance values.
This quantitative analysis directly addresses the energy conservation concern associated with expanding the beam diameter from 4.0 cm to 14.1 cm while keeping the average irradiance at 0.72 mW/cm2. The absolute values of integrated power are consistent with the nominal optical output of the LED (150 mW), considering coupling efficiency and measurement aperture.
At short working distances, even relatively low LED output power can produce sufficiently high irradiance at the target because geometric spreading losses are minimal. Although lasers can deliver higher power to the target [24], they generate substantial heat, resulting in increased power consumption, thermal management challenges, and potential damage to the laser module. In addition, safety concerns impose stricter regulatory requirements for laser-based medical devices. In contrast, increasing LED output power improves system performance [25,26,27] by providing sufficient irradiance for fluorescence excitation [28,29,30]. Moreover, a wider beam width further enhances performance [31,32] by enabling uniform illumination of the entire lesion, thereby facilitating comprehensive fluorescence evaluation. LEDs with intrinsically wide beam widths from a single source demonstrate particularly strong performance in this regard [31,32].
As shown in Table 10, while the peak irradiance of the bare LED was significantly higher at its narrow center, the proposed module successfully converted this peaked distribution into a wider, more uniform “top hat” like profile. This redistribution allows for a 3.5-fold increase in diameter without dropping the average irradiance below the excitation threshold, precisely because the ‘wasted’ excess energy at the bare LED’s center was effectively spread across the 14.1 cm field of view.
If the results of this study are applied to medical environments and implemented in real clinical settings through clinical trials and medical device approval procedures, this work is expected to serve as a practical reference for medical device developers, hospitals, and clinical professionals. In particular, given the requirement to cite relevant references in medical device approval plans and in technical and performance documentation submitted for regulatory approval, the optical performance evaluation metrics and experimental validation results presented in this study can provide valuable supporting evidence. This review addresses key requirements for medical device approval and discusses the clinical and institutional applicability of the proposed approach.
To this end, a usability evaluation should be conducted as part of the medical device approval process to demonstrate practical usability in clinical environments. Furthermore, if additional research and development are pursued based on the findings of this study, the research topics presented in this review will serve as a valuable reference for researchers seeking future medical device approval. This review analyzes the observed phenomena and discusses the implications of the research results, with a focus on their potential use as baseline data for obtaining medical device approval. Fluorescent contrast agents used in clinical practice are generally categorized into agents for tumor visualization and those for monitoring blood flow in blood vessels. Malignant tumors are characterized by extensive vascularization, and the similarity in color between tumors and blood vessels makes visual discrimination challenging. As a result, it is difficult to clearly distinguish tumor boundaries from surrounding vasculature, which can lead to vascular damage during tumor resection. In some cases, preserving blood vessels during surgery may result in incomplete tumor removal. Due to their high invasiveness, malignant tumors are prone to metastasis, and incomplete resection carries a high risk of recurrence within five years.
To address these challenges, 5-aminolevulinic acid (5-ALA) fluorescent contrast agents are used to identify tumor locations and assess the extent of tumor removal, while indocyanine green (ICG) is used to monitor vascular integrity and blood flow. Consequently, 5-ALA and ICG are widely preferred in clinical practice because they enable clear visualization of tumor and blood vessel boundaries.
ICG is administered intravenously, whereas 5-ALA is formulated as an oral tablet. These agents selectively label blood vessels (ICG) and tumors (5-ALA) with fluorescent markers. When externally illuminated with an appropriate light source, the fluorescent contrast agents undergo excitation and emit fluorescence at characteristic wavelengths. These emitted wavelengths are detected by a camera sensor, which captures the spectral information and displays blood vessels and tumors in distinct colors or as overlaid images on an external monitor.
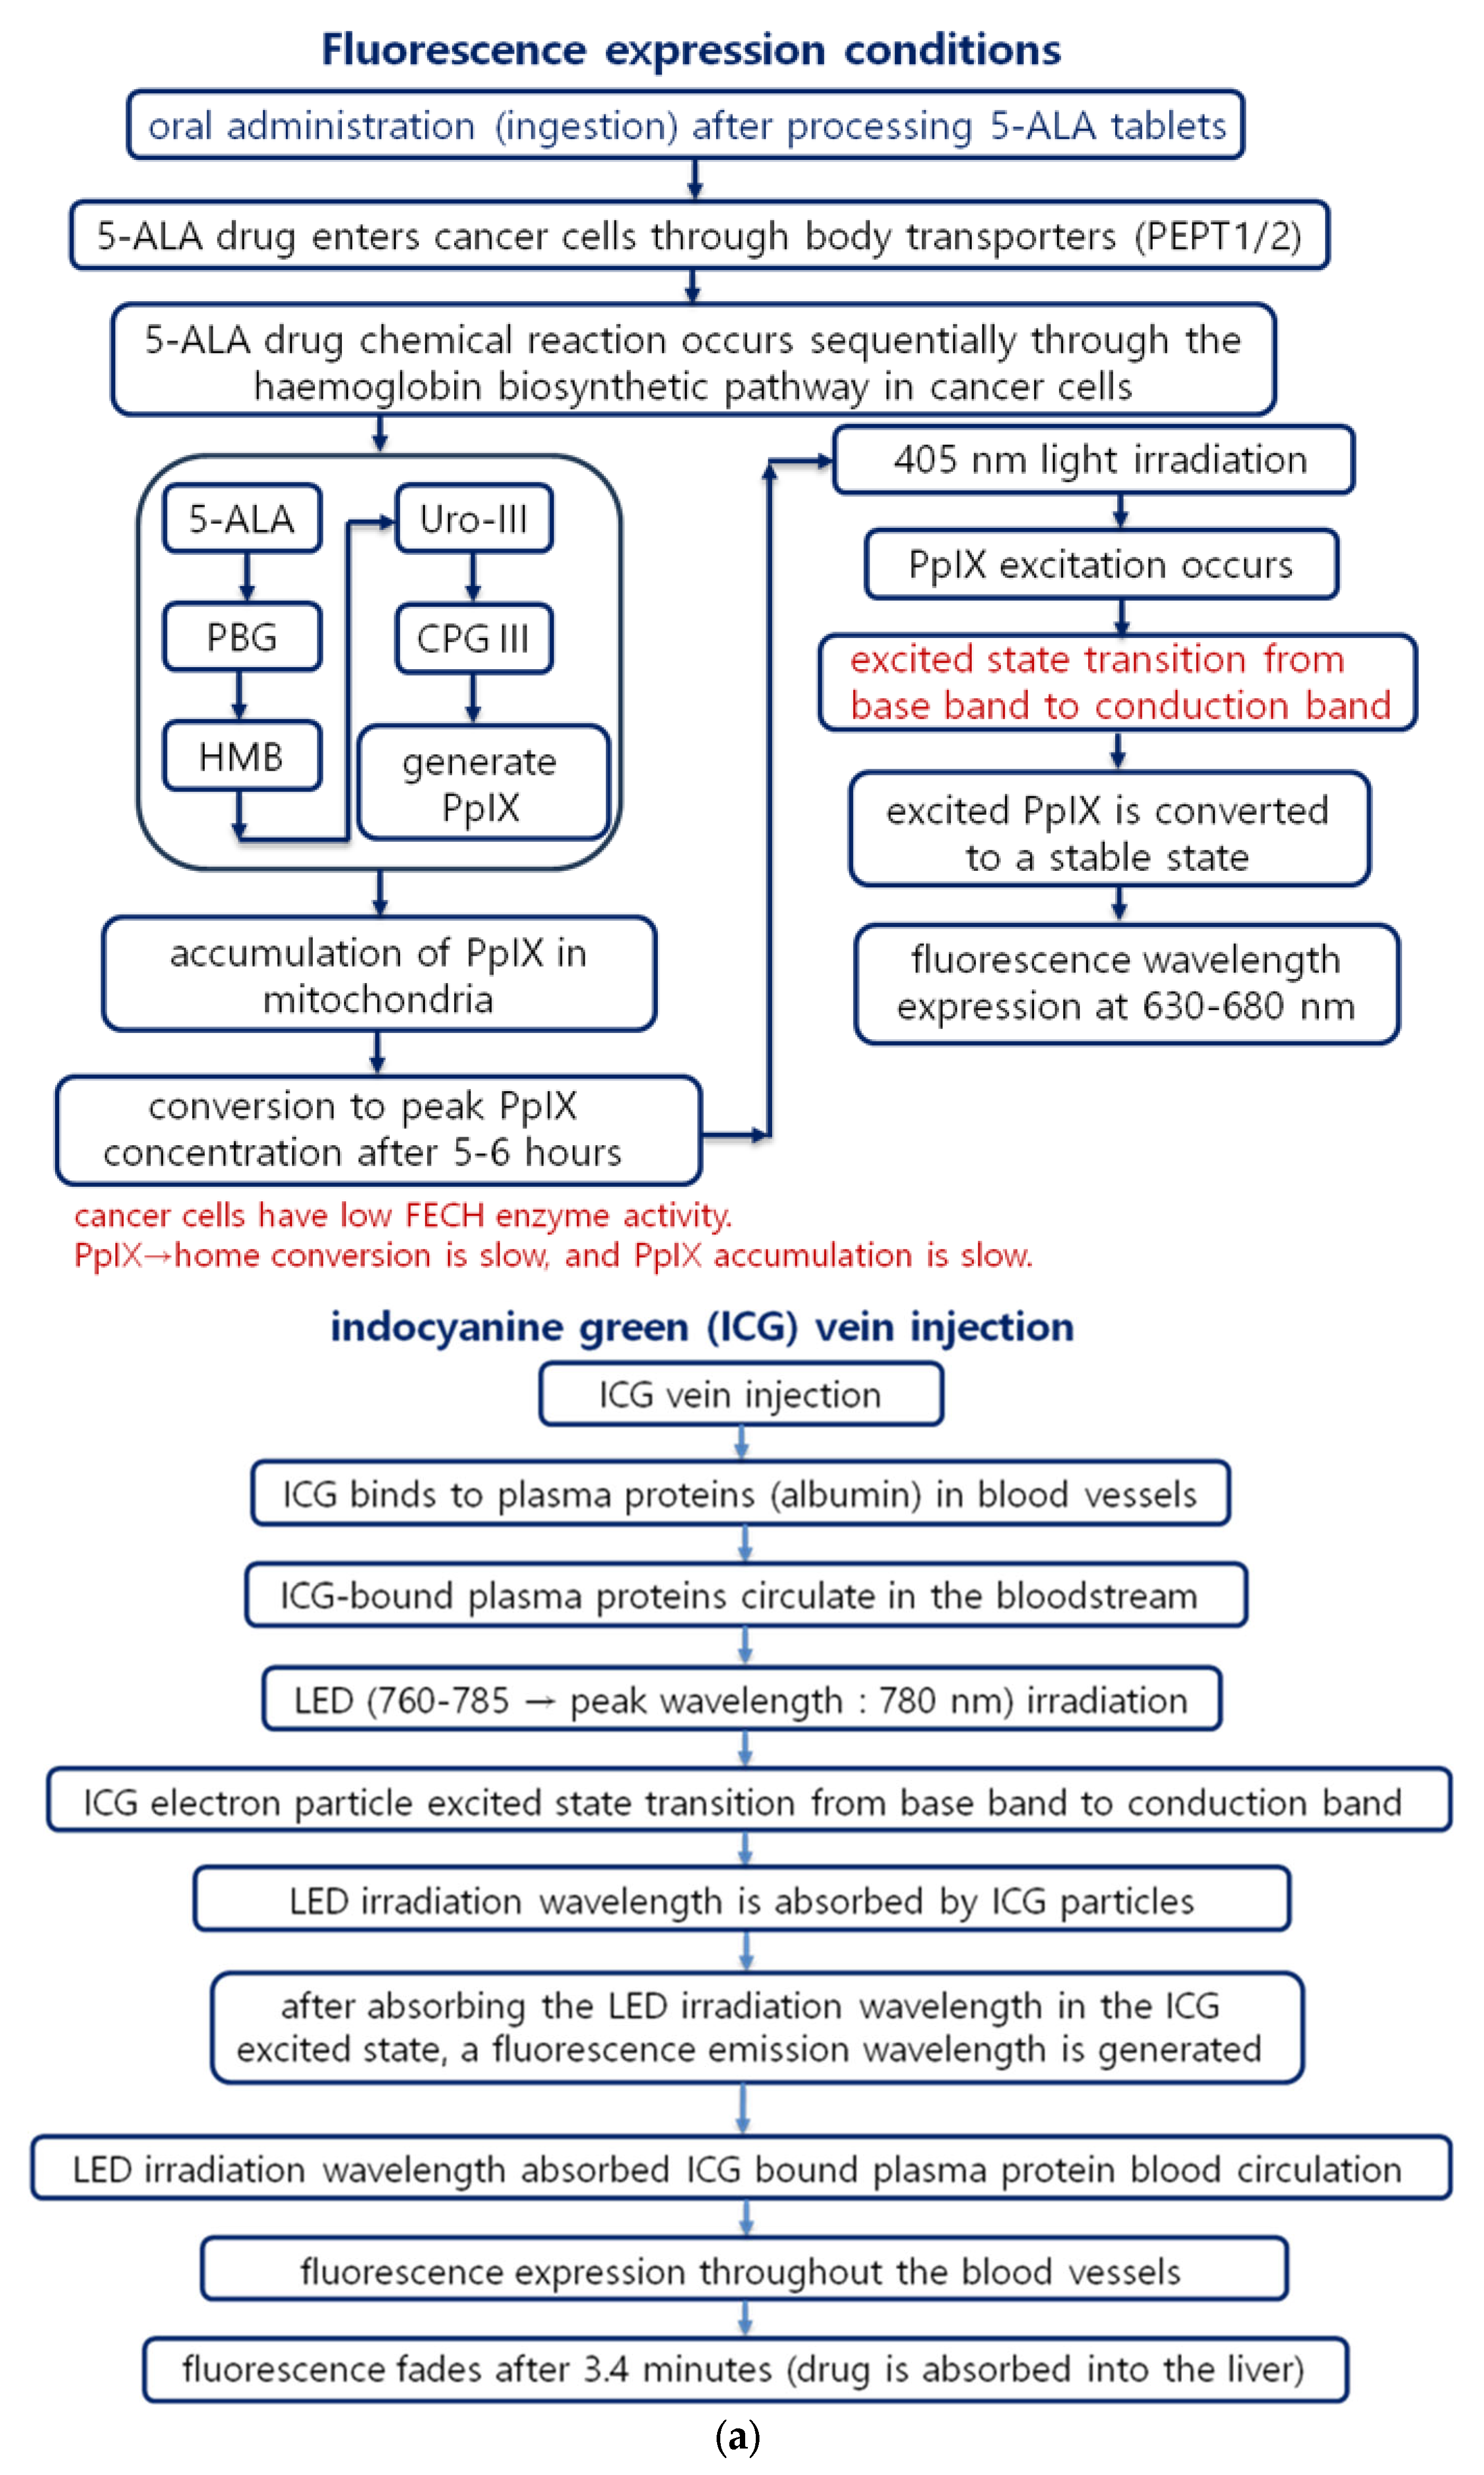
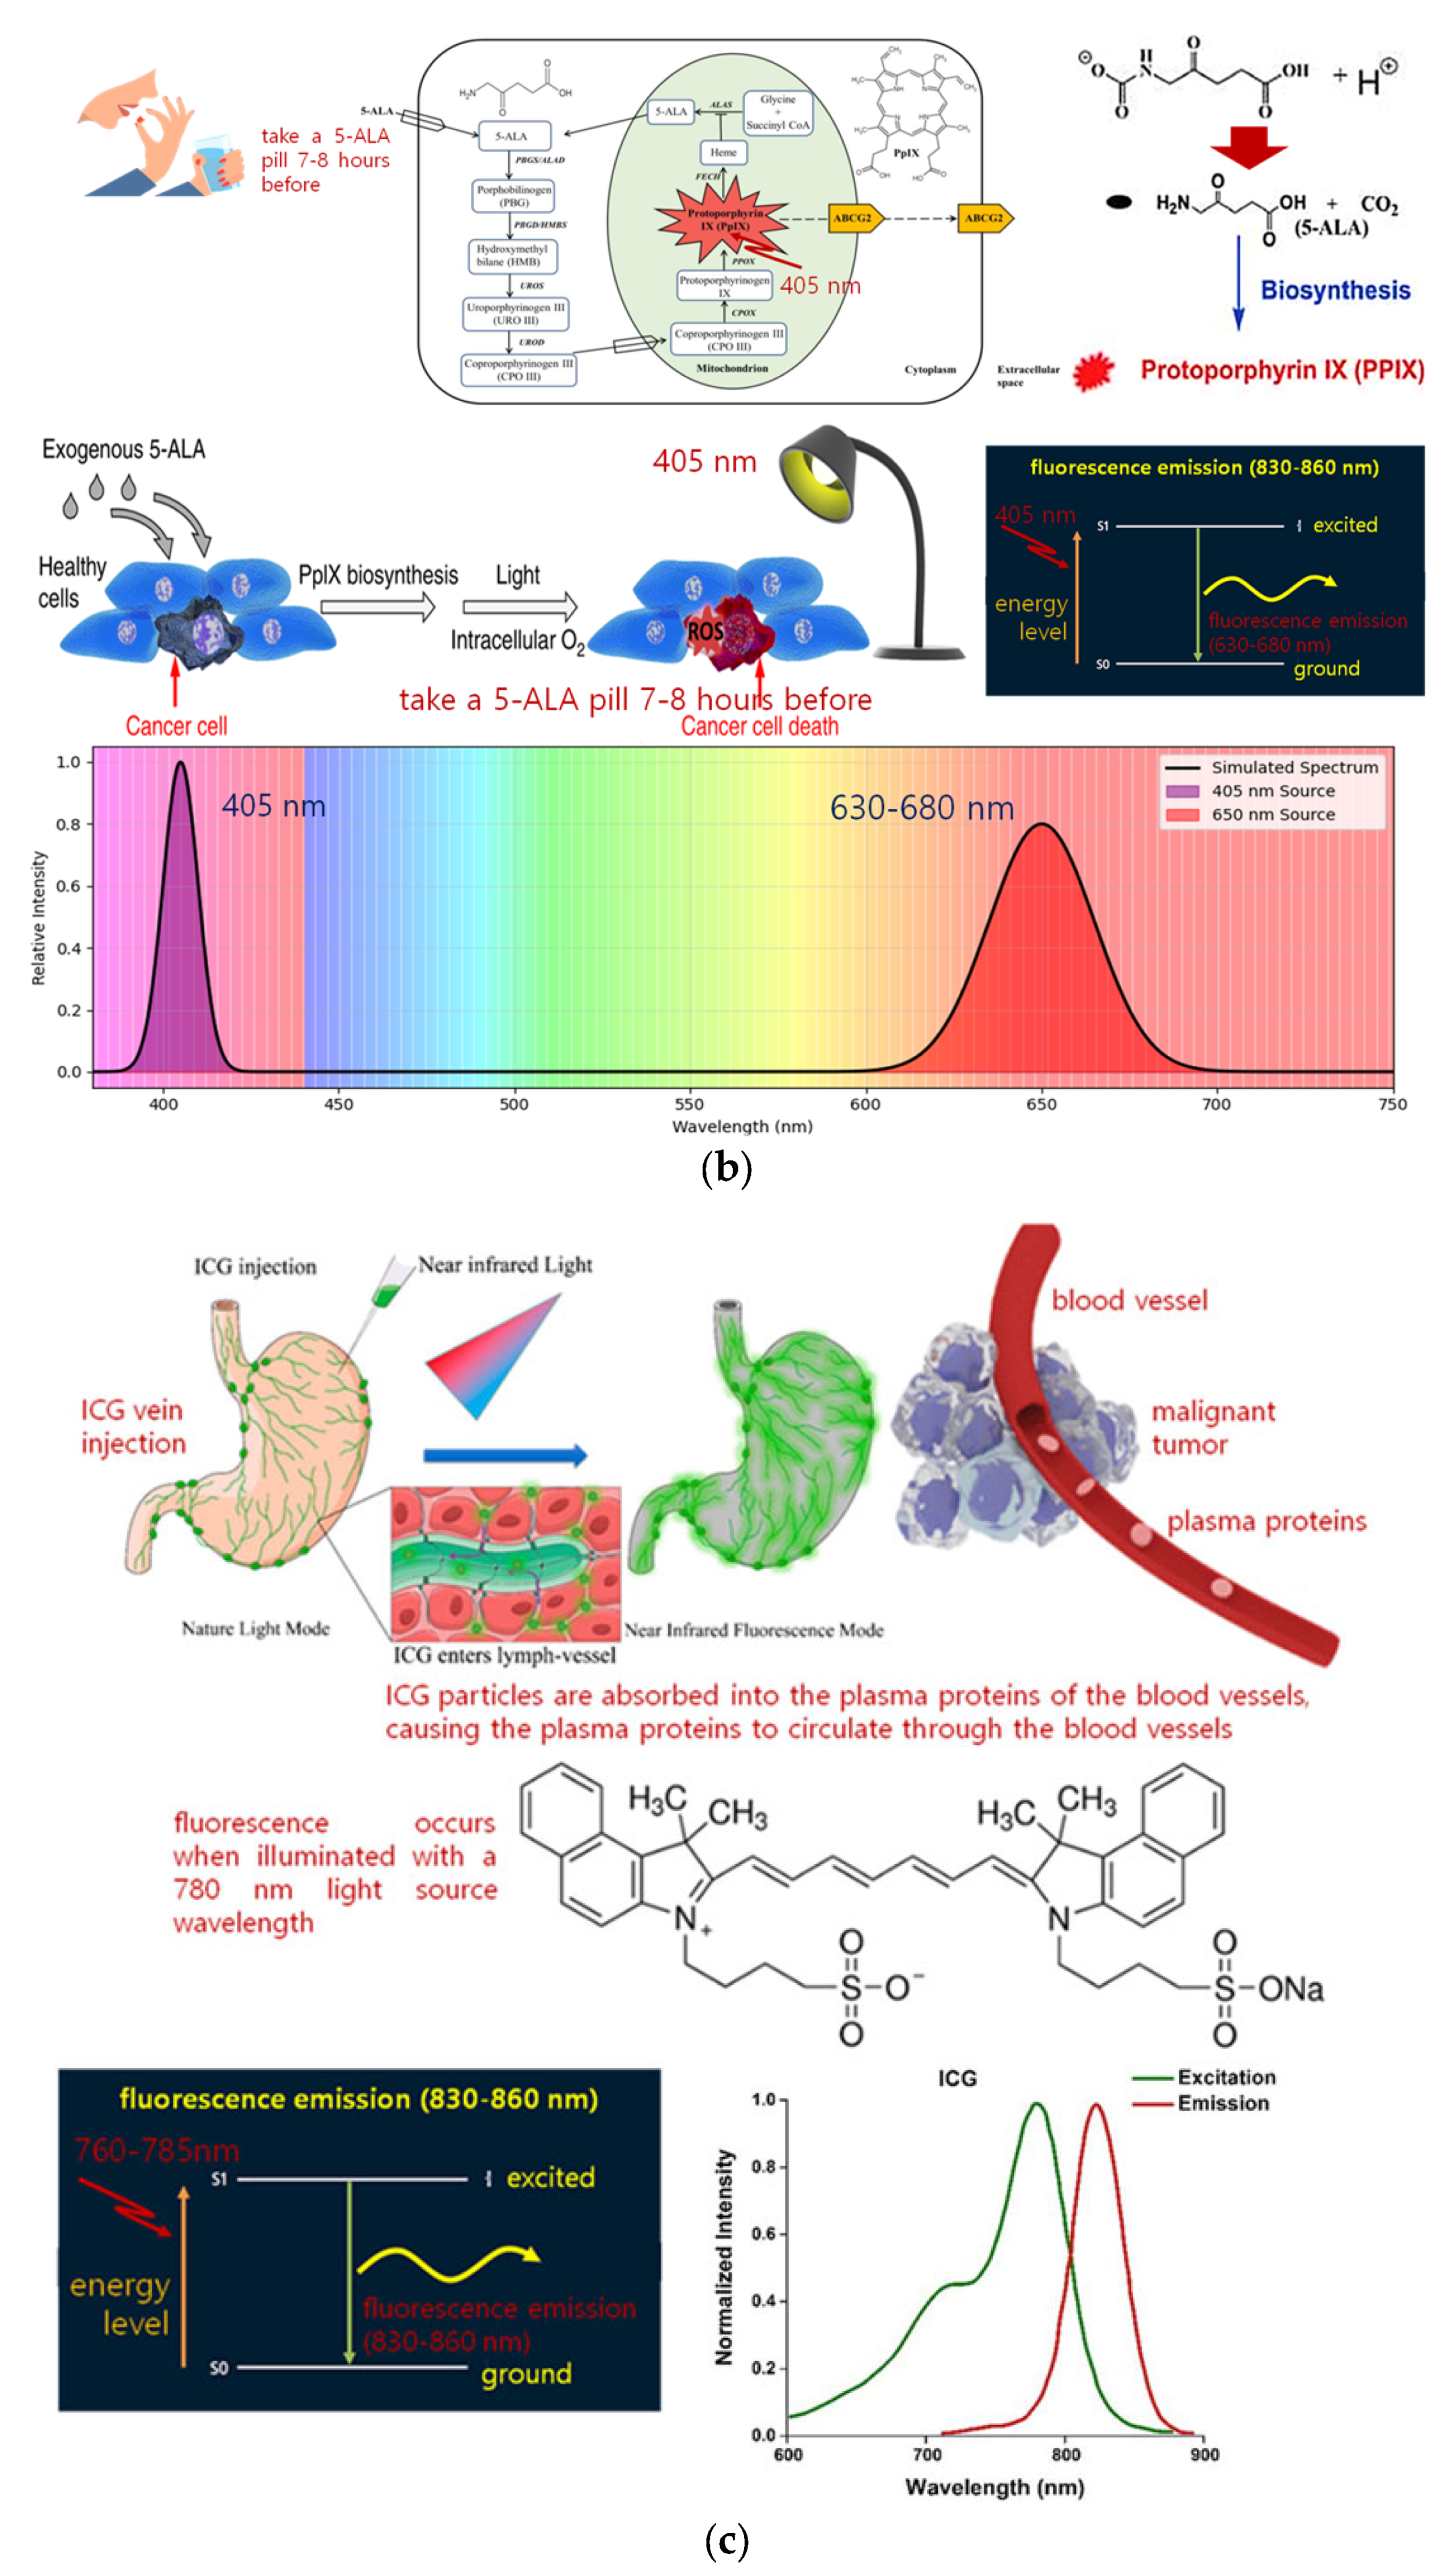
In the case of 5-ALA, fluorescence emission is induced after oral administration to a patient or animal model. As illustrated in Figure 15a, electrons transition from the ground state to an excited state through absorption of excitation energy. This process leads to the metabolic production of protoporphyrin IX (PpIX) approximately 5 to 8 h after administration. When a 405 nm LED or laser irradiates a lesion containing accumulated PpIX, the excitation light is absorbed, and fluorescence emission in the 630 to 680 nm range is generated, as shown in Figure 15b [32,33,34].
Cancer cells exhibit low activity of the protoporphyrin ferrochelatase (FECH) enzyme, which slows the conversion of protoporphyrin IX (PpIX) to heme and results in its accumulation in tumor tissue. PpIX selectively absorbs light at a wavelength of approximately 405 nm; wavelengths outside this range do not induce electron excitation. As shown in Figure 15c, this selectivity is due to the energy band gap, which corresponds to the 405 nm excitation wavelength.
ICG fluorescence is induced by intravenous injection of indocyanine green (ICG), as illustrated in Figure 15a. After injection, ICG binds to plasma proteins, primarily albumin, and circulates within blood vessels. The fluorescent agent also enters and stains lymph nodes. When an external light source (LED or laser) with a wavelength of 760–785 nm (peak wavelength: 780 nm) irradiates the fluorescently stained lesions (blood vessels or lymph nodes), electrons are excited from the ground state to the conduction band, as shown in Figure 15b. During relaxation, fluorescence is emitted in the wavelength range of 830–860 nm, which is defined as the fluorescence emission wavelength [35,36,37]. This fluorescence signal is detected by a camera sensor, enabling spectral color mapping and visual differentiation of lymph nodes and blood vessels on a monitor. It should be noted that the 830–860 nm range lies in the near-infrared (NIR) region and does not correspond to a visible color; therefore, the displayed color is a pseudo-color representation generated by the imaging system.
Similarly, ICG does not absorb wavelengths outside the 760–785 nm excitation range. As shown in Figure 15c, this is because the energy band gap for electron excitation is limited to this spectral region. The light source intensity must be sufficiently high to induce detectable fluorescence, and the required intensity varies depending on lesion characteristics, light source module design, and optical performance. Therefore, active intensity control is essential in surgical environments.
Lasers provide high optical power and thus strong fluorescence emission; however, their narrow beam width limits the observable field of view. In addition, due to potential human safety concerns, medical device approval for laser systems requires extensive technical documentation for each wavelength, including hazard and safety evaluations. Consequently, there is a growing trend toward replacing lasers with LEDs in clinical imaging systems.
Although LEDs offer a wider beam width and a larger field of view, their relatively low optical power can degrade fluorescence emission performance. Therefore, technical strategies to increase light source intensity are crucial. However, excessive increases in optical power can generate heat, which must be carefully controlled. Owing to their lower optical intensity, LEDs are generally considered less harmful to human tissue and thus offer improved safety.
In clinical practice, fluorescence-guided observation is used to visualize blood flow in vessels, tumor location and resection status, and the boundary between tumors and surrounding vasculature. The objectives and clinical applications vary depending on the type of surgery, patient condition, and cancer type. Consequently, simultaneous fluorescence observation using both 5-ALA and ICG is rare; in most surgical procedures, these two agents are used separately.
ICG and 5-ALA differ in their excitation mechanisms, band gap energies, excitation wavelengths, and fluorescence emission wavelengths. In addition, 5-ALA is metabolized to PpIX and accumulates in tumor tissue, whereas ICG binds to plasma proteins and stains only blood vessels and lymph nodes. Therefore, even if both agents are administered simultaneously, they do not overlap biologically and can be safely observed. Moreover, simultaneous irradiation at 405 nm (5-ALA excitation) and 760–785 nm (ICG excitation) does not cause spectral interference because the wavelengths and excitation conditions are distinct.
Fluorescence emission-guided imaging is widely used in surgical oncology, tumor diagnosis (both malignant and benign), and in internal medicine for observing blood circulation, lymphatic systems, and nerves. It is also applied in dentistry, radiation oncology, nuclear medicine, anesthesiology, pain medicine, and veterinary medicine for the visualization of inflammatory diseases, lymph nodes, and tumors.


5. Conclusions

This study demonstrates that a balanced condenser-diffuser optical structure can effectively expand the LED beam width while optimizing the spatial distribution of irradiance energy conservation for fluorescence excitation. Compared with a bare LED (4.0 cm, 1.43 mW/cm2), the proposed structure increased the beam diameter to 14.1 cm (3.5-fold) by redistributing the concentrated central energy of the bare LED to the periphery, resulting in an average irradiance of 0.72 mW/cm2 over the expanded area, which exceeds the minimum excitation threshold of 0.6 mW/cm2. Through numerical integration of the irradiance surface, we confirmed that this expansion was achieved under the constraint of energy conservation, with the spatially integrated irradiance remaining comparable within expected transmission losses introduced by the optical components. This enables a practical solution for fluorescence-guided blood flow and lymph node visualization during cancer surgery.
The proposed optical module is also applicable to tumor margin detection using 5-aminolevulinic acid (5-ALA), sodium fluorescent-based fluorescence imaging in ophthalmology and dentistry, and fluorescence-guided procedures in veterinary medicine. These results indicate that the proposed method provides a scalable and cost-effective platform for wide-field fluorescence imaging systems.

Author Contributions

S.L. and K.Y.; writing, H.K.; software and manufacturing, T.-H.L.; investigation and measurements, W.-S.L.; software and analysis, S.K.; and data curation, K.G.K.; formal analysis. All authors have read and agreed to the published version of the manuscript.

Funding

This work was supported by the tech incubator program for startup (TIPS, RS2024-00437535) and Korea Institute for Advancement of Technology (KIAT) under the project ‘Development of Digital Healthcare Products Based on Synthetic Medical Data Technology and Medical AI Technology,’ RS-2025-02305698, respectively. In addition, the research work was supported by the Korea Evaluation Institute of Industrial Technology (KEIT) in the form of a grant (RS-2025-02305698).

Institutional Review Board Statement

The study was conducted in accordance with the Declaration of Helsinki, and approved by the Institutional Review Board of Gachon University (protocol code 1044396-202304-HR-054-01 and date of approval: 8 May 2023).

Informed Consent Statement

Informed consent was obtained from all subjects involved in the study.

Data Availability Statement

The data presented in this study are available upon request from the corresponding author. The data is not publicly available because of privacy and ethical restrictions.

Acknowledgments

Sangyun Lee and Kicheol Yoon equally contributed to this work. Sangyun Lee and Kicheol Yoon are the co-first (lead) authors. Won-Suk Lee and Kwang Gi Kim equally contributed to this work. Won-Suk Lee and Kwang Gi Kim are co-corresponding authors. This work was supported by the Dongnam Health University, Republic of Korea. This clinical trial was approved by the Instituvtional Review Board (IRB) of Gachon University (IRB approval number: IRB 1044396-202304-HR-054-01) and was conducted in accordance with its guidelines. This work was supported by the National Research Foundation of Korea (NRF) grant funded by the Korea government (MSIT) (No. NRF-2021R1A5A2030333), environment at Gachon University Gil Medical Center (Grant number: FRD 2022-17 and FRD 2024-23-02), Dongnam Health University (Office of Industry-University Cooperation), and Gyeonggi University of Science and Technology (Office of Industry-University Cooperation), respectively.

Conflicts of Interest

Authors Sunghoon Kang and Kwang Gi Kim were presently employed by KMAIN Co., Ltd. The remaining authors declare that the re-search was conducted in the absence of any commercial or financial relationships that could be construed as a potential conflict of interest. The funders had no role in the design of the study; in the collection, analyses, or interpretation of data; in the writing of the manuscript; or in the decision to publish the results.

References

  1. Lim, H.J.; Oh, C.H. Indocyanine green-based photodynamic therapy with 785 nm light emitting diode for oral squamous cancer cells. Photodiagn. Photodyn. Ther. 2011, 8, 337–342. [Google Scholar] [CrossRef]
  2. Marshall Milton, V.; Rasmussen John, C.; Tan, I.C.; Aldrich Melissa, B.; Adams Kristen, E.; Wang, X.; Fife Caroline, E.; Maus Erik, A.; Smith Latisha, A.; Sevick-Muraca, E.M. Near-Infrared Fluorescence imaging in humans with indocyanine green: A review and update. Open Surg. Oncol. J. 2010, 2, 12–25. [Google Scholar] [CrossRef] [PubMed]
  3. Ju, M.; Yoon, K.C.; Lee, S.; Kim, K.G. Single quasi-symmetrical LED with high intensity and wide beam width using diamond-shaped mirror refraction method for surgical fluorescence microscope applications. Diagnostics 2023, 13, 2763. [Google Scholar] [CrossRef]
  4. Lee, S.M.; Yoon, K.C.; Lee, S.; Ryu, S.Y.; Kim, K.G. Multi-asymmetric irradiation method using a ring array to obtain an emission-capable LED beam power effect to observe cancer removal status in a surgical microscope. Diagnostics 2023, 13, 3482. [Google Scholar] [CrossRef]
  5. Dong, J. Optical design of color light-emitting diode ring light for machine vision inspection. Opt. Eng. 2011, 50, 043001. [Google Scholar] [CrossRef]
  6. Kuo, T.C.; Ding, T.J.; Lin, J.H.; Ma, S.H. Optical design of an LED lighting source for fluorescence microscopes. Appl. Sci. 2019, 9, 4574. [Google Scholar] [CrossRef]
  7. Lai, P.Y.; Liu, H.; Hong Ng, R.J.; Hnin Thet, H.W.; Chu, H.-S.; Teo, J.W.R.; Ong, Q.; Liu, Y.; Png, C.E. Investigation of SARS-CoV-2 inactivation using UV-C LEDs in public environments via ray-tracing simulation. Sci. Rep. 2021, 11, 22612. [Google Scholar] [CrossRef]
  8. Vu, D.T.; Vu, H.; Shin, S.; Kieu, N.M.; Tien, T.Q.; Vu, N.H. A simple design of uniform LED illumination using catadioptric collimator and freeform lenslet array. Light. Res. Technol. 2021, 54, 546–562. [Google Scholar] [CrossRef]
  9. Moreno, I.; Viveros-Méndez, P.X. Modeling the irradiation pattern of LEDs at short distances. Opt. Express 2021, 29, 419428. [Google Scholar] [CrossRef]
  10. Ye, Z.T.; Cheng, Y.H.; Liu, K.H.; Yang, K.S. Mini-LEDs with diffuse reflection cavity arrays and quantum Dot film for thin, large-area, high-luminance flat light source. Nanomaterials 2021, 11, 2395. [Google Scholar] [CrossRef]
  11. Sun, L.; Jin, S.; Cen, S. Free-form microlens for illumination applications. Appl. Opt. 2009, 48, 5520–5527. [Google Scholar] [CrossRef] [PubMed]
  12. Ding, Y.; Liu, X.; Zheng, Z.R.; Gu, P.F. Freeform LED lens for uniform illumination. Opt. Express 2008, 16, 12958–12966. [Google Scholar] [CrossRef]
  13. Ma, D.; Feng, Z.; Liang, R. Freeform illumination lens design using composite ray mapping. Appl. Opt. 2015, 54, 498–503. [Google Scholar] [CrossRef]
  14. Wang, G.; Wang, L.; Li, F.; Kong, D. Design of optical element combining Fresnel lens with microlens array for uniform light-emitting diode lighting. J. Opt. Soc. Am. A. 2012, 29, 1877–1884. [Google Scholar] [CrossRef]
  15. Radiometry and Radiometric Quantities. In Radiometry—An Overview; ScienceDirect Topics; Elsevier: Amsterdam, The Netherlands, 2000–2026; Available online: https://www.sciencedirect.com/topics/chemical-engineering/radiometry (accessed on 27 January 2026).
  16. Arecchi, A.V.; Messadi, T.; Koshel, R.J. Field Guide to Illumination; SPIE Field Guides Volume FG11; SPIE Press: Bellingham, WA, USA, 2007. [Google Scholar]
  17. Tian, W.; Tang, L.; Chen, Y.; Li, Z.; Zhu, J.; Jiang, C.; Hu, P.; He, W.; Wu, H.; Hyyppä, J. Analysis and Radiometric Calibration for Backscatter Intensity of Hyperspectral LiDAR Caused by Incident Angle Effect. Sensors 2021, 21, 2960. [Google Scholar] [CrossRef]
  18. Sun, C.-C.; Chien, W.-T.; Moreno, I.; Hsieh, C.-T.; Lin, M.-C.; Hsiao, S.-L.; Lee, X.-H. Calculating model of light transmission efficiency of diffusers attached to a lighting cavity. Opt. Express 2010, 18, 6137–6148. [Google Scholar] [CrossRef]
  19. Zhang, H.; Hsu, C.W.; Miller, O.D. Scattering concentration bounds: Brightness theorems for waves. Optica 2019, 6, 1321–1331. [Google Scholar] [CrossRef]
  20. Winston, R.; Welford, W.T. Efficiency of nonimaging concentrators in the physical-optics model. J. Opt. Soc. Am. 1982, 72, 1564–1571. [Google Scholar] [CrossRef]
  21. Moreno, I.; Sun, C.-C. Modeling the radiation pattern of LEDs. Opt. Express 2008, 16, 1808–1819. [Google Scholar] [CrossRef]
  22. Tillkorn, C.; Heimes, A.; Flamm, D.; Dorer, S.; Beck, T.; Hellstern, J.; Marschall, F.; Lingel, C. Anamorphic Beam Shaping for Efficient Laser Homogenization: Methods and High Power Applications. Proc. SPIE 2018, 10518, 105181I. [Google Scholar] [CrossRef]
  23. Schebesch, K.M.; Proescholdt, M.; Höhne, J.; Hohenberger, C.; Hansen, E.; Riemenschneider, M.J.; Ullrich, W.; Doenitz, C.; Schlaier, J.; Lange, M.; et al. Sodium fluorescein-guided resection under the YELLOW 560 nm surgical microscope filter in malignant brain tumor surgery—A feasibility study. Acta Neurochir. 2013, 155, 693–699. [Google Scholar] [CrossRef] [PubMed]
  24. Ma, L.; Fei, B. Comprehensive review of surgical microscopes: Technology development and medical applications. J. Biomed. Opt. 2021, 26, 010901. [Google Scholar] [CrossRef] [PubMed]
  25. Teng, C.W.; Huang, V.; Arguelles, G.R.; Zhou, C.; Cho, S.S.; Harmsen, S.; Lee, J.Y.K. Applications of Indocyanine Green in Brain Tumor Surgery: Review of Clinical Evidence and Emerging Technologies. Neurosurg. Focus 2021, 50, E4. [Google Scholar] [CrossRef]
  26. Miller, A.R.; Davis, G.L.; Oden, Z.M.; Razavi, M.R.; Fateh, A.; Ghazanfari, M.; Abdolrahimi, F.; Poorazar, S.; Sakhaie, F.; Olsen, R.J.; et al. Portable, battery-operated, low-cost, bright field and fluorescence microscope. PLoS ONE 2010, 5, e11890. [Google Scholar] [CrossRef] [PubMed]
  27. Wang, X. LED ring array light source design and uniform illumination properties analysis. Optik 2017, 140, 273–281. [Google Scholar] [CrossRef]
  28. Wang, H.; Wang, H.; Du, N.; Zhang, X. Study on optical design method for LED extended sources. In Proceedings of the 5th International Symposium on Advanced Optical Manufacturing and Testing Technologies: Advanced Optical Manufacturing Technologies, Dalian, China, 26–29 April 2010; SPIE: Bellingham, WA, USA, 2010; Volume 7655, p. 765536. [Google Scholar]
  29. Nam, H.; Kim, K.J.; Ko, S.B.; Kang, S.; Shin, D.J.; Kim, J.M.; Lee, J.Y.; Kim, T. Highly efficient white organic Light-Emitting diodes utilizing intermolecular interaction based on molecular geometry between host and deep blue Pt(II) complex. Chem. Eng. J. 2024, 487, 150294. [Google Scholar] [CrossRef]
  30. Cui, M.; Wang, J.; Shang, M.; Li, J. Full visible light emission in Eu2+, Mn2+ -doped Ca9LiY0.667(PO4)7 phosphors based on multiple crystal lattice substitution and energy transfer for warm White LEDs with high Colour-Rendering. J. Mater. Chem. C 2019, 7, 3644–3655. [Google Scholar] [CrossRef]
  31. Šimková, E.; Staněk, D. Probing nucleic acid interactions and pre-mRNA splicing by förster resonance energy transfer (FRET) microscopy. Int. J. Mol. Sci. 2012, 13, 14929–14945. [Google Scholar] [CrossRef]
  32. Park, H.W.; Choi, J.W.; Joo, K.K.; Kim, N.R.; Shin, C.D. Estimating fluor emission spectra using digital image analysis compared to spectrophotometer measurements. Sensors 2023, 23, 4291. [Google Scholar] [CrossRef]
  33. Howley, R.; Chandratre, S.; Chen, B. 5-Aminolevulinic Acid as a Theranostic Agent for Tumor Fluorescence Imaging and Photodynamic Therapy. Bioengineering 2023, 10, 496. [Google Scholar] [CrossRef]
  34. McNicholas, K.; MacGregor, M.N.; Gleadle, J.M. In Order for the Light to Shine so Brightly, the Darkness Must Be Present—Why Do Cancers Fluoresce with 5-Aminolaevulinic Acid? Br. J. Cancer 2019, 121, 631–639. [Google Scholar] [CrossRef] [PubMed]
  35. Law, S.K. Effectiveness of 5-Aminolevulinic Acid Combined with Curcumin Mediating Photodynamic Therapy. Pharm. Biomed. Res. 2023, 9, 169–172. [Google Scholar] [CrossRef]
  36. Liao, Y.; Zhao, J.; Chen, Y.; Zhao, B.; Fang, Y.; Wang, F.; Wei, C.; Ma, Y.; Ji, H.; Wang, D.; et al. Mapping Lymph Node during Indocyanine Green Fluorescence-Imaging Guided Gastric Oncologic Surgery: Current Applications and Future Directions. Cancers 2022, 14, 5143. [Google Scholar] [CrossRef]
  37. Morrison, S.J.; Scadden, D.T. The Bone Marrow Niche for Haematopoietic Stem Cells. Nature 2014, 505, 327–334. [Google Scholar] [CrossRef] [PubMed]
Figure 1. Concept of fluorescence emission-guided monitoring for detecting lymph node locations in tumor tissue and differences in lesion observation fields of view under LED illumination: (a) fluorescence emission-guided monitoring method for detecting lymph node locations; (b) schematic of lesion observation field-of-view ranges according to LED illumination angles.
Applsci 16 01753 g001
Figure 2. Differences in physical performance for fluorescence emission-guided lesion monitoring under LED irradiation: (a) lymph node observation range with a narrow LED irradiation angle; (b) lymph node observation range with a wide LED irradiation angle; (c) concept of fluorescence observation performance according to the number of LEDs.
Applsci 16 01753 g002
Figure 3. Beam-spreading control of wide-beam LEDs via optical refraction and focusing using housing insertion: (a) structural design; (b) fabrication process; (c) 3D modeling in Autodesk Tinkercad (Autodesk Co., Ltd., Mill Valley, CA, USA); and (d) intensity distribution on the target plane for a single LED with and without a lens and diffuser.
Applsci 16 01753 g003
Figure 4. Beam propagation and intensity distribution in a dual-path optical configuration (COMSOL, ver. 6.4, Multiphysics®, Altsoft, Seoul, Republic of Korea): (a) beam propagation flow; (b) simulated overlapping beam intensity profiles; (c) beam propagation of the overlapped dual beams; and (d) analysis of beam intensity profiles versus dsi, dsj, and the combined beam width at z = 10.
Applsci 16 01753 g004aApplsci 16 01753 g004b
Figure 5. 3D-printed device with a metal housing and beamwidth comparison between the conventional and proposed LED designs.
Applsci 16 01753 g005
Figure 6. Experimental results of light source irradiation: (a) LED irradiation; (b) LED with an optical condenser; (c) LED with an optical condenser and a diffuser lens (beam focusing: aspheric condenser lens, 25 mm focal length, 30 mm diameter, 12.7 mm thickness, Pyrex, Hach Company, Loveland, CO, USA; optical diffuser: EDC-20-G-1R, VIAVI Solutions, West Henrietta, NY, USA), (d) beam condenser combined with the proposed lens. The top subfigure illustrates the experimental configuration of the LED source, including the housing structure and the optical elements (focusing and diffusion lenses) used to control the beam profile before measurement.
Applsci 16 01753 g006
Figure 7. Numerical visualization of the beam profile and radial intensity distribution for different LED optical configurations (see Figure 6): (a) two-dimensional spatial intensity and angular distributions of a bare LED, an LED with a condenser lens, and an LED with both a condenser and a diffuser lens; (b) radial intensity distribution I(r) highlighting beam widening due to the diffuser; (c) spatial and angular intensity distributions emphasizing the beam-focusing effect of the condenser lens; and (d) schematic comparison of beam spot sizes for the different optical configurations.
Applsci 16 01753 g007aApplsci 16 01753 g007b
Figure 8. Experimental and simulated beam divergence characteristics with optical components.
Applsci 16 01753 g008
Figure 9. Optical ray-tracing analysis of beam propagation: (a) beam distribution for the LED alone (10°); (b) beam distribution for the LED coupled to a condenser lens (9.89°); and (c) beam distribution for the proposed configuration (LED + condenser + diffuser, 50°).
Applsci 16 01753 g009
Figure 10. Changes in LED beam intensity according to divergence angle expansion: (a) three-dimensional visualization of LED beam diffusion and intensity change; (b) comparison of beam cross-sections for the LED alone, LED with a condenser, and LED with both a condenser and a diffuser; and (c) visualization of the angular beam-spreading mechanism via ray-tracing simulation.
Applsci 16 01753 g010
Figure 11. Simulation results comparing polar patterns and beam intensity mapping with and without a lens (COMSOL Multiphysics®, Altsoft, Seoul, Republic of Korea): (a) theoretical and simulated polar patterns without a lens; (b) theoretical and simulated polar patterns with a lens; (c) beam intensity mapping without a lens; and (d) beam intensity mapping with a lens.
Applsci 16 01753 g011aApplsci 16 01753 g011b
Figure 12. Beam power and intensity measurement results as a function of spatial coordinates, with and without a lens (COMSOL Multiphysics®, Altsoft, Seoul, Republic of Korea): (a) beam width; (b) beam intensity.
Applsci 16 01753 g012
Figure 13. Fluorescence emission test results using phantom samples to evaluate LED beam width. The experiment was performed with a phantom concentration of 0.02 mM sodium fluorescent and an LED excitation power of 200 mW. The NIR camera settings, including gain and exposure time, were kept constant (fixed gain) to ensure a consistent comparison between the two conditions.
Applsci 16 01753 g013
Figure 14. Spatial irradiance distributions: (a) bare LED; (b) proposed structure; (c) comparison of integrated optical power.
Applsci 16 01753 g014
Figure 15. Fluorescence emission process analysis: (a) fluorescence emission process of 5-ALA and ICG, (b) fluorescence emission process (left) 5-ALA fluorescence (right) ICG fluorescence, (c) differences in fluorescence emission process and chemical structure of 5-ALA and ICG.
Applsci 16 01753 g015aApplsci 16 01753 g015b
Table 1. Radiometric versus photometric quantities and their relevance to near-infrared excitation (780 nm).
QuantitySymbolUnitPhysical MeaningUsed in This Works
luminous intensityIvcdoptical power per unit solid angle (photometric)no
irradianceEmW/cm2radiant power incident per unit areayes
Table 2. Radiometric quantities and units used in this study.
QuantitySymbolUnitDescription
radiant fluxΦemWtotal optical power of LED
irradianceEmW/cm2power per unit area on tissue
radianceLemW·sr−1·cm−2conserved optical quantity
beam divergenceθdegreefull divergence angle
Table 3. Symbols and their meanings in Equations (3)–(8).
SymbolDefinitionUnit
sxi, sxjobject distance from LED to focusing lensmm
f(•)effective focal length for each optical pathmm
S(•)′image distance from lens to image planemm
dsi, dsjpropagation distance from lens-diffuser to working plane for each pathmm
foverlapping plane of focusing lens and optical diffuser
mintersection point where two beams cross
rradius of marginal rays at the ff planemm
aaxial distance from ff plane to working planemm
breference distance from ff plane toward the light source sidemm
wpbeam width at the working planemm
δdivhalf-angle divergencerad
Table 4. Measured irradiance (mW/cm2) under different illumination configurations of the three types shown in Figure 6.
PerformanceIrradiance [mW/cm2]Beam
Diameter [cm]
Figure Number
LED without lenses1.434.0Figure 6a
LED with beam condenser0.913.98Figure 6b
LED with beam diffuser0.726.98Figure 6c
LED with beam condenser and proposed diffuser0.7214.1Figure 6d
Proposed method: a structure combining a beam focusing lens and a beam diffuser lens.
Table 5. Radiometric quantities and units used in this study.
QuantitySymbolUnitDescription
radiant fluxΦemWtotal optical power emitted by the LED module
irradianceEmW/cm2radiant flux incident per unit area on the target plane
radianceLemW·sr−1·cm−2conserved quantity governing power redistribution in optical systems
beam divergence angleθdegreefull-angle beam divergence of the LED module
working distanceWDcmdistance from LED module to target plane
Table 6. Radial light intensity distribution I(r) for different optical configuration include diffuser.
Radius, r (cm)Emission Angle (°)LED Only (mW/cm2)LED + Condenser (mW/cm2)LED + Condenser + Diffuser (mW/cm2)
0.00.01.431.460.72
2.07.61.221.250.69
4.015.20.751.130.66
6.022.60.340.460.61
8.029.90.110.210.55
10.036.90.020.060.45
12.043.60.35
14.050.20.25
Table 7. Radial intensity distribution I(r) for different configurations.
Radius, r (cm)Emission Angle (°)LED Only (mW/cm2)LED + Condenser Lens (mW/cm2)LED + Lens + Diffuser (mW/cm2)
0.00.0°1.430.910.72
2.07.6°1.220.860.71
4.015.2°0.750.740.68
6.022.6°0.340.570.66
8.029.9°0.110.390.66
10.036.9°0.020.220.64
12.043.6°0.090.62
14.050.2°0.030.61
Table 8. Comparison of the measured radiant flux and irradiance results for each illumination configuration.
LocationLens
Application
Irradiance [mW/cm2]Collected Power [mW]Distance from Origin
(cm) [mW/cm2]
awithout38.4013.590.00
with38.4013.590.00
bwithout25.579.0102.00
with38.4013.592.00
cwithout12.744.4304.00
with37.2812.864.00
dwithout0.990.140.00
with0.00012.126.00
ewithout0.0000.0000.00
with2.5611.68.00
fwithout0.0000.0000.00
with2.0410.210.0
gwithout0.0000.0000.00
with0.0866.5230.00
Illumination area: a to b (2 cm range), a to c (4 cm range).
Table 9. Comparative analysis of spatially integrated irradiance and irradiance distribution for the bare LED and the proposed structure to verify energy conservation, and the peak irradiance values should not be directly compared with area ratios; energy conservation is evaluated through spatial integration of the irradiance distribution.
CategoryBare LED (Gaussian)Proposed Structure (Top-Hat)Note
peak irradiance~2.20 mW/cm20.72 mW/cm2peak reduction via spatial redistribution
effective beam diameter4.0 cm14.1 cm~12.4-fold increase in area
integrated volume (Ptotal)138.4 mW112.3 mWtotal power from volume integration
optical efficiency100% (Ref.)81.2%18.8% loss due to optical components
Note that the peak irradiance is not representative of the spatial average for the bare LED, because most of the optical power is concentrated in a narrow central region with long Gaussian tails.
Table 10. Analysis of comparison and difference between suggested LED and others.
Ref.
[#]
λext
[nm]
WD
[cm]
Beam Area [cm2]Maximum LED Power Pmax [mW]Collected Power at Target [mW/cm2]LED
Quantity [ea]
this
work
78010.0014.118.00.721.00 (LED)
[24]4050.250.02740.012.31.0 (laser)
[25]55056.755.7279200.1969.00 (LED)
[26]62530.003.24300,30026.55130 (LED)
[27]4676.173.311006.1052 (LED)
Disclaimer/Publisher’s Note: The statements, opinions and data contained in all publications are solely those of the individual author(s) and contributor(s) and not of MDPI and/or the editor(s). MDPI and/or the editor(s) disclaim responsibility for any injury to people or property resulting from any ideas, methods, instructions or products referred to in the content.