Article

ffstruc2vec: Flat, Flexible, and Scalable Learning of Node Representations from Structural Identities


by
Mario Heidrich
1,2,*,
Jeffrey Heidemann
2,
Rüdiger Buchkremer
2 and
Gonzalo Wandosell Fernández de Bobadilla
1
1
Faculty of Economics and Business, Universidad Católica San Antonio de Murcia (UCAM), 30107 Murcia, Spain
2
Institute of IT Management and Digitization Research (IFID), FOM University of Applied Sciences in Economics and Management, 40476 Düsseldorf, Germany
*
Author to whom correspondence should be addressed.
Appl. Sci. 2026, 16(3), 1644; https://doi.org/10.3390/app16031644
Submission received: 20 January 2026 / Revised: 28 January 2026 / Accepted: 29 January 2026 / Published: 6 February 2026

Featured Application

The proposed framework targets real-world network analysis tasks in which node roles are defined by structural patterns. Typical applications include fraud detection in financial transaction networks, traffic classification, and role discovery in large-scale social or biological graphs, where scalability and interpretability are critical.

Abstract

Node embedding refers to techniques that generate low-dimensional vector representations of nodes in a graph while preserving specific node properties and is widely used in applied domains such as fraud detection and social network analysis. A key challenge is the development of scalable methods that can capture structural characteristics relevant to diverse downstream application tasks. While most existing approaches focus on preserving node proximity, methods that aim to preserve structural properties often lack the flexibility required to represent different types of structural patterns. In this work, we introduce ffstruc2vec, a scalable deep learning framework for learning node embeddings that preserve structural identities, designed for real-world network analysis tasks. The proposed approach employs a flat and efficient architecture that enables flexible modeling of a wide range of structural patterns and facilitates adaptation to different downstream tasks. The experimental results across unsupervised and supervised settings demonstrate that ffstruc2vec achieves competitive and often superior performance compared to existing structure-preserving node embedding methods. In addition, the framework enhances interpretability by quantifying the influence of individual structural patterns on task outcomes, supporting the interpretation of the learned representations. These results indicate that ffstruc2vec offers a flexible and scalable solution for structure-preserving node embedding with practical applicability.

1. Introduction

Node embedding is the process of generating low-dimensional vector representations of nodes in a graph, preserving task-relevant properties of nodes, including but not limited to structure, proximity, or attributes. These embeddings can be leveraged in various downstream tasks, including node classification, link prediction, clustering, exploratory data analysis, and network visualization. The method has found broad application across diverse domains, such as fraud detection in financial networks [1], friendship recommendation and bot detection in social networks [2,3], knowledge discovery in knowledge graphs [4,5], analysis of biological networks [6,7], and fake review detection on online platforms [8].
Despite the progress in node embedding methods, a significant limitation persists: existing approaches often lack the flexibility to adapt to diverse and complex structural patterns required by specific downstream tasks. For instance, while methods like struc2vec capture structural identities, they rely on rigid multilayer graphs that cannot be easily tailored to task-specific structural patterns, such as cyclic transaction chains in fraud detection or bridge roles in social networks. This architectural rigidity limits their applicability in domains where interpretability and adaptability are critical. To address this gap, we propose ffstruc2vec, a flexible framework designed to (1) encode a wide range of structural patterns in a scalable manner, (2) allow task-specific adaptation via supervised weight optimization, and (3) provide interpretable insights into relevant structural features.
This limitation is particularly pronounced when considering the diversity of structural patterns required across different application domains. A key challenge in node embedding is developing a scalable method for preserving the structural properties of nodes suitable for the required structural patterns of a downstream application task. The type of structural patterns in which a node is embedded within the graph can vary depending on the role or function of the node in a specific application task. For instance, fraudulent activities such as money laundering can be embedded in particular money flow patterns among illicit entities, resulting in characteristic structural patterns within the financial transaction network, such as suspicious cyclic transaction chains [9]. These structural patterns differ significantly from those observed in social networks, where specific roles such as bridge and core nodes define the network’s connectivity and influence [10]. As node embedding methods cannot preserve all types of structural patterns simultaneously, they must align with the requirements of a specific application task when defining types of structural identities.
ffstruc2vec is a flexible framework capable of integrating diverse types of structural patterns, including complex ones. If specific structural patterns, such as suspicious cyclic transaction chains in fraud detection, are known to be relevant, domain-specific knowledge can be incorporated manually. At the same time, ffstruc2vec can automatically adapt to task-specific requirements by optimizing corresponding weights in a supervised manner. The optimized weights provide insights into the relevance of specific structural patterns for a given application. The resulting interpretability is particularly crucial in highly regulated domains such as fraud detection. To the best of our knowledge, ffstruc2vec is among the first node embedding frameworks to combine this level of flexibility, scalability, and structural interpretability.
A detailed overview of node embedding frameworks, their limitations, and relevant references can be found in Section 2. Most node embedding frameworks primarily focus on preserving the proximity of nodes. Frameworks that instead aim to capture structural identities often struggle to adapt effectively to the specific types of structural identities required by downstream application tasks. For instance, struc2vec, which employs a multilayer graph to encode structural similarities, is limited in its ability to capture diverse types of structural identities. The ffstruc2vec approach addresses this issue more effectively by implementing a flexible and flattened similarity graph encoding structural similarities of the nodes. This approach involves assessing structural similarity between nodes by analyzing their respective structural properties and those of their surrounding neighborhoods. This evaluation incorporates various structural properties, including centrality measures, clustering coefficients, attached graphlets, and anonymous walk-based characteristics, to accurately capture and represent structural patterns for a specific downstream task. In specific tasks, such as fraud detection, the required structural patterns can be highly complex. A well-balanced combination of multiple indicators is essential, not only for the focal node but also for the nodes in its k-hop neighborhood. The edges of the similarity graph in ffstruc2vec are assigned weights derived from the similarity measures of the node pairs. They are utilized in random walks on the similarity graph to generate sequences of nodes. These sequences are then fed into the word2vec algorithm [11] to learn embedded node representation vectors. A detailed description of the ffstruc2vec framework can be found in Section 4.
Beyond graph-based embedding frameworks, various neural and neurosymbolic learning approaches have been developed to model complex functional or symbolic relationships, including bilinear neural networks, fractional-order models, and neurosymbolic reasoning systems (see, e.g., [12]). While powerful in domains such as equation solving, symbolic inference, or multimodal reasoning, these methods are not primarily designed for learning reusable, task-adaptive structural representations of nodes in large-scale graphs. In contrast, ffstruc2vec focuses on structure-preserving node embeddings that emphasize interpretability and scalability across a wide range of graph-based downstream tasks.
The name ffstruc2vec reflects the framework’s central design principle: a flat similarity graph that flexibly captures structural identities. This architecture enables effective adaptation to diverse downstream tasks by optimizing the weights of graph indicators across multiple k-hop neighborhoods. These optimized weights not only guide the embedding process but also offer interpretability by revealing task-relevant structural patterns. Beyond its flexibility and interpretability, ffstruc2vec is designed for scalability, making it well-suited for large-scale networks. Its optimized flat architecture and flexible alignment to task-specific structural requirements allow ffstruc2vec to capture a broader range of structural identities than alternative methods such as struc2vec [13]. A direct comparison to struc2vec is presented in Section 6, while a detailed discussion of the general key contributions of ffstruc2vec is provided in Section 5.
The effectiveness of ffstruc2vec is demonstrated in multiple downstream application tasks:
  • Unsupervised applications (Section 7.1 and Section 7.2) showcase its superior performance.
  • Supervised tasks (Section 7.3) highlight its significant improvements over other node embedding methods.
In summary, the main contributions of this paper are as follows:
  • We propose a flexible and flat node embedding framework that generates latent representations for nodes. This framework effectively aligns with various types of structural patterns in a graph, making it suitable for a wide range of downstream application tasks (see Section 5.1).
  • In terms of interpretability, the alignment process of ffstruc2vec to a downstream application task provides insight into the graph structures of application tasks and their impact, meaning, and relevance for the examined application scenarios (see Section 5.2).
  • To maintain scalability for large graphs, such as social networks with billions of nodes and edges, the time complexity of ffstruc2vec is O ( max ( | E | , | V | · log | V | ) ) for the extraction of certain structural identities, as detailed in Section 5.3.
  • The ffstruc2vec framework addresses weaknesses in existing node embedding frameworks, such as struc2vec, as detailed in Section 6.
  • The ffstruc2vec framework significantly outperforms other state-of-the-art node embedding frameworks in several practical downstream application tasks (see Section 7).
  • Beyond structural patterns, ffstruc2vec’s modular design allows for the integration of node proximity properties and node features, enabling alignment with the specific requirements of downstream tasks.
Together, these contributions establish ffstruc2vec as a flexible, interpretable, and scalable framework for structure-preserving node embedding across diverse application domains, demonstrating consistent effectiveness across multiple unsupervised and supervised downstream tasks.
The remainder of this paper is organized as follows. Section 2 reviews related work on node embedding methods with a focus on structure-preserving approaches. Section 4 introduces the ffstruc2vec framework and details its core components. The experimental evaluation and benchmarking are presented in Section 7. Finally, Section 8 concludes the paper and discusses limitations and directions for future work.
The Supplementary Material contains additional methodological and technical details, including the graph indicators (Section S1), the integration of proximity measures and node features (Section S2), comparison functions (Section S3), hyperparameters (Section S4), the complexity analysis (Section S5), and an extended discussion of the advantages of ffstruc2vec over struc2vec (Section S6).
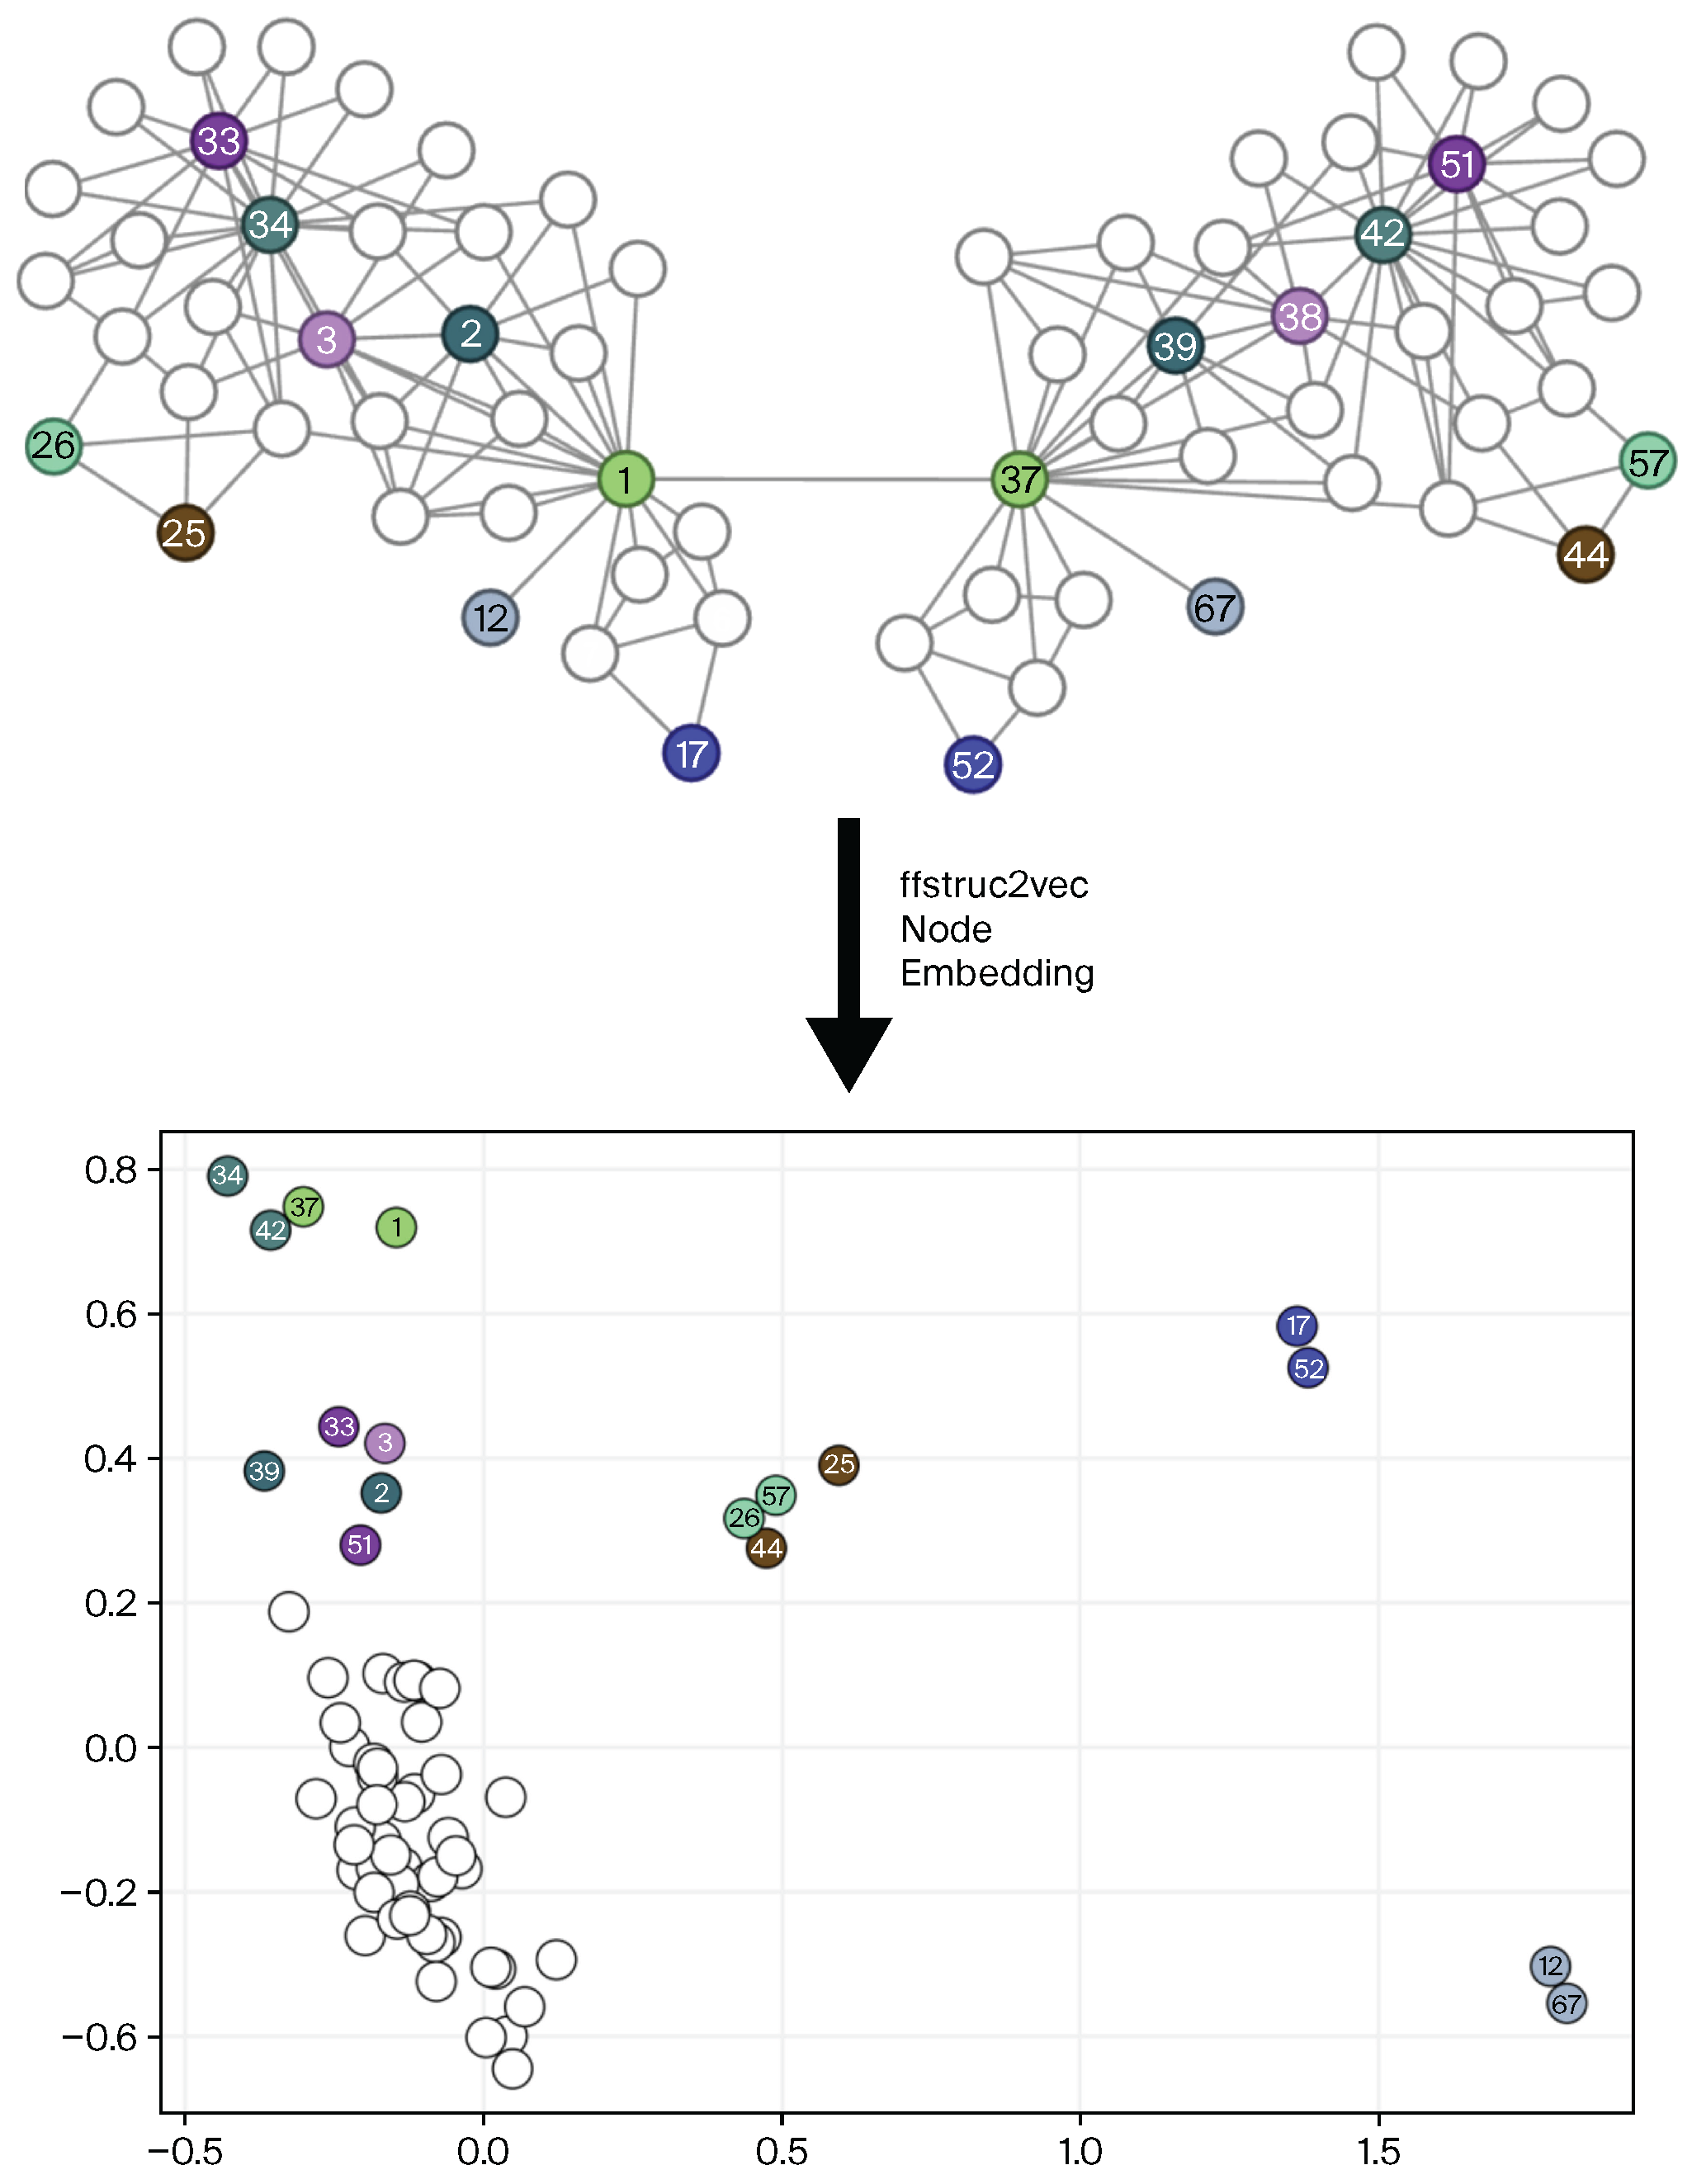
Figure 1 illustrates the application of ffstruc2vec to the mirrored Zachary’s Karate Club network. The upper image depicts the network, while the lower image visualizes the generated embedded vectors in a two-dimensional space. Nodes with distinct structural properties, such as central and peripheral nodes, are highlighted in color. It is evident that the ffstruc2vec approach effectively separates the embedding vectors of these nodes from the others, demonstrating its ability to distinguish structural roles.

2. Related Work

Advancements in representational learning for natural language processing have enabled new ways for feature learning of discrete objects, such as words. The Skip-gram model, introduced by Mikolov et al. [11], learns continuous word feature representations by optimizing a neighborhood-preserving likelihood objective. Inspired by this model, Perozzi et al. [14] proposed DeepWalk as an analogy for networks by treating a network as a “document”. In the same way that a document is an ordered sequence of words, sequences of nodes can be sampled from a network and transformed into an ordered sequence of nodes. Random walks generate these sequences, and language models then learn node representations by treating the sequences as sentences. Building on this, Grover and Leskovec [15] introduced the node2vec approach, which offers a more flexible biased second-order random walk model, while Ribeiro et al. [13] proposed struc2vec, focusing on global structural identities. However, struc2vec has several limitations, which are effectively addressed by ffstruc2vec (see Section 6).
Beyond random walks, other node embedding frameworks have been developed to learn low-dimensional representations of nodes in graphs. Most of these frameworks focus on preserving node proximity properties within the resulting embeddings [14,15,16,17,18,19,20,21]. However, there has been a growing interest in approaches that focus on structural patterns of nodes, independent of their proximity to others. Consequently, diverse methodologies have emerged.
An example of such an approach is struc2gauss, introduced by Pei et al. [22], which extends structure-based embeddings by representing nodes as Gaussian distributions instead of fixed vectors, capturing uncertainty and hierarchical similarities within structural roles. While struc2gauss models structural uncertainty probabilistically, ffstruc2vec takes a different approach by employing a flat similarity graph structure, which provides high flexibility in adapting to specific downstream application tasks and thereby offers interpretability while maintaining scalability (see Section 5).
Additional methods for generating node representations, often integrated into broader embedding frameworks, include self-attention-based approaches [23], attribute-aware sampling methods [24], kernel-based methods [25], recursive methods [26], matrix multiplication methods [27,28,29], spectral graph wavelet approaches [30], neighborhood-based embedding approaches focusing on local structural properties [31], contrastive learning methods, including Graph Contrastive Learning approaches [32,33,34,35], and methods targeting specific structural properties, such as role-based embeddings [36], anonymous walks [37,38,39], graphlets [40,41,42], or self-defined ripple diffusion patterns [43]. For a broader and more in-depth review of node embedding techniques and their applications, we refer the reader to existing surveys [44,45,46].
Each of these methods has its limitations. For example, matrix multiplication-based frameworks tend to be computationally intensive, struggle with flexibility regarding diverse structural patterns, and rely on assumptions about the relationship between the underlying network structure and the downstream application task. The diffusion wavelet approach in GraphWave produces embeddings that are less intuitive in terms of direct structural features and can be costly to compute at scale. Some methods explicitly assign role distributions or structural types to nodes [27,36], which can lead to reduced granularity and limit the ability to reflect nuanced structural differences in the resulting embeddings. Deep learning-based approaches, particularly those relying on Graph Neural Networks (GNNs), often face challenges with interpretability and scalability, particularly in application settings that require transparent and reusable representations. While some GNN variants attempt to incorporate structural features explicitly—such as Gralsp [47]—they require extensive labeled data and typically remain tightly coupled to specific downstream tasks, which also limits their reusability. In contrast, Graph Contrastive Learning aims to produce task-agnostic representations in a self-supervised fashion, but relies on computationally demanding data augmentation or multi-view training pipelines, which further limit its scalability and adaptability in application-specific settings.
In contrast, ffstruc2vec addresses these limitations by providing task-adaptive and transparent embeddings within a design that remains efficient even on large-scale graphs. To the best of our knowledge, ffstruc2vec is among the first frameworks to combine downstream task adaptability, interpretability, and scalability (see Section 5) within a unified design.
To provide a concise overview of representative node embedding approaches and their commonly discussed challenges in the context of structural role modeling, Table 1 categorizes related methods based on their primary focus.

3. Preliminaries and Definitions

This section defines the fundamental definitions and preliminary concepts required in this paper.
Definition 1
(Graph). A graph, denoted as G = ( V , E ) , is a mathematical construct comprising a set of vertices V = { v 1 , , v n } and a set of edges E { u , v } u , v V , u v in the case of an undirected graph, meaning each edge is an unordered pair of distinct nodes. In contrast, in a directed graph, the edge set is defined as E ( u , v ) u , v V , u v , where edges are ordered pairs indicating a directed connection from node u to node v.
In this work, we exclusively focus on undirected graphs, as defined above. However, the fundamental concepts introduced in this paper can be easily adapted and extended to directed graphs.
Definition 2
(Node Embedding). A node embedding of a graph G = ( V , E ) with n nodes is defined as a mapping function f as follows:
f : v i y i R d , i { 1 , , n } ,
where d | V | , and the function f preserves certain properties defined on the graph G.
Definition 3
(k-hop Neighborhood). The k-hop neighborhood of a node x in a graph is the set of all nodes that are exactly k hops away from x. Formally, it is defined as
N k ( x ) = { y V distance ( x , y ) = k } ,
where V represents the set of all nodes in the graph, and  distance ( x , y ) represents the length of the shortest path between nodes x and y.
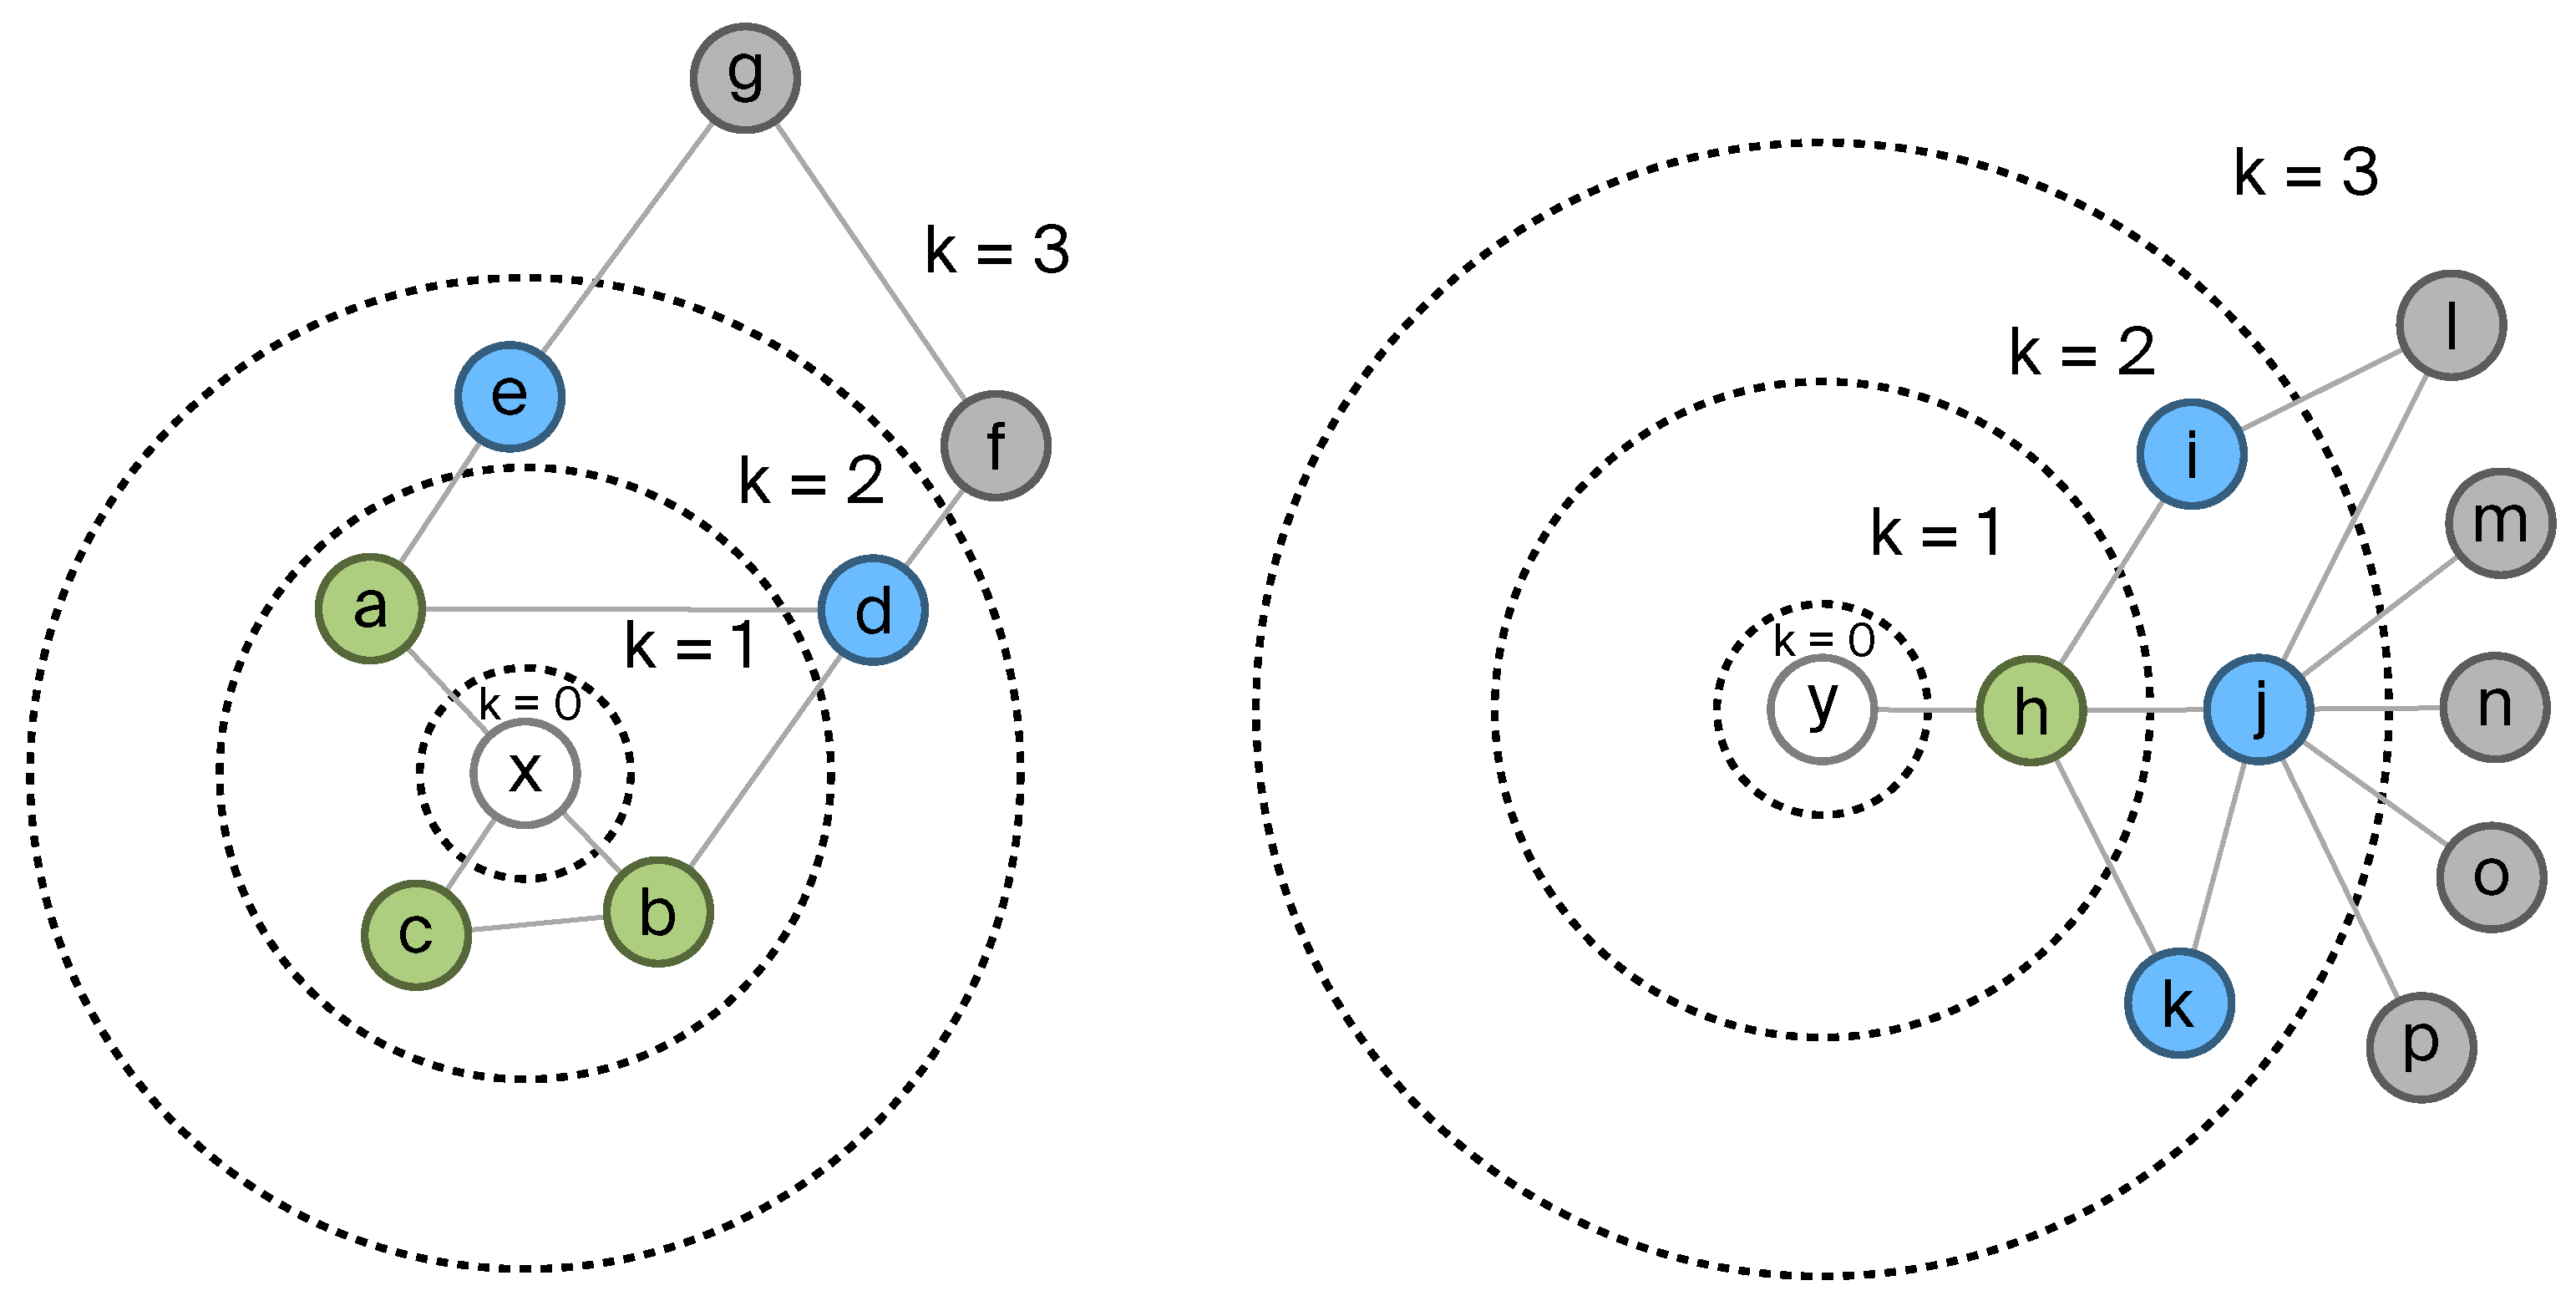
For an intuitive understanding, Figure 2 visually illustrates the k-hop neighborhoods of two nodes, x and y, using color coding. Specifically, the 1-hop neighborhood is highlighted in green, the 2-hop neighborhood in blue, and the 3-hop neighborhood in gray. As an illustrative example, the 2-hop neighborhoods of nodes x and y are given by
N 2 ( x ) = { e , d } , N 2 ( y ) = { i , j , k } .
Definition 4
(Node Degree). In accordance with Definition 1, the degree of a node v in a graph G = ( V , E ) is defined as
d v = | { u { v , u } E } | .
Definition 5
(Isomorphic Graphs). Two graphs G = ( V , E ) and G = ( V , E ) are isomorphic if there exists a bijective mapping g : V V (called the isomorphism function) such that for any two nodes v i , v j V , the following condition holds:
( v i , v j ) E iff ( g ( v i ) , g ( v j ) ) E .
Definition 6
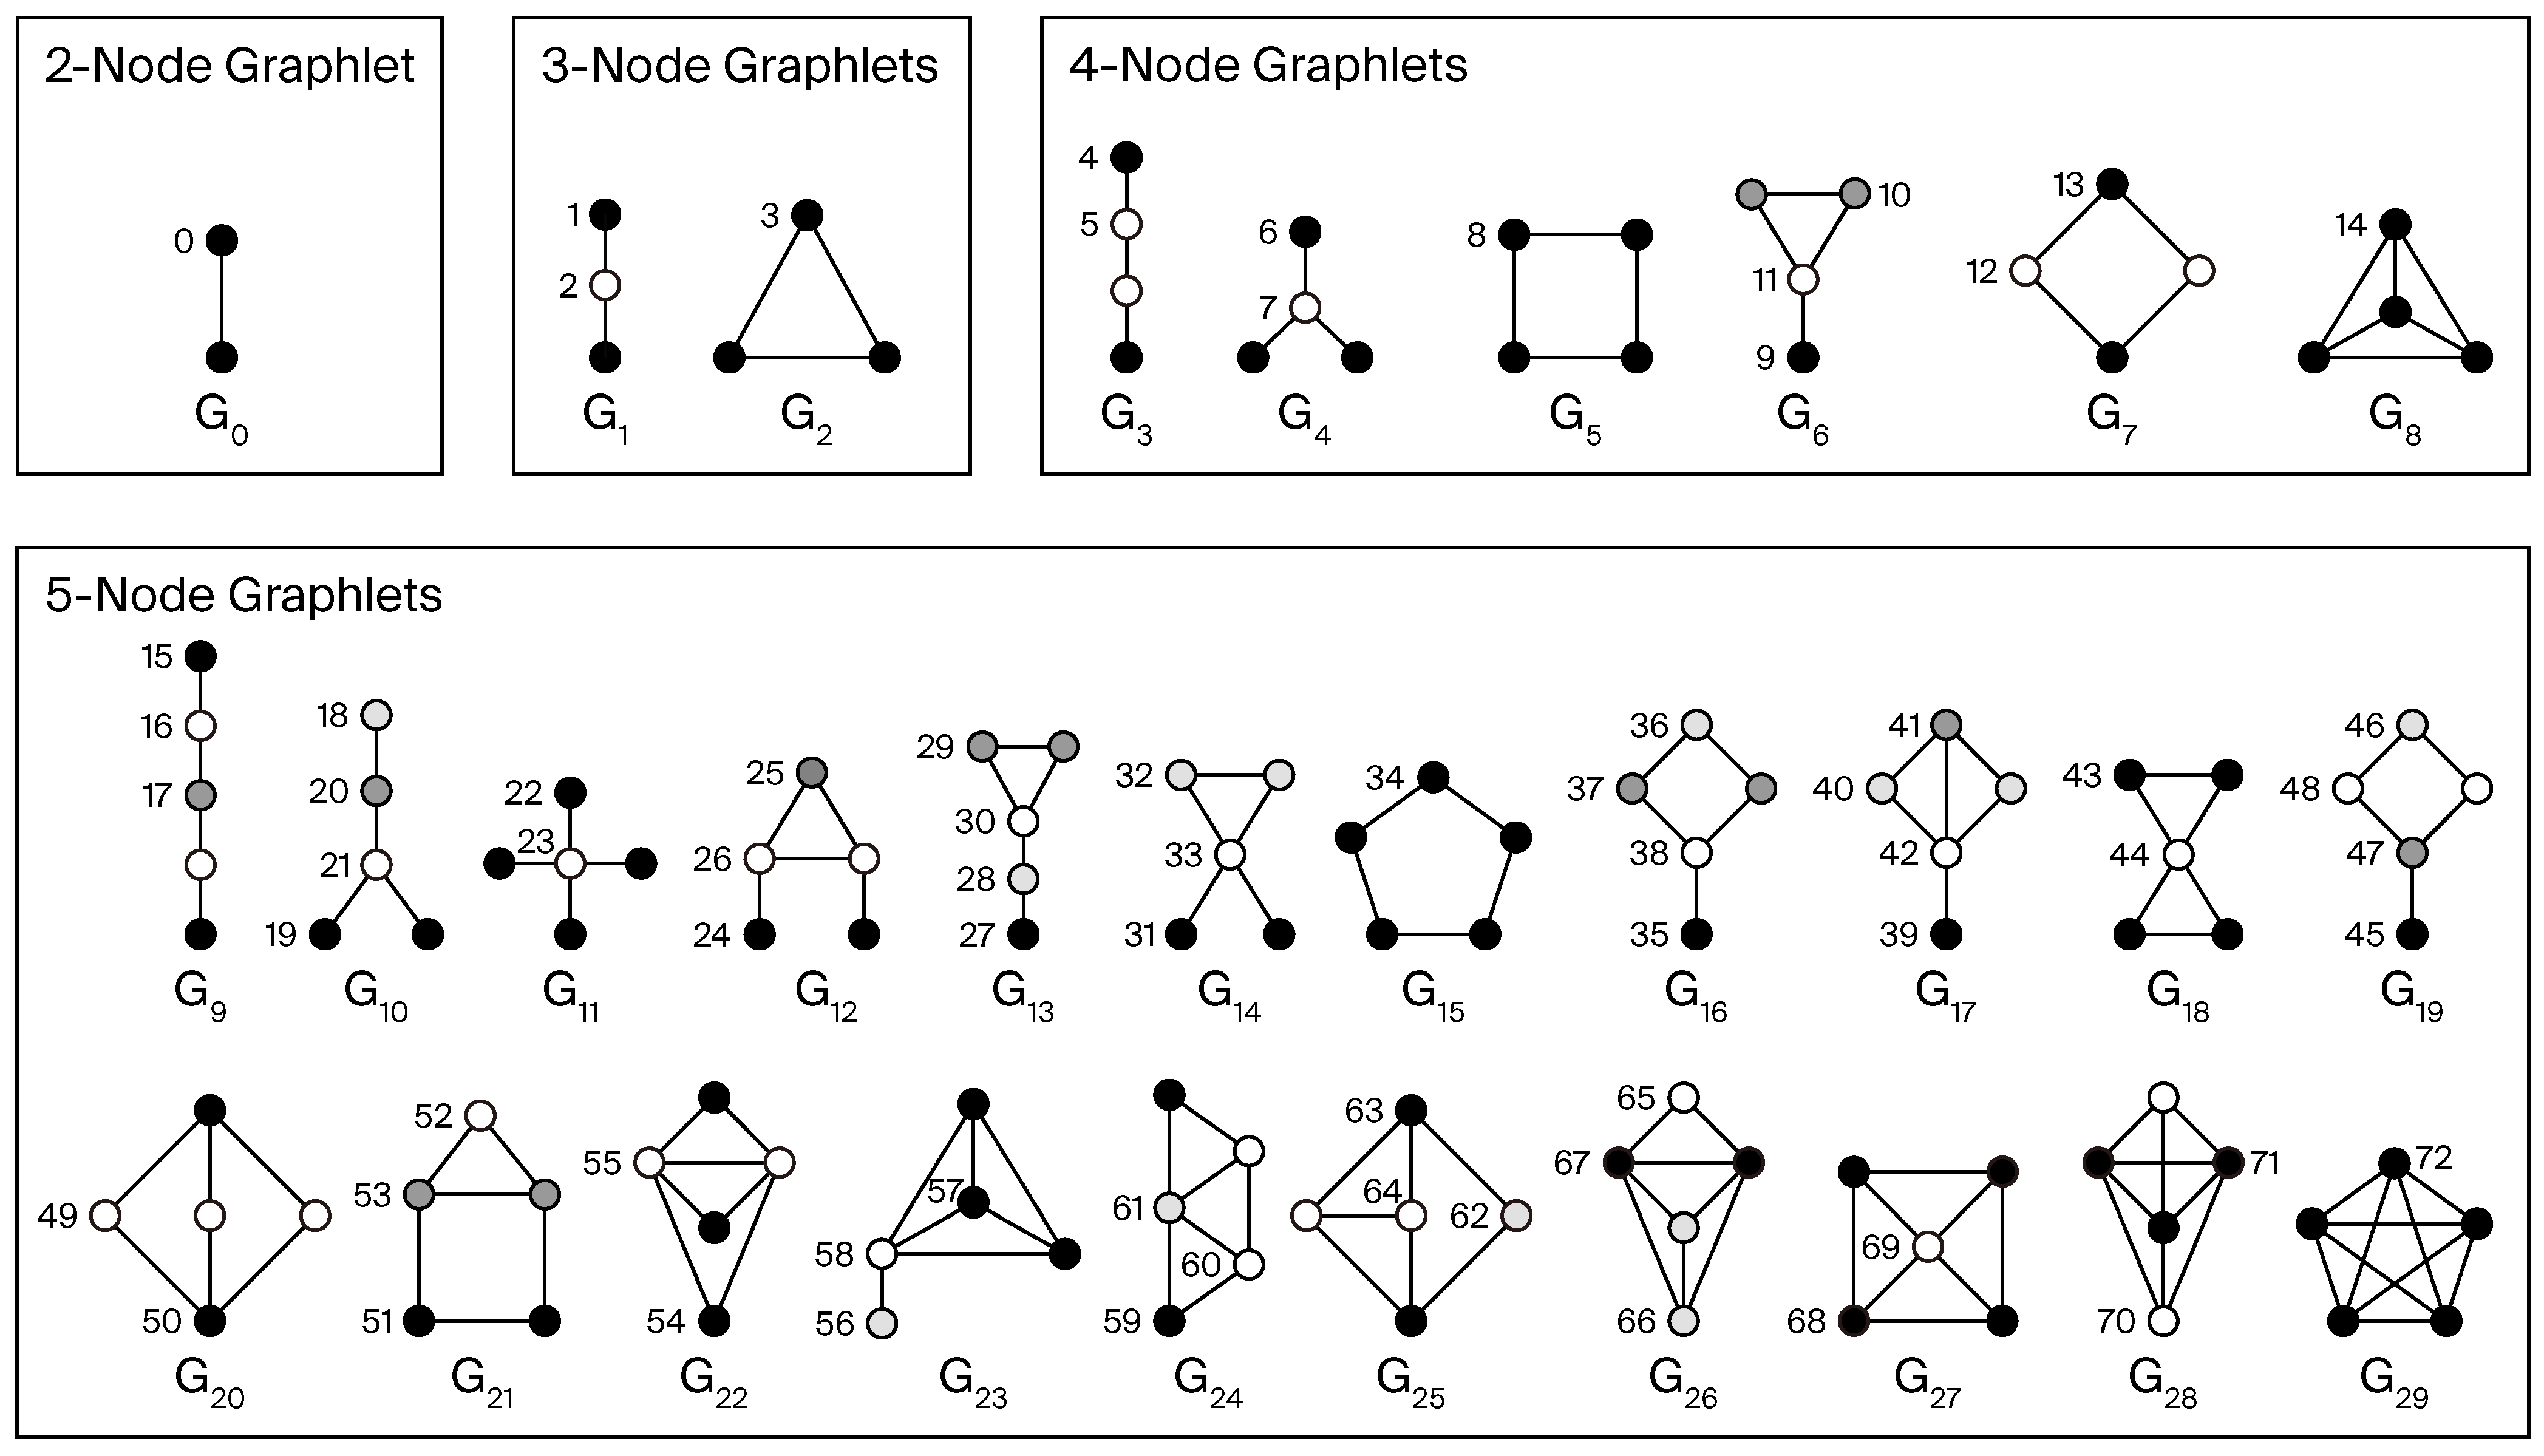
(Graphlets and Orbits). Graphlets are defined as small, connected, and non-isomorphic induced subgraphs (as specified in Definition 5) of a graph, consisting of at least two nodes [48]. All graphlets with 2, 3, 4, or 5 nodes and their automorphism orbits are illustrated in Figure 3. “orbit” refers to the different possible node positions within the graphlets. Symmetrical nodes are assigned the same orbit number, with 73 orbits of 30 graphlets.
Definition 7
(Anonymous Walk). Let s = ( u 1 , u 2 , , u k ) be an ordered list of elements u i V . We define the positional function p o s : ( s , u i ) q , which returns a list q = ( p 1 , p 2 , , p l ) of all positions p j N , where u i occurs in the list s.
If w = ( v 1 , v 2 , , v k ) is a random walk, then its corresponding anonymous walk is the sequence of integers a = ( f ( v 1 ) , f ( v 2 ) , , f ( v k ) ) , where the function f is defined as
f ( v i ) = min p j p o s ( w , v i ) p o s ( w , v i ) .

4. The ffstruc2vec Framework

The ffstruc2vec framework learns structural node representations by capturing similarities between nodes based on their structural roles within a network. It computes structural similarity scores between node pairs using a diverse set of structural properties, including those of individual nodes and their k-hop neighborhoods. The framework provides a flexible mechanism for integrating various comparison functions and adaptive weightings (see Section 4.1), allowing for an effective and interpretable encoding of structural identities. Based on these similarities, a similarity graph is constructed, where edge weights quantify the computed relationships (see Section 4.2). To extract meaningful patterns from this graph, biased random walks are performed, with transition probabilities influenced by the similarity-based edge weights (see Section 4.3). The resulting node sequences are then used in the Skip-gram model to learn dense vector representations of nodes (see Section 4.4). Finally, a task-aware optimization step refines the embeddings to improve performance in specific downstream applications (see Section 4.5).
A formalized overview of the complete ffstruc2vec pipeline is provided in Algorithm 1. Details regarding the specific graph indicators, comparison functions, and additional hyperparameters utilized within this pipeline are provided in Supplementary Materials Sections S1–S4.
Algorithm 1 ffstruc2vec: Learning Pipeline
Input: Graph G ( V , E ) , maximum neighborhood depth k * (defining the maximum k-hop neighborhood), l graph indicators { I i } i = 1 l , l comparison functions { f i } i = 1 l , p: number of random walks per node, L w : length of each random walk, d: embedding dimension.
Output: Node representation vectors { r x } x V in R d .
  1:
for all  x V  do
  2:
   Compute graph indicators { I i ( x ) } i = 1 l
  3:
end for
  4:
Initialize weights { w i k } for all ( i , k ) { 1 , , l } × { 0 , , k * }
  5:
for all  ( x , y ) V × V  do
  6:
    s i m ( x , y ) computeStructuralSimilarity ( x , y , { I i } , { f i } , { w i k } , k * )   // see Algorithm 2
  7:
end for
  8:
G similarityGraph ( V , s i m )                  // see Algorithm 3
  9:
for all  x V  do
10:
    c o n t e x t ( x ) performRandomWalks ( G , x , p , L w )     // see Algorithm 4
11:
end for
12:
r word2vec x V   c o n t e x t ( x ) , d              // see Section 4.4
13:
Task-aware optimization: adjust { w i k } (if applicable)    // see Section 4.5

4.1. Measuring Structural Similarity

The ffstruc2vec framework begins by evaluating the structural similarity between pairs of nodes in a graph, leveraging graph indicators as metrics to quantify the structural properties of individual nodes. Notably, the similarity between a node x and a node y is not solely determined by their respective structural properties but also accounts for the structural characteristics of the nodes within their k-hop neighborhoods, N k ( x ) and N k ( y ) (see Definition 3).
As an initial step, the structural similarity of the k-hop neighborhoods of x and y, denoted as s i m k ( x , y ) , is computed by comparing the graph indicator values of the nodes in N k ( x ) with those of the nodes in N k ( y ) . Let I = { I 1 , I 2 , , I l } be a set of graph indicators I i : V W ( I i ) , where each indicator describes a specific structural property of a node, and  W ( I i ) denotes the value range of the indicator. Examples of such graph indicators are provided in Supplementary Materials Section S1.
To quantify the similarity, let
f i : P ( W ( I i ) ) × P ( W ( I i ) ) R , i { 1 , , l } ,
denote a set of functions that compare the values of the graph indicators between two sets of nodes, where P ( W ( I i ) ) denotes the power set of W ( I i ) , i.e., the set of all subsets of the value range of the graph indicator I i . Specific examples of these comparison functions are detailed in Supplementary Materials Section S3. The structural similarity s i m k ( x , y ) is then computed as defined in Equation (1).
s i m k ( x , y ) = i = 1 l w i k · f i v N k ( x ) { I i ( v ) } , v N k ( y ) { I i ( v ) } ,
where w i k R are weighting factors applied to the values of graph indicators I i for the k-hop neighborhoods.
In the subsequent step of the ffstruc2vec framework, the overall structural similarity s i m ( x , y ) between nodes x and y is computed as the sum of the structural similarities between their respective k-hop neighborhoods, denoted as s i m k ( x , y ) , for all k k * . Here, k * is a predefined constant that determines the maximum neighborhood depth considered when describing the structural properties of a node’s neighborhood (see Equation (2)).
s i m ( x , y ) = k = 0 k * s i m k ( x , y ) .
By substituting Equation (1) into Equation (2), we obtain the following expanded expression:
s i m ( x , y ) = k = 0 k * i = 1 l w i k · f i v N k ( x ) { I i ( v ) } , v N k ( y ) { I i ( v ) }
For notational convenience, we extend the function I i to sets by defining
I i ( N k ( x ) ) : = v N k ( x ) { I i ( v ) } .
Using Equation (4), we can rewrite Equation (3) in a more compact form as follows:
s i m ( x , y ) = k = 0 k * i = 1 l w i k · f i ( I i ( N k ( x ) ) , I i ( N k ( y ) ) ) .
The weighting of graph indicators in different k-hop neighborhoods using the weighting factors w i k in Equation (5) is a key aspect of ffstruc2vec’s flexibility (see Section 4.5 and Section 5.1) in extracting diverse types of structural identities tailored to various downstream application tasks.
The computation of the structural similarity defined above is summarized in Algorithm 2.
Algorithm 2 Compute Structural Similarity
Input: Nodes x , y , graph indicators { I i } i = 1 l , comparison functions { f i } i = 1 l , weights { w i k } , maximum neighborhood depth k *
Output: Structural similarity score s i m ( x , y )
  1:
s i m ( x , y ) 0
  2:
for  k = 0 to k *  do
  3:
   for  i = 1 to l do
  4:
      Compute f i ( I i ( N k ( x ) ) , I i ( N k ( y ) ) )
  5:
       s i m ( x , y ) s i m ( x , y ) + w i k · f i ( · )
  6:
   end for
  7:
end for
  8:
return  s i m ( x , y )
Remark 1.
When employing a large number of graph indicators ( l ) and multiple k-hop neighborhoods ( k * + 1 ) , the search for l · ( k * + 1 ) weighting factors suitable for a specific downstream application task—e.g., through heuristic optimization—can be computationally intensive. The following strategies help mitigate the computational cost of determining suitable weighting factors.
  • In practical applications, a choice of k * 4 is reasonable for most downstream application tasks. This is supported by empirical research on the Facebook network of active users, which found an average shortest path length of 4.74 between two nodes [50].
  • To reduce the number of flexible weighting factors from l · ( k * + 1 ) to l + k * + 1 , the weighting factors for graph indicators and k-hop neighborhoods can be integrated independently, as shown in Equation (6). While this modification improves the computational efficiency of ffstruc2vec, it comes at the expense of a slight reduction in expressive power.
    s i m ( x , y ) = k = 0 k * w k hop i = 1 l w i ind · f i ( I i ( N k ( x ) ) , I i ( N k ( y ) ) ) .
  • To determine l · ( k * + 1 ) suitable weighting factors for large values of l and k * , a smaller graph subset can be used during the optimization phase before applying ffstruc2vec to the full graph with the optimized weighting factors. This approach enhances computational efficiency during optimization but increases the risk of selecting weighting factors that may be less optimal for specific downstream application tasks.

4.2. Constructing the Similarity Graph

As defined in Definition 1, the original graph is denoted as G = ( V , E ) . A fully connected weighted graph G = ( V , E ) is constructed, to encode the structural similarities between all nodes in G. Specifically, the node set remains unchanged, i.e.,  V = V , while the edge weights in E are assigned for ( x , y ) E based on the structural similarity between nodes x and y in the original graph G, quantified by s i m ( x , y ) in Equation (5).
The edge weights are computed by applying a transformation function to s i m ( x , y ) , ensuring that structurally similar nodes receive higher weights. The choice of this function in G is designed to be flexible and is treated as a hyperparameter (see Supplementary Materials Section S4). This adaptability allows the weighting function to be customized for the specific requirements of a given downstream application task.
The construction of the similarity graph defined above is summarized in Algorithm 3.
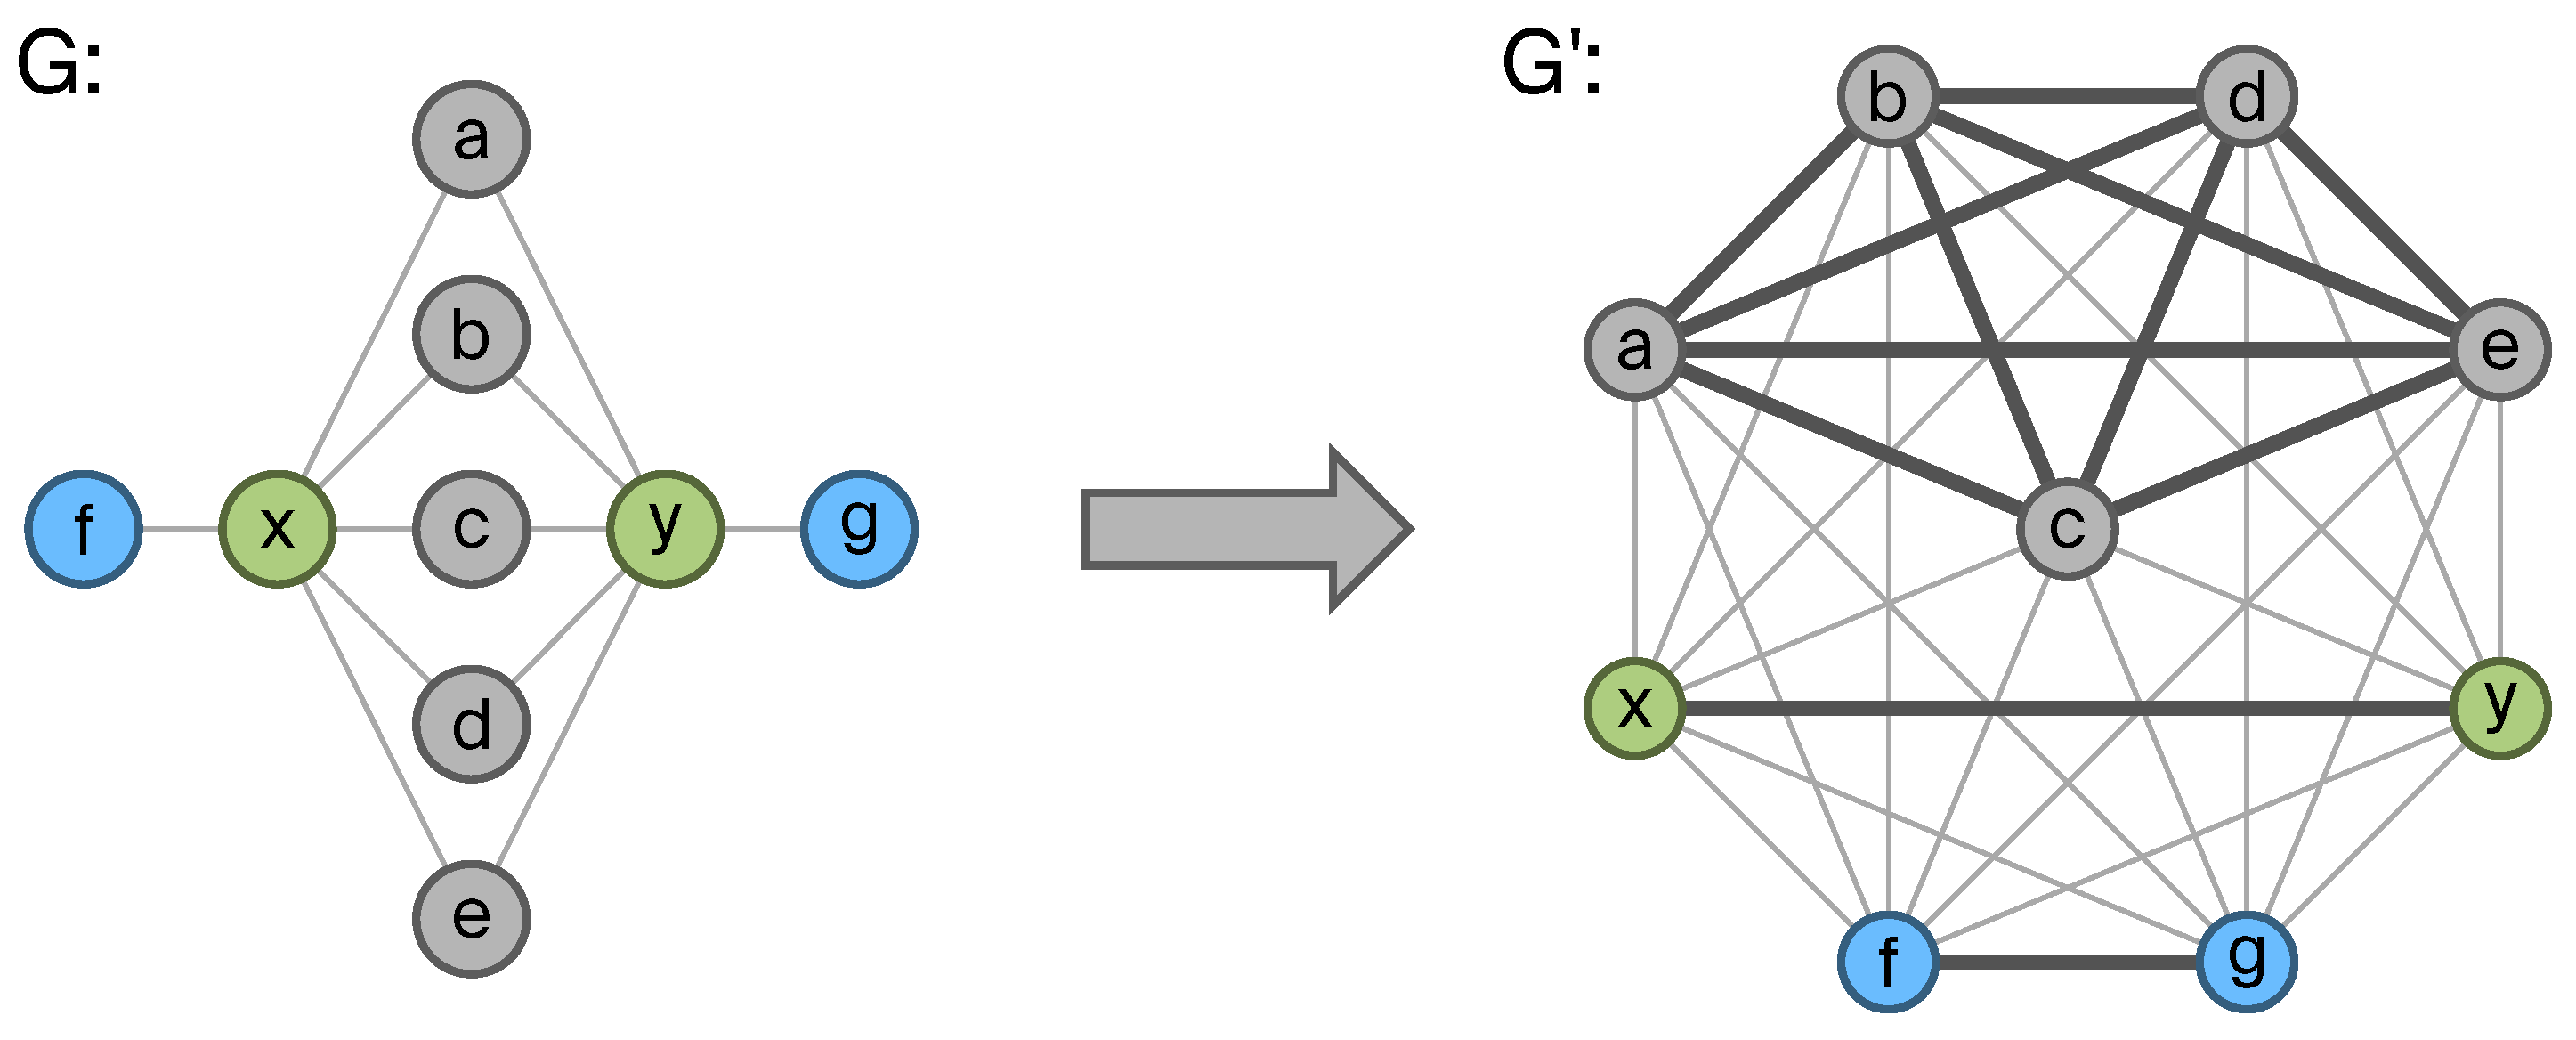
An illustrative example of this process is provided in Figure 4. Nodes in G with identical structural properties are depicted in the same color. In  G , edges connecting these structurally similar nodes are assigned higher weights, which are visually represented as thicker lines.
Algorithm 3 Similarity Graph Construction
Input: Node set V, similarity scores s i m ( x , y )
Output: Similarity graph G ( V , E )
  1:
V V
  2:
for all  ( x , y ) V × V  do
  3:
   Compute edge weight w x y from s i m ( x , y )
  4:
   Add edge ( x , y ) with weight w x y to E
  5:
end for
  6:
return  G ( V , E )

4.3. Performing Biased Random Walks

To generate node representation vectors using the similarity graph G , we first perform a biased random walk on G . During this process, the selection of the next node to visit is determined by the edge weights in G , ensuring that transitions favor structurally similar nodes.
The transition probability from node x to node y, denoted as P r ( x y ) , is computed as
P r ( x y ) = w x y j = 1 n w x j ,
where n represents the total number of nodes in the graph, and  w x y denotes the edge weight of the edge connecting nodes x and y in G .
Multiple random walks of a specified length are initiated from each node, generating sequences of nodes. The selection of the next node in these walks follows the transition probabilities defined in Equation (7), ensuring that transitions occur based on the edge weights in G . Since the edge weights in the fully connected graph G encode the structural similarities between nodes in G (as described in Section 4.2), the random walks naturally tend to position structurally similar nodes in similar contexts within the generated node sequences (as illustrated in Figure 5).
The generation of node contexts via random walks on the similarity graph is summarized in Algorithm 4.
Algorithm 4 Perform Random Walks
Input: Similarity graph G , start node x, number of walks p, walk length L w
Output: Set of node sequences context ( x )
  1:
Initialize empty set context ( x )
  2:
for  i = 1 to p do
  3:
   Initialize walk w [ x ]
  4:
   for  t = 1 to L w 1  do
  5:
      Sample the next node y according to P r ( x y ) in Equation (7)
  6:
      Append node to w
  7:
   end for
  8:
   Add w to context ( x )
  9:
end for
10:
return  context ( x )

4.4. Generating Node Representation Vectors

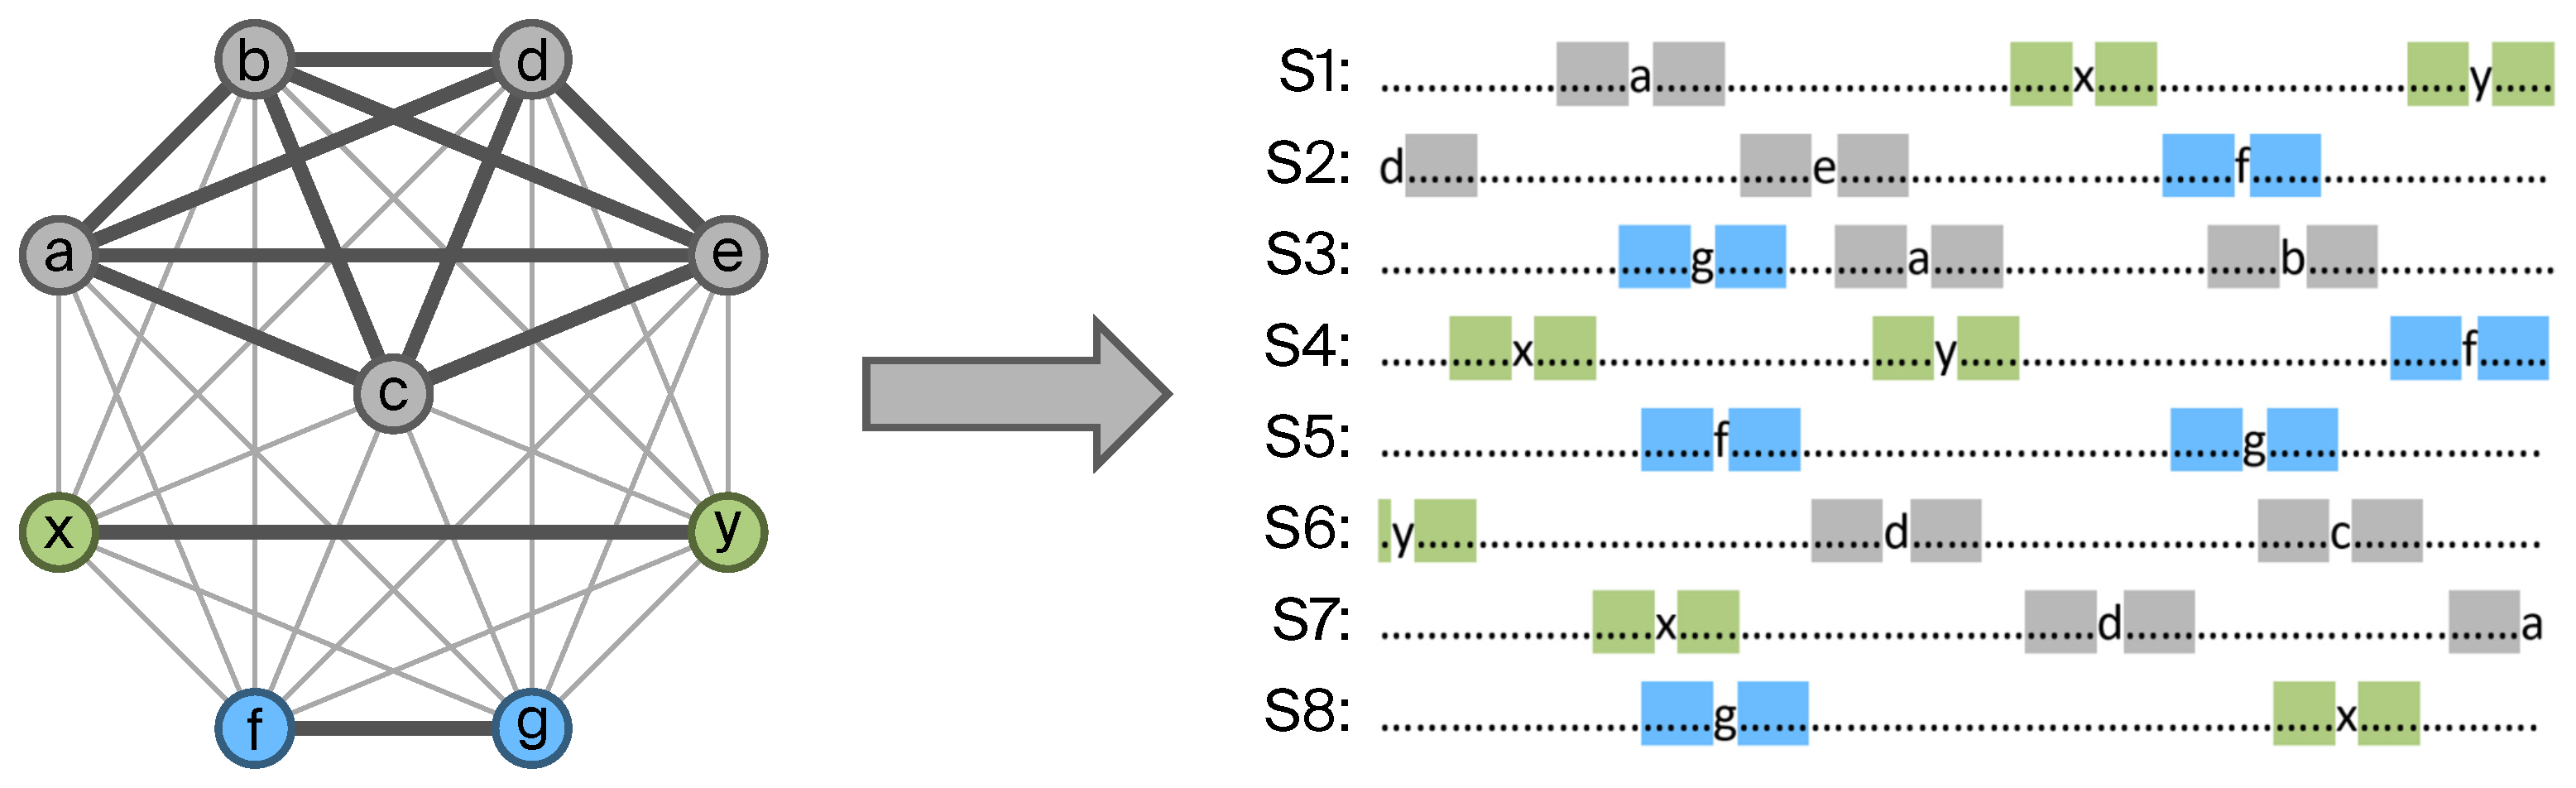
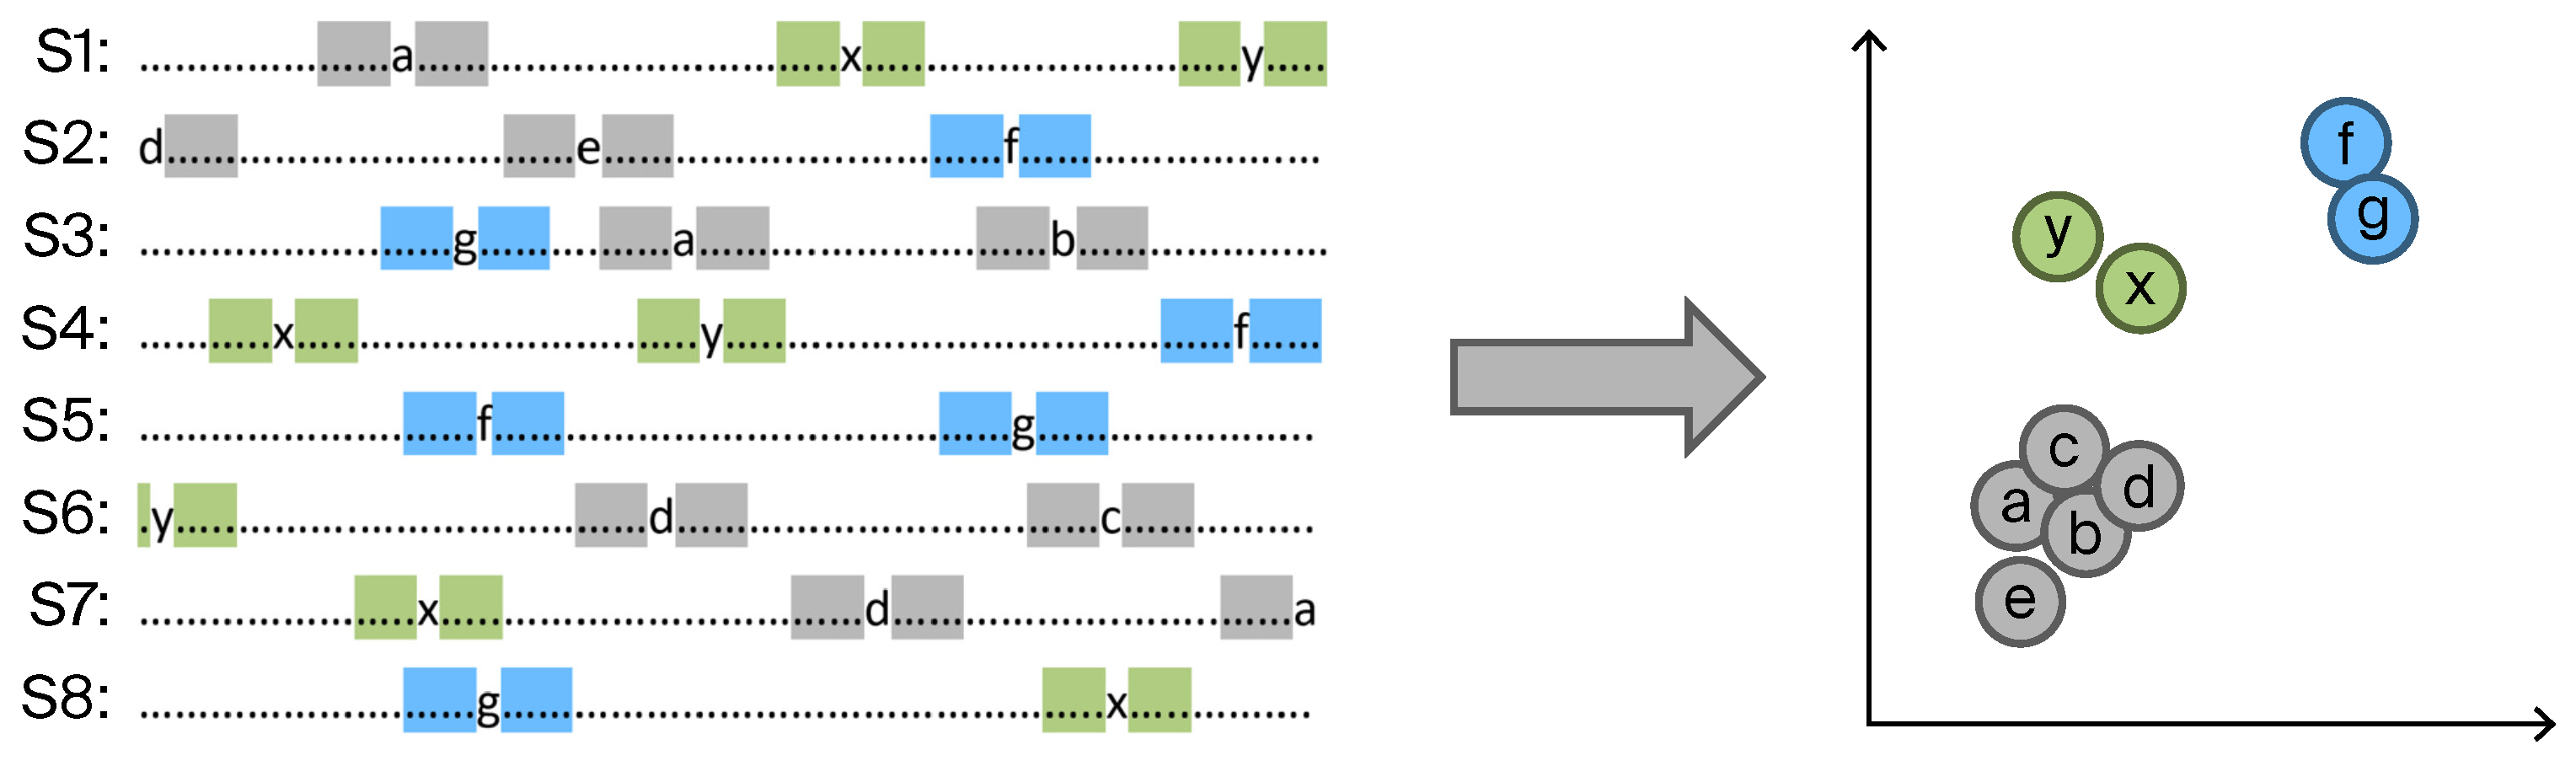
The Skip-gram language model [11] is employed to generate similar representation vectors for nodes that appear in similar contexts within these sequences. Since similar structural identities in G produce similar node contexts in the sequences, the model learns low-dimensional node representation vectors in a continuous vector space, ensuring that structurally similar nodes in G yield similar representations (as illustrated in Figure 6).
More specifically, the Skip-gram model learns a function Φ that maps nodes to their representation vectors by maximizing the conditional probability:
P r { v i w , , v i 1 , v i + 1 , , v i + w } Φ ( v i ) ,
where the context of node v i in a sequence is defined as a window of size w centered on the node.

4.5. Task-Aware Optimization of Node Representations

Different downstream application tasks rely on different types of structural identities within a network, as discussed in Section 2 and Section 5.1. ffstruc2vec is highly flexible, allowing for the seamless integration of various graph indicators with corresponding selectable comparison functions (see Supplementary Materials Sections S1–S3). Moreover, it enables the task-specific weighting of these structural properties for each graph indicator i, both for the nodes themselves and for each of their k-hop neighborhoods, using the parameters w i k for all ( i , k ) { 1 , , l } × { 0 , , k * } (see Section 4.1), where k * defines the maximum neighborhood depth under consideration.
These parameters can either be set manually or, if a downstream application task is accompanied by a loss function, optimized accordingly to align with the task-specific objective. A straightforward approach is to apply heuristic methods such as evolutionary strategies or Bayesian optimization techniques—for example, the Tree-structured Parzen Estimator (TPE) [51]. For large datasets with high values of l and k * , the measures discussed in Remark 1 can be applied to ensure scalability.

5. Key Contributions and Advantages of ffstruc2vec

5.1. Flexibility in Extracting Diverse Structural Identities

The structural identity of a node can be described through various types of structural patterns. The type of structural patterns relevant to a downstream application task may vary depending on the specific case. To ensure the effective application of node embedding vectors, they must preserve the types of structural patterns relevant to the given task. Therefore, a node embedding framework has to possess the capability to adapt flexibly to the specific requirements of application tasks. Many existing approaches lack this flexibility (see Section 2).
The flexibility of ffstruc2vec is achieved through a modular design centered on a flat similarity graph. The framework allows the weighted integration of diverse properties. This integration includes structural graph indicators, and can be extended to incorporate node proximity measures and node features, all weighted across different layers of a node’s k-hop neighborhood (see Definition 3). This weighting scheme, formalized in Section 4.1, enables the model to adapt its structural focus to meet the specific requirements of a given downstream task. For instance, a task might emphasize the properties of the node itself ( k = 0 ), while another might prioritize patterns in its extended neighborhood ( k 1 ). Examples of graph indicators, comparison functions, and other configurable hyperparameters are provided in Supplementary Materials Sections S1–S4.
Optimized hyperparameters can be determined through various methods. Depending on the requirements of the application task, various evaluation metrics can be employed to assess the effectiveness of the selected hyperparameters and the associated structural patterns. The continuous nature of the weights results in a vast hyperparameter space. Therefore, we optimized the accuracy score for the classification task described in Section 7.3 using the Tree-structured Parzen Estimator (TPE), as introduced by Bergstra et al. [51].
The resulting hyperparameter configurations provide valuable insights into the explanation and interpretation of the structural patterns relevant to the application task, as discussed in Section 5.2. ffstruc2vec supports this level of interpretability through its adaptable framework, which formulates the optimization problem in a linear search space (see Section 4.1).

5.2. Interpretability

The explainability and interpretability of machine learning algorithms [52,53] are becoming increasingly important in many practical applications, especially in highly regulated domains.
By generating structural signatures, ffstruc2vec can provide valuable insights into downstream application tasks. For example, the optimized hyperparameters of the flexible ffstruc2vec framework—such as the weights assigned to graph indicators and k-hop neighborhoods (see Section 5.1)—can reveal typical structural patterns associated with the embedding of specific nodes in the context of the application.
An illustrative example is a classification task for detecting financial fraud in transaction graphs, where edges represent financial interactions between entities. Optimized weights may highlight structural motifs, such as triangular patterns or graphlets within a node’s neighborhood, as indicative of fraudulent behavior. In the case of an air traffic network (see Section 7.3), high centrality or bridge scores for an airport or its neighbors may correspond to high passenger volumes. In contrast, in social networks, the same indicators may suggest different behavioral or relational dynamics, depending on the specific application context [10].
To further improve the interpretability of learned weights, preprocessing steps such as normalization or standardization of graph indicators can be beneficial.

5.3. Scalability

ffstruc2vec is designed to scale efficiently with the number of nodes and edges in the input graph, making it suitable for real-world scenarios such as large-scale social networks with billions of elements. Optimization measures applied to the algorithm result in the following time complexity for the extraction of certain structural identities:
O ( max ( | E | , | V | · log | V | ) ) .
Details on the complexity analysis for the optimized version of ffstruc2vec are provided in Supplementary Materials Section S5.

6. Comparative Analysis of ffstruc2vec and struc2vec

In node embedding, struc2vec is a state-of-the-art framework that employs random walks to preserve nodes’ structural identities. The following points summarize the advantages of ffstruc2vec over struc2vec, with additional discussion provided in Supplementary Materials Section S6.
(a)
Greater Flexibility.
ffstruc2vec offers a high degree of flexibility in extracting various types of structural identities, enabling better alignment with specific requirements of downstream application tasks.
(b)
Interpretability.
The alignment process of ffstruc2vec with downstream application tasks provides valuable insights into graph structures, highlighting their impact, meaning, and relevance.
(c)
Superior Scalability.
ffstruc2vec is more scalable for large graphs, with a time complexity of O ( max ( | E | , | V | · log | V | ) ) for the extraction of certain structural identities, compared to struc2vec, whose original multilayer construction can become cubic in the number of nodes in the worst case.
(d)
Optimized Flat Similarity Graph.
Unlike struc2vec’s multilayer graph, ffstruc2vec employs a flat structure to generate node embeddings, improving efficiency and performance.
(e)
Fewer Restrictions on Structural Identity Extraction.
struc2vec’s design imposes limitations on extracting certain structural identities for specific tasks, whereas ffstruc2vec provides a more adaptable framework.
(f)
Better Downstream Performance.
ffstruc2vec outperforms struc2vec across supervised and unsupervised downstream tasks, as demonstrated in Section 7.

7. Experimental Evaluation and Benchmarking

In this section, ffstruc2vec demonstrates its ability to extract structural identities by applying two unsupervised tasks, detailed in Section 7.1 and Section 7.2, and a supervised task in Section 7.3. Specifically, visualization, clustering, and outlier detection are used for unsupervised tasks, while node classification is applied to supervised tasks. Additionally, the performance of ffstruc2vec is evaluated by benchmarking it against other node embedding frameworks.

7.1. Zachary’s Karate Club

The Zachary’s Karate Club network, originally introduced by Zachary [54], consists of 34 nodes and 78 edges. Each node represents a club member, while the edges denote interactions between members outside the club. These edges are commonly interpreted as indicators of friendship among members.
In this section, we utilize a network previously used by Ribeiro et al. [13] to compare ffstruc2vec with the node embedding methods struc2vec, node2vec, and DeepWalk. This network comprises two identical copies of Zachary’s Karate Club network, designated as G 1 and G 2 . Each node in G 1 , denoted as v, has a corresponding mirror node in G 2 , denoted as u, where u and v share identical structural properties. These properties are expected to be preserved in the node embedding vectors.
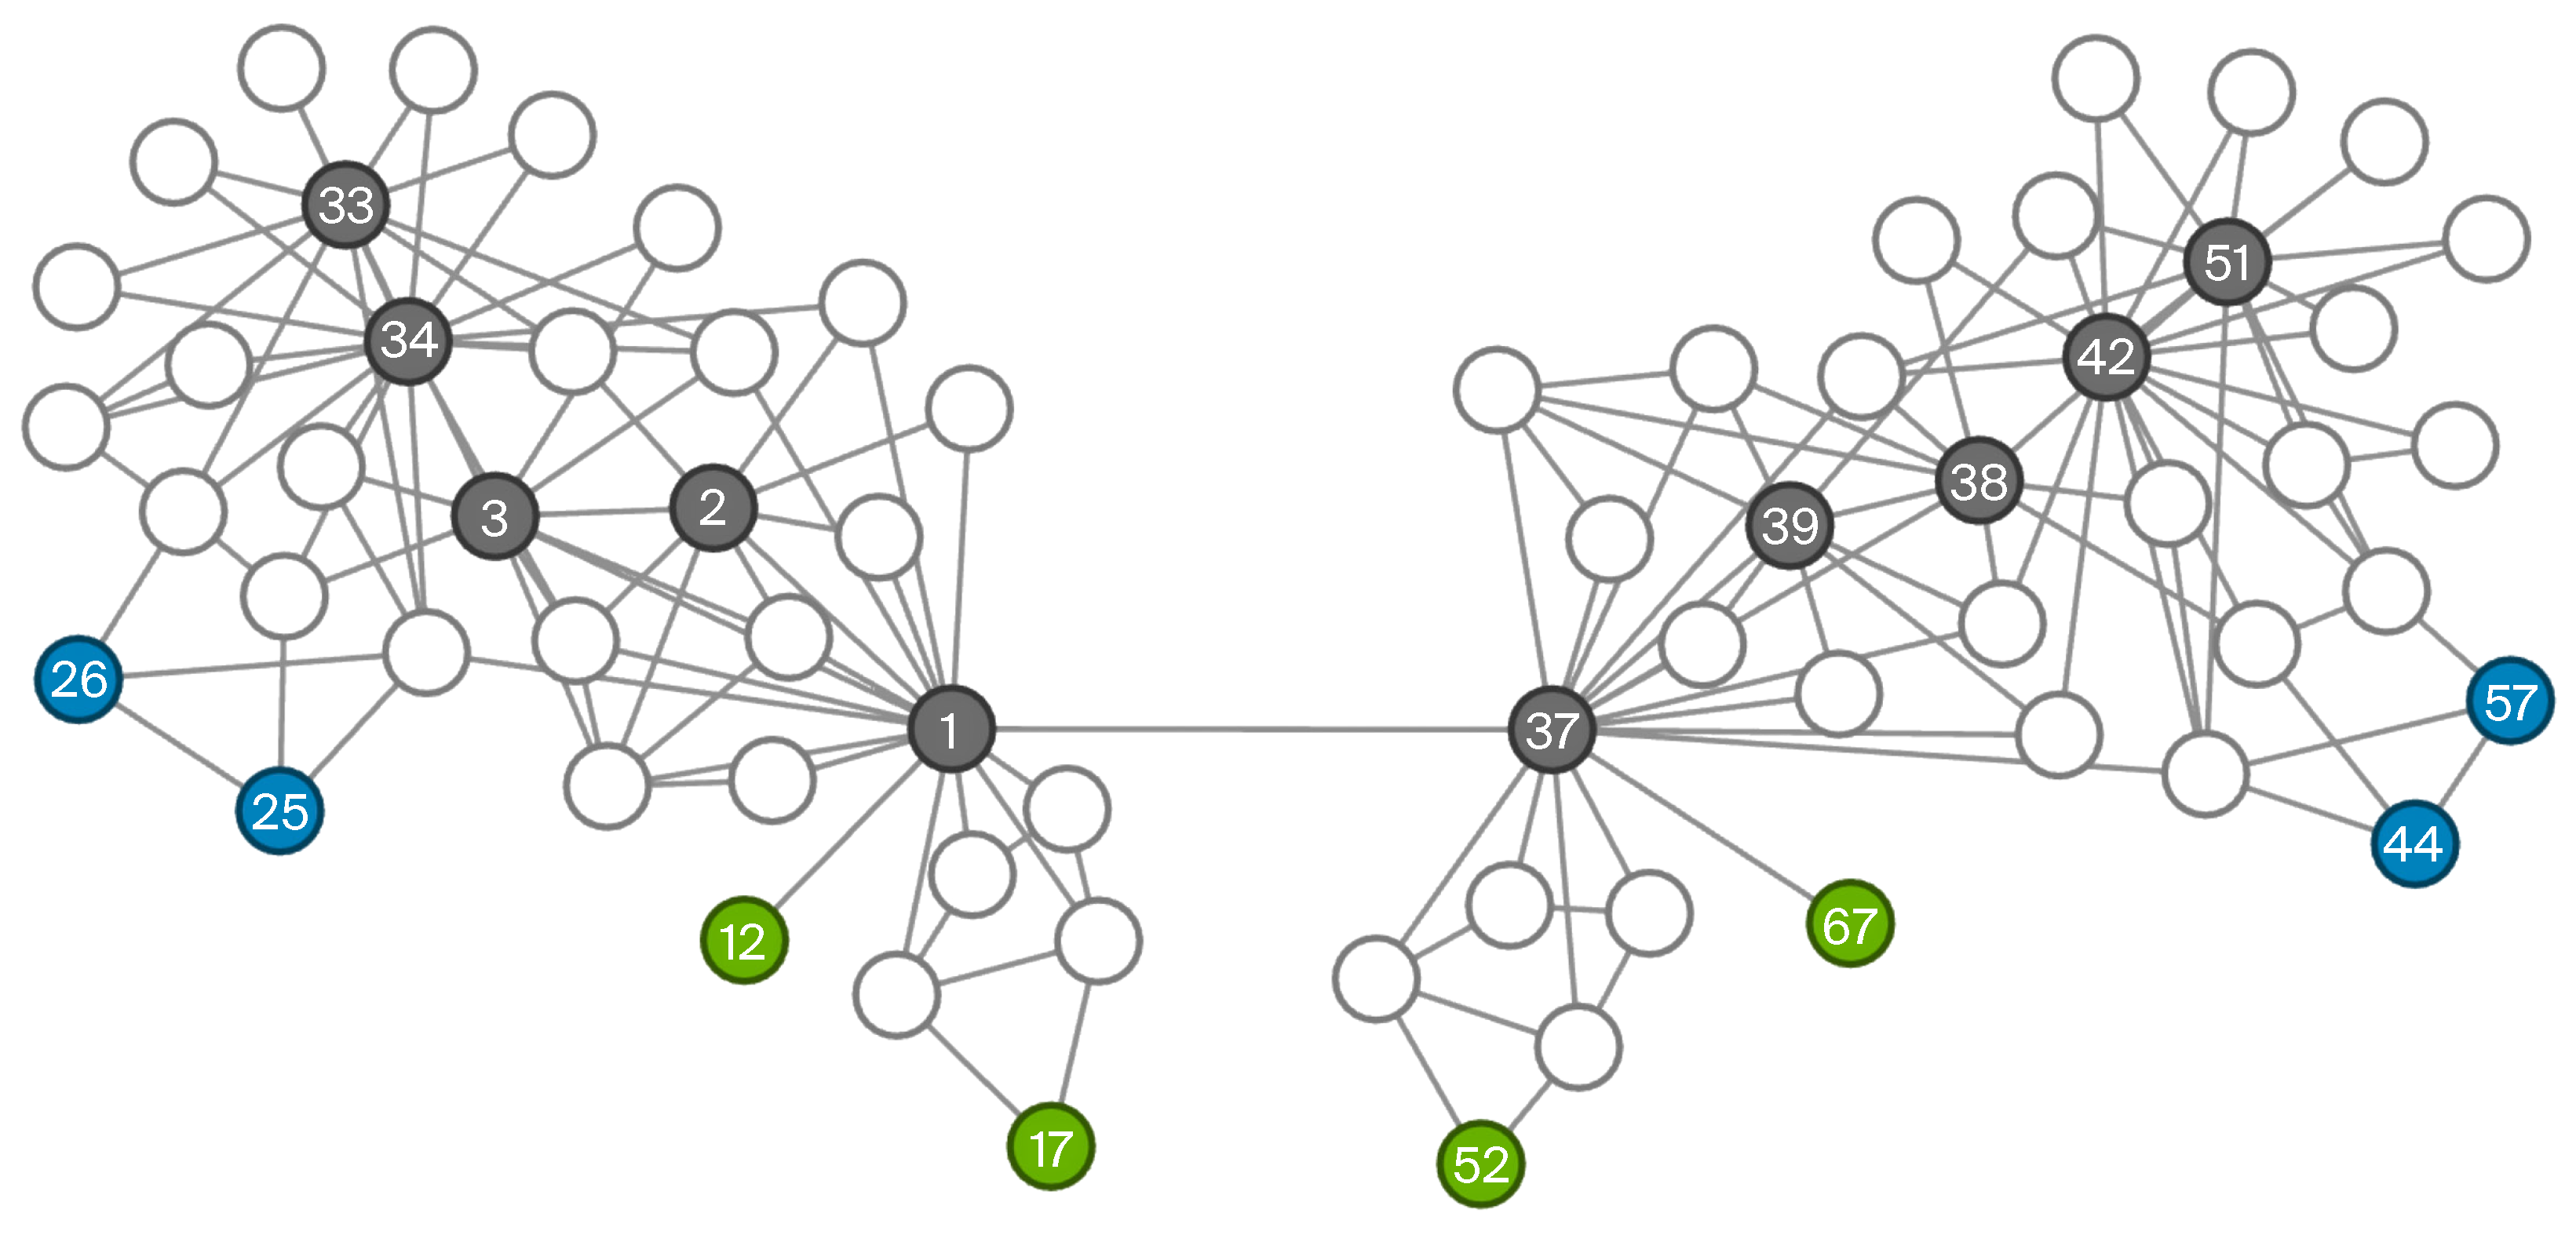
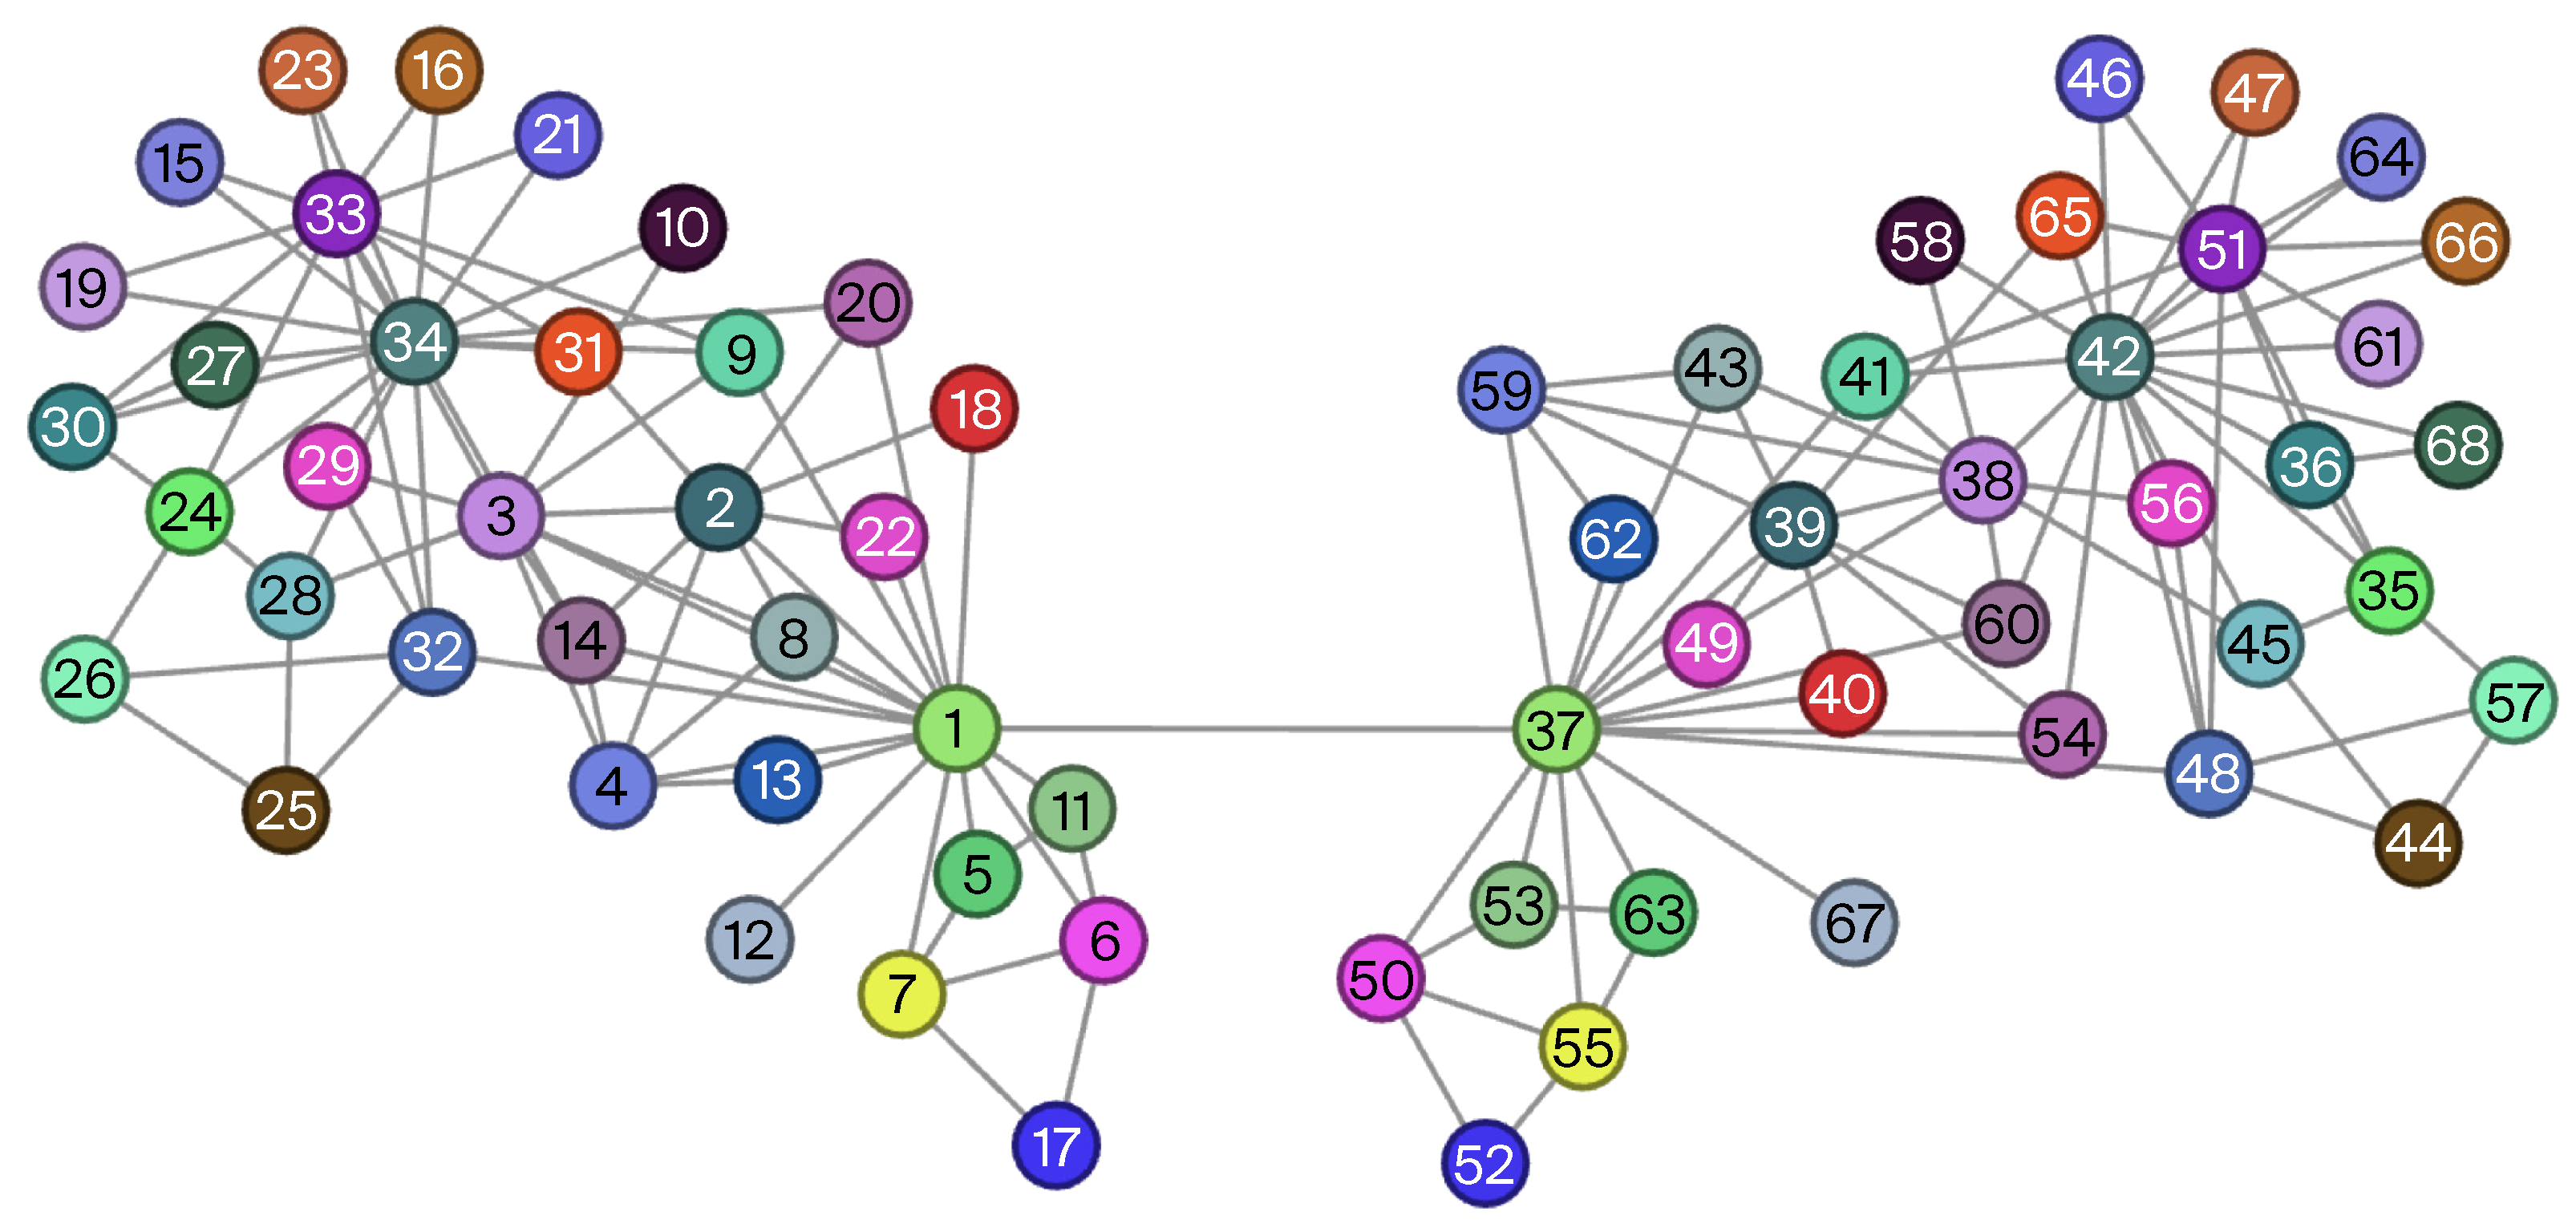
To ensure a fair comparison, the two networks were connected by an additional edge between the pair of mirrored nodes, 1 and 37. This modification was originally introduced because DeepWalk and node2vec cannot place nodes from different connected components in the same context. Figure 7 illustrates the mirrored network, with corresponding node pairs highlighted in the same color. Nodes 1 and 34, along with their corresponding mirrored nodes (37 and 42), represent the club instructor, Mr. Hi, and his administrator, John A. The network was constructed following a conflict between the two, which divided the club members into two factions, each centered around either Mr. Hi or John A. Consequently, nodes 1 and 34 occupy prominent central roles as leaders within their respective groups.
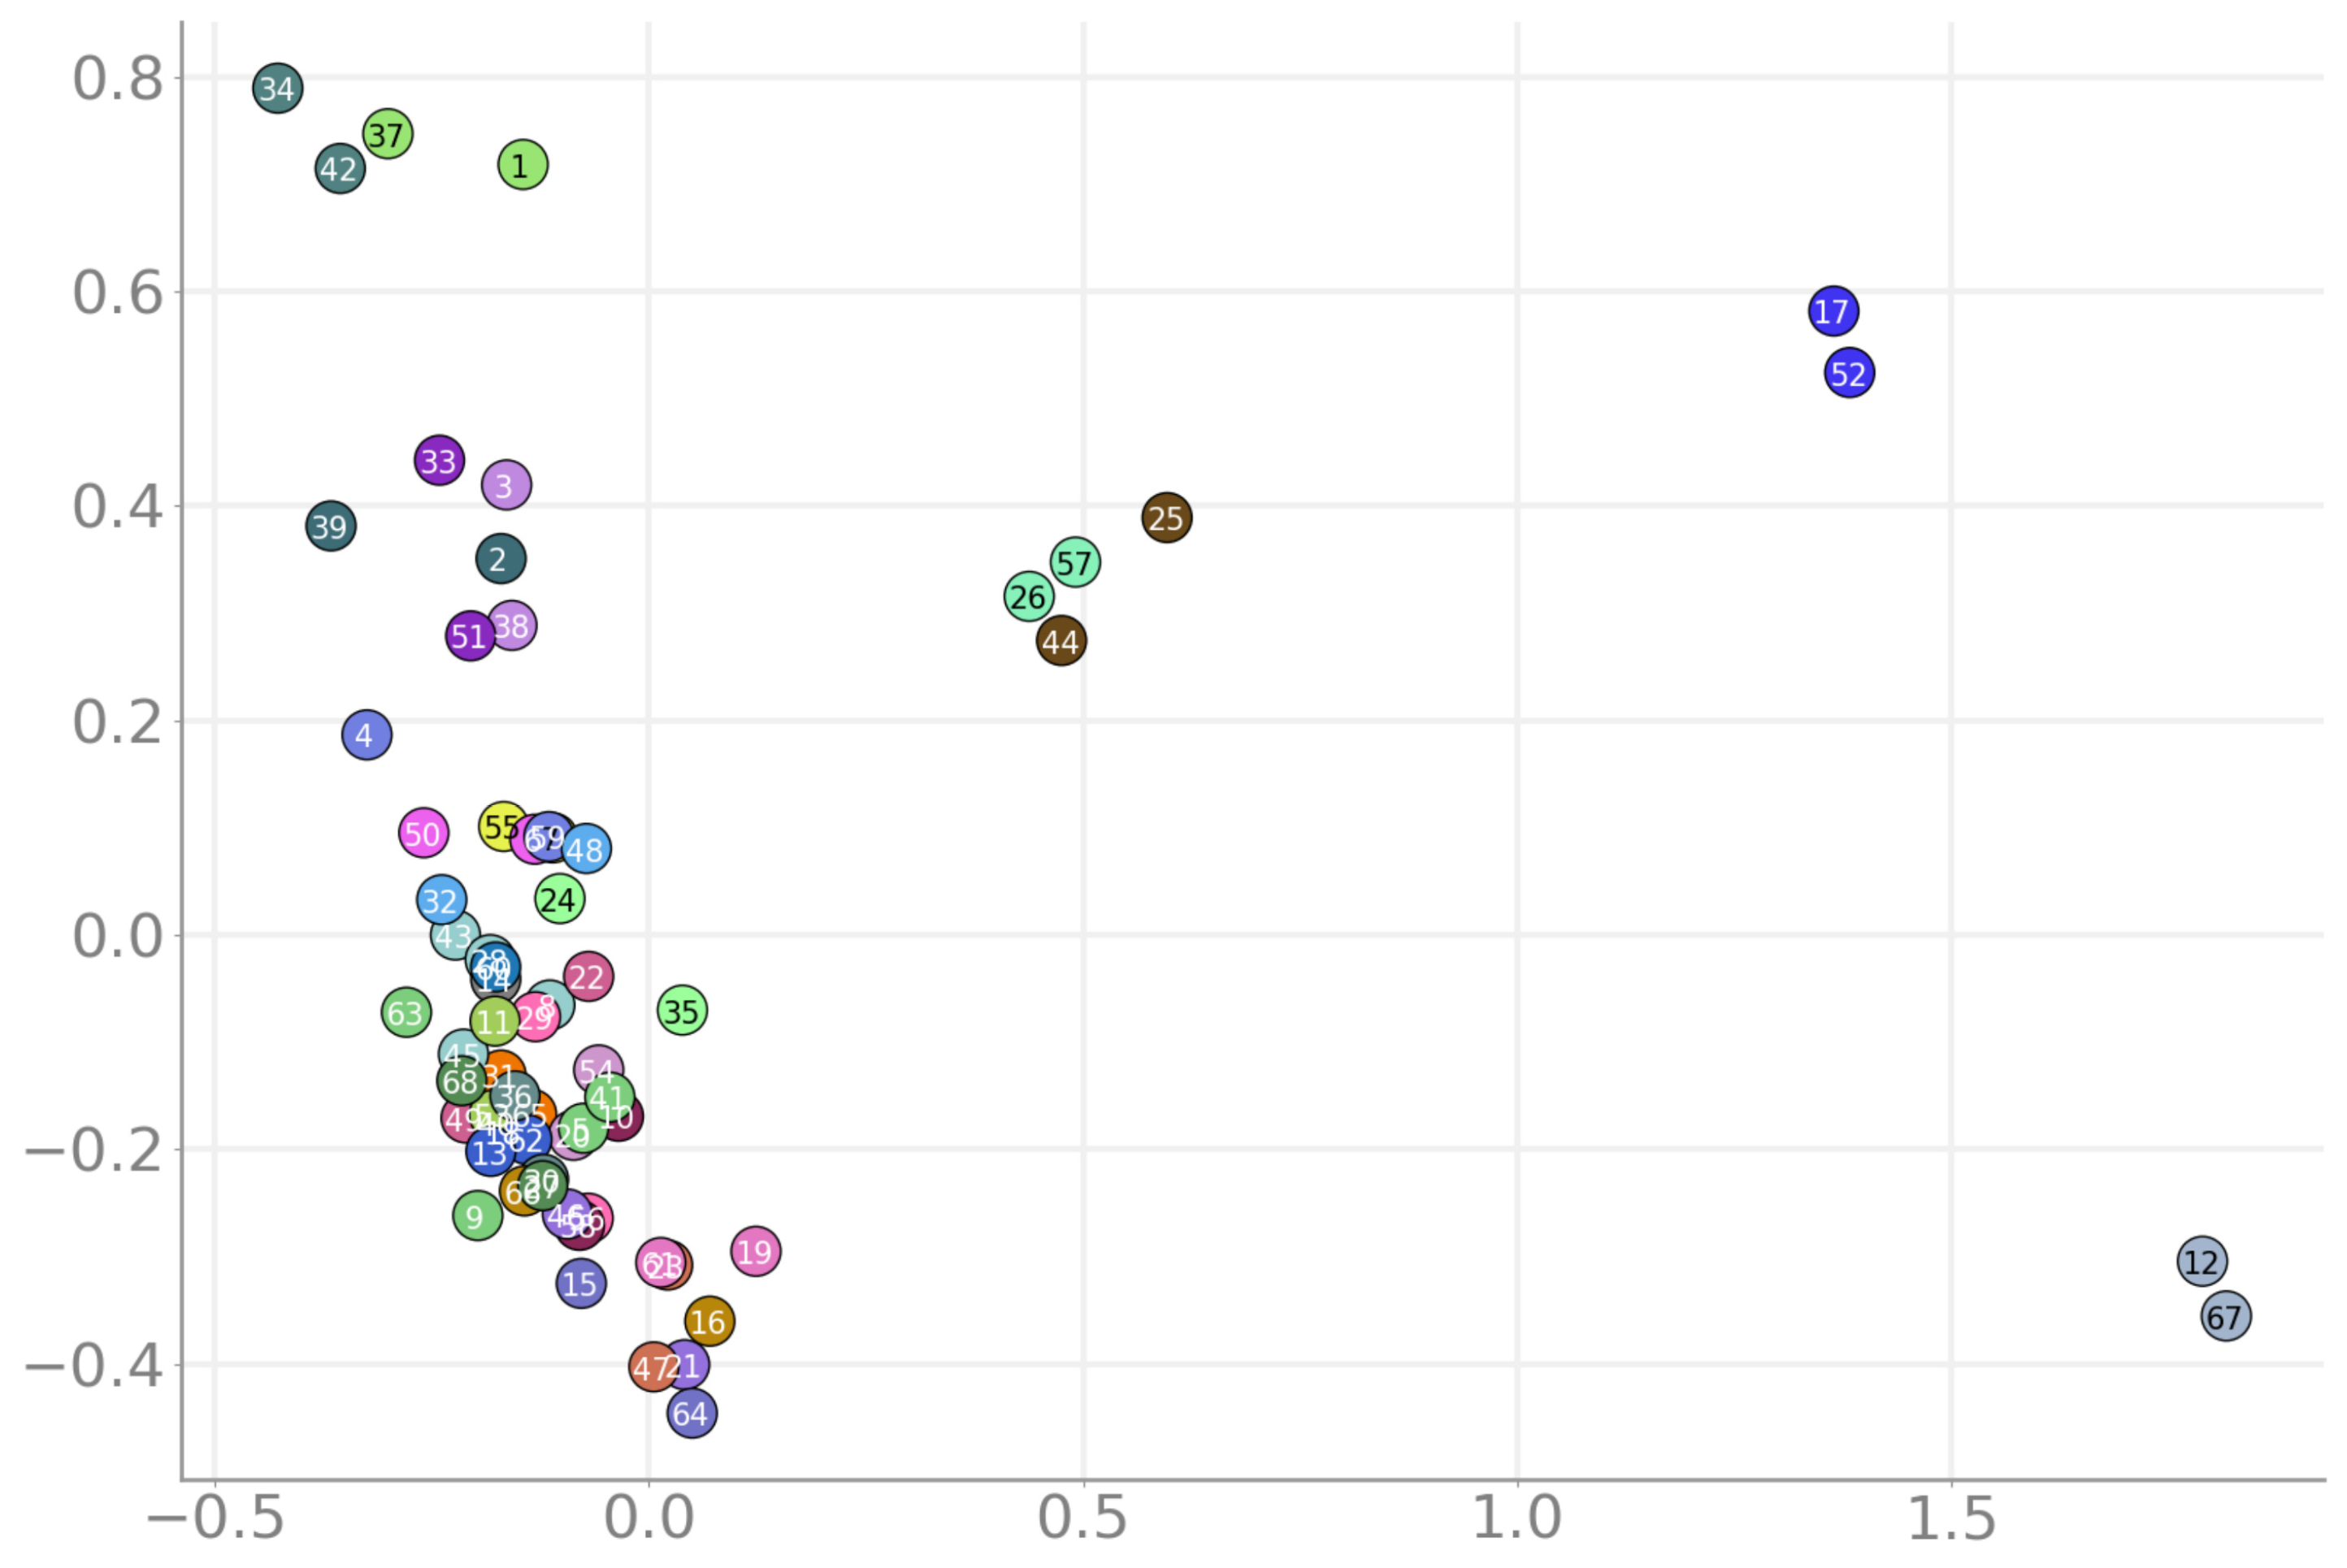
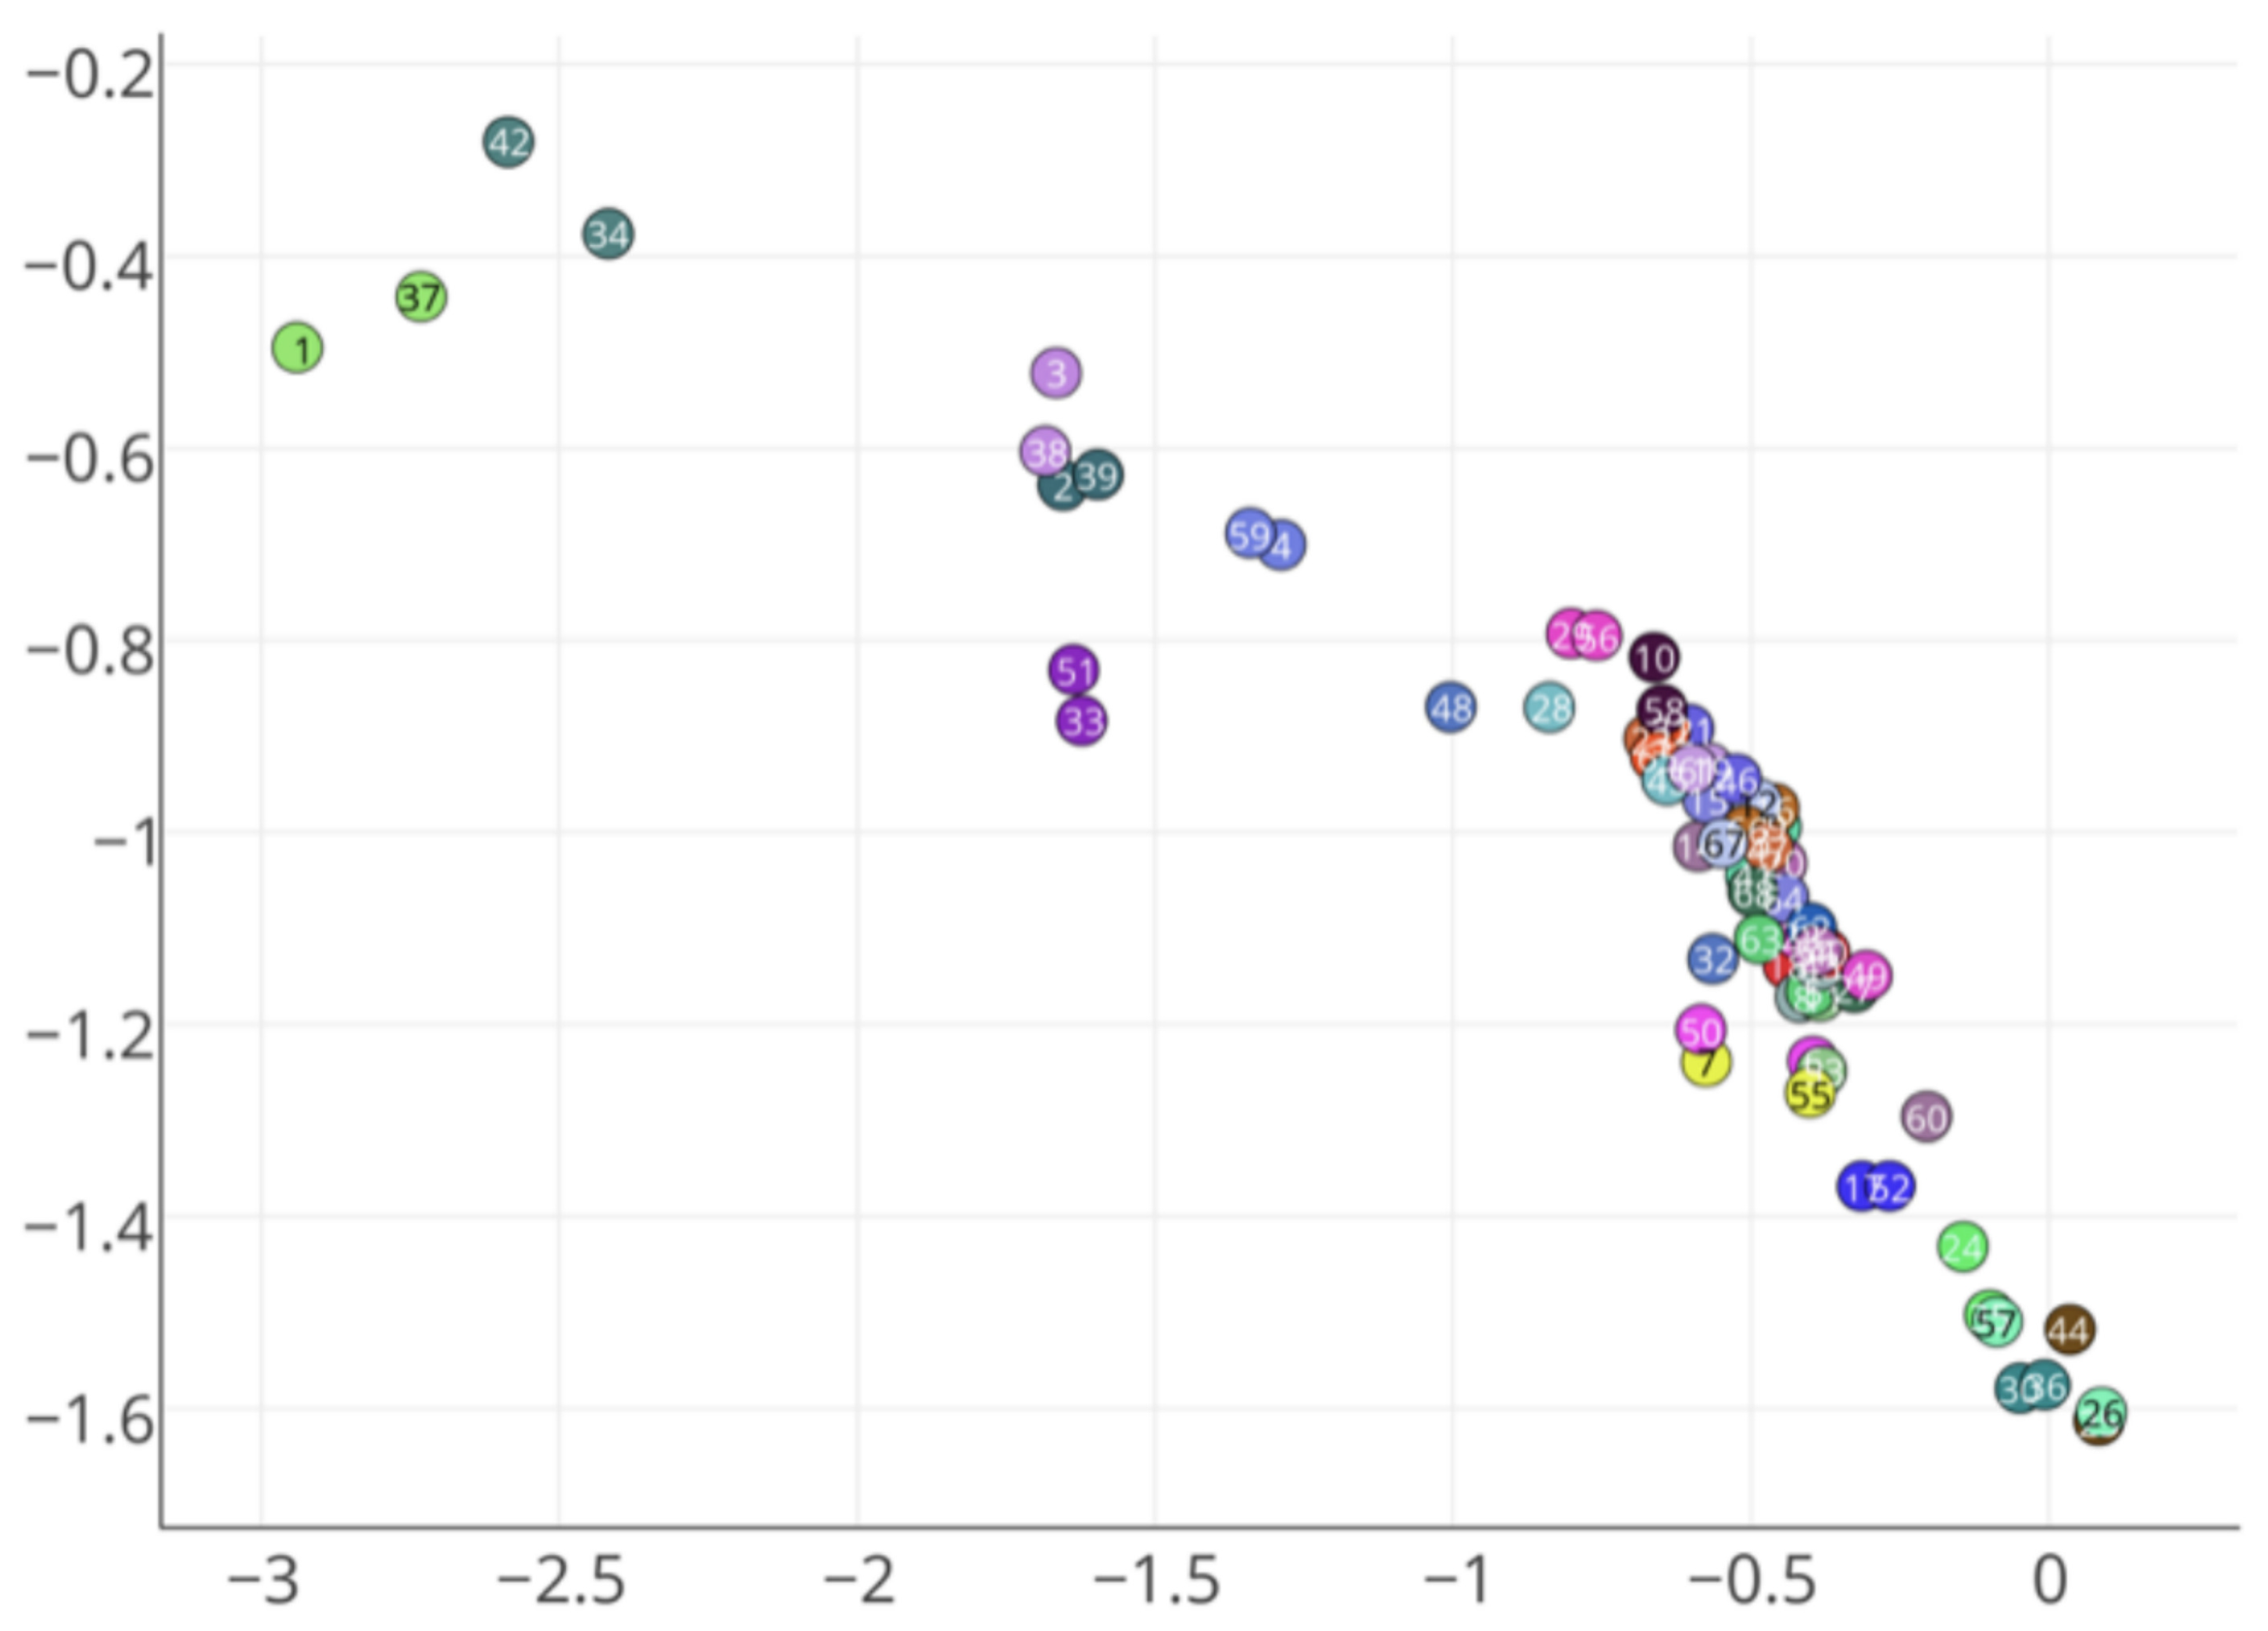
The node embedding vectors of the mirrored Karate network, generated by ffstruc2vec, are visualized in two-dimensional space in Figure 8. Additionally, Figure 9 illustrates the node representation vectors produced by the struc2vec method, as presented in Ribeiro et al. [13]. While both methods capture the structural identity of nodes, it is evident that ffstruc2vec extracts additional structural patterns compared to struc2vec.
Specifically, ffstruc2vec clearly separates the node pair (12, 67) from the rest of the nodes, whereas struc2vec places this pair within the primary node group. Similarly, node pair (17, 52) is distinctly separated by ffstruc2vec, whereas struc2vec positions it at the periphery of the primary group. Furthermore, ffstruc2vec distinctly separates the node pairs (25, 44) and (26, 57) from the rest of the network, unlike struc2vec.
A structural analysis of these nodes, identified by ffstruc2vec as structurally outstanding, is provided below for further examination.
  • Nodes 12 and 67 possess a unique structural role within Zachary’s Karate Club network, as they are the only nodes with a degree of 1.
  • Nodes 17 and 52 possess a unique role as the only outstanding nodes associated with the central club instructor nodes 1 and 37, positioned at the end of a small sub-cluster. This is evident from their assignment to these central nodes while being two hops away from them.
  • Nodes 25, 44, 26, and 57 possess a unique role as the only outstanding nodes associated with the central club administrator nodes 34 and 42. This is evident from their assignment to these central nodes while being two hops away from them.
In summary, ffstruc2vec captures a broader range of structural roles than struc2vec, which aligns with its advantages discussed in Section 6.
Furthermore, ffstruc2vec and struc2vec successfully extracted multiple structural properties from the Karate network. Both methods were able to group mirrored node pairs—i.e., nodes of the same color—such that they remain close together in the latent space. Additionally, both methods identified nodes 1 and 34, along with their corresponding mirrored nodes (37 and 42), as a separate cluster in the latent space. These nodes represent the central club instructor and the central club administrator. Moreover, ffstruc2vec and struc2vec identified nodes 2, 3, and 33, along with their mirrored counterparts (38, 39, and 51), as distinct from the rest of the network. These nodes also exhibit distinct structural identities, playing central roles within the network and possessing high node degrees.
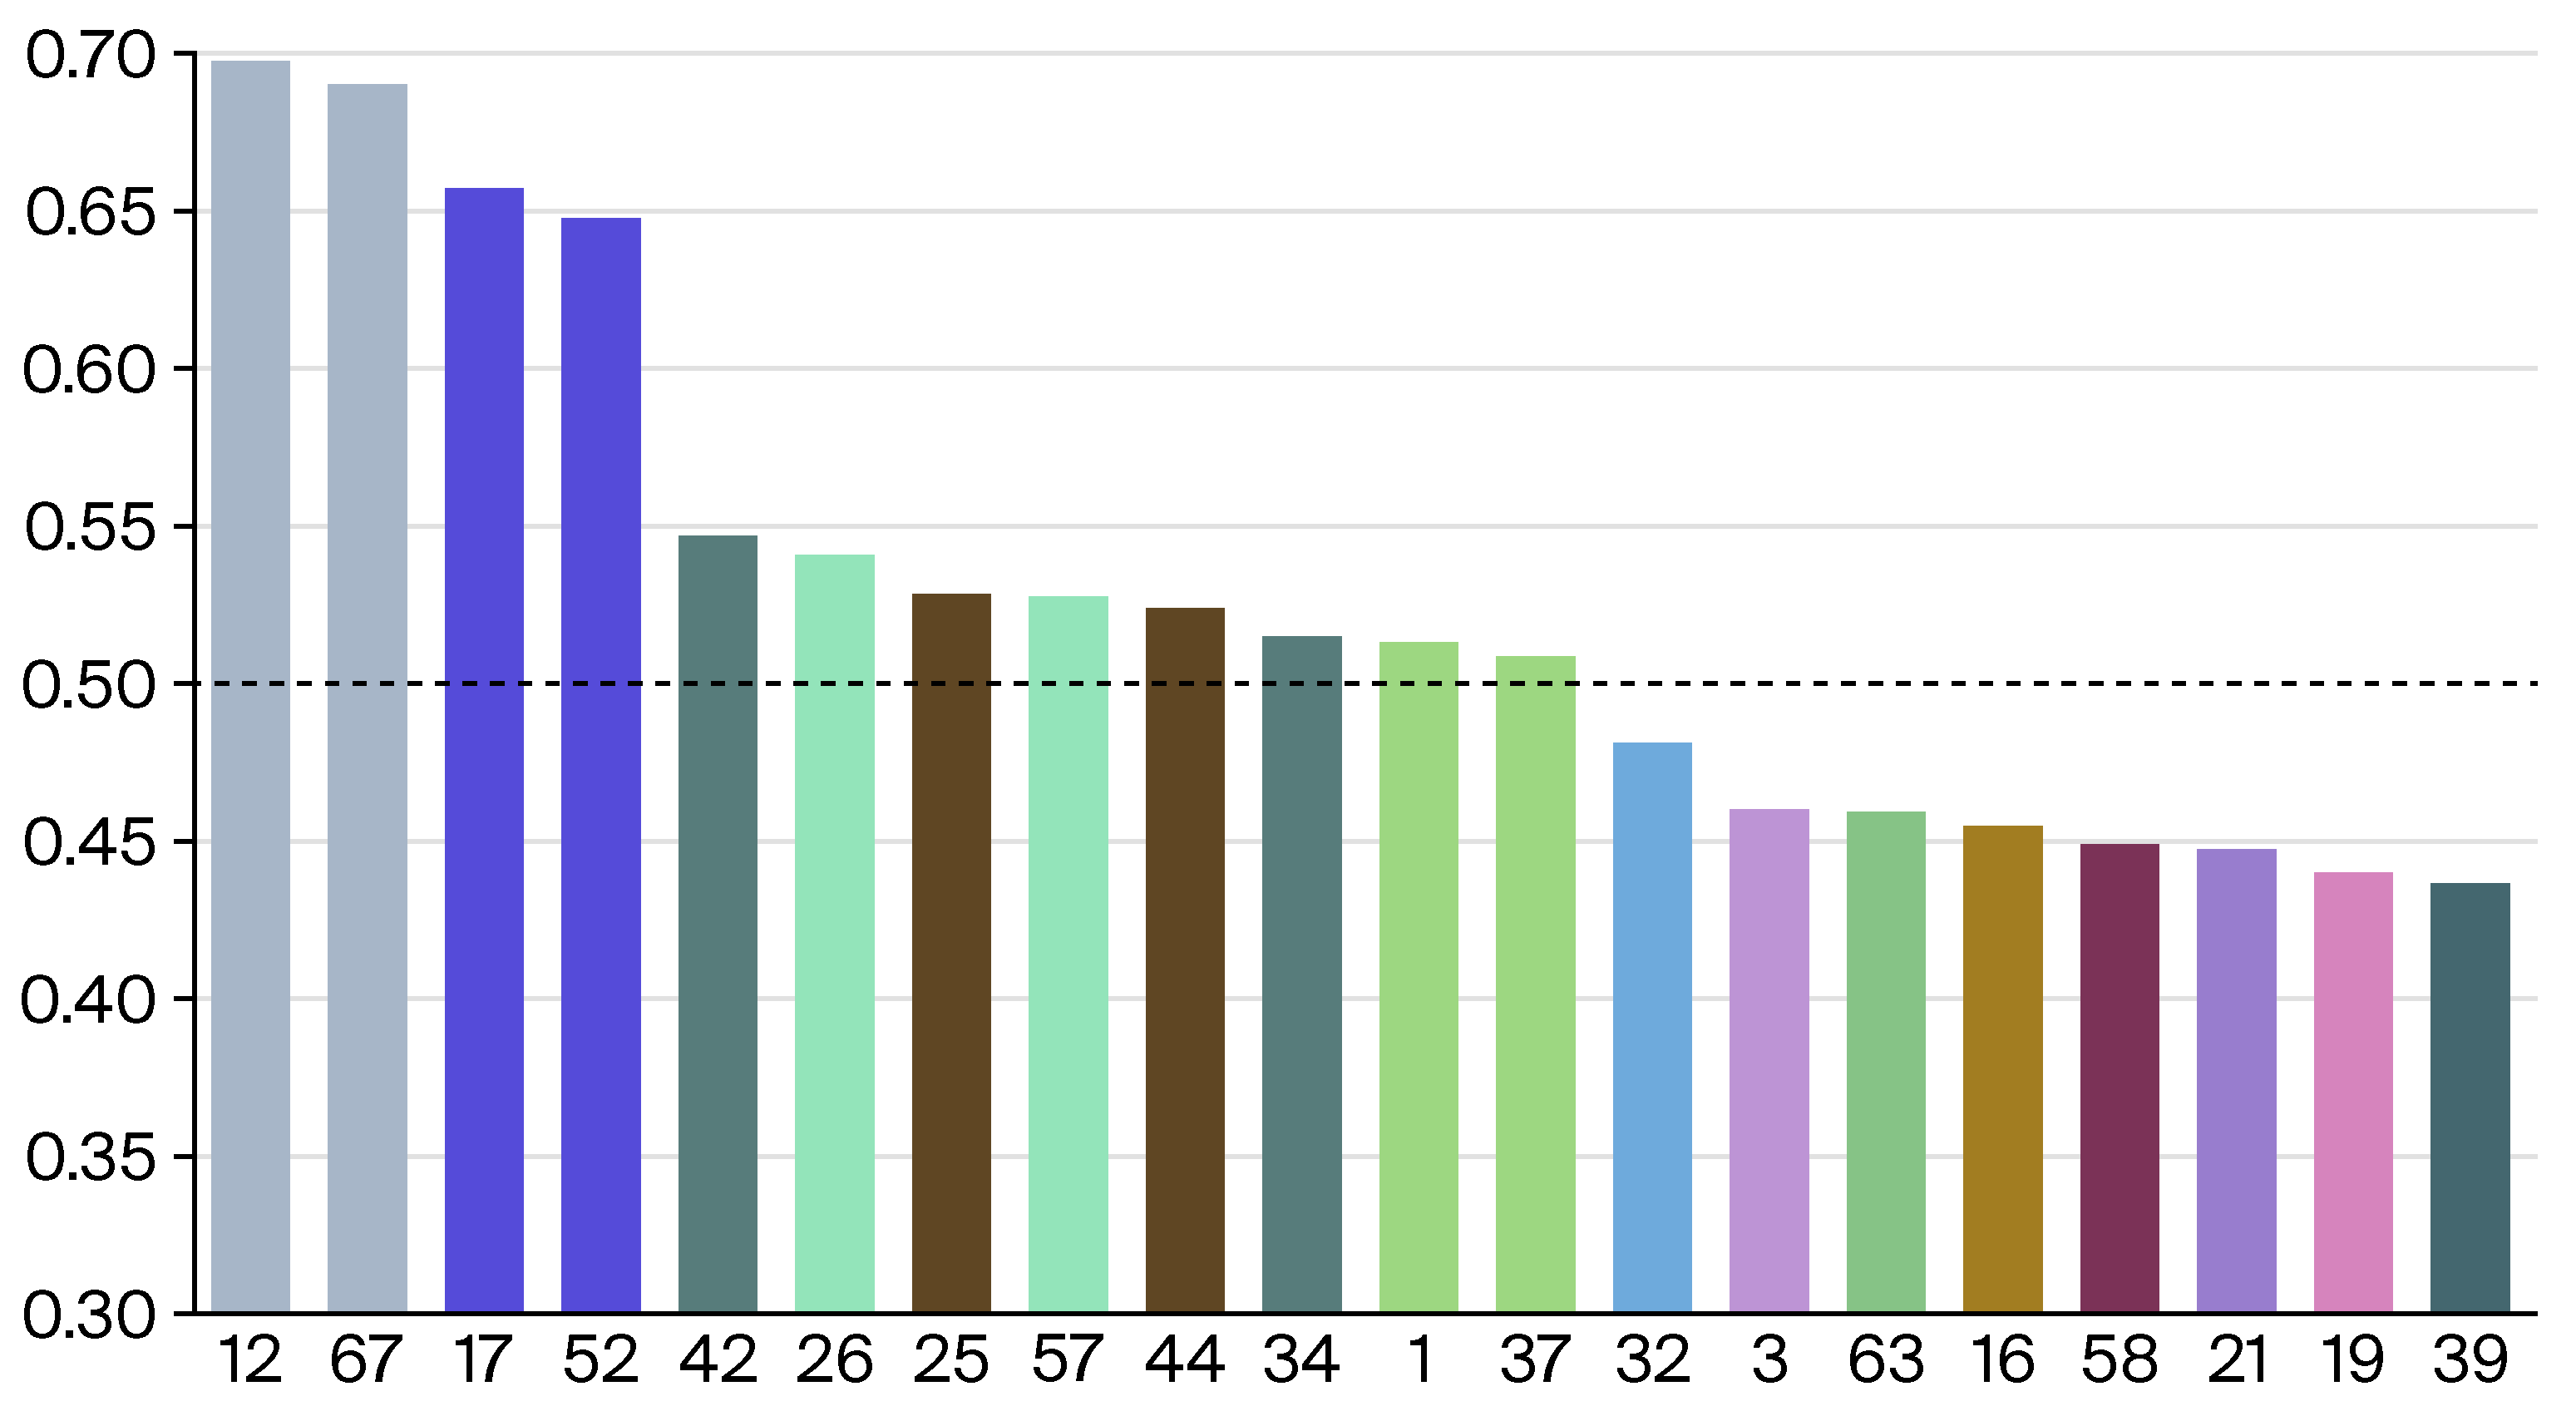
Figure 10 presents the top 20 absolute anomaly scores for the nodes obtained by applying an Isolation Forest to the ffstruc2vec representation vectors. A higher score indicates a greater likelihood that a node is an outlier with respect to its structural embedding within the graph. Notably, due to their distinct roles in the mirrored Zachary’s Karate Club network, the nodes identified as structurally outstanding in the structural analysis above exhibit anomaly scores exceeding 0.5 .
Applying a k-means clustering algorithm to the node embedding representations generated by ffstruc2vec to extract four clusters with similar structural properties results in the clusters shown in Figure 11, with each represented by a different color. It is visually evident that the clusters formed from these embeddings correspond to specific roles within the graph.
  • White nodes represent ordinary nodes that do not exhibit outstanding structural properties distinguishing them from the majority of the network.
  • Gray nodes occupy certain central roles within the network.
  • Blue and green nodes are separated from the other nodes due to the specific structural properties described above, which ffstruc2vec was able to extract more effectively than struc2vec.
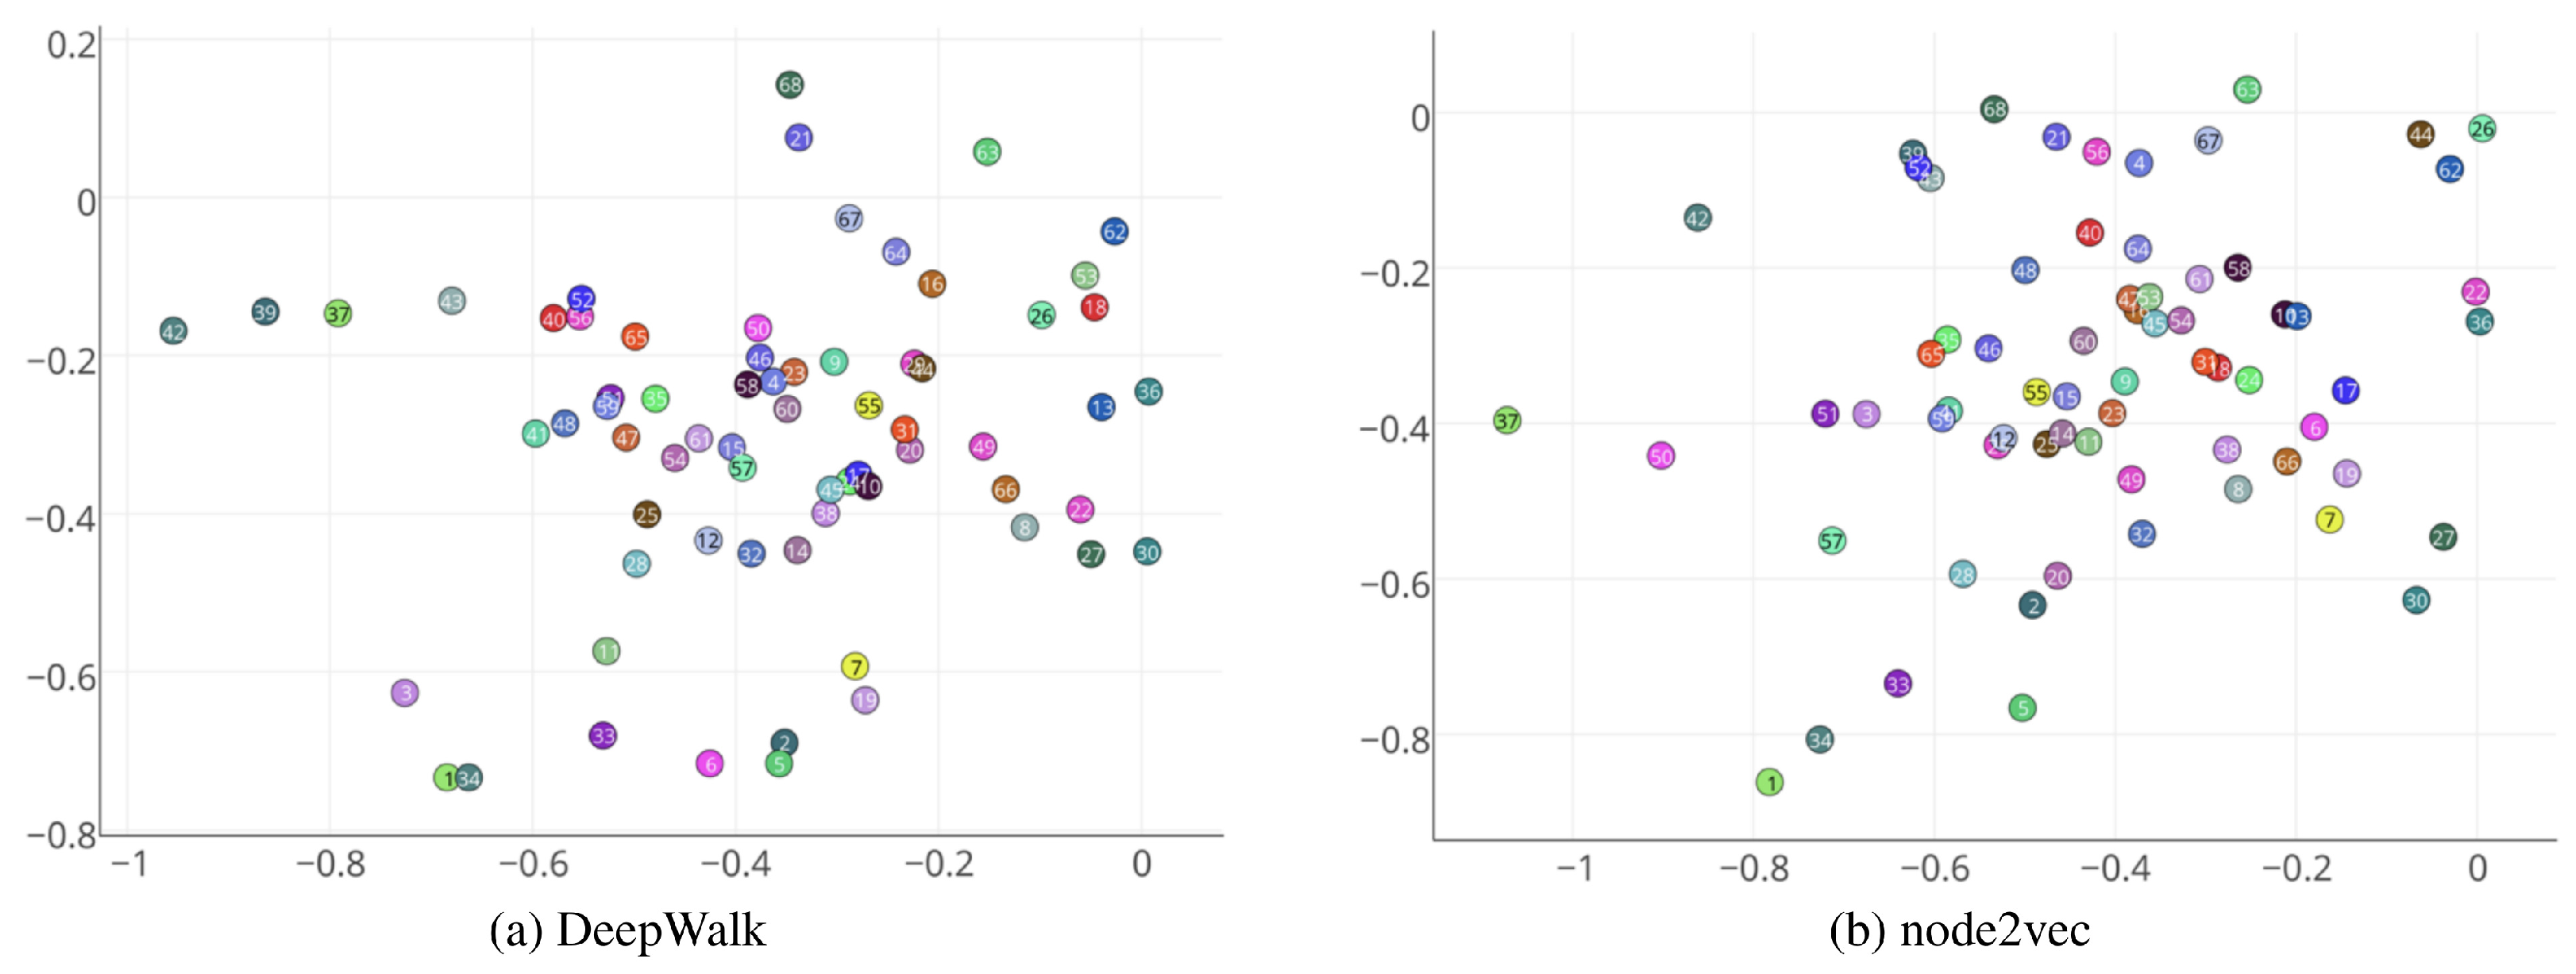
A comparison of the node embeddings generated by ffstruc2vec and struc2vec with those of DeepWalk and node2vec reveals that the embeddings from DeepWalk and node2vec fail to capture these structural patterns and do not group structurally equivalent nodes in the latent space, as shown in Figure 12a,b.

7.2. Barbell Graph

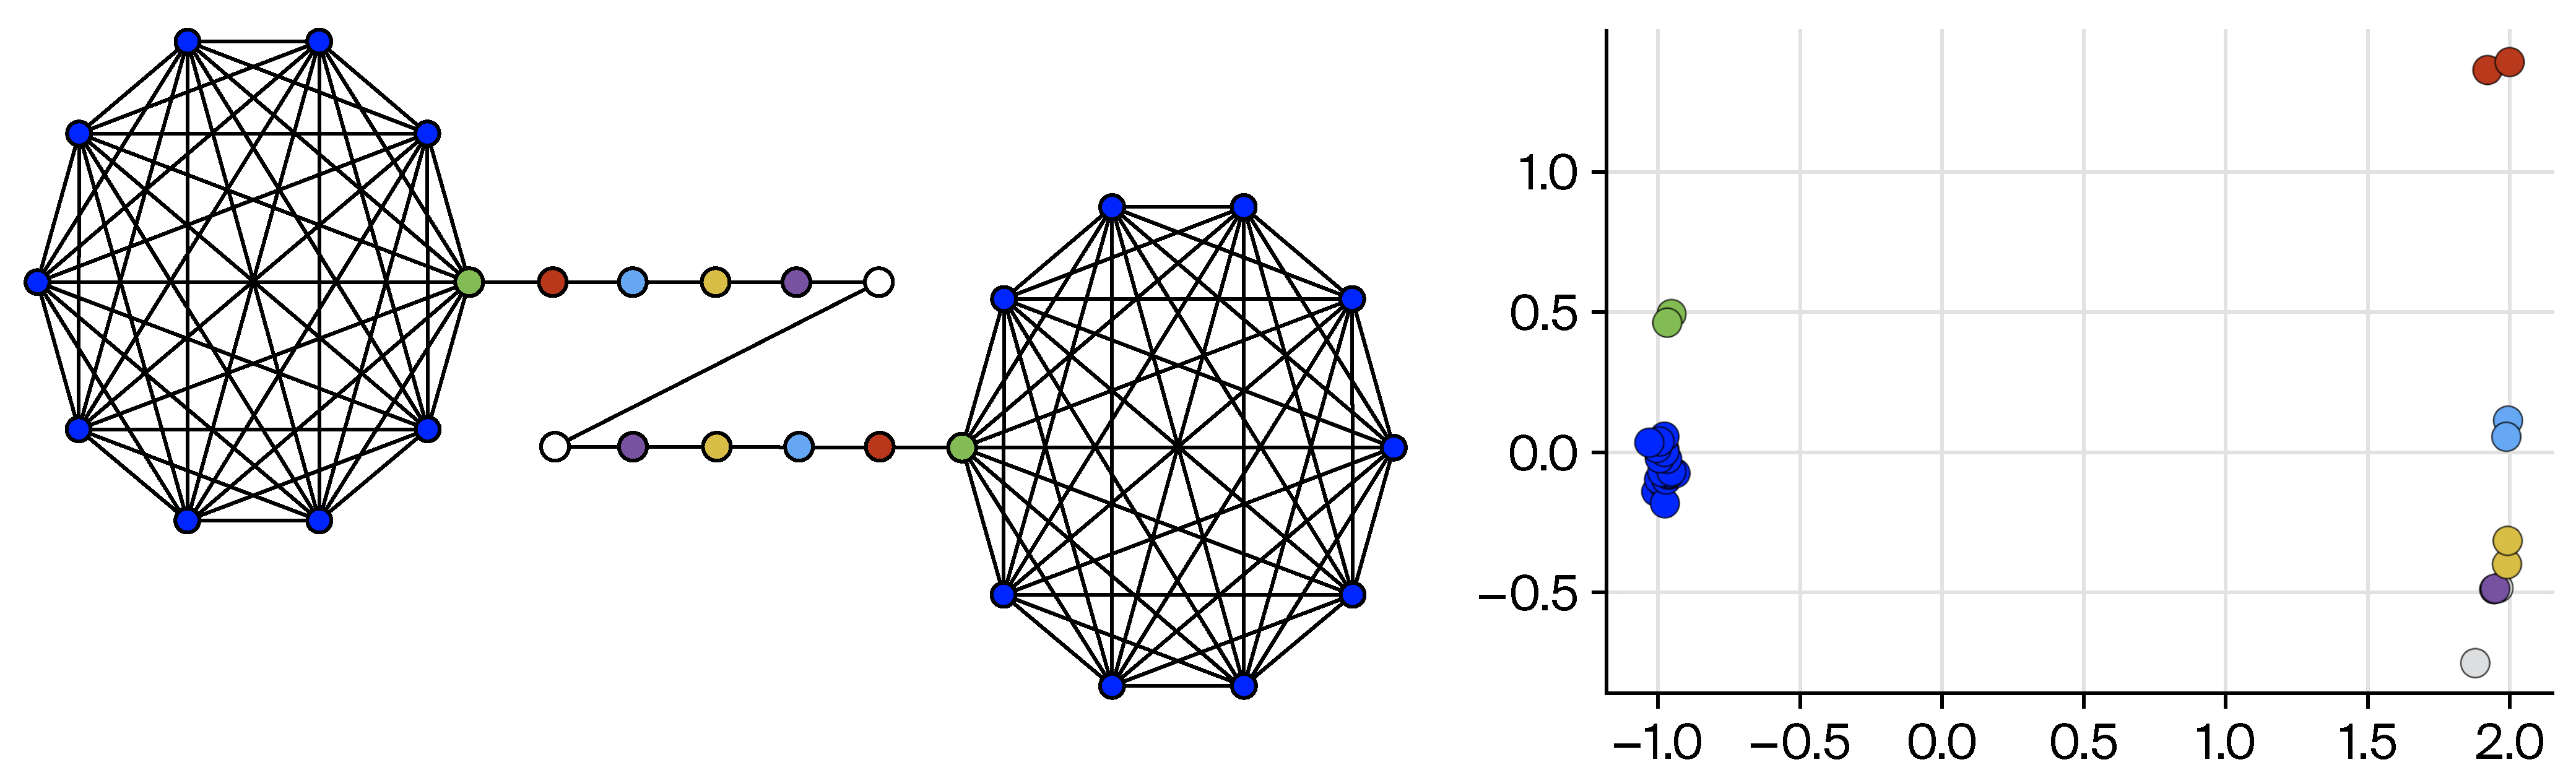
Figure 13 illustrates the application of the ffstruc2vec algorithm to a Barbell graph. Nodes with similar structural identities, as shown in the left image, are distinguished by uniform coloring. The ffstruc2vec algorithm effectively separates the embedding vectors of these nodes from the other nodes and positions nodes with similar structural identities closer to each other, as demonstrated in the right image.
The graph consists of two cliques, each comprising 10 nodes, interconnected by a path of 10 nodes. The nodes within the cliques that share identical structural identities are denoted in blue, while the nodes linking the cliques to the path are marked in green. ffstruc2vec positions the vectors of the blue nodes of the cliques closely together. In contrast, due to their additional connections to the path, the green nodes are positioned slightly apart from the blue nodes but remain relatively close, as expected.
Each node within the path has two neighbors and is colored red, blue, yellow, purple, or white, corresponding to its increasing distance from the cliques. As expected, ffstruc2vec places the nodes of the path far from the nodes of the cliques while preserving the relative order between them based on their distances to the cliques.
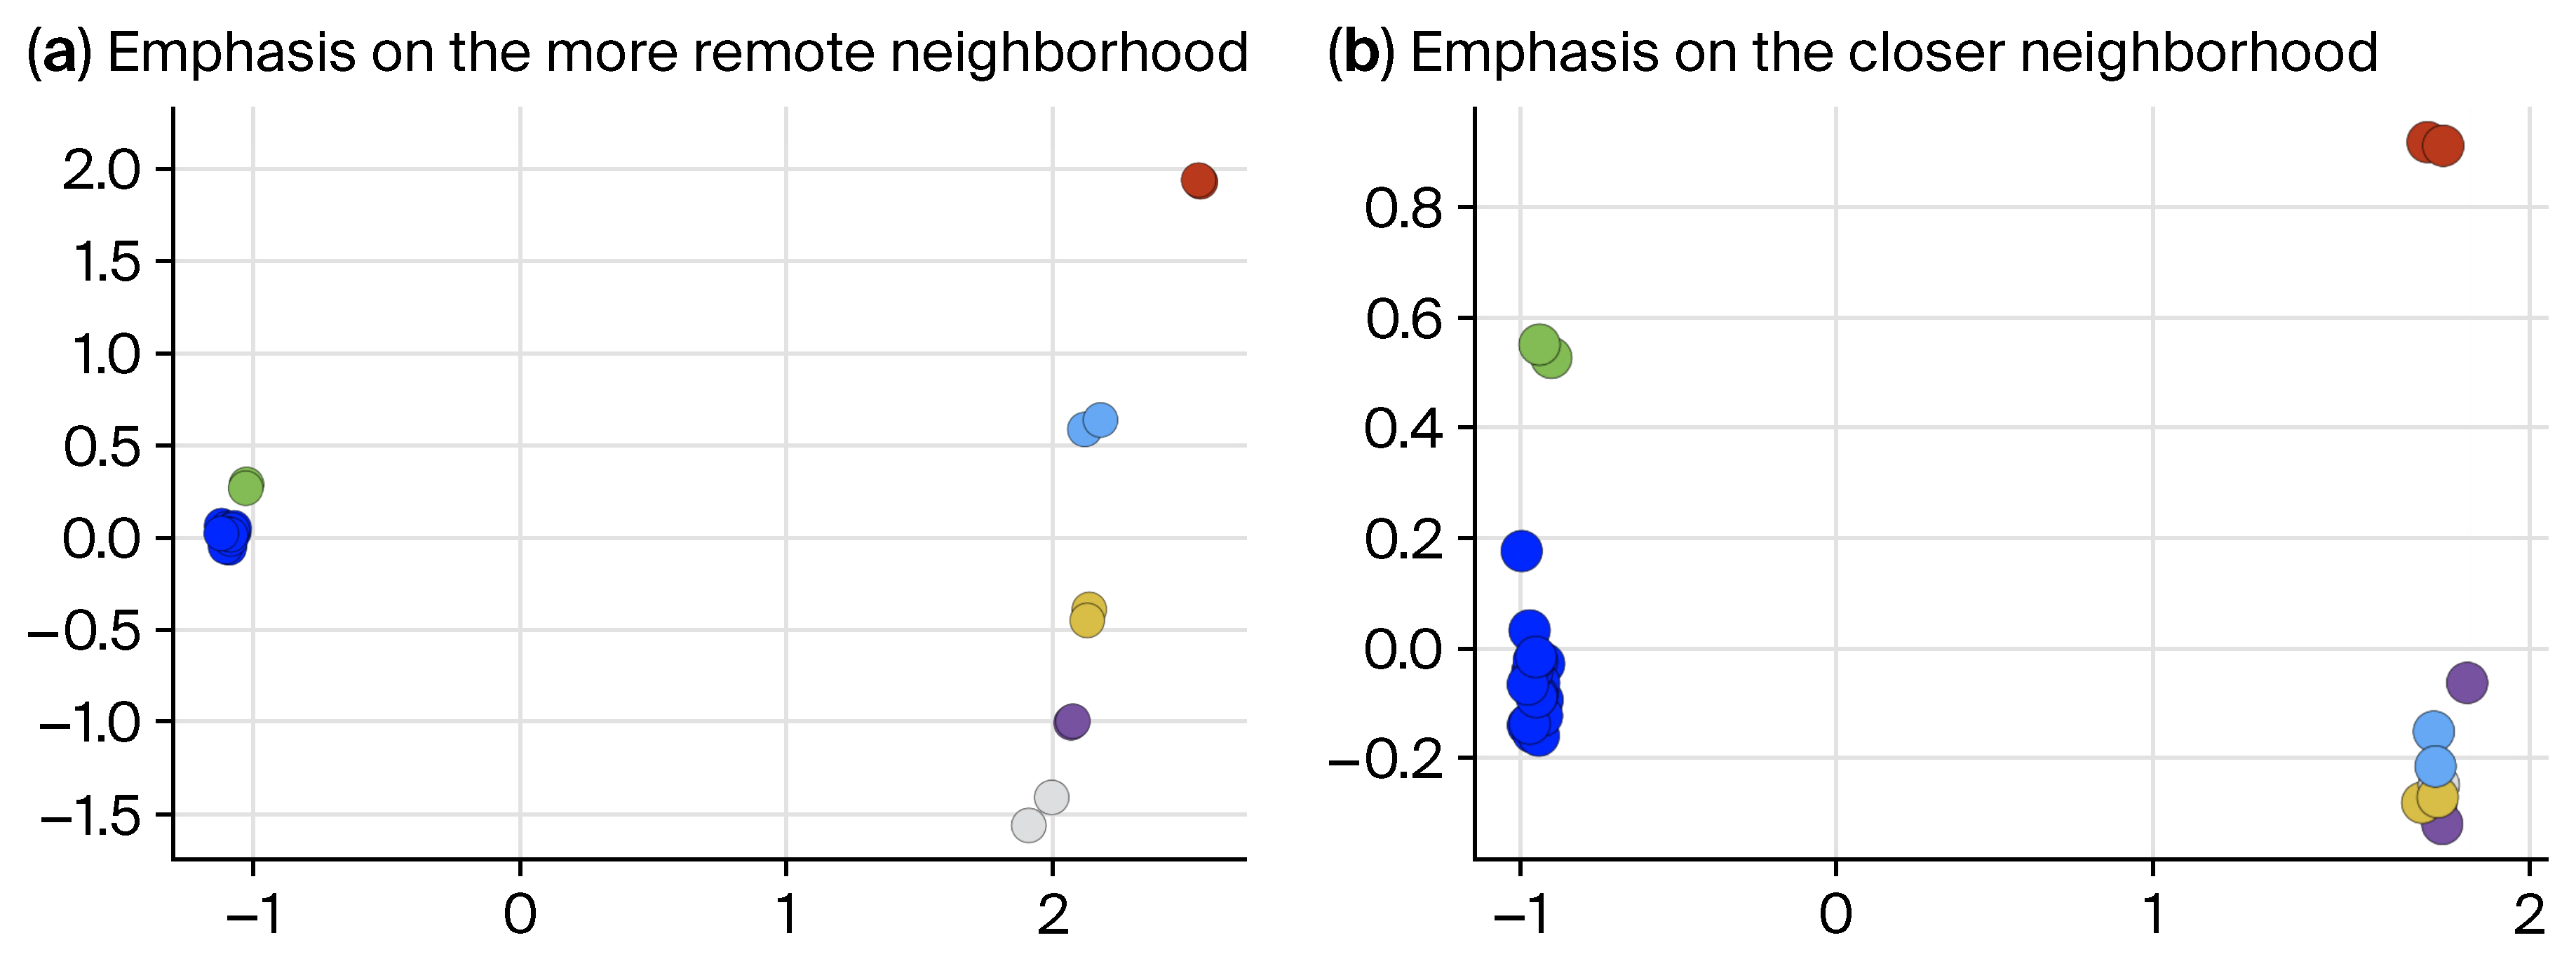
Figure 14 demonstrates ffstruc2vec’s flexibility in aligning with the demands of various downstream application tasks by emphasizing different types of structural identities. This adaptability is achieved by adjusting the weighting of k-hop neighborhood layers, which influences how structural similarities are captured in the latent space.
In Figure 14a, higher weighting is assigned to more distant k-hop neighborhood layers, leading to improved separation of nodes near the middle of the Barbell graph path, such as the blue, yellow, purple, and white nodes. This effect occurs because these nodes share a similar local neighborhood structure, meaning their distinction arises solely from the structural properties of their more distant neighborhoods. By prioritizing these higher-hop connections, ffstruc2vec enhances its ability to differentiate nodes based on structural roles beyond immediate proximity.
Conversely, in Figure 14b, higher weighting is applied to closer k-hop neighborhood layers. As a result, ffstruc2vec extracts similar structural identities for the blue, yellow, purple, and white nodes while simultaneously enabling better separation of the blue and green nodes. This shows how modifying the weighting scheme can shift the emphasis from long-range structural properties to local neighborhood similarities, highlighting ffstruc2vec’s adaptability in capturing different structural identities.
In contrast, Figure 13 applies equal weighting to the first five k-hop neighborhoods when generating node representation vectors. This uniform weighting approach fails to highlight structural nuances as effectively as the adaptive weighting strategies shown in Figure 14. The comparison highlights the advantage of flexibly adjusting neighborhood influences, enabling ffstruc2vec to extract more meaningful representations by aligning with the requirements of the corresponding downstream application task.
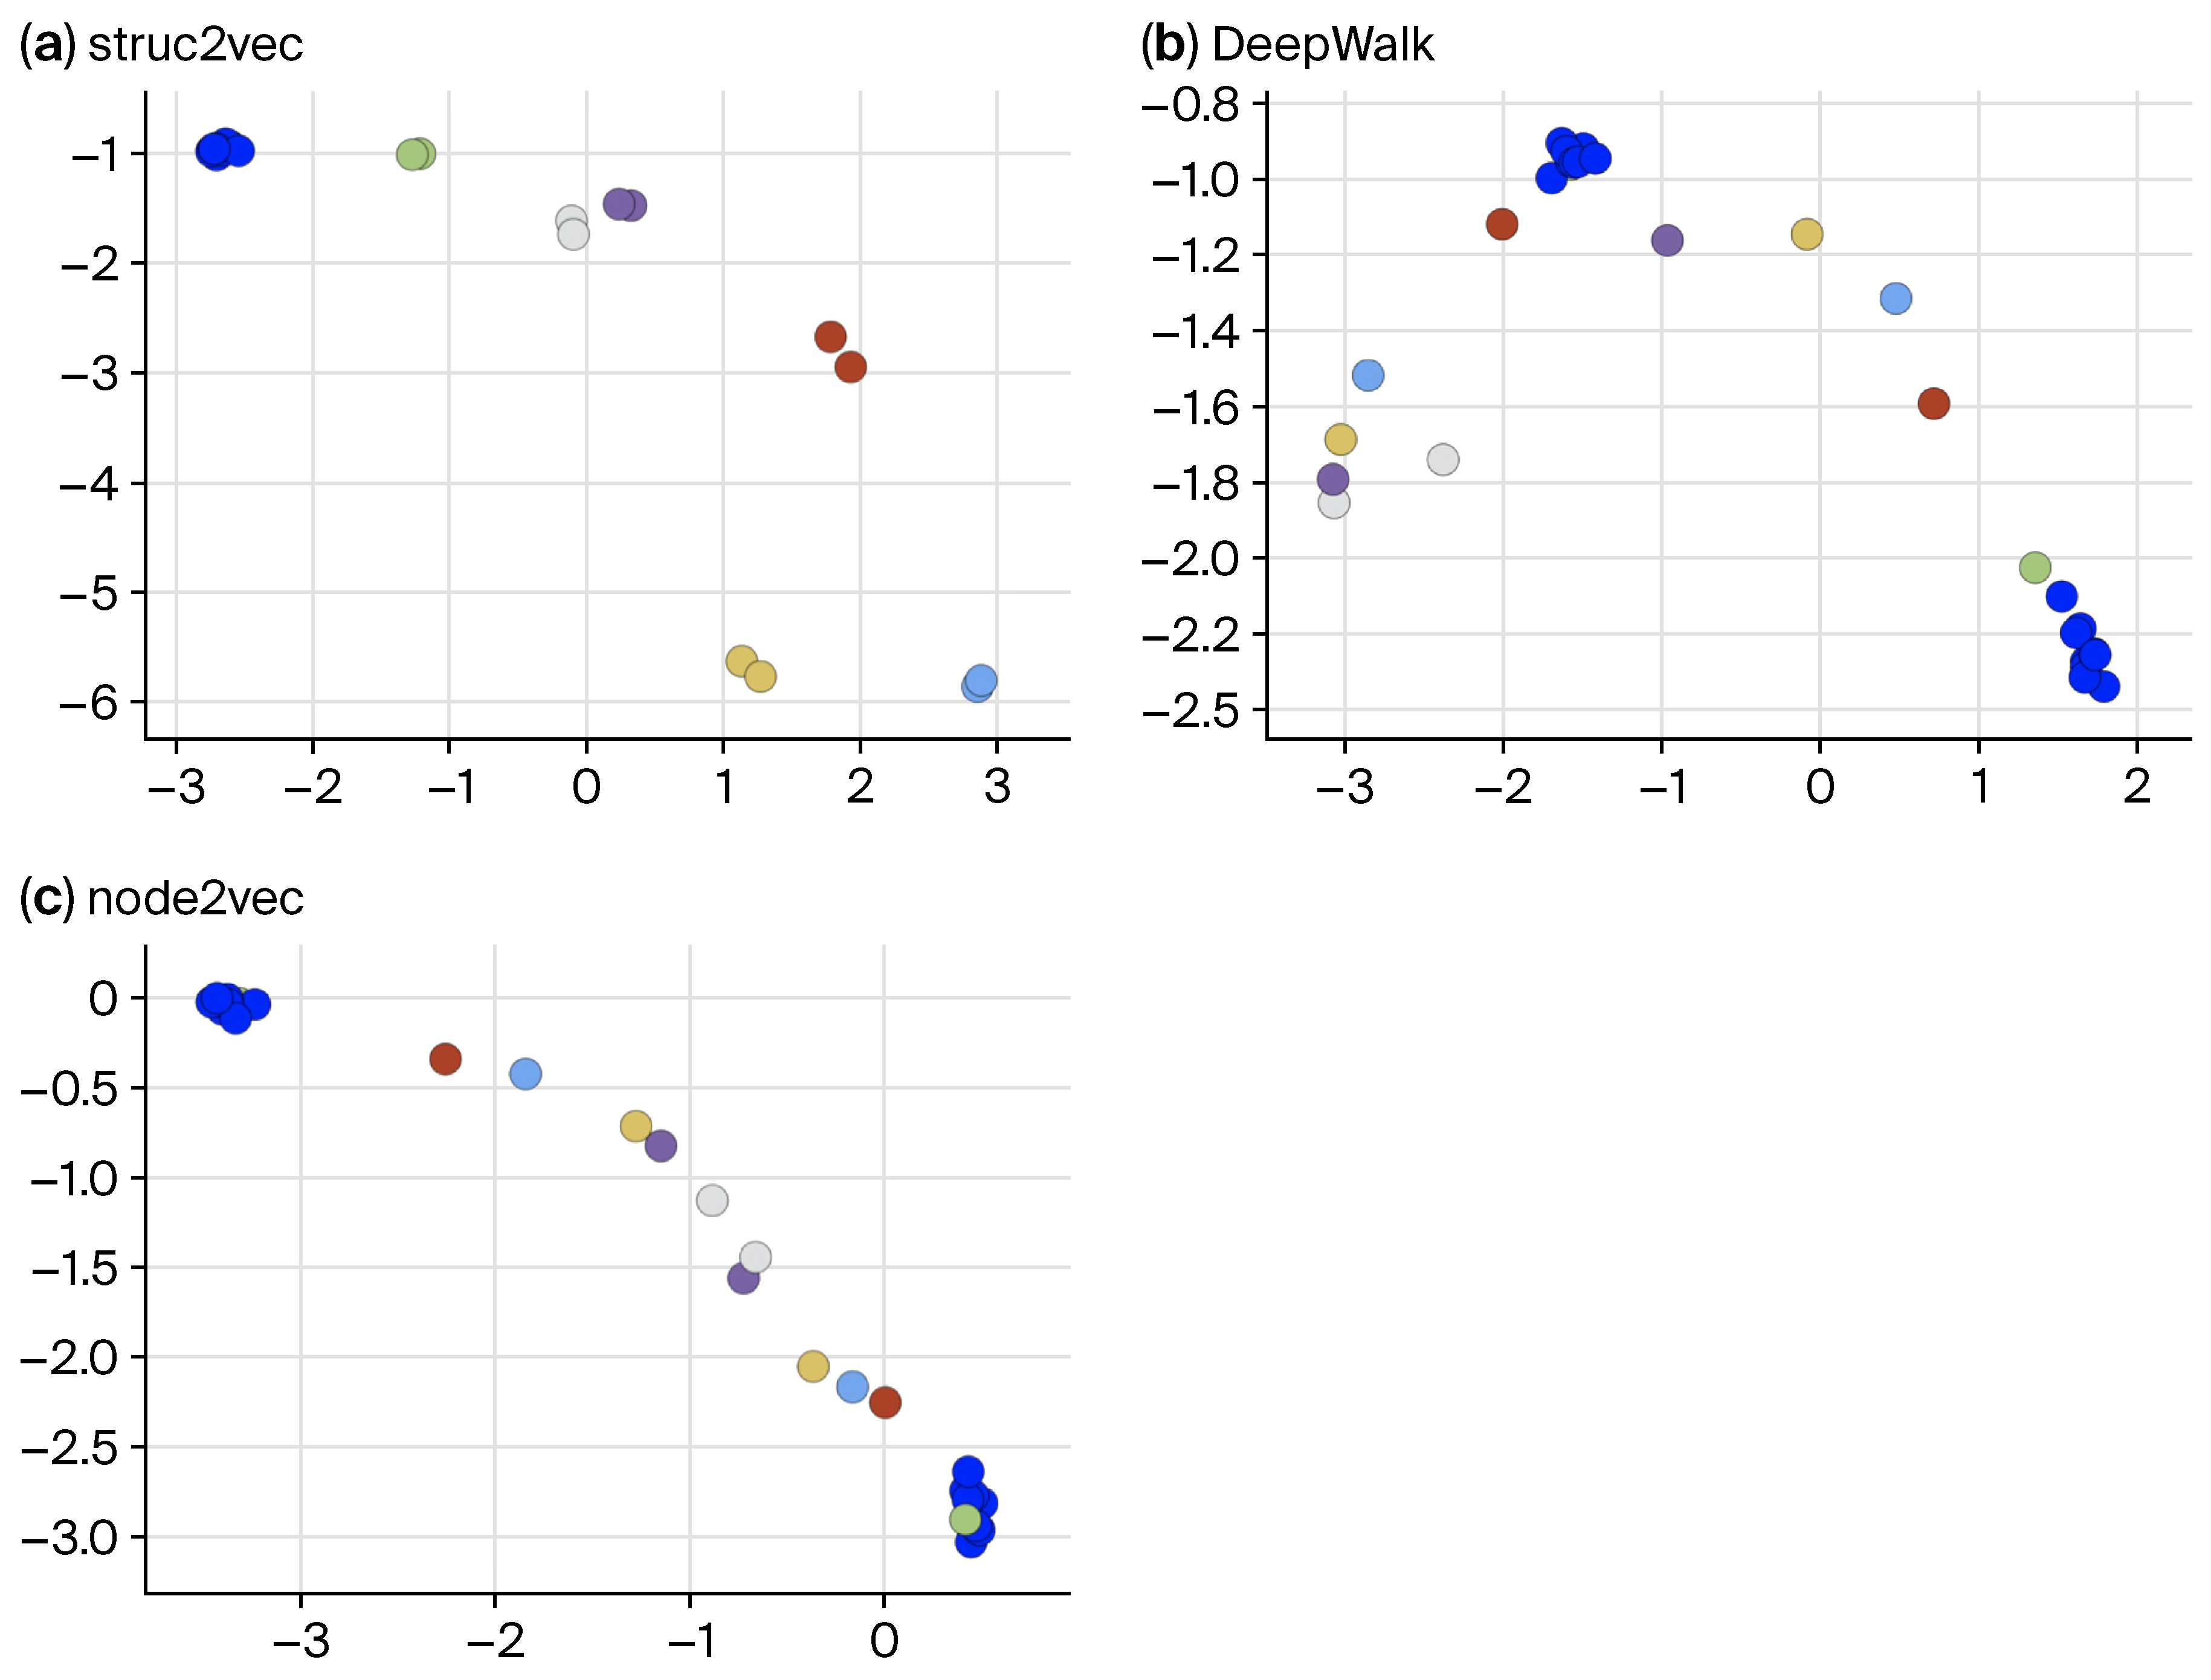
Figure 15 presents the latent representations for the nodes of the Barbell graph obtained using struc2vec, DeepWalk, and node2vec, as reported by Ribeiro et al. [13]. Struc2vec demonstrates structural preservation by grouping structurally equivalent nodes of the same color in the same vicinity in the latent space (Figure 15a). However, it falls short compared to ffstruc2vec (Figure 13), as highlighted by the following discrepancies.
  • The nodes’ structural identities in the Barbell graph’s path are distinguished only by their distance to the two cliques. While ffstruc2vec maintains the relative ordering of red to white nodes, struc2vec fails to do so consistently in the embedding space.
  • The nodes belonging to the two cliques in the Barbell graph have fundamentally different structural identities compared to the path nodes (e.g., d e g r e e 8 vs. d e g r e e = 2 ). In the embedding space, ffstruc2vec effectively separates these two groups, whereas struc2vec does not. For example, struc2vec positions the purple nodes significantly closer to the clique nodes than to the yellow nodes, even though the graph structure suggests that their structural identity is more aligned with that of the yellow nodes (see left image in Figure 13).
Section 6 provides a detailed discussion of the limitations of struc2vec in extracting structural identities compared to ffstruc2vec.
For completeness, Figure 15 also includes the embeddings generated by DeepWalk (Figure 15b) and node2vec (Figure 15c), which were used as a baseline comparison in the struc2vec paper. Both fail to preserve the structural properties of the nodes, despite varying the parameters p and q, which are designed in node2vec to control the balance between local and global exploration and can be adjusted to emphasize structural identities.

7.3. Air Traffic Network

The node representation vectors generated by ffstruc2vec can serve as input for node classification tasks, provided that the labels for nodes correspond to the type of structural identities that ffstruc2vec can preserve. To evaluate its effectiveness, particularly in comparison to struc2vec, we use three benchmark datasets introduced in the struc2vec paper by Ribeiro et al. [13]. These datasets consist of unweighted, undirected air traffic networks, where nodes represent airports and edges indicate the presence of commercial flights. Each airport is assigned one of four labels based on its activity level, measured by the number of flights or passengers. Specifically, the empirical activity distribution was divided into quartiles, with label 1 assigned to the 25 % least active airports and label 4 to the 25 % most active airports. All classes are of equal size and correspond to some type of structural role of the airport within the air traffic network. The details of the three benchmark datasets are listed in Table 2.
Although a regression algorithm might yield better results, we follow the classification approach established in the struc2vec paper to ensure better comparability between the frameworks. To generate node embeddings for each air traffic network, we applied ffstruc2vec, struc2vec, node2vec, and DeepWalk. The resulting embeddings were then used to train a supervised vector-based classification model. Instead of the grid search approach used in the struc2vec paper, we employed the Tree-structured Parzen Estimator (TPE) [51] to optimize hyperparameters, including the selection of the most suitable classification algorithm, thereby ensuring a fair benchmarking of all embedding methods. We considered node degree as the sole input feature, as it is a reasonable structural property for this task. Following the methodology of the struc2vec paper, we assessed performance using the accuracy score, given the balanced class distribution. Each experiment was repeated ten times with random training samples, using 80 % of the nodes for training. Moreover, we report the average performance across runs.
Table 3 summarizes the classification performance of the examined methods across all air traffic networks. DeepWalk yielded the lowest accuracy, as it primarily captures node proximity. For node2vec, the TPE algorithm favored larger values of p and smaller values of q, indicating a preference for structural properties over proximity. Consequently, node2vec achieved a 4 % higher average accuracy than DeepWalk by emphasizing structural features. Incorporating pure node degree as an input feature for the classification algorithms led to an additional 6.8 % improvement in accuracy compared to node2vec.
Struc2vec, which explicitly considers the structural properties of node neighborhoods, further enhanced the average accuracy by 2.8 % . The highest accuracy was achieved with ffstruc2vec, which outperformed struc2vec by 3.1 % due to its optimized flat framework and greater flexibility in capturing diverse structural identities.

8. Conclusions

In this work, we introduced ffstruc2vec, a novel node embedding framework that effectively preserves structural identities by encoding a principled integration of multiple structural properties of nodes and their neighborhoods into an auxiliary flat similarity graph. By leveraging customizable comparison functions, even complex structural attributes can be seamlessly incorporated, enhancing the expressiveness of the learned embeddings.
A key strength of ffstruc2vec lies in its flexibility and its ability to provide interpretable representations of structural patterns. Most existing node embedding frameworks only focus on specific structural patterns or lack interpretability. In contrast, ffstruc2vec can be aligned to the specific requirements of downstream applications by optimizing weights—providing insight into the impact of individual structural characteristics on the given downstream application task. Our experimental evaluations on both supervised and unsupervised tasks confirm that ffstruc2vec outperforms existing methods in capturing structural identities.
To ensure scalability, ffstruc2vec achieves a time complexity of
O ( max ( | E | , | V | · log | V | ) ) ,
for practically relevant settings, where (i) informative structural identities are predominantly captured by a node itself and its immediate neighborhood, and (ii) downstream applications rely on structural indicators and comparison functions that are efficiently computable at scale.
Limitations. While ffstruc2vec demonstrates strong performance across a variety of downstream tasks, certain limitations should be acknowledged. In particular, the framework involves trade-offs related to computational complexity when considering deeper neighborhood structures. In addition, property aggregation requires balancing expressiveness, interpretability, and scalability.
Future work. We identify two key directions:
  • Complexity analysis: For more complex structural patterns, particularly when considering neighborhood depths k 2 , the current worst-case complexity can increase to O ( max ( | E | · | V | , | V | · log | V | ) ) ; future work will explore approximations (e.g., neighborhood sampling) to reduce this cost.
  • Property aggregation: Future work will explore property aggregation strategies that balance the trade-off between representational power, flexibility, interpretability, and scalability.
Concluding remarks. By striking a balance between expressiveness, flexibility, interpretability, and scalability, ffstruc2vec establishes itself as a powerful framework for structural node embeddings.

Supplementary Materials

The following supporting information can be downloaded at: https://www.mdpi.com/article/10.3390/app16031644/s1. The Supplementary Materials are provided as a separate PDF and include Section S1 (Graph Indicators), Section S2 (Integration of Proximity and Features), Section S3 (Comparison Functions), Section S4 (Hyperparameters), Section S5 (Complexity Analysis), and Section S6 (Additional discussion of advantages over struc2vec). Additional background and methodological references relevant to these sections are cited in the Supplementary Material [55,56,57,58,59,60,61,62,63,64,65,66,67,68,69].

Author Contributions

Methodology, M.H., J.H., R.B. and G.W.F.d.B.; Software, M.H.; Writing—original draft preparation, M.H.; Writing—review and editing, J.H., R.B. and G.W.F.d.B.; Visualization, M.H.; Supervision, J.H., R.B. and G.W.F.d.B. All authors have read and agreed to the published version of the manuscript.

Funding

This research received no external funding.

Institutional Review Board Statement

Not applicable.

Informed Consent Statement

Not applicable.

Data Availability Statement

Data and source code supporting this study are publicly available at https://github.com/node-embedding/ffstruc2vec (accessed on 28 January 2026).

Acknowledgments

The authors would like to thank Mª Mercedes Carmona Martínez and Vinny Flaviana Hyunanda from Universidad Católica San Antonio de Murcia (UCAM), as well as Claudia Schmitz from FOM University of Applied Sciences, for their kind administrative support throughout the doctoral process.

Conflicts of Interest

The authors declare no conflicts of interest.

References

  1. van Belle, R.; Baesens, B.; de Weerdt, J. CATCHM: A novel network-based credit card fraud detection method using node representation learning. Decis. Support Syst. 2023, 164, 113866. [Google Scholar] [CrossRef]
  2. Saxena, A.; Fletcher, G.; Pechenizkiy, M. NodeSim: Node similarity based network embedding for diverse link prediction. EPJ Data Sci. 2022, 11, 24. [Google Scholar] [CrossRef]
  3. Dehghan, A.; Siuta, K.; Skorupka, A.; Dubey, A.; Betlen, A.; Miller, D.; Xu, W.; Kamiński, B.; Prałat, P. Detecting bots in social-networks using node and structural embeddings. J. Big Data 2023, 10, 119. [Google Scholar] [CrossRef] [PubMed]
  4. Egami, S.; Ugai, T.; Oota, M.; Matsushita, K.; Kawamura, T.; Kozaki, K.; Fukuda, K. RDF-star2Vec: RDF-star Graph Embeddings for Data Mining. IEEE Access 2023, 11, 142030–142042. [Google Scholar] [CrossRef]
  5. Liu, H.; Chen, Y.; He, P.; Zhang, C.; Wu, H.; Zhang, J. An inductive knowledge graph embedding via combination of subgraph and type information. Sci. Rep. 2023, 13, 21228. [Google Scholar] [CrossRef]
  6. Jiang, J.; Liu, L.P.; Hassoun, S. Learning graph representations of biochemical networks and its application to enzymatic link prediction. Bioinformatics 2021, 37, 793–799. [Google Scholar] [CrossRef]
  7. Pasquier, C.; Guerlais, V.; Pallez, D.; Rapetti-Mauss, R.; Soriani, O. A network embedding approach to identify active modules in biological interaction networks. Life Sci. Alliance 2023, 6, e202201550. [Google Scholar] [CrossRef]
  8. Zaki, N.; Krishnan, A.; Turaev, S.; Rustamov, Z.; Rustamov, J.; Almusalami, A.; Ayyad, F.; Regasa, T.; Iriho, B.B. Node embedding approach for accurate detection of fake reviews: A graph-based machine learning approach with explainable AI. Int. J. Data Sci. Anal. 2024, 18, 295–315. [Google Scholar] [CrossRef]
  9. Granados, O.M.; Vargas, A. The geometry of suspicious money laundering activities in financial networks. EPJ Data Sci. 2022, 11, 6. [Google Scholar] [CrossRef]
  10. Huang, S.; Lv, T.; Zhang, X.; Yang, Y.; Zheng, W.; Wen, C. Identifying node role in social network based on multiple indicators. PLoS ONE 2014, 9, e103733. [Google Scholar] [CrossRef]
  11. Mikolov, T.; Chen, K.; Corrado, G.S.; Dean, J. Efficient Estimation of Word Representations in Vector Space. In Proceedings of the International Conference on Learning Representations (ICLR) Workshops, Scottsdale, AZ, USA, 2–4 May 2013. [Google Scholar] [CrossRef]
  12. Besold, T.R.; d’Avila Garcez, A.; Bader, S.; Bowman, H.; Domingos, P.; Hitzler, P.; Kühnberger, K.U.; Lamb, L.C.; Lima, P.M.V.; de Penning, L.; et al. Neural-Symbolic Learning and Reasoning: A Survey and Interpretation. In Neuro-Symbolic Artificial Intelligence: The State of the Art; d’Avila Garcez, A., Lamb, L.C., Eds.; IOS Press: Amsterdam, The Netherlands, 2021; Volume 342, pp. 1–38. [Google Scholar] [CrossRef]
  13. Ribeiro, L.F.; Saverese, P.H.; Figueiredo, D.R. struc2vec. In Proceedings of the 23rd ACM SIGKDD International Conference on Knowledge Discovery and Data Mining, Halifax, NS, Canada, 13–17 August 2017; pp. 385–394. [Google Scholar] [CrossRef]
  14. Perozzi, B.; Al-Rfou, R.; Skiena, S. DeepWalk. In Proceedings of the 20th ACM SIGKDD International Conference on Knowledge Discovery and Data Mining, New York, NY, USA, 24–27 August 2014; pp. 701–710. [Google Scholar] [CrossRef]
  15. Grover, A.; Leskovec, J. node2vec: Scalable Feature Learning for Networks. In Proceedings of the ACM SIGKDD International Conference on Knowledge Discovery and Data Mining, San Francisco, CA, USA, 13–17 August 2016; pp. 855–864. [Google Scholar] [CrossRef]
  16. Tang, J.; Qu, M.; Wang, M.; Zhang, M.; Yan, J.; Mei, Q. LINE: Large-scale Information Network Embedding. In Proceedings of the 24th International Conference on World Wide Web, Florence, Italy, 18–22 May 2015; pp. 1067–1077. [Google Scholar] [CrossRef]
  17. Hamilton, W.L.; Ying, R.; Leskovec, J. Inductive Representation Learning on Large Graphs. In Proceedings of the 31st International Conference on Neural Information Processing Systems, Long Beach, CA, USA, 4–9 December 2017; Curran Associates Inc.: Red Hook, NY, USA, 2017; pp. 1025–1035. [Google Scholar]
  18. Qiu, J.; Dong, Y.; Ma, H.; Li, J.; Wang, K.; Tang, J. Network Embedding as Matrix Factorization. In Proceedings of the Eleventh ACM International Conference on Web Search and Data Mining, Marina Del Rey, CA, USA, 5–9 February 2018; pp. 459–467. [Google Scholar] [CrossRef]
  19. Lotfalizadeh, H.; Hasan, M.A. Force-directed graph embedding with hops distance. In Proceedings of the 2023 IEEE International Conference on Big Data (BigData), Sorrento, Italy, 15–18 December 2023; pp. 2946–2953. [Google Scholar] [CrossRef]
  20. Kutzkov, K. LoNe Sampler: Graph Node Embeddings by Coordinated Local Neighborhood Sampling. In Proceedings of the AAAI Conference on Artificial Intelligence, Washington, DC, USA, 7–14 February 2023; pp. 8413–8420. [Google Scholar] [CrossRef]
  21. Yin, H.; Zhang, M.; Wang, J.; Li, P. SUREL+: Moving from Walks to Sets for Scalable Subgraph-Based Graph Representation Learning. Proc. VLDB Endow. 2023, 16, 2939–2948. [Google Scholar] [CrossRef]
  22. Pei, Y.; Du, X.; Zhang, J.; Fletcher, G.; Pechenizkiy, M. struc2gauss: Structural role preserving network embedding via Gaussian embedding. Data Min. Knowl. Discov. 2020, 34, 1072–1103. [Google Scholar] [CrossRef]
  23. Nguyen, D.Q.; Nguyen, T.D.; Phung, D. A Self-attention Network Based Node Embedding Model. In Machine Learning and Knowledge Discovery in Databases; Hutter, F., Kersting, K., Lijffijt, J., Valera, I., Eds.; Lecture Notes in Computer Science; Springer: Cham, Switzerland, 2021; Volume 12459, pp. 364–377. [Google Scholar] [CrossRef]
  24. Li, S.; Zaidi, N.A.; Du, M.; Zhou, Z.; Zhang, H.; Li, G. Property graph representation learning for node classification. Knowl. Inf. Syst. 2024, 66, 237–265. [Google Scholar] [CrossRef]
  25. Nikolentzos, G.; Vazirgiannis, M. Learning Structural Node Representations using Graph Kernels. IEEE Trans. Knowl. Data Eng. 2019, 33, 2045–2056. [Google Scholar] [CrossRef]
  26. Tu, K.; Cui, P.; Wang, X.; Yu, P.S.; Zhu, W. Deep Recursive Network Embedding with Regular Equivalence. In Proceedings of the 24th ACM SIGKDD International Conference on Knowledge Discovery & Data Mining, London, UK, 19–23 August 2018; pp. 2357–2366. [Google Scholar] [CrossRef]
  27. Henderson, K.; Gallagher, B.; Eliassi-Rad, T.; Tong, H.; Basu, S.; Akoglu, L.; Koutra, D.; Faloutsos, C.; Li, L. RolX. In Proceedings of the 18th ACM SIGKDD International Conference on Knowledge Discovery and Data Mining (KDD ’12), Beijing, China, 12–16 August 2012; pp. 1231–1239. [Google Scholar] [CrossRef]
  28. Jin, D.; Rossi, R.A.; Koutra, D.; Koh, E.; Kim, S.; Rao, A. Latent Network Summarization: Bridging Network Embedding and Summarization. In Proceedings of the 25th ACM SIGKDD International Conference on Knowledge Discovery & Data Mining, Anchorage, AK, USA, 4–8 August 2019; pp. 1004–1014. [Google Scholar] [CrossRef]
  29. Ouyang, M.; Zhang, Y.; Xia, X.; Xu, X. GraRep++: Flexible Learning Graph Representations with Weighted Global Structural Information. IEEE Access 2023, 11, 98217–98229. [Google Scholar] [CrossRef]
  30. Donnat, C.; Zitnik, M.; Hallac, D.; Leskovec, J. Learning Structural Node Embeddings via Diffusion Wavelets. In Proceedings of the KDD ’18: 24th ACM SIGKDD International Conference on Knowledge Discovery & Data Mining, London, UK, 19–23 August 2018; pp. 1320–1329. [Google Scholar] [CrossRef]
  31. Böhm, J.N. Node Embeddings via Neighbor Embeddings. arXiv 2025. [Google Scholar] [CrossRef]
  32. Veličković, P.; Fedus, W.; Hamilton, W.L.; Liò, P.; Bengio, Y.; Hjelm, R.D. Deep Graph Infomax. In Proceedings of the 7th International Conference on Learning Representations (ICLR), New Orleans, LA, USA, 6–9 May 2019. [Google Scholar]
  33. Zhang, T.; Ren, Y.; Feng, W.; Du, W.; Zhang, X. CGCL: Collaborative Graph Contrastive Learning Without Handcrafted Graph Data Augmentations. In Proceedings of the 28th International Conference on Database Systems for Advanced Applications (DASFAA 2024), Gifu, Japan, 2–5 July 2024; Lecture Notes in Computer Science; Springer: Singapore, 2024; Volume 14855, pp. 418–428. [Google Scholar] [CrossRef]
  34. Shao, P.; Tao, J. Multi-level graph contrastive learning. Neurocomputing 2024, 570, 127101. [Google Scholar] [CrossRef]
  35. Yang, H.; Wang, Y.; Zhao, X.; Chen, H.; Yin, H.; Li, Q.; Xu, G. Multi-Level Graph Knowledge Contrastive Learning. IEEE Trans. Knowl. Data Eng. 2024, 36, 8829–8841. [Google Scholar] [CrossRef]
  36. Ahmed, N.K.; Rossi, R.A.; Lee, J.B.; Willke, T.L.; Zhou, R.; Kong, X.; Eldardiry, H. Role-Based Graph Embeddings. IEEE Trans. Knowl. Data Eng. 2022, 34, 2401–2415. [Google Scholar] [CrossRef]
  37. Ivanov, S.; Burnaev, E. Anonymous Walk Embeddings. In Proceedings of the 35th International Conference on Machine Learning, Stockholm, Sweden, 10–15 July 2018; Volume 80, pp. 2186–2195. [Google Scholar]
  38. Qiu, Y.; Zhou, Q. Role-oriented network embedding via anonymous walks. J. Intell. Fuzzy Syst. 2022, 44, 2729–2739. [Google Scholar] [CrossRef]
  39. Yan, Y.; Hu, Y.; Zhou, Q.; Wu, S.; Wang, D.; Tong, H. Topological Anonymous Walk Embedding: A New Structural Node Embedding Approach. In Proceedings of the 33rd ACM International Conference on Information and Knowledge Management, Boise, ID, USA, 21–25 October 2024; pp. 2796–2806. [Google Scholar] [CrossRef]
  40. Lyu, T.; Zhang, Y.; Zhang, Y. Enhancing the Network Embedding Quality with Structural Similarity. In Proceedings of the 2017 ACM on Conference on Information and Knowledge Management, Singapore, 6–10 November 2017; Lim, E.P., Winslett, M., Sanderson, M., Fu, A., Sun, J., Culpepper, S., Lo, E., Ho, J., Donato, D., Agrawal, R., et al., Eds.; Association for Computing Machinery: New York, NY, USA, 2017; pp. 147–156. [Google Scholar] [CrossRef]
  41. Dutta, A.; Sahbi, H. Stochastic Graphlet Embedding. IEEE Trans. Neural Netw. Learn. Syst. 2019, 30, 2369–2382. [Google Scholar] [CrossRef]
  42. Tu, K.; Li, J.; Towsley, D.; Braines, D.; Turner, L.D. gl2vec: Learning feature representation using graphlets for directed networks. In Proceedings of the IEEE/ACM International Conference on Advances in Social Networks Analysis and Mining, Vancouver, BC, Canada, 27–30 August 2020; pp. 216–221. [Google Scholar] [CrossRef]
  43. Luo, J.; Xiao, S.; Jiang, S.; Gao, H.; Xiao, Y. ripple2vec: Node Embedding with Ripple Distance of Structures. Data Sci. Eng. 2022, 7, 156–174. [Google Scholar] [CrossRef]
  44. Cai, H.; Zheng, V.W.; Chang, K.C.C. A Comprehensive Survey of Graph Embedding: Problems, Techniques, and Applications. IEEE Trans. Knowl. Data Eng. 2018, 30, 1616–1637. [Google Scholar] [CrossRef]
  45. Jin, J.; Heimann, M.; Jin, D.; Koutra, D. Toward Understanding and Evaluating Structural Node Embeddings. ACM Trans. Knowl. Discov. Data 2022, 16, 58. [Google Scholar] [CrossRef]
  46. Khoshraftar, S.; An, A. A Survey on Graph Representation Learning Methods. ACM Trans. Intell. Syst. Technol. 2024, 15, 19. [Google Scholar] [CrossRef]
  47. Jin, Y.; Song, G.; Shi, C. GraLSP: Graph Neural Networks with Local Structural Patterns. Proc. AAAI Conf. Artif. Intell. 2020, 34, 4361–4368. [Google Scholar] [CrossRef]
  48. Przulj, N.; Corneil, D.G.; Jurisica, I. Modeling interactome: Scale-free or geometric? Bioinformatics 2004, 20, 3508–3515. [Google Scholar] [CrossRef]
  49. Przulj, N. Biological network comparison using graphlet degree distribution. Bioinformatics 2007, 23, e177–e183. [Google Scholar] [CrossRef]
  50. Backstrom, L.; Boldi, P.; Rosa, M.; Ugander, J.; Vigna, S. Four degrees of separation. In Proceedings of the 4th Annual ACM Web Science Conference, Evanston, IL, USA, 22–24 June 2012; pp. 33–42. [Google Scholar] [CrossRef]
  51. Bergstra, J.; Bardenet, R.; Bengio, Y.; Kégl, B. Algorithms for Hyper-Parameter Optimization. In Proceedings of the Advances in Neural Information Processing Systems, Granada, Spain, 12–14 December 2011; pp. 2546–2554. [Google Scholar]
  52. Atzmueller, M.; Fürnkranz, J.; Kliegr, T.; Schmid, U. Explainable and interpretable machine learning and data mining. Data Min. Knowl. Discov. 2024, 38, 2571–2595. [Google Scholar] [CrossRef]
  53. Schwalbe, G.; Finzel, B. A comprehensive taxonomy for explainable artificial intelligence: A systematic survey of surveys on methods and concepts. Data Min. Knowl. Discov. 2024, 38, 3043–3101. [Google Scholar] [CrossRef]
  54. Zachary, W.W. An Information Flow Model for Conflict and Fission in Small Groups. J. Anthropol. Res. 1977, 33, 452–473. [Google Scholar] [CrossRef]
  55. Brin, S.; Page, L. The anatomy of a large-scale hypertextual Web search engine. Comput. Networks Isdn Syst. 1998, 30, 107–117. [Google Scholar] [CrossRef]
  56. Milenkoviæ, T.; Pržulj, N. Uncovering Biological Network Function via Graphlet Degree Signatures. Cancer Inform. 2008, 6, 257–273. [Google Scholar] [CrossRef]
  57. Micali, S.; Zhu, Z.A. Reconstructing Markov processes from independent and anonymous experiments. Discret. Appl. Math. 2016, 200, 108–122. [Google Scholar] [CrossRef]
  58. Yang, B.; Liu, D.; Liu, J. Discovering Communities from Social Networks: Methodologies and Applications. In Handbook of Social Network Technologies and Applications; Furht, B., Ed.; Springer: Berlin/Heidelberg, Germany, 2010; pp. 331–346. [Google Scholar] [CrossRef]
  59. Fortunato, S.; Hric, D. Community Detection in Networks: A User Guide. Phys. Rep. 2016, 659, 1–44. [Google Scholar] [CrossRef]
  60. Khan, B.S.; Niazi, M.A. Network Community Detection: A Review and Visual Survey. arXiv 2017, arXiv:1708.00977. [Google Scholar] [CrossRef]
  61. Fang, Y.; Huang, X.; Qin, L.; Zhang, Y.; Zhang, W.; Cheng, R.; Lin, X. A survey of community search over big graphs. VLDB J. 2020, 29, 353–392. [Google Scholar] [CrossRef]
  62. Rakthanmanon, T.; Campana, B.; Mueen, A.; Batista, G.; Westover, B.; Zhu, Q.; Zakaria, J.; Keogh, E. Addressing Big Data Time Series. ACM Trans. Knowl. Discov. Data 2013, 7, 10. [Google Scholar] [CrossRef]
  63. Katz, L. A New Status Index Derived from Sociometric Analysis. Psychometrika 1953, 18, 39–43. [Google Scholar] [CrossRef]
  64. Jeh, G.; Widom, J. SimRank: A measure of structural-context similarity. In Proceedings of the 8th ACM SIGKDD International Conference on Knowledge Discovery and Data Mining (KDD ’02), New York, NY, USA, 23–26 July 2002; pp. 538–543. [Google Scholar] [CrossRef]
  65. Lin, Z.; Lyu, M.R.; King, I. MatchSim: A novel similarity measure based on maximum neighborhood matching. Knowl. Inf. Syst. 2012, 32, 141–166. [Google Scholar] [CrossRef]
  66. Jin, R.; Lee, V.E.; Hong, H. Axiomatic ranking of network role similarity. In Proceedings of the 17th ACM SIGKDD International Conference on Knowledge Discovery and Data Mining (KDD ’11), New York, NY, USA, 21–24 August 2011; pp. 922–930. [Google Scholar] [CrossRef]
  67. Jin, R.; Lee, V.E.; Li, L. Scalable and Axiomatic Ranking of Network Role Similarity. ACM Trans. Knowl. Discov. Data 2014, 8, 3. [Google Scholar] [CrossRef]
  68. Cormen, T.H.; Leiserson, C.E.; Rivest, R.L.; Stein, C. Introduction to Algorithms, 4th ed.; MIT Press: Cambridge, MA, USA, 2022. [Google Scholar]
  69. Morin, F.; Bengio, Y. Hierarchical probabilistic neural network language model. In Proceedings of the 10th International Workshop on Artificial Intelligence and Statistics (AISTATS 2005), Bridgetown, Barbados, 6–8 January 2005. [Google Scholar]
Figure 1. ffstruc2vec applied to the mirrored Zachary’s Karate Club. Nodes with special structural properties in the graph (upper picture), such as central and peripheral nodes, are marked in color. The ffstruc2vec approach effectively separates the embedding vectors of these nodes from the other nodes (lower picture).
Applsci 16 01644 g001
Figure 2. Visualization of k-hop neighborhoods for nodes x and y. The neighborhoods are color-coded as follows: green for k = 1 , blue for k = 2 , and gray for k = 3 .
Applsci 16 01644 g002
Figure 3. Automorphism orbits 0 , 1 , 2 , , 72 for the thirty 2-, 3-, 4-, and 5-node graphlets G 0 , G 1 , , G 29 . In a graphlet G i for i { 0 , 1 , , 29 } , nodes belonging to the same orbit are shaded identically. Adapted from [49], © Oxford University Press, reproduced with permission.
Applsci 16 01644 g003
Figure 4. Example of a similarity graph G constructed from the original graph G. Nodes with the same structural properties in G are depicted in the same color, while edges with high weights—indicating a high degree of structural similarity between the connected nodes—are represented as thick lines in G .
Applsci 16 01644 g004
Figure 5. Generating node sequences (right) using random walks on the similarity graph (left). Nodes with the same color indicate structurally similar nodes. Structurally similar nodes in the original graph result in similar contexts within the generated sequences, as indicated by the matching colors in the illustrations.
Applsci 16 01644 g005
Figure 6. Applying the Skip-gram model to the generated node sequences (left) to learn node representation vectors (right). Each letter represents a node. Colors indicate structural similarity: nodes with the same or similar colors share similar structural properties and therefore appear in similar contexts within the sequences.
Applsci 16 01644 g006
Figure 7. Mirrored Zachary’s Karate Club network. Nodes and their mirrored counterparts are represented with identical colors to illustrate structural symmetry.
Applsci 16 01644 g007
Figure 8. ffstruc2vec node embedding vectors of the mirrored Zachary’s Karate Club network. Nodes and their mirrored counterparts share identical colors. ffstruc2vec effectively clusters structurally similar nodes, preserving the network’s structural properties in the embedding space.
Applsci 16 01644 g008
Figure 9. struc2vec node embedding vectors of the mirrored Zachary’s Karate Club network. Nodes and their mirrored counterparts share identical colors. struc2vec fails to effectively separate several structurally distinctive nodes from the main cluster in the embedding space. Reproduced from [13], © ACM, with permission.
Applsci 16 01644 g009
Figure 10. Anomaly scores of the 20 structurally most anomalous nodes in the mirrored Zachary’s Karate Club network, computed using ffstruc2vec’s representation vectors. The y-axis denotes the anomaly scores, while the x-axis represents the corresponding nodes.
Applsci 16 01644 g010
Figure 11. Clustering of nodes in the mirrored Zachary’s Karate Club network using ffstruc2vec’s representation vectors. The clusters obtained using k-means group nodes with similar structural properties and are color-coded to reflect their structural similarity.
Applsci 16 01644 g011
Figure 12. Node embedding vectors of the mirrored Zachary’s Karate Club network, obtained using DeepWalk and node2vec. Nodes and their mirrored counterparts share identical colors, where each color represents a corresponding mirrored node pair. The embeddings produced by these methods fail to capture structural patterns. Reproduced from [13], © ACM, with permission.
Applsci 16 01644 g012
Figure 13. Application of ffstruc2vec to a Barbell graph (left), demonstrating structural identity preservation in the embedding space (right). Nodes with the same structural identity in the Barbell graph share the same color, where each color denotes one structural identity class. ffstruc2vec maps node representation vectors of structurally similar nodes to nearby positions in the embedding space.
Applsci 16 01644 g013
Figure 14. Illustration of ffstruc2vec’s flexibility in the Barbell graph by adjusting the weighting of k-hop neighborhood layers. In (a), higher weighting is assigned to distant neighborhoods, emphasizing long-range structural similarities. In (b), closer neighborhoods are prioritized, enhancing local structural differentiation.
Applsci 16 01644 g014
Figure 15. Node embedding representations in the Barbell graph learned by three different node embedding frameworks. Reproduced from [13], © ACM, with permission.
Applsci 16 01644 g015
Table 1. Summary of representative node embedding methods and commonly discussed challenges with respect to structural role modeling.
Method CategoryRepresentative ApproachCommon Challenges in Structural Embedding Contexts
Proximity-based embeddingsnode2vec [15]Primarily focus on local connectivity and neighborhood proximity; not explicitly designed to capture structural roles independent of node proximity.
Structural identity (multilayer graph)struc2vec [13]Relies on a rigid multilayer architecture, which can limit flexibility and adaptation to task-specific structural patterns, and may affect scalability.
Structural identity (probabilistic)struc2gauss [22]Models uncertainty in structural similarity, but provides limited mechanisms for task-specific adaptation and direct interpretability of structural feature contributions.
Contrastive learning approachesDGI [32]Depend on data augmentation or multi-view training pipelines, which can increase computational cost and limit interpretability and scalability in practice.
Note: This table provides a high-level categorization of representative approaches and summarizes commonly discussed challenges in the literature. It is not intended as an exhaustive or quantitative comparison.
Table 2. An overview of the three air traffic network datasets used for evaluation. Each dataset is an unweighted, undirected graph where nodes represent airports and edges indicate commercial flight connections. The activity measurement is the basis for assigning activity-level labels to airports for the classification algorithm.
DatasetNodesEdgesActivity Measurement
Brazilian air traffic network1311038Number of landings plus takeoffs
American air traffic network119013,599Number of passengers that passed the airport
European air traffic network3995995Number of landings plus takeoffs
Table 3. Classification accuracy of node embedding methods across three air traffic network datasets. The best-performing method for each dataset is in bold.
AlgorithmBrazilEuropeAmericaAverage
DeepWalk53.3%48.1%62.4%54.6%
node2vec58.9%50.8%66.2%58.6%
Node degree81.1%57.0%58.2%65.4%
struc2vec75.9%61.6%67.1%68.2%
ffstruc2vec82.6%61.6%69.7%71.3%
Disclaimer/Publisher’s Note: The statements, opinions and data contained in all publications are solely those of the individual author(s) and contributor(s) and not of MDPI and/or the editor(s). MDPI and/or the editor(s) disclaim responsibility for any injury to people or property resulting from any ideas, methods, instructions or products referred to in the content.