1. Introduction
Motorcyclists are among the most vulnerable road users, facing a disproportionately high risk of injury and fatality in road accidents. The literature highlights a complex interplay among demographic, behavioural, environmental, and infrastructural factors that influences accident occurrence and injury severity. Motorcycle accidents account for a significant proportion of road traffic injuries and fatalities globally, especially in developing countries. Young males (often aged 15–40) are the most affected group, with a high incidence of severe injuries and fatalities [
1,
2,
3]. In some regions, nearly half of all road accidents involve motorcycles, with adolescents and young adults being particularly at risk [
2,
4,
5,
6]. Head and neck injuries are the most common and severe, frequently leading to death or long-term disability [
2,
7,
8,
9]. The severity of injuries is strongly associated with factors such as speed, lack of helmet use, alcohol consumption, and nighttime driving [
2,
10,
11,
12,
13]. Helmet use significantly reduces the risk of traumatic brain injury and fatality [
8,
14].
Main factors influencing the risk of road accidents involving motorcyclists/drivers of two-wheeled vehicles: demographics consist of young adult male motorcyclists that are at higher risk in both environments, but risky behaviours such as riding without a license or exceeding speed limits are particularly impactful in urban areas [
2,
5]; behavioural factors connected with alcohol/drug use, lack of helmet, and high speed and risky manoeuvres are significant contributors to injury severity [
3,
10,
11,
12]; environmental factors associated with poor road conditions, nighttime, rural/urban differences, weather, and road curvature [
11,
15,
16,
17,
18]; and infrastructure connected with absence of motorcycle-friendly barriers, inadequate lighting, and lack of dedicated lanes [
12,
16,
17]. A substantial body of research has compared motorcycle crash injury outcomes and severity between urban and rural environments, revealing significant differences in risk factors, crash characteristics, and injury patterns. Factors such as clear weather, young motorcyclists, unlit roadways, drowsiness, illegal overtaking, four-lane highways, and crashes on weekends or at night are more strongly associated with severe injuries in rural settings. Still, factors such as older motorcyclists, crashes at intersections or on horizontal curves, and collisions with passenger cars are more significant in urban settings. Additionally, in urban areas, crashes are more likely to involve pedestrians and occur at intersections [
19].
Rural crashes are more likely to involve head-on collisions and run-off-road events, and to occur under dark, unlit conditions. Urban crashes are more often rear-end collisions involving pedestrians and occur at signalised intersections [
4]. Effective interventions include stricter enforcement of helmet, speed limit, and alcohol regulations, as well as public education campaigns targeting high-risk groups. Infrastructure improvements, such as motorcycle protection systems on barriers and dedicated lanes, also show promise in reducing injury severity [
12,
16,
17]. Recent studies emphasise the need for more nuanced analyses considering temporal and spatial variations, unobserved heterogeneity, and the interplay between fault status and injury severity [
11,
12,
15]. There is also a call for improved data collection and injury assessment methods to inform targeted interventions [
7,
8,
10]. Machine learning models are used to identify factors that influence injury severity [
20].
Motorcyclists are among the most vulnerable road users worldwide, but patterns and risk factors for motorcycle accidents vary widely by region. Recent studies conducted in Europe and other continents reveal similarities and differences in motorcycle accident rates worldwide. European studies, including large-scale analyses undertaken in Germany, Portugal, Finland, and Slovenia, consistently show that motorcyclists are at high risk of serious and fatal injuries, especially to the head, chest, and limbs (extremity trauma) [
3,
7,
10,
21,
22,
23,
24,
25]. However, over the past two decades, Europe has seen a steady decline in both the number and severity of motorcycle-related injuries and fatalities, attributed to improved safety regulations, helmet use, and advances in trauma care [
3,
24]. Key factors contributing to injury severity in Europe include excessive speed, alcohol consumption, poor road conditions, and risky overtaking manoeuvres [
9,
10,
21,
22,
26]. Urban areas often see more minor injuries, while rural and non-urban roads are associated with higher fatality rates [
3,
22,
24]. European Union countries have implemented policies to prevent road accidents. The EU’s ‘Vision Zero’ (long-term goal to move as close as possible to zero fatalities in road transport by 2050) and ‘Safe System’ (elimination of crashes connected with human errors) approaches have contributed to significant improvements in road safety by focusing on infrastructure, enforcement and active safety systems [
3,
27].
In Asia, motorcycle accidents account for a significantly higher percentage of road traffic fatalities, often exceeding 50% in some countries. Helmet use and enforcement of regulations are less consistent, and therefore the severity of injuries is deepened by lower compliance with safety regulations and less developed trauma care systems [
4,
11]. The United States and Canada have high motorcycle fatality rates per mile travelled, with alcohol, speed, and lack of helmets being the main risk factors. Injury patterns are similar to those in Europe, but mortality rates are generally higher due to differences in helmet regulations and road user behaviour [
4,
28,
29,
30]. In Africa, injuries sustained in motorcycle crashes are an increasing public health problem, characterised by a high proportion of serious and fatal injuries. Contributing factors include poor road infrastructure, limited enforcement of safety regulations, and low helmet use rates [
31]. In Australia, the injury pattern is similar to that in Europe, but there are more single-vehicle accidents and specific challenges related to rural road conditions [
27].
Europe has made significant progress in reducing motorcycle accident fatalities and injury severity through comprehensive safety strategies. Still, challenges remain, especially in rural areas and in the underreporting of minor injuries. Compared to other regions, Europe benefits from more vigorous enforcement, better infrastructure, and higher helmet use, resulting in lower fatality rates and improved outcomes for motorcyclists. In rural areas, the policy focuses on improving road lighting, targeting young drivers, and combating risky behaviour such as illegal overtaking. Accident prevention in urban areas involves improving safety at intersections, enforcing driving licence and speed limit regulations, and protecting vulnerable road users such as pedestrians. In addition, enforcing helmet and alcohol laws and tailoring interventions to local accident patterns and risk profiles have been shown to reduce accidents [
11,
16,
32,
33,
34]. Rural motorcycle crashes are more likely to result in severe or fatal injuries, often due to environmental and behavioural factors unique to these settings. Urban crashes, while more frequent, tend to result in less severe injuries but are influenced by intersection dynamics and pedestrian involvement. Effective safety interventions must be context-specific, addressing the distinct risk factors present in each environment.
Analysts in European countries mainly use extensive accident databases (e.g., GIDAS in Germany (German In-Depth Accident Study) and the Trauma Register DGU (Deutsche Gesellschaft für Unfallchirurgie) to identify factors influencing the severity of injuries. The limited number of reports on non-fatal injuries, especially minor injuries [
35], makes it difficult to identify additional factors directly affecting injuries to participants travelling on two-wheeled vehicles. In Poland, the number of motorcyclists is steadily growing, which is facilitated, among other things, by legal changes allowing persons with a car driving licence to ride motorcycles with an engine capacity of up to 125 cm
3. Poland is characterised by diverse geographical and infrastructural conditions, which influence how motorcycles are used across different regions. Mountainous and foothill areas are conducive to motorcycle tourism and recreational riding, while lowland and heavily urbanised regions are more likely to use motorcycles for everyday transport. This diversity translates into different riding styles, traffic intensity, and specific road hazards, which are essential for assessing motorcyclist safety on a national scale. This study addresses a particular type of motorcycle accident, i.e., single-vehicle accidents, as these account for a substantial proportion of all motorcycle accidents and increased from 25.1% to 28.5% during the analysed period, i.e., 2014–2023. According to the Polish Road Safety Observatory, a single-vehicle accident is a road accident resulting in human casualties, including the perpetrator, involving a single vehicle (excluding collisions with pedestrians). This definition includes colliding with an immobilised vehicle, a tree, a pole, a pothole, an animal, a sign, a barrier, and a vehicle rollover.
The article is set up in a way that makes sense and is easy to follow so that the reader can understand each part of the analysis. The Introduction provides background information and explains why the study was conducted. It also discusses what we already know about risk factors in single-vehicle accidents and outlines the study’s main goals and research questions. This part explains the problem’s context and importance, which is why a thorough analytical approach is necessary.
The
Section 2 describes the dataset of 5253 single motorcycle accidents, the classification of injury outcomes, and the application of five machine learning algorithms: multinomial logistic regression, classification tree, random forest, XGBoost (eXtreme Gradient Boosting), and neural network (NN) and Recurrent Neural Network (RNN). It details the mathematical formulations, model training procedures, and evaluation metrics, ensuring that the analytical process is transparent and reproducible. The
Section 3 presents the empirical findings in detail. It reports the performance of each classification model using confusion matrices, sensitivity, specificity, positive and negative predictive values, and under the ROC (Receiver Operating Characteristic) Curve (AUC) scores. Using machine learning models, factors related to injury severity were identified among the many characteristics recorded in accident descriptions. On the one hand, the models were trained on a training set, and their recognition accuracy was verified on a test set. Of course, different models detected the importance of various factors to varying degrees, but ‘Passenger presence’ was the dominant factor. The
Section 4 interprets the results in the context of the existing literature, examining how the identified risk factors align with or differ from previous studies. It addresses methodological strengths and limitations, such as class imbalance and data constraints. It considers the implications of the findings for targeted road safety interventions in both rural and urban environments. Finally, the
Section 5 synthesises the principal outcomes and recommendations, emphasising the robustness of the identified predictors and the practical relevance of the results for policy and intervention strategies.
3. Results
3.1. Risk Factor Analysis
Data on accidents involving single motorcycles between 1 January 2014 and 31 December 2023 were imported from the Data Warehouse of the Polish Road Safety Observatory [
36]. The dataset contains 5253 records related to single-motorcycle accidents. There is a severe class imbalance in the dataset: 13.48% of road users were classified as fatalities (Death), 80.14% Injury, and 6.38% No injury. The dataset was divided into a training set and a test set in proportions of 80% and 20%, respectively, in a random manner while maintaining the proportions of the dependent variable classes [
44,
46,
47,
48]. Dividing data helps prevent overfitting and analyse reliable forecasts.
The imbalance of classes affects the positive predictive value (PPV) of minority classes; therefore, in order to create classifiers, each record was used with a weight. The weights for each class were defined as standardised reciprocals of the shares of injury type; therefore, for accident with realisation, the weight of Death is equal to 0.3047, for accident with realisation for Injury, 0.0513, for accident with realization No injury, 0.644. The prediction results presented below refer to the verification of models on the test set.
3.2. Multinomial Logistic Regression
The confusion matrix and quality of classifier of multinomial logistic regression are presented in
Table 2 and
Table 3, respectively. The accuracy of the prediction on the test set is 69.2%.
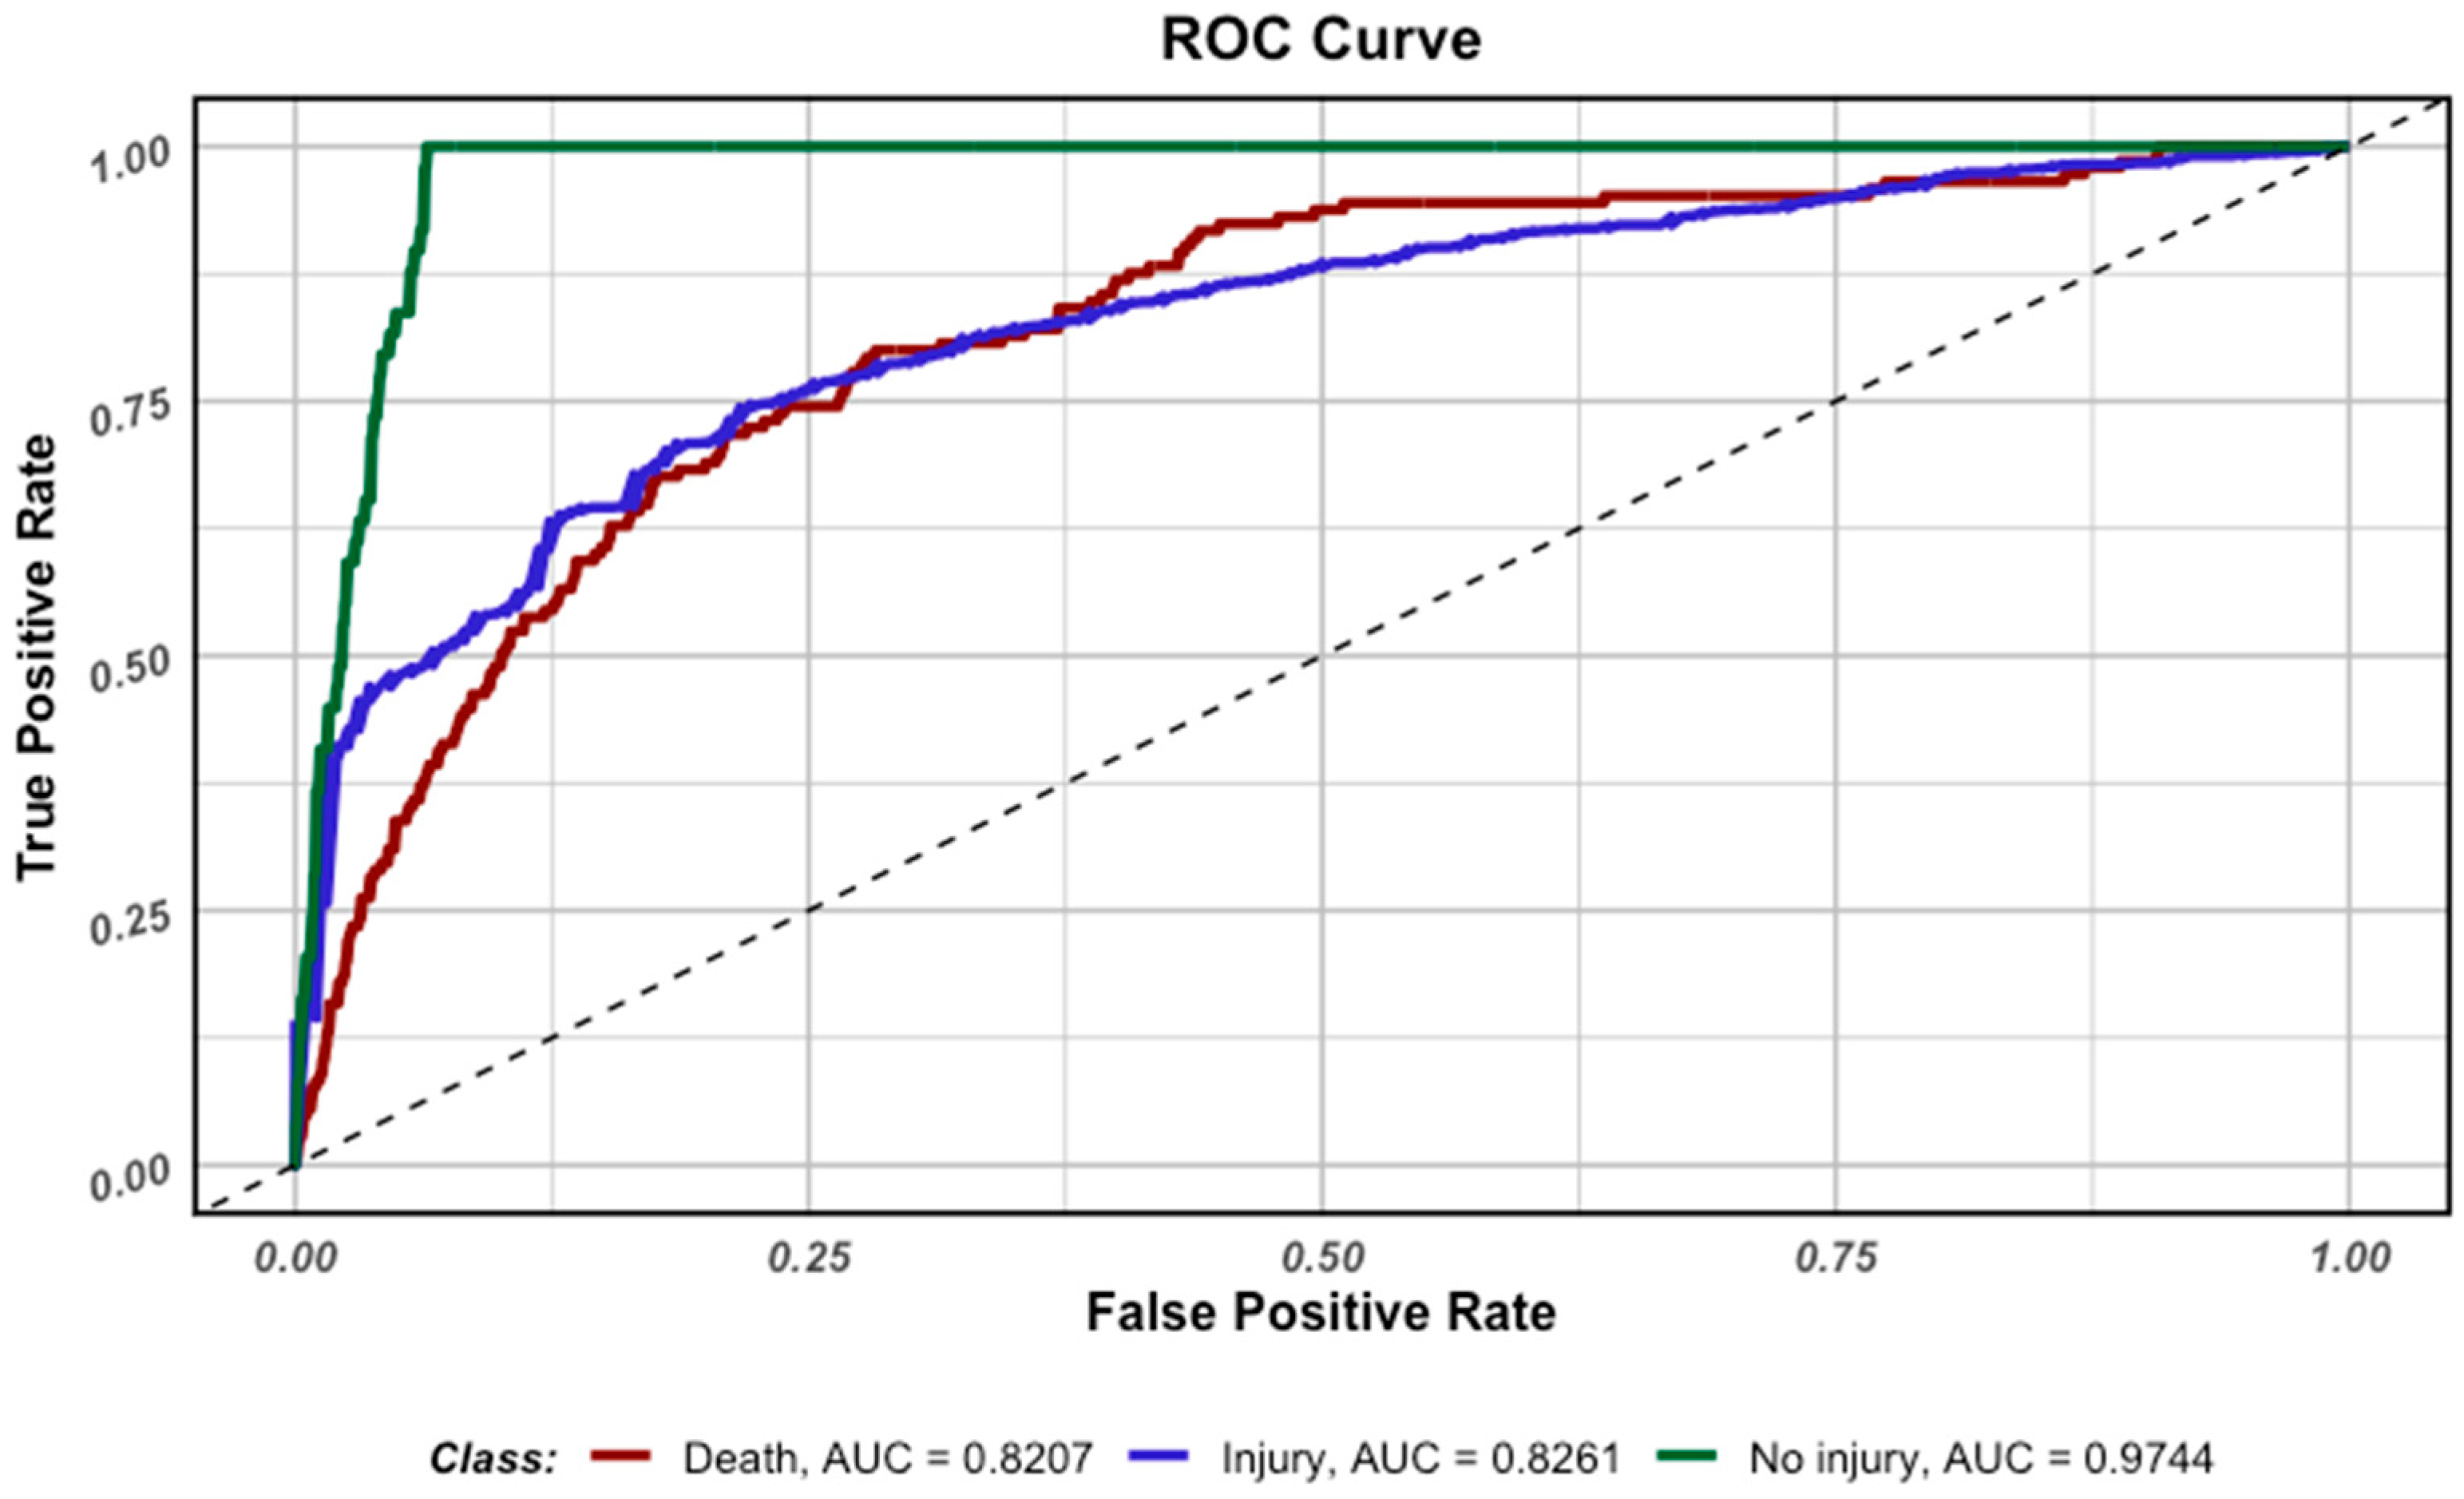
Figure 1 shows the ROC curves for each class, but
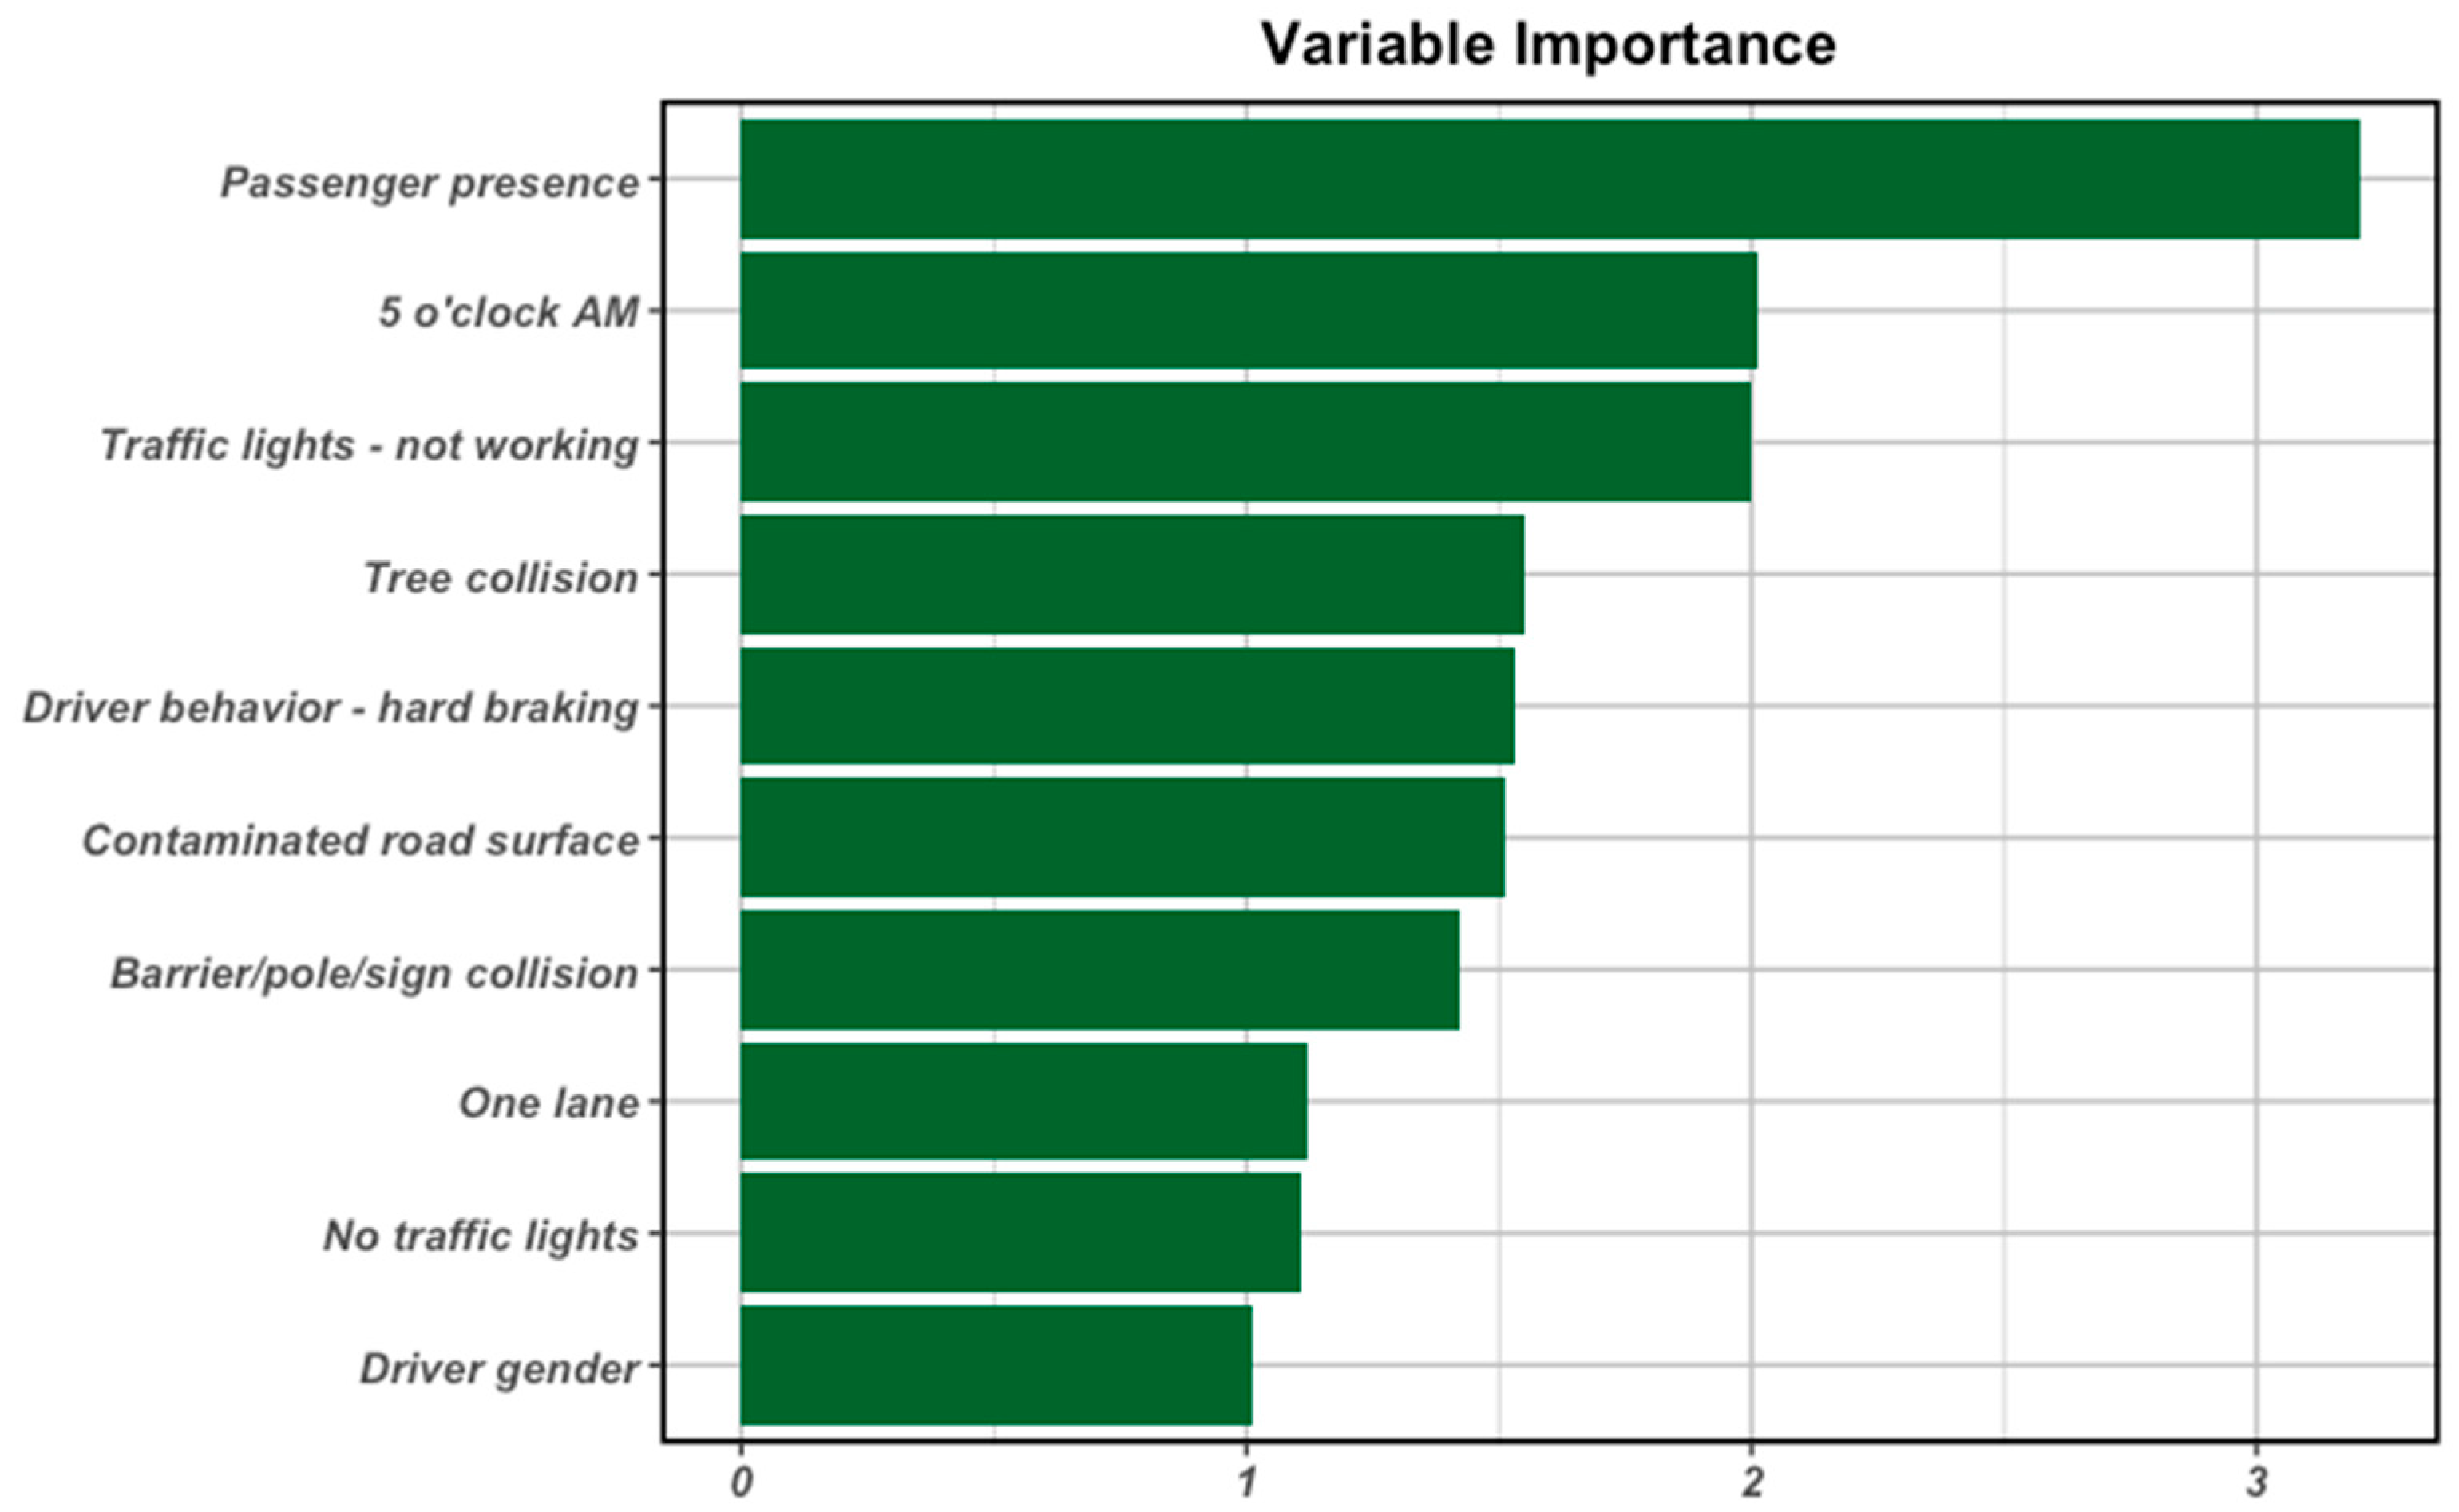
Figure 2 presents the ten most important variables used in the classifier based on multinomial logistic regression.
Figure 1 and
Table 3 show that multinomial logistic regression performs very well with the No injury category. It detects all cases in this class (sensitivity = 1). Very few cases from other categories are predicted as No injury (specificity = 0.94). An AUC of 0.97 indicates that it distinguishes this class from the others almost perfectly. However, of all positive predictions, only a small proportion are correct (PPV = 0.43).
In the case of the injury class, the model predicts slightly more than half of actual cases (sensitivity = 0.67). However, the vast majority of predictions are accurate (PPV = 0.95). High specificity (0.84) and AUC (0.83) indicate a fairly satisfactory ability of the model to distinguish this class from the others.
High sensitivity (0.74) indicates that the model predicted 74% of deaths correctly. However, of all classes, it has the lowest PPV of 0.32, indicating that the vast majority of predictions are inaccurate. High specificity of 0.75 indicates a fairly good ability to distinguish other classes from deaths. The high AUC of 0.82 indicates good model quality.
Figure 2 for the multinomial regression model shows that the main factors influencing the severity of injuries sustained by motorcyclists are
Passenger presence—The variable with the highest importance indicates that the presence of a passenger on a motorcycle is the strongest single factor influencing the probability score when classifying injuries sustained in an accident. This may be due to changes in vehicle dynamics associated with increased weight and a shift in the centre of gravity, which is crucial when riding a motorcycle. Inappropriate behaviour on the part of the passenger may be a factor increasing the risk, but the presence of a passenger may also have a positive effect on the driver’s behaviour, increasing their attentiveness on the road as a result of feeling responsible for another person.
5 o’clock AM—Accidents occurring around 5:00 a.m. can be caused by many factors: driver fatigue (end of the night/beginning of the day), poor visibility at dawn, wet road surfaces, specific traffic conditions (e.g., heavy goods vehicles), or increased speed on roads that are empty at this time of day.
Traffic lights—not working—Faulty traffic lights at intersections can cause confusion among drivers, which in turn has a significant impact on the consequences of road accidents.
Tree collision—A direct collision with an indestructible obstacle such as a tree drastically increases the severity of injuries to motorcyclists, who are not protected by the vehicle’s structure.
Driver behaviour—hard braking—A common reaction to an emergency situation, which is associated with a higher risk of losing control and causing a serious accident.
Contaminated road Surface—A slippery or dirty road surface reduces traction, increasing the likelihood of an accident +95.
Barrier/pole/sign collision—Unlike collisions involving trees, collisions with road infrastructure may have less impact, as road infrastructure is increasingly made of deformable components in order to minimise the risk of injury in the event of an accident.
One lane—Single-lane roads are significant because the vast majority of accidents (over 80%) involving motorcyclists occur on single-carriageway two-way roads.
No traffic lights—The lower validity of this predictor suggests that drivers may be better prepared for right-of-way rules at intersections without traffic lights than in cases where traffic lights are present but not functioning.
Driver gender—The gender of the motorcyclist is a less significant predictor of injury severity compared to the previous ones, but it still appeared among the top ten.
3.3. Classification Tree
The confusion matrix and quality of the classification tree are presented in
Table 4 and
Table 5, respectively. The accuracy of the prediction of the classification tree on the test set is equal to 71.39%.
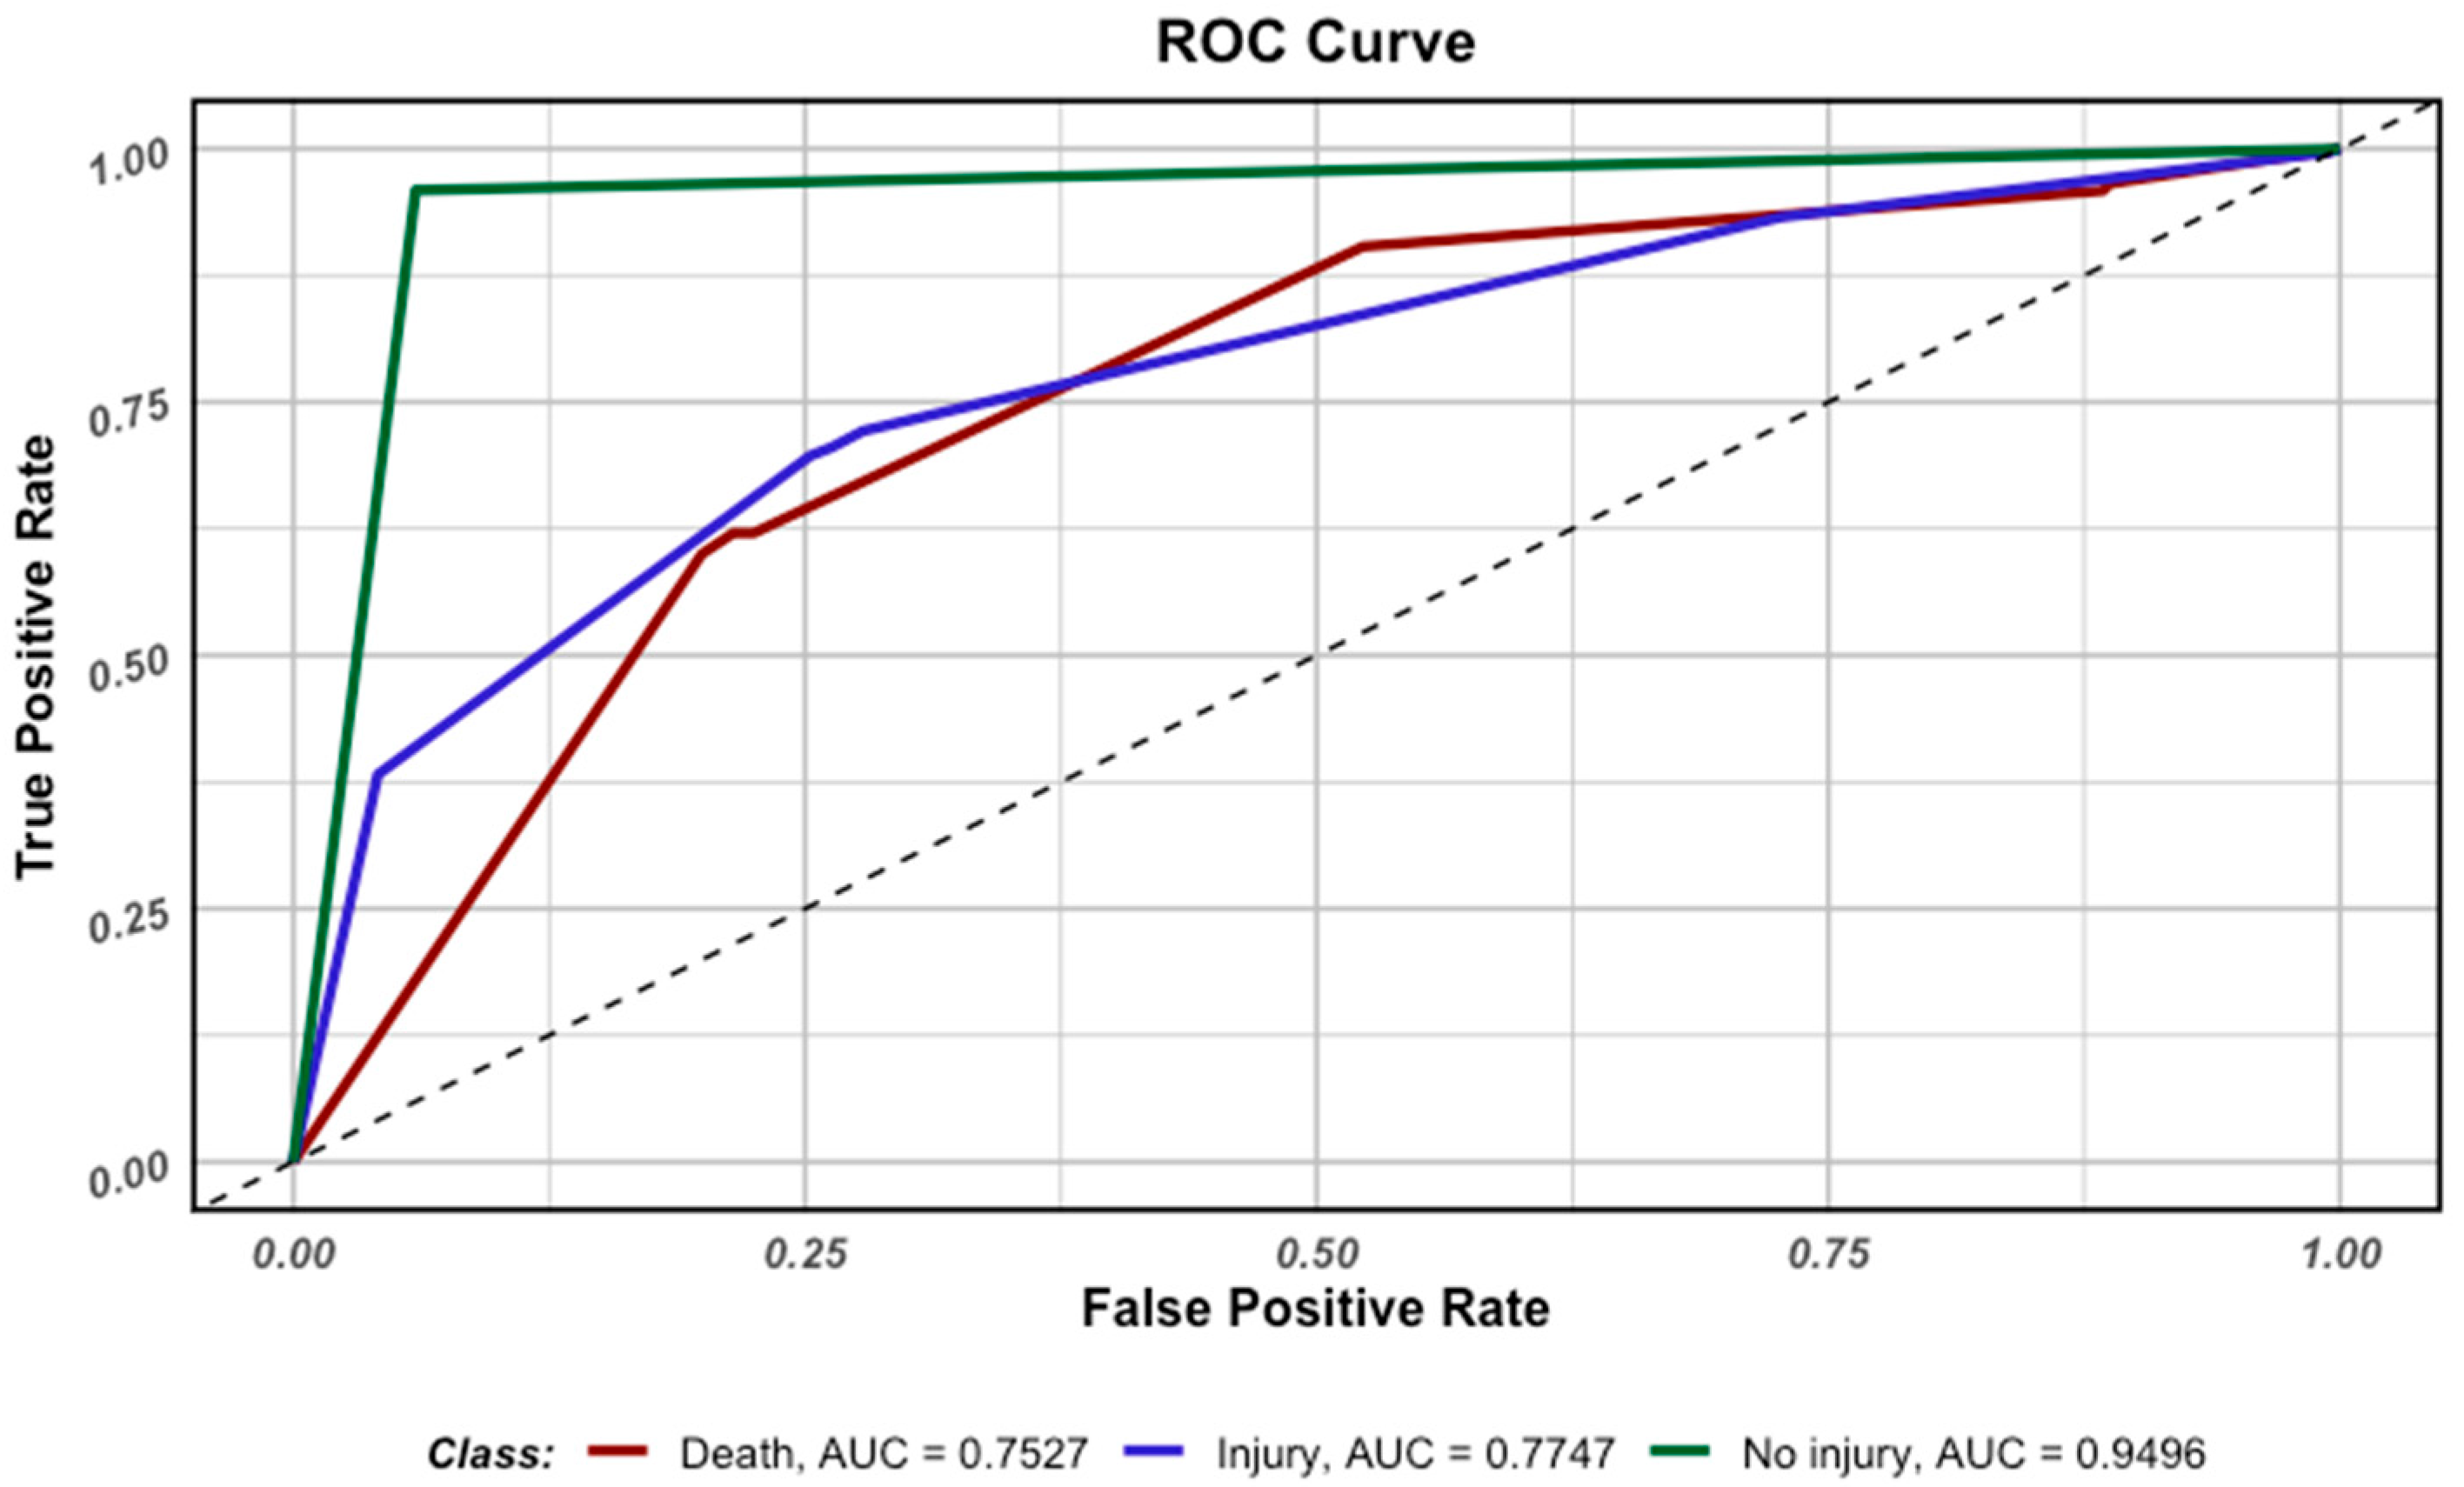
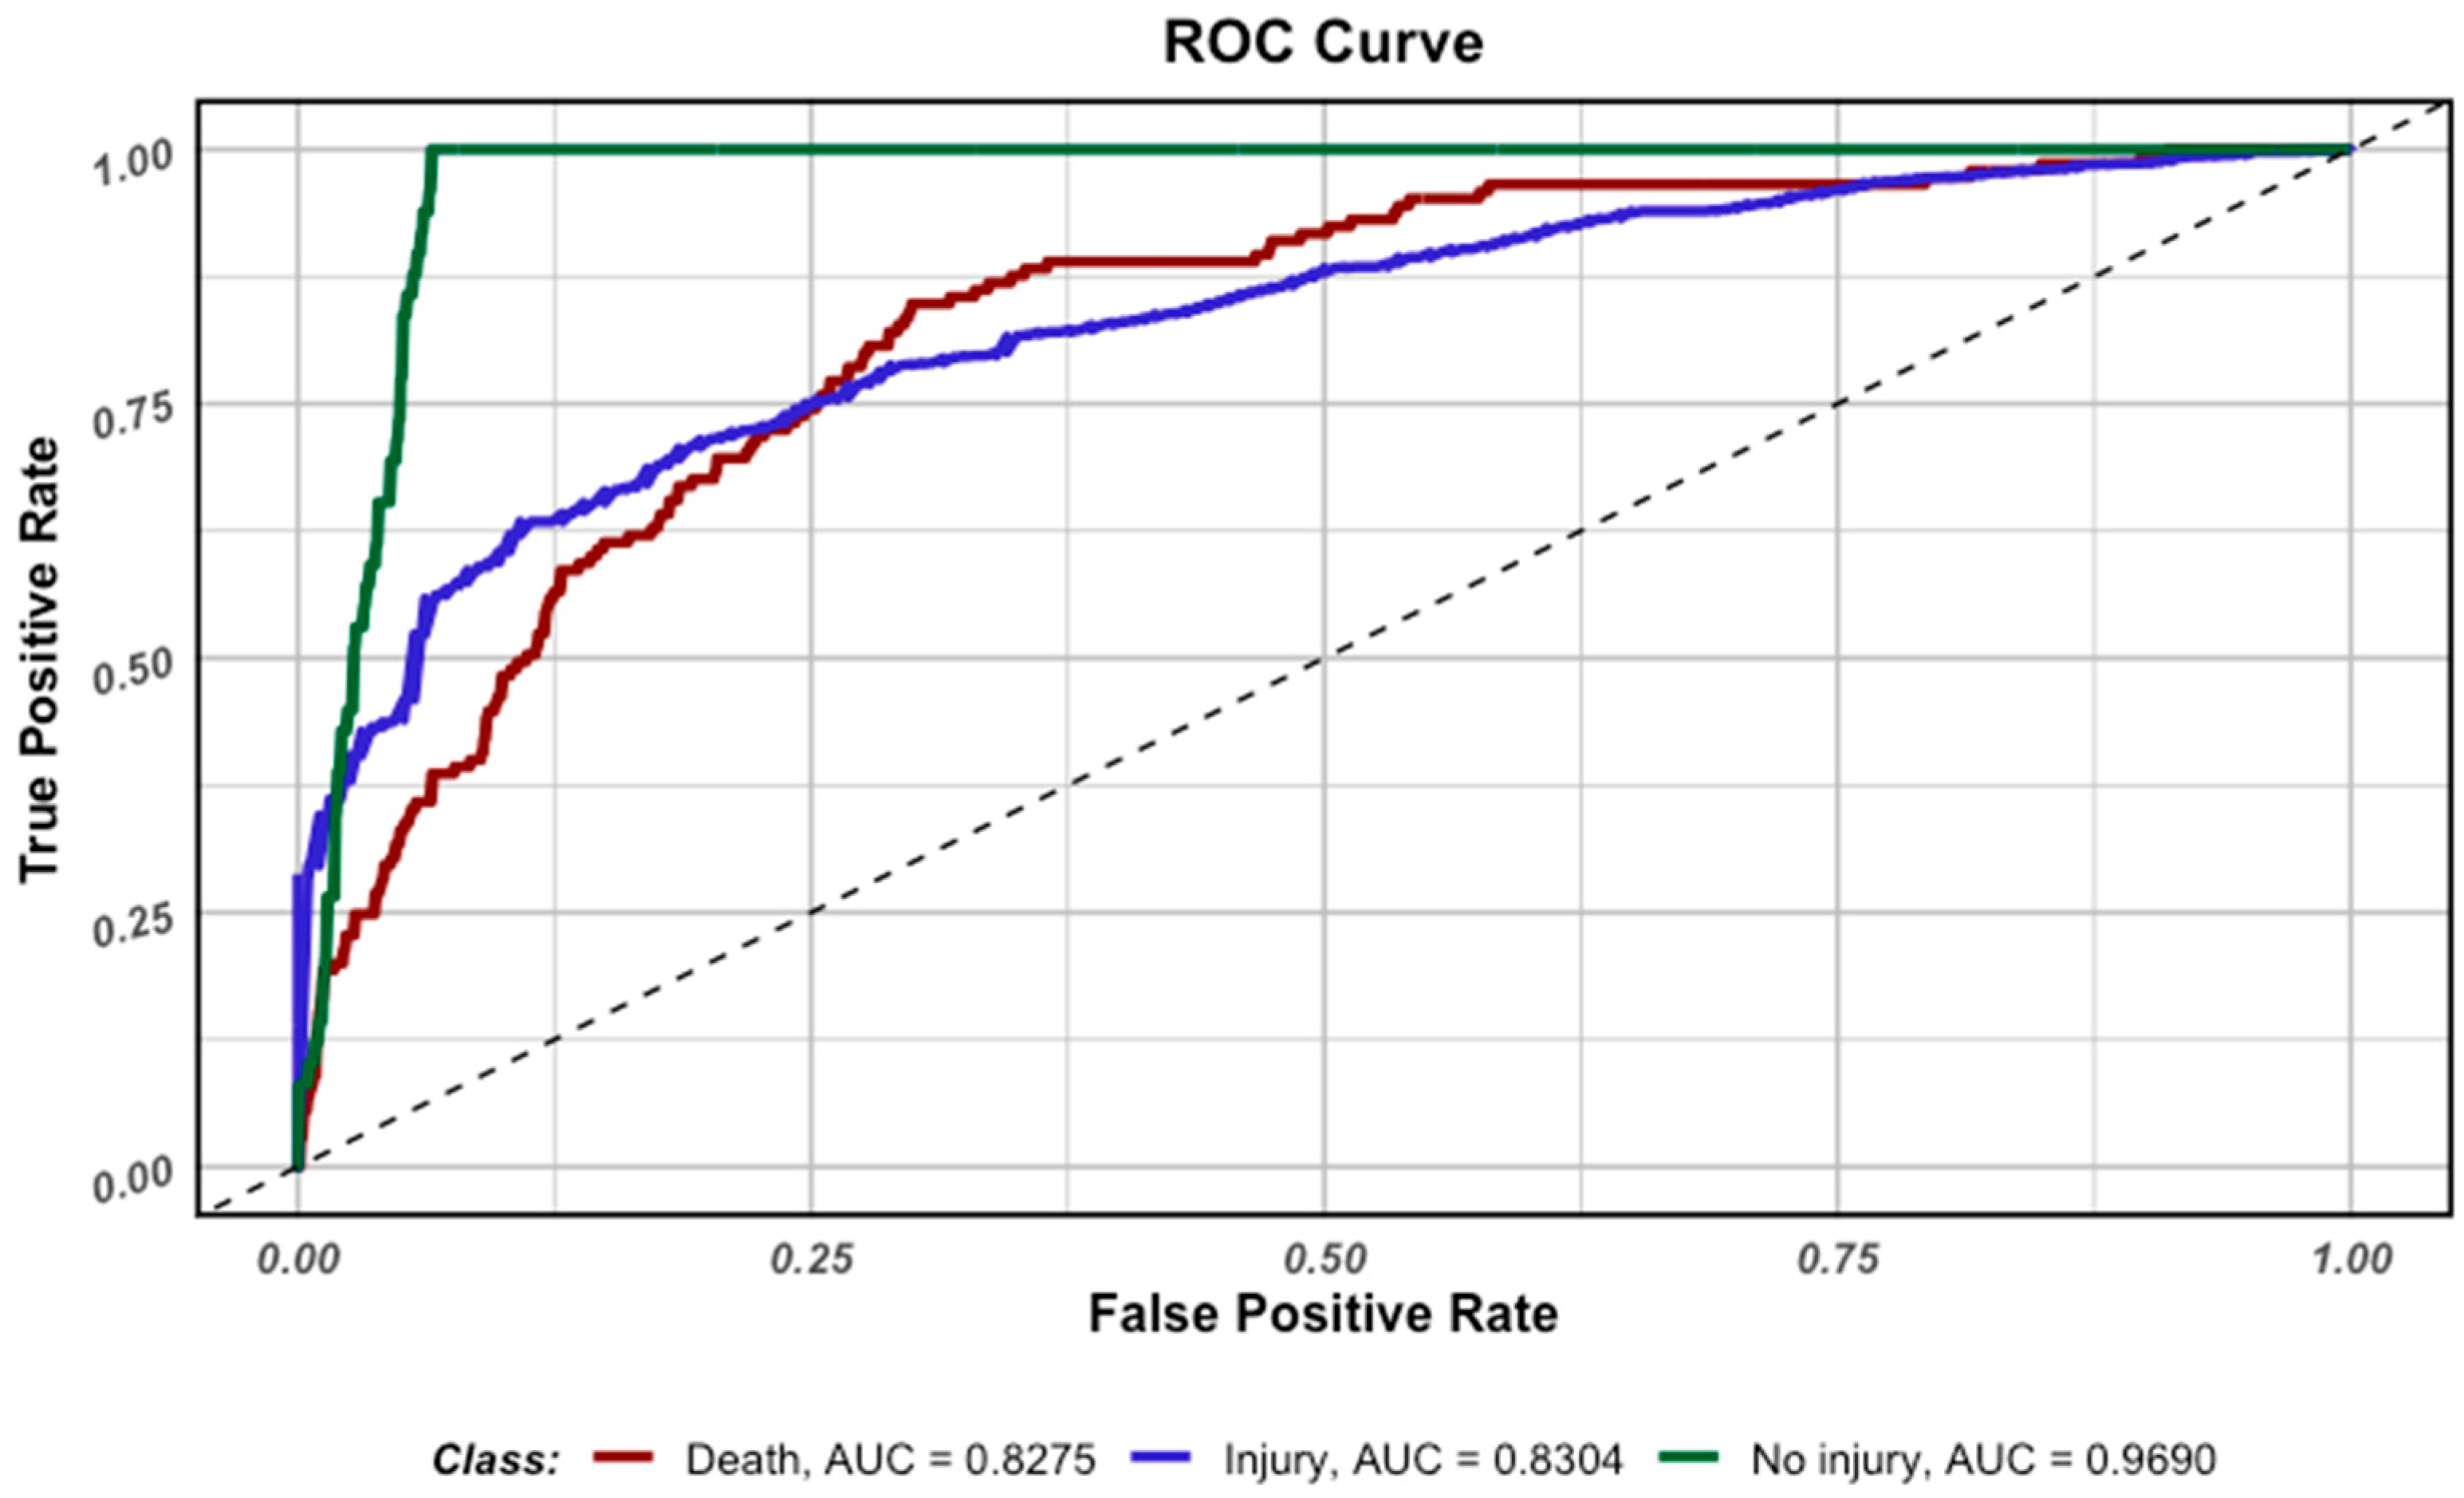
Figure 3 shows the ROC curves for each class, but
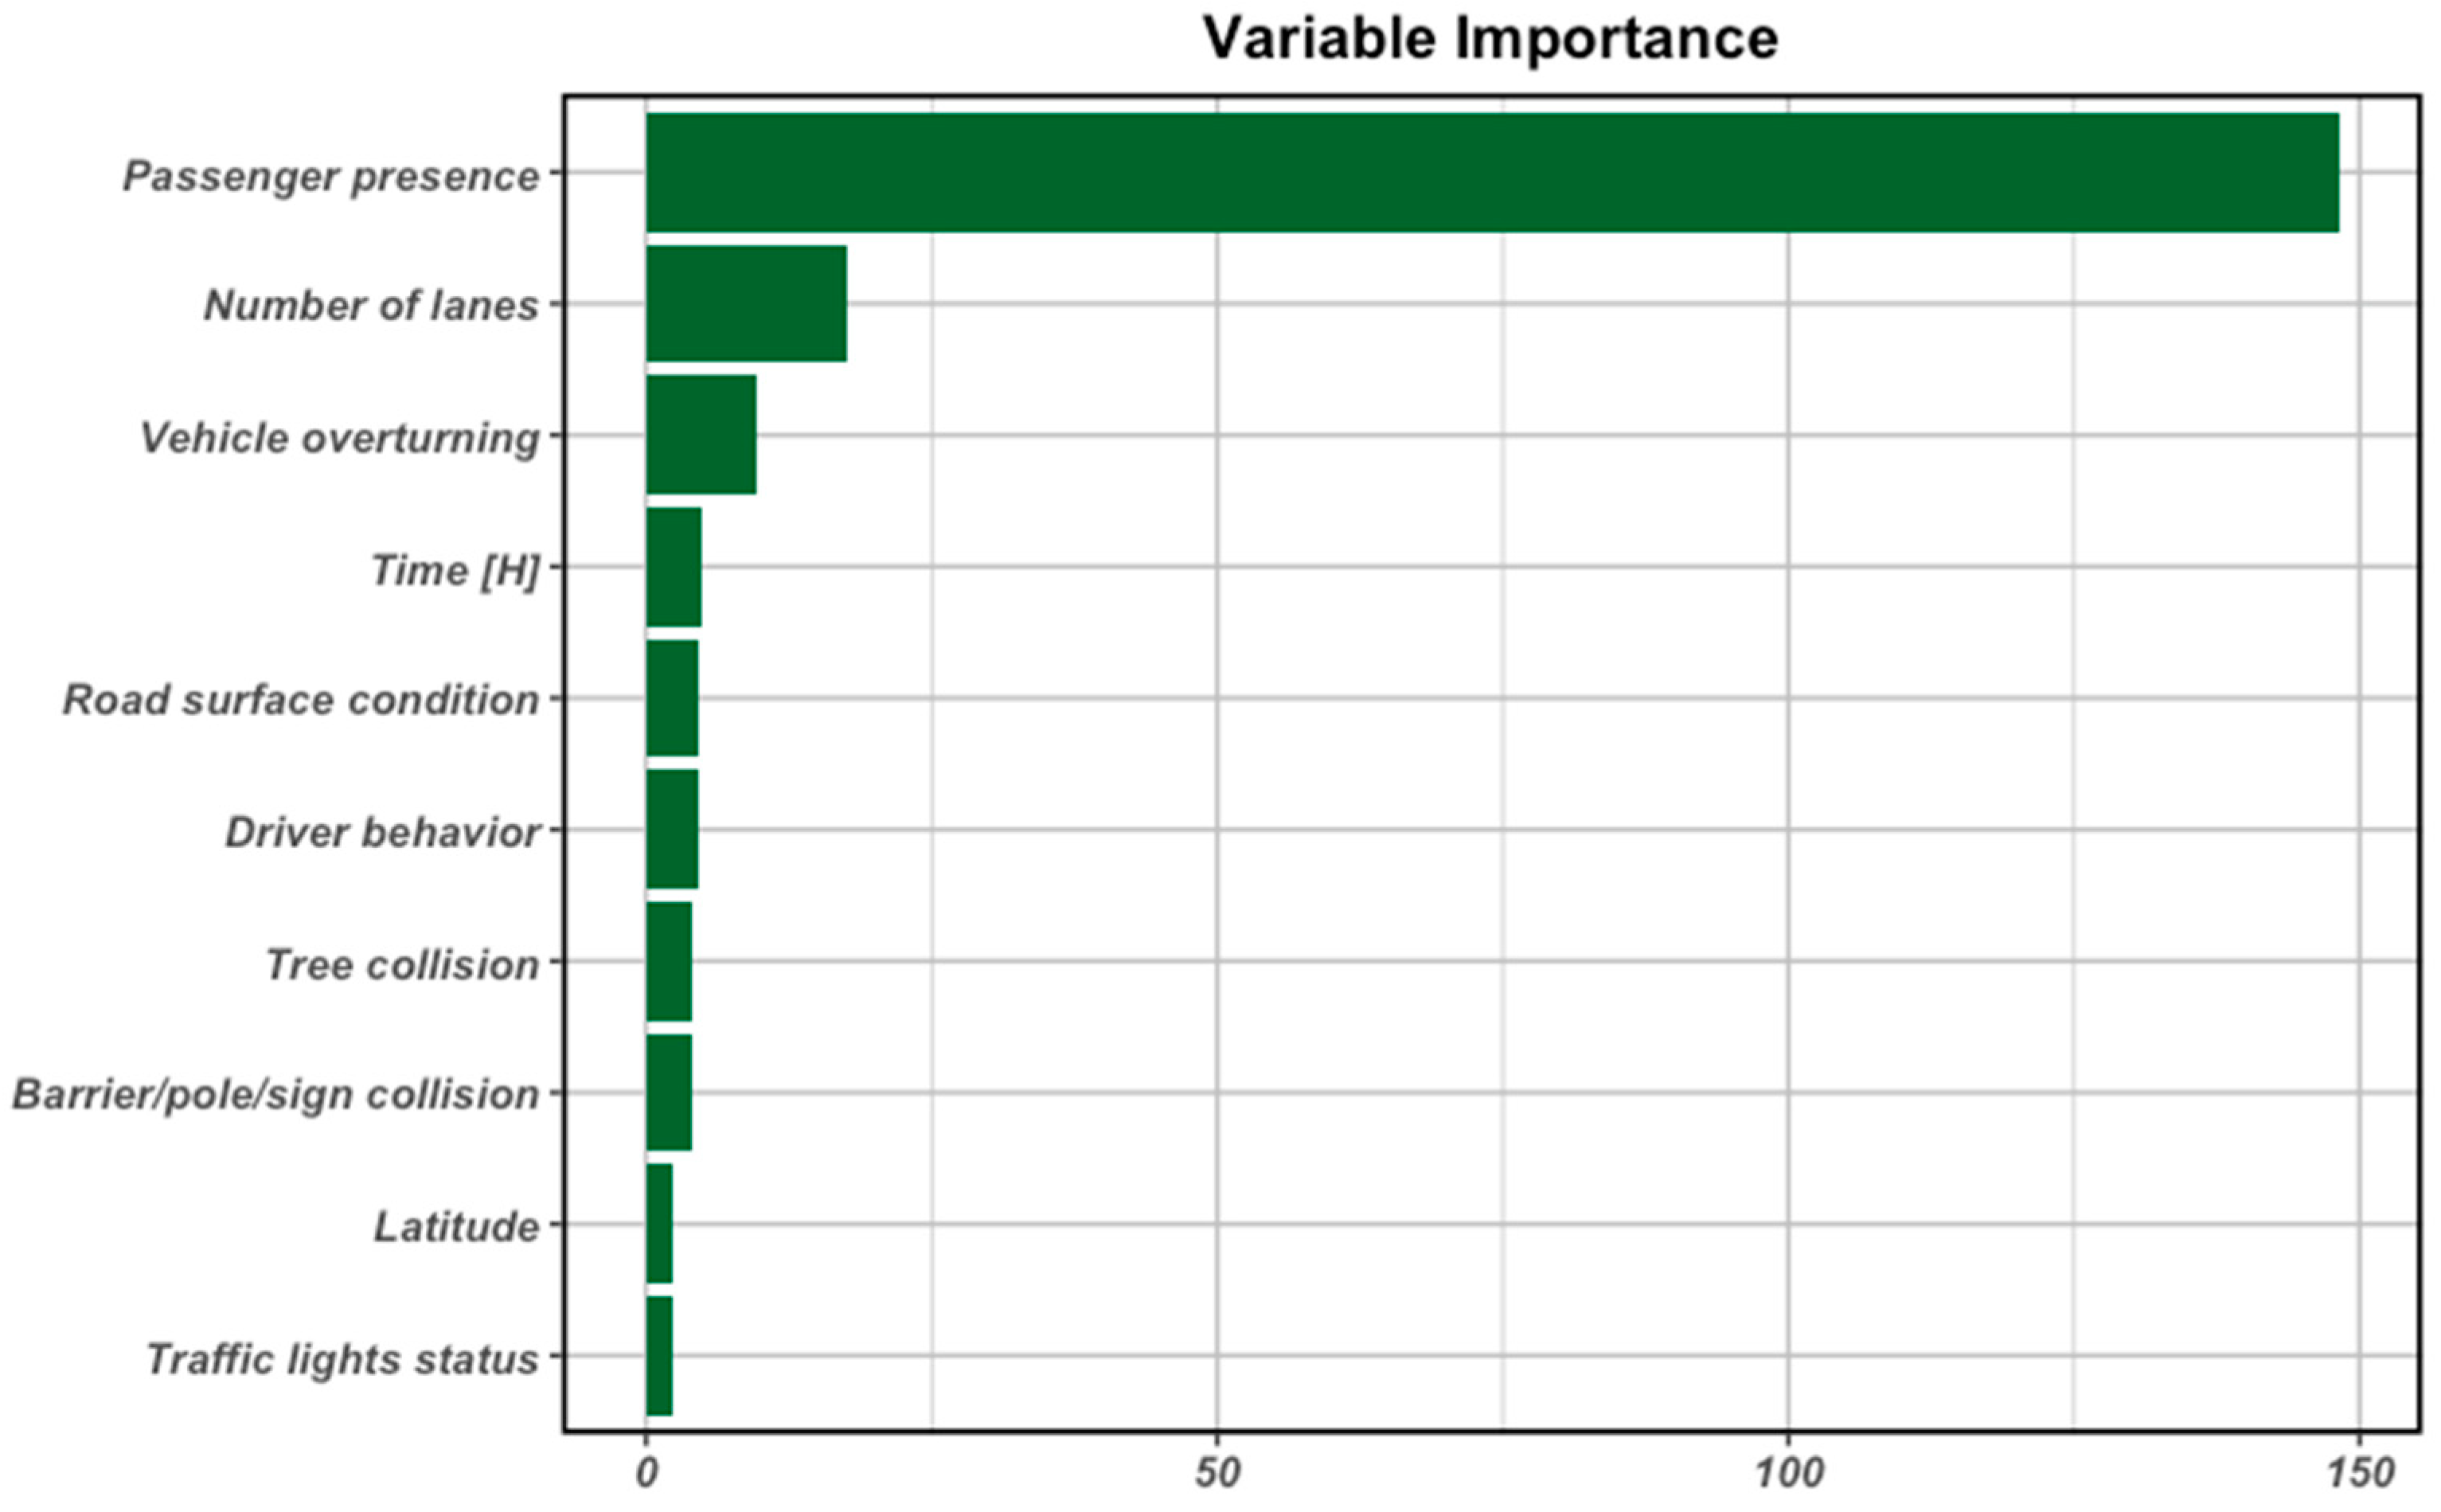
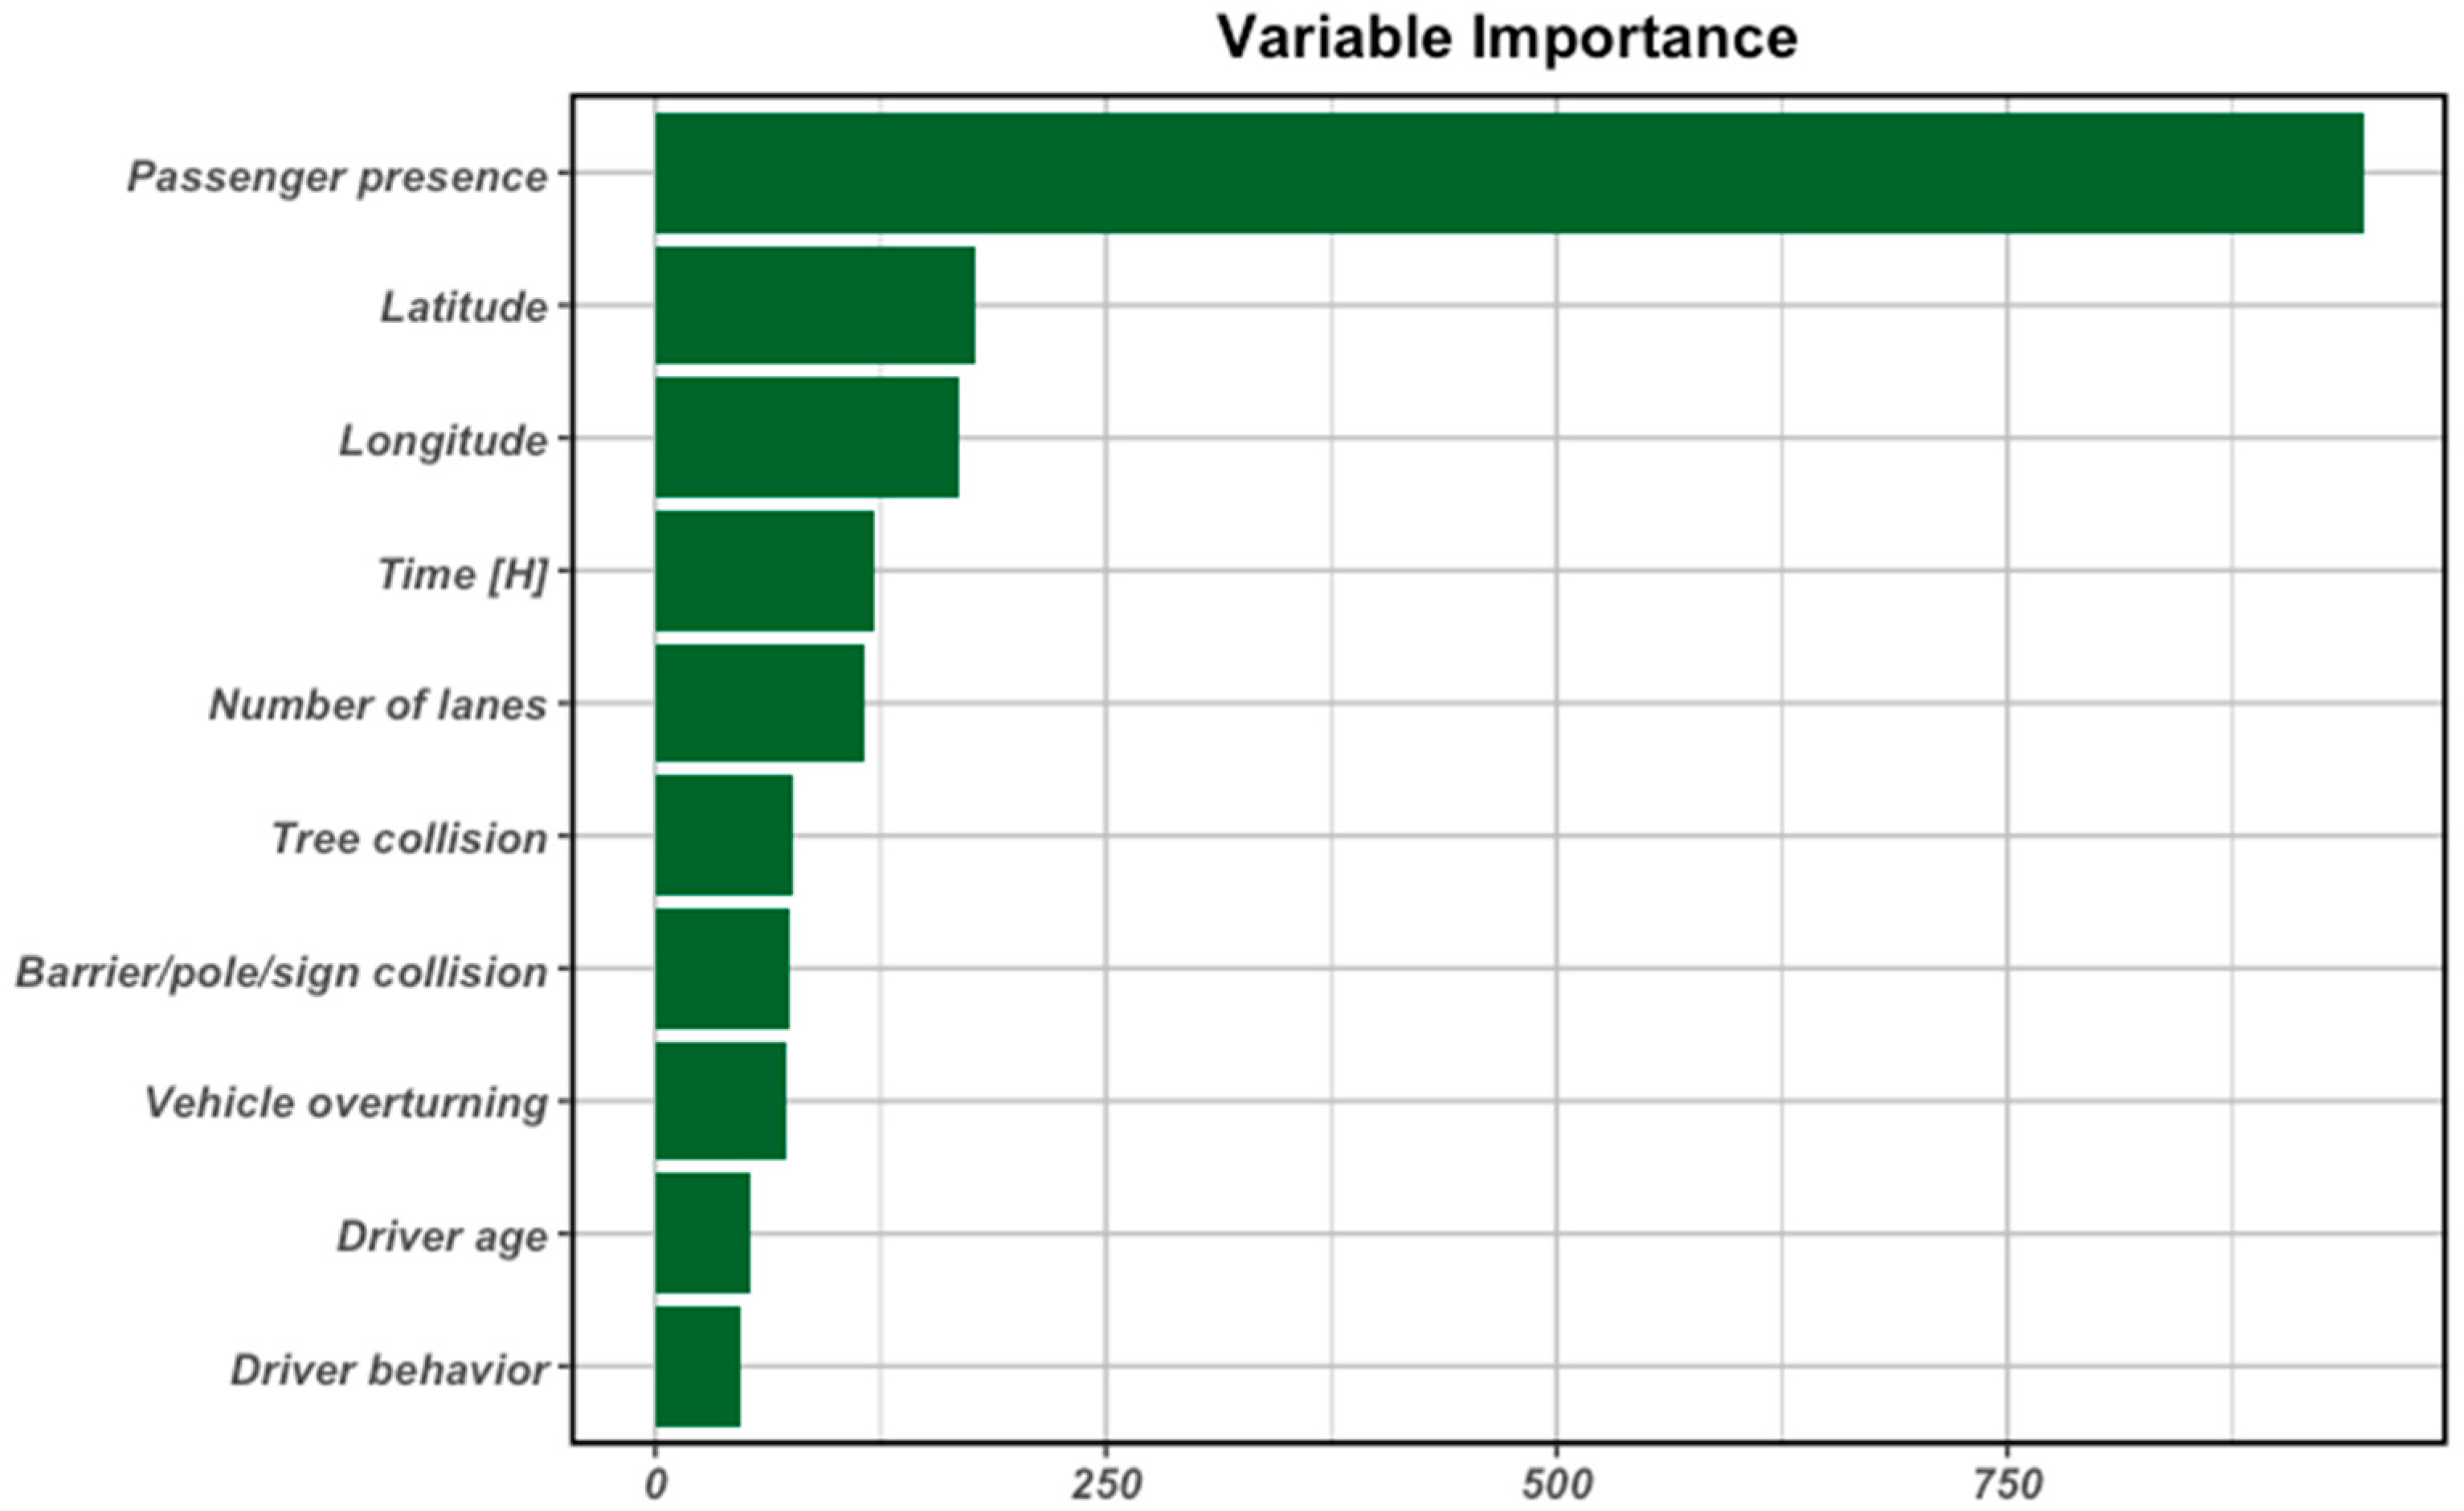
Figure 4 presents the ten most important variables used in the classification tree.
Based on
Figure 3 and
Table 5, the decision tree performs quite well in predicting deaths, although the PPV of 0.31 indicates that almost 69% of positive predictions are false. A sensitivity of 0.62 means that the model detects slightly more than half of actual deaths. Moderate specificity (0.78) and AUC (0.75) indicate that the ability to distinguish deaths from other classes is moderately good, but could be better.
When it comes to cases without injuries, apart from the low PPV (0.42), suggesting a high percentage of false positives, the tree performs exceptionally well with this class. It detects almost all cases of this class (sensitivity = 0.96). It distinguishes them very well from other classes (AUC = 0.95 and specificity = 0.94). NPV at level 1 means that it practically never assigns a different class to cases where there was No injury.
When it comes to the class in which the damage was sustained, the tree performs averagely. Sensitivity (0.7) indicates that it detects less than 70% of actual cases. The slightly higher specificity (0.75) and AUC measure (0.77) show that the model performs well in distinguishing this class from the others, but there is room for improvement. A very big plus is the model’s high PPV (0.92), which indicates that a very small percentage of predictions are false positives. However, the very low NPV 0.36 shows that the vast majority of negative predictions are incorrect.
The
Figure 4 for the decision tree model shows that the main factors influencing the injuries sustained by the motorcyclist are
Passenger presence—As in the case of multinomial logistic regression, in a decision tree, the highest value indicates that the presence of a passenger on a motorcycle is the strongest single factor influencing the probability outcome. This may be due to changes in the dynamics of the vehicle associated with increased weight and a shift in the centre of gravity, which is crucial when riding a motorcycle. Inappropriate passenger behaviour may be a risk factor, but the presence of a passenger may also have a positive effect on the driver’s behaviour, increasing their attentiveness on the road as a result of feeling responsible for another person.
Number of lanes—The characteristics of the road (e.g., single-lane vs. multi-lane) prove to be an extremely important factor for the decision tree. This may reflect differences in the speeds reached on different types of roads, the types of manoeuvres, and the risk of an accident occurring and its consequences.
Vehicle overturning—Whether or not a motorcycle has overturned is a strong, direct indicator of the dynamics of the accident and correlates strongly with the severity of injuries.
Time [H]—The exact time (rather than just the time of day, such as “day” or “night”) provides the model with precise information that can be correlated with traffic intensity, lighting conditions, or driver fatigue.
Road surface condition—Road surface condition is an important classification criterion and a factor influencing the prediction of loss of traction and the type of accident.
Driver behaviour—A broad category of behaviours proves to be an equally important factor in distinguishing between scenarios, consequences, and the level of injury in individual motorcycle accidents.
Tree collision—Although this variable had a high importance in the regression, other factors mentioned above proved to be more important in the model prediction in the decision tree. Nevertheless, the information about hitting a tree is still important, as indicated earlier, a direct collision with an undeformable obstacle such as a tree radically increases the severity of injuries to motorcyclists who are not protected by the vehicle structure.
Barrier/pole/sign collision—It indicates the risk of collision with road infrastructure. As indicated earlier, unlike collisions with trees, this variable may have less impact because road infrastructure is increasingly made of deformable elements to minimise the risk of injury in the event of an accident, but it is still a highly important factor.
Latitude—The variable related to geographical location may reflect regional differences in terrain, road layout, infrastructure, and the resulting driving style.
Traffic lights status—The presence or failure of headlights may affect the driver’s behaviour and decisions, and thus the injuries sustained.
3.4. Random Forest
The confusion matrix and quality of classifier of fandom forest are presented in
Table 6 and
Table 7, respectively. The accuracy of the prediction of the random forest on the test set is equal to 76.52%.
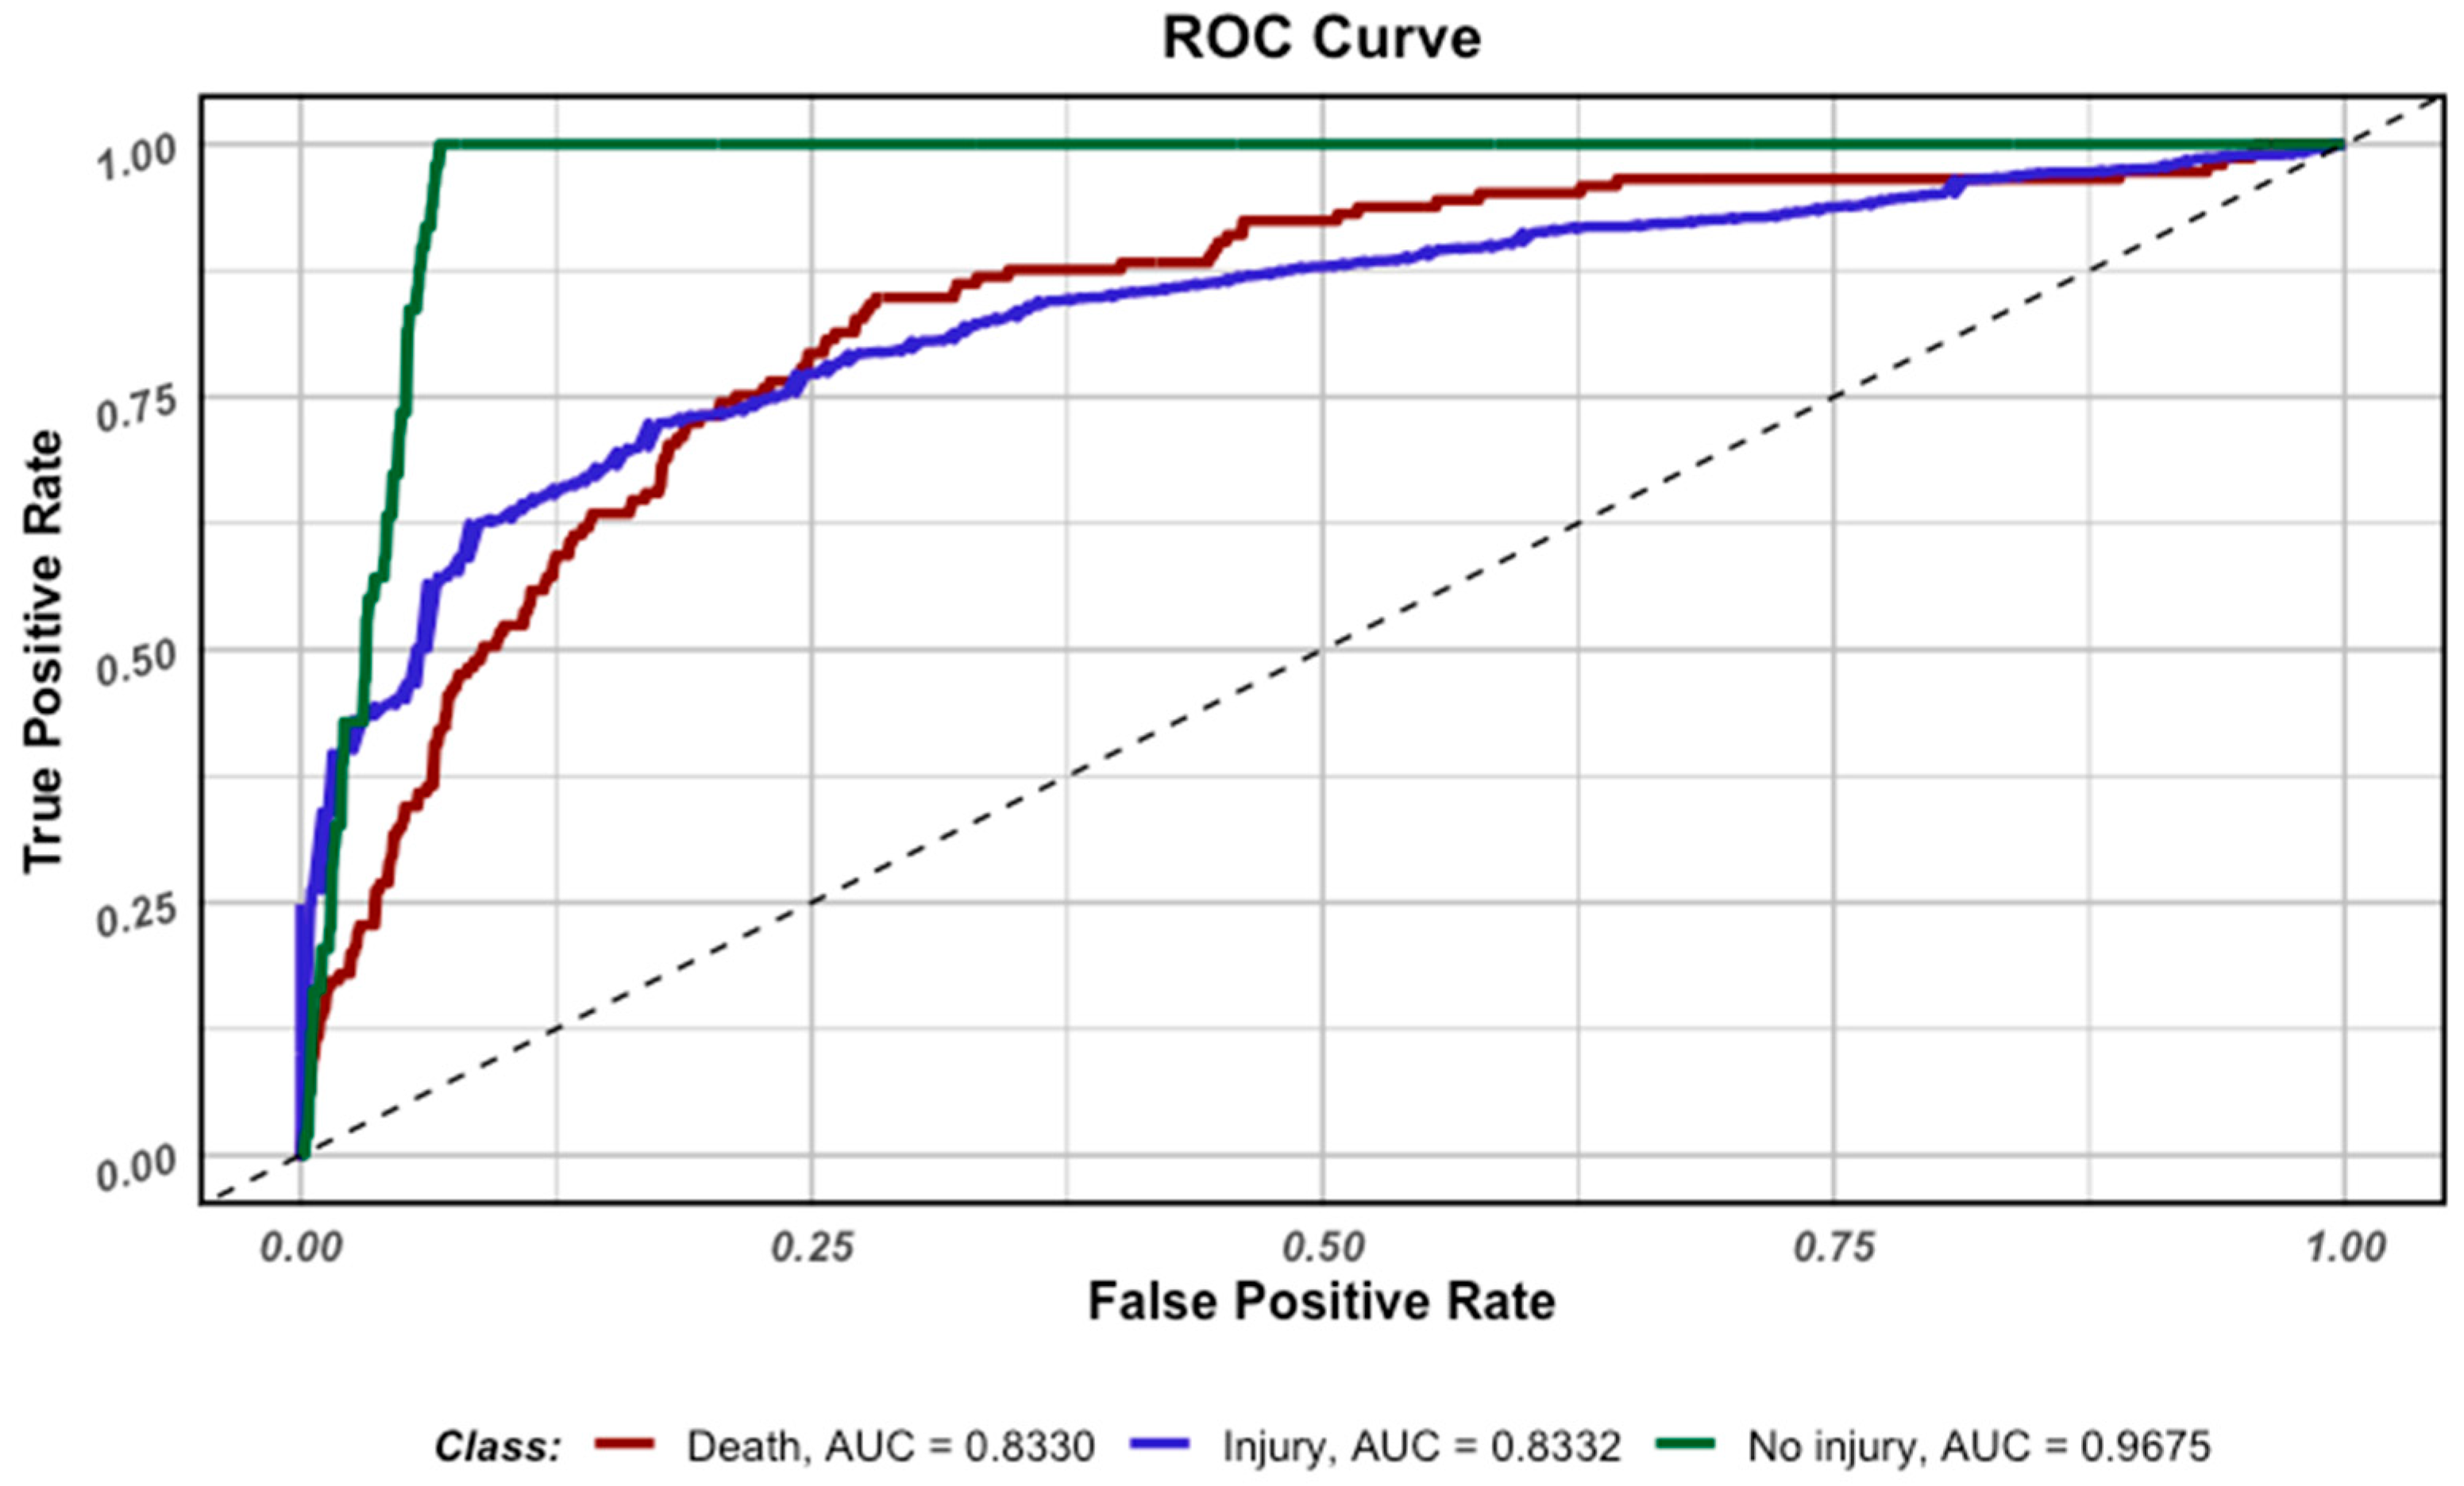
Figure 5 shows the ROC curves for each class, but
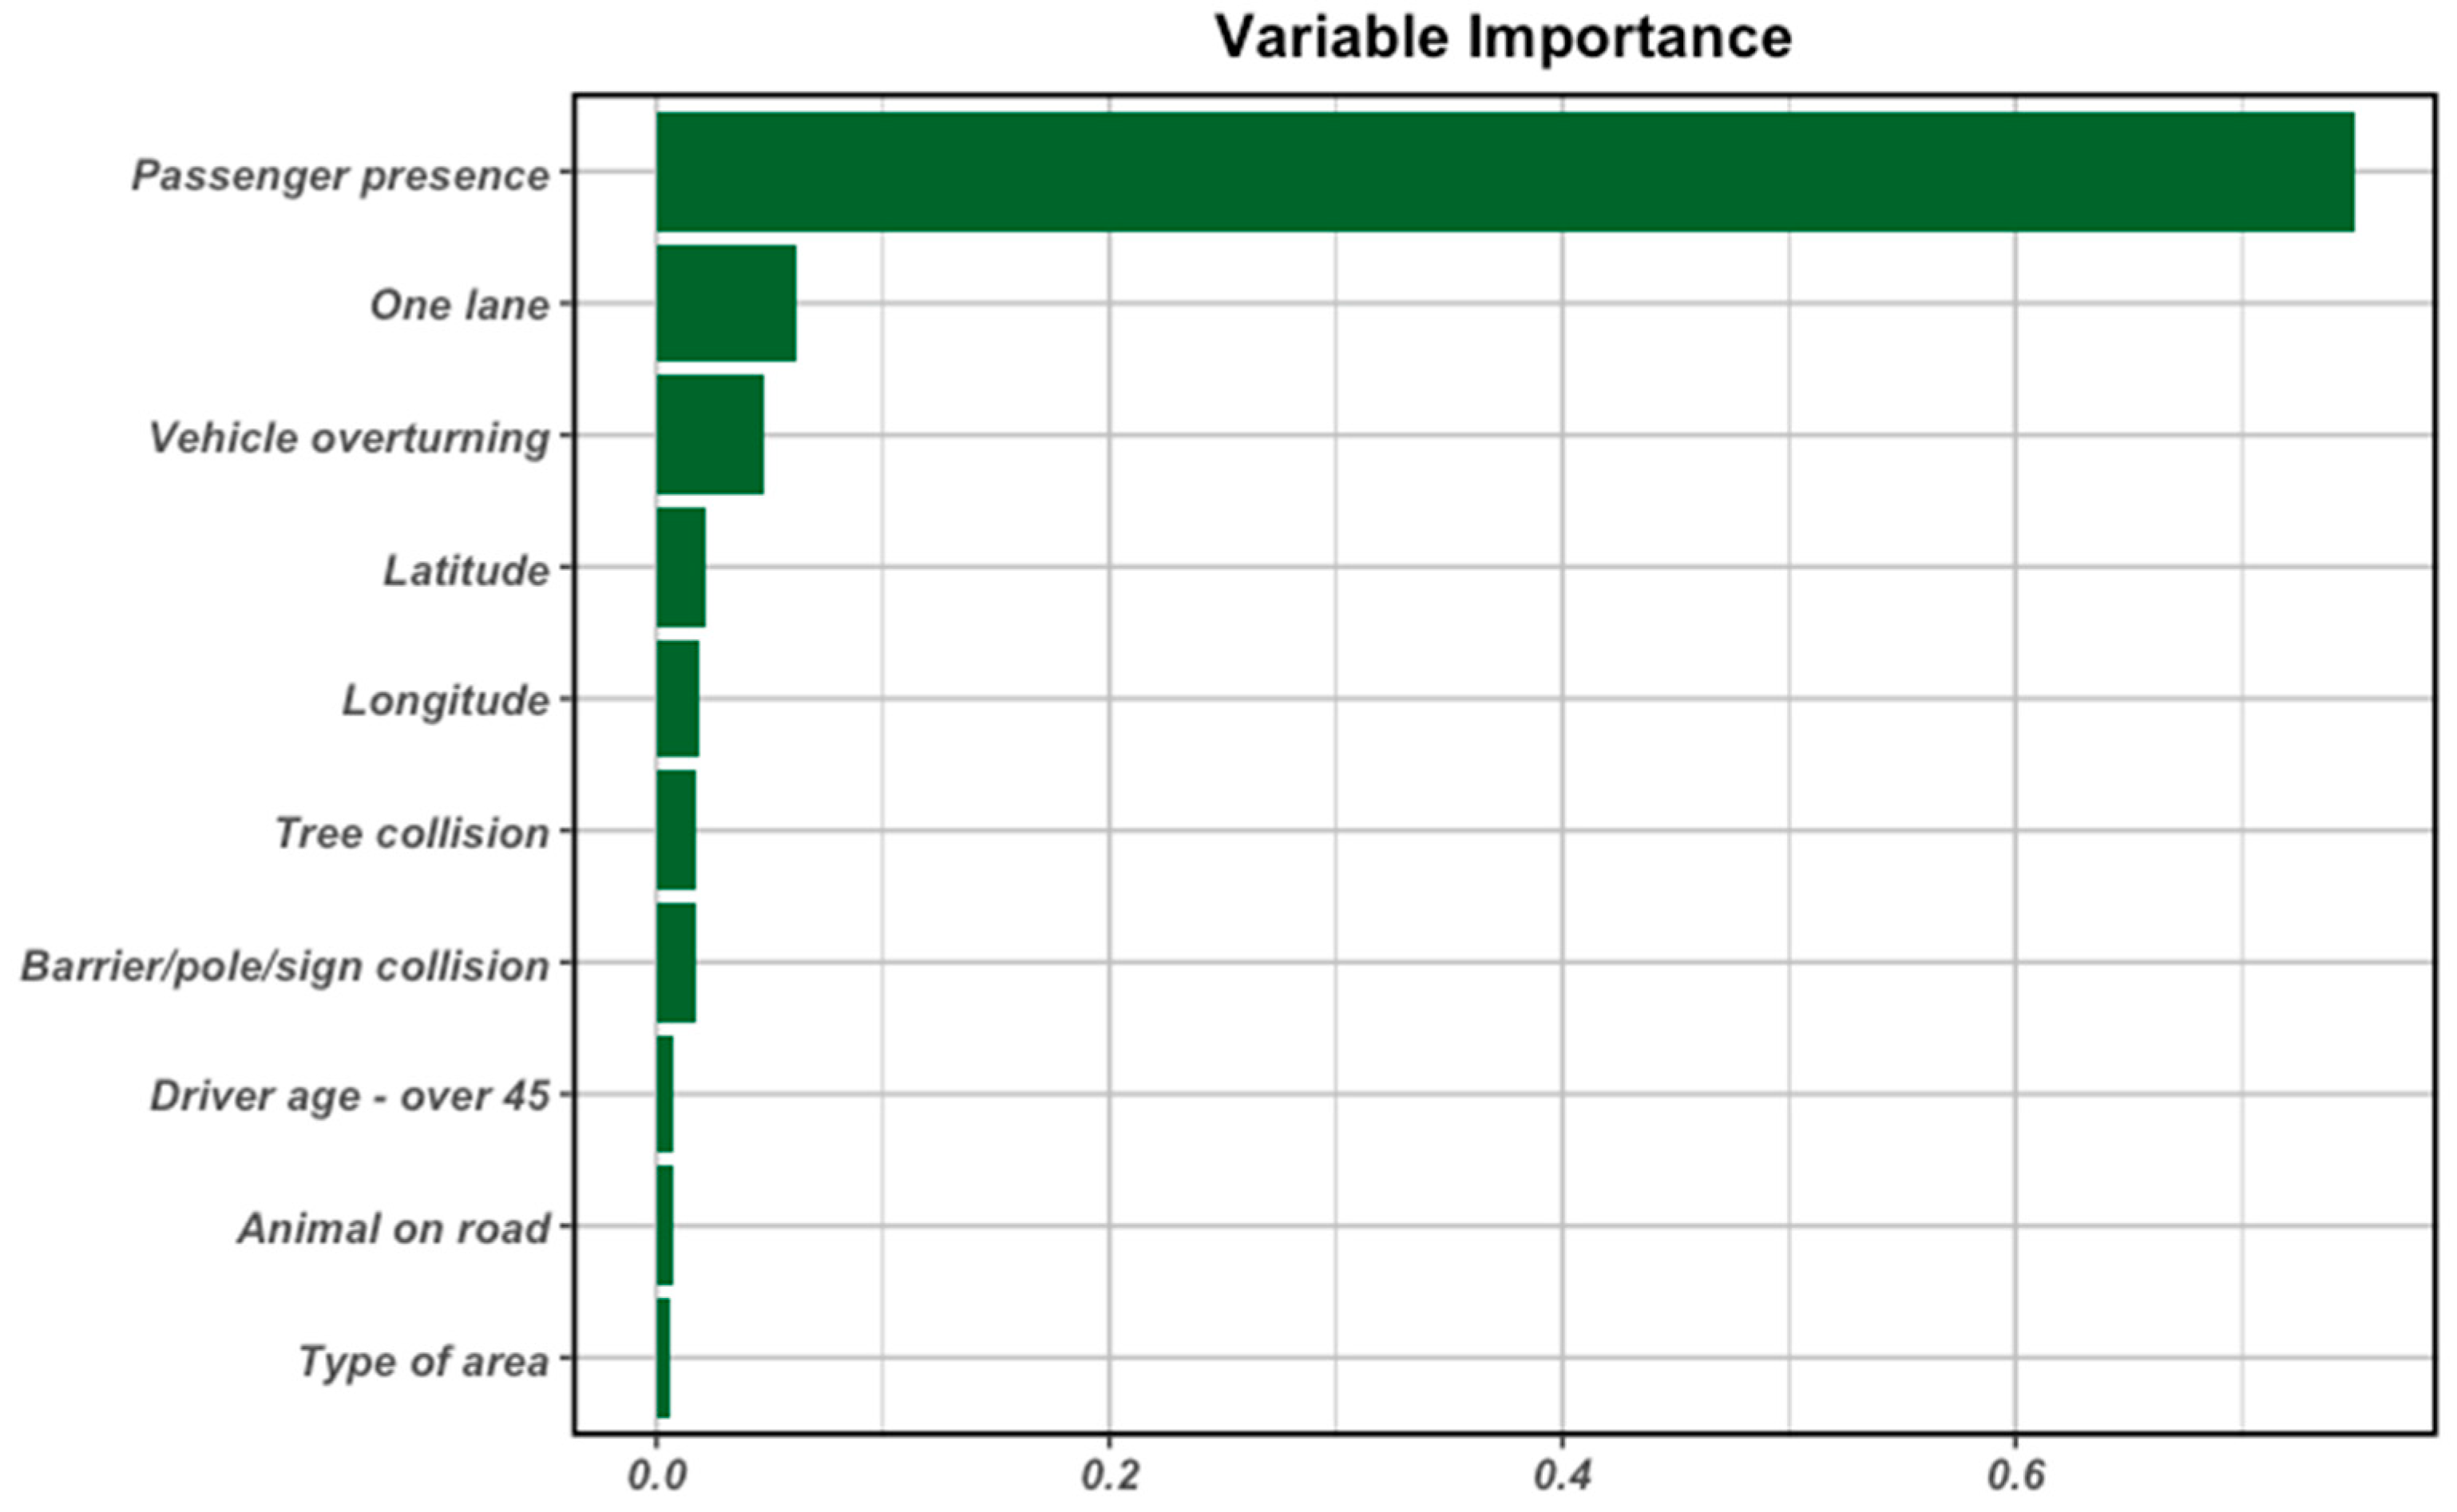
Figure 6 presents the ten most important variables used in the classifier based on random forest.
The random forest detects approximately 79% of actual cases of the Injury class (sensitivity = 0.79). The vast majority of predictions in this class are accurate (PPV = 0.92). The AUC measure is high (0.83), indicating good ability to distinguish this class. However, specificity is moderate (0.69), so the model often predicts damage where there is none. The low negative prediction value (0.43) only confirms that the model is wrong in most negative predictions.
In cases of death, the model performs poorly in predicting them (sensitivity = 0.57), and 60% of predictions are false positives (Pos Pred Value = 0.4), so the model is more often wrong than right. However, the high specificity (0.86) and very high negative predictive value (0.93) indicate that the model is very good at predicting the absence of death in the vast majority of cases. The AUC measure of 0.83 indicates a fairly good ability to separate deaths from other classes.
No injury for the model is a relatively unproblematic class. High sensitivity (0.94) and specificity (0.94) indicate that it almost perfectly distinguishes cases without injury from the rest. Negative predictive value is at an almost perfect level, indicating that there are practically no cases where a negative prediction is false. The incredibly high AUC (0.97) confirms that the model has an excellent ability to separate this class. However, the relatively low PPV (0.42) shows that most positive predictions are false.
Figure 6 for the random forest model shows that the main factors influencing the injuries sustained by the motorcyclist are
Passenger presence—Once again, this is the most important variable, with a significant advantage over other predictors. This model clearly confirms earlier findings that the presence of a passenger is the strongest predictor of the severity of injuries sustained. As indicated earlier, this may be due to changes in vehicle dynamics associated with increased weight and a shift in the centre of gravity, which is crucial when riding a motorcycle. Inappropriate passenger behaviour may be a factor that increases the risk, but the presence of a passenger may also have a positive effect on the driver’s behaviour, increasing their attentiveness on the road as a result of feeling responsible for another person.
Latitude and Longitude—Two variables that make up geographical coordinates. This means that geographical location can be of fundamental importance to the consequences of an accident. Geographical location can reflect regional differences in terrain, road layout (e.g., roads with many horizontal and vertical bends), infrastructure, and the resulting driving style.
Time [H]—The precise time of the incident provides accurate information that can be correlated with traffic intensity, lighting conditions, or driver fatigue, which may influence the type of accident and its consequences.
Number of lanes—Road characteristics are a significant risk factor. As indicated earlier, this may reflect differences in speeds reached on different types of roads, types of manoeuvres and, consequently, the risk of an accident occurring and its consequences.
Tree collision—Hitting a tree is once again a significant factor in determining the level of injury sustained in a single motorcycle accident. As indicated earlier, a direct collision with an undeformable obstacle, such as a tree, radically increases the severity of injuries to motorcyclists, who are not protected by the vehicle’s structure.
Barrier/pole/sign collision—Again, this variable is slightly less important than hitting a tree. This may be because road infrastructure is increasingly made of elements that are susceptible to deformation in order to minimise the risk of potential injuries. However, the importance of these variables is similar.
Vehicle overturning—The fact that a motorcycle has overturned is a strong, direct indicator of the dynamics of the accident and correlates strongly with the severity of injuries.
Driver age—Younger drivers are more prone to reckless driving, and when combined with a lack of experience, this becomes a factor influencing the severity of injuries sustained. The driver’s experience, measured by the number of kilometres driven, seems to be more important, but such data was not available in the dataset.
Driver behaviour—The driver’s behaviour was included in the list of the most important predictors, but it is less significant than the objective characteristics of the traffic incident (where, when, and with whom).
3.5. XGBoost
The confusion matrix and quality of classifier based on XGBoost are presented in
Table 8 and
Table 9, respectively. The accuracy of the XGBoost model on the test set is 72.05%.
Figure 7 shows the ROC curves for each class, but
Figure 8 presents the ten most important variables used in the classifier.
Results in
Table 9 and
Figure 7 indicate the flawless sensitivity of the XGBoost model for the No injury class, indicating that it detects all actual cases. With a remarkably high area under the curve (AUC = 0.97) and a specificity of 0.93, it achieves outstanding distinguishing ability for it. A NPV of 1 indicates that the model never speculated on a class other than the actual one. Unfortunately, more than half of the predictions are false positives (PPV = 0.41), so the model more often predicts no damage where damage actually occurred.
In the case of Death, the model has a strong sensitivity of 0.74, which means it detects almost 75% of actual deaths, while maintaining a reliable discriminatory ability (AUC = 0.83, specificity = 0.79).
For injuries, the sensitivity of the model is 0.7, which means that its predictions detect approximately 70% of actual cases. The very high positive prediction value of 0.95 means that the model is practically never wrong and only about 30% of predictions are false positives. The high specificity (0.84) and AUC value (0.83) show that the model distinguishes the injury class from the others very well.
The
Figure 8 for the XGBoost model shows that the main factors influencing the injuries sustained by the motorcyclist are
Passenger presence—Once again, this is the variable of highest importance, which only confirms that the presence of a passenger in single motorcycle accidents is significant for the level of injuries sustained. As explained earlier, this may be due to a change in the dynamics of the vehicle associated with increased weight and a shift in the centre of gravity, which is crucial when riding a motorcycle. Inappropriate behaviour on the part of the passenger may be a factor increasing the risk, but the presence of a passenger may also have a positive effect on the driver’s behaviour, increasing their attentiveness on the road as a result of feeling responsible for another person.
One lane—Narrow, single-lane roads pose a particularly high risk to motorcyclists, which may be associated with less room for manoeuvre, a higher likelihood of head-on collisions and a different nature of traffic.
Vehicle overturning—The fact that a motorcycle has overturned is a strong, direct indicator of the dynamics of the accident and correlates strongly with the severity of injuries.
Latitude and Longitude—Two variables that make up geographical coordinates. This means that geographical location can be of fundamental importance to the consequences of an accident. Geographical location can reflect regional differences in terrain, road layout (e.g., roads with many horizontal and vertical bends), infrastructure, and the resulting driving style.
Tree collision—A direct collision with an undeformable obstacle such as a tree radically increases the severity of injuries to motorcyclists, who are not protected by the vehicle structure.
Barrier/pole/sign collision—As discussed earlier, unlike events involving collisions with trees, this variable may have less impact because road infrastructure is increasingly made of deformable elements to minimise the risk of injury in the event of an accident, but it is still a highly important factor.
Driver age—over 45—This age group faces specific risks (e.g., slower reactions, different driving style, greater susceptibility to injury). This also confirms the trend observed in European studies [
51], which indicates that the average age of motorcyclists has been steadily increasing over the years, and that more middle-aged drivers are now dying than in 2011.
Animal on road—In the case of a motorcycle, even a small animal on the road can have a significant impact on the outcome of an accident. The sudden presence of an animal on the road leads to sudden, uncontrolled manoeuvres and, consequently, to accidents with serious consequences.
Type of area—The classification of the area (built-up/unbuilt) is one of the factors where, as statistics show, nearly 70% of accidents involving motorcycles occur in built-up areas, but less than half of motorcyclists die in them. This is related to the nature of traffic, its density and, above all, the speeds reached, which are lower in built-up areas, meaning that the consequences of a possible accident are less serious.
3.6. Neural Networks
The injury severity classification was based on neural networks which were trained on the learning set. The architecture of NN and RNN are presented in
Table 10 and
Table 11, respectively. The tables show the type and order of layers for NN and RNN respectively, the shape of the output data, the number of trainable parameters, and the activation functions used in each layer. For NN and RNN (
Table 10 and
Table 11), the last dense layer is defined as a softmax function; thus, the relationship between inputs and outputs is not linear. On the other hand, only the predictors for latitude and longitude were numerical, and the remaining variables were encoded as binary using one-hot encoding. The data presented shows unbalanced classes, so an early stopping technique is not the optimal approach. The total number of parameters including weights and biases of all layers for the NN presented in
Table 10 is 9053, but the total number of parameters of the RNN presented in
Table 11 is 153,493.
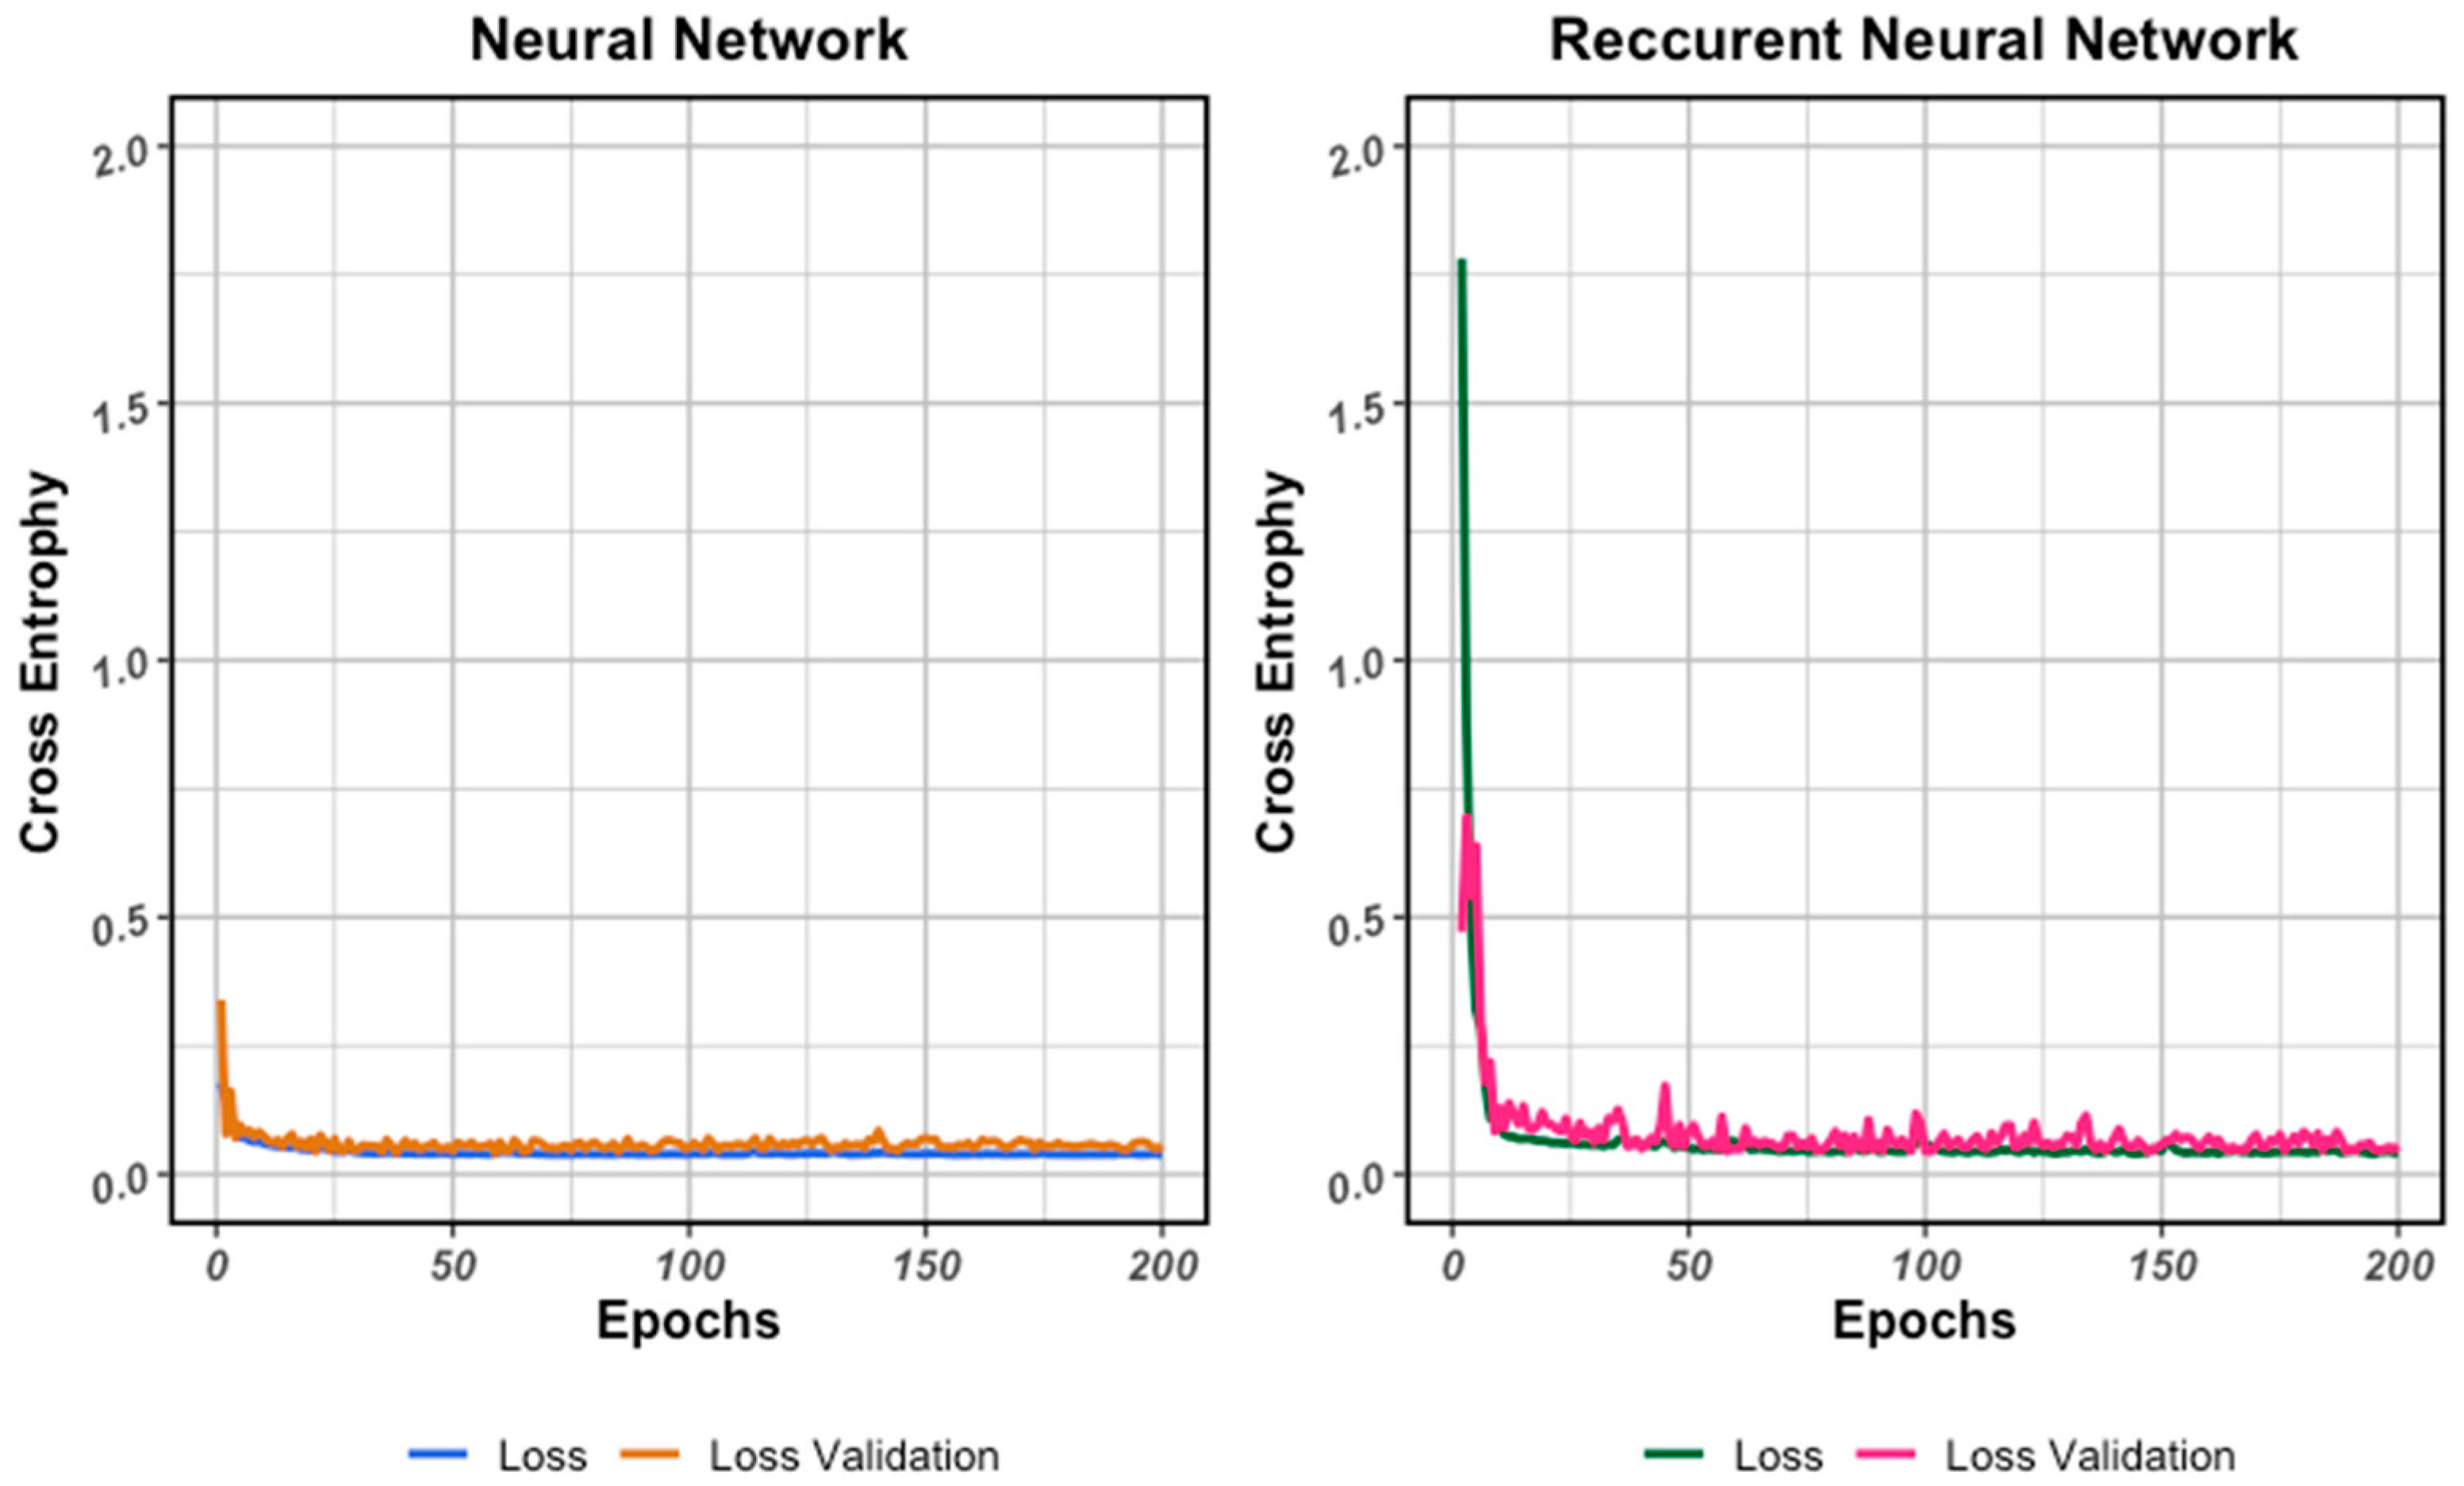
To estimate weights and biases for each neural network, 200 epochs were used. Also, during training, validation was applied on a set containing (10% batch). For each network, the batch size during the training process was approximately 1% of the training set. To avoid overfitting, the number of 200 epochs was a compromise between the batch size and the classification performance on the training set. Cross-entropy was selected as objective function for the classification model based on NN and RNN and the accuracy was chosen as a verification metric.
Figure 9 shows the cross-entropy and accuracy values during the training process for neural networks.
Classifier-based neural network
For each neural network type the validation was performed on the test set.
Table 12 present the confusion matrix and
Table 13 the evaluation of the recognition quality metrics of the NN-based classifier on the test set for the three classes: Death, Injury, and No injury. From
Table 12, we can see that the model correctly predicted 814 out of 1052 instances. Accuracy of prediction of NN model on test set is equal 77.38%. The model performed best in identifying Injury cases, correctly classifying 690 out of 754 actual injuries. However, it often misclassified Death cases as Injury, correctly identifying only 80 out of 197 actual Deaths. For the No injury category, the model correctly predicted 44 out of 101 cases, showing lower precision due to false predictions. Overall, the classifier based NN demonstrates strong performance for Injury predictions but has difficulty distinguishing between Death and Injury cases and between No injury and Injury cases.
Based on
Table 13, the NN classification model demonstrates strong overall predictive ability for motorcycle crash outcomes, but it has notable differences between them.
The model shows moderate sensitivity (0.55) and high specificity (0.87) for Death cases, meaning it correctly identifies just over half of actual deaths while effectively ruling out the vast majority of non-death cases. However, the positive predictive value of 0.41 indicates that around 59% of death predictions are false positives. The area under the curve (AUC) value of 0.82 indicates fairly good discriminatory ability. When it comes to Injury outcomes, the model performs particularly well, detecting most injury cases (sensitivity = 0.8) and provides strong reliability due to a very high positive predictive value (0.92). Although the specificity is moderate (0.67), the AUC of 0.82 still indicates robust overall performance for this class. The model achieves the highest overall scores for the No injury category, with both sensitivity (0.9) and specificity (0.94) at excellent levels. The AUC of 0.97 confirms its outstanding ability to distinguish no-injury cases. The positive predictive value, however, remains relatively low (0.44), likely reflecting the low prevalence of no-injury cases in the dataset. Overall, the model is the most effective at identifying injury and no-injury cases, with slightly lower precision for predicting deaths. Balanced accuracy suggests reliable performance across all outcome classes.
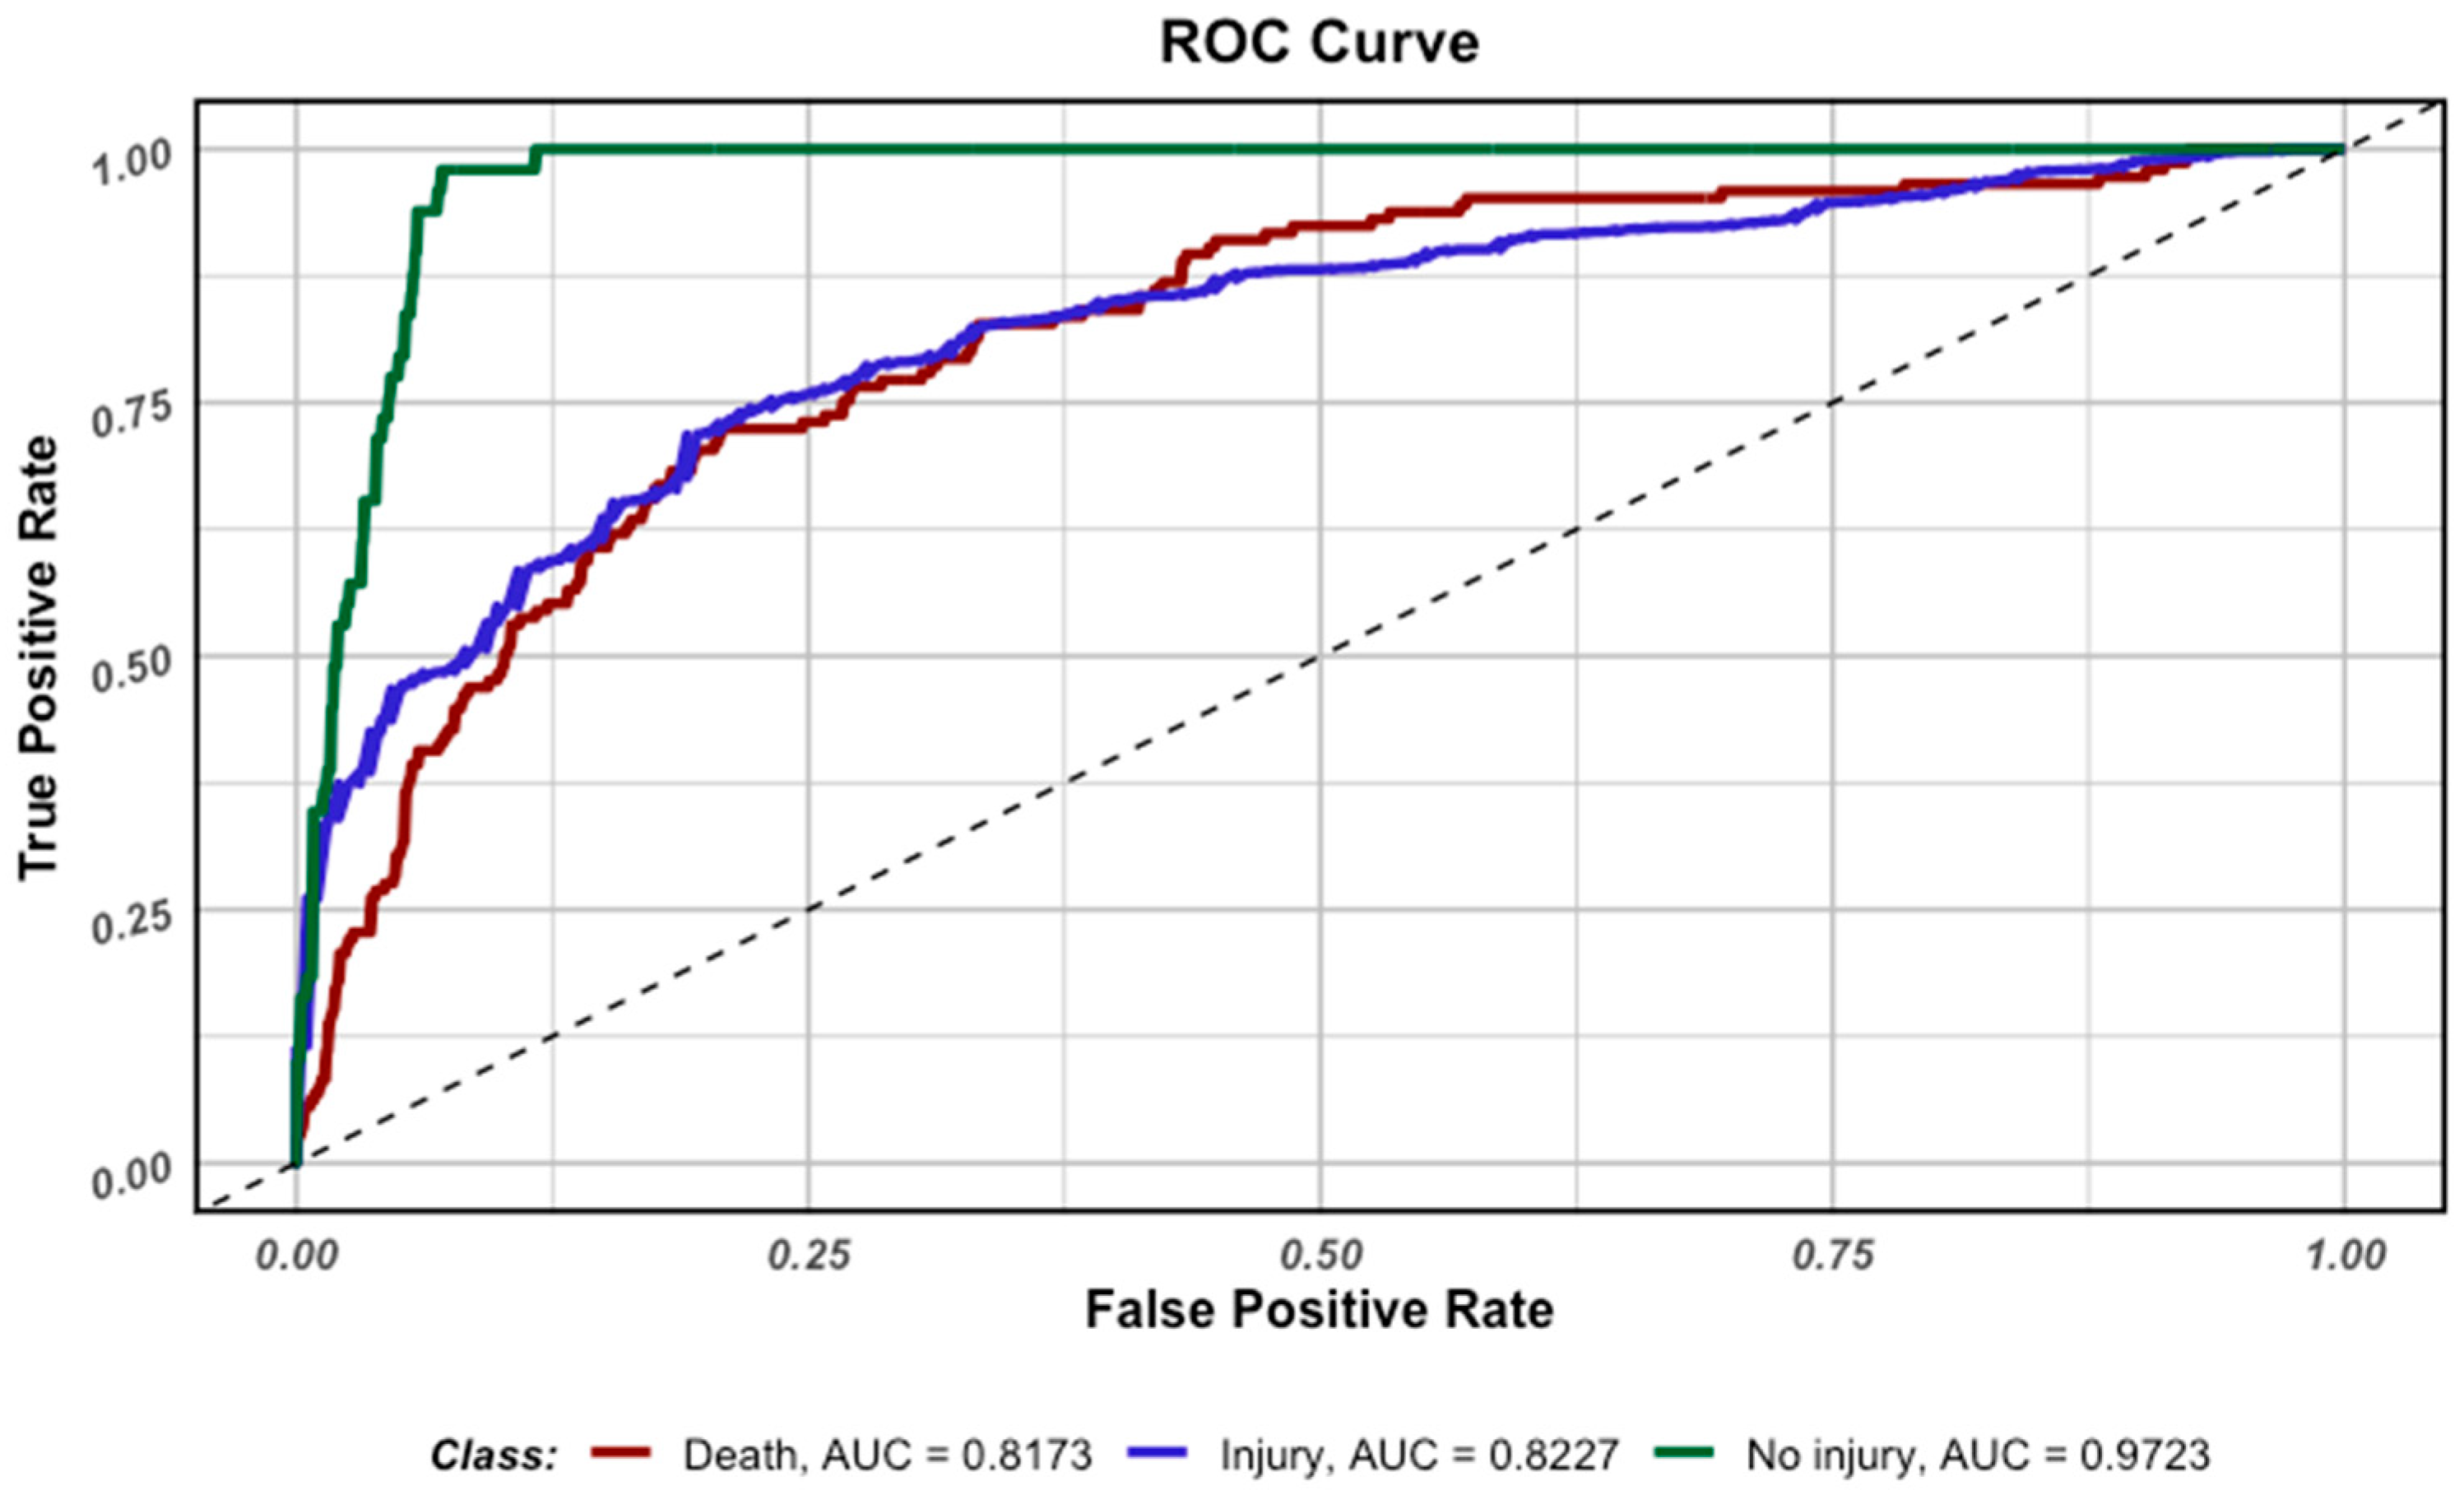
The
Figure 10 shows the Receiver Operating Characteristics curves for each injury severity class, estimated from the test set. The AUC values also indicate reliable performance across all classes. The biggest AUC value (0.97) is obtained for the No injury class, although this class had only 101 instances in the test set. In contrast, the smallest one equals 0.82 is obtained for the Death class, although the test set contained only 197 instances in comparison to 1052 cases.
Classifier-based Recurrent Neural Network
Table 14 presents the confusion matrix and
Table 15 the evaluation of the recognition quality metrics of RNN-based classifier on the test set for the three classes: Death, Injury, and No injury. From
Table 13, we can see that the model correctly predicted 837 out of 1052 instances. The accuracy of prediction of the RNN model on the test set is equal 79.56%.
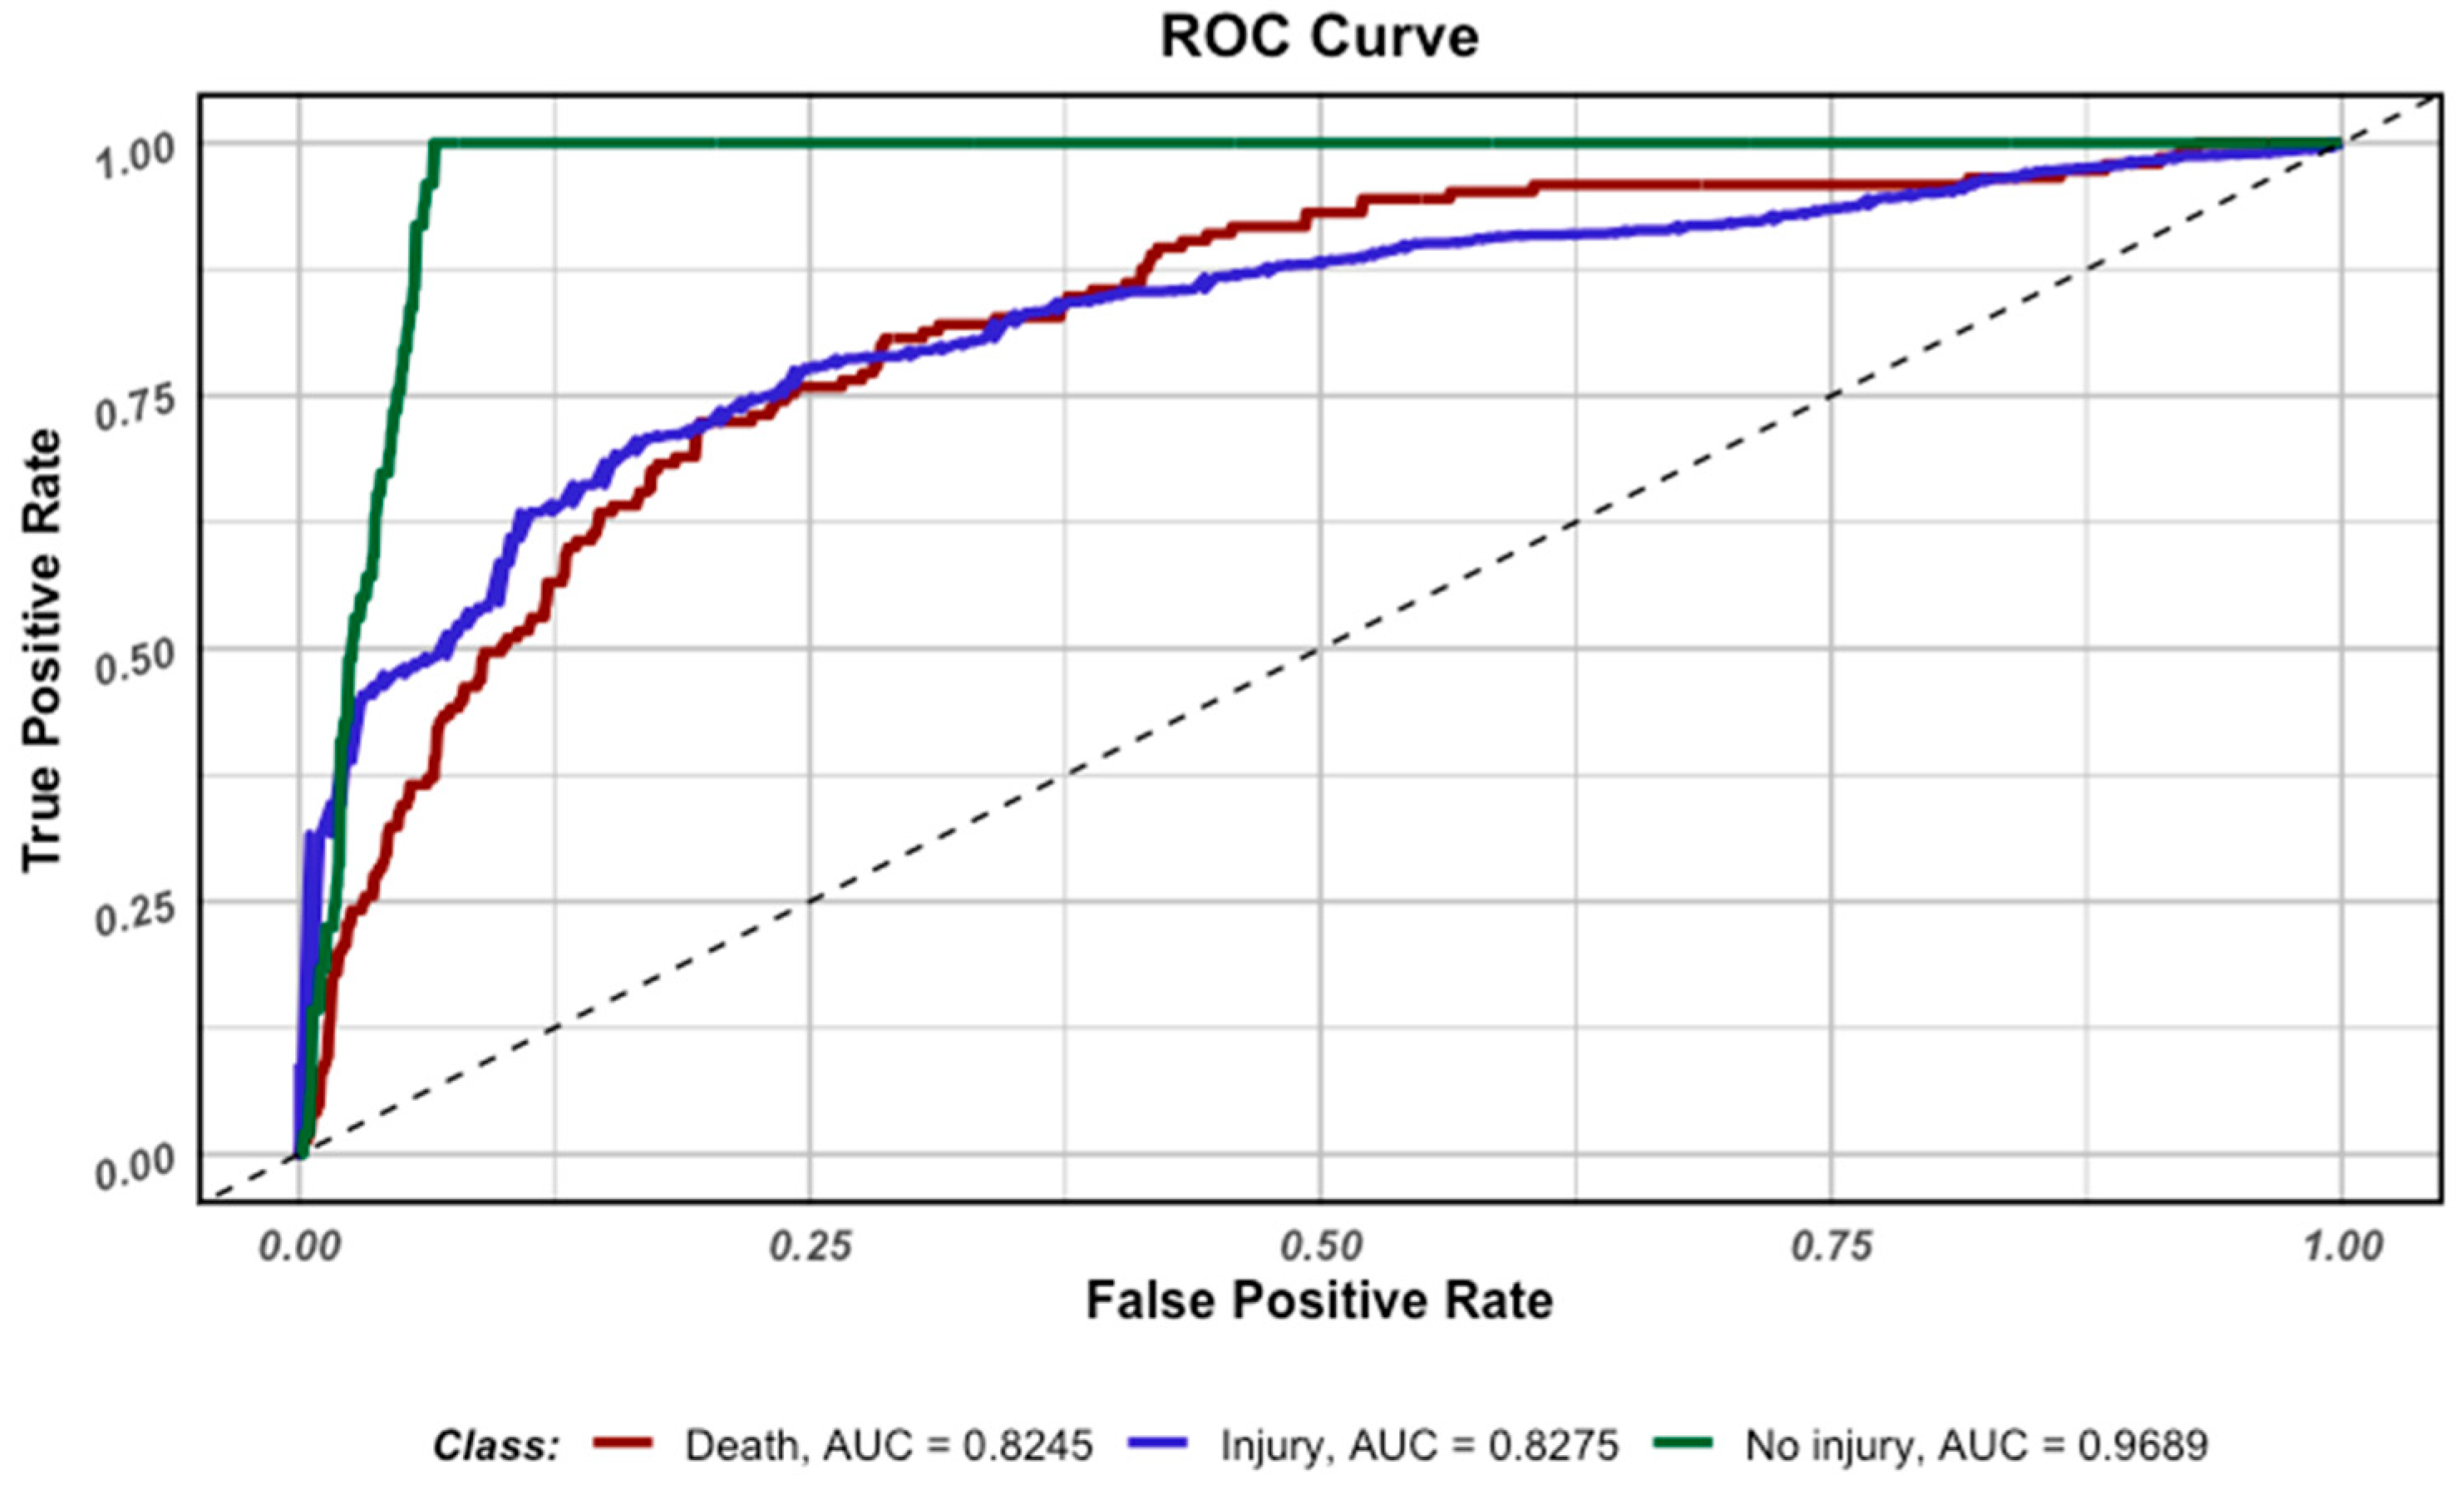
The Recurrent Neural Network classification model demonstrates solid predictive performance across all outcome classes. For the Injury outcomes, it provides a fairly accurate predictive ability, with a high sensitivity (0.84) and even higher positive predictive value (0.9), suggest that its predictions identify about 80% of injury incidents, with a negligible amount of false positives (0.09). An AUC of 0.83 confirms its effectiveness in predicting this class. The model identifies 100% of No injury cases correctly (sensitivity = 1) and its very high specificity (0.93) with excellent AUC (0.97) indicate that it has excellent distinguishing ability for this class. However, the moderate positive predictive value (0.42) suggests that approximately 58% of predictions are false positives. In the case of the Death class, the model also has an excellent discriminatory ability (specificity = 0.92 and AUC = 0.82). However, it detects only 44% of the actual death cases (sensitivity = 0.44), and a positive predictive value of 0.47 indicates that over 50% of predictions are false positives.
Figure 11 presents the Receiver Operating Characteristics curves for each class of injury severity estimated on the test set.
Although the literature suggests that accidents in rural areas are more serious, this factor did not prove particularly significant in classifying injuries across the models. From machine learning models, we see that the factor ‘urban-rural stratification’ has no significant influence on single-vehicle accidents (specific accidents on roadways!), and only the factor ‘area type’ (built-up/unbuilt) has been identified as an essential variable by the XGBoost model, with a very low p-value. Among the factors that emerged, one was consistent with the literature. In the decision tree, road surface condition was among the critical factors, which may reflect the fact that it is often worse in rural areas due to lower financial resources. All models included tree collisions, which are more common in rural areas, where there are more trees along roads, and they are significantly larger.
4. Discussion
This study employed five machine learning algorithms to identify risk factors associated with injury severity in single-motorcycle accidents using a dataset of 5253 incidents. The analysis revealed consistent patterns across multiple modelling approaches, while also highlighting methodological challenges inherent in predicting severe outcomes from observational accident data. We discuss our principal findings, compare them with existing literature, address limitations, and outline implications for road safety practice and future research.
4.1. Principal Findings
Passenger presence was the most important factor in predicting injury severity across all five algorithms: multinomial logistic regression, classification tree, random forest, XGBoost, and NNs (
Figure 2,
Figure 4,
Figure 6 and
Figure 8). The fact that this finding holds true across a range of methods, each using different measures of variable importance, suggests that it is a strong link and not just a model-specific artifact. No other predictor exhibited similar significance across all models, highlighting the unique influence of passenger presence in this dataset.
Road infrastructure and crash configuration variables also exhibited strong and consistent associations with injury outcomes. Single-lane carriageways and vehicle overturning events repeatedly ranked among the top predictors (
Figure 4,
Figure 6 and
Figure 8). Collision with rigid objects, particularly trees, showed substantial importance across models, whereas impacts with poles, signs, or barriers—though still relevant—demonstrated relatively lower contributions. Road surface condition, specifically contaminated or low-friction surfaces, was consistently associated with increased injury severity.
Temporal and spatial factors contributed meaningfully to model predictions. The precise time of day (Time [H]) appeared among important predictors in multiple models, with early-morning hours (approximately 05:00) showing elevated association with severe outcomes in the multinomial logistic regression model (
Figure 2). Geographic coordinates (latitude and longitude) carried notable importance in tree-based models (
Figure 4,
Figure 6 and
Figure 8), likely capturing unobserved regional variation in road characteristics, terrain, traffic patterns, and emergency response infrastructure.
Model performance patterns were broadly consistent across algorithms. The “No injury” class proved most distinguishable, with sensitivities ranging from 0.90 to 1.00 and AUC values between 0.95 and 0.97, coupled with specificities around 0.93–0.94. However, positive predictive values remained modest (0.41–0.44), a typical consequence of low prevalence (4.7%) even when discrimination performance is excellent. For the “Injury” class, positive predictive values were consistently high (0.91–0.95), indicating that when models predicted injury, they were usually correct. However, sensitivity varied by algorithm (0.67–0.84), meaning a fraction of actual injuries were misclassified. The “Death” class presented the greatest classification challenge: sensitivity ranged from 0.44 (RNN) to 0.74 (multinomial logistic regression and XGBoost), with positive predictive values between 0.32 and 0.47. Despite high specificities (0.75–0.92) and respectable AUC values (0.75–0.83), the models frequently misclassified fatal cases as injuries, or vice versa.
The passenger presence factor is one of the most important, because mainly in the absence of a passenger, no drivers were reported uninjured, approximately 85% were injured, and 15% died as a result of the accident. Motorcycle drivers without passengers take more risky manoeuvres on the road. It follows from the above that the presence of a passenger increases the driver’s sense of responsibility.
4.2. Comparison with the Existing Literature
The data comes from PRSO and refers only to individual motorcycle accidents in Poland. Our discovery that the presence of passengers is a strong predictor of injury severity is in line with other research that shows that behavioural and vehicle-loading factors have a big impact on crash outcomes [
10,
11,
12,
21]. Having a passenger in the car could change the weight distribution and dynamic response of the vehicle, which could make it less stable and harder to control, especially during emergency manoeuvres. Yet the direction and size of this effect may depend on the situation: having a passenger could mean either a higher risk (because of changes in how the vehicle works or the rider being distracted) or a lower risk (because they feel more responsible and are more careful). We cannot figure out which of these competing mechanisms is causing what with our observational design. To do that, we would need to use experimental or quasi-experimental methods.
The strong link between single-lane carriageways and the severity of injuries is in line with what has already been shown: limited road geometries increase the risk and severity of crashes [
16,
22]. In the same way, the importance of vehicles overturning is supported by research that shows loss-of-control situations are a major cause of serious injuries to motorcyclists [
6,
17]. We noticed that hitting trees is worse than hitting poles, signs, or barriers. This is probably because trees are more rigid and modern infrastructure uses more forgiving roadside hardware [
6,
17].
There is a lot of research on traffic safety that shows a link between dirty or low-friction road surfaces and more serious accidents [
10,
16,
21]. Our results underscore the significance of surface condition as a modifiable risk factor subject to engineering interventions. The patterns we saw in our data, especially the higher importance of early-morning hours, are in line with research that links circadian fatigue, changing lighting conditions, and unusual traffic patterns to more serious crashes [
11,
15]. The fact that geographic coordinates are important in our models probably has to do with how different factors are in different places, like the terrain, the shape of the roads, the level of enforcement, and the availability of trauma care, as shown in earlier research [
11,
15,
27].
4.3. Interpretation of Rural and Urban Contexts
The current literature consistently indicates that motorcycle crash characteristics, risk factors, and injury patterns exhibit significant disparities between rural and urban environments [
16,
19,
32,
33,
34]. Rural crashes are usually worse or deadly. They often happen at high speeds, when one vehicle goes off the road, or when two vehicles hit each other head-on. They also happen when there is not much light. Urban crashes happen more often, but they are usually less serious. They often happen at intersections, at lower speeds, and when more than one vehicle is involved [
4,
19,
22].
A significant limitation of our study is that our analysis did not stratify results by area type (urban vs. rural). Consequently, although we identified important predictors overall, we cannot determine from our data whether these factors operate differently or carry different weights in rural versus urban environments. The variable importance rankings presented in
Figure 2,
Figure 4,
Figure 6 and
Figure 8 reflect aggregate patterns across all accident locations in the dataset.
Nevertheless, the factors we identified—passenger presence, road configuration, surface condition, temporal patterns, and collision types—are plausibly relevant to both settings, though their relative contributions and the optimal interventions to address them may differ by context. Future research should explicitly test whether the predictive structure identified here varies systematically between rural and urban crashes.
4.4. Methodological Considerations
The multi-model approach utilized in this study yielded convergent evidence regarding essential determinants while uncovering class-specific performance trade-offs. Ensemble methods (random forest and XGBoost) and multinomial logistic regression provided consistent discrimination between “Injury” and “No injury” classes, while gradient boosting and logistic regression attained the highest sensitivities for “Death,” although they exhibited low positive predictive values at standard classification thresholds (
Table 2 and
Table 8). These patterns indicate possible advantages from threshold optimization and cost-sensitive calibration to realign false-negative and false-positive rates in accordance with operational priorities [
44,
50].
The observed class imbalance—Death (13.8%), Injury (81.6%), No injury (4.7%)—likely contributed to the modest positive predictive values for minority classes despite strong discrimination (high AUC). We did not apply class-balancing techniques (e.g., class weighting, SMOTE oversampling, and cost-sensitive learning) in the present analysis. Future work should systematically evaluate whether such approaches improve minority-class detection while maintaining overall discrimination [
37,
44].
The recurrence of specific predictors across distinct algorithms—particularly passenger presence, lane configuration, overturning, tree collision, surface condition, and temporal/spatial variables—increases confidence that these associations reflect genuine patterns in the data rather than model-specific idiosyncrasies. Objective descriptors of roadway and environmental conditions generally exhibited greater importance in tree-based models than rider behaviour categories, complementing prior work integrating behavioural and infrastructural risk components [
1,
10,
16,
21,
26]. Summarising the classifiers, we evaluated their performance using the following metrics: Accuracy,
,
, and
, which are summarized in
Table 16.
Overall, the results show that classifiers predict injury outcomes of participants in single motorcycle accidents quite well. This is due to a combination of consistently high values (≈0.83–0.88) and only moderate accuracy, , and scores. In practice, the models are generally good at predicting classes but less effective at making unambiguous decisions about classes. This is mainly due to the class imbalance of the analysed dataset. Simple models (multinomial logistic regression, decision tree) already predict the injury status of motorcyclists well, while more advanced models mainly provide incremental improvements rather than breakthrough improvements. This suggests that the current performance ceiling is due more to the characteristics of the data than to the choice of model itself.
4.5. Limitations
This study has several important limitations that should be considered when interpreting results and planning future research. Like most European accident databases, our dataset likely underreports minor injuries [
35], which may bias prevalence estimates and affect model calibration, particularly for the “No injury” class. Key behavioural variables known to influence injury severity—including helmet use, blood alcohol concentration, and vehicle speed at impact—were not available in the dataset, preventing us from assessing their contributions relative to the environmental and infrastructural factors we did measure. Additionally, exposure data (e.g., vehicle-kilometres travelled by motorcyclists) were unavailable, precluding calculation of true risk rates or adjustment for differential exposure across contexts.
This analysis, as an observational study utilizing predictive classification models, identifies correlations between predictors and outcomes but is unable to establish causal relationships. Observed associations may indicate direct causal effects, confounding by unmeasured variables, or reverse causation. The significant correlation between passenger presence and injury severity may result from (a) passengers directly elevating risk by altering vehicle dynamics, (b) riskier riders being more inclined to transport passengers, (c) passenger trips predominantly occurring on higher-risk roads or in more hazardous conditions, or (d) a combination of these factors. To differentiate between these explanations, it would necessitate causal inference techniques (e.g., instrumental variables, and natural experiments) or experimental frameworks that exceed the parameters of this study.
We employed a single random train–test split (80/20) rather than cross-validation, which may yield performance estimates sensitive to the particular split obtained. Although we tested five diverse algorithms, we did not systematically optimize hyperparameters through grid search or Bayesian optimization, nor did we conduct external validation on an independent dataset from a different time period or geographic region. These omissions limit our ability to assess model stability, optimal configuration, and generalizability.
Our analysis did not stratify results by area type (urban vs. rural), time period, or other potentially important subgroups, limiting our ability to draw context-specific conclusions. We did not explore interaction effects between predictors, which may be important if, for example, the effect of passenger presence differs depending on road type or time of day. We focused on discrimination metrics (AUC, sensitivity, and specificity) but did not assess calibration (agreement between predicted probabilities and observed frequencies), which is critical for operational use of predictive models. Finally, we did not conduct sensitivity analyses to assess robustness of findings to alternative modelling choices, outlier removal, or feature subsets.
4.6. Implications for Practice
Even with these problems, our results are directly useful for making roads safer. First, engineering measures that lessen the forces of crashes and lessen the effects of losing control events—like motorcycle-friendly barrier systems, clear-zone management (removing or shielding rigid roadside objects, especially trees), and road surface maintenance—are still very important for preventing injuries [
17]. Our results show how important these interventions that focus on infrastructure are.
Second, efforts to enforce the law and teach people should focus on the behaviours and conditions that are most likely to lead to problems, as shown by the literature and our variable importance analyses. We could not directly look at helmet use, alcohol impairment, or speeding in our dataset, but these are all well-known factors that make injuries worse [
3,
10,
14,
33,
34] and should stay at the top of the list of things to enforce. Since we found that early-morning hours are more dangerous, it might be helpful to focus on interventions (like better lighting and more police presence) during these times.
Third, the strong link between the presence of a passenger and the severity of the injury, no matter what the cause, suggests that rider education programs should cover the extra problems that come with riding with a passenger, such as how the vehicle behaves, how to talk to each other, and who is responsible for safety.
Fourth, practitioners should think about using different intervention strategies depending on the setting, since the literature shows that rural and urban areas have different risk profiles [
16,
19,
32,
33,
34]. In rural areas, where crashes are more likely to be deadly or serious, priorities may include better lighting on roads, better management of clear zones, median barriers, stricter speed limits, and better emergency response systems. In cities, where crashes happen more often but are usually less serious, priorities may include redesigning intersections and optimizing signals, protecting pedestrians, and strictly enforcing rules about speed, helmets, and licenses. However, we emphasize that our data did not directly test whether the risk factors we identified operate differently in these contexts; such analyses should be a priority for future research.
Finally, data system improvements that reduce underreporting (particularly of minor injuries), incorporate richer behavioural and environmental variables (helmet use, speed, alcohol, weather, and lighting), and enable linkage to exposure data would support more sophisticated predictive analytics and more precisely targeted interventions [
26,
35,
37,
44,
51].
5. Conclusions
This study systematically assessed risk factors associated with injury severity in solitary motorcycle accidents using an extensive dataset and a range of machine learning algorithms, including multinomial logistic regression, classification trees, random forests, XGBoost, and NNs. The analysis found that passenger presence was the most significant variable, consistently ranking highest across all models. Other important factors that could predict crashes were the road layout (single-lane carriageways, and overturning), the weather (contaminated surfaces, and collisions with hard objects), and the time and place of the crash (crash time, and geographic location).
Model performance demonstrated reliable classification of cases without injury, while the differentiation between fatal and non-fatal injuries remains a methodological challenge. The recurrence of key predictors across all analytical approaches supports the robustness of the findings.
The results underscore the necessity for context-specific interventions. In rural environments, technical measures such as improved road lighting, clear-zone management, and speed control are recommended. In urban areas, engineering solutions for intersection safety, pedestrian protection, and regulatory enforcement regarding licensing and helmet use are essential. The integration of advanced machine learning techniques enables the identification of critical risk factors and supports the development of targeted strategies to mitigate the consequences of motorcycle accidents.
This study is subject to several limitations. The dataset may underreport minor injuries, which can bias prevalence estimates and affect model calibration. Some relevant behavioural and environmental variables, such as helmet use, alcohol concentration, and precise speed at the time of the crash, were unavailable and could not be included in the analysis. Additionally, class imbalance—particularly the low proportion of fatal cases—posed challenges for model sensitivity and positive predictive value in minority classes.
PRSO collects, analyses, and disseminates data on road safety, including the circumstances and causes of accidents, based on police reports and other data, allowing it to identify the most common mistakes made by road users and highlight hazards and areas requiring preventive action. However, PRSO does not act as a body that legally determines the fault of the perpetrator of a specific accident. Determining fault and responsibility for a road incident is carried out as part of proceedings conducted by the police and/or law enforcement authorities (the prosecutor’s office, and the court) in accordance with relevant regulations. Supplementing the database with, for example, the driver’s fault on the one hand might improve the quality of the classifiers. On the other hand, it may change the importance of predictors.
Further research should address these limitations by improving data completeness and quality, especially regarding minor injuries and behavioural factors. Incorporating additional variables, such as real-time environmental conditions, rider experience, and exposure metrics, may enhance model accuracy. Methodological advances, including cost-sensitive learning, prevalence-aware training, and explicit modelling of spatial-temporal heterogeneity, are recommended to improve the detection of severe outcomes and support the development of more effective intervention strategies.





 ,
,