1. Introduction
Explosive materials are widely used in various fields today. In the construction sector, their primary applications include NATM (New Austrian Tunneling Method) tunnel excavations, mining tunnels, controlled demolitions, and excavations for roads, dams, and bridges. During blasting operations carried out in such projects, various environmental and engineering-related problems such as ground vibrations, noise, and structural damage may occur [
1]. These effects can be particularly detrimental in areas located close to residential zones or industrial facilities.
Beyond the direct effects of structural damage, blast-induced actions can significantly influence the resilience of engineering systems, defined as the capacity of structures and infrastructure networks to withstand extreme events, adapt to their impacts, and recover rapidly thereafter. Recent studies have emphasized that, particularly for critical infrastructure exposed to multi-hazard environments, resilience-based assessments provide a more comprehensive framework than conventional strength-oriented approaches [
2]. In this context, evaluating blast effects not only in terms of peak response parameters but also with respect to system robustness and post-event functionality has become increasingly important.
Safety conditions are of critical importance in facilities where explosive materials are manufactured, transported, stored, and used. During transportation, risks such as fire, impact, collision, or falling pose serious hazards, while improper storage conditions such as the presence of flammable materials, humidity, direct sunlight, and inadequate ventilation may lead to accidental explosions. In addition to their legal use in engineering applications, explosives are also frequently employed in terrorist attacks. Due to their high destructive potential and psychological impact, explosives have become an attractive tool for terrorist organizations. Such explosions not only threaten human life but also cause severe damage to engineering structures.
The effects of explosions on structures depend on numerous parameters, including the structural design and type (reinforced concrete, steel, or masonry), the characteristics of the structural system, the type and magnitude of the explosion, the relative position of the explosion with respect to the structure (internal or external), the distance between the explosion center and the structure, and the location of the explosion within the structure [
3]. Explosions generate extremely high pressures over very short durations, which may result in permanent deformations depending on the strength, stiffness, and ductility of the structural materials. When such deformations occur in load-bearing elements, different damage levels ranging from limited and controlled damage to partial or total collapse may develop depending on the explosion intensity.
Numerical analyses for structural design under blast loading have been conducted since 1953 and have significantly evolved following the publication of regulations by the U.S. Army in 1990, which were subsequently updated in 2008 and 2014. The widely adopted UFC 3-340-02 guideline provides design criteria for protective structures in facilities where explosive materials are produced, tested, stored, and used. This guideline covers the determination of blast load parameters, the calculation of dynamic responses of reinforced concrete and steel structural elements, and design considerations to mitigate damage caused by blast-induced shock waves and fragment penetration [
4].
The risk of explosions in underground structures is not limited to events occurring at the free ground surface. Explosions may also occur within underground tunnels constructed for transportation, mining, sewerage systems, defense, sheltering, and storage purposes. In particular, blasting operations carried out near existing tunnels such as excavation works for a new tunnel constructed adjacent to an operational one may cause damage to the surrounding underground structures [
5]. Soil properties play a decisive role in determining the response of underground structures subjected to blast loading. Previous studies have shown that soils with higher degrees of compaction exhibit increased energy dissipation, resulting in lower displacement and stress levels compared to moderately compacted soils [
6].
In this study, the dynamic effects of underground explosions on tunnel–soil–free-field interaction are comprehensively investigated through numerical analyses. A single-layer NATM tunnel section representing the Eurasia Tunnel is modeled using a finite element-based dynamic analysis framework, and blast loads are defined in accordance with the UFC 3-340-02 provisions. The effects of soil type (soft soil and stiff soil), explosion intensity, and tunnel cover depth on system behavior are evaluated through a parametric approach. Response spectra derived from acceleration time histories obtained at the free-field ground surface are compared with the design spectra specified in the Turkish Building Earthquake Code (TBEC-2018) [
7]. This study aims to contribute to a quantitative assessment of blast-induced dynamic effects in terms of both the safety of underground structures and the earthquake-like dynamic demands that may develop at the ground surface.
2. Materials and Methods
In this study, the dynamic effects of underground explosions on tunnel–soil–free-field interaction are investigated using numerical methods. The analyses are conducted using PLAXIS-2D, a finite element-based software capable of performing dynamic analyses. In the numerical model, a single-layer NATM (New Austrian Tunneling Method) tunnel section representing the Eurasia Tunnel is adopted. Since linear and long structures such as the Eurasia Tunnel are dominated by cross-sectional behavior, they are commonly modeled under plane strain conditions using software such as PLAXIS-2D in both the literature and engineering practice. In 2D analyses, the blast load acting on the tunnel cross-section is assumed to act as an infinitely long line load in the out-of-plane (z) direction. Compared to a realistic point or localized explosion, this assumption neglects the dissipation of blast energy along the tunnel axis and therefore represents a more severe and conservative scenario for the investigated cross-section. Blast loads are defined in accordance with the UFC 3-340-02 guideline, and the effects of variations in soil type, tunnel cover depth, and explosion intensity on system behavior are evaluated through a parametric approach.
The tunnel geometry used in the numerical model is defined to represent the single-layer NATM cross-section of the Eurasia Tunnel. The tunnel lining is modeled using elastic concrete material properties, while the interaction between the tunnel and the surrounding soil is realistically represented by interface elements. In this manner, a coupled tunnel–soil solution is achieved, allowing relative sliding, separation, and contact behaviors to be taken into account.
The soil domain is discretized with sufficiently large dimensions to minimize numerical boundary reflections, and viscous absorbing boundary conditions are assigned at the model boundaries. Rayleigh damping is employed in the dynamic analyses to ensure realistic energy dissipation at both low- and high-frequency ranges. The soil medium is defined using the Mohr–Coulomb constitutive model [
8] to represent elastoplastic behavior. Two different soil conditions, namely soft soil and stiff soil, are considered in the study. For both soil types, unit weight, elastic modulus, Poisson’s ratio, cohesion, internal friction angle, and damping ratios are determined in accordance with values reported in the literature and commonly adopted in engineering practice. By varying the mechanical properties of the soil in the parametric analyses, damping and reflection mechanisms associated with wave propagation are systematically investigated.
Blast loads are defined based on closed-space explosion conditions in accordance with the UFC 3-340-02 [
4] provisions. To model realistic urban scenarios, TNT equivalencies are determined by considering the maximum explosive quantities that can be carried by three different vehicle classes, namely automobiles, SUVs, and panel vans. For each scenario, pressure–time and force–time histories are generated. Due to the loading constraints associated with curved geometries in the PLAXIS software v20.02, dynamic load assignment was carried out by computing the integral of the distributed pressure acting over the effective length defined along the tunnel crown in order to prevent potential numerical errors arising from geometric curvature. The resulting equivalent loads were then assigned to the corresponding nodal points. The blast loads are applied as distributed loads at three different locations along the tunnel crown and subsequently converted into equivalent concentrated loads for implementation in the numerical model. This approach allows a realistic representation of blast effects acting on the tunnel structure.
In total, multiple combinations are considered by accounting for three different explosion intensities, two soil conditions (soft soil and stiff soil), and four tunnel cover depths (17 m, 27 m, 37 m, and 47 m). Dynamic analyses are performed for each combination, and acceleration time histories at the free-field ground surface are obtained. The recorded acceleration data are transferred to the Seismo-Signal software to derive response spectra for each scenario. The blast-induced spectral accelerations are subsequently compared with the design spectra specified in the Turkish Building Earthquake Code (TBEC-2018).
The analysis results are evaluated in terms of maximum displacements occurring in the tunnel lining, acceleration time histories at the free-field ground surface, blast-induced response spectra, and the effects of soil type and tunnel cover depth on wave propagation and energy dissipation. Furthermore, comparative assessments of spectral demand levels with respect to the TBEC-2018 design spectra are carried out. Within this framework, the study aims to quantitatively evaluate blast-induced dynamic effects in terms of both the safety of underground structures and the earthquake-like demands that may develop at the free-field ground surface.
2.1. Explosion Effect
The force generated by an explosive depends on several parameters, including its TNT equivalent weight WE, the scaled distance Z, and the properties of the surrounding medium. Solid explosives represent the form with the highest explosive performance. In international blast analysis and design practices, calculations are commonly carried out based on TNT equivalency. The TNT equivalent of the explosive used is converted to global standards and calculated using Equation (1) [
9].
In Equation (1),
denotes the TNT equivalent weight [kg],
represents the weight of the explosive used [kg],
denotes the heat of explosion of the explosive [MJ/kg], and
represents the heat of explosion of TNT [MJ/kg].
Table 1 presents the characteristic properties of some commonly used explosive materials. These materials represent a subset of the explosive types referred to in Equation (1).
Blast effects propagate in the form of a high-intensity shock wave that expands radially outward from the explosive surface. The instant at which the explosive is initiated corresponds to the peak response of the system. This process generates a high-intensity, short-duration shock wave with earthquake-like characteristics, which rapidly attenuates with time and distance [
10]. In the scientific design and analysis of blast effects, two primary parameters are considered: the explosive charge weight and the distance measured from the center of the explosion to the target point. The parameter known as the scaled distance, denoted as
Z, is defined as a function of the distance between the explosion source and the point at which the blast effects are evaluated.
In Equation (2), Z[m/kg1/3] denotes the scaled distance, R [m] represents the distance between the explosion center and the target point, and W
E denotes the TNT equivalent weight. In a free-air explosion, shock waves generated at the explosion center propagate radially outward and eventually encounter the first structure along their path. Upon impact, the incident shock wave is amplified due to the resulting pressure and impulse and is subsequently reflected [
10]. The pressure–time relationship generated by the shock wave at a point ahead of the wave front is given in Equation (3) [
11].
In explosions occurring within a structure, the peak pressures generated by the initial shock waves are significantly higher than those observed in free-air explosions. As a result, pressure waves reflected within the enclosed space further amplify the applied loading. In addition, the presence or absence of air contact during the explosion, as well as the accumulation of high-temperature gaseous products generated by the explosive chemical reaction, can impose additional pressure demands on the structure.
The mathematical formulation of explosions occurring in confined environments is highly complex. Therefore, such explosions are commonly assumed to generate a two-stage loading mechanism. The first stage corresponds to the pressure effects of shock waves produced by the explosive and reflected from the confining walls. The development and decay of this high-pressure phase occur over a very short duration. The second stage is associated with the pressure generated by the gaseous products of the explosion reaction, which acts over a longer duration but with a lower pressure magnitude compared to the first stage [
12].
The calculation of shock loads resulting from confined explosions involves several steps. First, the surface of the protective structure subjected to the explosion and the number of reflecting surfaces are determined. Subsequently, the required parameters specified in the relevant design guidelines are calculated for the affected surface. Based on these parameters, appropriate charts are selected to obtain the average peak reflected pressure and the scaled average reflected impulse. From these charts, the values of the reflected pressure Pr and the scaled reflected impulse Ir are obtained. Due to multiple reflections and varying time phases, the pressure distribution acting on a structural element exhibits a highly irregular pressure–time history. For practical analysis purposes, this pressure–time relationship may be idealized using an equivalent right-angled triangular pressure pulse. The equivalent pressure duration is then determined using the selected values of Pr and Ir [
4].
In Equation (4), Ir denotes the scaled average reflected impulse, while Pr represents the peak reflected pressure.
2.2. Tunnel–Soil Interaction
Due to regional geological conditions, numerous highway tunnels are constructed along intercity routes as well as major urban arteries. In addition to overcoming challenging natural constraints, these tunnels play a significant role in reducing travel distances, travel time, and the consumption of non-renewable fuels. Traffic congestion is a major issue in Istanbul, the metropolitan city of the Marmara Region. The Eurasia Tunnel was constructed as an alternative to the three existing bridges connecting the European and Asian sides of the city. The Eurasia Tunnel aims to provide its users with an environmentally friendly, comfortable, safe, economical, and rapid transportation experience through the use of advanced engineering technologies [
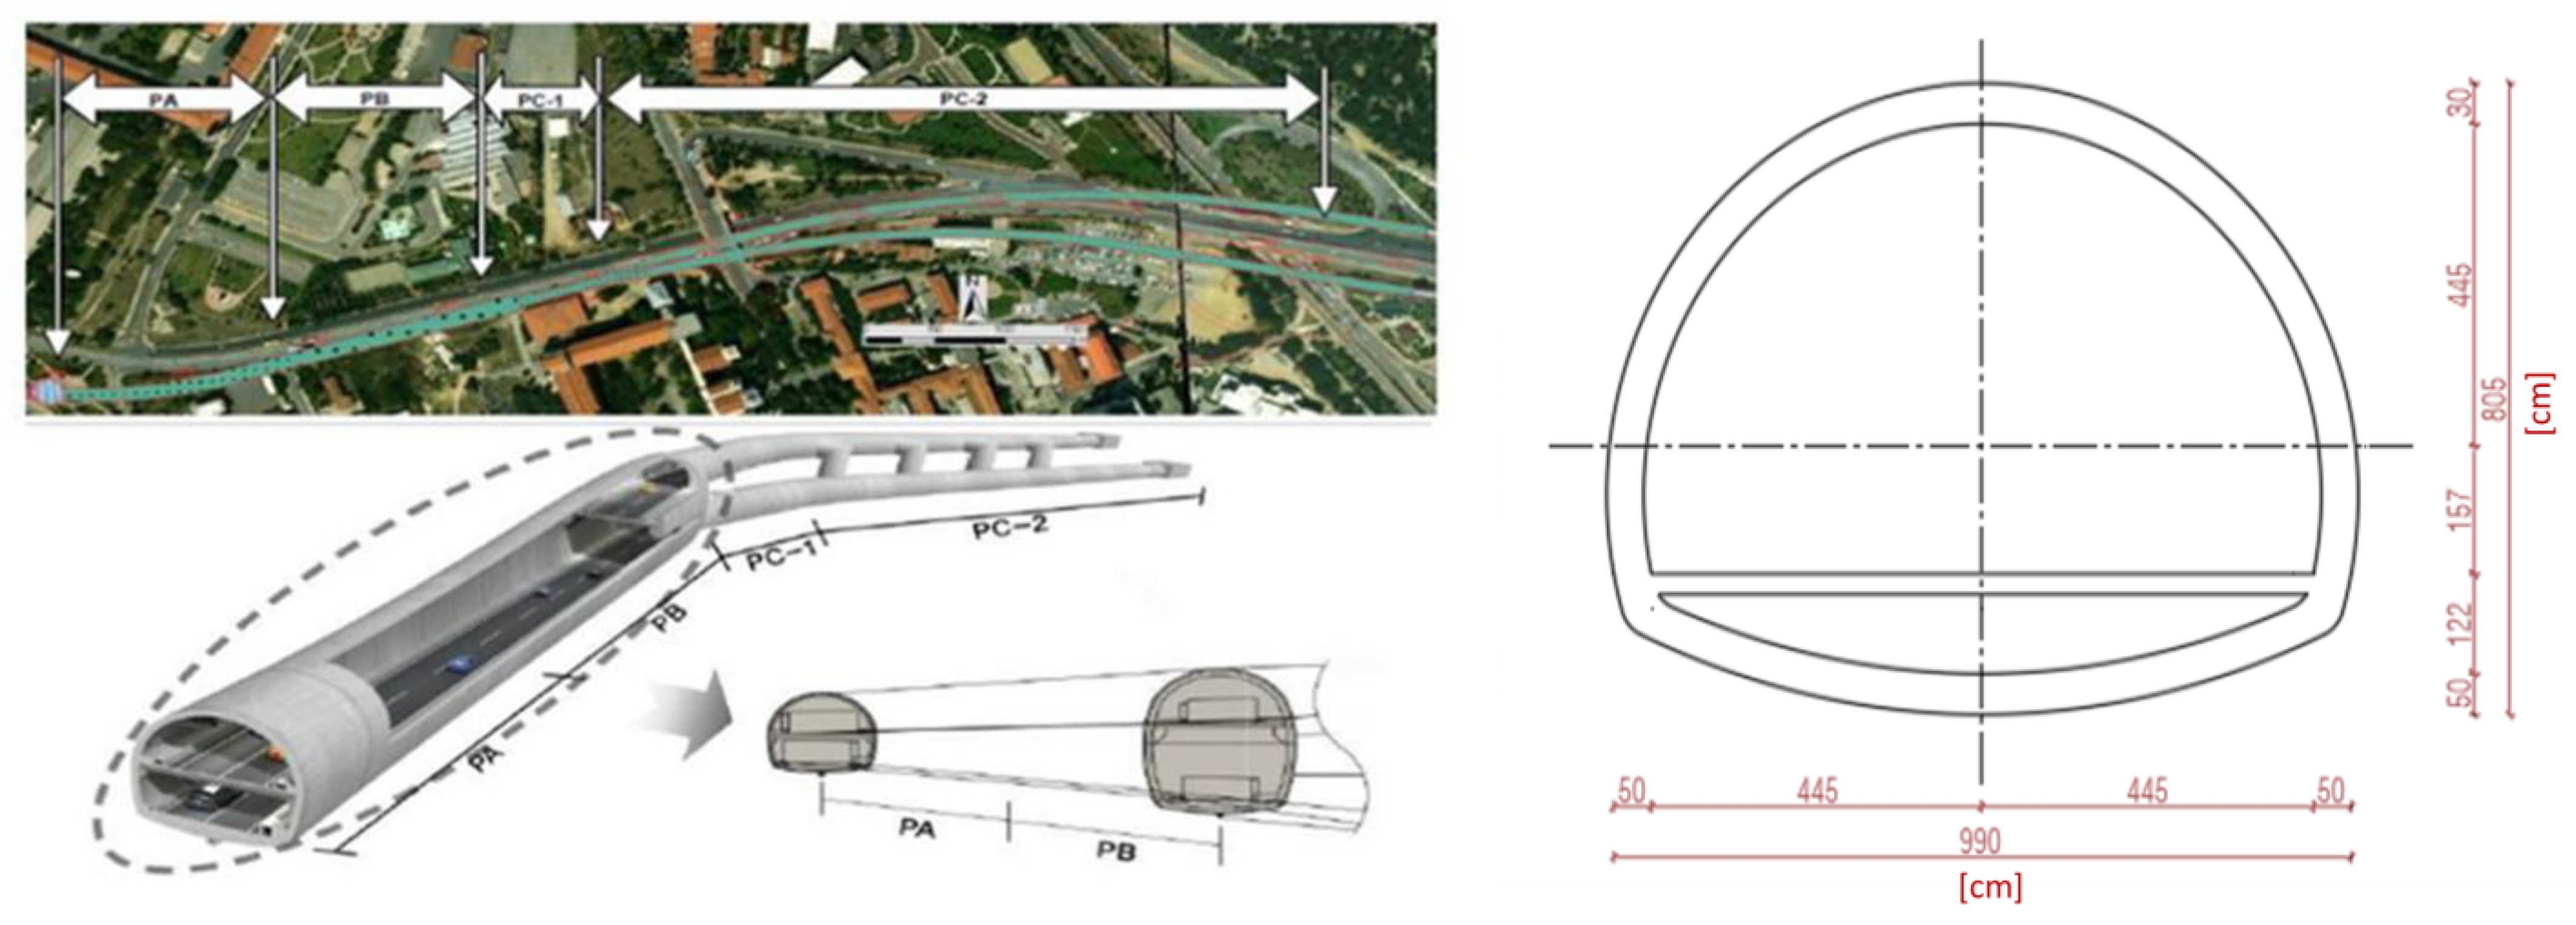
13]. The tunnel connects the European and Asian shorelines via a 5.4 km-long highway tunnel, with a total project alignment length of 14.6 km. In this study, a single-layer NATM tunnel section of the Eurasia Tunnel extending over a length of 670 m within the city of Istanbul is modeled. During the construction of the Eurasia Tunnel, C50-grade concrete was used for the tunnel lining, with a lining thickness of 50 cm [
14]. The tunnel lining was defined as a Plate element in PLAXIS 2D, and its axial stiffness (EA = 18.5 × 10
6 kN/m) and bending stiffness (EI = 38.5 × 10
4 kNm
2/m) were calculated and incorporated into the numerical model. In addition, the interaction between the tunnel lining and the surrounding soil was modeled using interface elements, allowing frictional behavior and potential separation effects to be incorporated into the numerical solution (
Figure 1).
In the Mohr–Coulomb constitutive model, both the elastic and plastic properties of the soil are defined. The elastic behavior is characterized by the elastic modulus E and Poisson’s ratio ν, while the plastic behavior is governed by the cohesion c, internal friction angle φ, and dilation angle ψ. The elastic modulus E represents the initial slope of the stress–strain curve obtained from triaxial tests, whereas Poisson’s ratio ν reflects the volumetric deformation characteristics of the material, particularly in relation to its saturation condition.
The plastic parameters describe the shear strength behavior of the soil, where cohesion c represents the interparticle bonding forces, the internal friction angle φ characterizes frictional resistance between soil particles, and the dilation angle ψ defines the volumetric expansion behavior during shearing. The mechanical properties of the soils considered in this study are summarized in
Table 2.
The soil parameters presented in
Table 2 were determined based on the characteristic properties of soft and stiff soils proposed by Bowles (1997) [
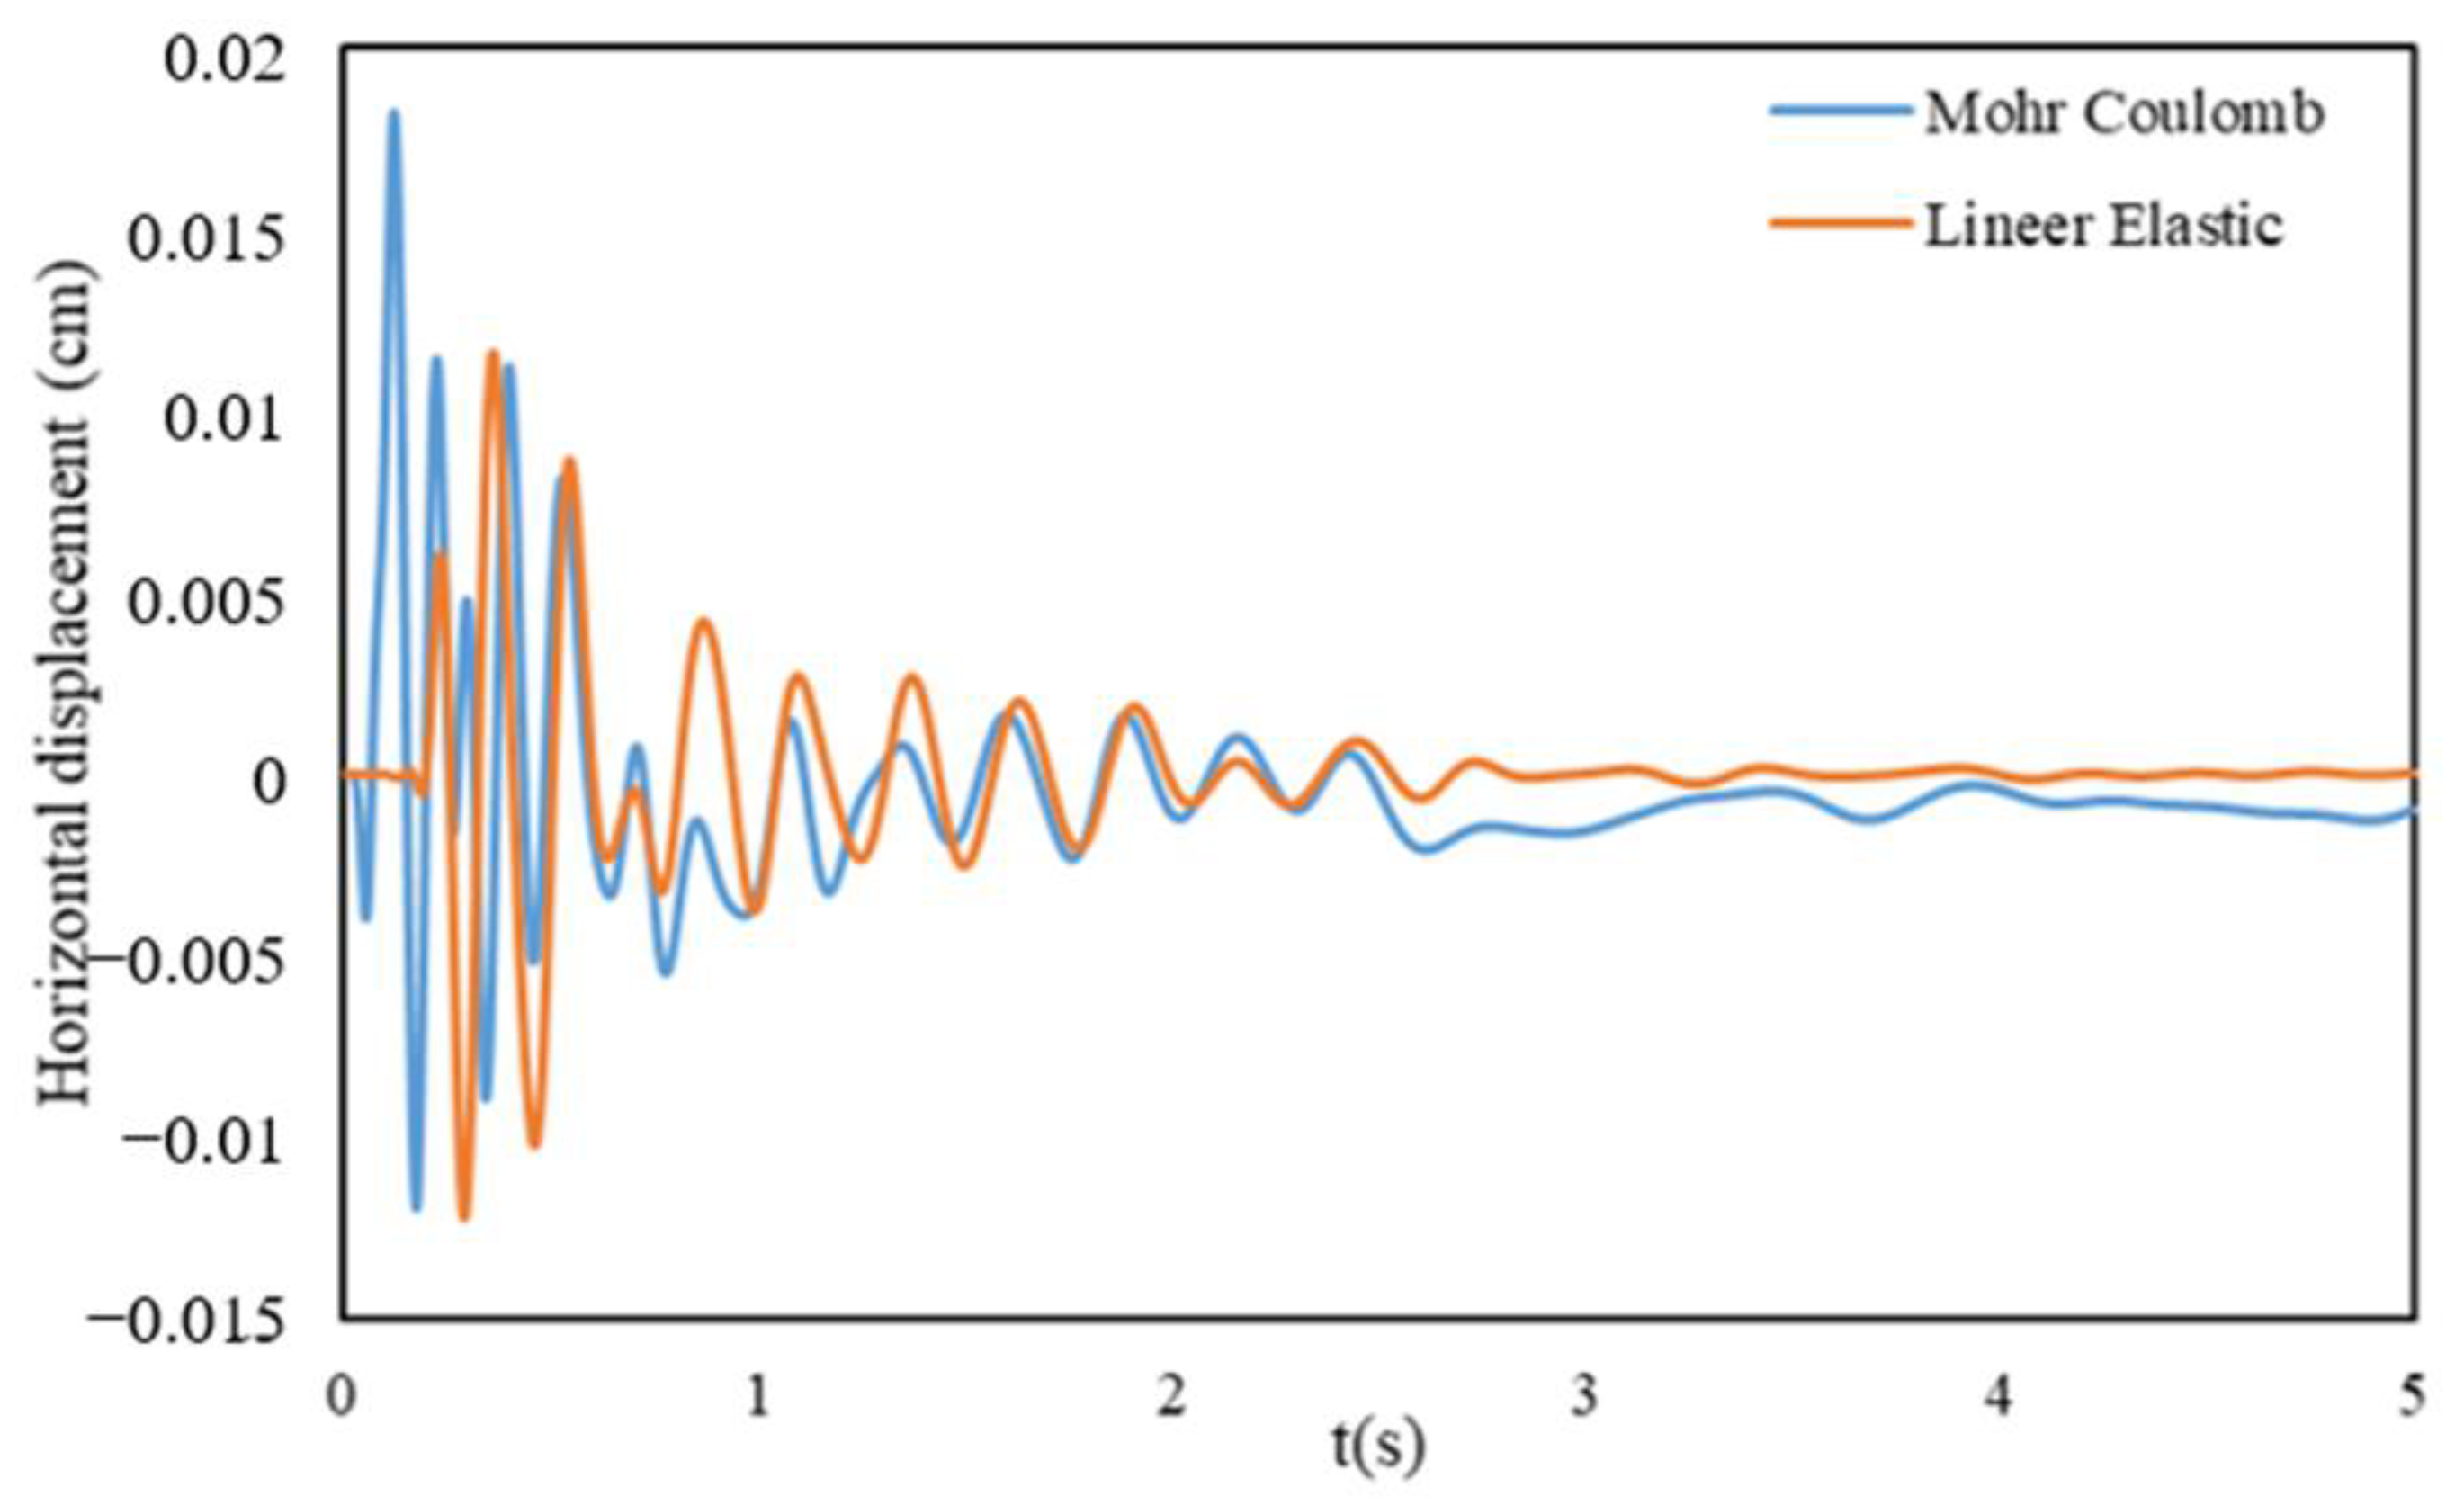
15] in the literature and were defined within the framework of the Mohr–Coulomb material model (
Figure 2). Wave propagation characteristics were evaluated using the Elastic Modulus (E) and Poisson’s ratio (ν), which represent the elastic behavior of the soils, together with the internal friction angle (ϕ). Within this context, the shear wave velocity (Vs) was calculated as a function of the elastic parameters. Owing to the lower elastic modulus and higher Poisson’s ratio, lower wave velocities were obtained for soft soil conditions, whereas a pronounced increase in shear wave velocity was observed for stiff soils due to the higher elastic modulus and lower Poisson’s ratio. The resulting Vs values quantitatively demonstrate that an increase in soil stiffness directly affects wave propagation velocity and energy transmission characteristics (
Table 2).
PLAXIS-2D discretizes the computational domain into triangular finite elements when generating the finite element mesh. For these elements, two different node configurations are available: 6-node triangles and 15-node triangles. The 6-node triangular element provides second-order interpolation for displacements, whereas the 15-node triangular element employs fourth-order interpolation. Although the 6-node triangular element can yield satisfactory results in deformation analyses when a sufficiently refined mesh is used, caution is required in analyses such as bearing capacity calculations. In contrast, the 15-node triangular element offers highly accurate solutions for challenging problems, including collapse and failure analyses, and provides high-quality stress results [
8]. Therefore, 15-node finite elements are adopted in this study.
In this study, the Rayleigh damping approach is employed to define material damping. This approach is considered one of the most suitable methods for dynamic analyses solved using the finite element method, as it accounts for the damping contributions of both the mass and stiffness matrices [
16].
Rayleigh damping is a numerical approach in which the damping matrix [C] is constructed as a linear combination of a portion of the mass matrix [M] and a portion of the stiffness matrix [K], as expressed in Equation (5).
The parameter α represents the contribution of mass to the damping of the system. As the value of α increases, lower-frequency components are increasingly damped. Conversely, the parameter β (Equation (6)) governs the contribution of stiffness to system damping, such that higher values of β result in greater attenuation of higher-frequency components [
8].
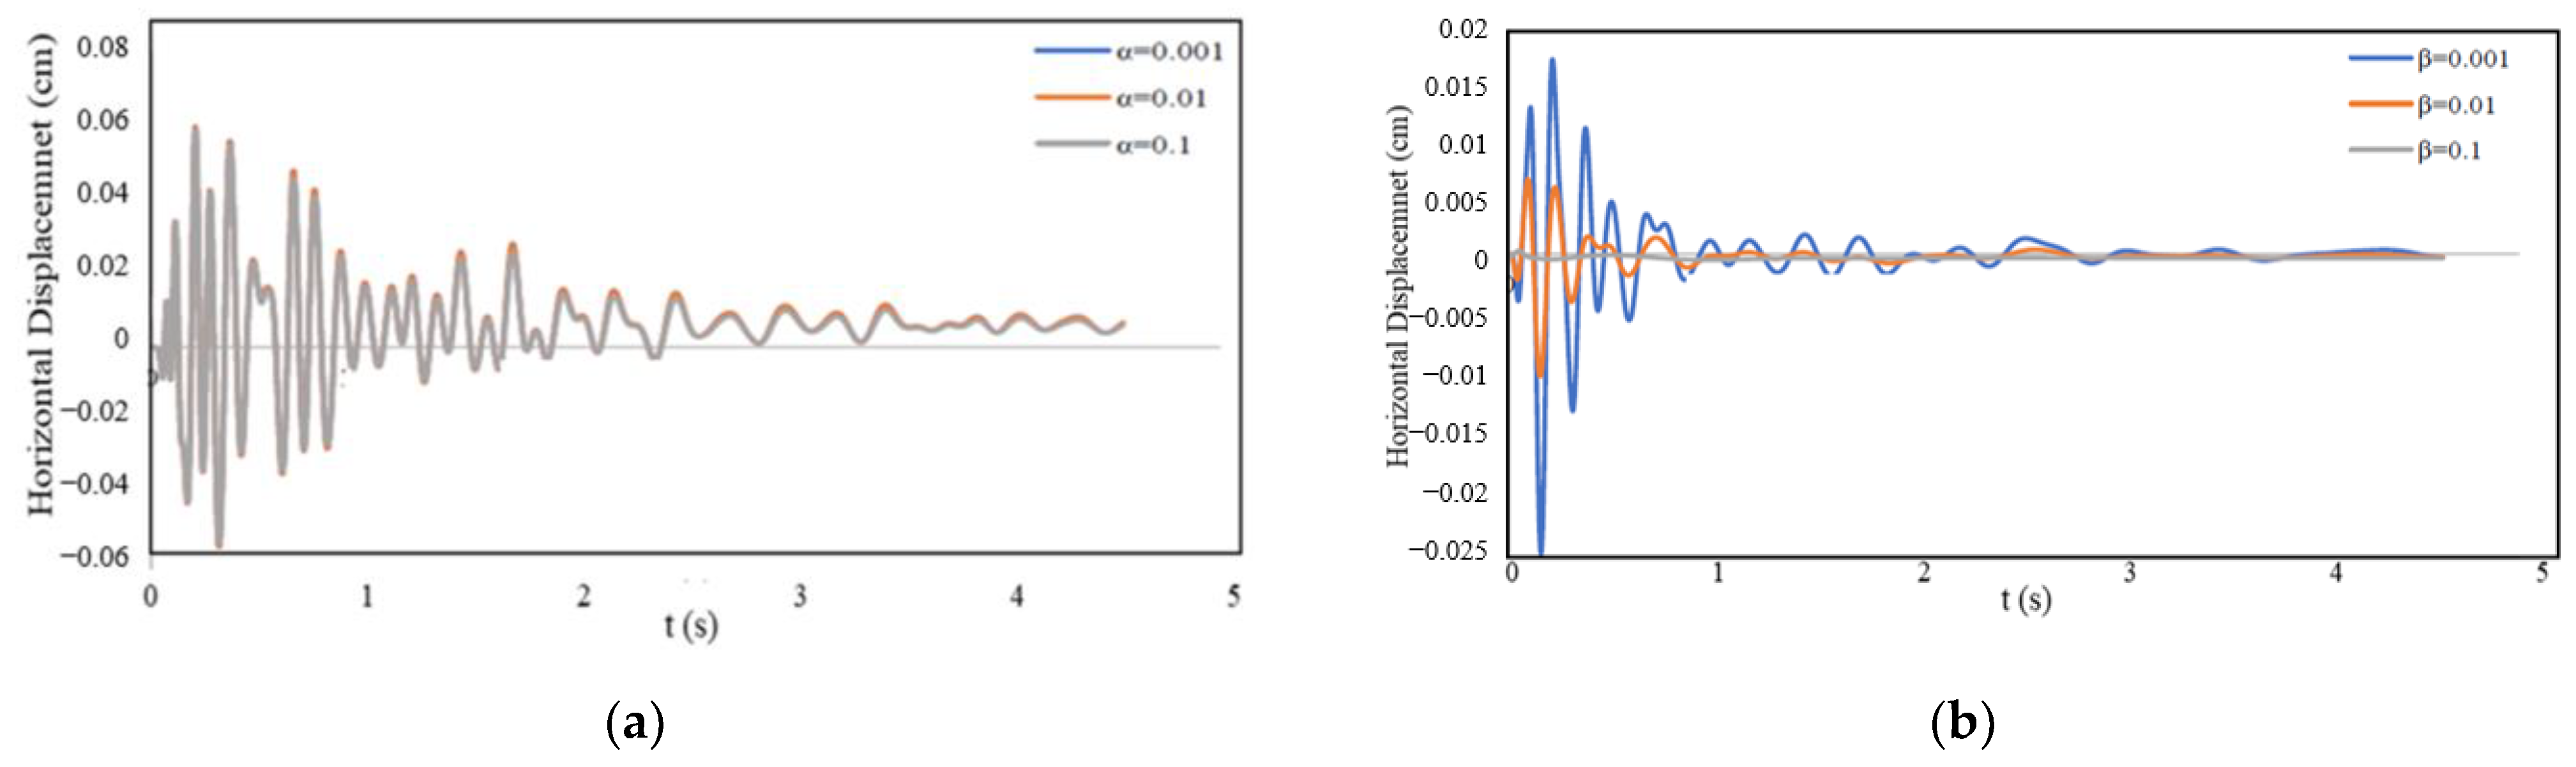
Previous studies on soil structure interaction problems have indicated that the contribution of mass-proportional damping to the overall damping behavior is negligible, and that considering only the stiffness-proportional component does not introduce significant inaccuracies. When the graph is examined, it is observed that the mass participation coefficient α does not have a significant influence on the displacement-time response under the applied vertical dynamic loading (
Figure 3). Previous studies on soil–structure interaction problems indicate that the contribution of mass-proportional damping to the overall damping response is negligible, and that considering only the stiffness-proportional contribution does not lead to significant inaccuracies [
17].
In the investigation of the stiffness participation coefficient, the proportionality constant α was set to zero, while the proportionality constant β was varied to 0.1, 0.01, and 0.001 to examine its effect. As seen in the graph, increasing the value of β results in a reduction in response amplitude and an increase in wavelength.
Accordingly, the mass-proportional damping coefficient α is assumed to be zero in this study. The influence of the stiffness-proportional damping coefficient β on the numerical results is examined, and it is observed that increasing β leads to a reduction in response amplitudes and an increase in the dominant wavelength. Typical damping ratios (ζ) are taken as 2% for rock media and 5% for soft soil conditions [
18]. Based on the soil properties, the corresponding values of the Rayleigh damping coefficients α and β are calculated and incorporated into the analyses.
The normal and shear stresses absorbed at the soil boundaries modeled using equivalent viscous dashpots are given in Equation (7). In this equation, c1 and c2 denote the damping coefficients, ρ represents the material density, Vp and Vs correspond to the compressional and shear wave velocities, respectively, and Ux and Uy define the particle velocities in the corresponding directions.
To reduce boundary-induced wave reflections in the dynamic analyses, equivalent viscous absorbing boundary conditions proposed by Lysmer and Kuhlemeyer (1969) [
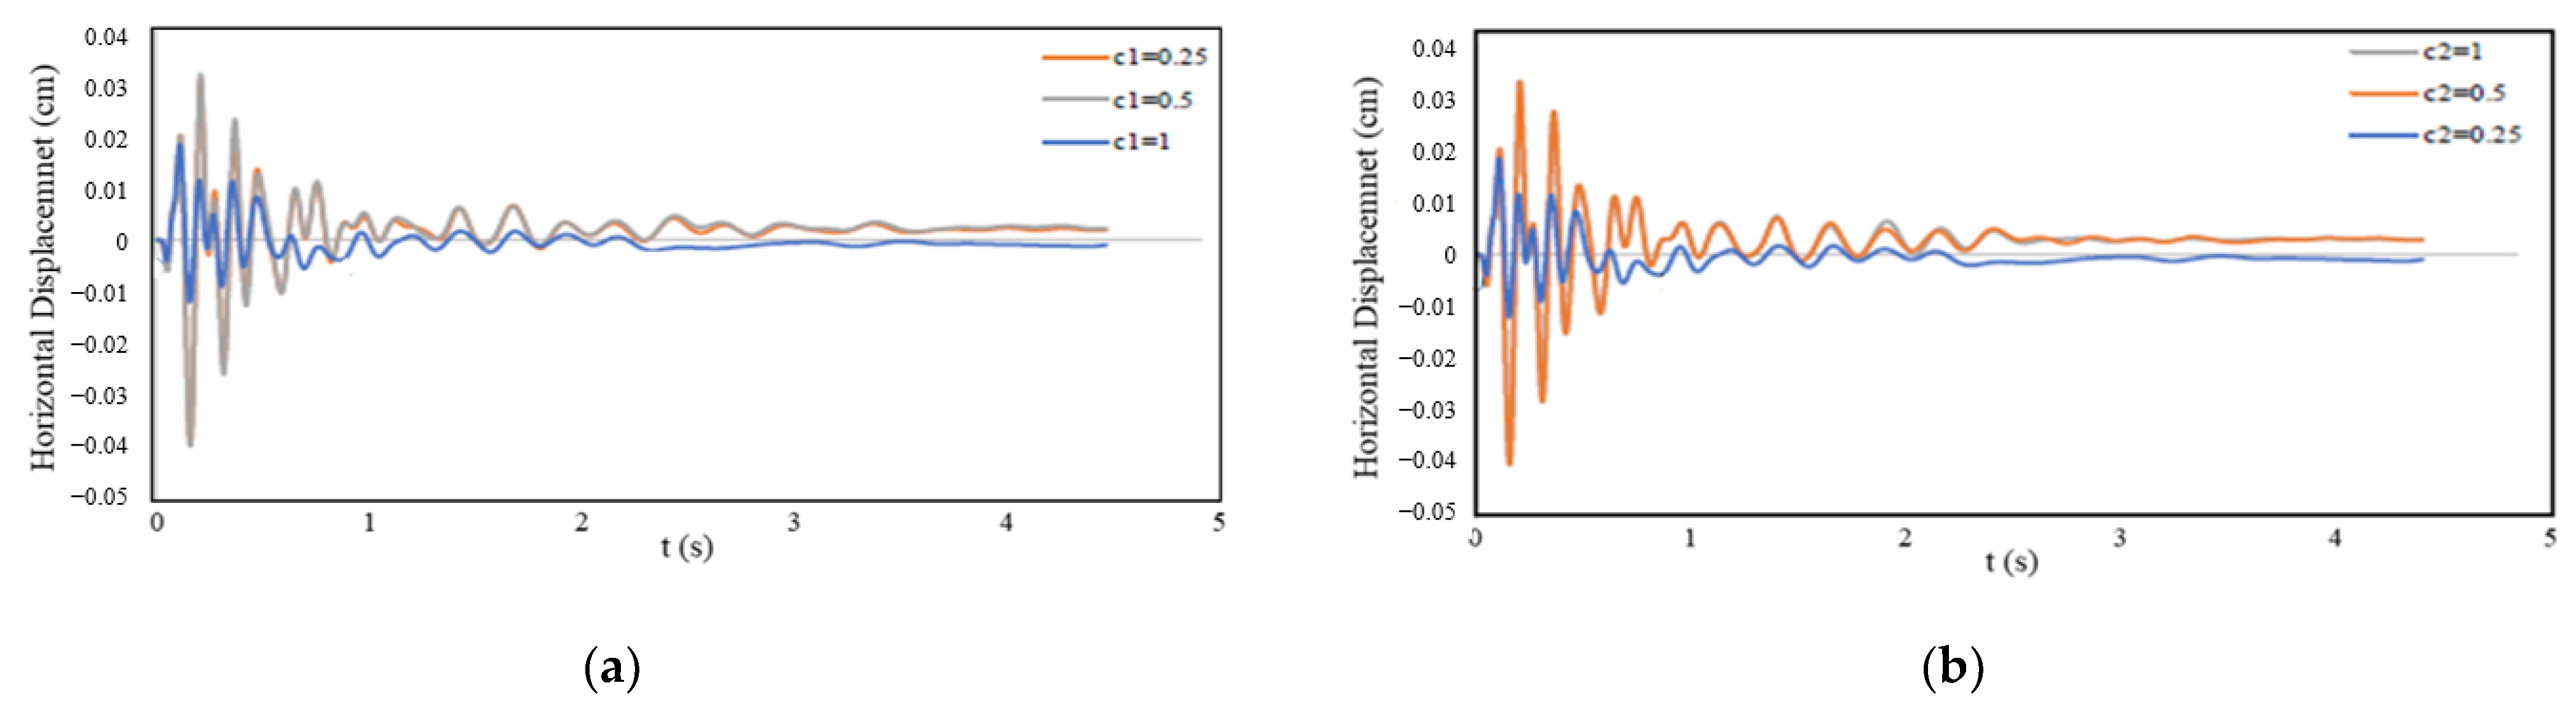
19] were applied at the soil boundaries. Within this framework, the effects of the viscous damping coefficients c1 and c2, defined for compressional and shear waves, respectively, on the model response were investigated parametrically.
Figure 4a,b comparatively present the displacement time histories obtained at the tunnel crown level and the free-field ground surface for c1 and c2 values of 0.25, 0.5, and 1.0.
The findings obtained from
Figure 4 indicate that boundary reflections become more pronounced at low damping coefficient values, whereas appropriate combinations of the coefficients enable effective transmission of wave energy out of the model domain. Accordingly, the values c1 = 1 and c2 = 0.25, which minimize reflection effects and yield results consistent with the literature, were adopted in the final analyses.
The discretized finite element size of the soil domain (Δh) depends on the shear wave velocity of the soil (Vs), the maximum significant frequency of the input motion (fmax), and a dimensionless factor k. The factor k varies within the range 5 ≤ k ≤ 10 depending on the type of finite element and the shape functions employed. It should be noted that when short-wavelength frequency components are modeled using excessively large finite elements, high-frequency components may be artificially filtered. Therefore, to ensure accurate wave propagation throughout the analysis, it is recommended that at least 10 nodal points be used per wavelength [
20]. In light of these considerations, a value of k = 10 is adopted in this study.
The maximum significant frequency (fmax) is determined by performing a Fourier analysis of the vibration response under seismic loading conditions. Based on these parameters, the discretized finite element size of the soil domain (Δh) is calculated using Equation (8).
The discretized finite element size of the soil domain (Δh) is calculated based on the requirement to accurately capture wave propagation. For blast analyses conducted in soft soil conditions, the maximum significant frequency obtained from the Fourier analysis is fmax = 12.93 Hz, the shear wave velocity is Vs = 63.28 m/s, and the factor k. Accordingly, the minimum required element size is calculated as Δh ≤ 0.489 m to ensure proper wave propagation. To ensure the numerical accuracy of the model, comprehensive sensitivity analyses were performed prior to the main analyses.
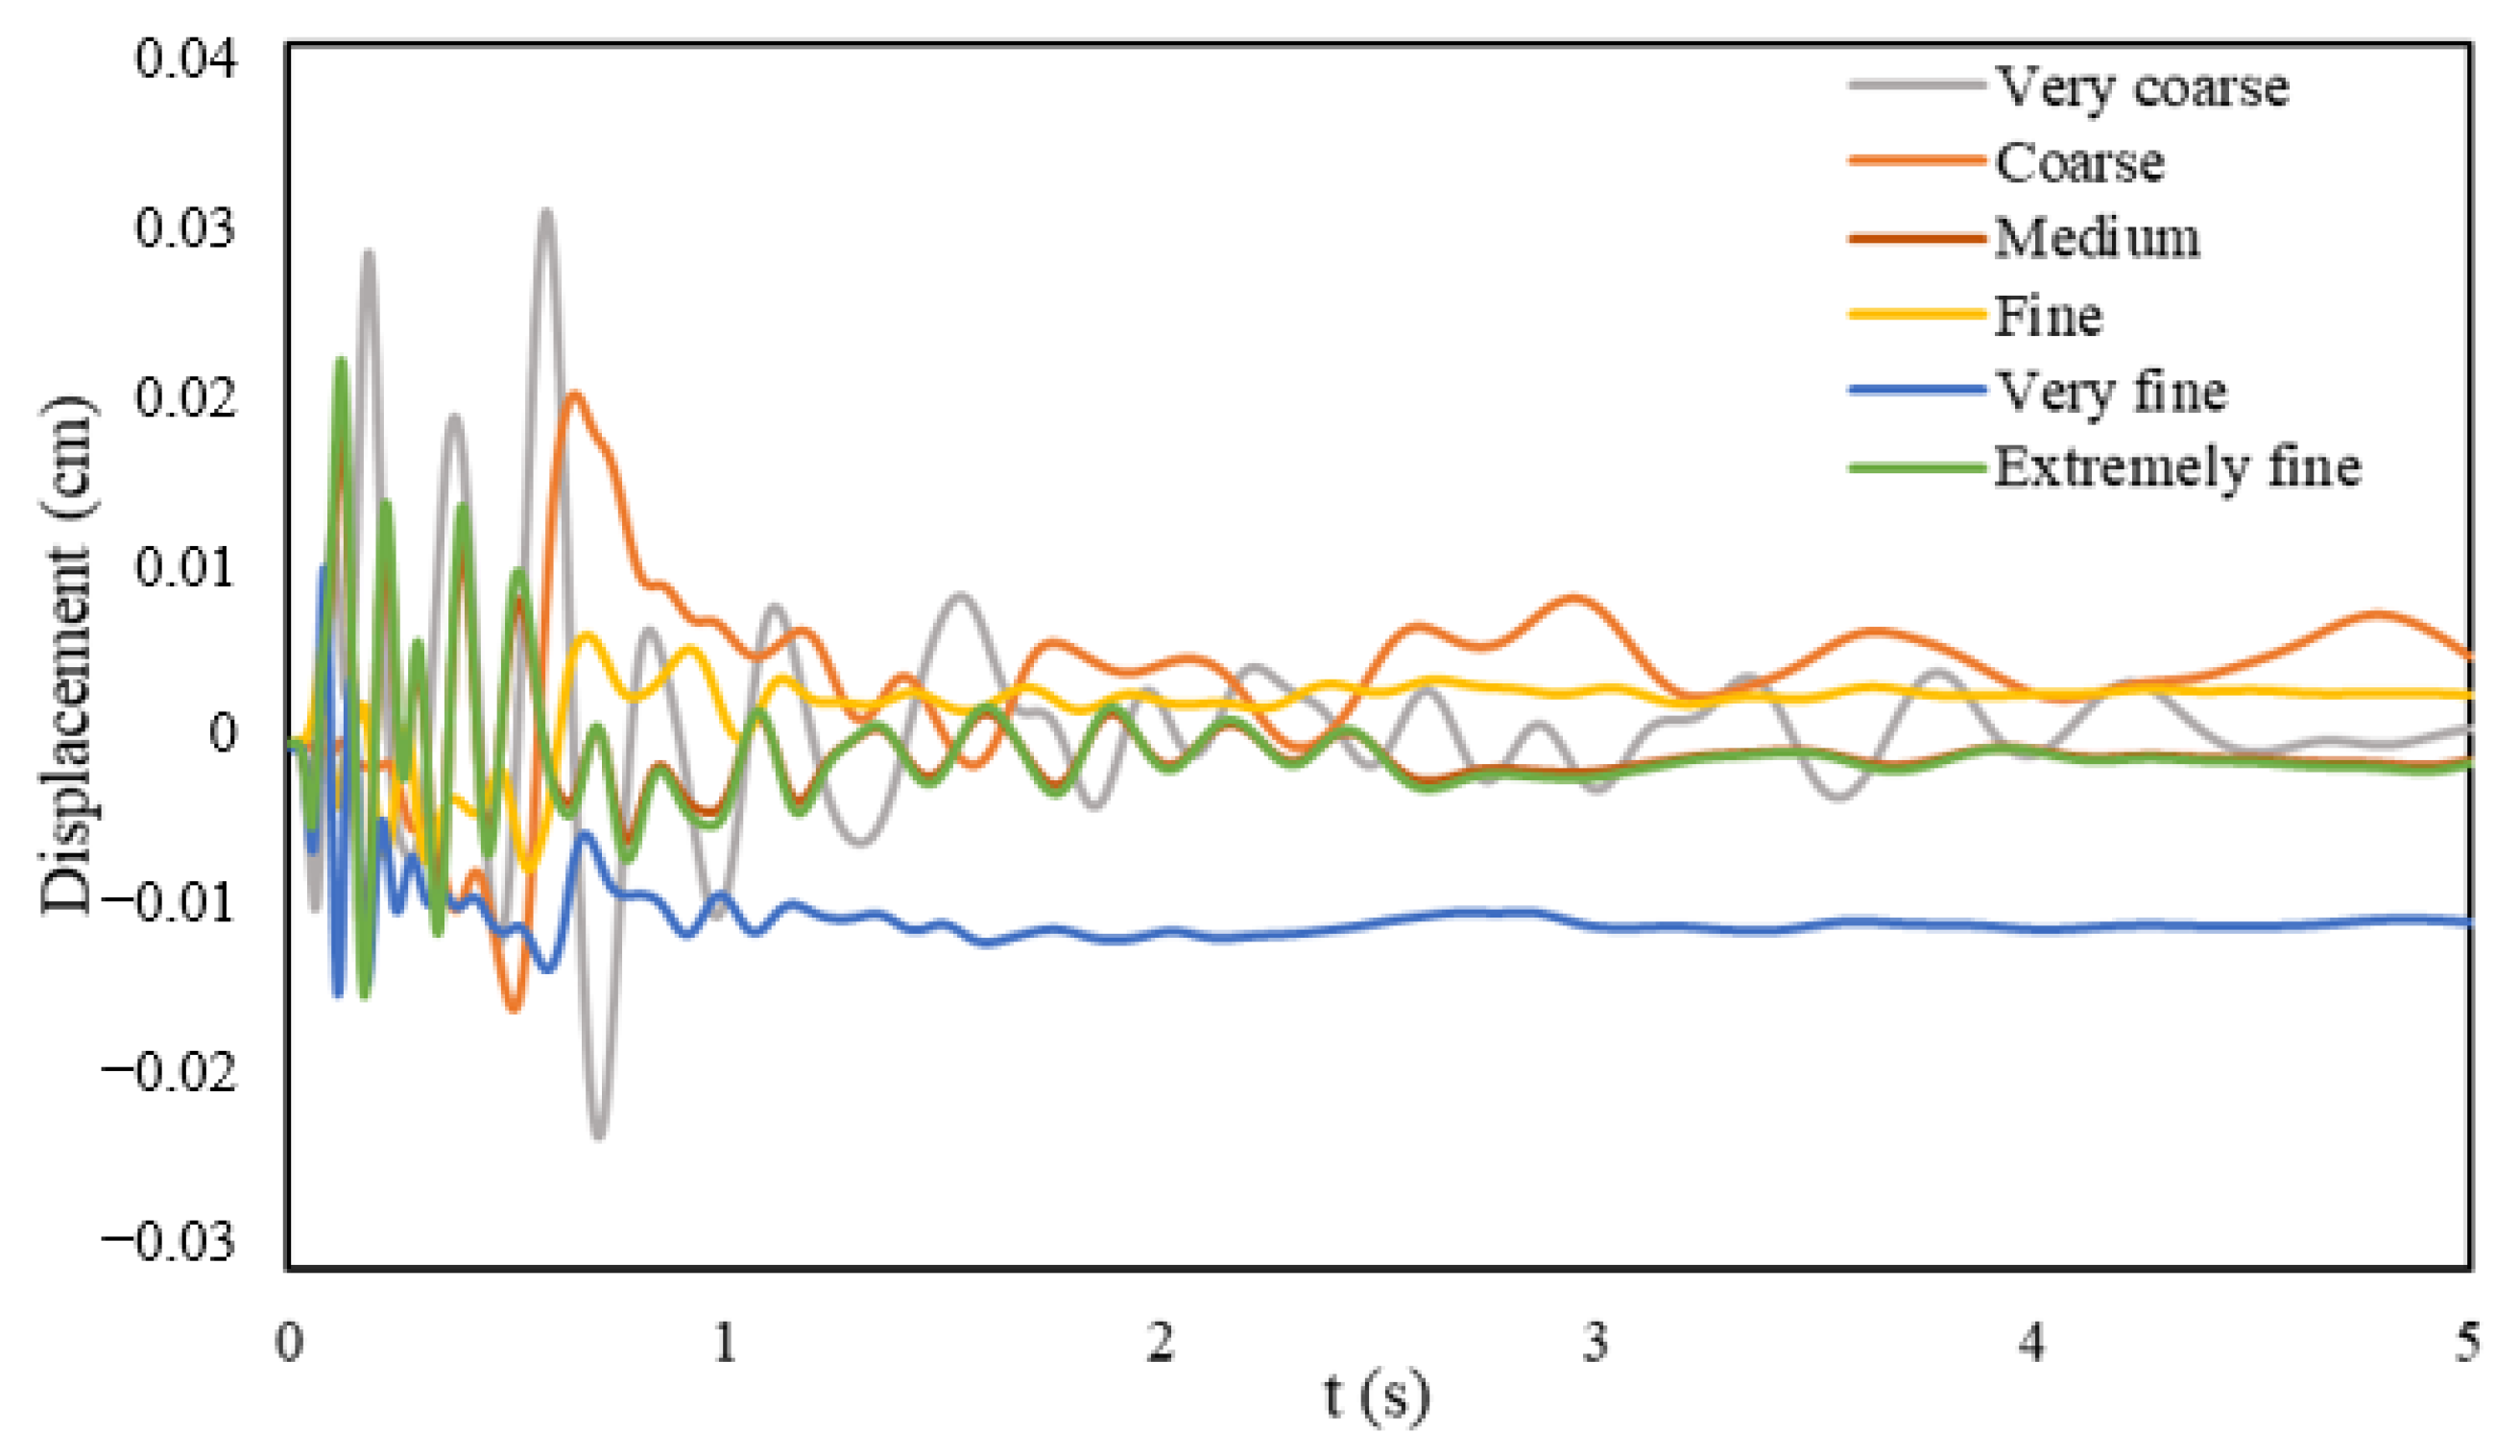
Table 3 presents the number of elements and nodal points corresponding to each finite element mesh configuration. As the mesh quality increases, the number of elements and nodes increases, while the mesh size decreases.
Different finite element mesh sizes were tested, and the optimal mesh configuration at which the results converge was identified (
Figure 5). The influence of the finite element mesh defined in the PLAXIS software was examined in this study. A parametric analysis was conducted for a blast load with a Δh value using five mesh types defined in the software, very coarse, coarse, medium, fine, and very fine, and the resulting responses at the free-field ground surface were investigated.
During numerical analyses, propagating waves must sequentially reach one nodal point and then the next. If the time increment used in the analysis is excessively large, the wave may reach two nodal points simultaneously, which can lead to numerical instability and violate the fundamental assumptions of the finite element method and wave propagation theory [
16].
Therefore, the time step employed in the numerical solution is constrained by the Courant stability criterion, expressed in Equation (9). In this equation, V denotes the velocity of the pressure wave propagating through the soil medium [
19].
In this study, the analyses are performed using a time step size of Δt ≤ 0.007 s. Taking the characteristics of the blast loading time history into account, a finer time increment of 0.001 s is adopted throughout the analyses.
3. Results
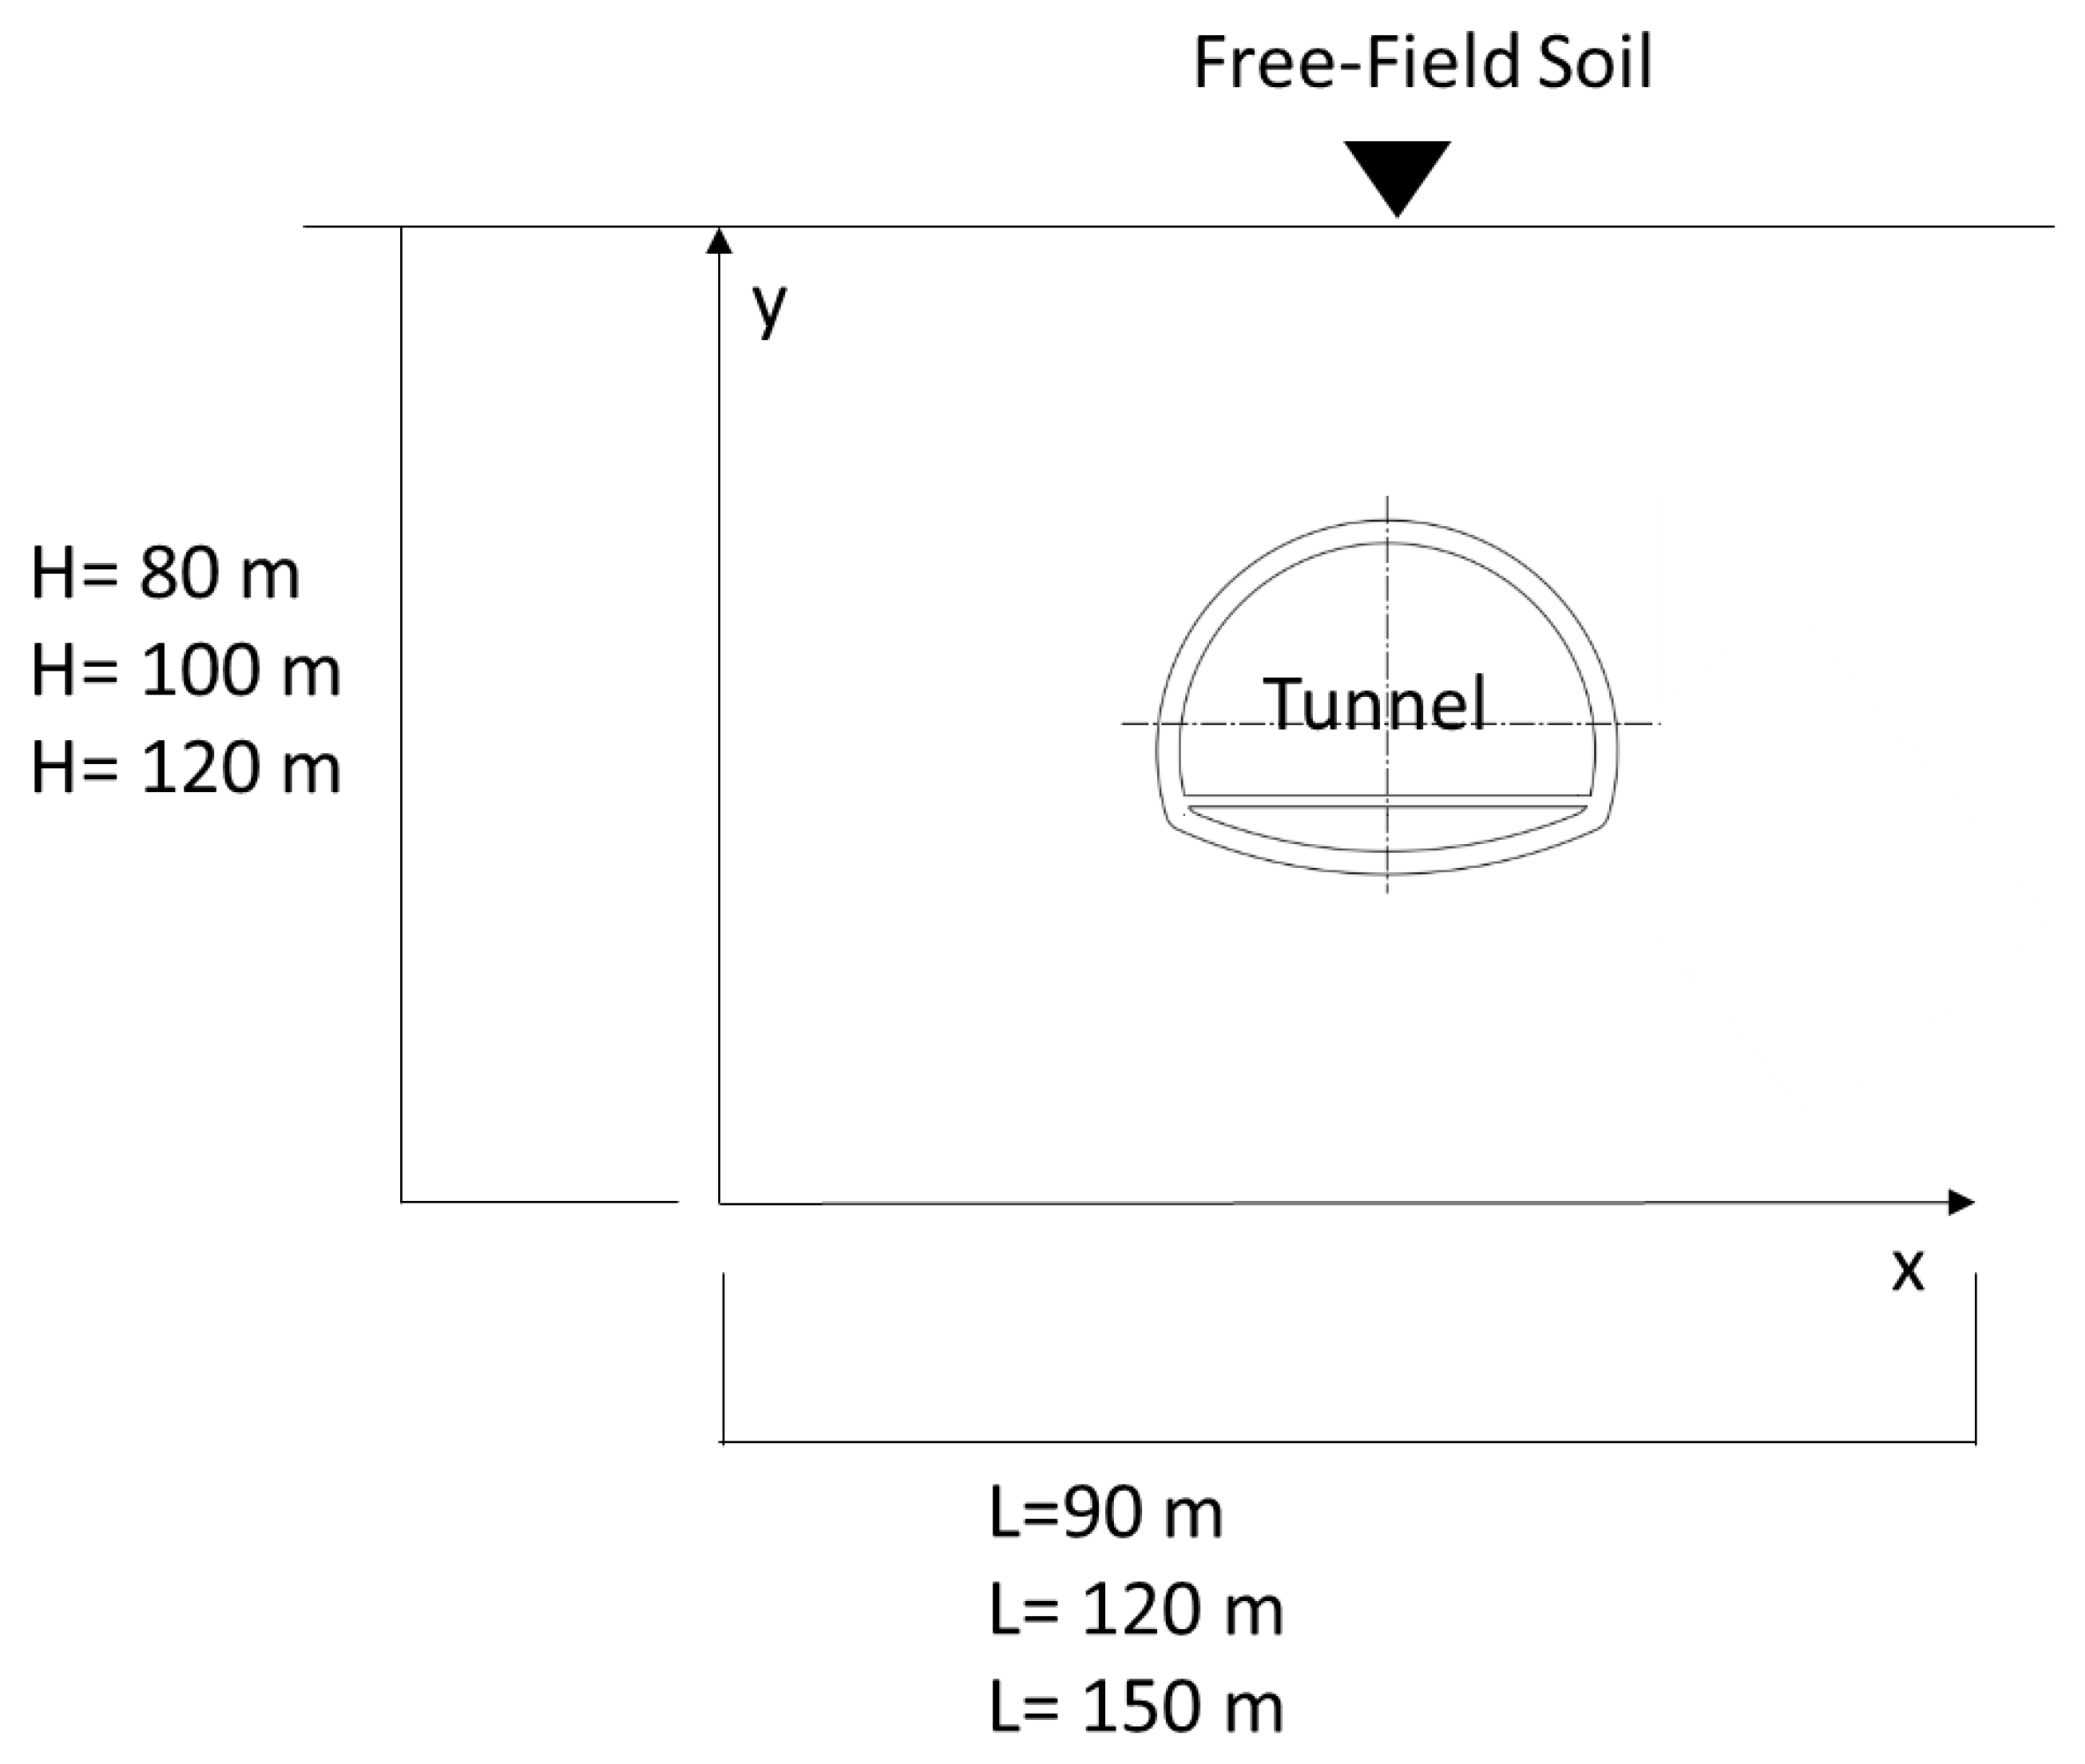
In this study, the influence of the dimensions of the soil domain containing the structural element, defined by the height H and width L, on wave propagation induced by blast loading is investigated in both the vertical (y) and horizontal (x) directions. As a first step, the vertical dimension of the finite soil domain (H) is examined by varying the depth below the tunnel invert while keeping the overburden above the tunnel constant. During this process, the horizontal width in the x-direction is fixed at 90 m, corresponding to approximately 8 to 10 times the tunnel width.
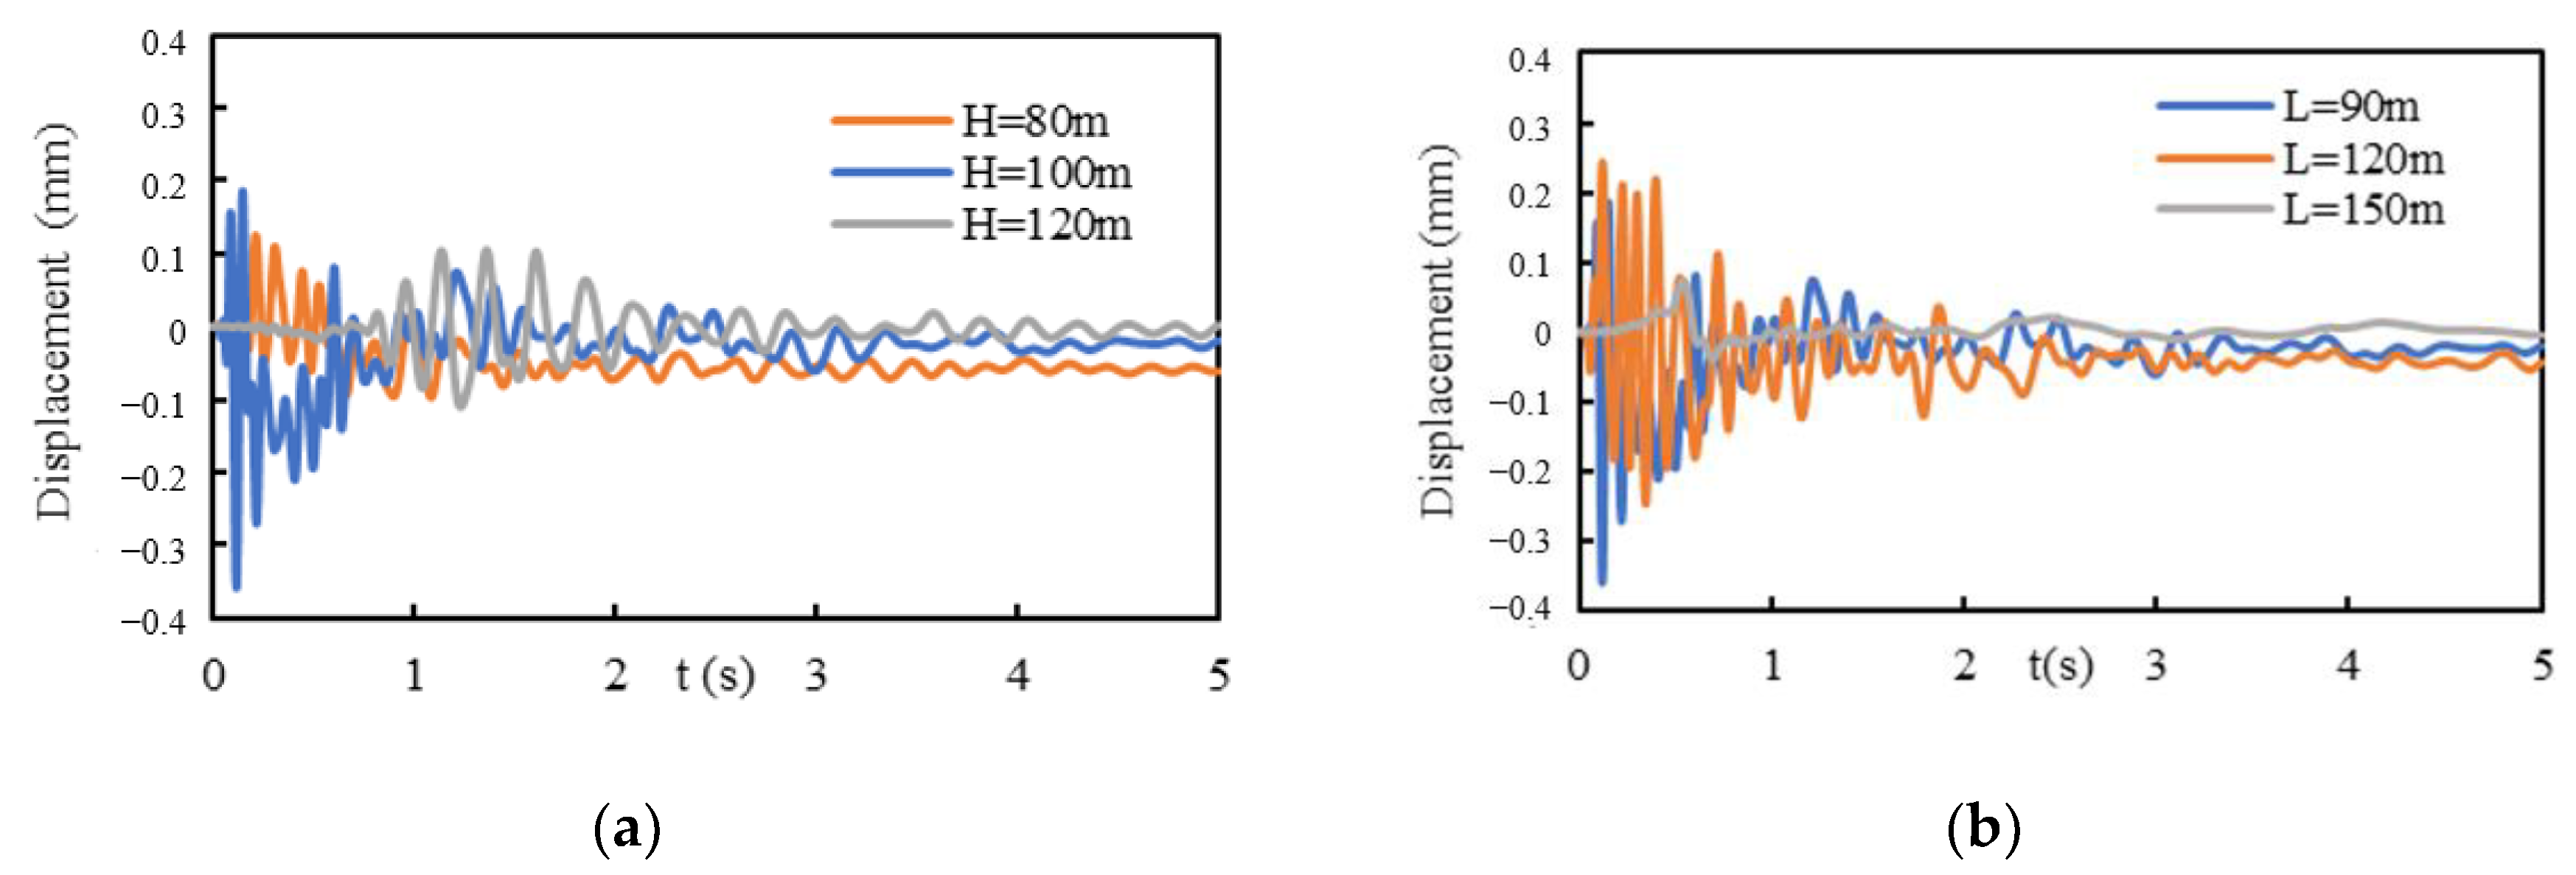
The height H of the soil domain is varied as 80 m, 100 m, and 120 m, and the resulting wave propagation effects are evaluated at the tunnel crown, the mid-depth of the soil domain, and the free-field ground surface. The influence of the domain height on wave propagation characteristics is illustrated in
Figure 6.
Figure 7 illustrates the variations in the domain dimensions H and L. As the height and width of the soil domain increase, the amplitude of the displacement response decreases. Allowing all degrees of freedom of the modeled finite soil domain to remain completely free implies that the geometric attenuation of the soil medium is not accounted for. To perform such an analysis, the dimensions of the modeled soil domain would need to be selected significantly larger than the adopted values in order to realistically represent an infinite soil medium within the numerical framework. However, this approach would substantially increase the computational cost and model size [
21].
Therefore, based on the balance between numerical accuracy and computational efficiency, the soil domain dimensions are selected as H = 100 m and L = 120 m.
Based on the vehicle types permitted to use the Eurasia Tunnel and their maximum explosive carrying capacities, three different explosion magnitudes are designed in this study. These scenarios are developed using the commonly employed C-4 explosive as the reference material. For automobiles, SUVs, and panel vans allowed to operate within the Eurasia Tunnel, the equivalent explosive masses are determined according to the maximum explosive loads that each vehicle type can carry [
10]. In this study, C-4 explosive, which is frequently used in terrorist attacks, was selected as the explosive type. The corresponding equivalent TNT weights, according to the UFC 3-340-02 standard, are 227 kg for passenger cars, 454 kg for SUVs, and 1818 kg for panel vans. Based on these values, the explosive masses assigned to the vehicles were calculated using Equation (1) as 160 kg for passenger cars, 320 kg for SUVs, and 1270 kg for panel vans.
When evaluating blast effects in confined environments, reflecting surfaces are also taken into account. The reflection effects are calculated in accordance with the UFC 3-340-02 standard.
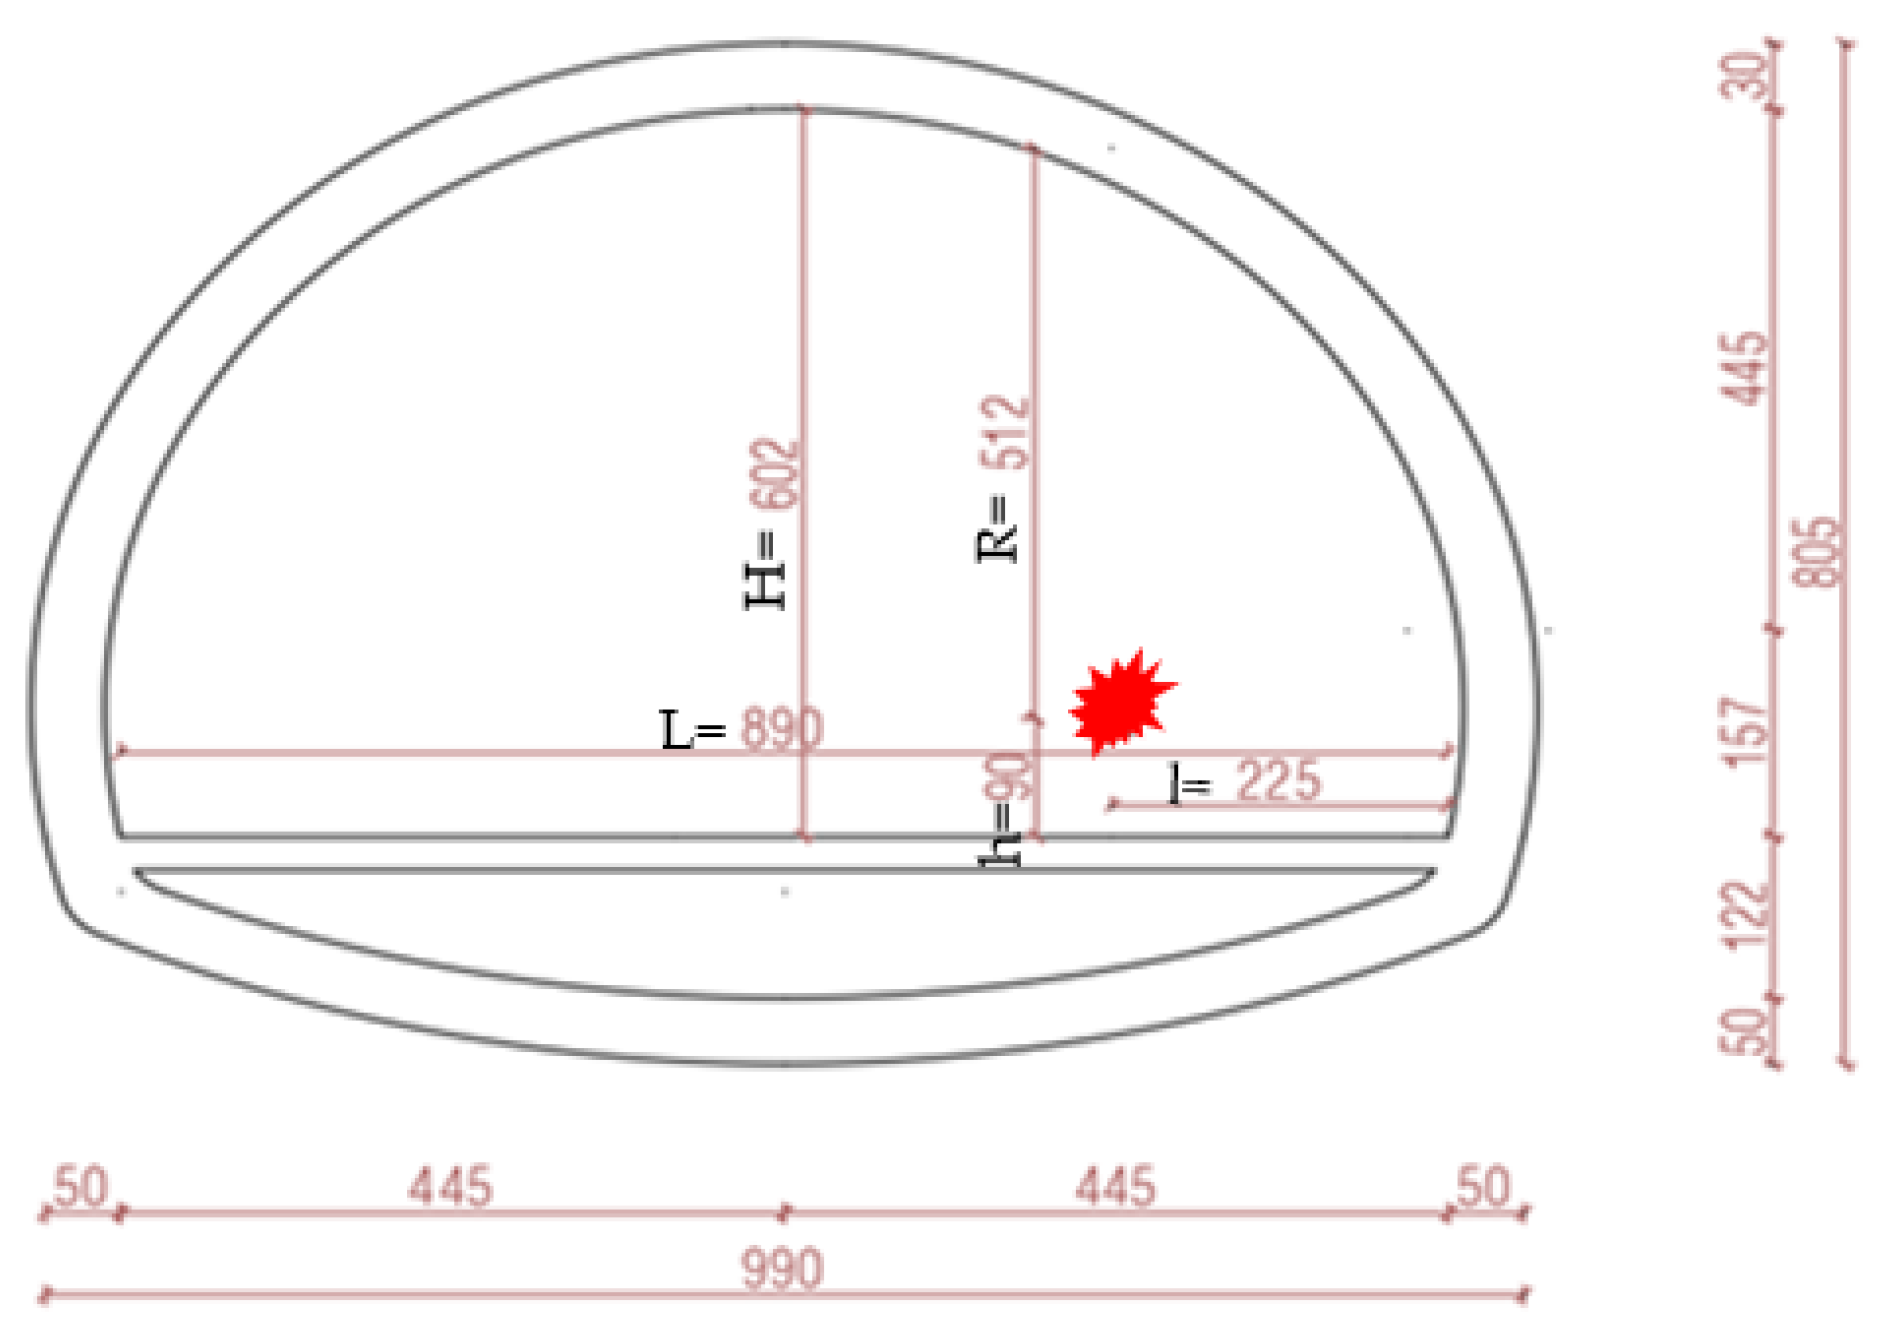
Figure 8 presents the location of the explosion point and the distances between the explosion source and the reflecting surfaces.
In this context, h denotes the distance between the explosion source and the vertically reflecting surface, Htunnel represents the height of the vertical reflecting surface, l denotes the length of the vertically reflecting surface, Ltunnel represents the distance between the explosion source and the horizontally reflecting surface, and R denotes the distance between the explosion source and the surface at which the response is evaluated. According to the UFC 3-340-02 standards, the ratio of the distance from the explosion source to the vertical reflection surface to the height of the vertical reflection surface, h/Htunnel and the ratio of the horizontal distance between the explosion source and the horizontal reflecting surface to the width of the horizontal reflecting surface, l/Ltunnel are combined with the number of reflecting surfaces to determine the peak reflected pressure and the scaled reflected impulse.
Since the explosive charge within the tunnel cross-section is surrounded by four nearby reflective boundaries (the crown, invert, and two sidewalls), the internal blast loading was treated as occurring within a partially confined volume that is bounded by reflective surfaces but is not fully enclosed. In the longitudinal direction (along the tunnel axis), the bidirectional wave propagation and venting effects prevent the assumption of a fully enclosed chamber. Accordingly, the partial confinement charts corresponding to a configuration with four enclosed surfaces and two open surfaces were selected from the UFC 3-340-02 guideline. In the UFC 3-340-02 guideline, the number of reflecting surfaces (N) of a structure is a governing parameter in the calculation of blast loads. Accordingly, the circular/arched tunnel cross-section was idealized as a “four-surface reflective structure” (roof, invert, and two sidewalls) in terms of shock wave reflections.
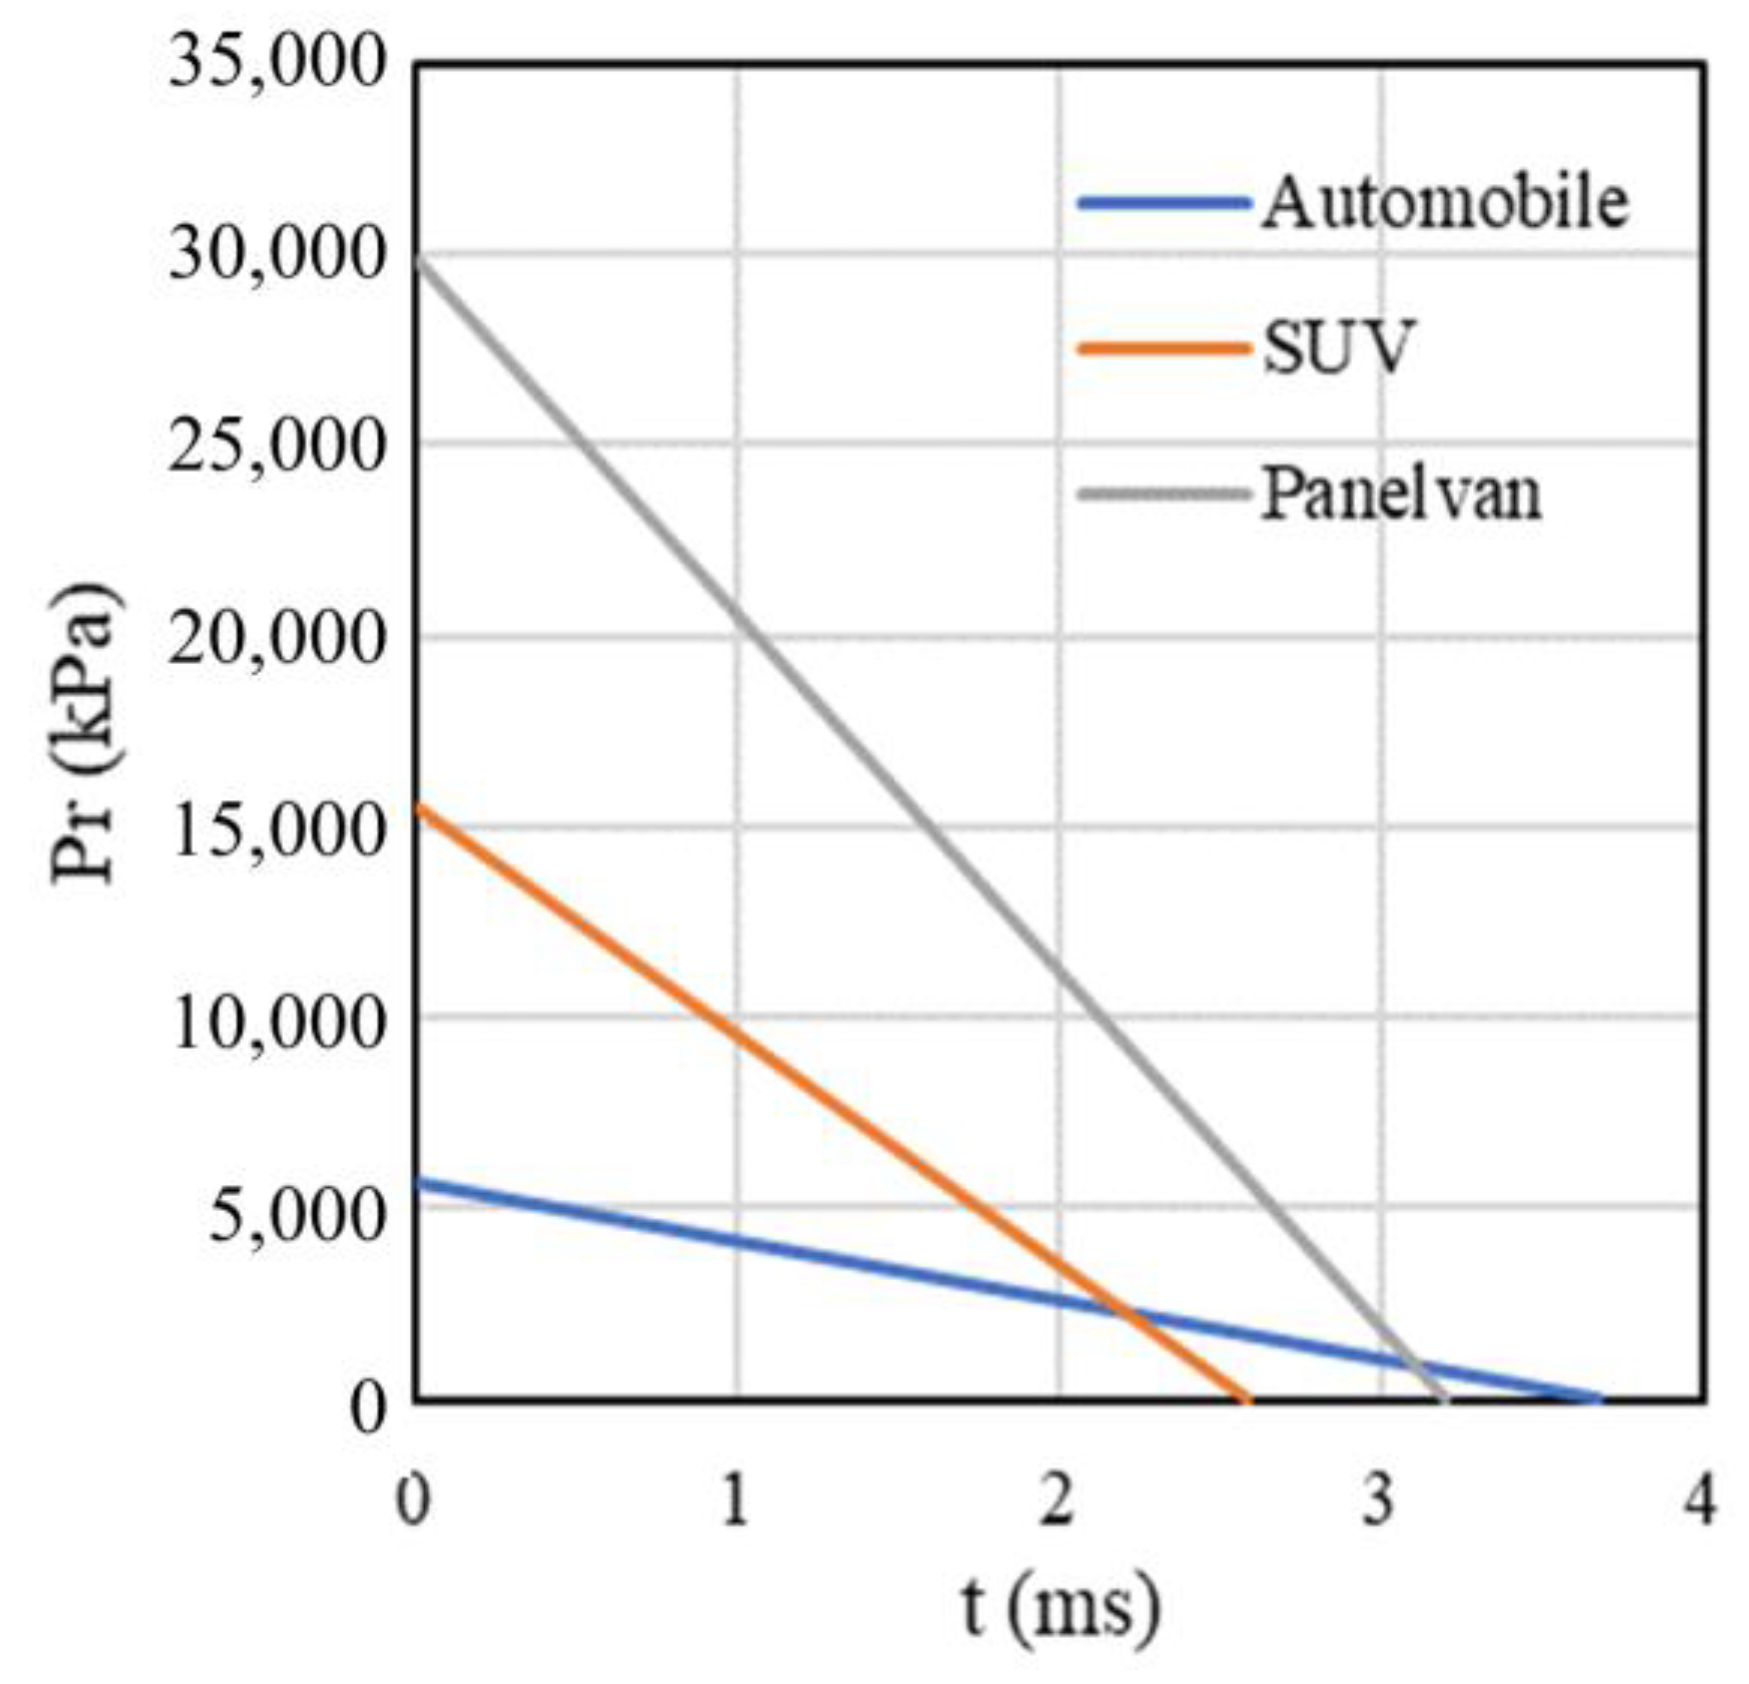
Table 4 presents the reflected pressure and impulse values calculated for automobile, SUV, and panel van explosion scenarios. In rectangular rooms (closed enclosures), post-blast gases become trapped inside and generate a long-duration static pressure. However, since a tunnel is a “long” structure with both ends open, this condition was evaluated as a fully or partially vented blast scenario. Since there are no obstacles on the tunnel roadway level and the contact area with air is relatively large, the effects of gas pressure are neglected in this study.
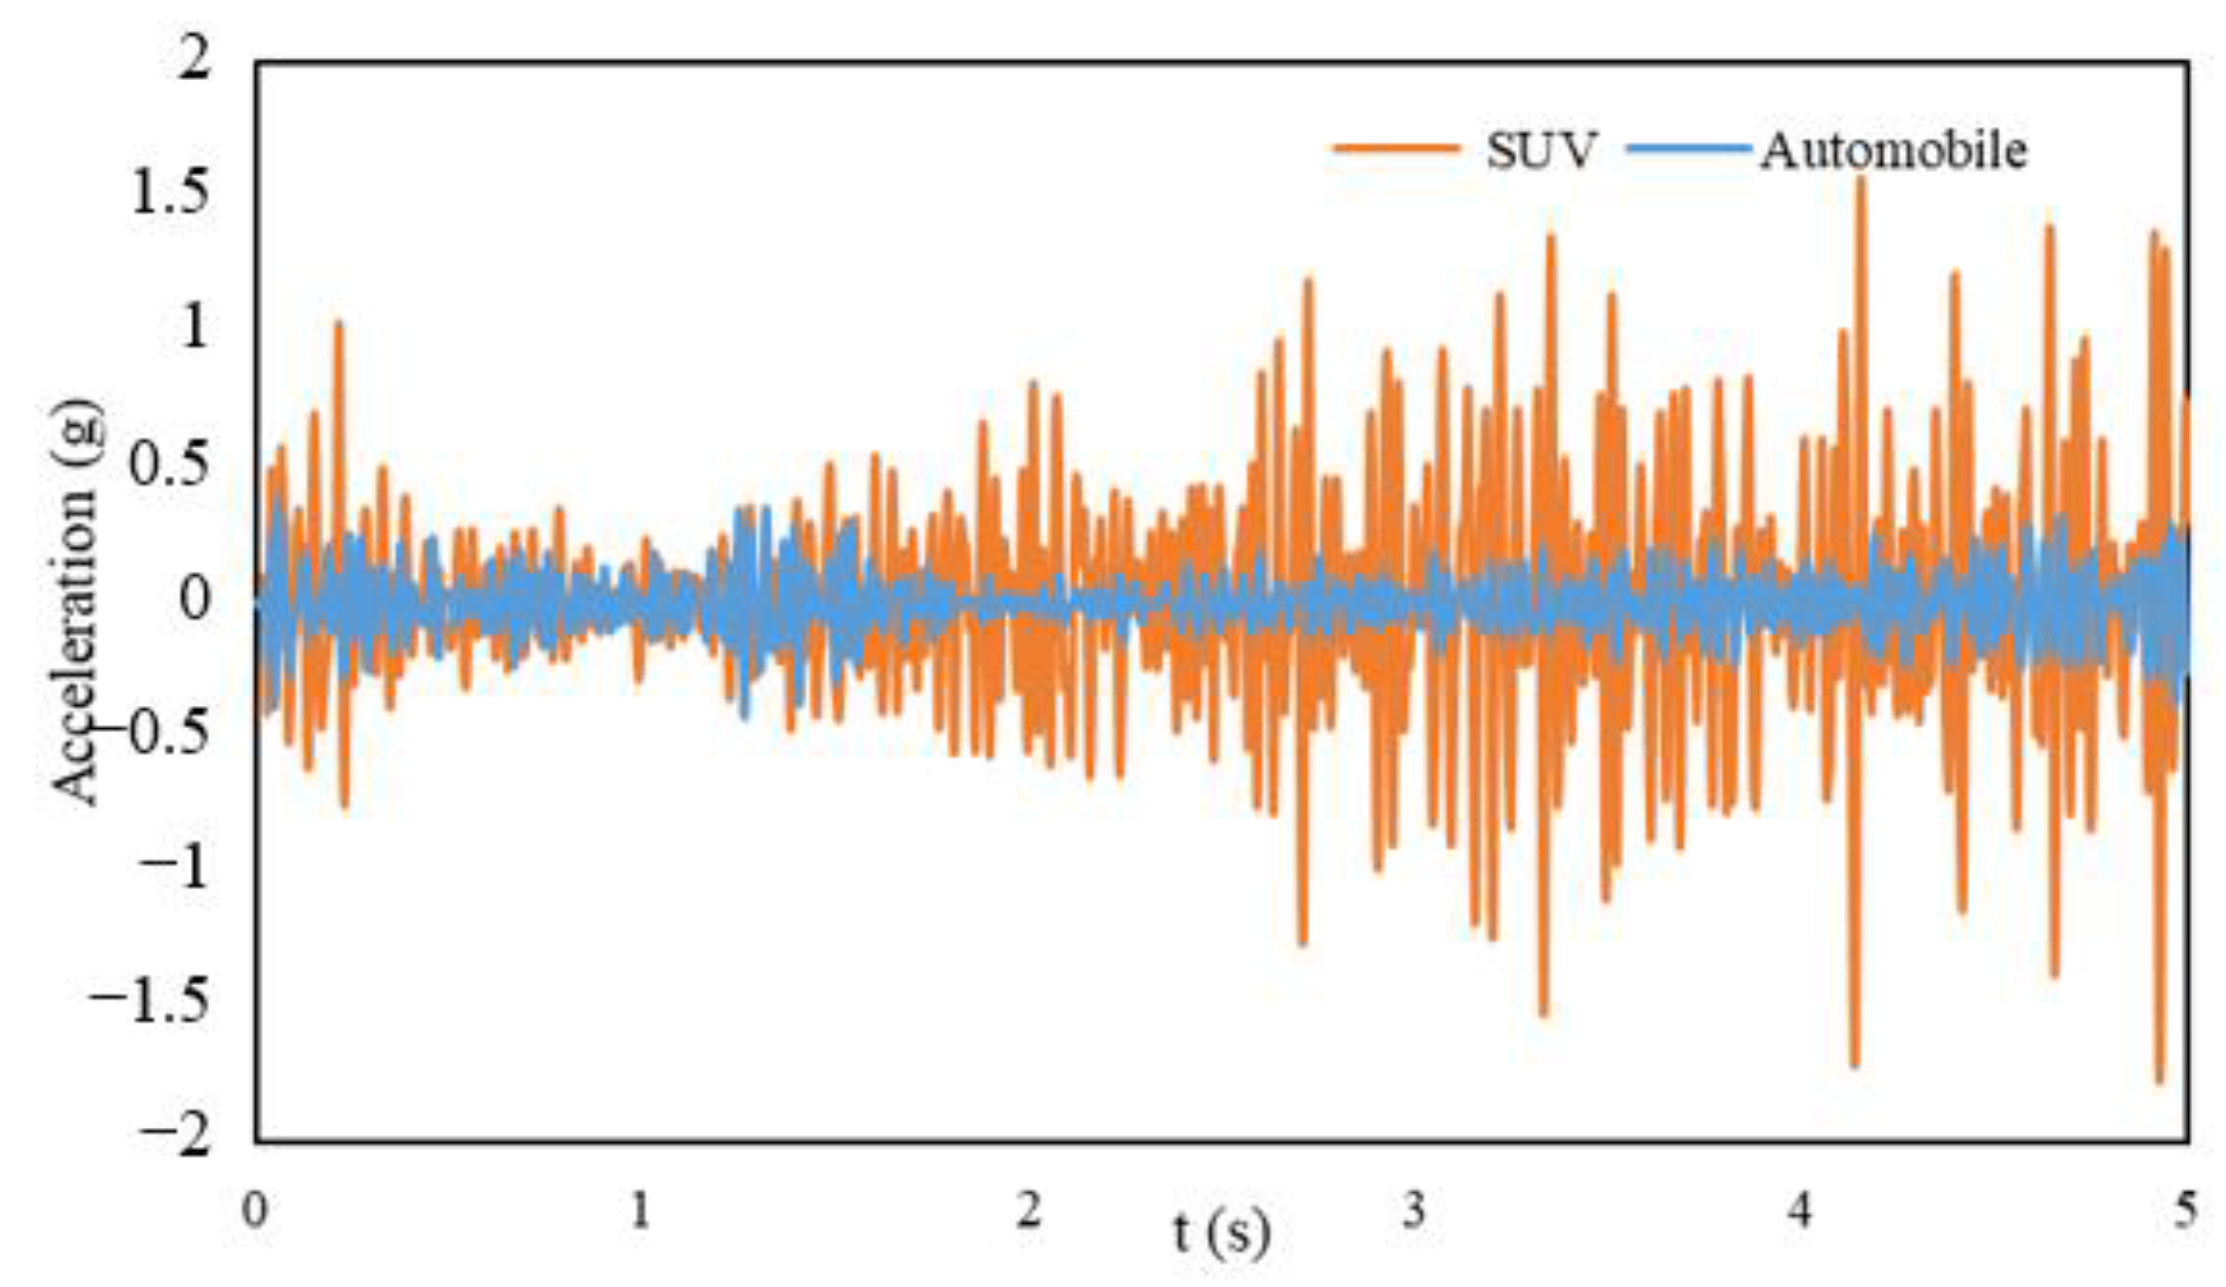
Figure 9 illustrates the time history of the blast loading.
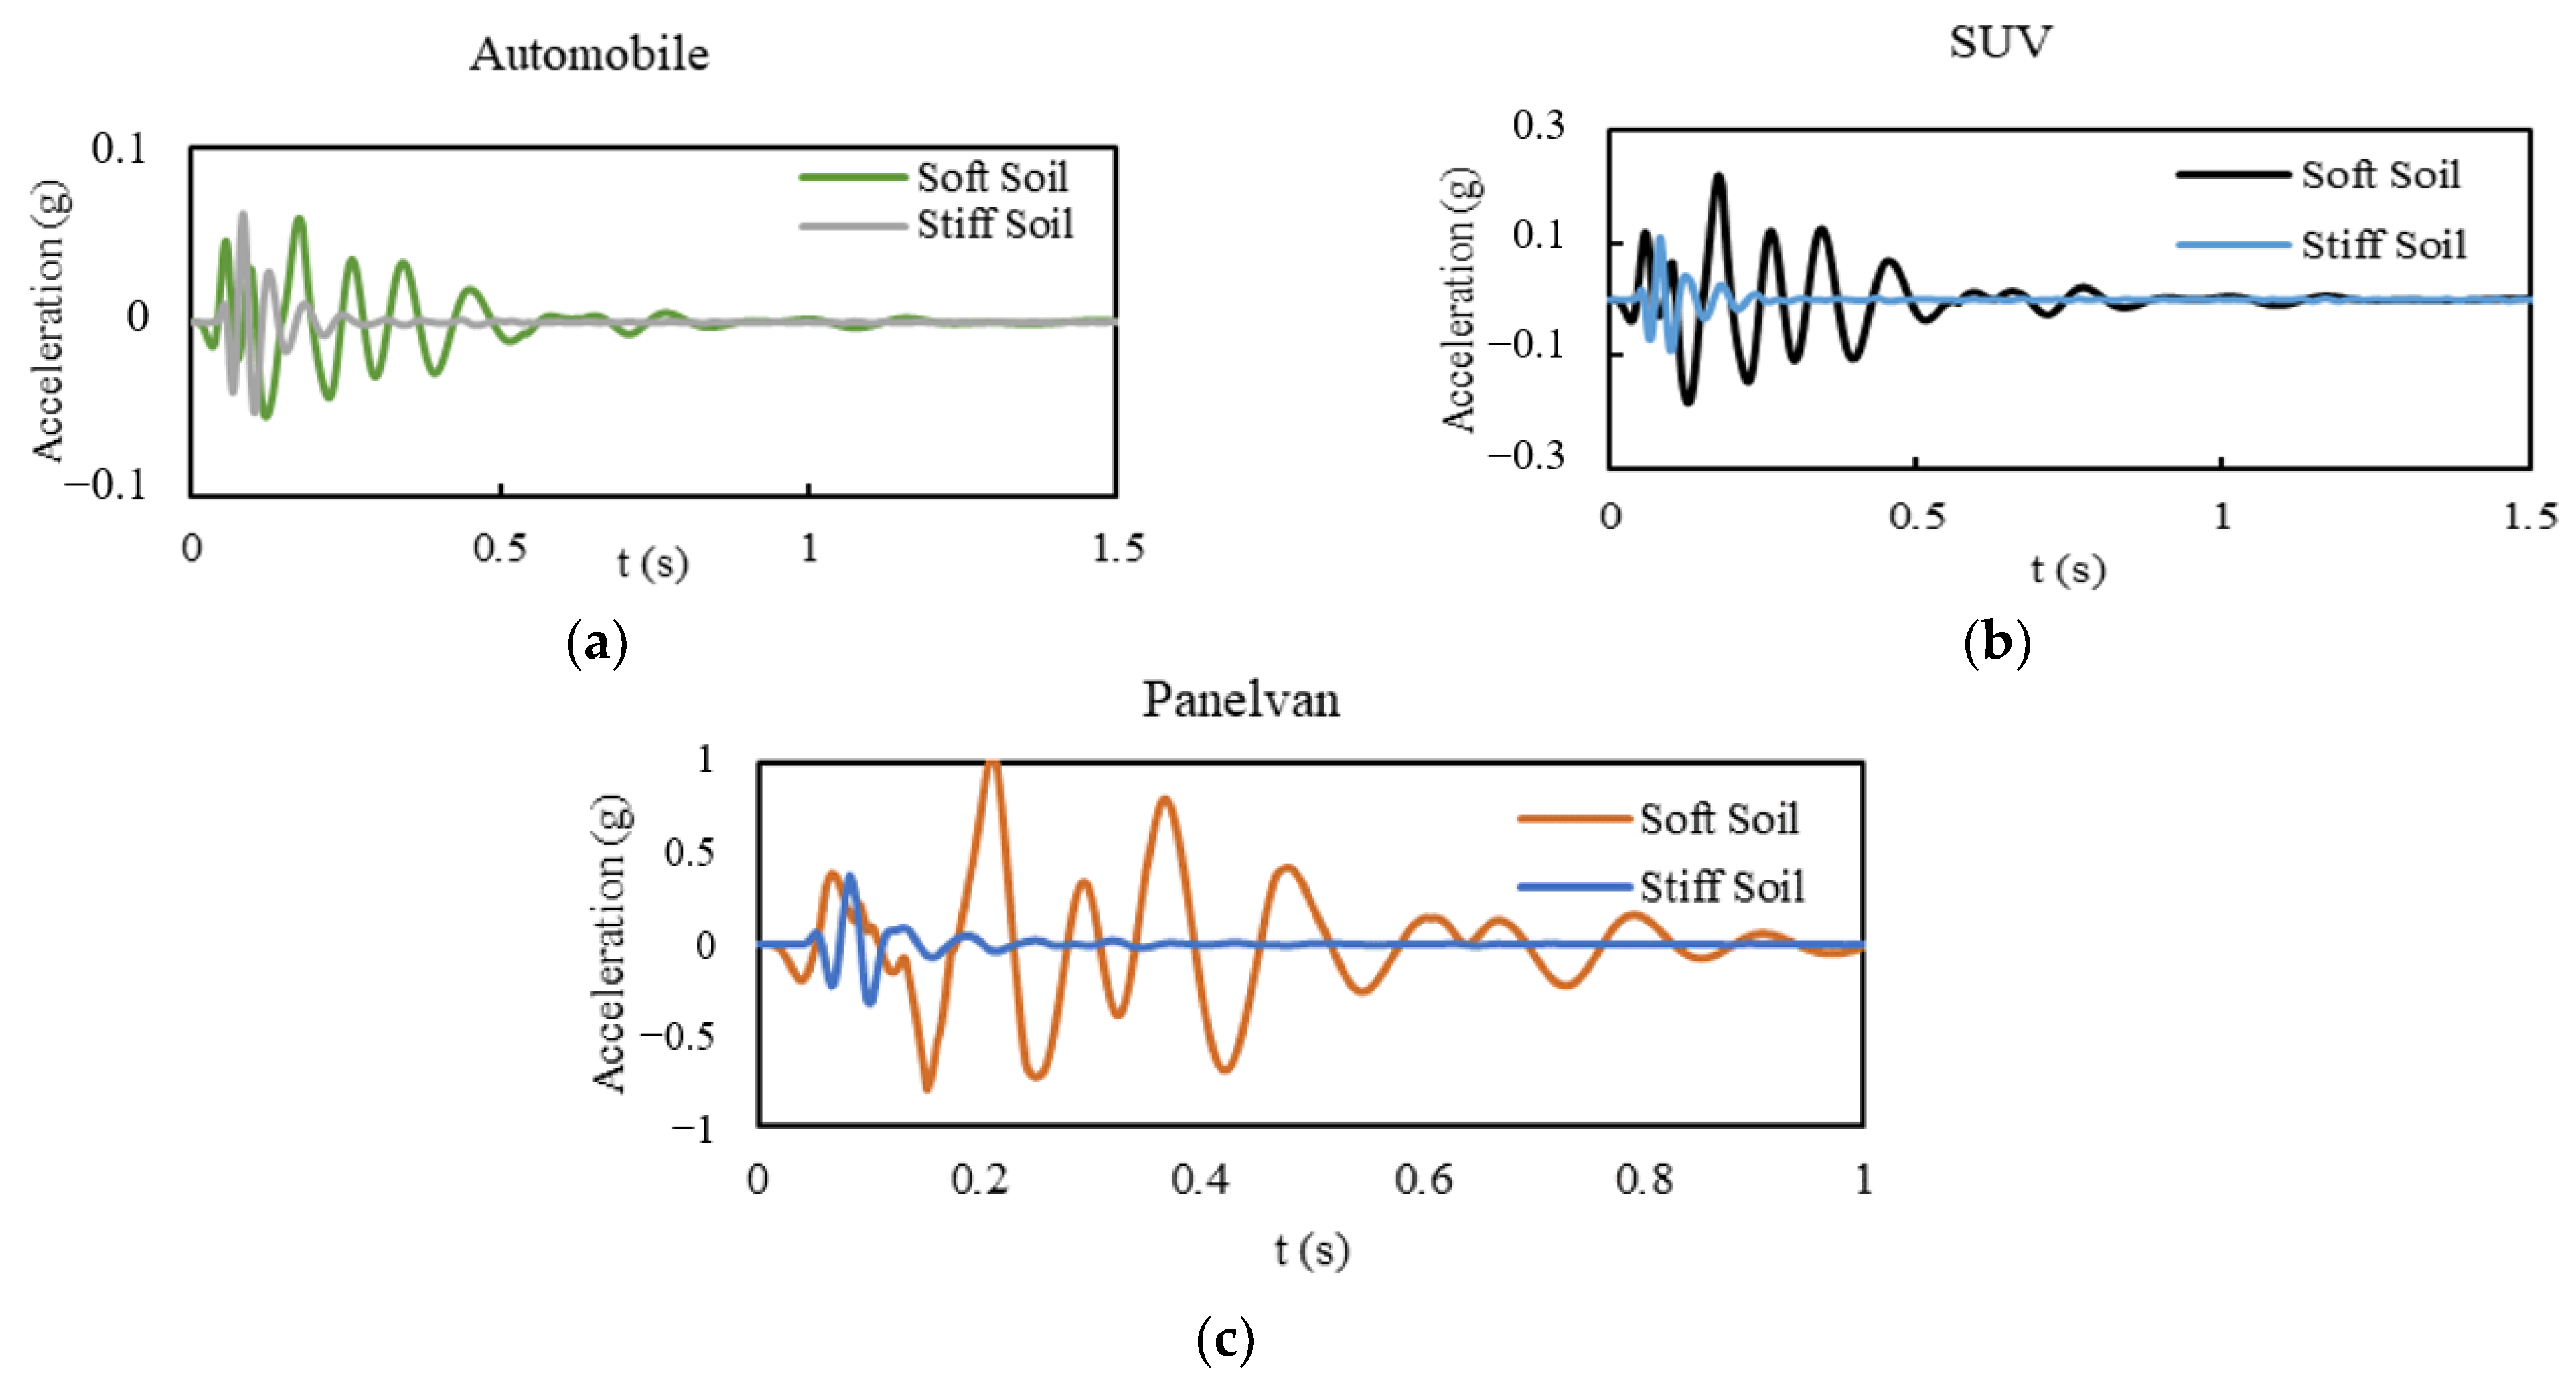
The effect of soil type on system behavior is investigated for automobile, SUV, and panel van explosion scenarios occurring at a tunnel depth of 37 m. The analyses are performed based on the soil mechanical properties presented in
Table 2 (
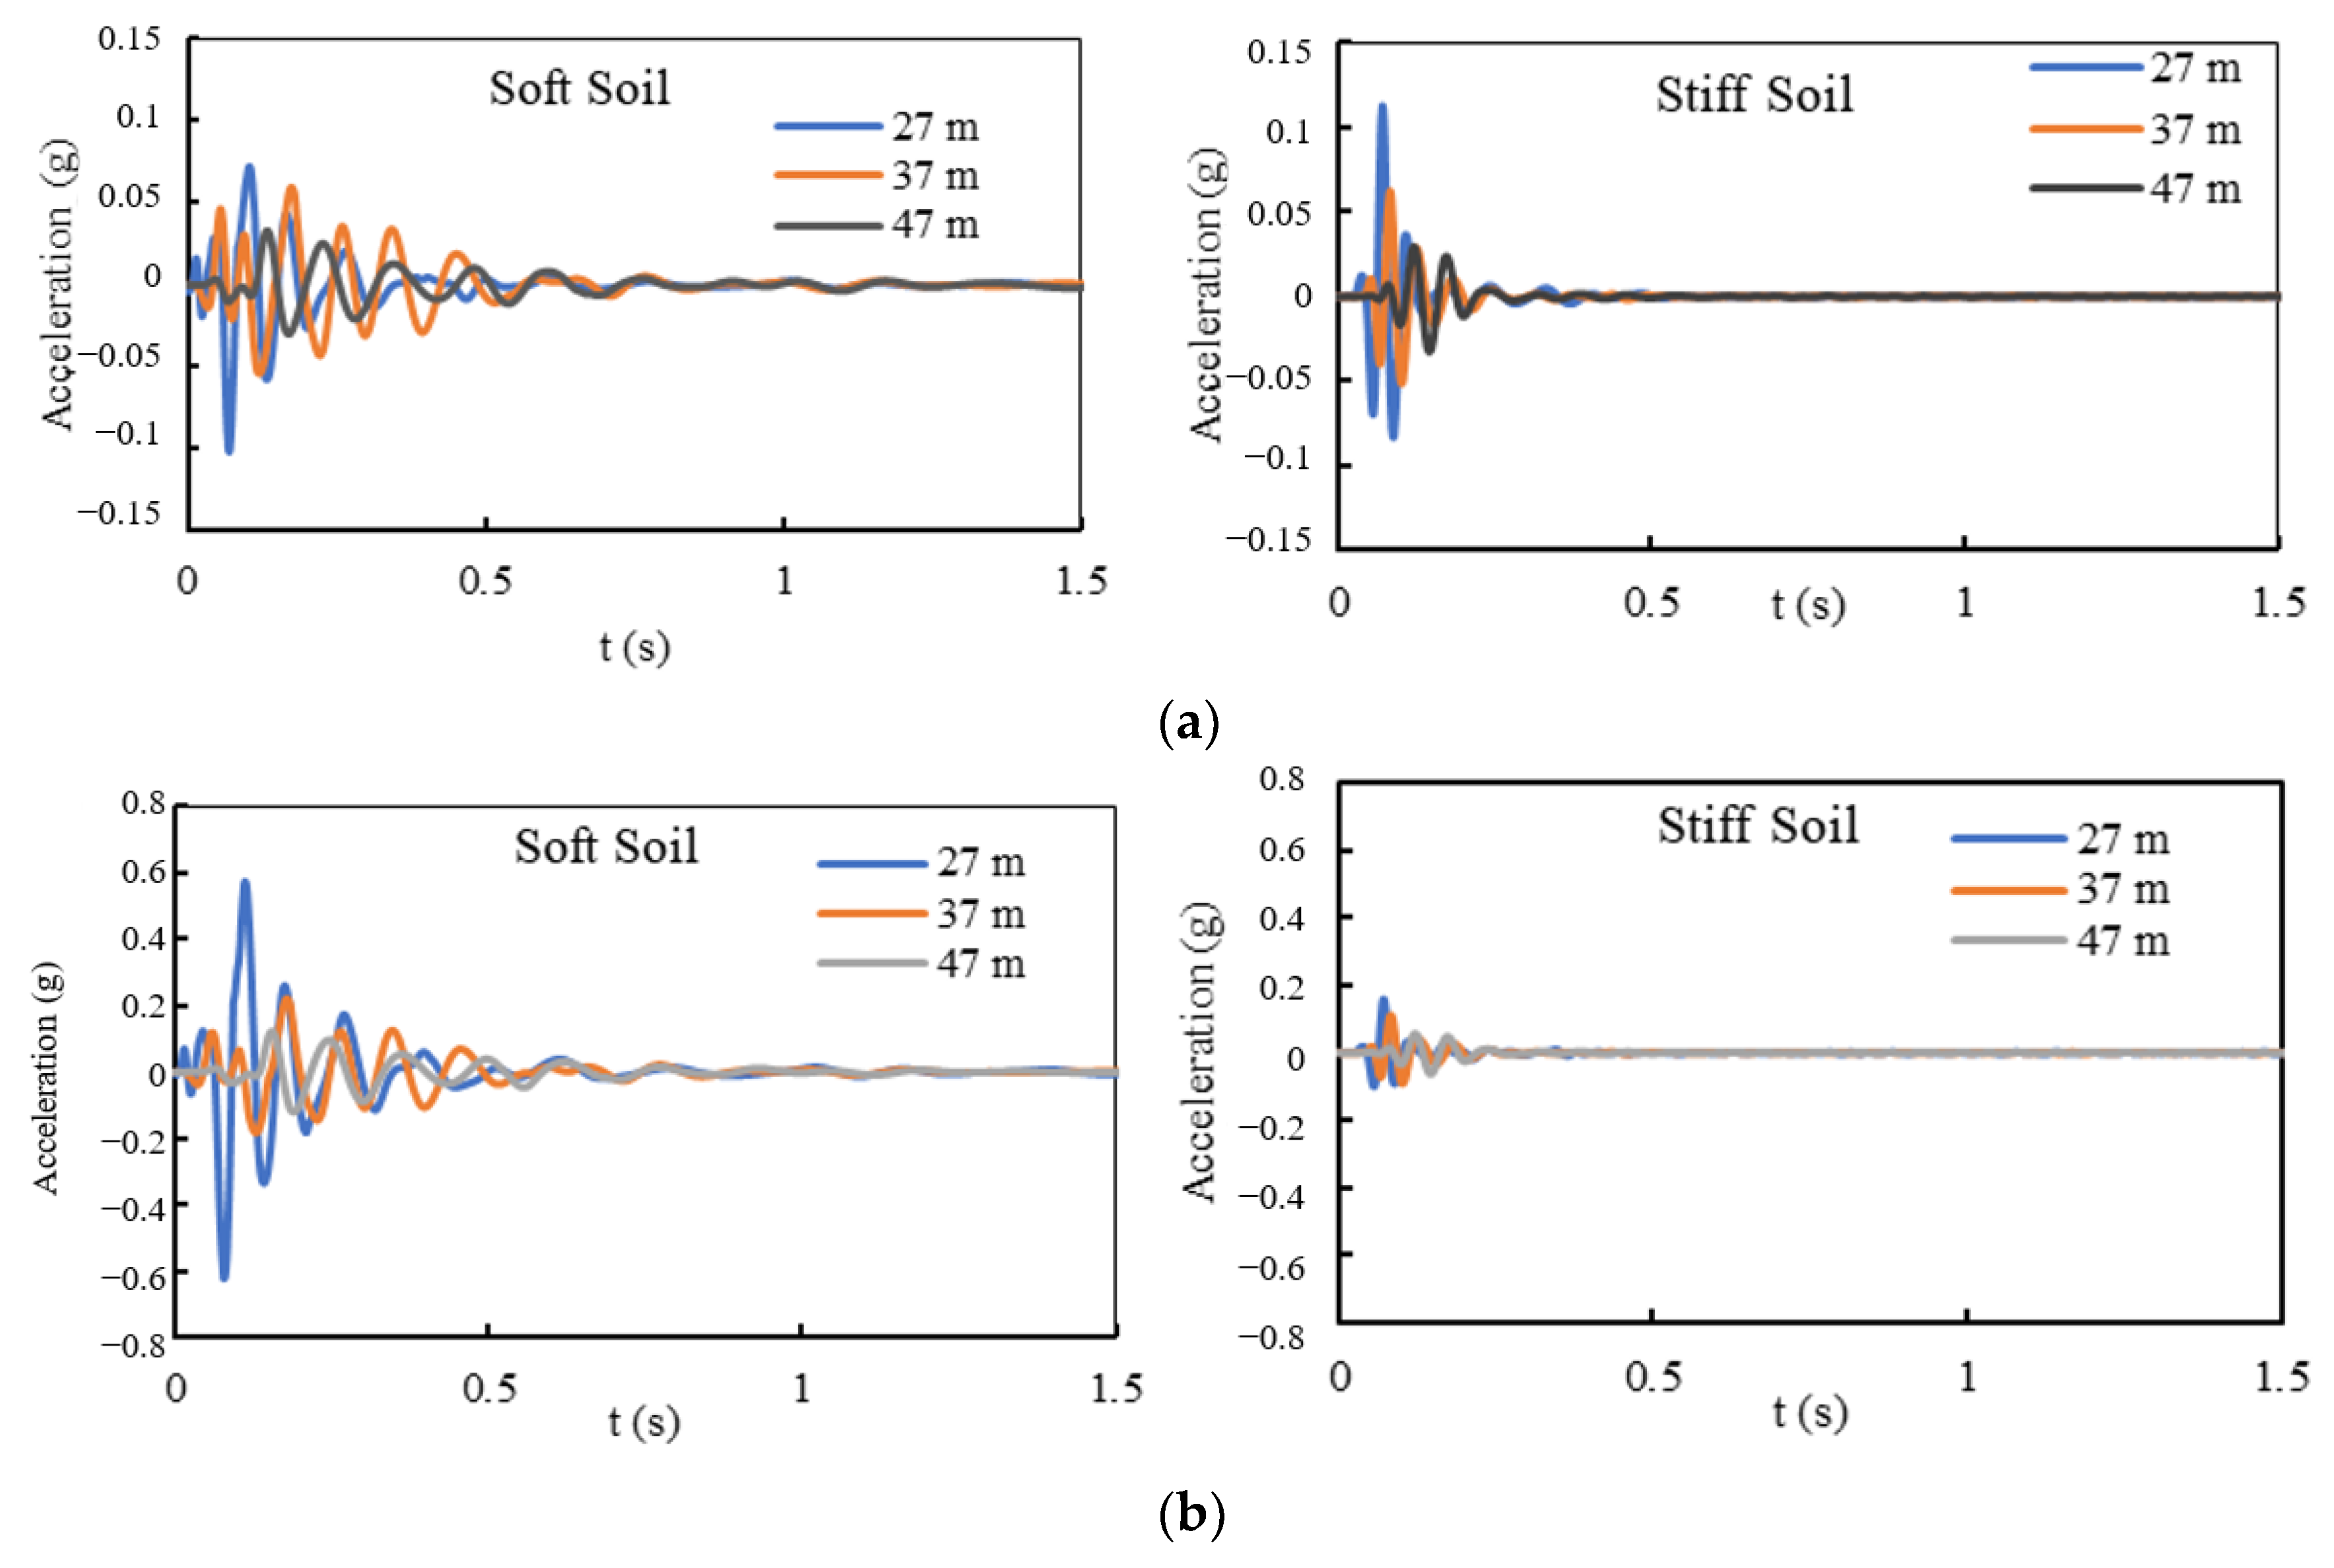
Figure 10).
Figure 10 presents the acceleration time histories recorded at the free-field ground surface for all explosion scenarios. The acceleration records obtained for soft soil conditions exhibit longer wavelengths compared to those observed in stiff soil. As soil conditions improve, an increase in shear wave velocity is generally expected to result in higher wave propagation speeds and, consequently, larger acceleration amplitudes. However, this trend is not consistently observed in the present study. In soft soil conditions (low Vs), the tunnel structure can move compatibly with the deformable soil and undergo elastic deformation (settlement). In contrast, in stiff soil conditions (high Vs), the tunnel is constrained by the rigid surrounding soil, and the resulting high force demands are transferred directly to the tunnel cross-section, causing damage in the form of plastic deformation. Consequently, as the tunnel sustains damage, a portion of the applied force is absorbed through structural energy dissipation, and a smaller fraction of the force is transmitted back into the surrounding soil medium.
This behavior can be attributed to the interaction between the tunnel structure and the surrounding soil. When an explosion occurs within soft soil, the relatively higher Poisson’s ratio of the soil (ν = 0.4) allows greater deformation, enabling the tunnel to undergo displacement without a significant loss of structural integrity. In contrast, when the explosion occurs within stiff soil, the lower Poisson’s ratio (ν = 0.2) restricts soil deformation, leading to damage in the tunnel lining. During this damage process, a portion of the blast energy is absorbed by the tunnel structure, resulting in a reduced transfer of force to the surrounding soil medium.
In the automobile explosion scenario, the tunnel structure experiences less damage compared to the SUV and panel van explosion cases. Consequently, the tunnel retains its structural capacity and transfers a larger portion of the blast energy to the surrounding soil. Under these conditions, it is observed that acceleration amplitudes increase with increasing shear wave velocity in the stiff soil environment. However, for the SUV and panel van scenarios, the energy dissipated through damage in the tunnel lining significantly reduces the energy transmitted to the soil, resulting in acceleration levels that are, on average, approximately three times lower than those observed in soft soil conditions.
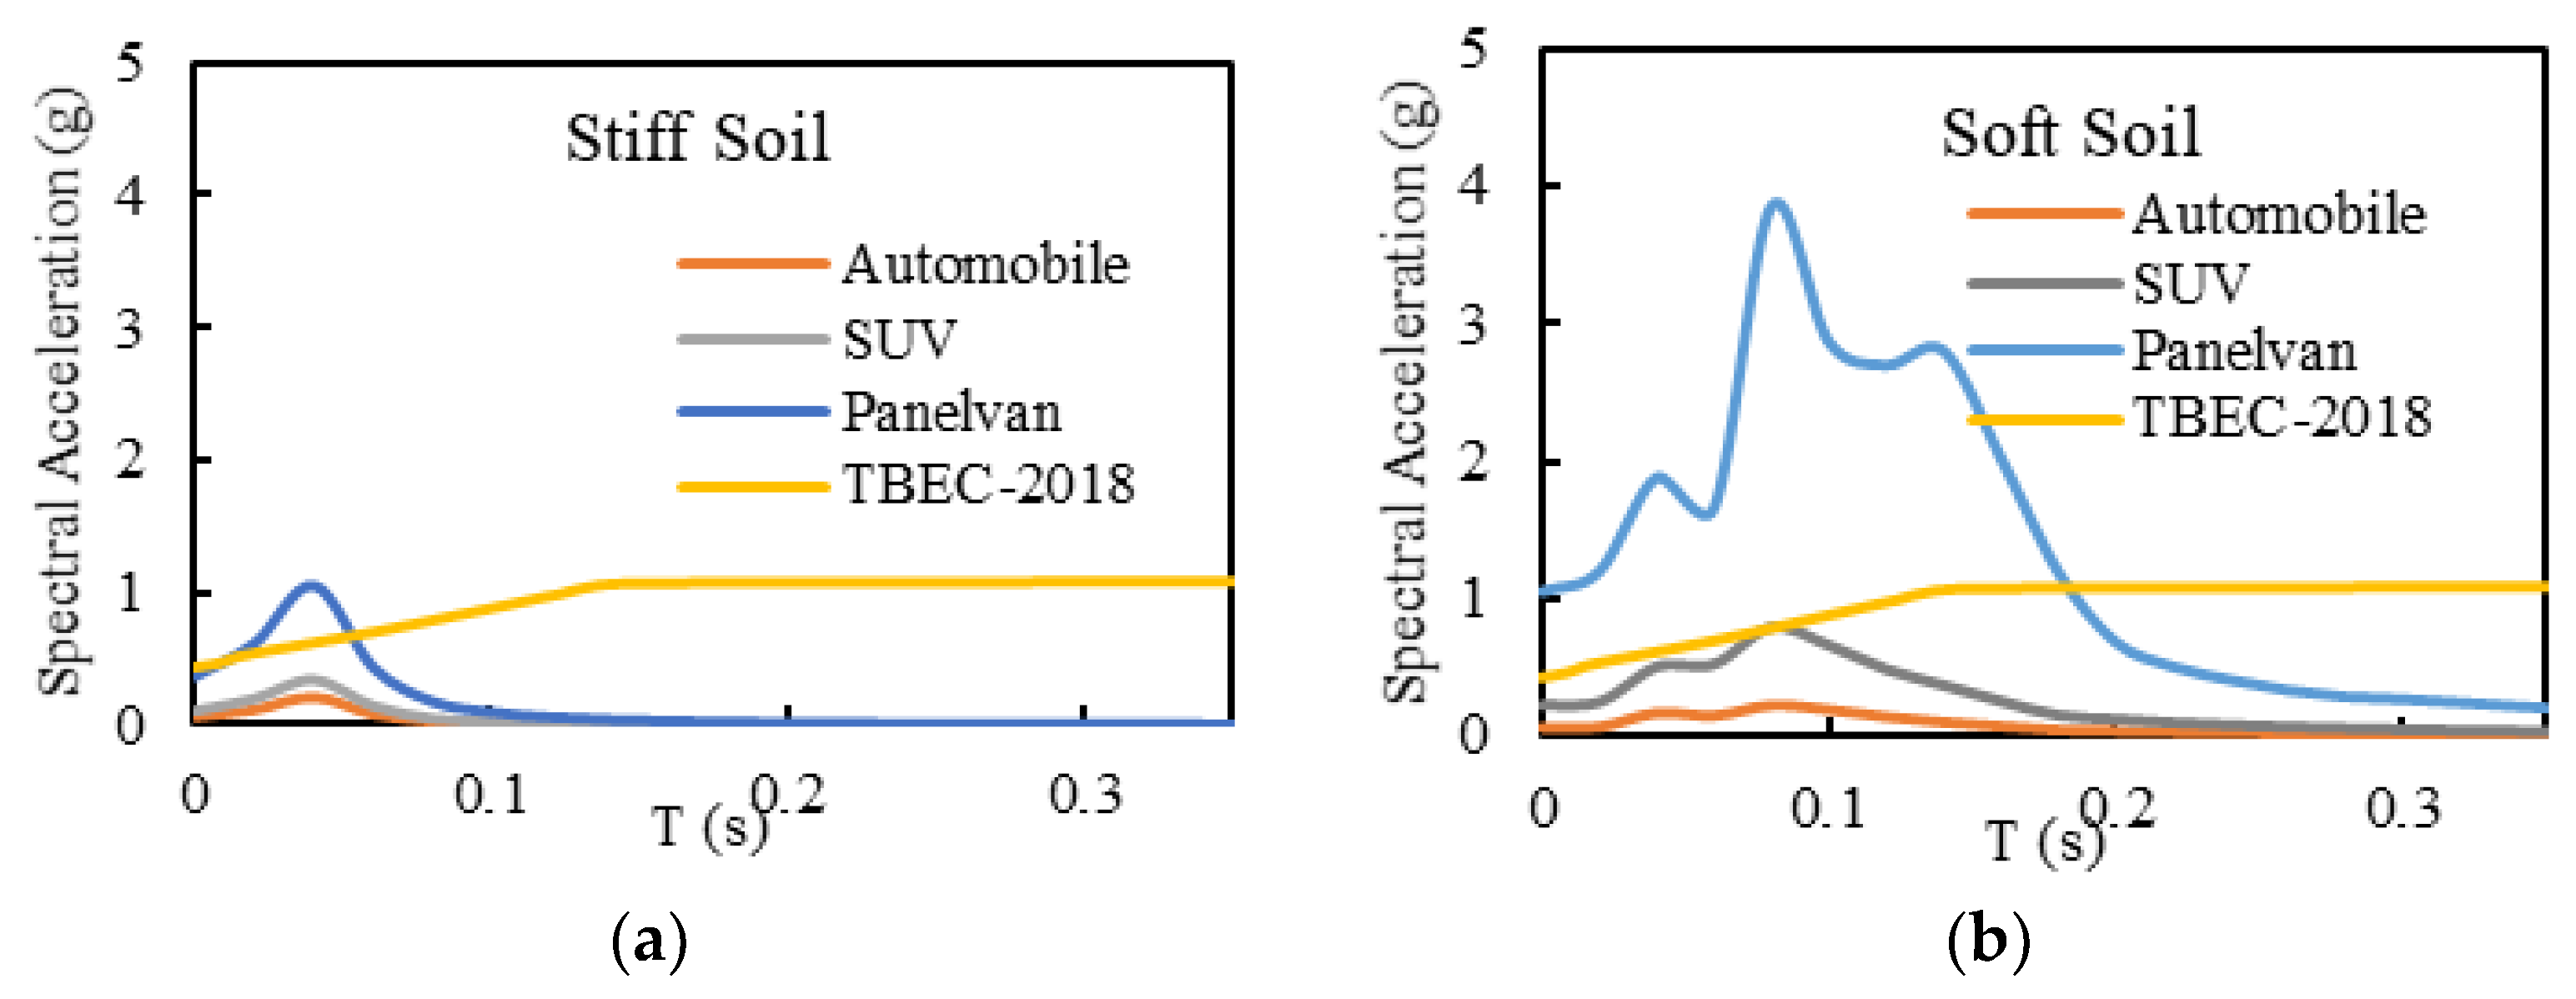
The acceleration responses obtained from the numerical analyses were converted into response spectra using the Seismo-Signal v2022 software [
22] for a damping ratio of 5% and were compared with the DD2 earthquake-level spectra (475-year return period, 10% probability of exceedance in 50 years) defined in TBEC-2018 (
Figure 11). The blast-induced response spectra indicate that spectral acceleration levels increase with increasing explosion intensity. The maximum spectral accelerations are observed at a period of approximately 0.08 s. For soft soil conditions, the explosion intensity does not significantly affect the period at which the maximum spectral acceleration occurs.
For the automobile explosion scenario, maximum peak acceleration values of 0.202 g and 0.219 g are recorded for stiff soil and soft soil, respectively. In the SUV explosion scenario, the maximum peak accelerations are 0.34 g in stiff soil and 0.789 g in soft soil, whereas for the panel van explosion scenario, peak values of 1.06 g in stiff soil and 3.85 g in soft soil are obtained. When the ratio of acceleration levels between soft and stiff soil conditions is considered, the values are approximately equal for the automobile explosion, while increases of approximately 2.32 times and 3.63 times are observed for the SUV and panel van explosion scenarios, respectively.
In stiff soil conditions, the maximum spectral accelerations occur at a period of 0.04 s, whereas in soft soil they occur at 0.08 s, indicating an approximately twofold increase in the characteristic duration. Consistent with the free-field acceleration time histories, the lower Vs in soft soil spreads the wave packet over time, prolonging the time to reach the peak value and increasing the dominant period. However, in an internal tunnel-blast problem the surface response is not governed solely by Vs; impedance-controlled coupling and the energy transmission path through the lining soil system are also decisive. While soft soil with lower impedance tends to produce a longer-duration response and a slower apparent decay, in stiff soil especially under high-intensity loading a portion of the energy may be consumed by lining deformation/damage, reducing the energy radiated into the surrounding ground. Therefore, the higher spectral accelerations observed in soft soil should be interpreted as the combined outcome of wave-propagation characteristics and soil structure interaction.
In the short-period range, the response spectrum obtained for the panel van explosion locally exceeds the DD2 (475-year return period, 10% probability of exceedance in 50 years) earthquake-level spectra specified in TBEC-2018. This behavior indicates that, under stiff soil conditions, the high wave propagation velocity leads to increased acceleration demands, which may result in elevated shear forces and bending moments in the tunnel lining. At longer periods, the blast-induced spectral accelerations decrease rapidly and remain below the DD2 earthquake-level spectra.
Under soft soil conditions, particularly for the panel van explosion, the response spectrum is observed to significantly exceed the DD2 earthquake-level spectra within the short- to intermediate-period range. In soils with low shear wave velocity, the prolonged trapping of wave energy and amplification effects cause increases in spectral accelerations in terms of both amplitude and period range. This behavior indicates that surface structures may be subjected to acceleration and displacement demands exceeding the design levels prescribed by the code.
To investigate the effect of explosion depth on vibration propagation, the tunnel is kept within the same soil medium while the overburden thickness above the tunnel crown is varied to 17 m, 27 m, 37 m, and 47 m, and the resulting responses at the free-field ground surface are examined.
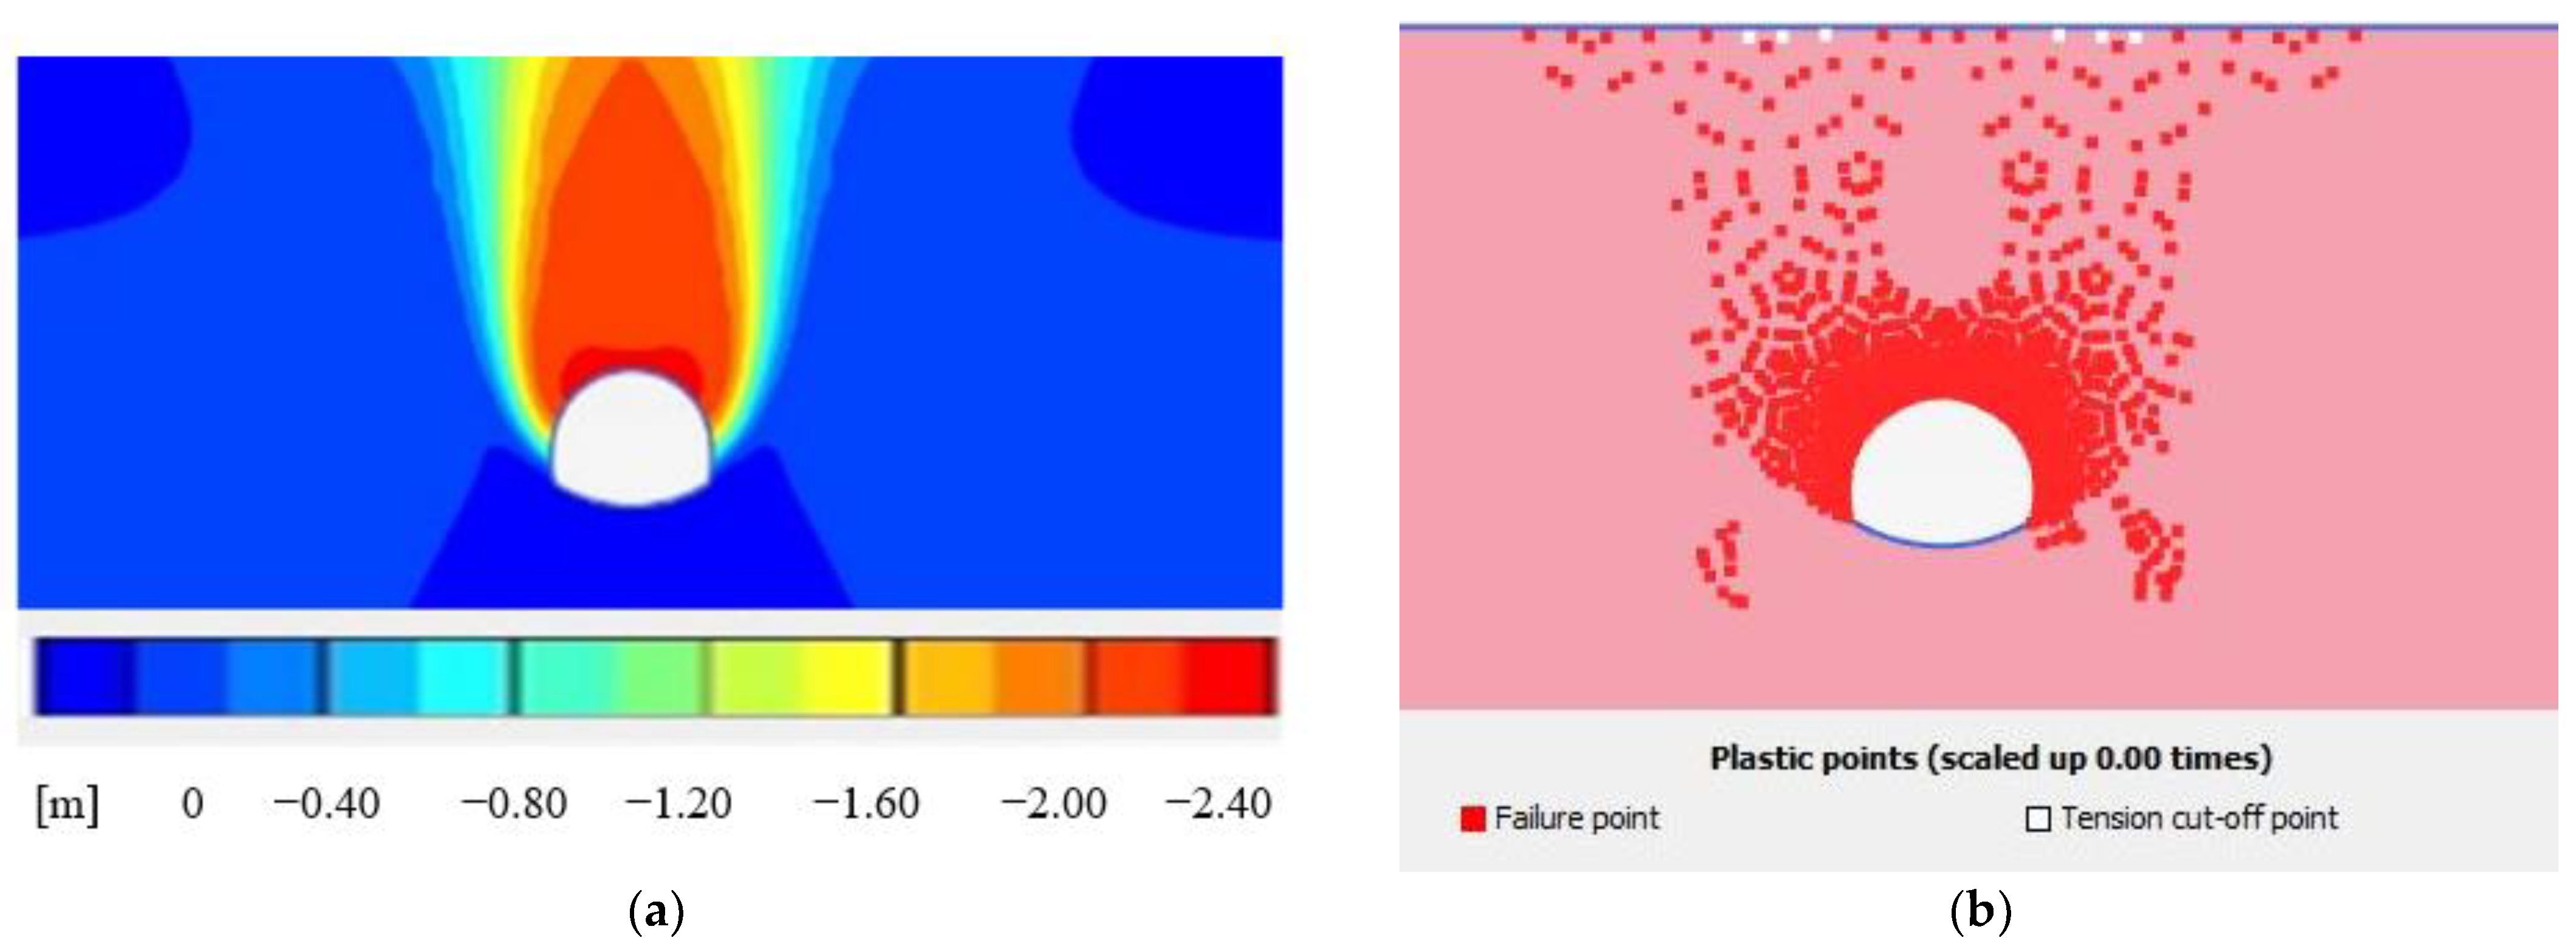
Under soft soil conditions, once the tunnel excavation reached a cover depth of 17 m, pronounced plastic deformations developed within the soil mass even before the application of any blast loading. Due to the low stiffness and limited shear strength of the soil, the confining pressure around the tunnel crown and sidewalls rapidly decreased after excavation, leading to the formation of an extensive plastic zone. This behavior indicates that the soil–tunnel system was already close to a limit equilibrium state under geostatic loading conditions alone. Consequently, following tunnel excavation, the soil bearing capacity became insufficient and a collapse of approximately 2.377 m occurred. As illustrated in
Figure 12, failure developed in the soil above the tunnel, and the analysis was terminated at this stage. Therefore, it is clearly demonstrated that the system lacks sufficient residual bearing capacity to resist additional dynamic loads and that a progressive collapse mechanism was triggered independently of the blast effects.
Under stiff soil conditions, no collapse or widespread plastic deformation is observed at a cover depth of 17 m under excavation and geostatic loading alone. However, once the blast load is applied, the system does not exhibit a geometric failure mechanism but instead shows dynamic instability. Owing to the high wave propagation velocities and relatively low material damping in stiff soils, stress waves undergo multiple reflections between the tunnel and the ground surface. This wave superposition leads to dynamic amplification, causing acceleration and displacement responses to increase over time rather than attenuate. This behavior indicates that the system becomes unstable from both numerical and mechanical perspectives (
Figure 13).
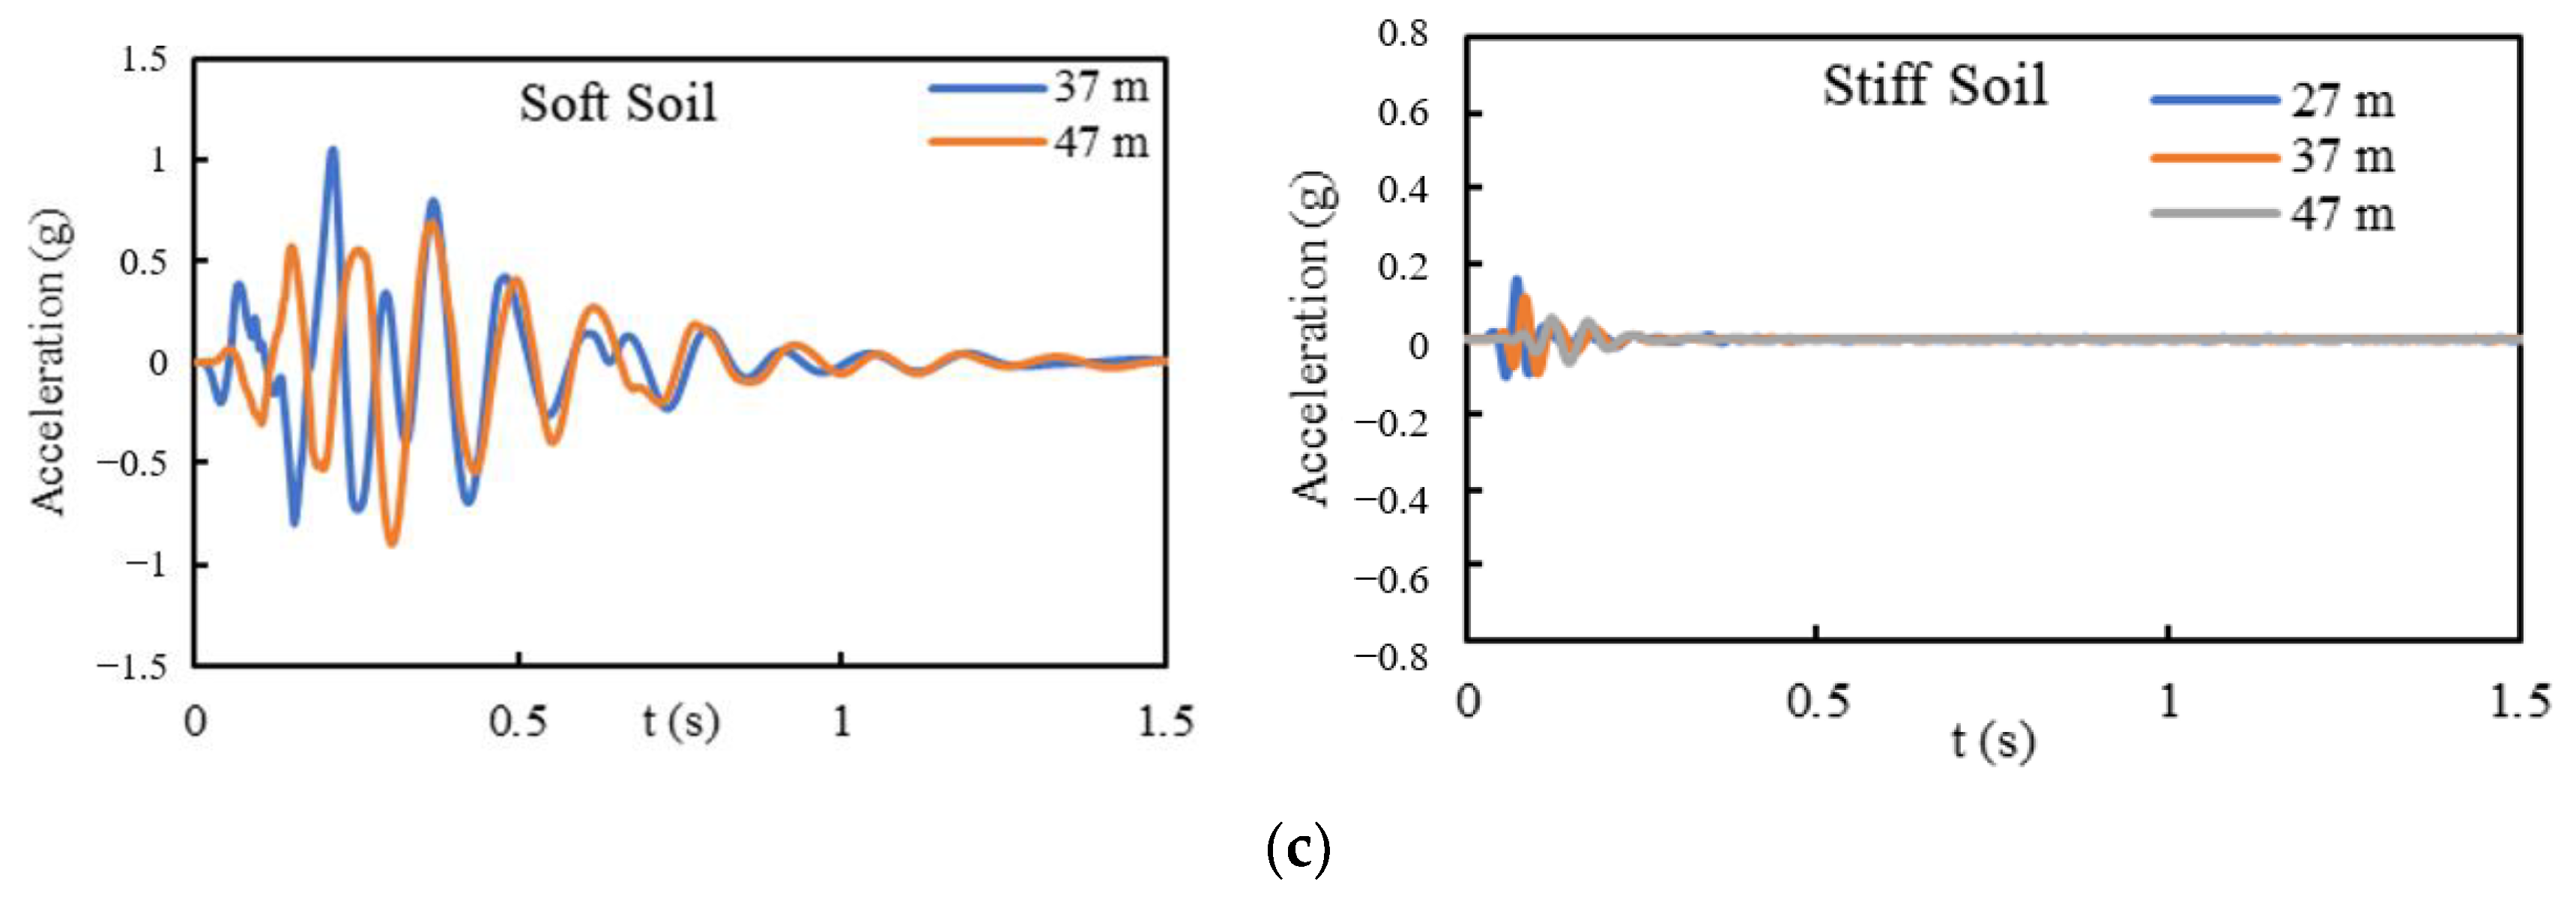
During the analysis, points within the soil domain begin to undergo plastic deformation, leading to numerical and mechanical instability of the system. For this reason, only the variations observed at the free-field ground surface for tunnel cover depths of 27 m, 37 m, and 47 m are presented in
Figure 14.
The free-field acceleration time histories in
Figure 10 and
Figure 14 vary systematically with soil wave velocity (Vs) and propagation/attenuation mechanisms. In soft soil, lower Vs leads to stronger soil amplification, higher peak accelerations, and longer-duration oscillations with a slower decay of the response envelope. In stiff soil, higher Vs concentrates the response into a shorter-duration, lower-amplitude wave packet that attenuates rapidly. Increasing the tunnel cover depth (27–37–47 m) generally reduces peak accelerations due to geometric spreading and cumulative material attenuation, with a more pronounced effect in soft soil. These contrasts become more evident for the higher-intensity panelvan scenario, strengthening the mechanistic correlation.
For the automobile explosion scenario, peak accelerations of 0.0997 g, 0.0531 g, and 0.0273 g are recorded in soft soil, while corresponding values of 0.11 g, 0.061 g, and 0.031 g are obtained in stiff soil for increasing tunnel cover depths. In this case, the acceleration levels observed in stiff soil are slightly higher than those in soft soil. Although the tunnel lining experiences damage during the automobile explosion, it does not completely lose its structural capacity. While part of the blast-induced force is absorbed by the tunnel, a significant portion is still transmitted to the surrounding soil.
For the SUV explosion scenario, peak accelerations of 0.595 g, 0.211 g, and 0.102 g are obtained in soft soil, whereas values of 0.158 g, 0.103 g, and 0.061 g are recorded in stiff soil. In this case, despite the tunnel modeled in stiff soil losing a large portion of its structural capacity, collapse does not occur due to the high stiffness of the surrounding soil. However, as the tunnel absorbs a substantial amount of the blast energy while undergoing damage, the acceleration transmitted to the free-field ground surface is lower than that observed in soft soil conditions.
In the panel van explosion scenario, peak accelerations of 1.049 g and 0.89 g are observed in soft soil, while corresponding values of 0.374 g and 0.179 g are obtained in stiff soil. The underlying mechanism in this case is similar to that observed for the SUV explosion scenario.
For all soil conditions, an increase in tunnel cover depth results in a reduction in acceleration levels at the free-field ground surface. As the propagation path length and travel time within the soil increase, wave attenuation becomes more pronounced. In both soft and stiff soils, increasing explosion intensity leads to longer wavelengths, thereby extending the time required for the system to reach a stable state. This stabilization time exceeds 1 s in soft soil conditions, whereas it remains below approximately 0.5 s in stiff soil.
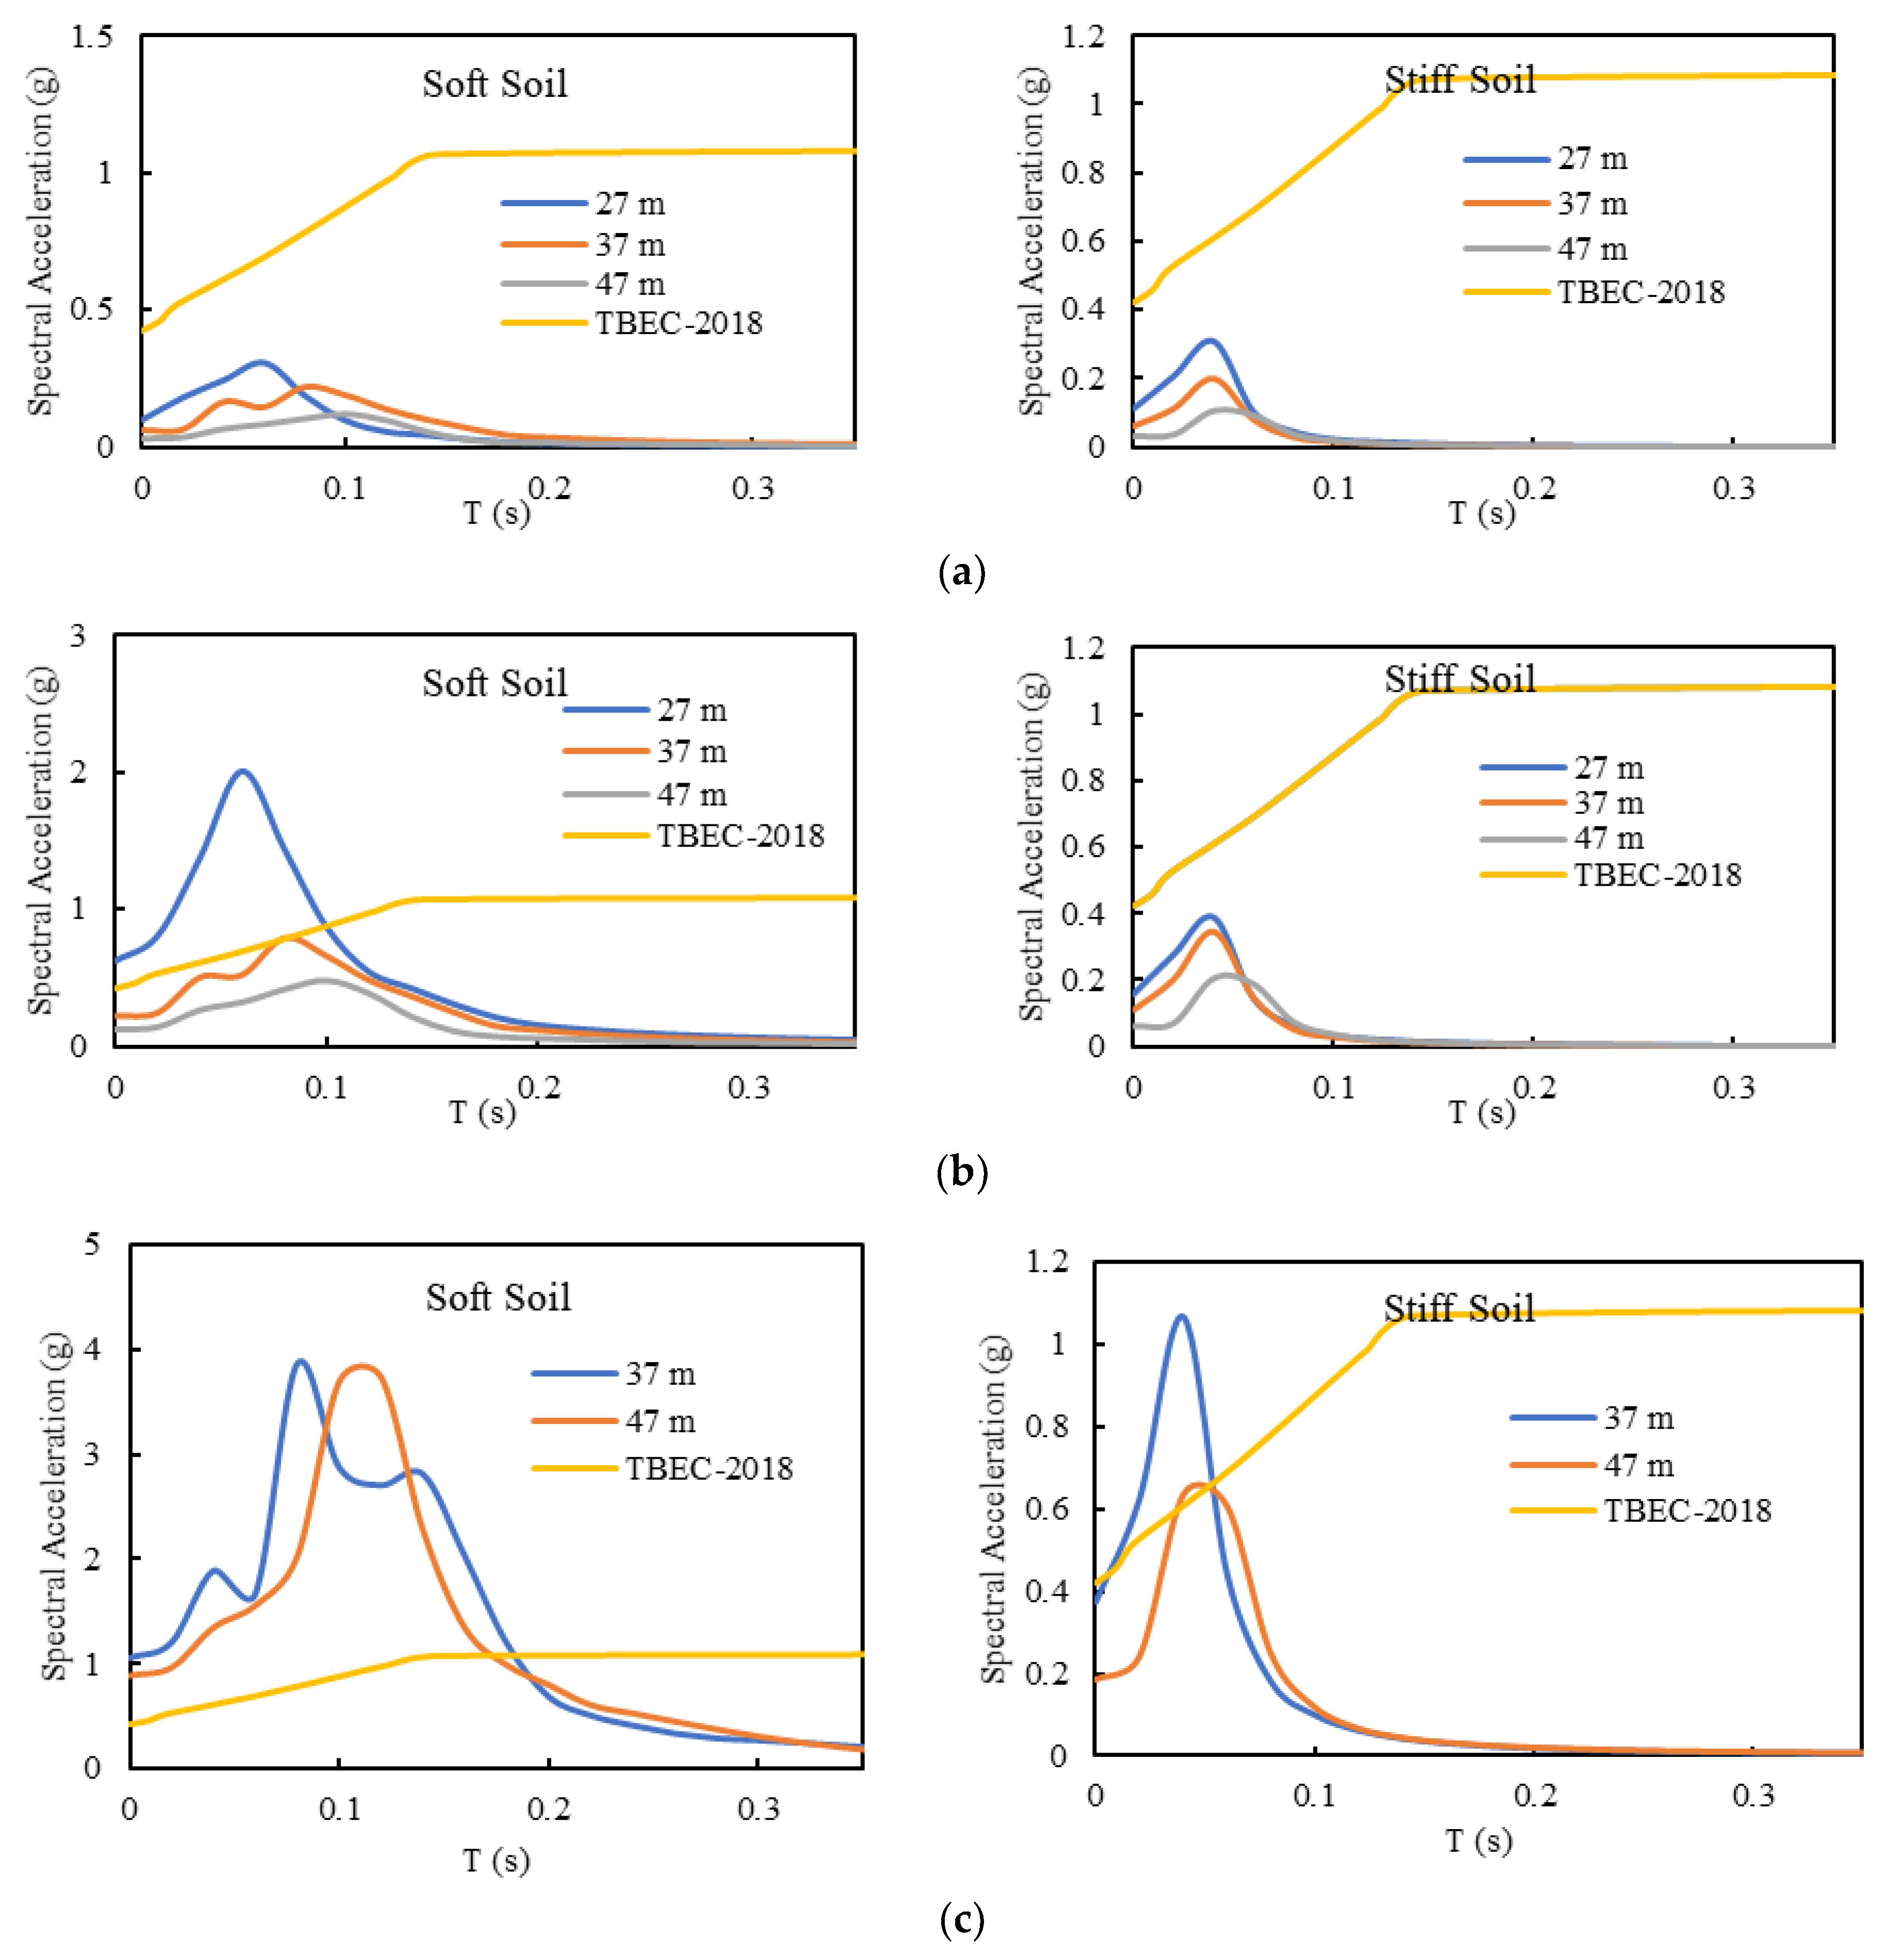
Figure 15 presents the spectral acceleration responses at the free-field ground surface for automobile, SUV, and panel van explosion scenarios under varying tunnel cover depths.
For soft soil conditions, the peak spectral acceleration values are obtained as 0.30 g, 0.22 g, and 0.12 g for the automobile explosion scenario; 2.0 g, 0.789 g, and 0.479 g for the SUV explosion scenario; and 3.85 g and 3.74 g for the panel van explosion scenario. In contrast, for stiff soil conditions, the peak spectral accelerations are recorded as 0.306 g, 0.201 g, and 0.107 g for the auto-mobile explosion, 0.38 g, 0.34 g, and 0.206 g for the SUV explosion, and 1.065 g and 0.633 g for the panel van explosion scenario.
In the soft soil scenarios, the period corresponding to the peak spectral acceleration increases with increasing tunnel cover depth, whereas in stiff soil conditions the period at which the maximum spectral acceleration occurs remains constant at 0.04 s for all cases.
An examination of the blast-induced response spectra indicates that the highest spectral acceleration levels occur in the panel van explosion scenario. Under soft soil conditions, this explosion induces spectral accelerations of 3.73 g for structures with a natural period of 0.1 s, 0.88 g for structures with a period of 0.2 s, and 0.30 g for structures with a period of 0.3 s. These results suggest that structures with short natural periods, particularly around 0.1 s, are highly susceptible to damage under such blast loading conditions.
The exceedance of the design response spectrum by the response spectrum in the short-period range (T < 0.2 s) (
Figure 11 and
Figure 15) indicates that increased shear forces and bending moments may develop in the tunnel lining due to high acceleration demands. This condition points to a potential damage mechanism that may lead to stress concentrations and localized plastic deformations in the lining elements, particularly under stiff soil conditions.
On the other hand, it should not be overlooked that blast-induced waves are not confined solely to the tunnel structure but can also be transmitted toward the ground surface through the surrounding soil medium, thereby affecting surface structures. Especially within the period ranges where the response spectrum approaches or exceeds the TBEC 2018 design spectrum, the acceleration and displacement demands imposed on surface structures may surpass the design levels prescribed by the code. This situation indicates that blast effects may pose a damage potential for both structural and non-structural components of buildings located at the ground surface.
4. Conclusions
In this study, the dynamic effects of explosions occurring in underground NATM tunnels on the soil–tunnel–free-field interaction are investigated in detail using the finite element method. Through a series of multi-parameter analyses considering different explosion types, soil conditions, and tunnel cover depths, blast-induced wave propagation, attenuation mechanisms, and earthquake-like spectral demands at the free-field ground surface are quantitatively evaluated. The main findings of the study can be summarized as follows:
Equivalent TNT charges are defined for different vehicle classes (automobile, SUV, and panel van) based on their maximum explosive carrying capacities, and force–time histories are generated for each scenario. This approach enables the realistic modeling of explosion scenarios representative of urban tunnel environments.
It is observed that as the dimensions of the discretized soil domain increase (i.e., with increasing H and L), the maximum displacements decrease. This finding highlights the necessity of employing sufficiently large soil domains in numerical models to reduce boundary reflections and to achieve a more reliable representation of real soil behavior.
The soil type is found to be a governing parameter affecting both tunnel response and free-field ground accelerations. Under stiff soil conditions, although wave propagation velocities are higher, displacements remain limited; however, force concentrations lead to higher damage levels in the tunnel lining. In contrast, soft soil conditions result in larger deformations, but due to soil deformability, a significant portion of the blast energy is dissipated, leading to lower acceleration demands at the free-field ground surface compared to stiff soil cases.
A comparison of the effects induced by three different explosion types under two soil conditions and tunnel cover depths of 17 m, 27 m, 37 m, and 47 m indicates that increasing cover depth lengthens the propagation path and travel time of blast waves within the soil. Consequently, the displacements and accelerations reaching the free-field ground surface are significantly reduced. For both soil types, increasing cover depth results in smaller acceleration amplitudes, longer wavelengths, and delayed occurrence of peak accelerations.
Under shallow cover conditions, particularly at a depth of 17 m, tunnel excavation in soft soil fails to maintain stability, and the system reaches a failure state even prior to the application of blast loading. Conversely, tunnel excavation in stiff soil remains stable; however, for automobile and SUV explosion scenarios, accelerations exhibit an unexpected increase over time, leading to dynamic instability of the system.
The results indicate that blast-induced seismic demands are primarily governed by soil type, followed by the influence of cover depth, while explosion intensity plays a comparatively secondary role once soil-mediated attenuation mechanisms become dominant. In the short-period range, the response spectrum obtained for the panel van explosion is observed to locally exceed the DD2 earthquake-level design spectrum defined in TBEC-2018 (475-year return period, 10% probability of exceedance in 50 years), particularly under stiff soil conditions. Owing to high wave propagation velocities, this exceedance leads to increased acceleration demands, which may result in elevated shear forces and bending moments in the tunnel lining, thereby causing stress concentrations and the development of localized plastic deformations. However, at longer periods, the blast-induced spectral accelerations rapidly decay and remain below the DD2 spectrum under stiff soil conditions.
In contrast, under soft soil conditions, particularly for the panel van explosion scenario, the response spectrum significantly exceeds the DD2 earthquake-level spectrum over a short- to intermediate-period range. In soils characterized by low shear wave velocities, the prolonged trapping of wave energy and dominant amplification effects lead to increases in spectral accelerations in terms of both amplitude and period range. This behavior indicates that not only tunnel linings but also surface structures may be subjected to acceleration and displacement demands exceeding the design levels prescribed by the code.
An increase in cover depth lengthens the propagation path of blast waves, enhances attenuation, delays the occurrence of peak responses, and shifts the dominant spectral content toward longer periods, thereby significantly reducing demands at both the tunnel level and the free-field ground surface. Overall, these findings demonstrate that, particularly under unfavorable soil conditions and shallow cover depths, underground explosions can generate earthquake-like dynamic demands comparable to or exceeding seismic design levels. This highlights the necessity of considering blast effects together with seismic loads in the design and safety assessment of shallow urban tunnels.