Article

Study on the Transient Response of Composite Lined Tunnels Subjected to Blasting P-Wave

1
Jiangxi Provincial Transportation Engineering Group Co., Ltd., Nanchang 330036, China
2
State Key Laboratory of Safety and Resilience of Civil Engineering in Mountain Area, East China Jiaotong University, Nanchang 330013, China
*
Authors to whom correspondence should be addressed.
Appl. Sci. 2026, 16(3), 1482; https://doi.org/10.3390/app16031482
Submission received: 4 January 2026 / Revised: 22 January 2026 / Accepted: 22 January 2026 / Published: 2 February 2026

Abstract

Blasting-induced vibrations from new tunnel construction pose a significant threat to the structural safety of existing tunnel linings due to dynamic stress concentration. To address this, this study establishes a transient-response analytical model for composite lining tunnels using wave function expansion and a combination of the Duhamel integral and Fourier transform methods. Through a case study of the Hongshan South Road Tunnel, the research systematically quantifies the influence of critical factors such as load rise time, lining thickness, and material stiffness. Numerical results reveal that under blasting P-wave action, the inner vault of the secondary lining exhibits the most significant dynamic stress concentration, identifying it as the primary vulnerable zone. Furthermore, peak dynamic stress and vibration velocity increase sharply as the load rise time decreases, indicating that short-duration, high-intensity impacts present the greatest hazard. To mitigate these effects, the study identifies several optimization strategies: increasing the thickness of the initial support and employing high-modulus materials effectively reduce stress peaks. Specifically, maintaining the elastic modulus ratio of the surrounding rock to the initial support at approximately 2.0 provides an optimal balance for enhancing blast resistance. The findings suggest that tunnel design should prioritize optimizing the stiffness of the initial support and utilizing grouting to reinforce the surrounding rock. This research provides a robust theoretical framework and specific parameter optimization directions for the seismic and blast-resistant design of composite lining tunnels.

1. Introduction

In engineering construction, drilling and blasting operations represent a mature and widely used rock excavation technology, known for their efficiency and cost-effectiveness, playing a key role in fields such as underground chamber excavation and mining engineering [1]. Currently, tunnel construction in various domains in China is undergoing new changes: tunnel depths are increasing, and newly constructed tunnels are increasingly intersecting with existing ones, as seen in railway tunnel renovation and expansion, and metro crossing construction [2,3]. In this context, blasting-induced seismic waves from drilling and blasting operations, as well as elastic waves generated by earthquakes or explosions, pose severe threats to tunnel structural safety if left uncontrolled. Such waves may lead to lining cracks, deformation, and other defects, and in extreme cases, could even trigger the complete collapse of the tunnel [4,5]. In order to fully understand the damage mechanism caused by blasting vibrations, a systematic analysis of the dynamic response and vibration properties of the tunnel lining is imperative.
The dynamic response of circular linings to seismic waves has been widely studied in the literature. Among them, A seminal study by Pao and Mow et al. [6] employed the wave function expansion method, providing a systematic analytical framework for solving elastic wave scattering problems involving deeply embedded structures. Subsequently, Li et al. [7,8] simplified blasting-induced seismic waves as planar harmonic waves and conducted systematic steady-state response analyses on the scattering problem of deeply buried tunnels. Under the premise of neglecting time-dependent factors, this method focuses on investigating the sensitivity and response patterns of the Dynamic Stress Concentration Factor (DSCF) to the physical and geometric properties of the lining. These studies on tunnel dynamic responses were based on the assumption of an infinite medium and did not consider the reflection effects of the ground surface. Lee et al. [9]. employed imaging techniques to solve the SH-wave scattering problem of shallowly buried underground structures, and subsequent researchers extended this method to other scenarios. They systematically investigated the dynamic behavior of shallow circular linings subjected to plane longitudinal waves, providing a detailed analysis of how parameters such as incident angle, burial depth, and lining stiffness influence the structural response [10]. Moreover, many researchers have conducted in-depth analyses of various factors affecting tunnel stability, including input method of seismic waves [11,12], tunnel geometry [13,14], interactions within multiple tunnel systems [15,16], and dynamic pore stress in soils [17,18,19]. In recent years, numerous scholars have investigated vibration isolation in the frequency domain. For example, Ding et al. [20,21,22] conducted studies showing that embedding negative Poisson’s ratio metamaterials and metasurfaces in soil can effectively mitigate seismic hazards.
It is worth noting that most existing studies have largely been confined to the analysis of harmonic wave excitation, typically overlooking the influence of time-dependent factors. However, non-periodic disturbances exhibit distinctly different characteristics, with their perturbation features demonstrating random variations. The analytical determination of transient responses resulting from non-periodic disturbances is inherently far more intricate than the evaluation of steady-state responses under harmonic wave excitation. Currently, methods for solving transient responses mainly fall into three categories: combination schemes [23,24], integral transforms and their inversions [25], and integral transforms combined with contour integration [26]. Most of these efforts are aimed at analyzing the dynamic response characteristics of tunnels exposed to non-periodic disturbances in an infinite domain. For the transient response generated by deeply buried tunnels, describing the characteristics of scattered waves through integral transforms and their inversions, as well as employing a combination of integral transforms and contour integration, presents significant challenges. The prevailing approach involves deriving the analytical solution for transient response to aperiodic disturbances by integrating Duhamel’s integral and Fourier transform techniques, based on the existing analytical solution for steady-state response. Building upon the aforementioned methodology, Li et al. [27] introduced a trapezoidal quadrature technique to investigate the transient dynamic response of deep-buried circular cavities subjected to blasting longitudinal waves. Subsequently, Tao et al. [28,29] extended the analysis to investigate the transient responses of various underground structures—specifically cavities, circular inclusions, and water diversion tunnels—under blasting P-waves. In parallel, some scholars [30] leveraged the addition theorem of Hankel functions to explore the influence of source-tunnel spacing on structural dynamics. The results indicate that the standoff distance is positively correlated with the maximum DSCF.
The majority of prior studies were primarily restricted to analyzing the transient behavior of basic underground cavities and single-layer linings, thereby overlooking the complex dynamic interactions and load-sharing mechanisms between different components in multi-layered systems. To bridge this gap and better reflect the composite lining structures (consisting of primary support and secondary lining) commonly used in modern urban tunnels, this study selects the longitudinal wave (P-wave) as the incident source. Unlike previous research that focuses on homogeneous structures, this work explicitly establishes an analytical framework to evaluate how the stiffness and thickness ratios between the primary and secondary layers influence transient stress redistribution. An analytical solution for the steady-state response was first obtained via the wave function expansion method. Building on this foundation, the transient dynamic response of composite linings subjected to blasting P-waves was then systematically investigated through a combined approach of the Duhamel integral and Fourier transform. To validate the findings, a case study of the Nanjing Hongshan South Road tunnel group is performed, focusing on the impact of critical design parameters on the vibration characteristics. Furthermore, effective vibration mitigation measures are proposed, aiming to provide theoretical foundations and design references for related engineering practices.

2. Derivation of Steady-State Response

2.1. Illustration of the Computational Model

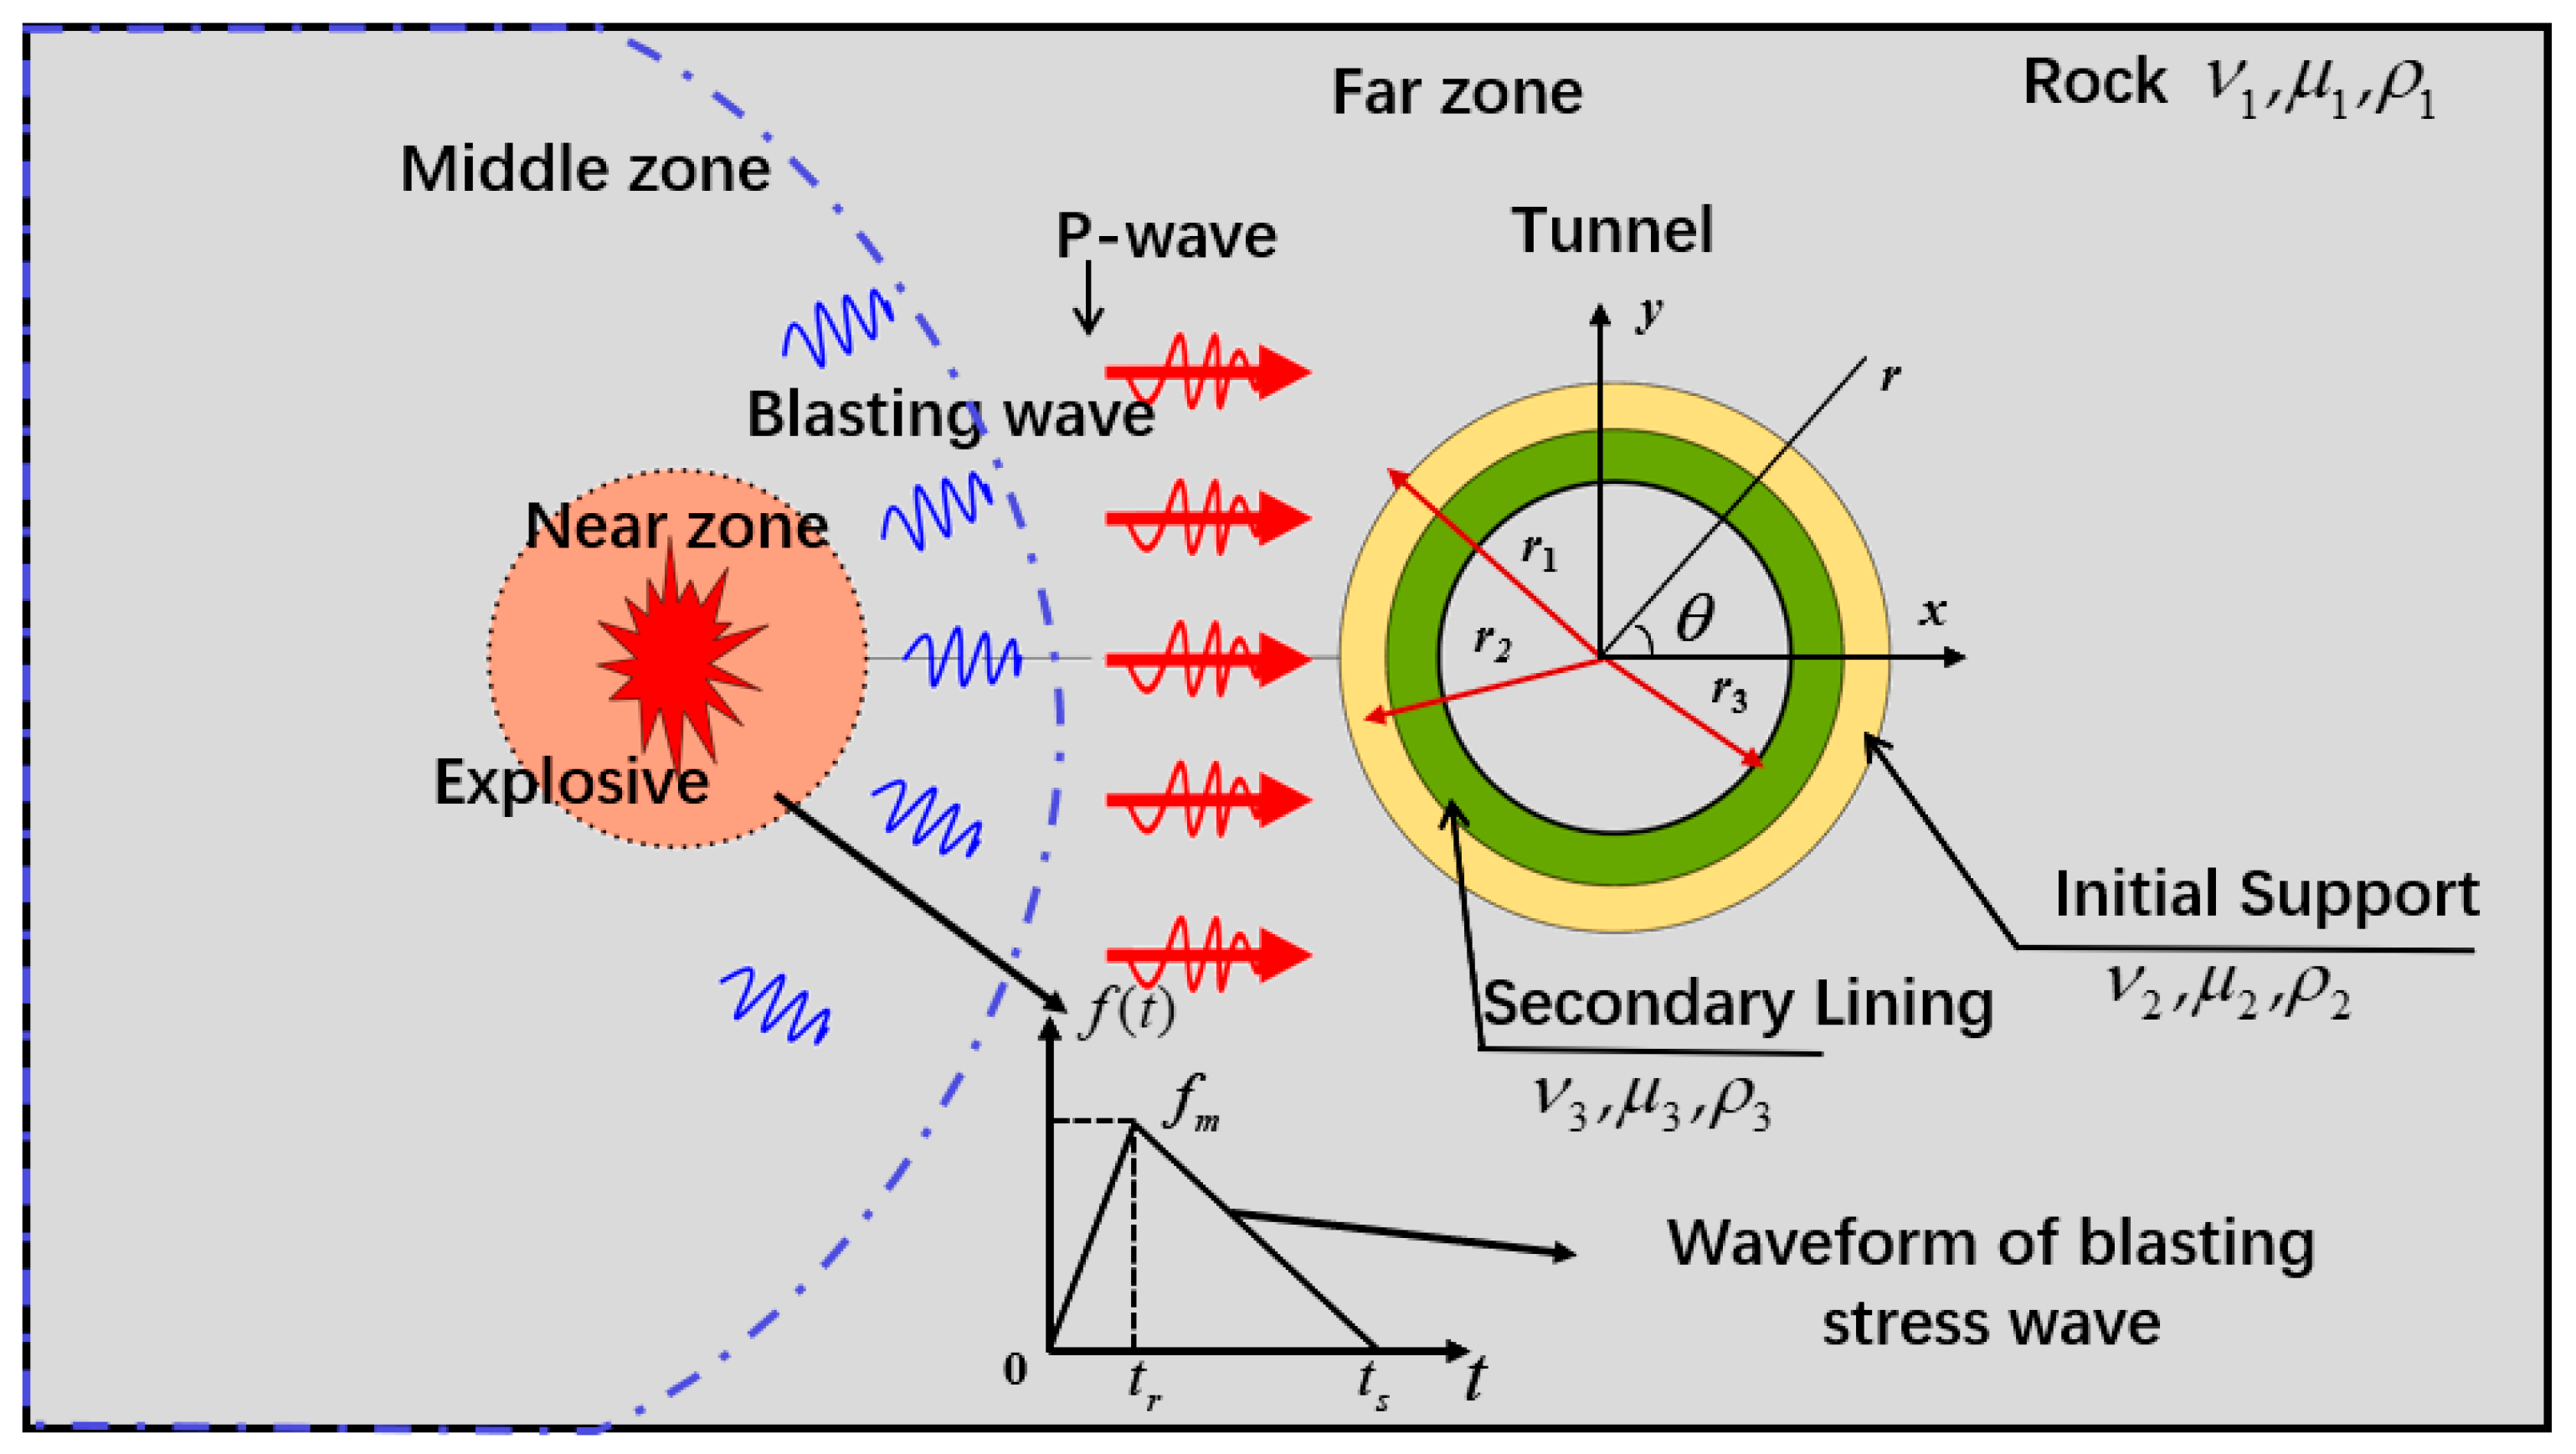
When an explosive detonates in rock, the resulting shock wave attenuates into a stress wave at distances of approximately 125 to 150 times the charge radius (r) from the source. Beyond 150r, it further decays into a seismic wave [31]. The schematic in Figure 1 illustrates the geometric configuration of a deeply buried composite-lined tunnel within an infinite domain, together with the prescribed blast load and coordinate framework. The figure uses black and blue dashed lines to delineate the boundaries between the near-/mid-field and mid-/far-field blast zones, respectively. This study is confined to the far-field (outside the blue dashed line), based on the premise that the explosion-induced seismic wave therein admits a plane wave approximation [32]. In the physical model, it is assumed that a plane longitudinal wave impinges normally along the tunnel axis. To balance computational accuracy and efficiency, this three-dimensional dynamic process is further simplified as a two-dimensional plane strain problem. Both the surrounding rock and the lining are assumed to be isotropic elastic materials. The Cartesian and polar coordinate systems are denoted as (x, y) and (θ, r), respectively. Here, r3, r2, and r1 represent the inner radius of the secondary lining, the inner radius of the initial support, and the outer radius of the initial support, correspondingly.
Since blasting constitutes a non-periodic disturbance, the transient response of the tunnel induced by such disturbance exhibits significant complexity. To facilitate theoretical analytical calculations, the blast seismic wave is simplified as a triangular pulse, which effectively represents the loading and unloading processes of the explosion, as illustrated in Figure 1. In this function, fm denotes the peak intensity reached by the blast seismic wave, tr represents the rise time from initiation to the peak, and ts indicates the total duration from initiation to the end of the waveform. On the basis of the transient wave superposition theorem, the corresponding analytical solution for the steady-state response was derived via a wave-field analysis approach.

2.2. Plane Strain Problem and Stress-Displacement Expressions

The plane strain model is employed herein, primarily due to the geometric features of structures like subway tunnels, beams, and rails, where one dimension (the x3-axis) far exceeds others and the cross-section remains uniform. This simplification reduces complex 3D problems into efficient 2D analyses for engineering design. Nevertheless, the approach is constrained by two factors: it requires uniformly distributed axial loads to avoid underestimating axial stress, and it is inapplicable to short structures with an aspect ratio (L/W < 5). The governing equations and constitutive relations for plane strain problems are defined as follows:
μ 2 u + ( λ + μ ) u = ρ u ¨ σ i j = 2 μ ε i j + λ δ i j ε
where, denote the Lamé constants (λ and μ) of the material, u denotes the displacement of the elastic medium, where the double dots in the superscript represent its second-order derivative. σ i j and ε i j denote the stress and strain tensors of the elastic medium, respectively, and δ i j is the Dirichlet function. Introducing the potential functions φ and ψ for the medium, the displacement is represented based on the Helmholtz decomposition theorem as:
u ¯ = φ + × ψ
For different media subjected to harmonic excitation, the analytical expressions for displacement, stress, and particle velocity are expressed as:
u r = φ r + 1 r ψ θ , ν r = i ω u r u θ = 1 r φ θ ψ r , ν θ = i ω u θ σ r r = λ 2 φ + 2 μ 2 φ r 2 + r 1 r ψ θ σ θ θ = λ 2 φ + 2 μ 1 r φ r + 1 r 2 φ θ 2 + 1 r 1 r ψ θ r θ σ r θ = 2 μ 1 r 2 φ r θ 1 r 2 φ θ + μ 1 r 2 2 ψ θ 2 r r 1 r ψ r
2 φ = 2 φ r 2 + 1 r φ r + 1 r 2 2 φ θ 2 is the representation of the Laplacian operator in polar coordinates. Where u r , u θ correspond to the radial and circumferential displacements within the polar coordinate framework, respectively; σ r r , σ θ θ and σ r θ correspond, respectively, to the radial, circumferential, and dynamic shear stress components; ν r and ν θ represent the radial and circumferential vibration velocities, respectively.

2.3. Wave Field Analysis

Assuming a unit-amplitude steady-state condition and disregarding the transient term eiwt, the displacement potential function for a plane P-wave propagating in an infinite medium is formulated as [6]:
φ ( i ) = n = 0 ε n i n J n ( α 1 r ) cos n θ
where α 1 signifies the longitudinal wave number, ω indicates the excitation frequency, J n represents the first-kind Bessel function of order n. When n = 0 occurs, ε n = 1 follows; when n ≥ 1 occurs, ε n = 2 results.
Due to the parameter differences between the surrounding rock and the initial support, a wave impedance mismatch exists. When a harmonic P-wave propagates to the interface between the surrounding rock and the lining, diffracted P- and SV-waves radiating outward are generated. Their corresponding potential functions can be expressed as:
φ r = n = 0 A n H n ( 1 ) ( α 1 r ) cos ( n θ ) ψ r = n = 0 B n H n ( 1 ) ( β 1 r ) sin ( n θ )
where An and Bn are undetermined coefficients; H n ( 1 ) is the Hankel function of the first kind of order n; β1 is the shear wave number of the surrounding rock. According to the principle of superposition, the total wave field in the surrounding rock medium can be obtained as:
φ 1 = φ ( i ) + φ r ψ 1 = ψ r
In a manner analogous to the analysis of the surrounding rock, the wave field potential functions for the initial support and the secondary lining can be, respectively, written as:
φ 2 = n = 0 C n H n ( 1 ) ( α 2 r ) + D n H n ( 2 ) ( α 2 r ) cos n θ ψ 2 = n = 0 F n H n ( 1 ) ( β 2 r ) + G n H n ( 2 ) ( β 2 r ) sin n θ φ 3 = n = 0 K n H n ( 1 ) ( α 3 r ) + L n H n ( 2 ) ( α 3 r ) cos n θ ψ 3 = n = 0 M n H n ( 1 ) ( β 3 r ) + N n H n ( 2 ) ( β 3 r ) sin n θ
where A n , B n , C n , D n , F n , G n , K n , L n , M n , N n are undetermined coefficients; α 2 , α 3 , β 2 and β 3 denote the wavenumbers of the compressional (P)- and shear (S)-waves for the initial lining (subscript 2) and secondary lining (subscript 3), respectively.
The boundary conditions governing the interfaces between different media in the model yield the following relationships. In these equations, the superscripts (1, 2, 3) represent the surrounding rock, initial support, and secondary lining, respectively.
The interface continuity requirements for both stress state and displacement vector between the initial support and the surrounding rock are given by the following equations:
σ r r ( 2 ) = σ r r ( 1 ) , σ r θ ( 2 ) = σ r θ ( 1 ) u r ( 2 ) = u r ( 1 ) , u θ ( 2 ) = u θ ( 1 ) on r = r 1
The interface continuity requirements for both stress state and displacement vector between the secondary lining and the initial support are given by the following equations:
σ r r ( 3 ) = σ r r ( 2 ) , σ r θ ( 3 ) = σ r θ ( 2 ) u r ( 3 ) = u r ( 2 ) , u θ ( 3 ) = u θ ( 2 ) on r = r 2
The stress-free boundary condition on the inner surface of the secondary lining is given by:
σ r r ( 3 ) = 0 , σ r θ ( 3 ) = 0 on r = r 3
Substituting Equations (6) and (7) into Equation (3), and then introducing the resulting expressions for displacement and stress into the boundary conditions given by Equations (8)–(10) ultimately yields a system of linear equations.
A i j X i = M j , i , j = 1 , 2 , ...10
where the specific expressions for each element in the coefficient matrices   X 1 = A n ,   X 2 = B n X 9 = M n ,   X 10 = N n , A i j , and M j are provided in the Appendix A. Based on the boundary conditions, a system of linear equations is solved to determine the unknown coefficients, thereby obtaining the series-form analytical solutions for stress and displacement within the medium. By plugging these solutions into the subsequent expressions, we can obtain the detailed formulas for the DSCF, Radial Velocity Scaling Factor (RVSF), and Hoop Velocity Scaling Factor (HVSF) pertaining to the surrounding rock, lining structure, and secondary lining structure.
DSCF = σ θ θ / σ 0 RVSF = ν r / ν 0 HVSF = ν θ / ν 0
where σ 0 = μ β 1 2 φ 0 , ν 0 = α 1 ω φ 0 e i ω t .

3. Derivation of Transient Response

While the steady-state response of a composite-lined tunnel under harmonic P-wave incidence was theoretically analyzed in Section 2.2, the blasting disturbances encountered in practical engineering often exhibit significant non-periodicity. These non-periodic disturbances induce transient responses around the tunnel. Therefore, the analytical solution for the transient response under transient P-wave disturbances can be derived based on the steady-state solution obtained in the previous section [6].
The transient response g ( x i , t ) can be interpreted as the time-domain convolution of the unit-impulse response h ( x i , t )   of the tunnel and the applied transient blast load f t :
g ( x i , t )   =   h ( x i , t )     f t
By the convolution theorem, the Fourier transform of a convolution corresponds to the product of the Fourier transforms of the individual functions in the frequency domain:
F { g ( x i , t ) } = F { h ( x i , t ) } F { f ( t ) }
Here, F { h ( x i , t ) } = χ ( x , ω ) = R ( ω ) + i I ( ω ) is the frequency response (admittance) function under harmonic excitation, with R ( ω ) and I ( ω ) being its real and imaginary components; F ( ω ) = F { f ( t ) } denotes the Fourier transform of the transient blast load. The transient response is then recovered via the inverse Fourier transform:
g ( x i , t ) = 1 2 π χ ( x , ω ) F ( ω ) e i ω t d ω  
In this study, the trapezoidal rule is employed to evaluate the Fourier transform integral.
Following the methodology established in prior work [6], the blasting load is mathematically represented by the trigonometric function defined in Equation (16):
f ( t ) = 0 t   < 0 t / t t 0 t < t r ( t s t ) / ( t s t r ) t r t < t s 0 t t s
where t represents time. It should be noted that the use of the Fourier transform implies zero initial conditions. This is physically consistent with the blast loading problem addressed here, as the system is assumed to be in a quiescent state prior to the arrival of the wave front (i.e., displacements and velocities are zero at t ≤ 0. Given that the proposed model is based on dimensionless parameters, the real-world dynamic response and vibration velocity can be determined by multiplying the normalized expression in Equation (14) by the actual peak blasting pressure (fm).
To analyze the transient response at the interface, the time variable t is normalized with respect to the duration required for the wave to traverse the outer radius of the initial support, expressed mathematically in Equation (17):
τ = c p t / r 1
For the Heaviside step function input, the induced impulse response is defined mathematically as:
g h ( x , t ) = 2 π 0 χ ( x , ω ) ω sin ( ω t ) d ω
To determine the transient response of any arbitrary loading function, the Duhamel integral method is employed, expressed below:
g ( x , t ) = f ( 0 ) g h ( t ) + 0 t f ( τ ) g h t τ d τ
For 0 t < t r :
g ( x i , t ) = 0 t 1 t r d τ 2 π 0 R ( ω ) sin ω ( t τ ) ω d ω = 2 π t r 0 R ( ω ) ( 1 cos ω t ) ω 2 d ω
For t r t < t s :
g ( x i , t ) = 2 π t r 0 R ( ω ) cos ω ( t t r ) cos ω t ω 2 d ω 2 π ( t s t r ) 0 R ( ω ) 1 cos ω ( t t r ) ω 2 d ω
For t t s :
g ( x i , t ) = 2 π t r 0 R ( ω ) cos ω ( t t r ) cos ω t ω 2 d ω 2 π ( t s t r ) 0 R ( ω ) cos ω ( t t s ) cos ω ( t t r ) ω 2 d ω
For transient response problems such as blasting load, this study adopts a solution framework based on the Duhamel integral. As shown in Equation (12), this framework theoretically provides a complete analytical expression for the steady-state response of the tunnel. However, due to the arbitrary time-varying nature of the load, performing direct analytical integration of Equations (20)–(22) to obtain an explicit closed-form solution is highly challenging. Therefore, this paper employs the trapezoidal quadrature method [27,32] for numerical approximation. The selection of this method is based on the following considerations: the Duhamel integral is applicable to arbitrary time-history loads and can extend the steady-state solution to transient processes. The trapezoidal quadrature method is a straightforward and robust numerical approach that provides a reasonable balance between computational efficiency and accuracy, making it suitable for nonlinear signals with abrupt changes such as blasting loads. It is noted that the discrete Fourier transform (DFT) and its fast implementation (FFT) are mathematically equivalent to applying the trapezoidal rule to the Fourier integral; while FFT is computationally more efficient, the time-domain trapezoidal quadrature is more directly compatible with the Duhamel integral formulation adopted here. In contrast, methods such as contour integration in the frequency domain are typically suited for cases with singularities, which are not present in this problem. The numerical procedure involves first extracting the real-valued components of the dynamic or vibratory response from Equation (12) for each dimensionless wavenumber. Subsequently, the transient contribution from each subdivided interval is calculated using the trapezoidal rule, with the overall transient response ultimately derived by summing these individual contributions.
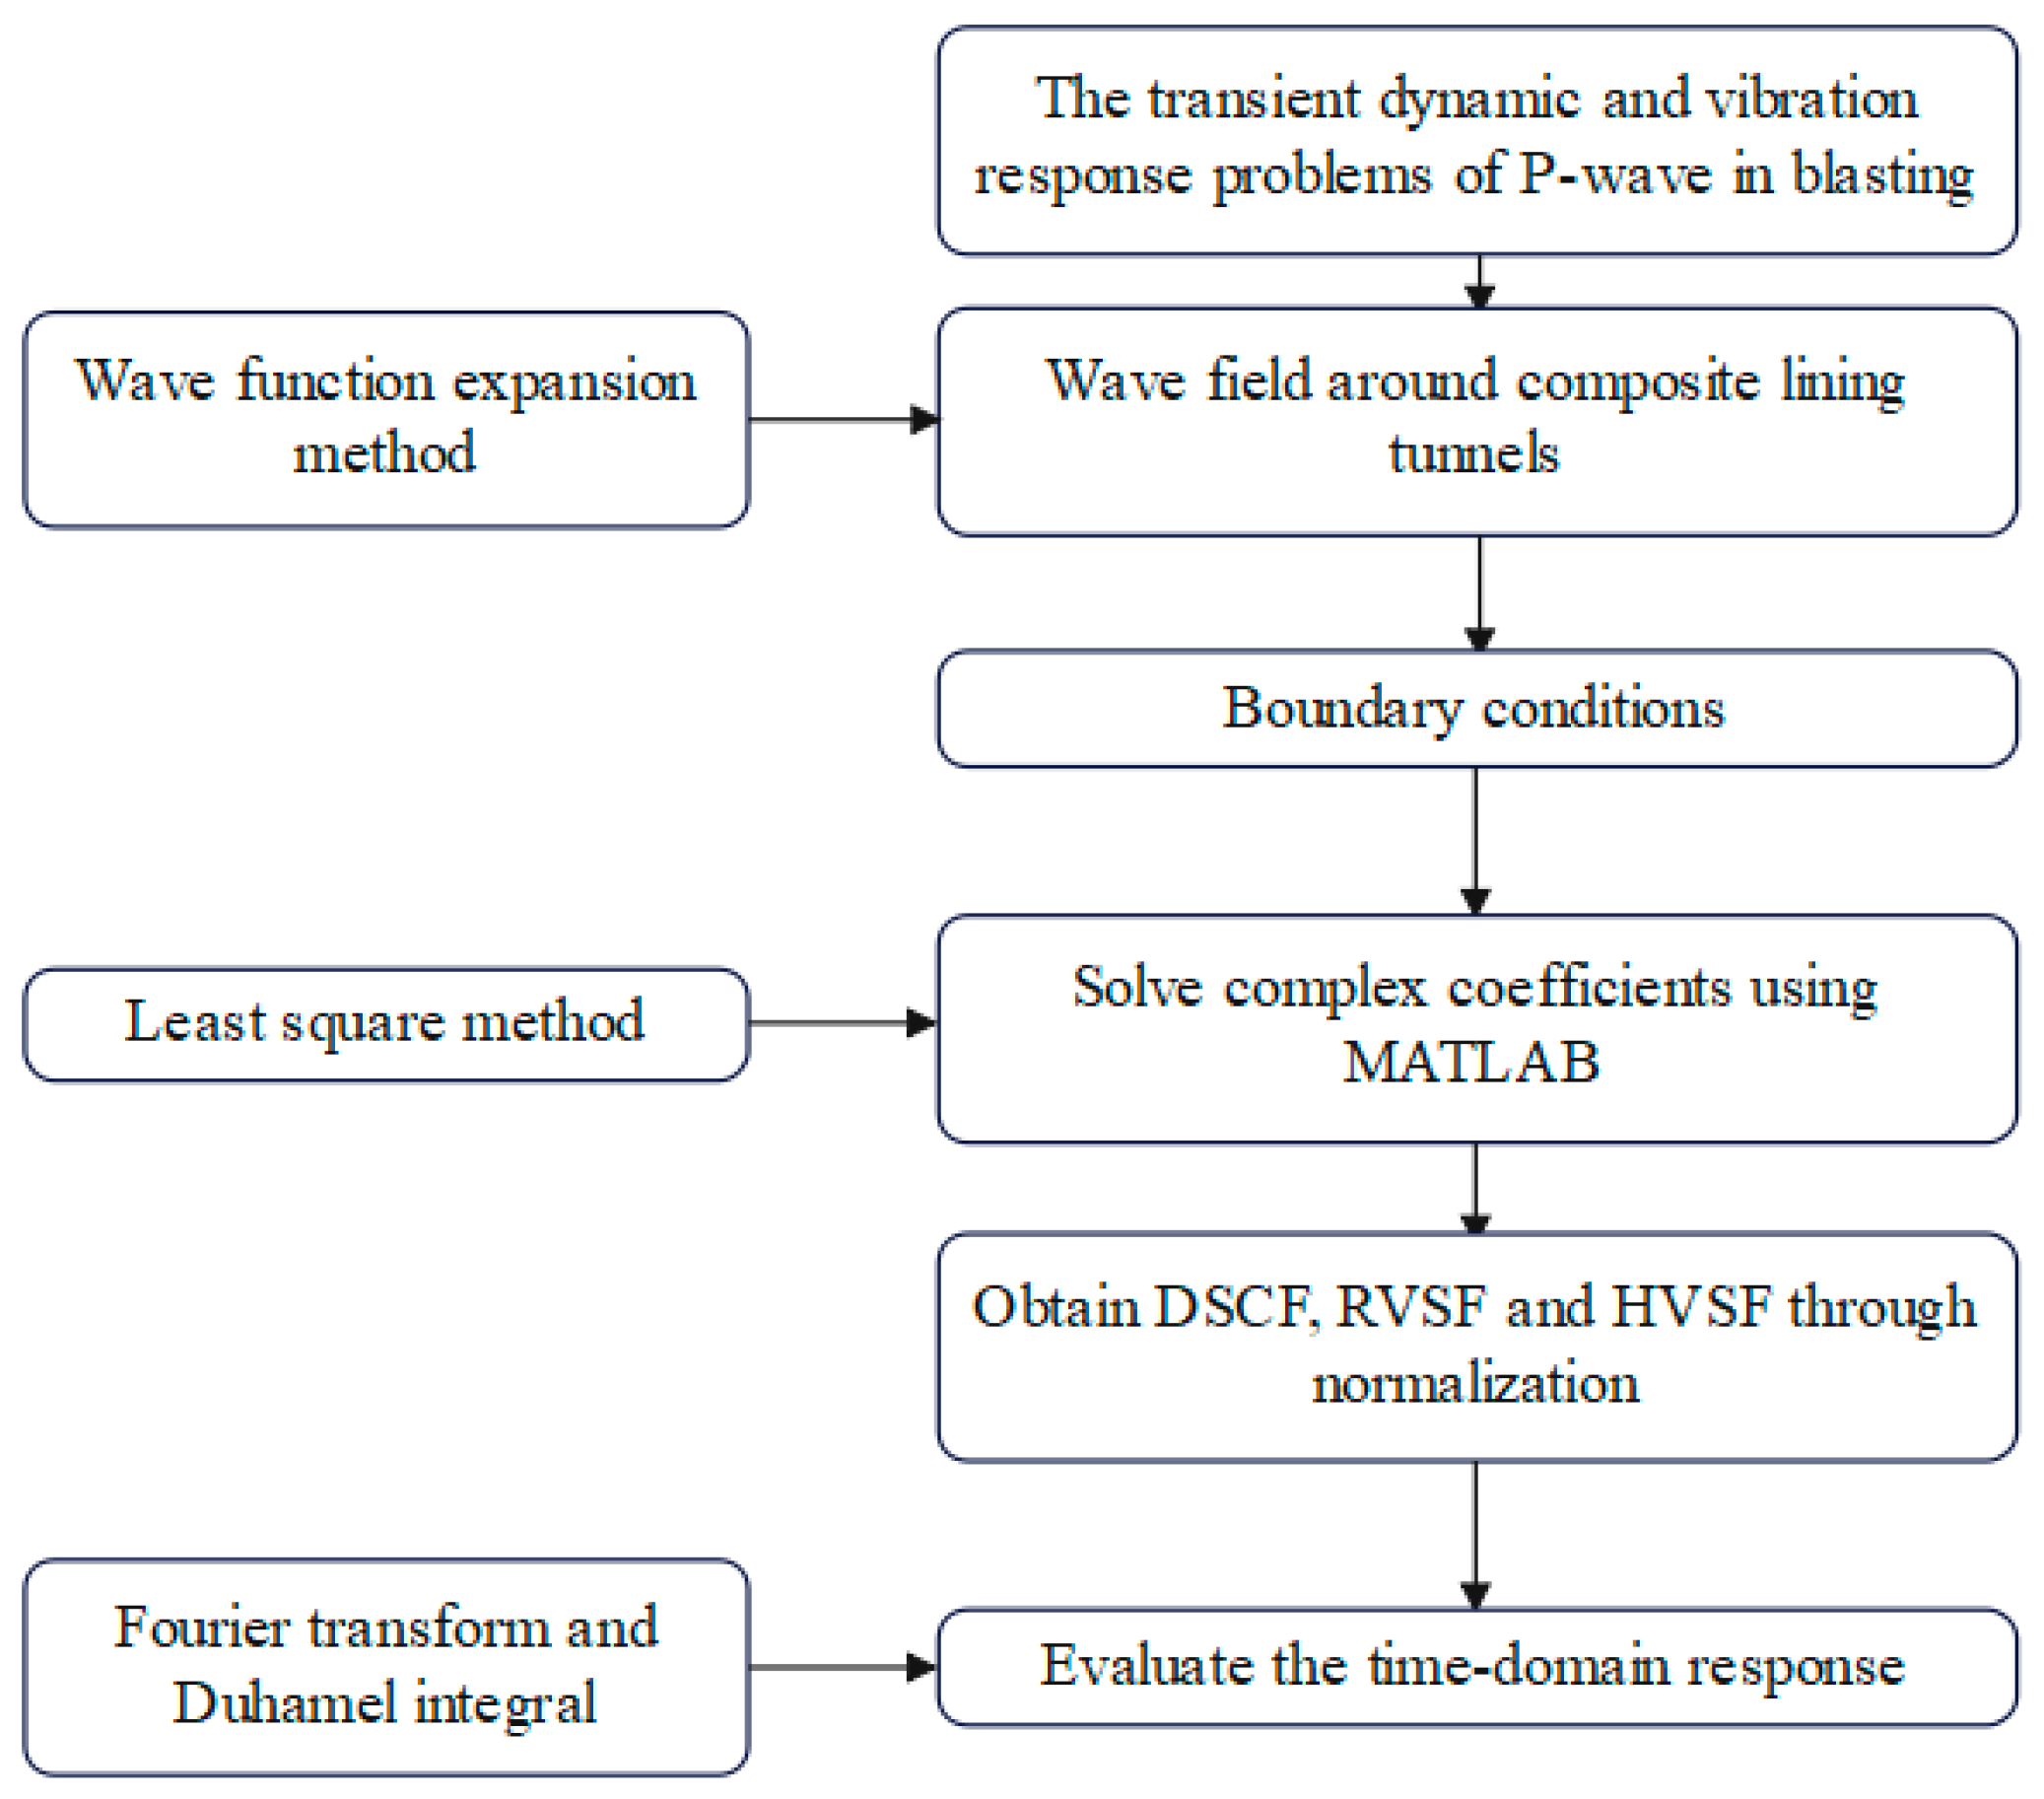
Based on the methods described in Section 2 and Section 3, Figure 2 summarizes the calculation process for the transient response of composite lining tunnels under transient P-wave excitation.

4. Analysis of Theoretical Results

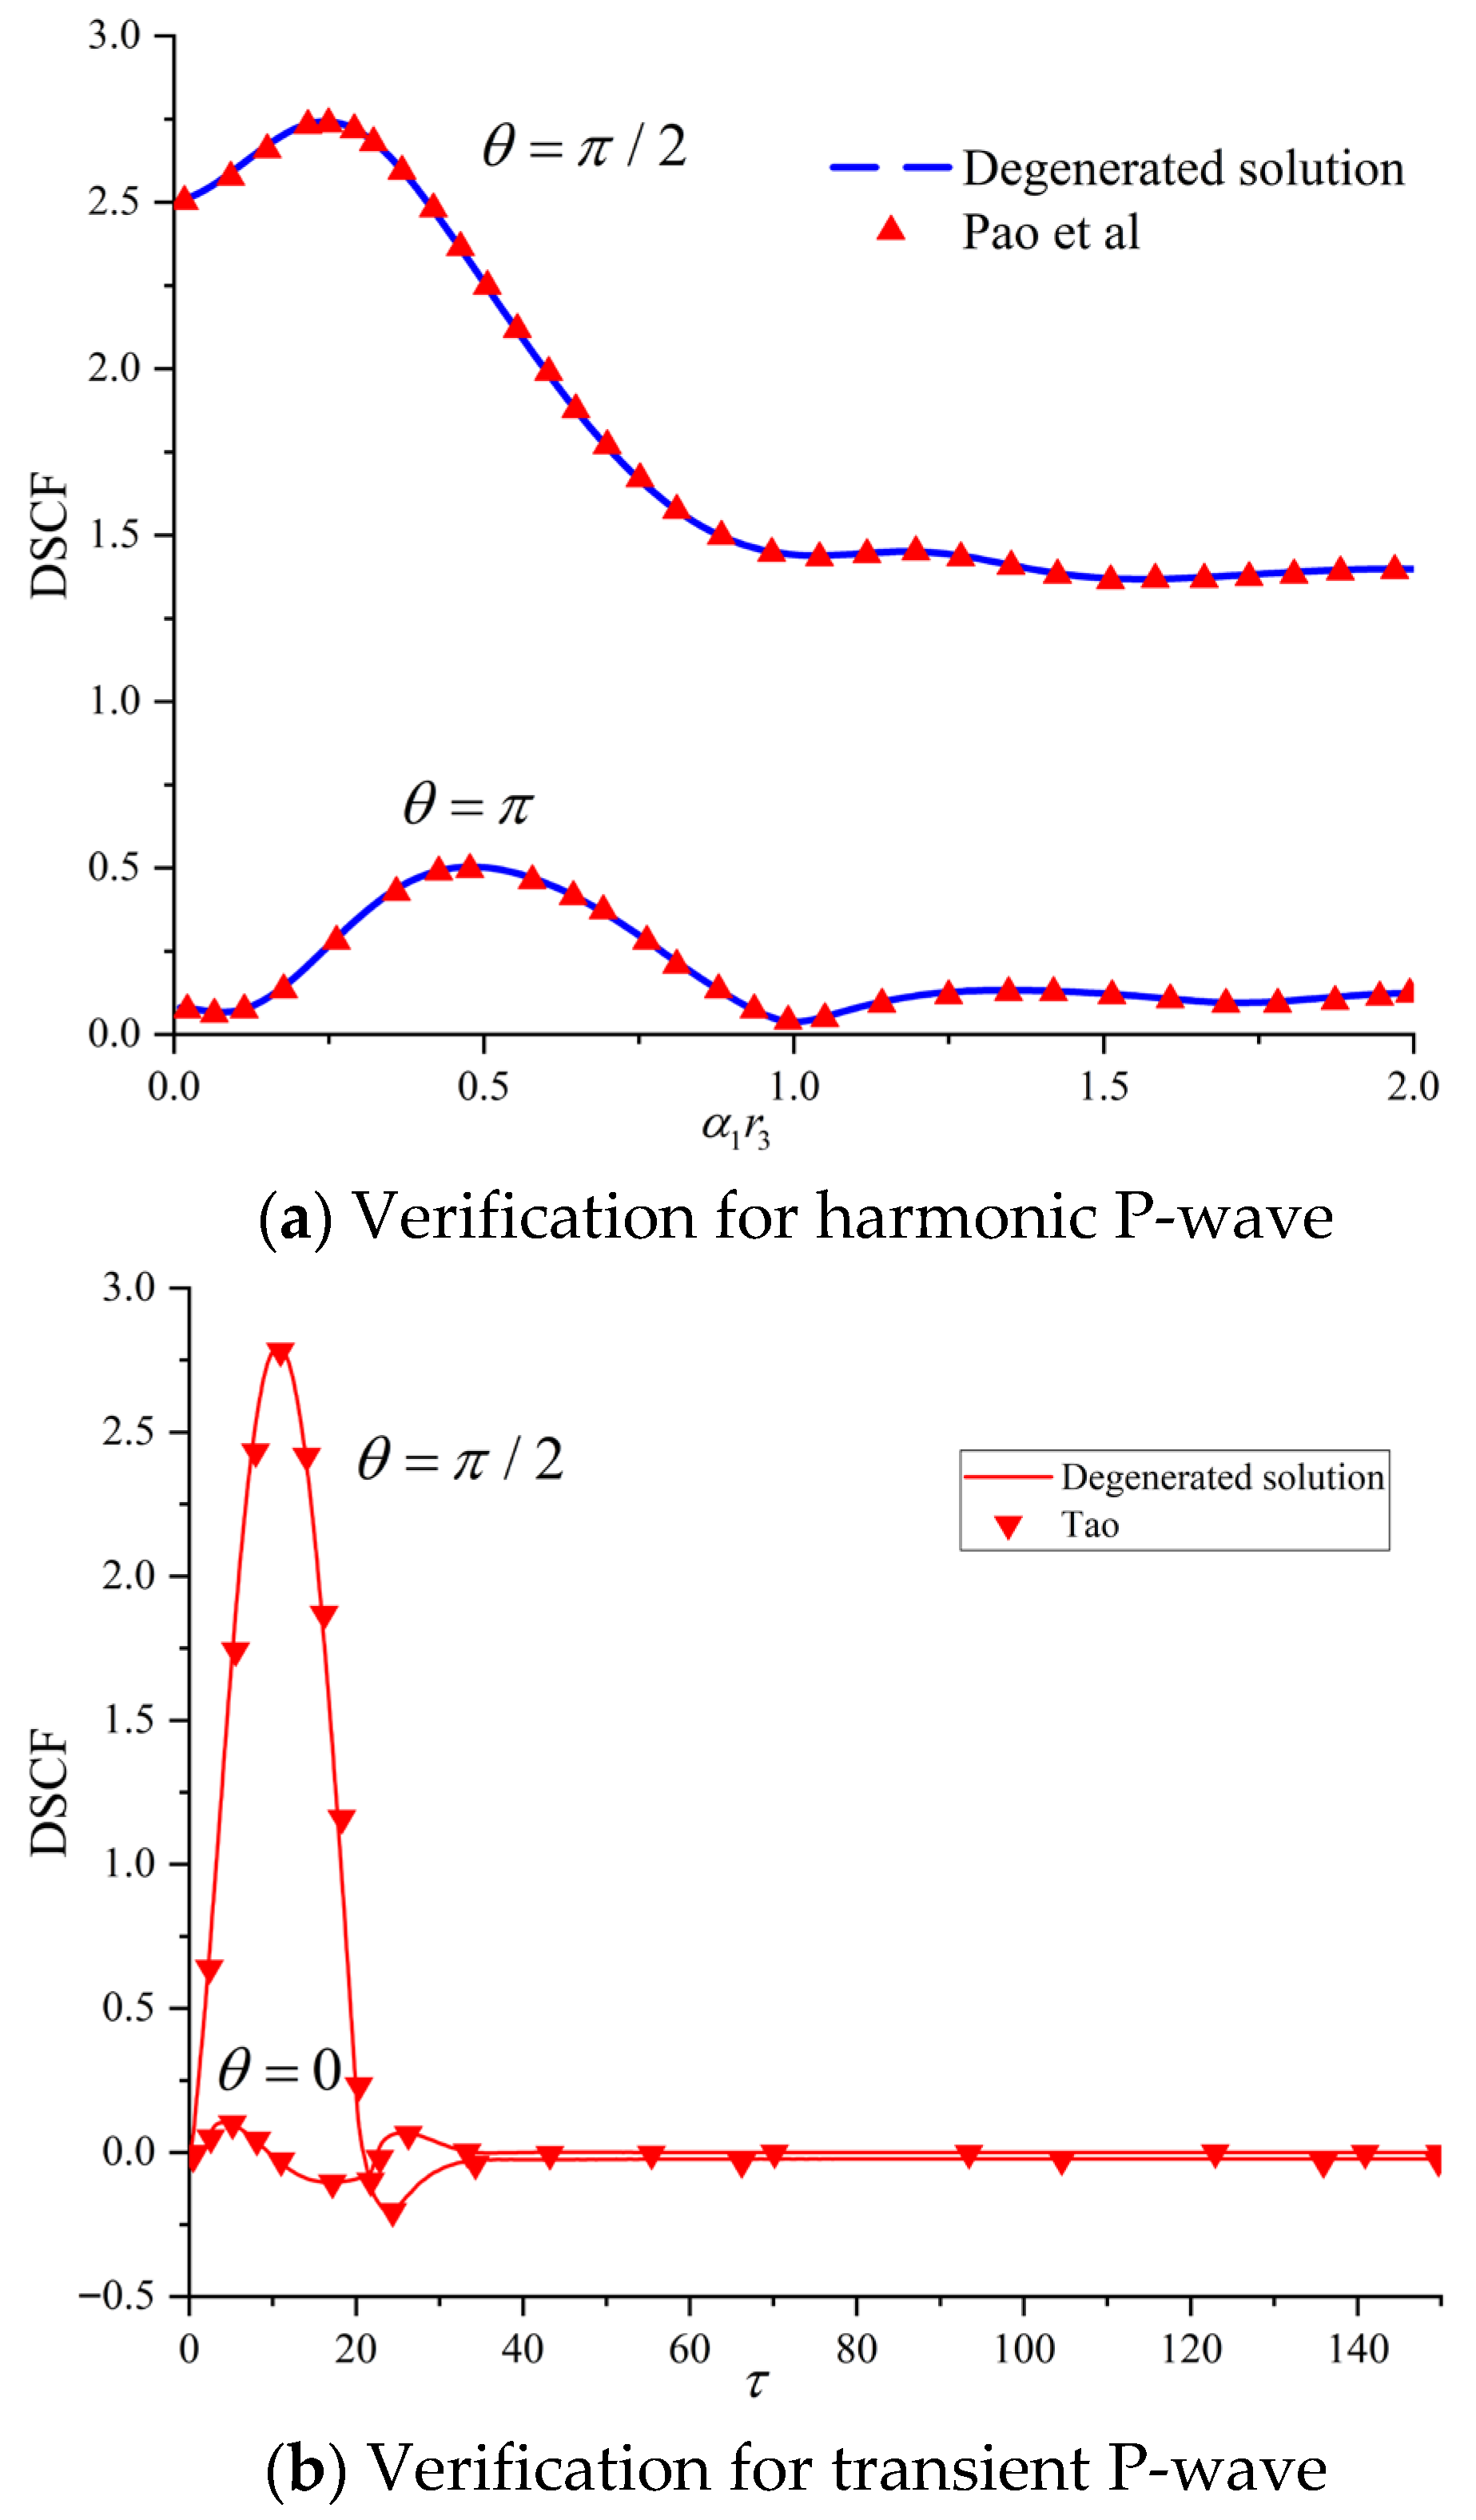
The theoretical derivations of this study are validated by reduction to known special cases. This validation is performed by first simplifying the model to the case of a single-layer lining subjected to harmonic P-wave incidence, with the results then benchmarked against the classical solution provided by Pao [6]. A “degenerate solution” refers to simplifying a complex model into a known standard form by setting specific parameters equal for validation purposes. The material parameters of the surrounding rock and the lining are taken consistent with the existing literature, as follows: μ ˜ = 2.9 , γ = 1.5 , v 1 = 0.25 , v 2 = 0.2 , η = 1.1 , where μ ˜ denotes the ratio of the shear modulus of the surrounding rock to that of the lining, γ denotes the ratio of longitudinal wave number in adjacent media, ν1 and ν2 are the Poisson’s ratios of the surrounding rock and the lining, respectively, η is the ratio of the inner to outer radii of the lining, and α 1 r 3 is the dimensionless wave number. For the case of transient P-wave loading, the model is further reduced to an empty cavity. The corresponding calculation parameters [27] are: surrounding rock density 2750 kg/m3, Young’s modulus 18.73 GPa, and Poisson’s ratio 0.206. The comparison presented in Figure 3 demonstrates a high degree of agreement between the current degenerated solution and the existing literature [6,27]. Consequently, this serves as robust evidence confirming the accuracy and reliability of the developed approach for transient response analysis. In summary, this confirms the validity of the analytical solution method established in this work. The comparison results are shown in Figure 3.

4.1. Engineering Background

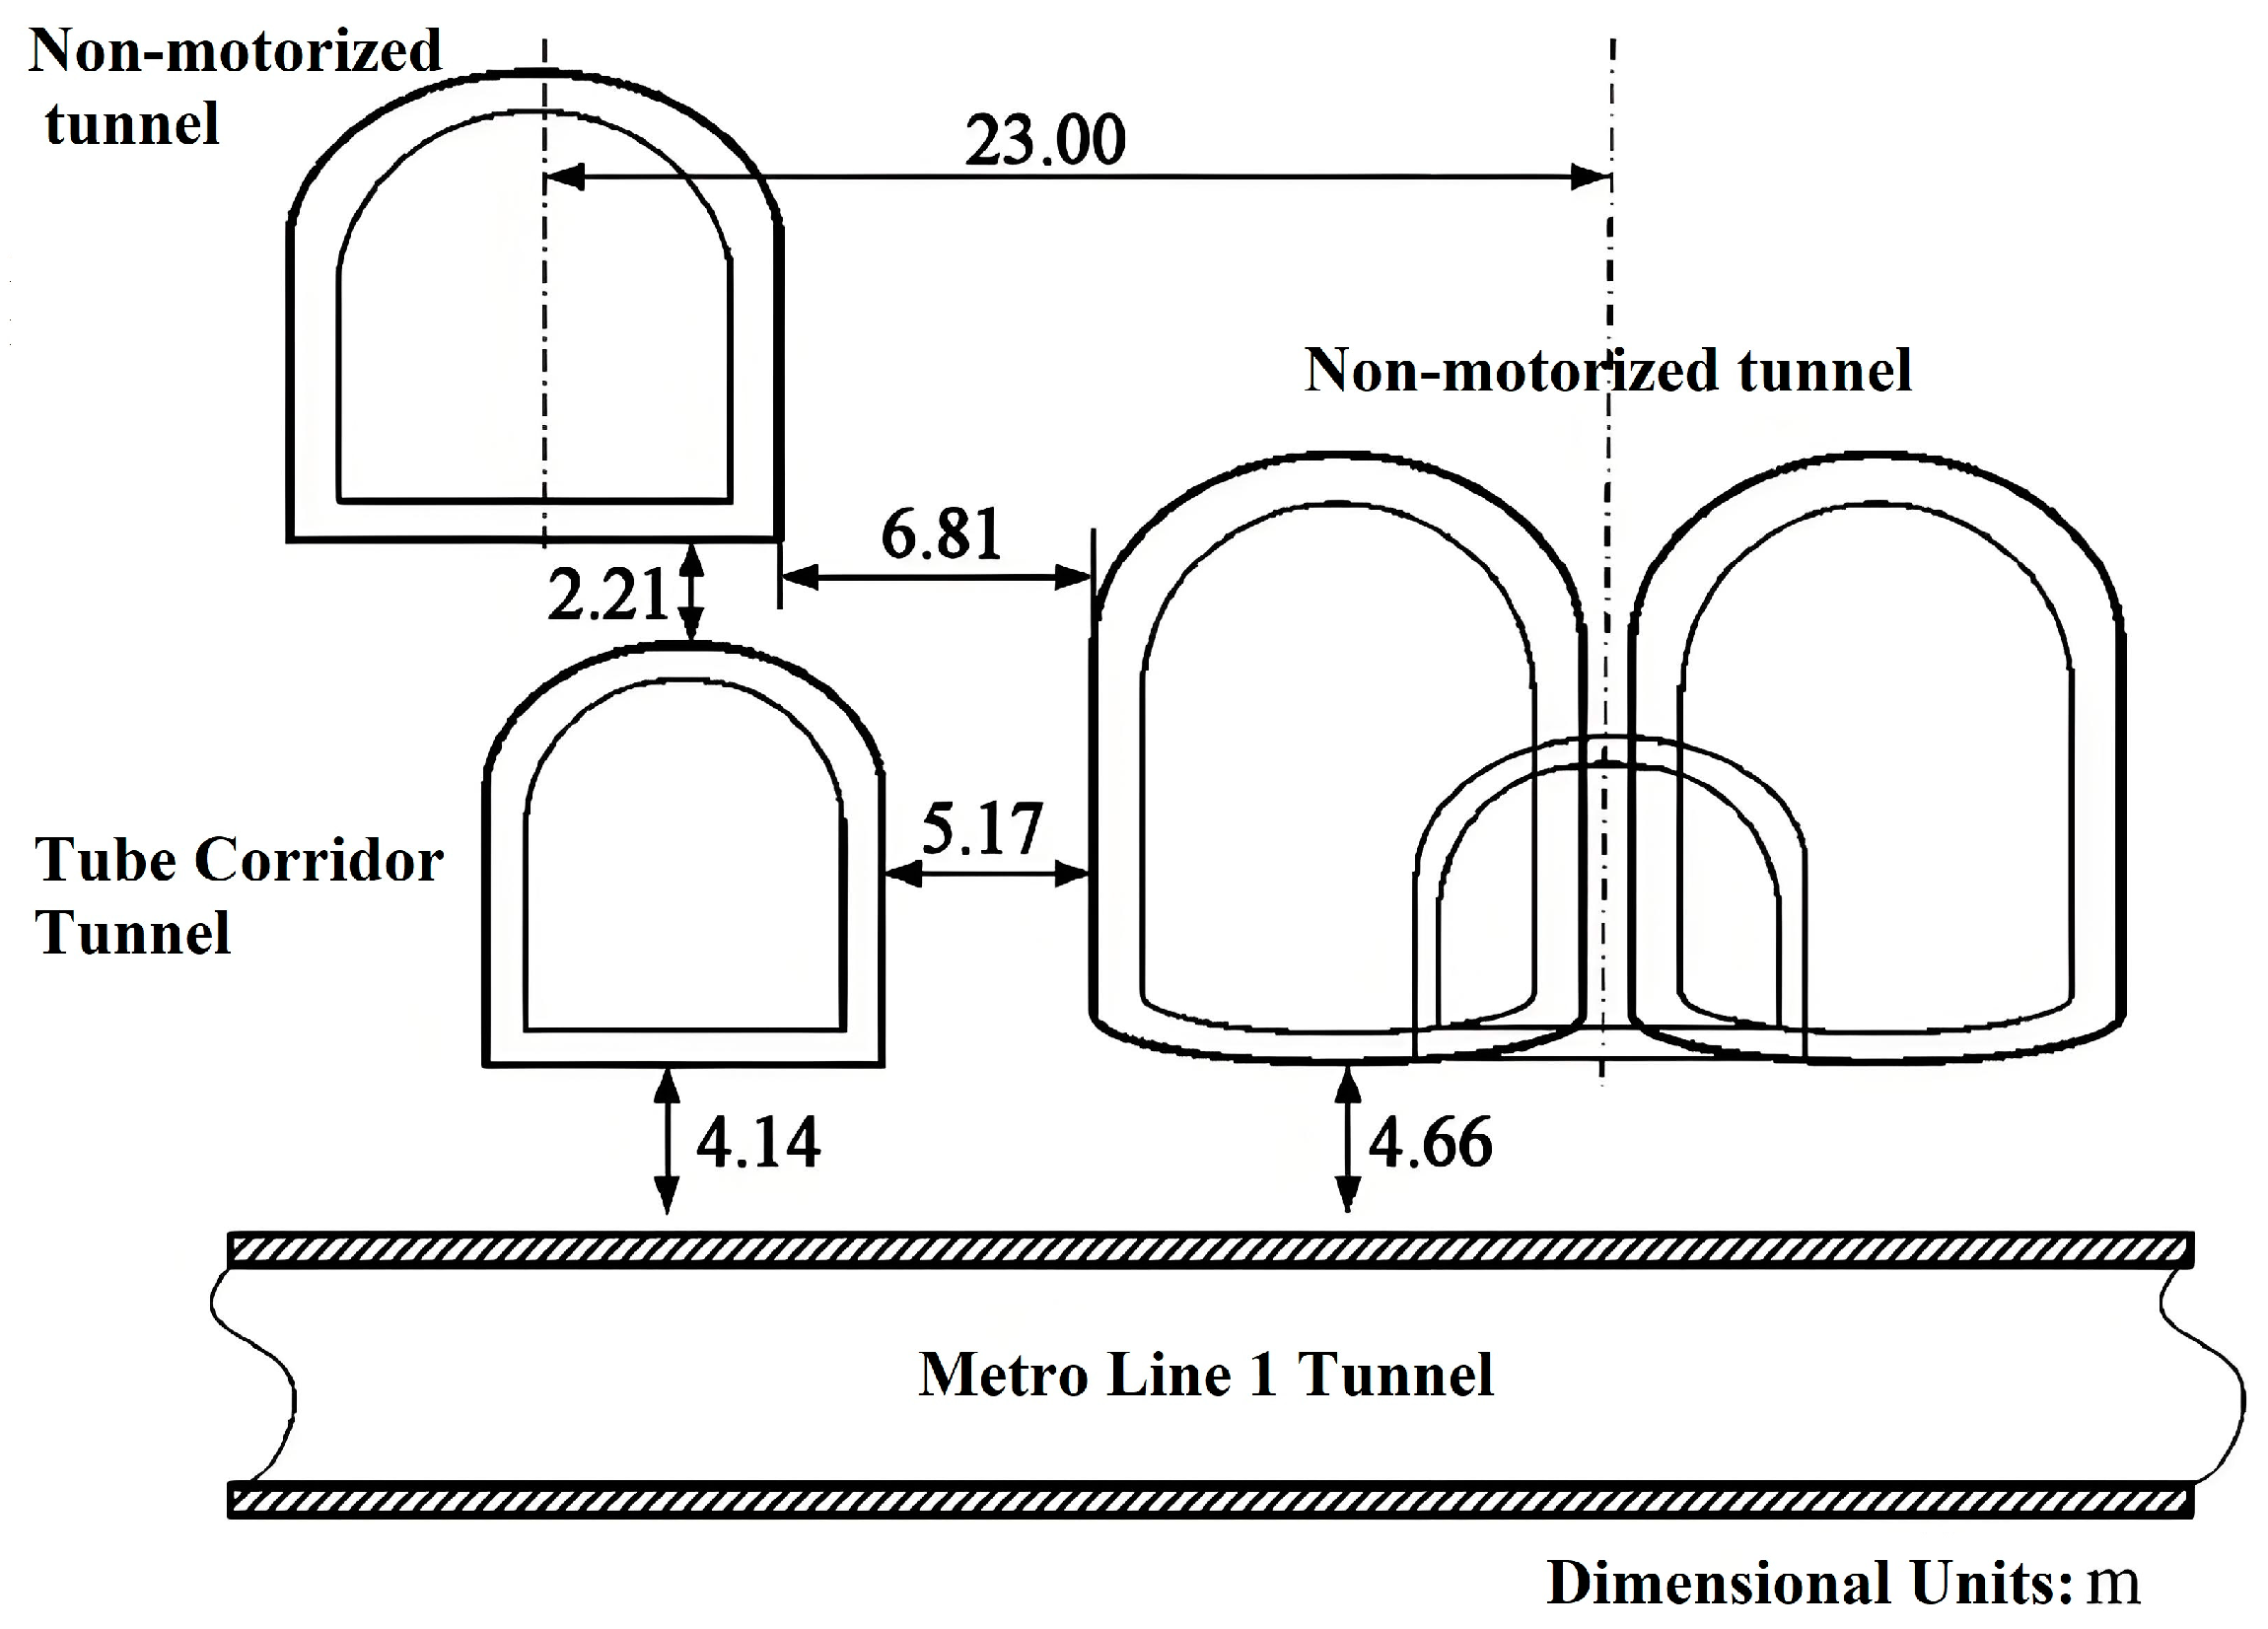
The Hongshan South Road tunnel group is situated north of Nanjing Railway Station. Blasting operations in the upper-level tunnel group may potentially affect the operation of the underlying Metro Line 1, with an approximate clearance of 5 m. The r3 is set to 5 m. Detailed values for other specific tunnel parameters are provided in Table 1. As shown in Figure 4, the newly constructed non-motorized vehicle lane is in close proximity to the existing operational subway tunnel. This indicates that blasting operations for the non-motorized lane may have significant impacts on the circular tunnel of Subway Line 1. Therefore, a detailed vibration assessment is required.

4.2. Influence of Blast Load Duration on Transient Response

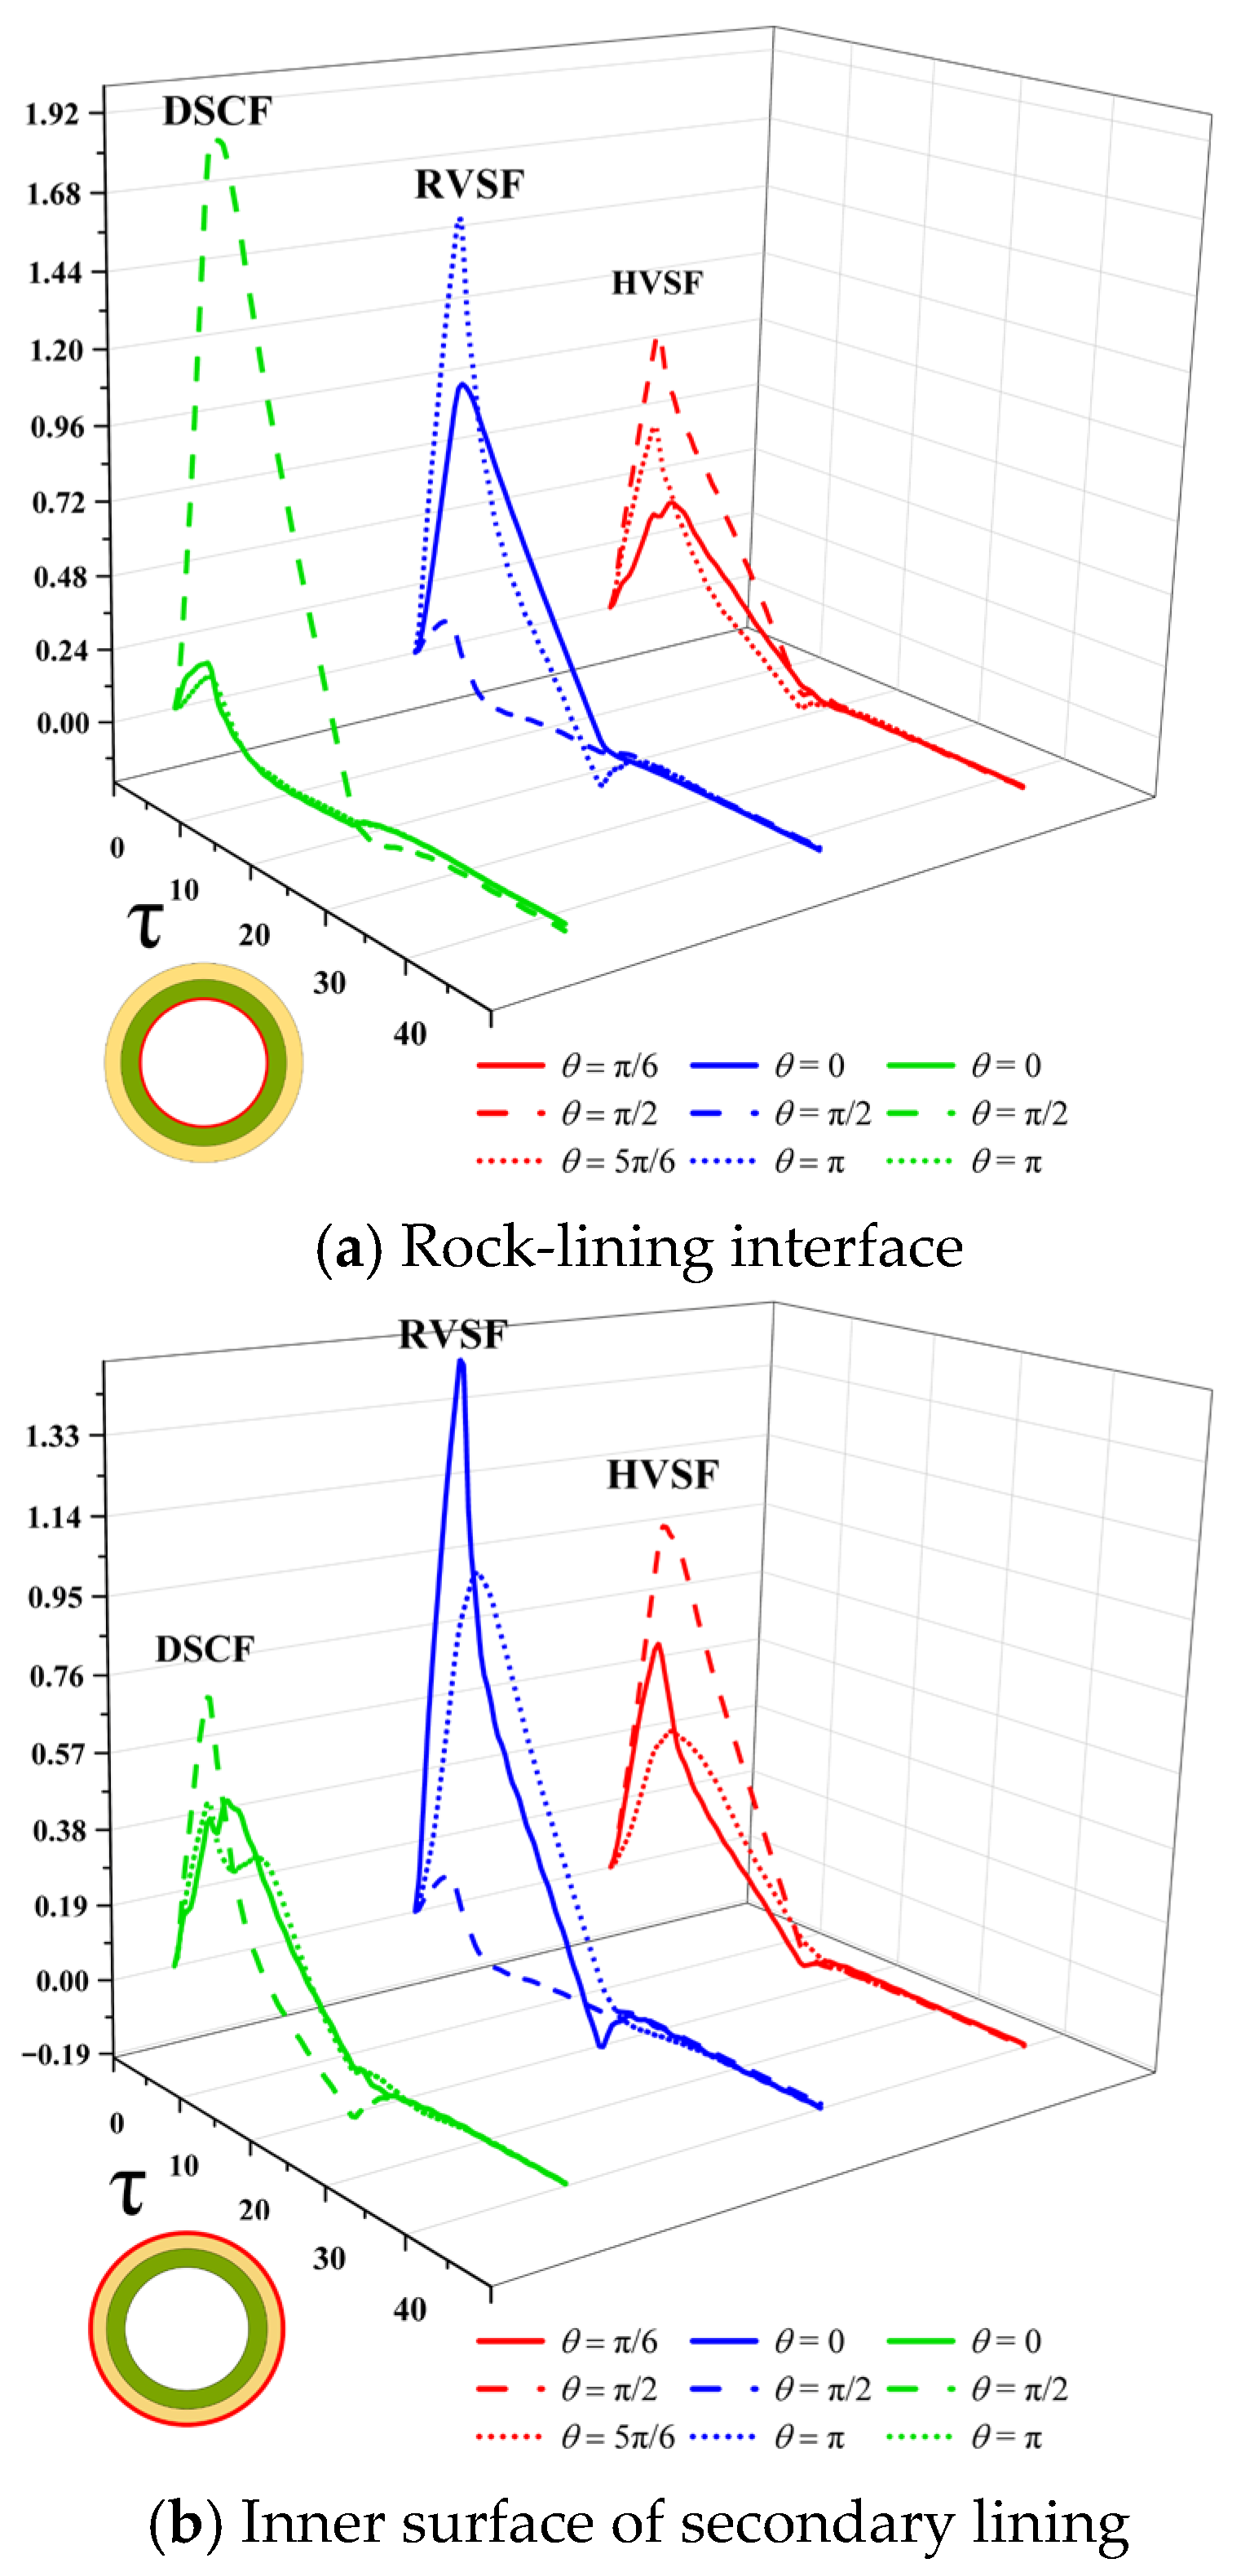
The non-perturbation loading function is characterized by its specific loading and unloading parameters, denoted as t s / t r = 5 , t r = 5 . The temporal variations of the DSCF, RVSF, and HVSF in response to P-wave blasting excitation are presented in Figure 5, for points located on both the tunnel-surrounding rock interface and the inner boundary of the secondary lining. Regarding the overall transient response, all three indicators exhibit a consistent variation pattern: the curves initially rise rapidly to a positive peak, then drop sharply into the negative region, and finally gradually decay to zero. This indicates that during the scattering of the transient incident wave around the lining, the dynamic field undergoes a significant reduction process from a positive to a negative peak. Across different monitoring points, the tunnel-surrounding rock interface and the inner boundary of the secondary lining exhibit significantly differing response amplitudes. Specifically, the DSCF value at the vault of the inner secondary lining boundary is notably higher than that at the tunnel-surrounding rock interface, indicating that this area merits particular attention in design. This suggests that, as the initial load-bearing structure, the secondary lining experiences more intense blast impact, and the dynamic stress concentration phenomenon is more pronounced. For the radial vibration response, the peak RVSF of the secondary lining is also significantly greater than that of the surrounding rock, indicating that the lining is more susceptible to severe instantaneous radial deformation. This is likely related to the stiffness difference between the lining and the surrounding rock. In contrast, the difference in the Hoop Velocity Scaling Factor between the secondary lining and the surrounding rock is relatively small, and its amplitude of variation is also less significant.
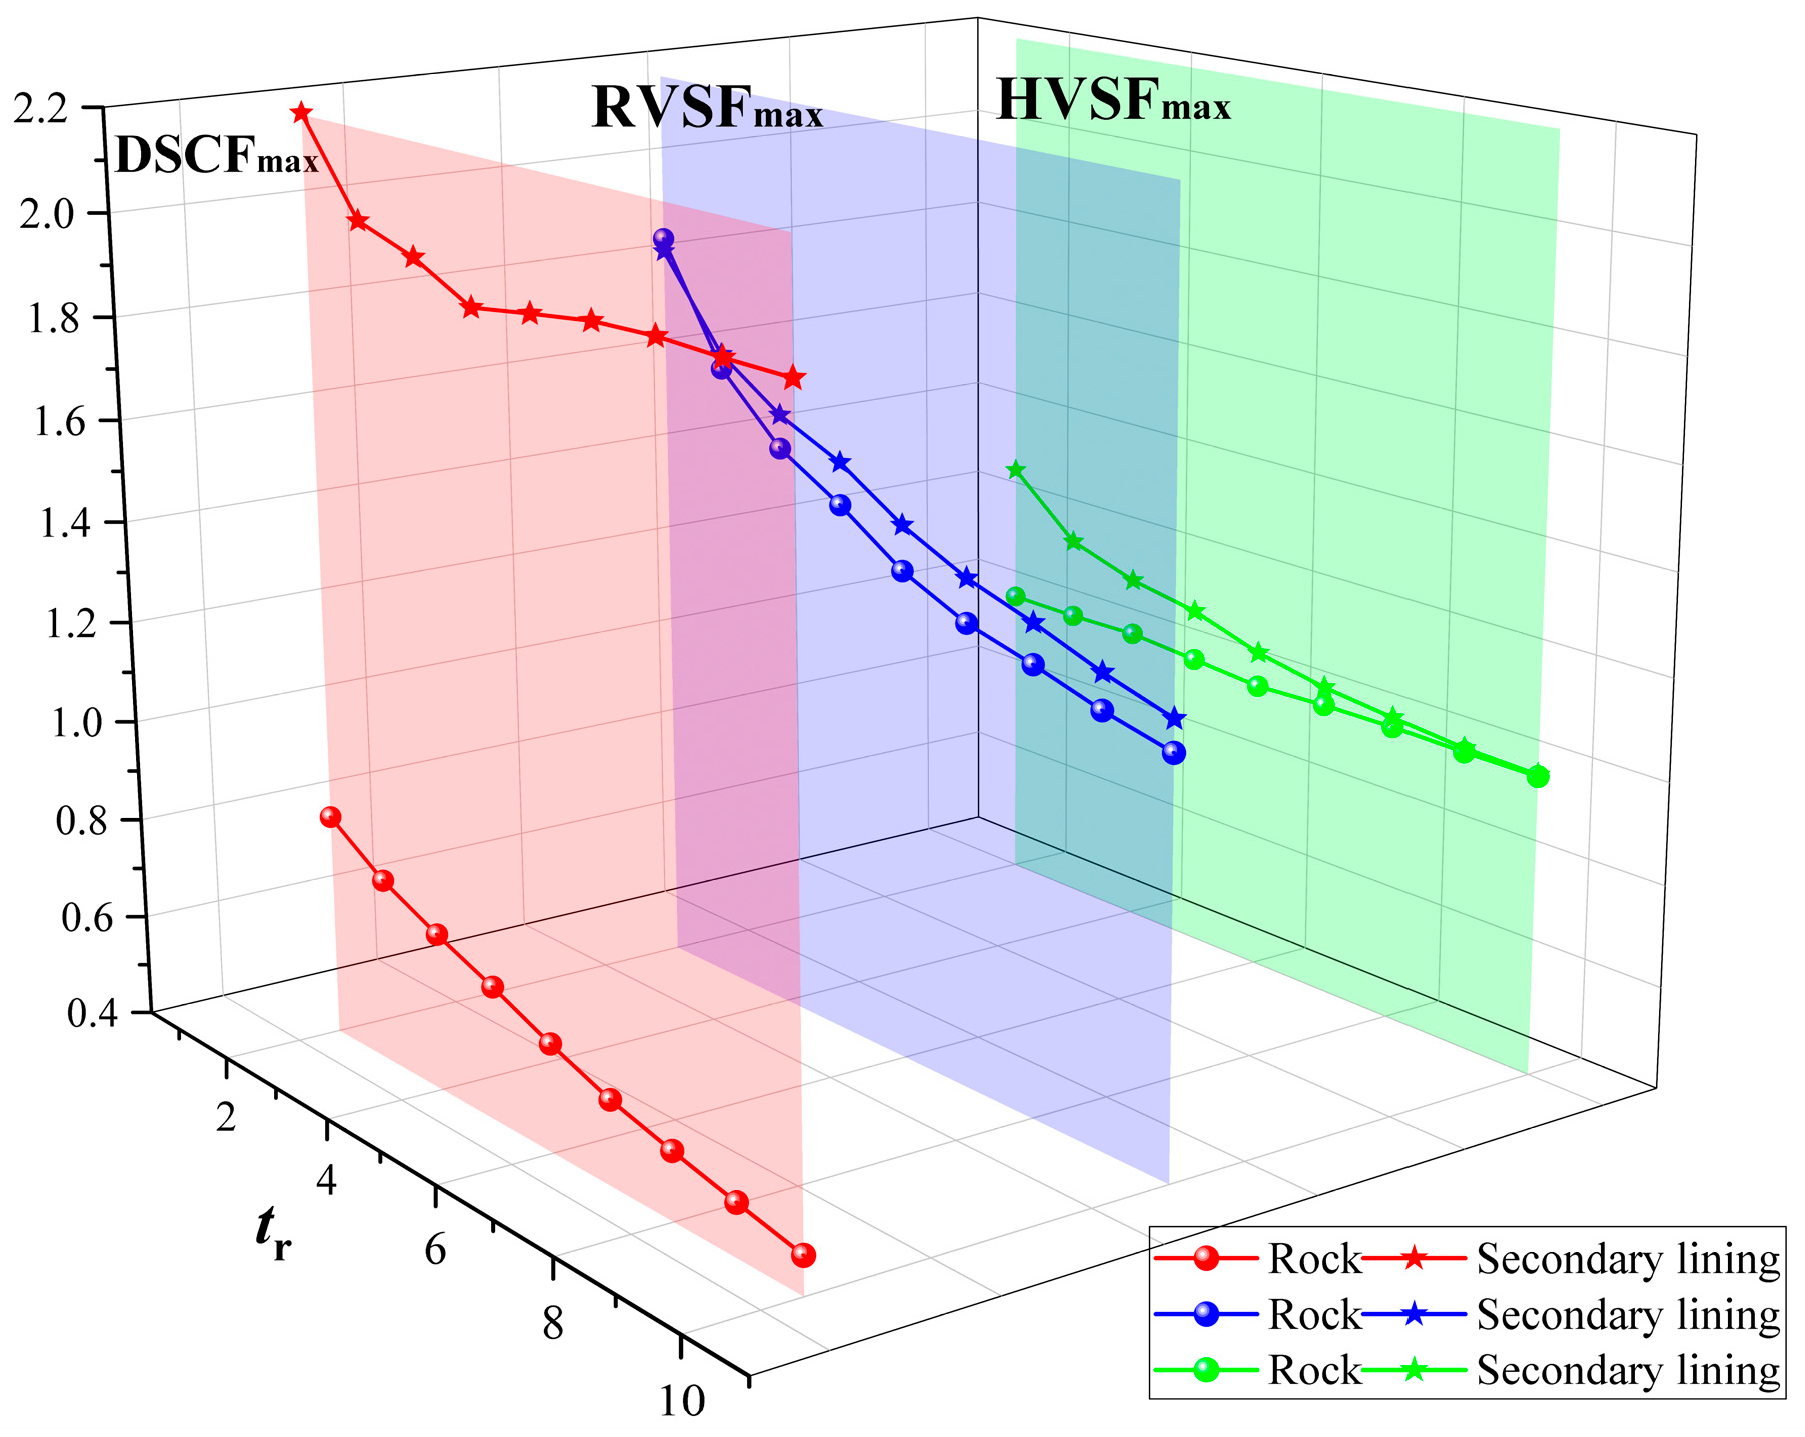
For clarity in the following discussion, the rock-lining interface (hereafter referred to as rock) and the Inner surface of secondary lining (hereafter referred to as secondary lining) are defined. As illustrated in Figure 6, Under transient P-wave loading, the peak dynamic stress concentration factor (DSCFmax), peak radial velocity scaling factor (RVSFmax), and peak hoop velocity scaling factor (HVSFmax) all indicators exhibit a distinct decreasing trend as the duration of the blast load, tr, increases. Specifically, as tr decreases, DSCFmax, RVSFmax, and HVSFmax show an increasing trend. Furthermore, the dynamic and vibration response intensities are generally higher on the secondary lining side than on the surrounding rock side. This phenomenon can be explained from the perspective of the temporal effect of load action: a shorter loading duration implies a more rapid application and release of the blast load, leading to a higher energy input imposed on the structure within an extremely short timeframe. Consequently, this results in a more intense and concentrated transient response. A further comparison of their sensitivity to variations in tr reveals that RVSFmax is the most sensitive to changes in loading duration. Its value decreases from 1.87 to 1.20, representing a reduction of approximately 36%. In contrast, HVSFmax is less affected by variations in tr. This indicates that under transient P-wave loading, the vibration response in the radial direction of the surrounding rock and lining structure is more intense and more sensitive to the time-varying characteristics of the load. The hoop-direction vibration response, however, demonstrates a certain degree of inertia and is less influenced by changes in the loading duration.

4.3. Circumferential Comparative Analysis of Transient Response Between Surrounding Rock and Secondary Lining

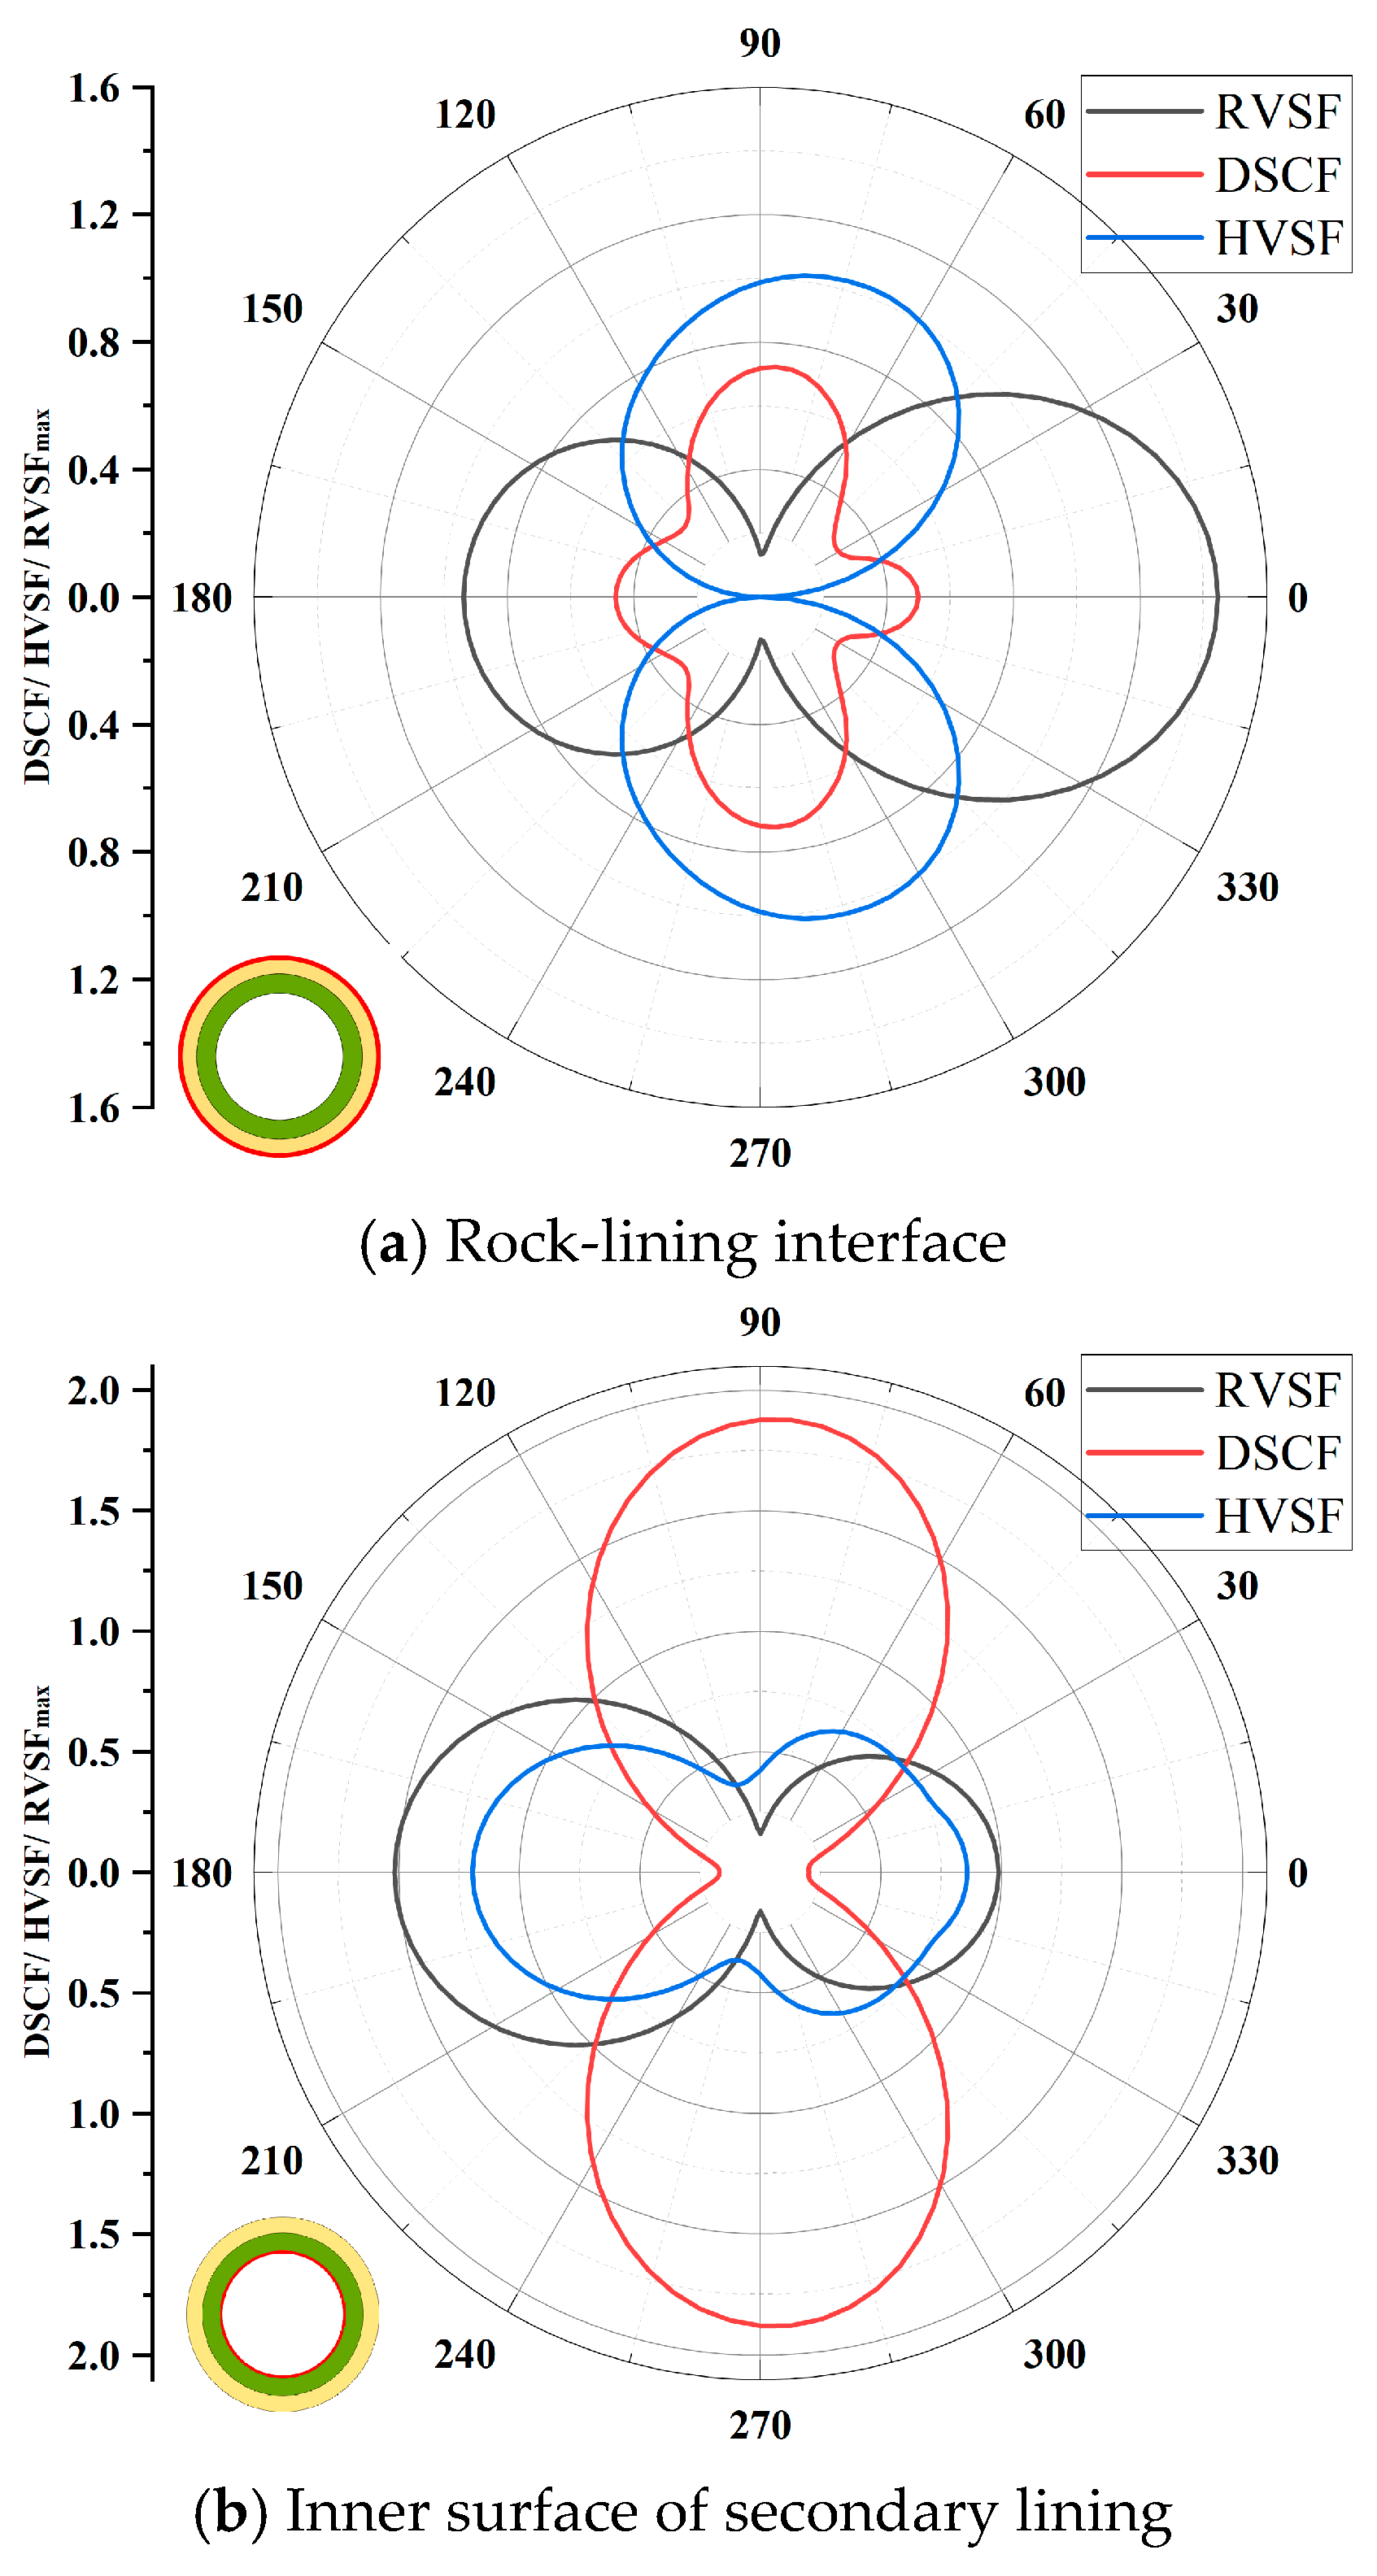
To further investigate the dynamic and vibration responses of composite-lined tunnels, this study selects the triangular blast load with amplitude parameter t r = 5 and loading/unloading ratio t s / t r = 5 as the excitation input. Figure 7 illustrates the distributions of DSCFmax, RVSFmax, and HVSFmax along the inner surface of the surrounding rock and the secondary lining. From the overall distribution characteristics, the peak dynamic stress response on the secondary lining side is notably higher than that on the surrounding rock side, which is consistent with the earlier conclusion regarding the dynamic concentration effect of the secondary lining as the main load-bearing component. For the vibration response, the peak radial and circumferential velocities display a high degree of consistency between the surrounding rock and the secondary lining. As shown in Figure 7a, for the surrounding rock side, the maximum HVSFmax occurs at the haunch. Figure 7b indicates that for the inner surface of the secondary lining, the maximum DSCFmax is located at the crown, and the peaks of both circumferential and radial vibration responses tend to concentrate toward the side facing the blast, reflecting the concentration characteristics of dynamic and vibration responses in the lining structure under blast impact.

4.4. Influence of Tunnel Physical and Mechanical Parameters on Transient Response

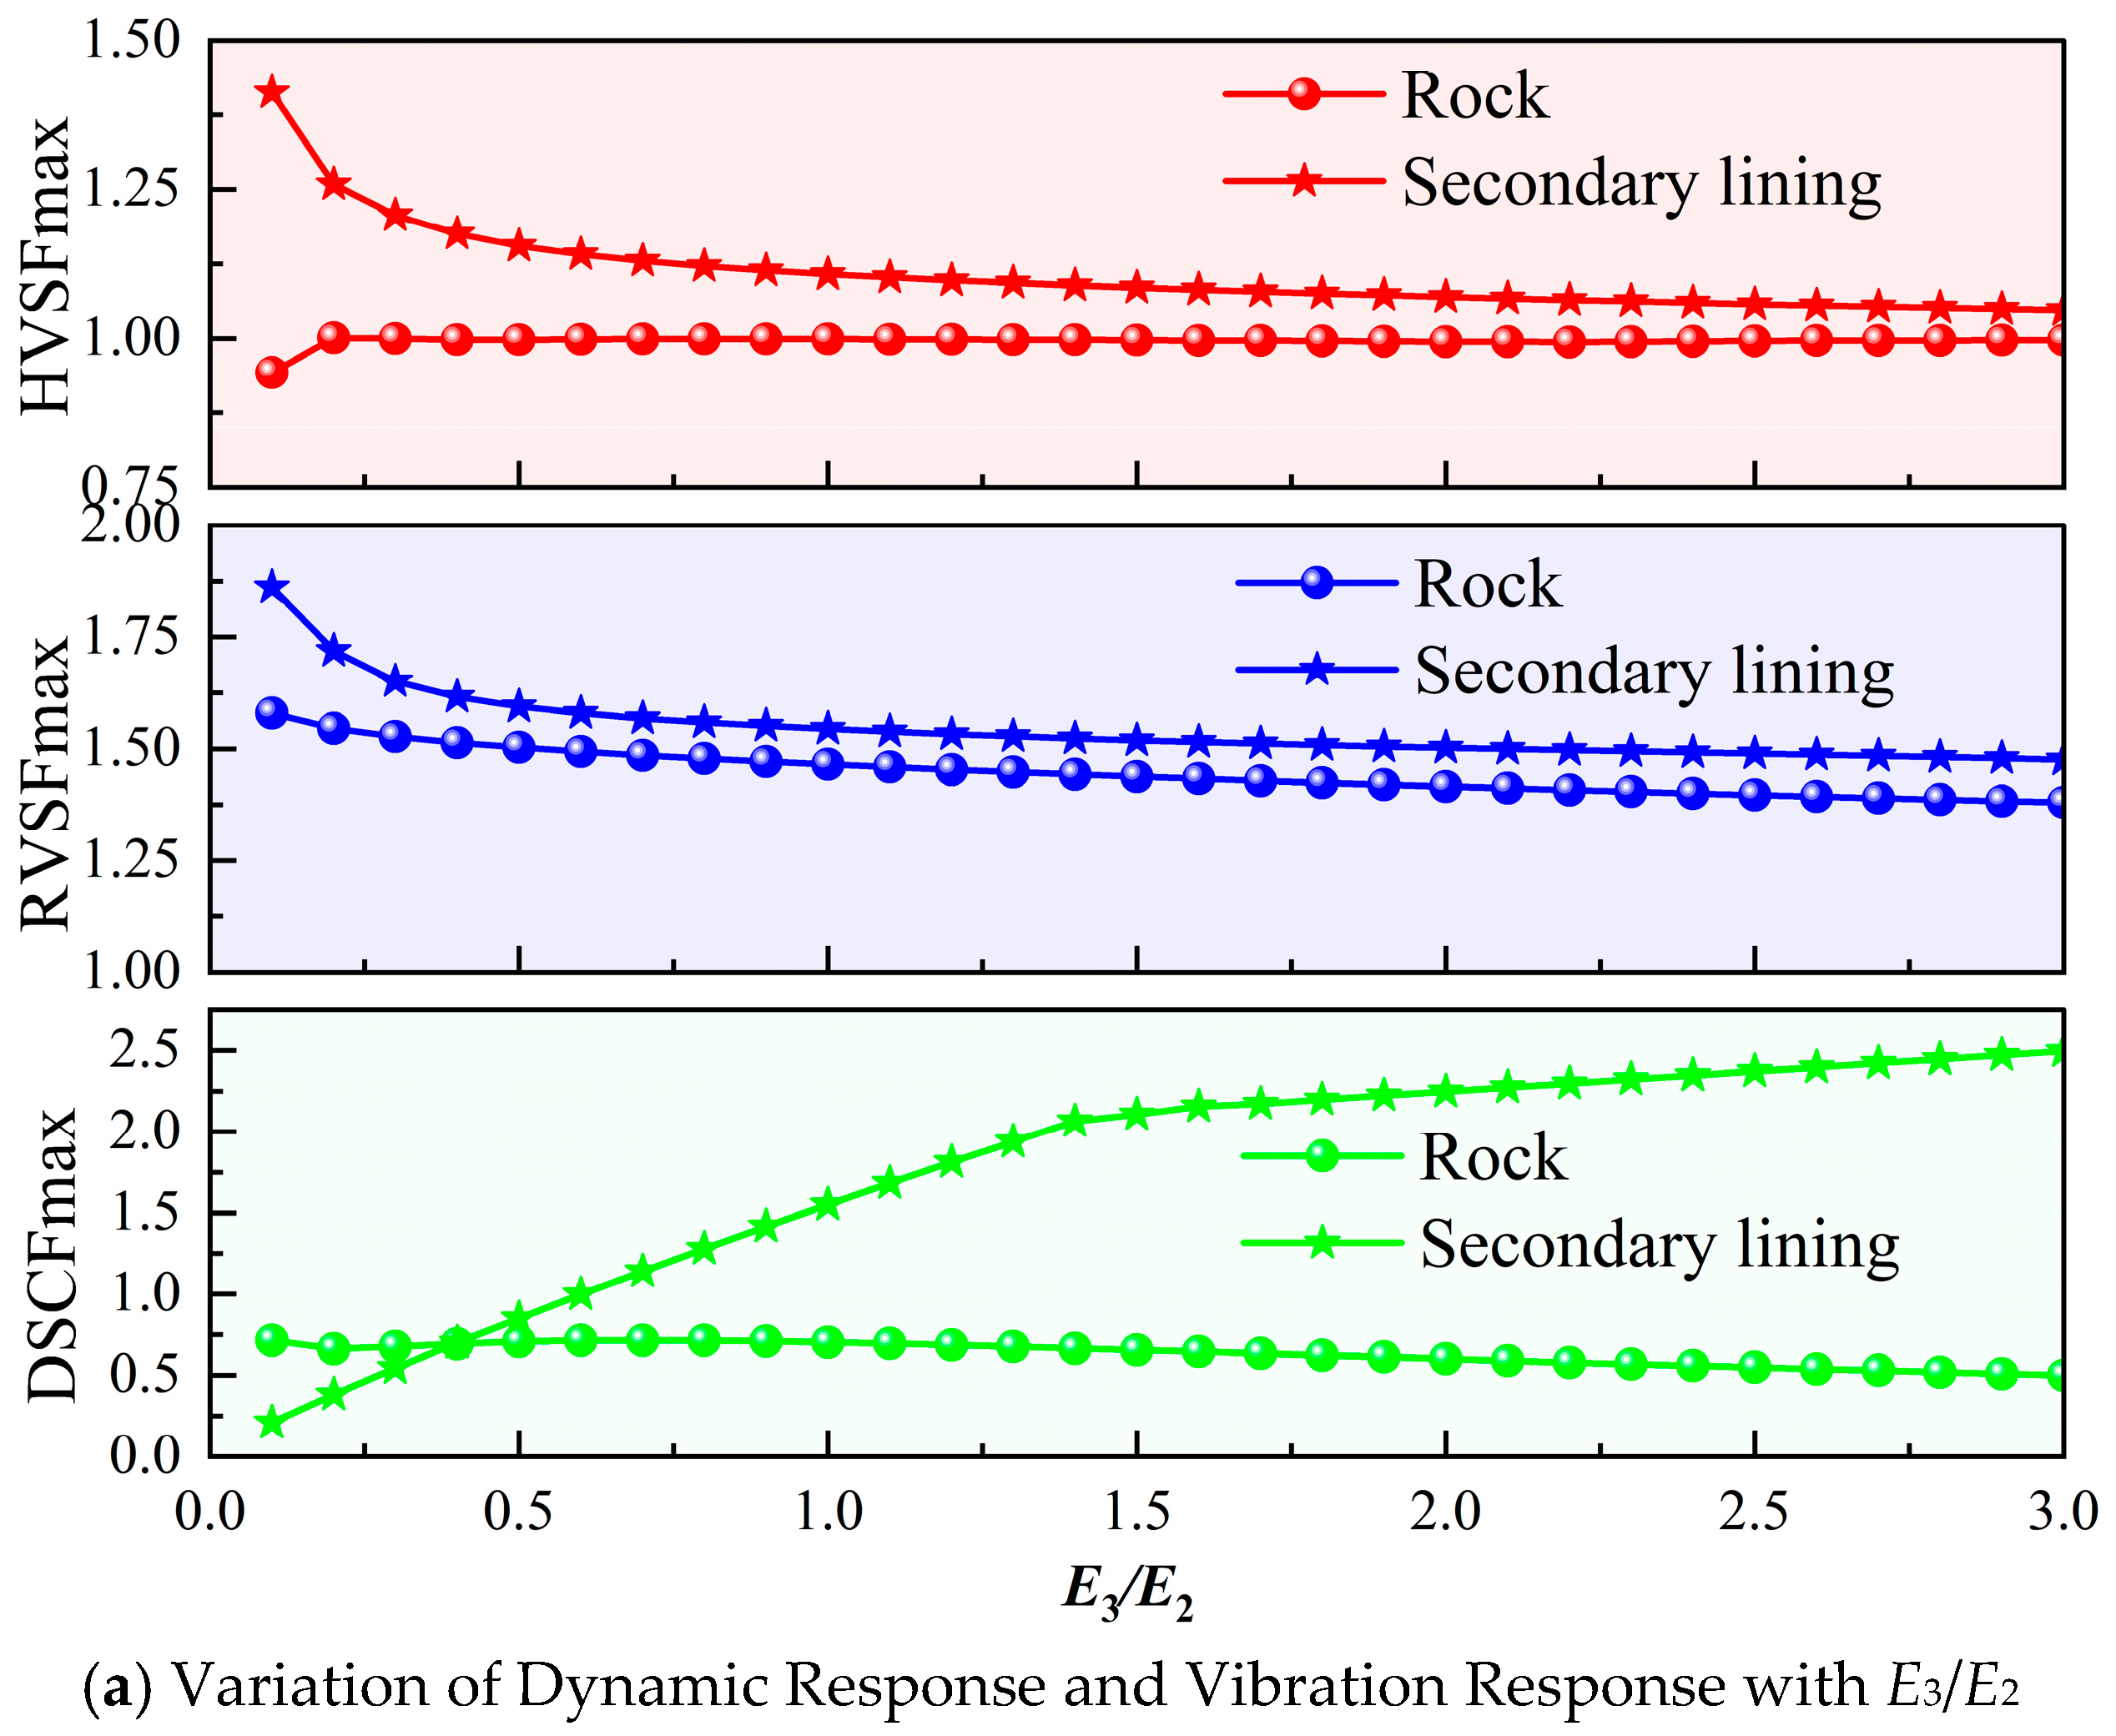
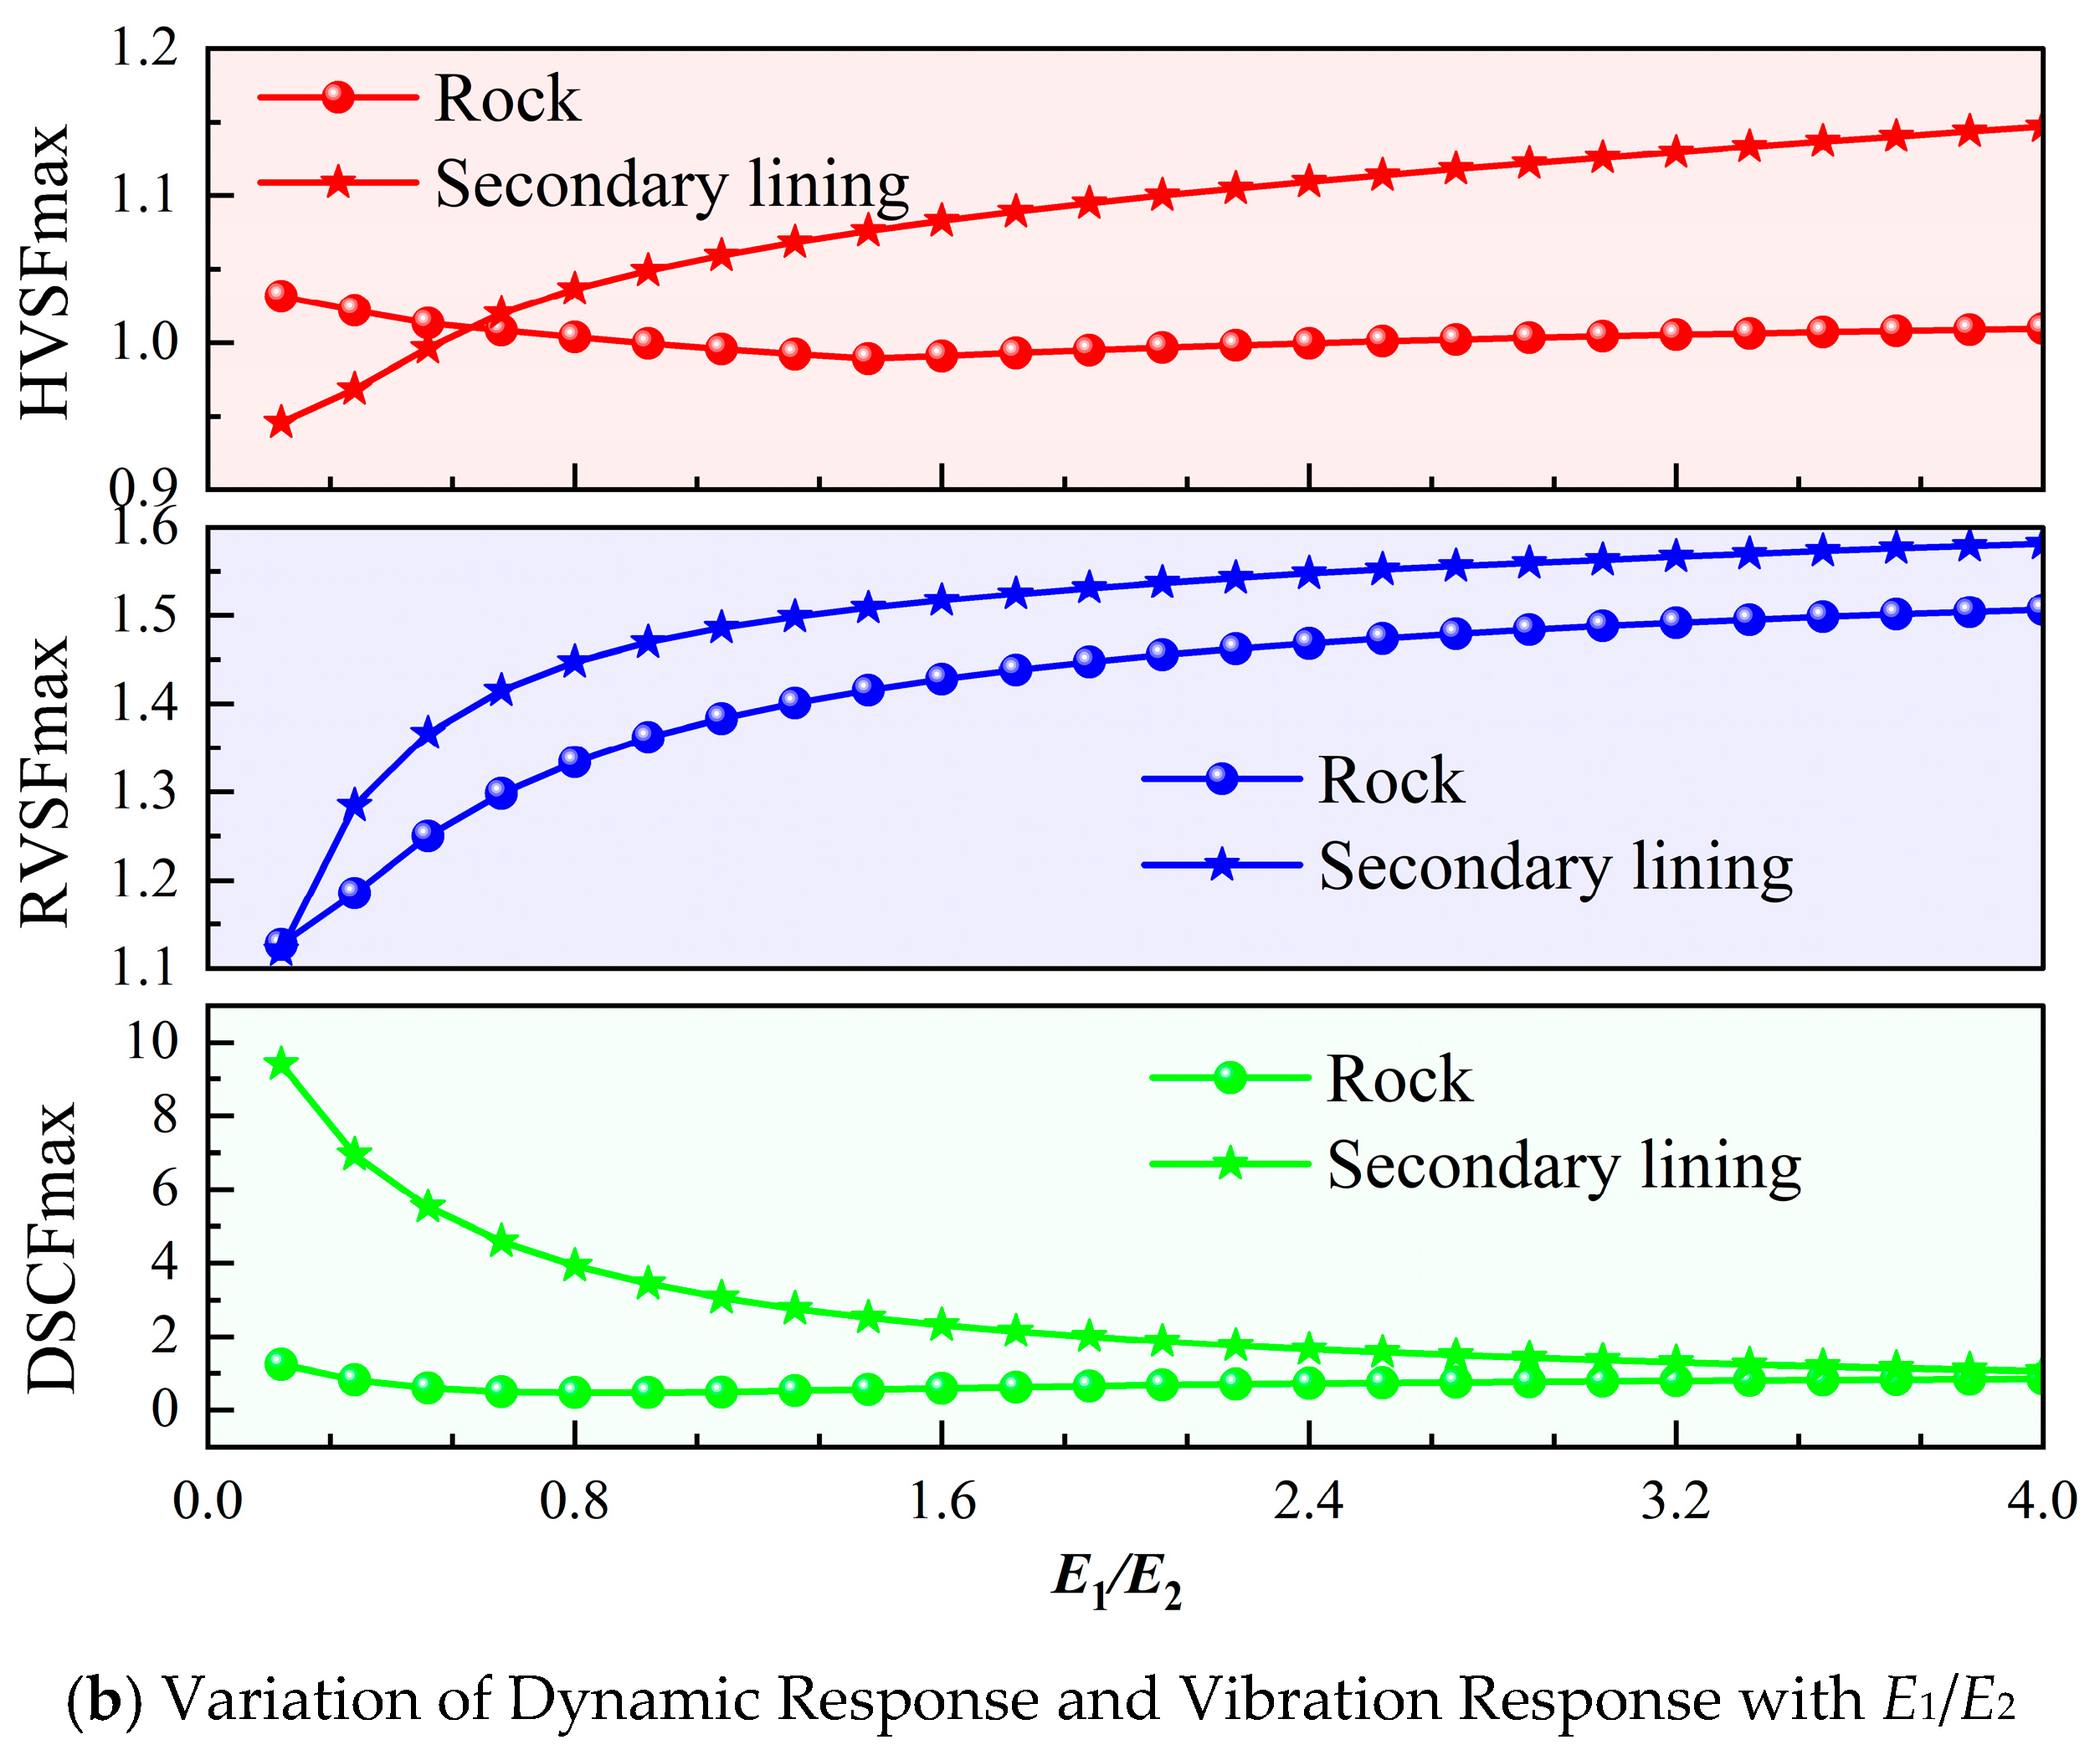
Given that the influence of the Poisson’s ratio of the lining and surrounding rock on the transient response is relatively minor [33], this subsection introduces two dimensionless parameters—the elastic modulus ratio between the secondary lining and the initial support (E3/E2) and the elastic modulus ratio between the surrounding rock and the initial support (E1/E2)—to analyze the effect of elastic modulus on the transient response of the composite lined tunnel. As shown in Figure 8a, under transient P-wave loading, the peak values of DSCF, RVSF, and HVSF on the surrounding rock side decrease as E3/E2 increases. For the inner surface of the secondary lining, the peak vibration responses also decrease with increasing E3/E2, tending to stabilize when E3/E2 exceeds 1.2. In contrast, the peak dynamic stress increases as the stiffness ratio E3/E2 rises. Therefore, to ensure structural stability while minimizing stress concentration, selecting a secondary lining material with a decreased rigidity. Figure 8b indicates that under transient P-wave loading, the DSCFmax on the inner surface of the secondary lining decreases significantly with increasing E1/E2, dropping from approximately 9.39 to 1.05—a reduction of about 89%. In comparison, the variation of DSCFmax on the surrounding rock side with E1/E2 is not pronounced. As E1/E2 increases, the peak vibration responses (HVSFmax, RVSFmax) in the surrounding rock and secondary lining increase initially and then plateau, with the overall magnitude of change being limited. In general, when E1/E2 exceeds 2, both dynamic and vibration responses tend to stabilize. This suggests that when the surrounding rock is more stable, the dynamic and vibration responses of the composite lining structure are smaller, as a competent surrounding rock can transfer part of the dynamic stress and vibration from the initial and secondary linings. Therefore, in practical engineering, measures such as grouting reinforcement of the surrounding rock can be adopted to enhance the stability of composite lined tunnels.

4.5. Influence of Geometric Parameters on Transient Response

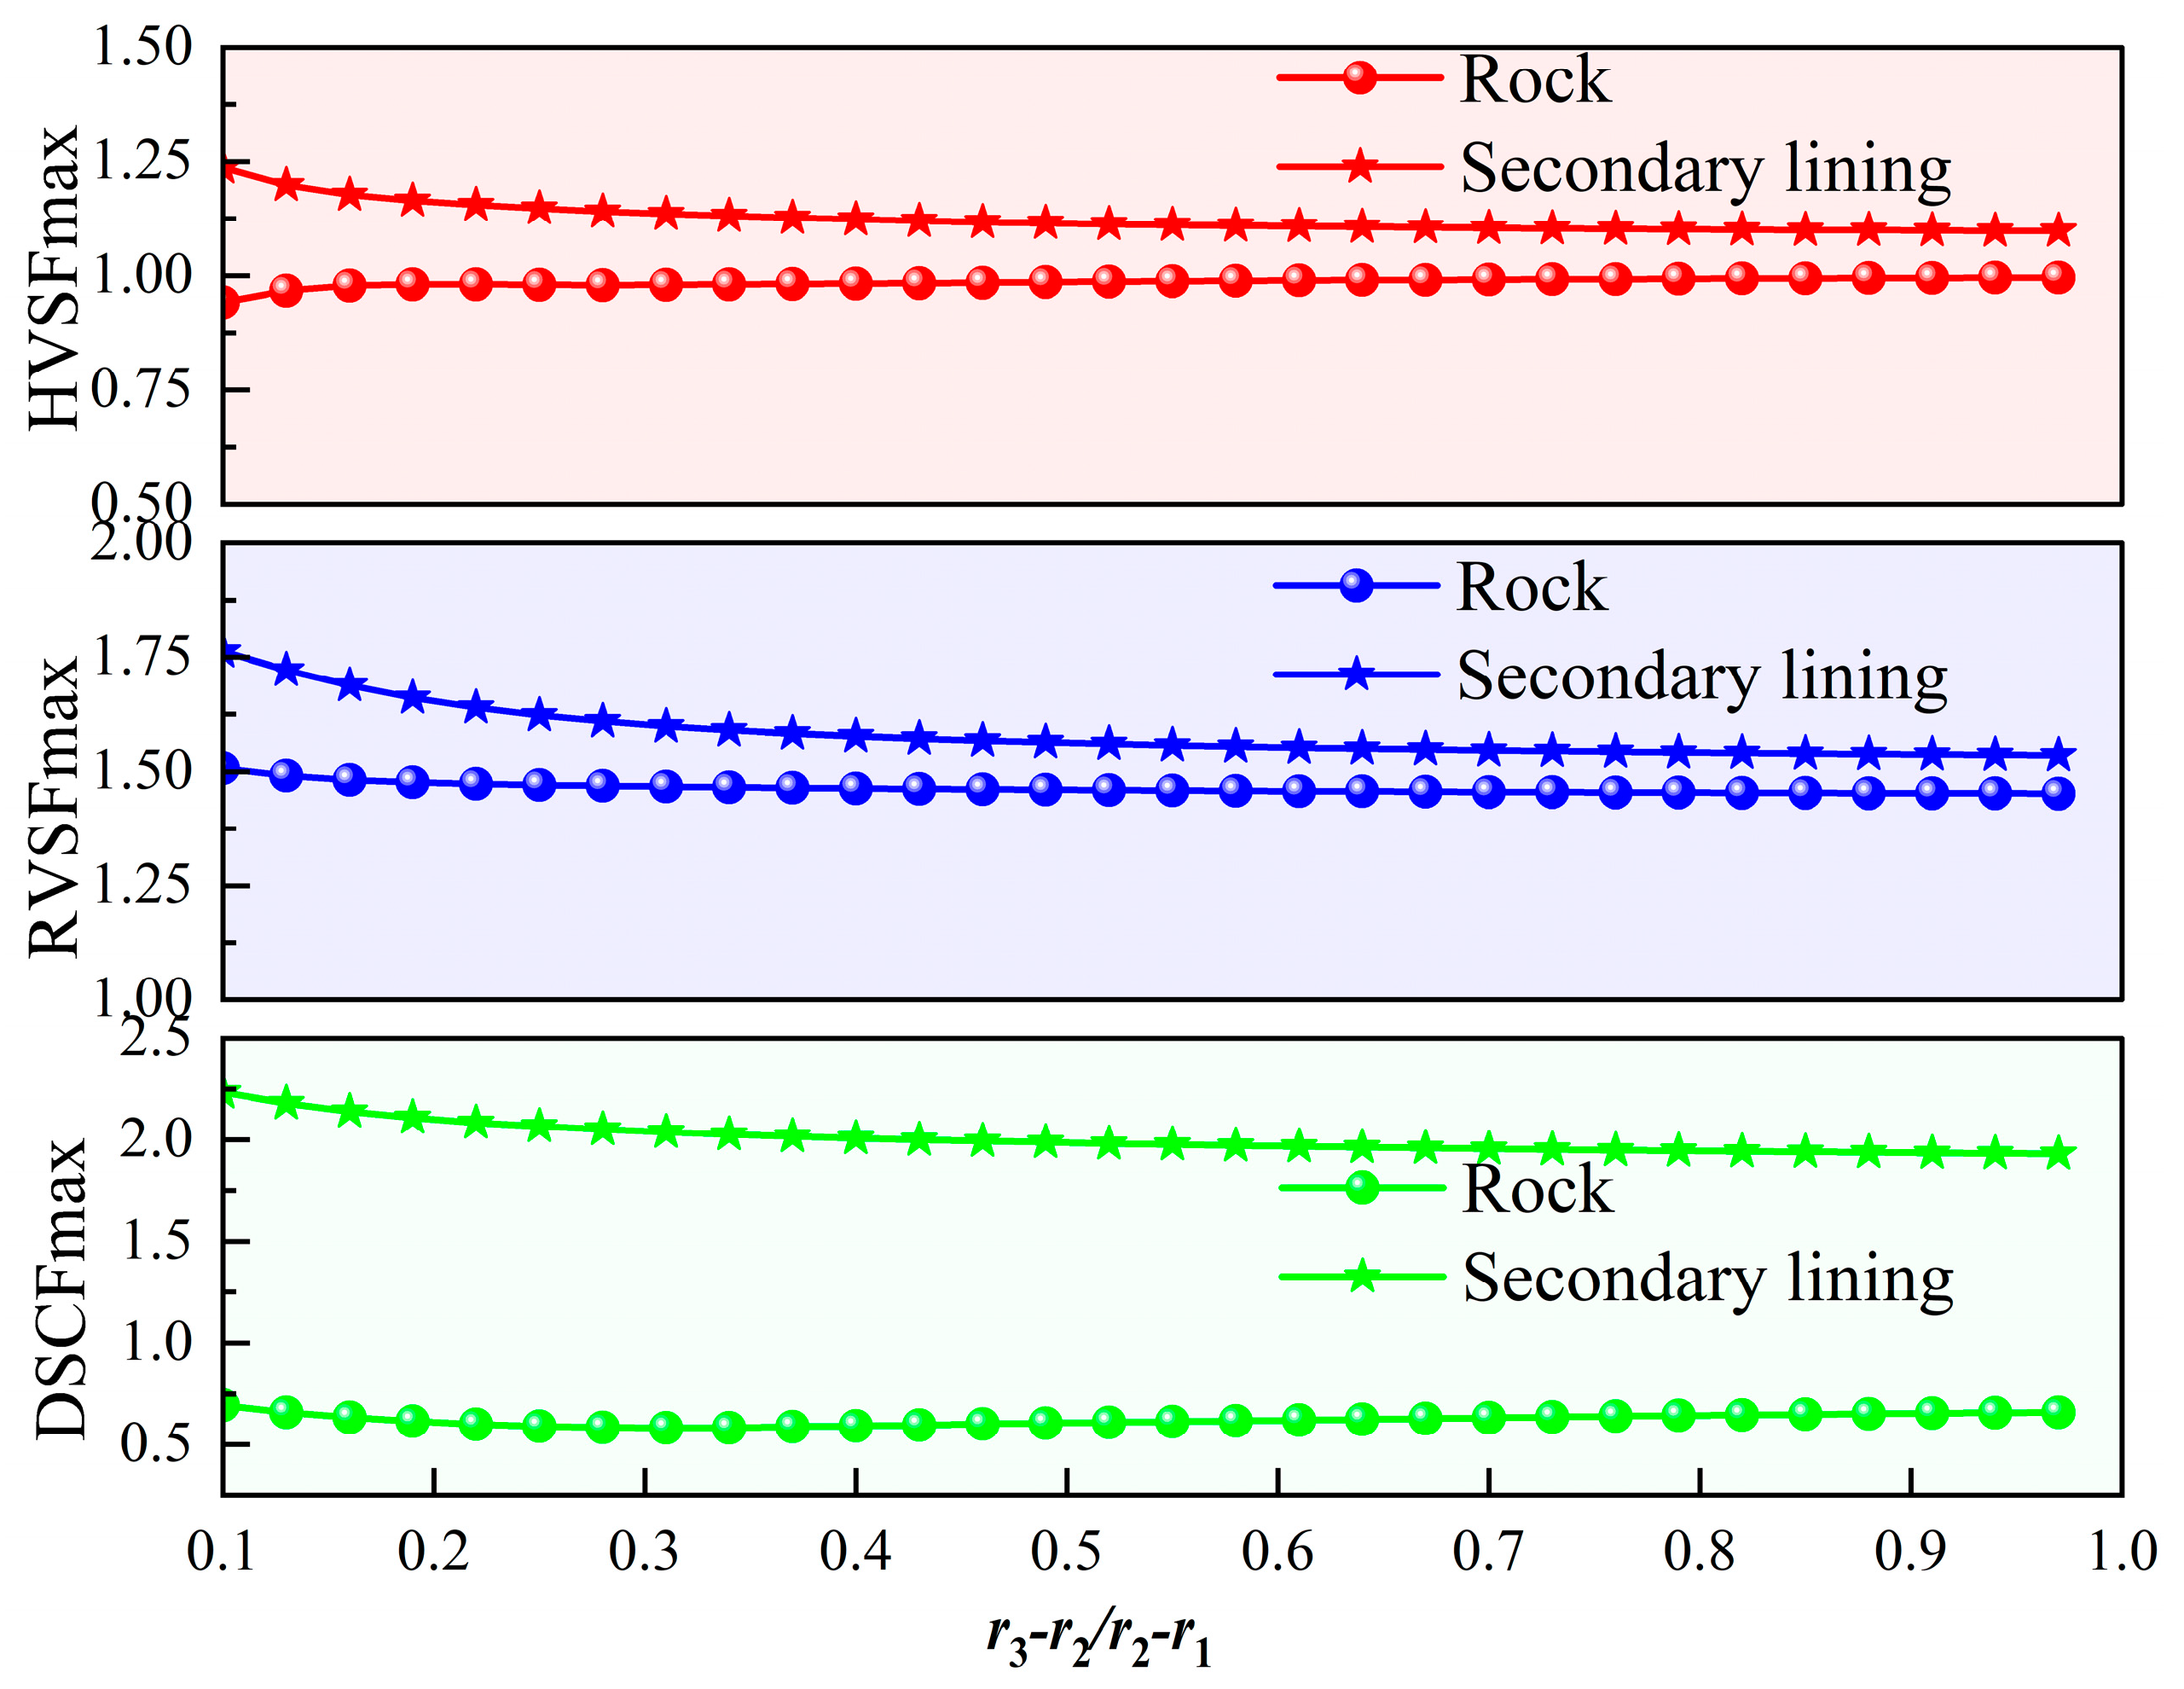
This section selects the dimensionless thickness ratio (r1r2/r2r3) as the research indicator to focus on analyzing the regulatory effect of varying lining thickness on the transient response of composite tunnel structures. Figure 9 presents the variations of DSCFmax, RVSFmax, and HVSFmax along the surrounding rock and the inner surface of the secondary lining with respect to this thickness ratio.
Figure 9 reveals that, subjected to transient P-wave excitation, the peak values of DSCFmax, RVSFmax, and HVSFmax at the inner lining interface demonstrate a direct positive association with the geometric parameter (r1r2/r2r3). Notably, the magnitude of fluctuation on the internal side is quantitatively greater than that recorded on the external surrounding rock side. When the thickness ratio increases to 1, DSCFmax on the lining’s inner surface decreases from 2.23 to 1.93, corresponding to a reduction of 13.5%. On the surrounding rock side, DSCFmax and RVSFmax follow a similar trend, whereas HVSFmax increases with the thickness ratio before gradually stabilizing, exhibiting a relatively small range of variation. In view of the unstable surrounding rock conditions, optimizing the initial support thickness can serve as a critical measure to bolster the structural integrity and stability of the composite tunnel system. Overall, setting the thickness ratio of the initial support to the secondary lining at 0.2 can effectively reduce the dynamic and vibration responses of both the secondary lining and the surrounding rock.

5. Conclusions and Prospects

This study focuses on the transient dynamic and vibration response of deep-buried composite lined tunnels. By analyzing the associated distribution patterns, it specifically examines the influences of elastic modulus, blast loading duration, and lining thickness on dynamic stress and vibration coefficients. The primary conclusions are as follows:
(1)
In the seismic design of tunnels, special attention should be paid to zones of dynamic stress concentration such as the crown of the secondary lining. When the rise time of the blasting load is short, the peak dynamic stress in these areas becomes particularly significant, necessitating enhanced protective measures.
(2)
On the interface between the tunnel lining and the surrounding rock, the variation trends of DSCF, RVSF, and HVSF are generally consistent at the crown and the two haunch positions. Moreover, the peak dynamic and velocity vibration responses at the lining–rock interface are lower than those on the inner surface of the secondary lining.
(3)
The peak values of DSCF and HVSF at the tunnel crown are notably higher than those at the sidewalls. In contrast, the RVSF effect is much more pronounced at the sidewalls than at the crown. Overall, the peak dynamic stress concentration response is significantly greater than the peak velocity vibration response.
(4)
In tunnel seismic design, by opting for a “thick and stiff” configuration in the initial support, this approach can optimize the support system, given that the secondary lining’s stability is well maintained. Increasing the ratio of the elastic modulus of the surrounding rock to that of the initial support helps reduce the peak values of the dynamic stress concentration factor and the velocity scaling factors inside the lining. However, when this ratio exceeds 2, the reduction effect becomes less pronounced. Therefore, it is recommended to enhance the elastic modulus ratio through measures such as grouting reinforcement to ensure the stability of the tunnel structure.
While this analytical framework excels in efficiency and physical clarity, its reliance on idealized assumptions limits its application to complex geometries and non-linearities, which are better addressed by numerical methods like FEA. Future research should prioritize systematic comparisons with high-fidelity simulations and integrate individual layer properties, such as damping effects, into radial vibration analysis. This will enhance structural health diagnosis and provide a more robust foundation for the seismic design of complex composite underground systems.


Author Contributions

W.G.: Resources, Writing—original draft, Funding acquisition, Investigation, Writing—review and editing; C.L.: Investigation, Supervision, Validation; Z.L.: Investigation, Conceptualization and Design; L.G.: Writing—original draft, Data curation, Writing—review and editing, Software; J.D.: Resources, Supervision; N.G.: Supervision, Data Curation. All authors have read and agreed to the published version of the manuscript.

Funding

The authors gratefully acknowledge the financial support received from: Study on Micro-vibration Blasting Technology for Tunnels in Alpine Regions (Grant No. 2024HX01); Ganpo Juncai Program—Young Science and Technology Talent Support Project of Jiangxi Province (Grant No. 2024QT04); Natural Science Foundation of Jiangxi Province, China (Grant No. 20242BAB26079); and General Program of Natural Science Foundation of Jiangxi Province (Grant No. 20242BAB25300).

Institutional Review Board Statement

Not applicable.

Informed Consent Statement

Not applicable.

Data Availability Statement

The data that support the findings of this study are available from the corresponding author upon reasonable request.

Acknowledgments

We are grateful to our teammates for their dedicated support and collaborative efforts throughout this research.

Conflicts of Interest

Author Wei Guo, Cong Luo and Ning Guo were employed by the company Jiangxi Provincial Transportation Engineering Group Co., Ltd. The remaining authors declare that the research was conducted in the absence of any commercial or financial relationships that could be construed as a potential conflict of interest.

Appendix A

ε 11 ( l ) ( α r ) = n 2 + n 1 / 2 β 2 r 2 Q n ( l ) ( α r ) α r Q n 1 ( l ) ( α r ) ε 12 ( l ) ( β r ) = n ( n + 1 ) Q n ( l ) ( β r ) + β r Q n 1 ( l ) ( β r ) ε 21 ( l ) ( α r ) = n 2 + n + 1 / 2 β 2 r 2 α 2 r 2 Q n ( l ) ( α r ) + α r Q n 1 ( l ) ( α r ) ε 22 ( l ) ( β r ) = n ( n + 1 ) Q n ( l ) ( β r ) β r Q n 1 ( l ) ( β r ) ε 41 ( l ) ( α r ) = n [ ( n + 1 ) Q n ( l ) ( α r ) + α r Q n 1 ( l ) ( α r ) ] ε 42 ( l ) ( β r ) = n 2 + n 1 / 2 β 2 r 2 Q n ( l ) ( β r ) + β r Q n 1 ( l ) ( β r ) ε 71 ( l ) ( α r ) = α r Q n 1 ( l ) ( α r ) n Q n ( l ) ( α r ) ε 72 ( l ) ( β r ) = n Q n ( l ) ( β r ) ε 81 ( l ) ( α r ) = n Q n ( l ) ( α r ) ε 82 ( l ) ( β r ) = β r Q n 1 ( l ) ( β r ) n Q n ( l ) ( β r ) Q n ( l ) ( ) = J n ( ) , l = 1 H n ( 1 ) ( ) , l = 3 H n ( 2 ) ( ) , l = 4
The above presents the specific expressions for the individual computational factors included in the matrix elements of Equation (11). In these expressions, the superscript l in takes the values 1 for Bessel functions of the first kind, and 3 or 4 for Hankel functions of the first and second kind, respectively.
M 1 = i n φ 0 ε n E 11 1 ( α 1 r ) M 2 = i n φ 0 ε n E 41 1 ( α 1 r ) M 3 = i n φ 0 ε n E 71 1 ( α 1 r ) M 4 = i n φ 0 ε n E 81 1 ( α 1 r )
A 11 = E 11 3 α 1 r , A 12 = E 12 3 β 1 r A 13 = μ 2 E 12 3 α 2 r A 14 = μ 2 E 12 4 α 2 r A 15 = E 12 3 β 2 r , A 16 = μ 2 E 12 4 β 2 r , A 17 = A 18 = A 19 = A 110 = 0 A 21 = E 41 3 α 1 r , A 22 = E 42 3 β 1 r A 23 = μ 2 E 42 3 α 2 r A 24 = μ 2 E 42 4 α 2 r A 25 = E 42 3 β 2 r , A 26 = μ 2 E 42 4 β 2 r , A 27 = A 28 = A 29 = A 210 = 0 A 31 = E 71 3 α 1 r , A 32 = E 72 3 β 1 r A 33 = μ 2 E 72 3 α 2 r A 34 = μ 2 E 72 4 α 2 r A 35 = E 72 3 β 2 r , A 36 = μ 2 E 72 4 β 2 r , A 37 = A 38 = A 39 = A 310 = 0 A 41 = E 81 3 α 1 r , A 42 = E 82 3 β 1 r A 43 = μ 2 E 82 3 α 2 r A 44 = μ 2 E 82 4 α 2 r A 45 = E 82 3 β 2 r , A 46 = μ 2 E 82 4 β 2 r , A 47 = A 48 = A 49 = A 410 = 0
A 51 = A 52 = 0 , A 53 = μ 2 E 12 3 α 2 r , A 54 = μ 2 E 12 4 α 2 r , A 55 = E 12 3 β 2 r , A 56 = μ 2 E 12 4 β 2 r A 57 = μ 1 E 11 3 α 3 r , A 58 = μ 1 E 11 4 α 3 r , A 59 = μ 1 E 12 3 β 3 r , A 510 = μ 1 E 12 4 β 3 r A 61 = A 62 = 0 , A 63 = μ 2 E 42 3 α 2 r , A 64 = μ 2 E 42 4 α 2 r , A 65 = E 42 3 β 2 r , A 66 = μ 2 E 42 4 β 2 r A 67 = μ 1 E 41 3 α 3 r , A 68 = μ 1 E 41 4 α 3 r , A 69 = μ 1 E 42 3 β 3 r , A 610 = μ 1 E 42 4 β 3 r A 71 = A 72 = 0 , A 73 = μ 2 E 72 3 α 2 r , A 74 = μ 2 E 72 4 α 2 r , A 75 = E 72 3 β 2 r , A 76 = μ 2 E 72 4 β 2 r A 77 = μ 1 E 71 3 α 3 r , A 78 = μ 1 E 71 4 α 3 r , A 79 = μ 1 E 72 3 β 3 r , A 710 = μ 1 E 72 4 β 3 r A 81 = A 82 = 0 , A 83 = μ 2 E 82 3 α 2 r , A 84 = μ 2 E 82 4 α 2 r , A 85 = E 12 3 β 2 r , A 86 = μ 2 E 82 4 β 2 r A 87 = μ 1 E 81 3 α 3 r , A 88 = μ 1 E 81 4 α 3 r , A 89 = μ 1 E 82 3 β 3 r , A 810 = μ 1 E 82 4 β 3 r
A 91 = A 92 = A 93 = A 94 = A 95 = A 96 = 0 , A 97 = E 11 3 α 3 r A 98 = E 11 4 α 3 r , A 99 = E 12 3 β 3 r , A 910 = E 12 4 β 3 r A 101 = A 102 = A 103 = A 104 = A 105 = A 106 = 0 , A 107 = E 41 3 α 3 r A 108 = E 41 4 α 3 r , A 109 = E 42 3 β 3 r , A 1010 = E 42 4 β 3 r
The expressions above correspond to the elements of the matrix in Equation (11), where μ 1 = G 2 / G 1 , μ 2 = G 3 / G 1 .

References

  1. Guan, X.; Yang, N.; Zhang, W.; Li, M.; Liu, Z.; Wang, X.; Zhang, S. Vibration response and failure modes analysis of the temporary support structure under blasting excavation of tunnels. Eng. Fail. Anal. 2022, 136, 106188. [Google Scholar] [CrossRef] [Scilit]
  2. Zhou, Z.; Zhou, X.; Li, L.; Liu, X.; Wang, L.; Wang, Z.; Zhou, Z.; Zhou, X.; Li, L.; Liu, X.; et al. The Construction Methods and Control Mechanisms for Subway Station Undercrossing an Existing Tunnel at Zero Distance. Appl. Sci. 2023, 13, 8826. [Google Scholar] [CrossRef] [Scilit]
  3. Wu, B.; Liu, W.; Shi, P.; Xu, X.; Liu, Y. A case study of newly tunnels over-crossing the existing subway tunnels. Int. J. Distrib. Sens. Netw. 2022, 18, 155013292210871. [Google Scholar] [CrossRef] [Scilit]
  4. Cheng, R.; Chen, W.; Hao, H.; Li, J. A state-of-the-art review of road tunnel subjected to blast loads. Tunn. Undergr. Space Technol. 2021, 112, 103911. [Google Scholar] [CrossRef] [Scilit]
  5. Liu, C.; Zhao, G.; He, J.; Liu, H.; Cui, J. Damage Pattern and Failure Mechanism of Shield Tunnel Lining under Internal Explosion. Thin-Walled Struct. 2025, 214, 113420. [Google Scholar] [CrossRef] [Scilit]
  6. Pao, Y.-H.; Mow, C.-C.; Achenbach, J.D. Diffraction of Elastic Waves and Dynamic Stress Concentrations. J. Appl. Mech. 1973, 40, 213–219. [Google Scholar] [CrossRef] [Scilit]
  7. Li, X.; Long, Y.; Ji, C.; Zhou, X.; He, Y.; Lu, L. Analysis of dynamie stress concentration factor for existing cireulartunnel lining under blasting seismic wave. Rock Soil Mech. 2013, 34, 2218–2224. [Google Scholar] [CrossRef]
  8. Li, X.; Long, Y.; Ji, C.; Zhou, X.; Lu, L. Dynamic stress concentration factor for tunnel surrounding rock underblasting seismic waves. Chin. J. Geotech. Eng. 2013, 35, 578–582. [Google Scholar]
  9. Lee, V.W.; Trifunac, M.D. Response of Tunnels to Incident SH-Waves. J. Eng. Mech. Div. 1979, 105, 643–659. [Google Scholar] [CrossRef] [Scilit]
  10. Ding, H.; Tong, L.; Xu, C.; Zhao, X.; Nie, Q. Dynamic responses of shallow buried composite cylindrical lining embedded in saturated soil under incident P wave based on nonlocal-Biot theory. Soil Dyn. Earthq. Eng. 2019, 121, 40–56. [Google Scholar] [CrossRef] [Scilit]
  11. Wang, J.; Zhang, Y.; Yu, P.; Shu, B.; Wang, Q.; Xu, Y.; Lang, L.; Peng, X. Dynamic Process Study of Earthquake-Induced Landslides Applying an Improved Discontinuous Deformation Analysis Method Considering Site Response. Rock Mech. Rock Eng. 2023, 56, 5427–5446. [Google Scholar] [CrossRef] [Scilit]
  12. Chang, C.; Qiao, F.; Bo, J.; Peng, D.; Li, Q. The influence of seismic frequency spectrum on the instability of loess slope. Sci. Rep. 2023, 13, 10949. [Google Scholar] [CrossRef] [Scilit]
  13. Yue, C.; Liu, Q. Complex function method for the scattering of harmonic plane waves by an arbitrary-shaped cavity in an unsaturated medium. Soil Dyn. Earthq. Eng. 2023, 173, 108139. [Google Scholar] [CrossRef] [Scilit]
  14. Mei, W.; Pan, P.; Wang, Z.; Xie, Y.; Feng, Y.; Chi, F. Dynamic Responses and Failure Characteristics of Surrounding Rock in a Deep-Buried Tunnel with an Arbitrary Cross-Section Subjected to Blasting P-Wave. Comput. Geotech. 2025, 186, 107447. [Google Scholar] [CrossRef] [Scilit]
  15. Wang, H.; Chen, Z.; Ma, S.; Li, X.; Liu, S.; Zhao, S. Seismic performance analysis of shallow-buried large-scale three-box-section segment-connected pipeline structure under multiple actions. Sci. Rep. 2023, 13, 2584. [Google Scholar] [CrossRef] [Scilit] [PubMed]
  16. Jin, L.; Zhu, J.; Zhou, W.; Liang, J.; Chen, G. 2D dynamic tunnel-soil-aboveground building interaction I: Analytical solution for incident plane SH-waves based on rigid tunnel and foundation model. Tunn. Undergr. Space Technol. 2022, 128, 104625. [Google Scholar] [CrossRef] [Scilit]
  17. Xu, C.; Ding, H.; Tong, L.; Luo, W.; Wang, N. Scattering of a plane wave by shallow buried cylindrical lining in a poroelastic half-space. Appl. Math. Model. 2019, 70, 171–189. [Google Scholar] [CrossRef] [Scilit]
  18. Tong, L.; Lai, S.; Zeng, L.; Xu, C.; Yang, J. Nonlocal scale effect on Rayleigh wave propagation in porous fluid-saturated materials. Int. J. Mech. Sci. 2018, 148, 459–466. [Google Scholar] [CrossRef] [Scilit]
  19. Dong, J.; Tu, Z.; Shang, X.; Xu, C.; Zhuang, Y.; Wu, H.; Hu, J.; Xie, S.; Li, C.; Zhang, T. Development of sustainable alkali activated red mud composite cement: Mechanical properties, hydration mechanisms, and environmental benefits. Constr. Build. Mater. 2025, 499, 144089. [Google Scholar] [CrossRef] [Scilit]
  20. Ding, H.; Huang, N.; Muhammad, C.; Xu, C.; Tong, L. Negative Poisson’s ratio locally resonant seismic metamaterials vibration isolation barrier. Acta Mech. Sin. 2024, 40, 523370. [Google Scholar] [CrossRef] [Scilit]
  21. Ding, H.; Yu, Y.; Xu, C.; Pu, X.; Guo, W.; Tong, L. Analytical modeling for nonlinear seismic metasurfaces of saturated porous media. Int. J. Mech. Sci. 2025, 303, 110666. [Google Scholar] [CrossRef] [Scilit]
  22. Ding, H.; Huang, N.; Xu, C.; Xu, Y.; Cao, Z.; Zeng, C.; Tong, L. A locally resonant metamaterial and its application in vibration isolation: Experimental and numerical investigations. Earthq. Eng. Struct. Dyn. 2024, 53, 4099–4113. [Google Scholar] [CrossRef] [Scilit]
  23. Xiang, G.; Tao, M.; Zhao, R.; Zhao, H.; Memon, M.B.; Wu, C. Dynamic response of water-rich tunnel subjected to plane P wave considering excavation induced damage zone. Undergr. Space 2024, 15, 113–130. [Google Scholar] [CrossRef] [Scilit]
  24. Luo, H.; Tao, M.; Yang, Z.; Zhao, R.; Wu, C. Transient response of semi-elliptical hill with an elliptical tunnel under blast and seismic loading. Soil Dyn. Earthq. Eng. 2024, 184, 108864. [Google Scholar] [CrossRef] [Scilit]
  25. Mei, W.; Xia, Y.; Pan, P.-Z.; Li, M.; Tan, S.; Wang, Z. Transient wave-induced dynamic responses of a circular composite-lined tunnel with imperfect interface. Waves Random Complex Media 2022, 35, 13208–13230. [Google Scholar] [CrossRef] [Scilit]
  26. Baron, M.L.; Matthews, A.T. Diffraction of a Pressure Wave by a Cylindrical Cavity in an Elastic Medium. J. Appl. Mech. 1961, 28, 347–354. [Google Scholar] [CrossRef] [Scilit]
  27. Li, X.; Li, C.; Cao, W.; Tao, M. Dynamic stress concentration and energy evolution of deep-buried tunnels under blasting loads. Int. J. Rock Mech. Min. Sci. 2018, 104, 131–146. [Google Scholar] [CrossRef] [Scilit]
  28. Tao, M.; Zhao, H.; Li, Z.; Zhu, J. Analytical and numerical study of a circular cavity subjected to plane and cylindrical P-wave scattering. Tunn. Undergr. Space Technol. 2020, 95, 103143. [Google Scholar] [CrossRef] [Scilit]
  29. Tao, M.; Xiang, G.; Zhao, R.; Wu, C. Scattering of P-wave and transient response around a fluid-filled cavity in an elastic medium. J. Cent. South Univ. 2023, 30, 568–583. [Google Scholar] [CrossRef] [Scilit]
  30. Li, C.; Li, X.; Liang, L. Dynamic response of existing tunnel under cylindrical unloading wave. Int. J. Rock Mech. Min. Sci. 2020, 131, 104342. [Google Scholar] [CrossRef] [Scilit]
  31. Yang, J.; Sun, J.; Jia, Y.; Yao, Y.; Zhang, W.; Tao, T. Composition and Characteristics of Rock Vibration Generated in Blasting Excavation of Deep Tunnels. Front. Earth Sci. 2022, 10, 903773. [Google Scholar] [CrossRef] [Scilit]
  32. Luo, H.; Tao, M.; Hong, Z.; Xiang, G.; Wu, C. Analysis of the dynamic response and damage characteristic for the tunnel under near-field blasts and far-field earthquakes. Undergr. Space 2025, 21, 331–351. [Google Scholar] [CrossRef] [Scilit]
  33. Xia, Y.; Han, G.; Mei, W.; Pan, P.-Z.; Li, M.; Yan, M.; Yan, Y. Dynamic Responses of a Shallow Lined Tunnel with Imperfect Interface Under Transient P Wave. Int. J. Struct. Stab. Dyn. 2024, 24, 2450187. [Google Scholar] [CrossRef] [Scilit]
Figure 1. Model construction and propagation diagram of blast-induced seismic waves.
Applsci 16 01482 g001
Figure 2. Flowchart of the calculation process.
Applsci 16 01482 g002
Figure 3. Comparison of Degenerate Solutions with Refs. [6,27].
Applsci 16 01482 g003
Figure 4. Relative position of tunnels in Hongshan South Road [8].
Applsci 16 01482 g004
Figure 5. Time-history curves of transient DSCF, RVSF and HVSF.
Applsci 16 01482 g005
Figure 6. Variation of peak transient DSCF, RVSF, and HVSF versus tr.
Applsci 16 01482 g006
Figure 7. Circumferential distribution of transient response in surrounding rock and secondary lining.
Applsci 16 01482 g007
Figure 8. Influence of elastic modulus on the peak values of dynamic and vibrational response.
Applsci 16 01482 g008aApplsci 16 01482 g008b
Figure 9. Influence of (r1r2/r2r3) on the peak values of dynamic and vibrational response.
Applsci 16 01482 g009
Table 1. Medium parameters for each structural layer [8].
MediumElastic Modulus
E/GPa
Density
ρ/(kg/m3)
Poisson’s Ratio vLining Thickness d/m
Rock5026000.26
Initial Support2525000.250.15
Secondary Lining3225000.260.45
Disclaimer/Publisher’s Note: The statements, opinions and data contained in all publications are solely those of the individual author(s) and contributor(s) and not of MDPI and/or the editor(s). MDPI and/or the editor(s) disclaim responsibility for any injury to people or property resulting from any ideas, methods, instructions or products referred to in the content.