1. Introduction
Animal reproductive management is a core element of dairy herd management, with a pivotal aspect being the accurate and timely detection of oestrus, particularly in the context of artificial insemination implementation. The effectiveness of oestrus detection directly impacts insemination outcomes, overall pregnancy rates, and the intervals between calf births and conception. These variables ultimately determine milk production levels and, consequently, the economic success of the farm [
1].
In the context of cattle breeding, oestrus detection still largely relies on direct observation by farmers, necessitating significant time and manpower and leading to increased production costs. As a result, the frequency of accurate observations for oestrus detection is often insufficient to achieve high oestrus detection rates. To address these challenges, automated oestrus detection systems have been developed and proposed for over 30 years. These technologies have the potential to decrease the calving-to-conception interval, prolong the productive years per cow, diminish culling rates attributed to poor fertility, and ultimately enhance lifetime milk production per cow [
2].
The oestrus event alters various biological parameters, such as skin temperature, milk conductivity, and motor activity [
3,
4,
5]. Technologies that continuously track and evaluate in-depth behavioral data contribute to better reproductive management by increasing the accuracy of oestrus detection and present a viable remedy by enhancing the precision and punctuality of insemination. The detection of primary and secondary indications of oestrus is frequently the foundation of these technologies. Among these indications, activity is the most significant [
6]. On the day of oestrus, activity can increase up to six times over the preceding day [
7].
These automated technologies, which are intended to detect the increase in physical activity that indicates the onset of oestrus, include pedometers and collars. These electronic devices function thanks to accelerometers (cheap and easily integrated with different devices belonging to the so-called Information and Communications Technology—ICT) and allow for a more objective and continuous assessment of the activity of the cow on which they are installed, compared to what workers could achieve. Consequently, they allow for a reduction in workload, and potentially, the farmer can devote time to other responsibilities, such as decisions regarding milk yield, reproduction, animal health and welfare, and environmental impact [
8,
9,
10,
11]. To ensure that the initial cost of adopting these systems is justified, it is crucial that they are able to detect the highest possible number of actual oestrus events, a measure known as sensitivity, and that the oestrus events indicated are accurate, meaning there is a low number of false positives. The algorithms that control their functioning need to be considerably enhanced in order to do this and give reliable and precise data to support reproductive management. Furthermore, the transmitters are often placed at precise spots in the barn where data collecting happens as the animals pass by. This may lead to a delay in gathering data and could interfere with the timing of insemination, which is essential to the success of reproduction.
The growing spread of the Internet of Things (IoT) technologies offers benefits for livestock management [
12]. However, their operation is strongly influenced by Internet connection, which has to be reliable, and this requirement is often missing in rural regions where agricultural activities are mostly concentrated.
Current Precision Livestock Farming (PLF) research is often directed towards developing reliable behavioral models, obtained by processing data acquired by triaxial accelerometers installed inside mobile devices worn by cows [
13]. Data transmission is often entrusted to wireless communication systems, including Wi-Fi, 3G/4G, Bluetooth, and ZigBee. Nevertheless, such systems are effective tools for accessing the Internet only in small and confined spaces and are not suitable for large modern farms. In contrast, technologies that use long-range networks could provide low-power connectivity over large areas due to their wide coverage. This feature justifies their use for monitoring grazing herds [
14].
This study is part of an important research project entitled Cowtech, financed with European fundings and focused on the development of a prototype of an automatic system for monitoring cow behavior, based on a wireless network infrastructure and wearable sensors to improve welfare and productive and reproductive performance [
15,
16,
17]. The first technological innovation of this project is given by the use of wireless communication network infrastructures of the Low-Power Wide-Area Network (LPWAN) type to enable long-range communications with low energy consumption. Several benefits derive from this innovation: first of all, it is not required to be installed in the barn (as PC or wired communication or power supply network); furthermore, it allows the use of cloud services for the management and storage of data collected in the barn; finally, it made it possible to develop a WebApp, specifically designed for farmer use with a user-friendly front-end. The only weakness is represented by the low bit rate. Another important technological innovation is the adoption of smart devices (pedometers and collars) with upgradeable firmware, capable of processing raw data and sending results through the LPWAN.
In a preliminary study of the Cowtech project [
9], a moving-mean-based algorithm for dairy cows’ oestrus detection was proposed. In the same project, an eco-sustainable non-invasive pedometer prototype was also designed for housing the firmware for running the aforementioned algorithm [
18,
19]. This was a stand-alone smart pedometer (SASP), equipped with the following electronic components: a triaxial accelerometer, a rechargeable power supply unit, a microcontroller, and a communication module suitable for LPWAN applications. However, the SASP module cannot be considered a self-updating oestrus detector, as it is unable to update the algorithm oestrus indicators. This represents a partial limitation for extended field use. To address this shortcoming, the SASP is equipped with upgradable firmware that allows for remote updating of oestrus indicators, making the module scalable and adaptable.
A detailed comparison with the most recent technologies for cows’ oestrus detection, available in the scientific literature, is proposed in the Discussion section, highlighting the strengths and weaknesses of the system designed in this study.
The objectives of this manuscript were to refine the moving-mean-based algorithm for dairy cow’s oestrus detection proposed in a previous study [
9], to implement the refined algorithm in a software tool, to develop a customized WebApp for farmers, and to test and validate this system on a Sicilian dairy farm.
2. Materials and Methods
2.1. Animals, Housing and Management
This research was performed on a dairy farm located in Acate, Sicily, with approximately 50 lactating Holstein cows housed in a free-stall barn with cubicles. The barn was equipped with a cooling system for the summer period, including ventilation and large droplet sprinklers. The floor of the barn was continuous, not perforated, facilitating the exhibition of the typical signs of oestrus. Cleaning occurred every 24 h with the assistance of a tractor.
Throughout this research, the average days in milk (DIM) of the herd ranged between 80 and 165, with an average parity of 2. Cows were milked twice a day and had an average production of about 38 ± 9 L/d. In the morning, after milking, the animals were fed a total mixed ration (TMR) which was balanced according to their requirements.
The farm employed management software for monitoring purposes and utilized pedometers for data collection on cow activity. Cows were inseminated after their first heat detection by pedometers following a 50-day voluntary waiting period. The number of inseminations per successful conception ranged from 1.8 to 2.2. Days between calving and first insemination ranged from 67 to 103. This, along with multiple silent oestrus events, resulted in a calving-to-conception interval ranging from 95 to 107 days, with an average of 101 days, and an average inter-calving interval of 384 days. The conception rate was 43.14%.
2.2. Telecommunication Networks
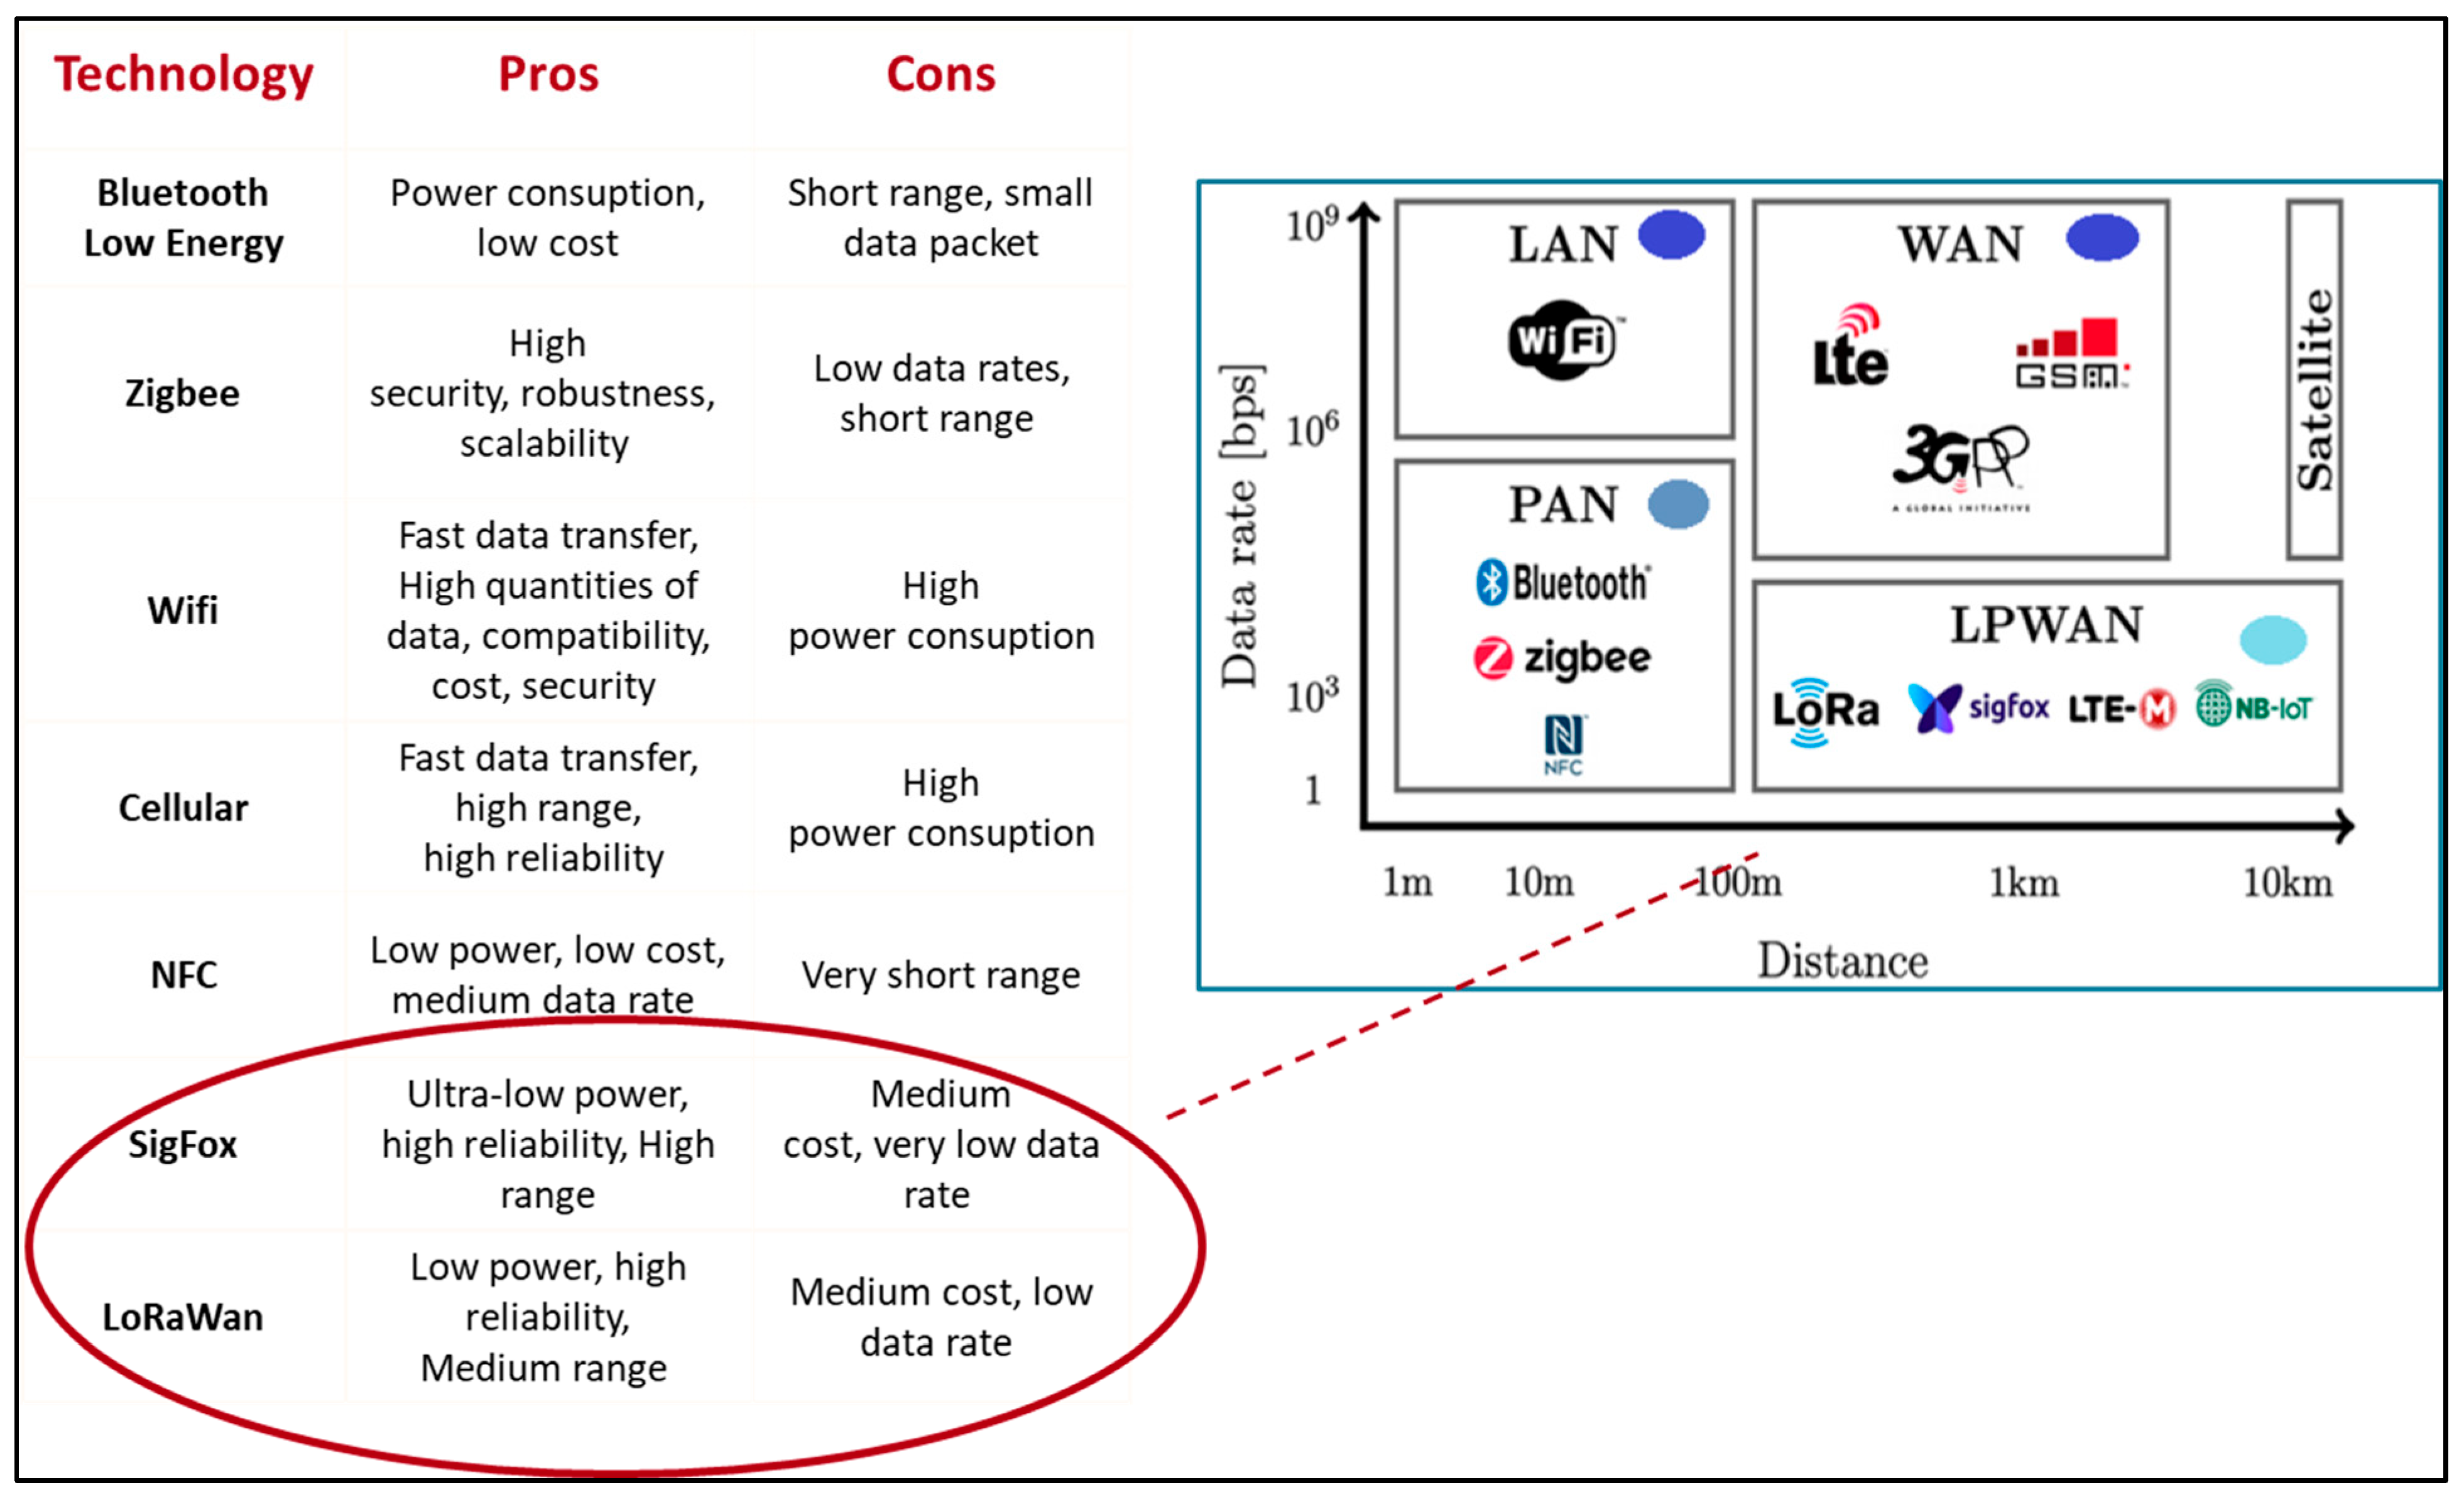
A typical problem of the common GSM networks is the inefficient coverage, particularly in rural areas that often represent the areas of interest for applications of the type under consideration. In the specific case of mobile devices for livestock, a telecommunications network associated with high power consumption is not required as it may result in reduced battery life. To overcome these problems, two different Low-Power Wide-Area Networks (LPWANs) have been adopted: Sigfox and LoRa. These LPWANs are widespread in specific IoT applications for PLF, due to the real-time and low-power monitoring of cows in livestock. Their strengths are their long working range (from 100 m to 10 km), low energy consumption, and low bit rate (
Figure 1).
The right combination between a low sampling rate and the LPWANs could provide a longer battery life compared to other systems investigated in the literature, without incurring unwanted data loss [
20]. The battery life and the feasibility of a Sigfox-based tracking system in extensive farms were investigated [
9,
14]: the mean value found for the battery life was of nearly 4 months by using a 10 min time interval for data collection, operating within areas with poor telecommunications network coverage, where it was necessary to install a repeater.
Concerning the position detection, the most recent LPWAN, LoRaII, offers the benefit of deriving the position of the target by triangulating the arrival time of the packets through highly synchronized base stations, with an accuracy of 10–30 m that seems to be acceptable for virtual fencing applications and other similar applications.
In this paper, the innovative pedometer prototype could send information and row data acquired in a server cloud by using one of the telecommunication networks (LoRa, LoRaWAN and Sigfox) in order to process and visualize them through a specifically developed WebApp.
2.3. Stand-Alone Smart Pedometer and Algorithm for Oestrus Detection
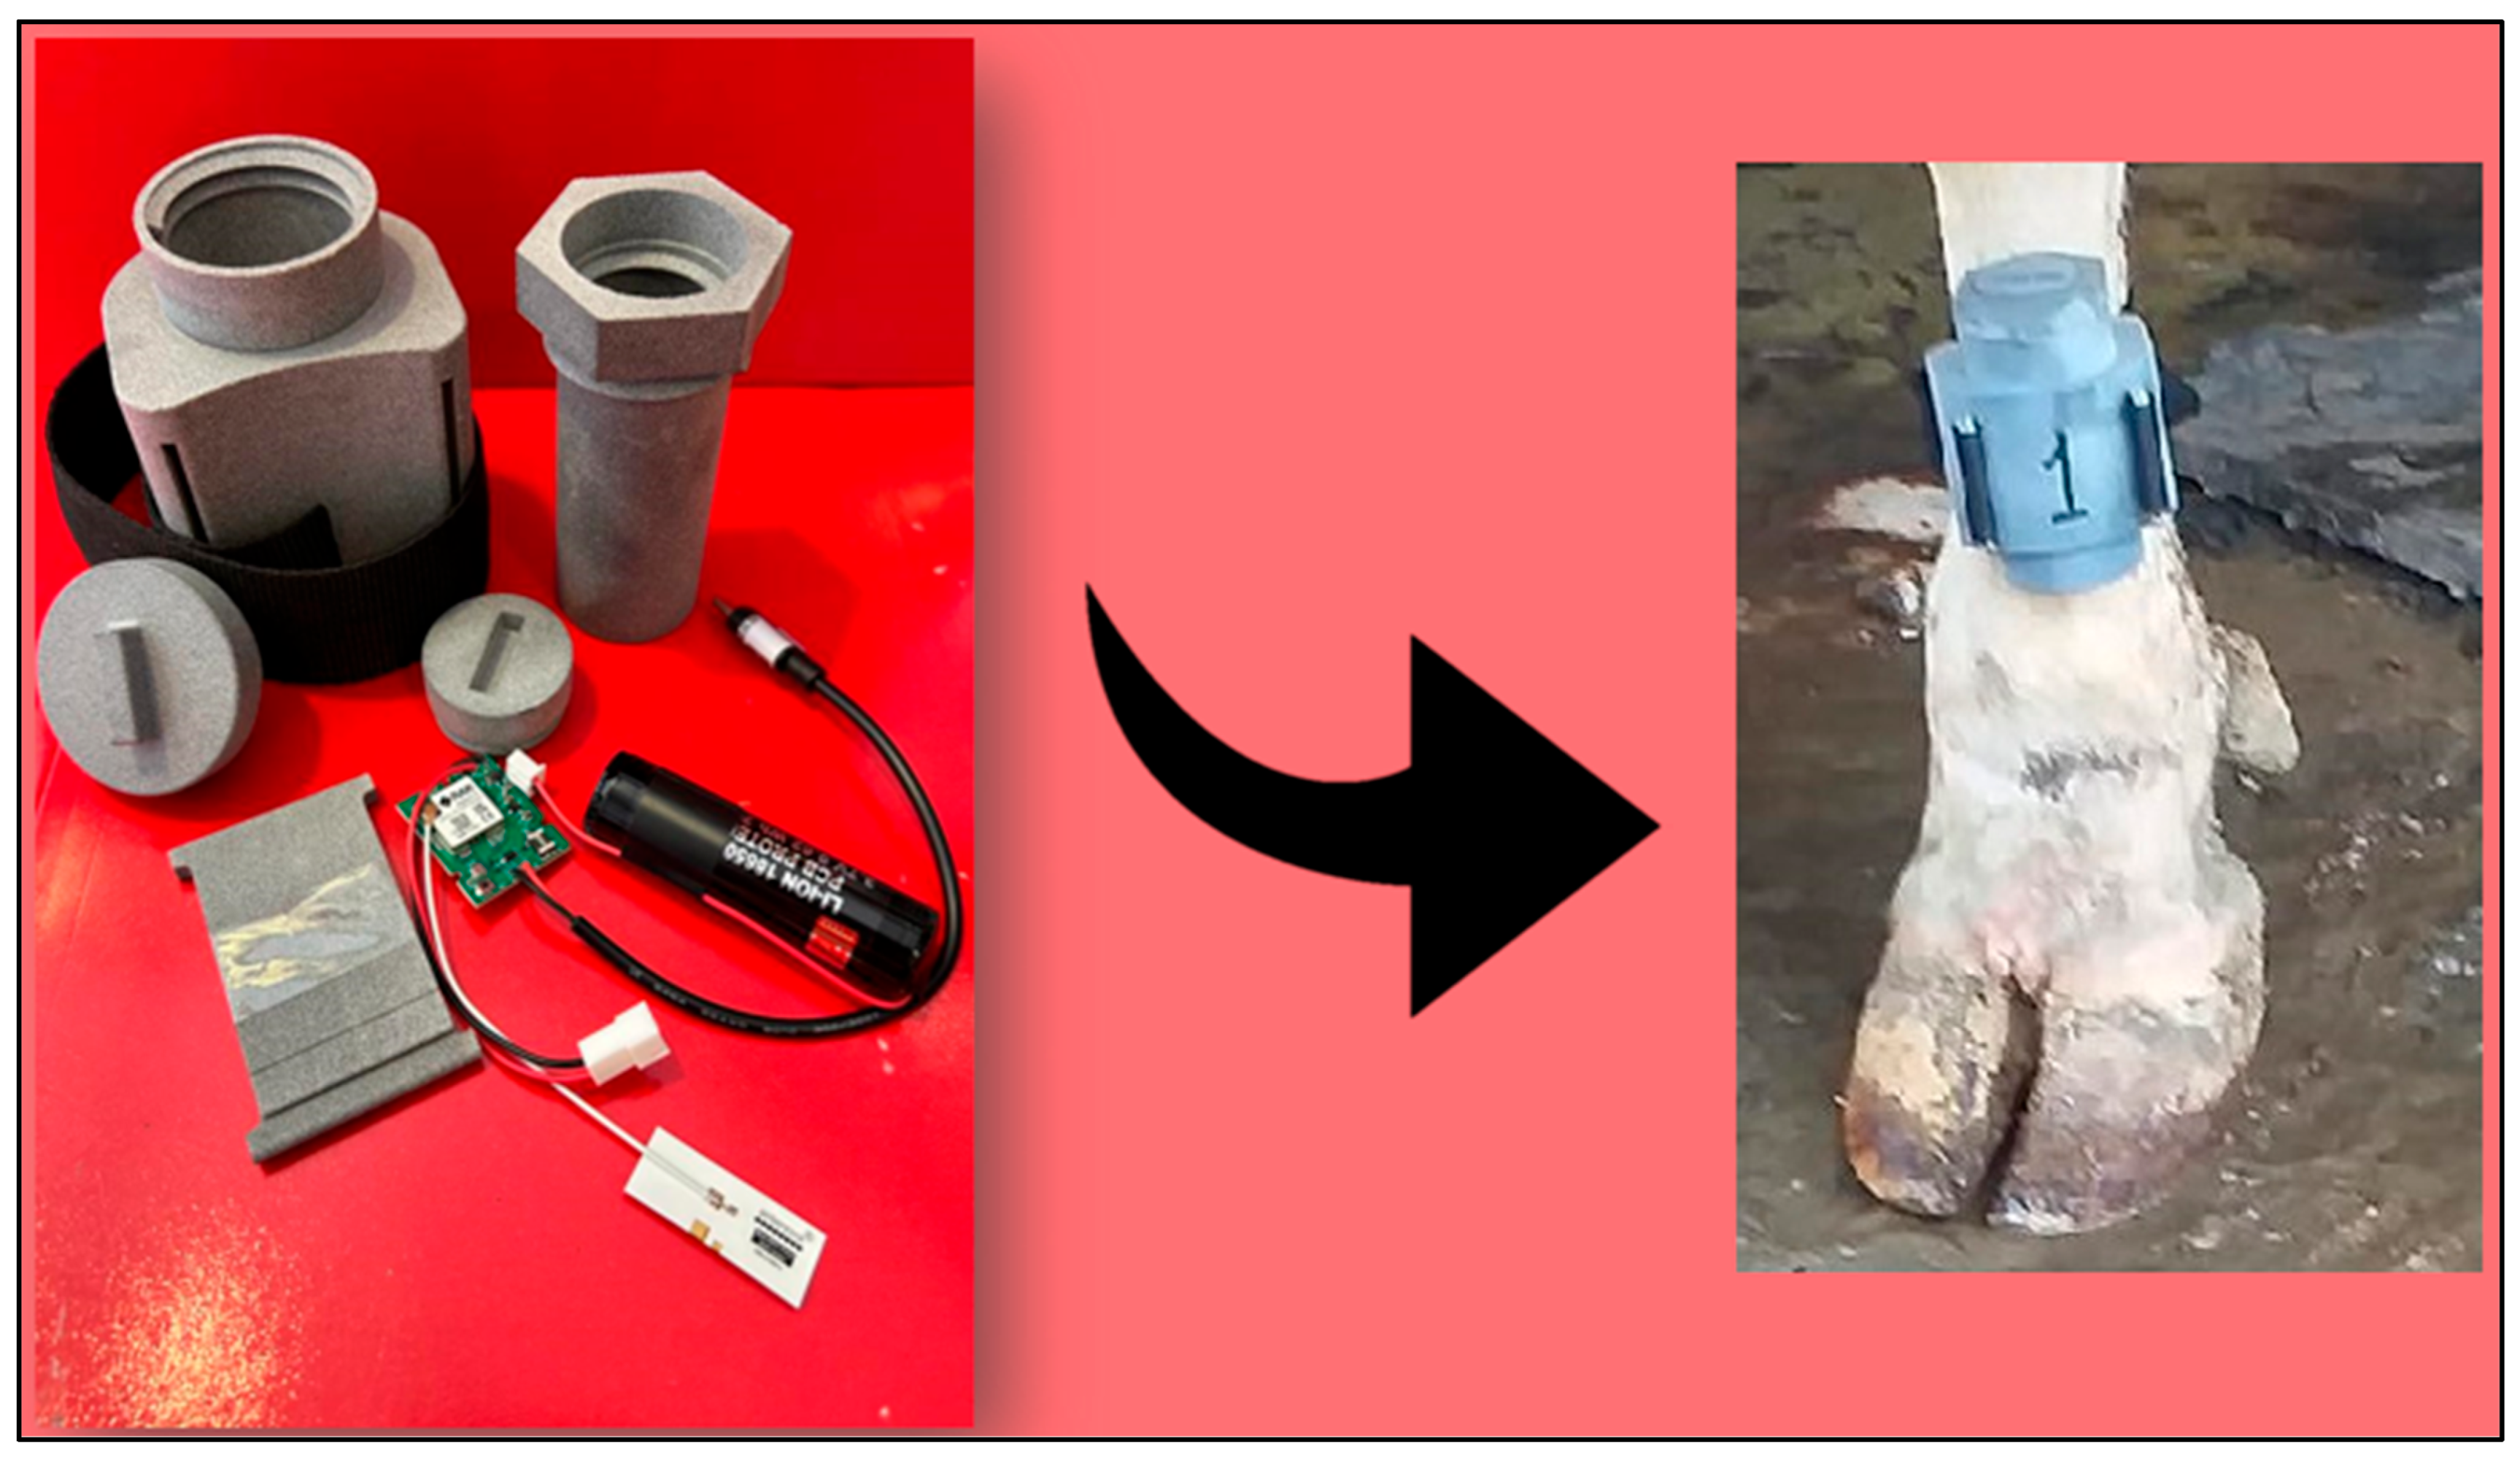
The SASP designed in this study is a customized electronic device suitable for LPWAN applications. The electronic device was housed into a customized case attached to the cow foreleg (
Figure 2). In detail, the SASP was provided with a double-casing geometry: an external casing with a protective function, profiled respecting the anatomical comfort of the cow; and an internal casing that houses sensors, electronic components, and a power-supply unit, specifically designed to be removable and interchangeable, allowing it to be transferred to another cow once the oestrus event is over. The printing material chosen for the SASP packaging was SDS Nylon because it is bio-friendly, recyclable, and highly resistant to chemical and mechanical agents [
18,
19].
The SASP function consists of monitoring the cow’s motor activity in order to detect the oestrus event. In this case, it is composed of the following components: a triaxial accelerometer, a rechargeable power supply unit, a LPWAN communication module, and a microcontroller which calculates the moving-means by using Equation (1) and computing the variables reported in
Table 1. The acceleration data from the three axes are acquired at a frequency of 4 Hz.
Upgradable firmware allows us to run the new algorithm based on pre-fixed acceleration thresholds, achieving a double benefit: plug-and-play installation and on-board computing.
Since a day counts 96 intervals of 10 min each, the moving mean over 24 h (
mov_
meanh) is computed by using Equation (1):
Every 15 min, the moving averages are sent to the cloud server.
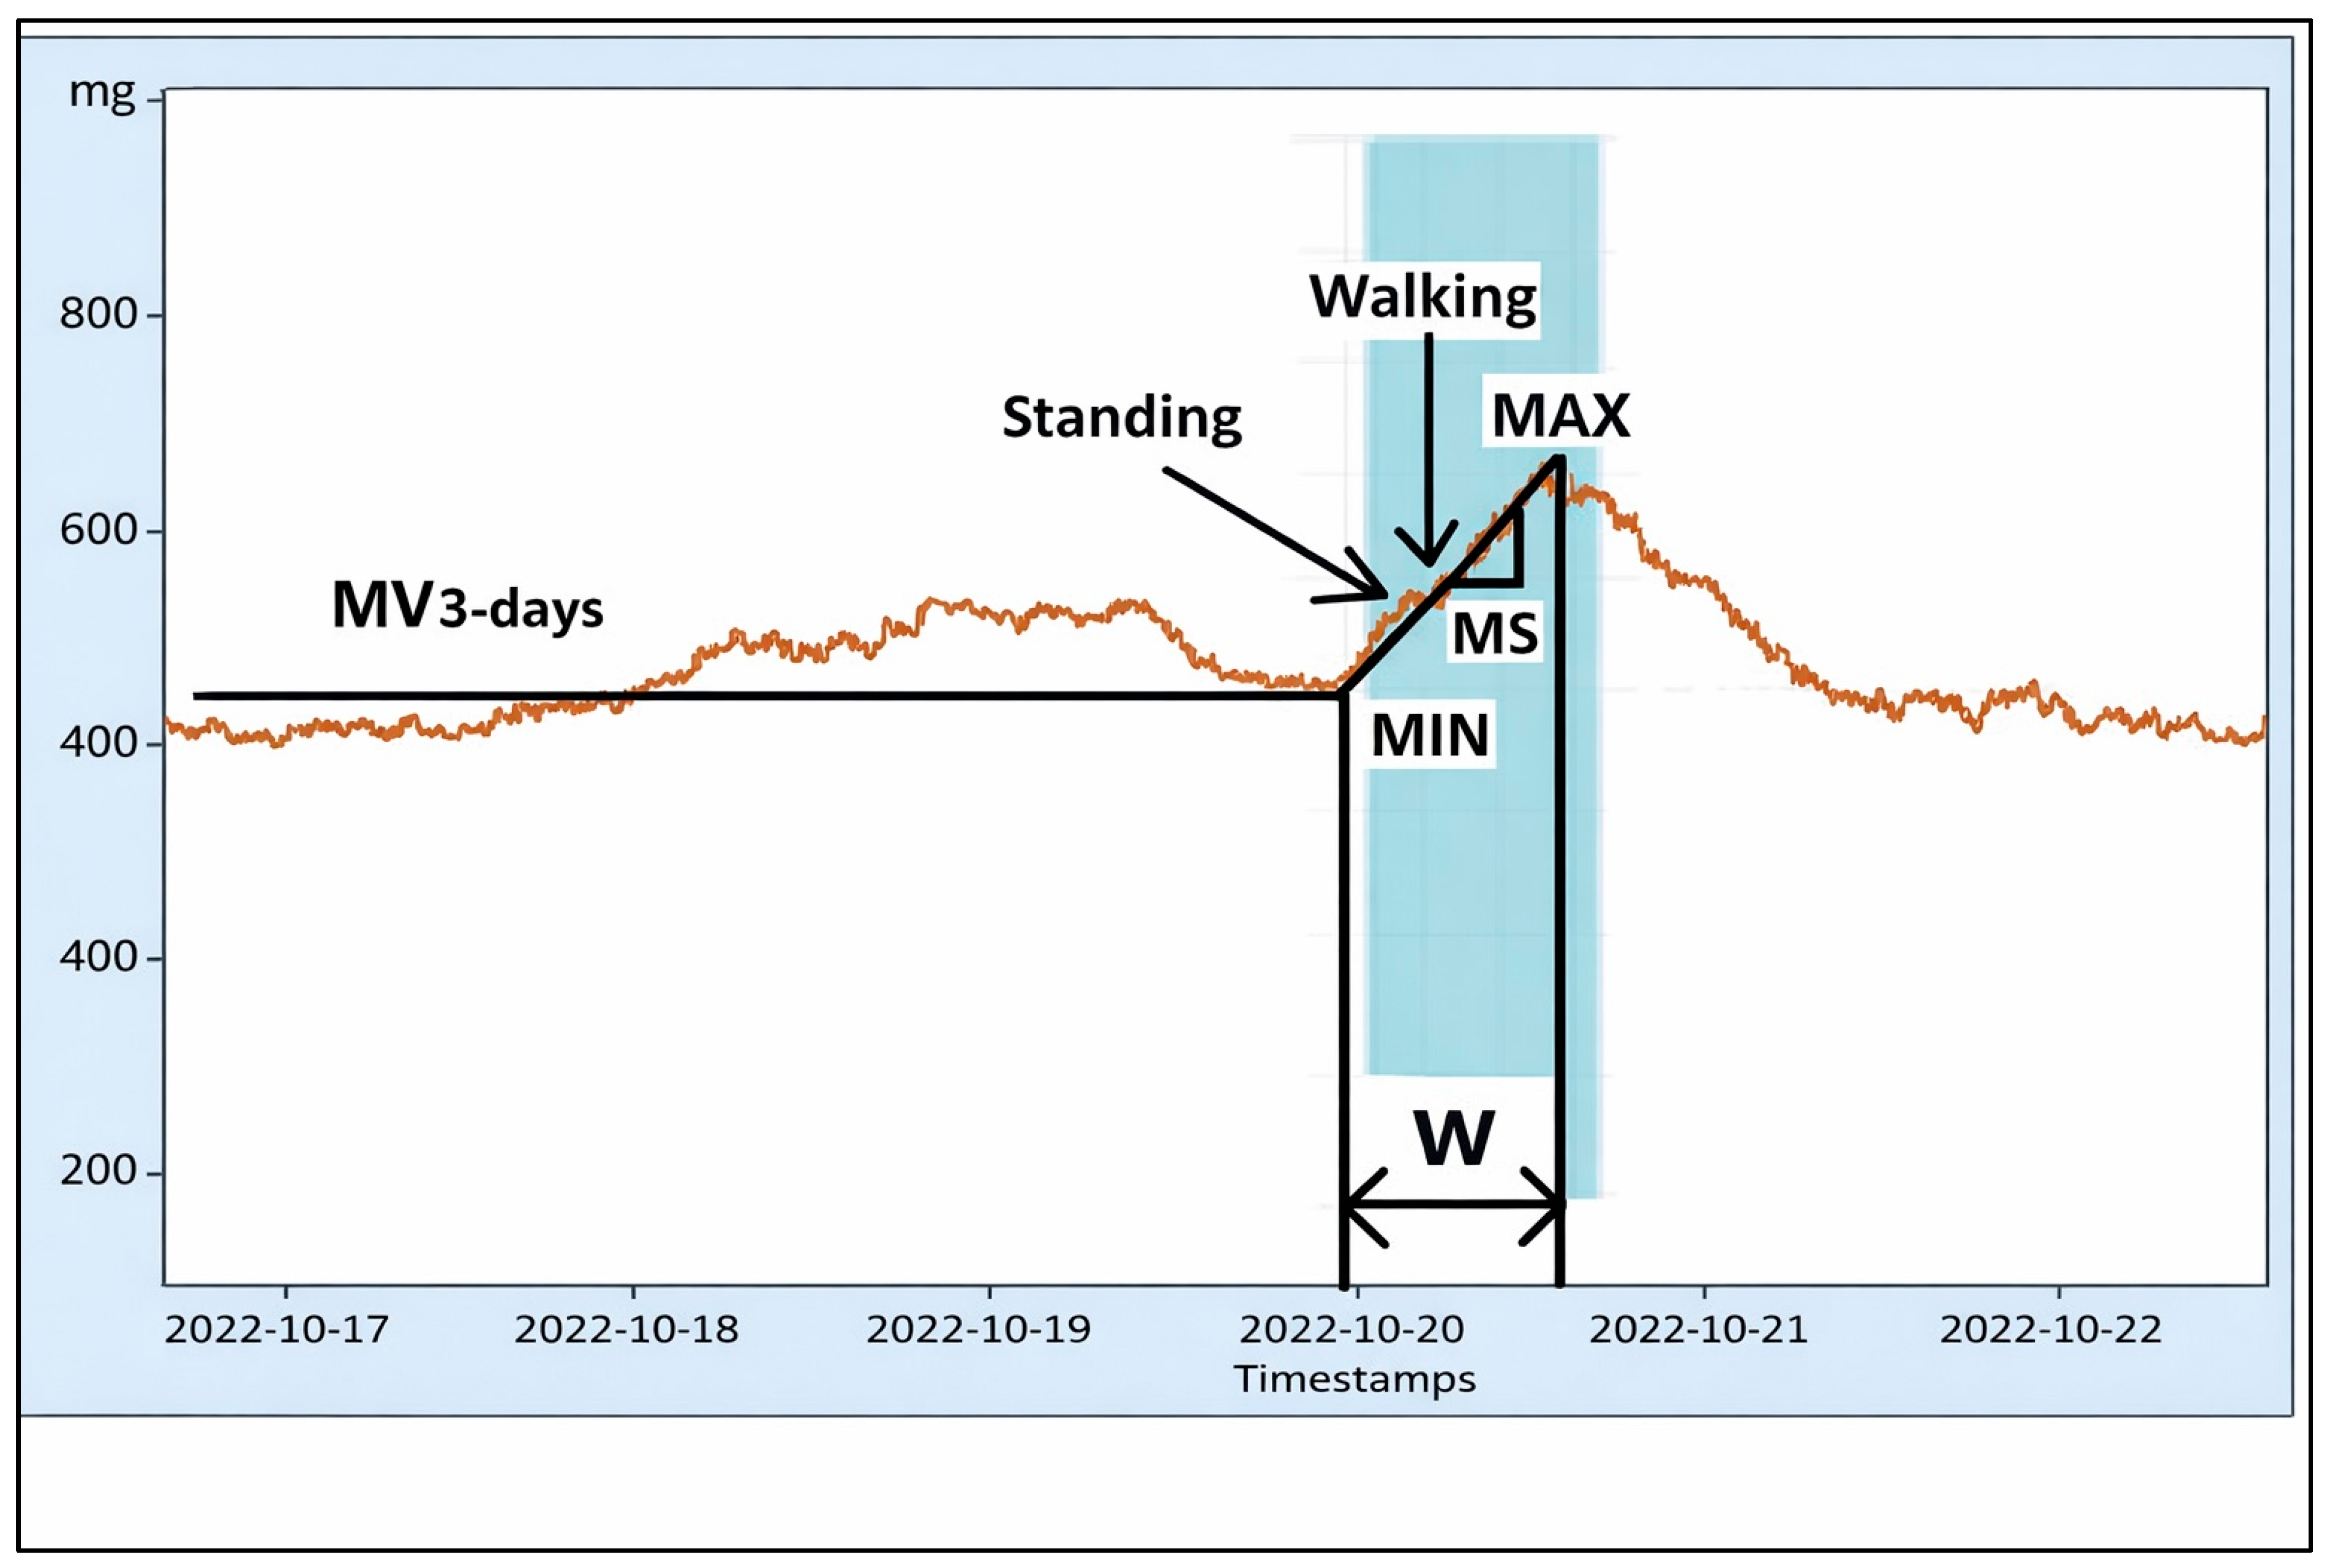
The algorithm gives rise to the analysis of the accelerometric curve averaged over 24 h [
9,
15]. In fact, it is evident that, as the oestrous event approaches, behavior associated with the cow “Standing”, which corresponds to a constant increase in the accelerometer values in the curve, is followed by behavior associated with the cow “Walking”, which forms a plateau in the accelerometric curve. Specifically, the standing stage corresponds to the cow’s willingness to be mounted, waiting for insemination. However, since no mounting occurred, the cow increases its movement activity in search of the bull, giving rise to the walking stage. So, a continuous alternation of behaviors associated with “Standing” and “Walking” is observed until the oestrus occurs, corresponding to the peak in the accelerometer curve. Once oestrus event is over, the acceleration values tend to quickly decrease, highlighting the animal resting in a lying position. Furthermore, the following parameters are easily identifiable in the curve (
Figure 3): the mean value of the acceleration in the three days preceding the oestrous event (MV3-days), the values of the local minimum (MIN) and maximum (MAX) during oestrus, and the mean value of the slope of the curve corresponding to each “Standing” activity. Therefore, it was considered appropriate to design an algorithm based on three indicators within the accelerometric curve:
Width of the oestrous window (W) coinciding with the duration of oestrus (expressed in hours);
Mean value of the oestrous slope (MS), expressed in mg/h;
Increase in the peak compared to the local minimum (I%), expressed in percentage according to Equation (2).
For each indicator, the error range is calculated following Equation (3):
where
and
σi are the mean value and the standard deviation of the
i-th indicator, respectively.
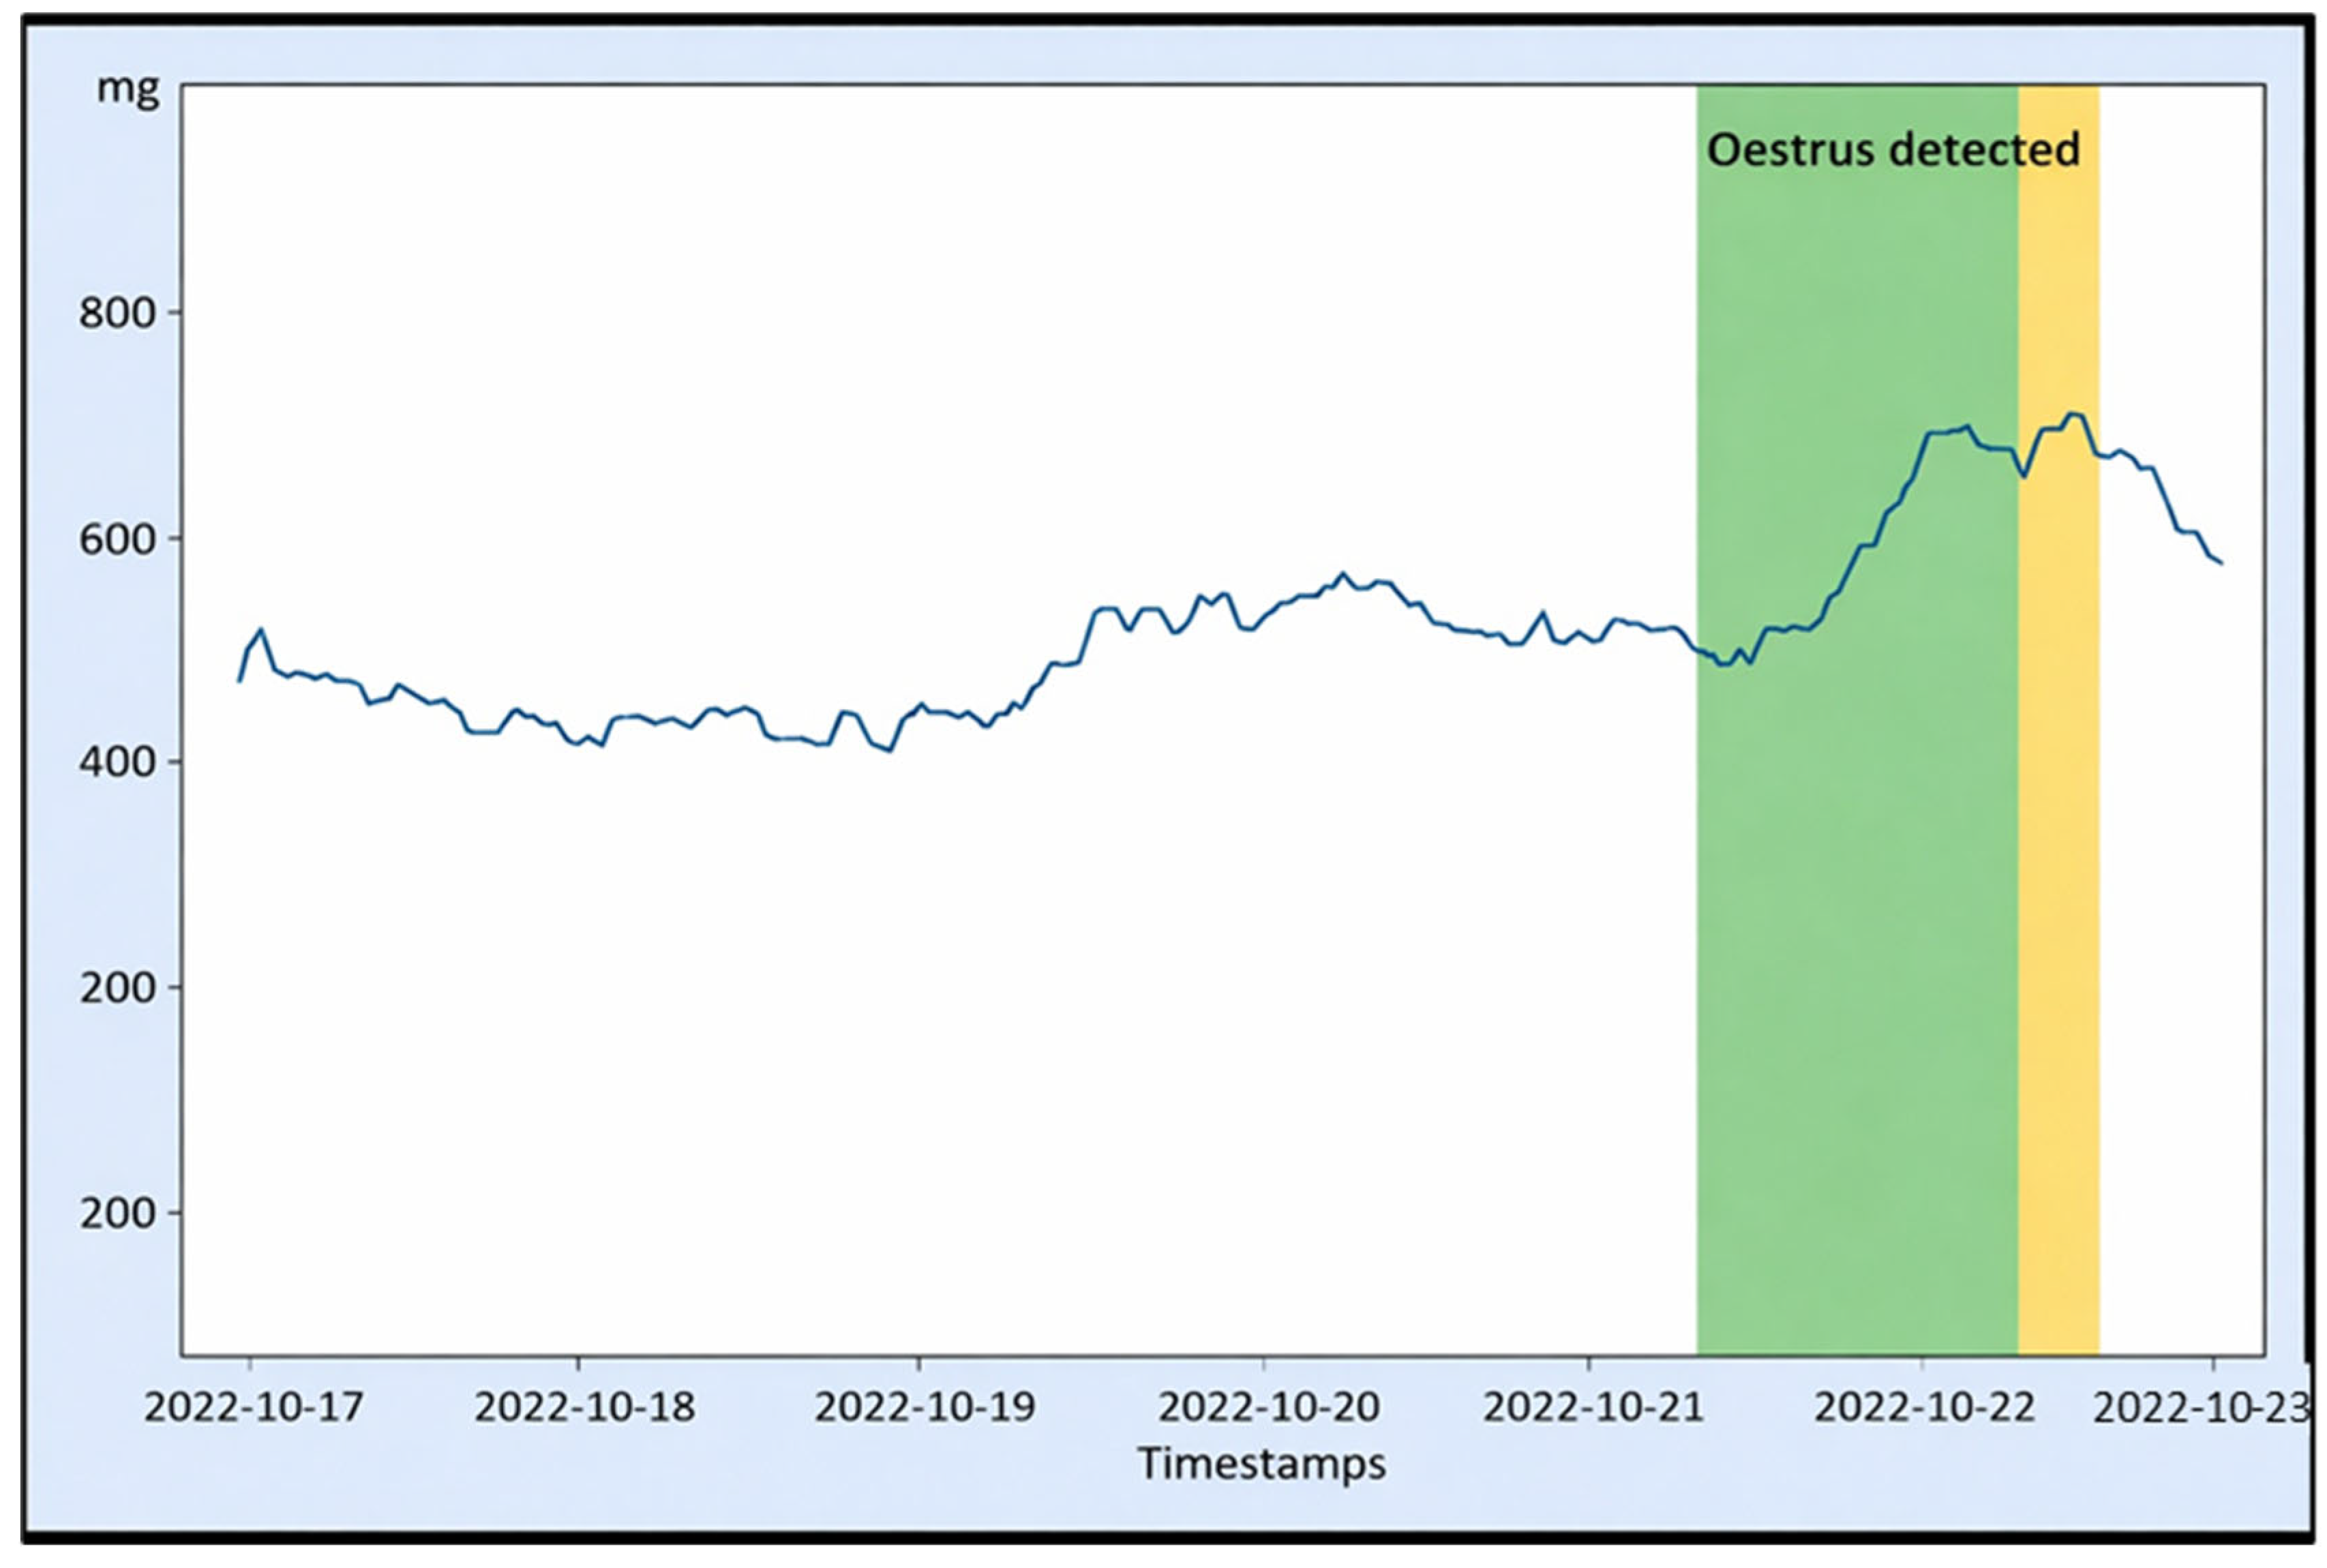
The algorithm decision tree generates the “Oestrous detected” alert (
Figure 4) whenever the values of at least two of the three indicators fall within their error ranges. If only one indicator falls within the error range, the procedure is repeated by increasing the error range by 50%; therefore, if the values of at least two of the three indicators fall within their corresponding extended error ranges, the algorithm generates the “Probable oestrous” alert. In all remaining cases, no oestrus is reported. The algorithm analyzes and updates the calculation of oestrus indicators until the conditions for a new oestrus event are met.
Data coming from the SASPs were used to develop a model based on a moving window whose duration is equal to the pre-oestrus time interval, technically called proestrus (in event of oestrus this window returns the value of the parameter MV
3-days). The adoption of a proestrus time span of 3 days is in accordance with what was found in the scientific literature [
21], and considering deviations from the average trend in the curve occurring within that interval time frees the analysis from changes in behavior that are seasonal and not related to any estrous event.
2.4. Tests and Validation
The testing period ranged from July 2021 to October 2023 and consisted of three test campaigns: the first from July to October 2021, the second from September to December 2022, and the last from April to October 2023. The temporal distribution of the tests was determined in order to also take into account any seasonal changes in behavior not specifically related to oestrus.
The experimental pedometers devices were fitted to the cows, without preference for limb, as this does not affect the measurements [
22]. Due to limited availability of internal casings of pedometers, seven cows could be monitored simultaneously. Moreover, the cows concurrently wore commercial pedometers on another limb as per the farmer’s setup. Cows exhibiting lameness, which could result in decreased walking and therefore failure to register an activity peak during oestrus, as well as cases of suspected abomasal displacement and other health issues diagnosed by the veterinarian, were excluded from the study. They wore the pedometers starting anytime between the day after calving, defined as day 1, and the 30th day of milking, allowing the activity peak detection algorithms to reference a robust dataset. The devices remained on the cows until pregnancy confirmation by the veterinarian through ultrasonography at 35 days post-insemination. All oestrous events detected by the algorithm were validated both by the breeder, through the visual and direct identification of all typical signs of the oestrous phase (e.g., frequent mooing, mounting reflex, and presence of mucous secretion), and by the veterinarian, through progesterone analysis.
Progesterone analysis was the gold standard for detecting oestrus and analyzing bovine cyclicity because of its high sensitivity [
23,
24,
25]. In our study, research was performed on milk, which was chosen because it mirrors blood levels [
26] and does not harm the cows. Milk samples were gathered on Mondays, Wednesdays, and Fridays every week, beginning on the 40th day after giving birth. Any alerts from the pedometer that happened prior to 40 days were ignored. The sampling procedure used whole-milking samplers to avoid disruption from the high levels of progesterone in cisternal milk, which is produced early on. Evening milking was chosen because the progesterone concentration at this time best represents that of the entire day [
27]. However, for our study and oestrus identification purposes, the interception of the progesterone nadir was relevant, and this is independent of the chosen sampling time. The samples were kept at a consistent temperature of 4 °C and tested at CoRFiLaC milk lab (Ragusa, Italy) within 72 h. Progesterone testing was performed twice using an ELISA kit from Ridgeway Science
® (Gloucestershire, UK). If the duplicates’ standard deviation compared to their mean exceeded 15%, the analyses were repeated. A total of 886 milk samples were analyzed.
2.5. Algorithm Performance
Algorithm performance was evaluated by comparing detected oestrus events with those confirmed by visual observation and milk progesterone analysis, which was considered the reference method. Performance metrics were calculated as follows:
Sensitivity (
SE) was defined as the proportion of confirmed oestrus events correctly identified by the system:
Positive Predictive Value (
PPV) was defined as the proportion of detected oestrus events that were confirmed as true oestrus events:
Given the limited number of validated oestrus events, no inferential statistical tests were applied. Results are therefore presented as descriptive statistics, and conclusions are interpreted with caution regarding statistical robustness and generalizability.
2.6. Customized WebApp for Farmer Use
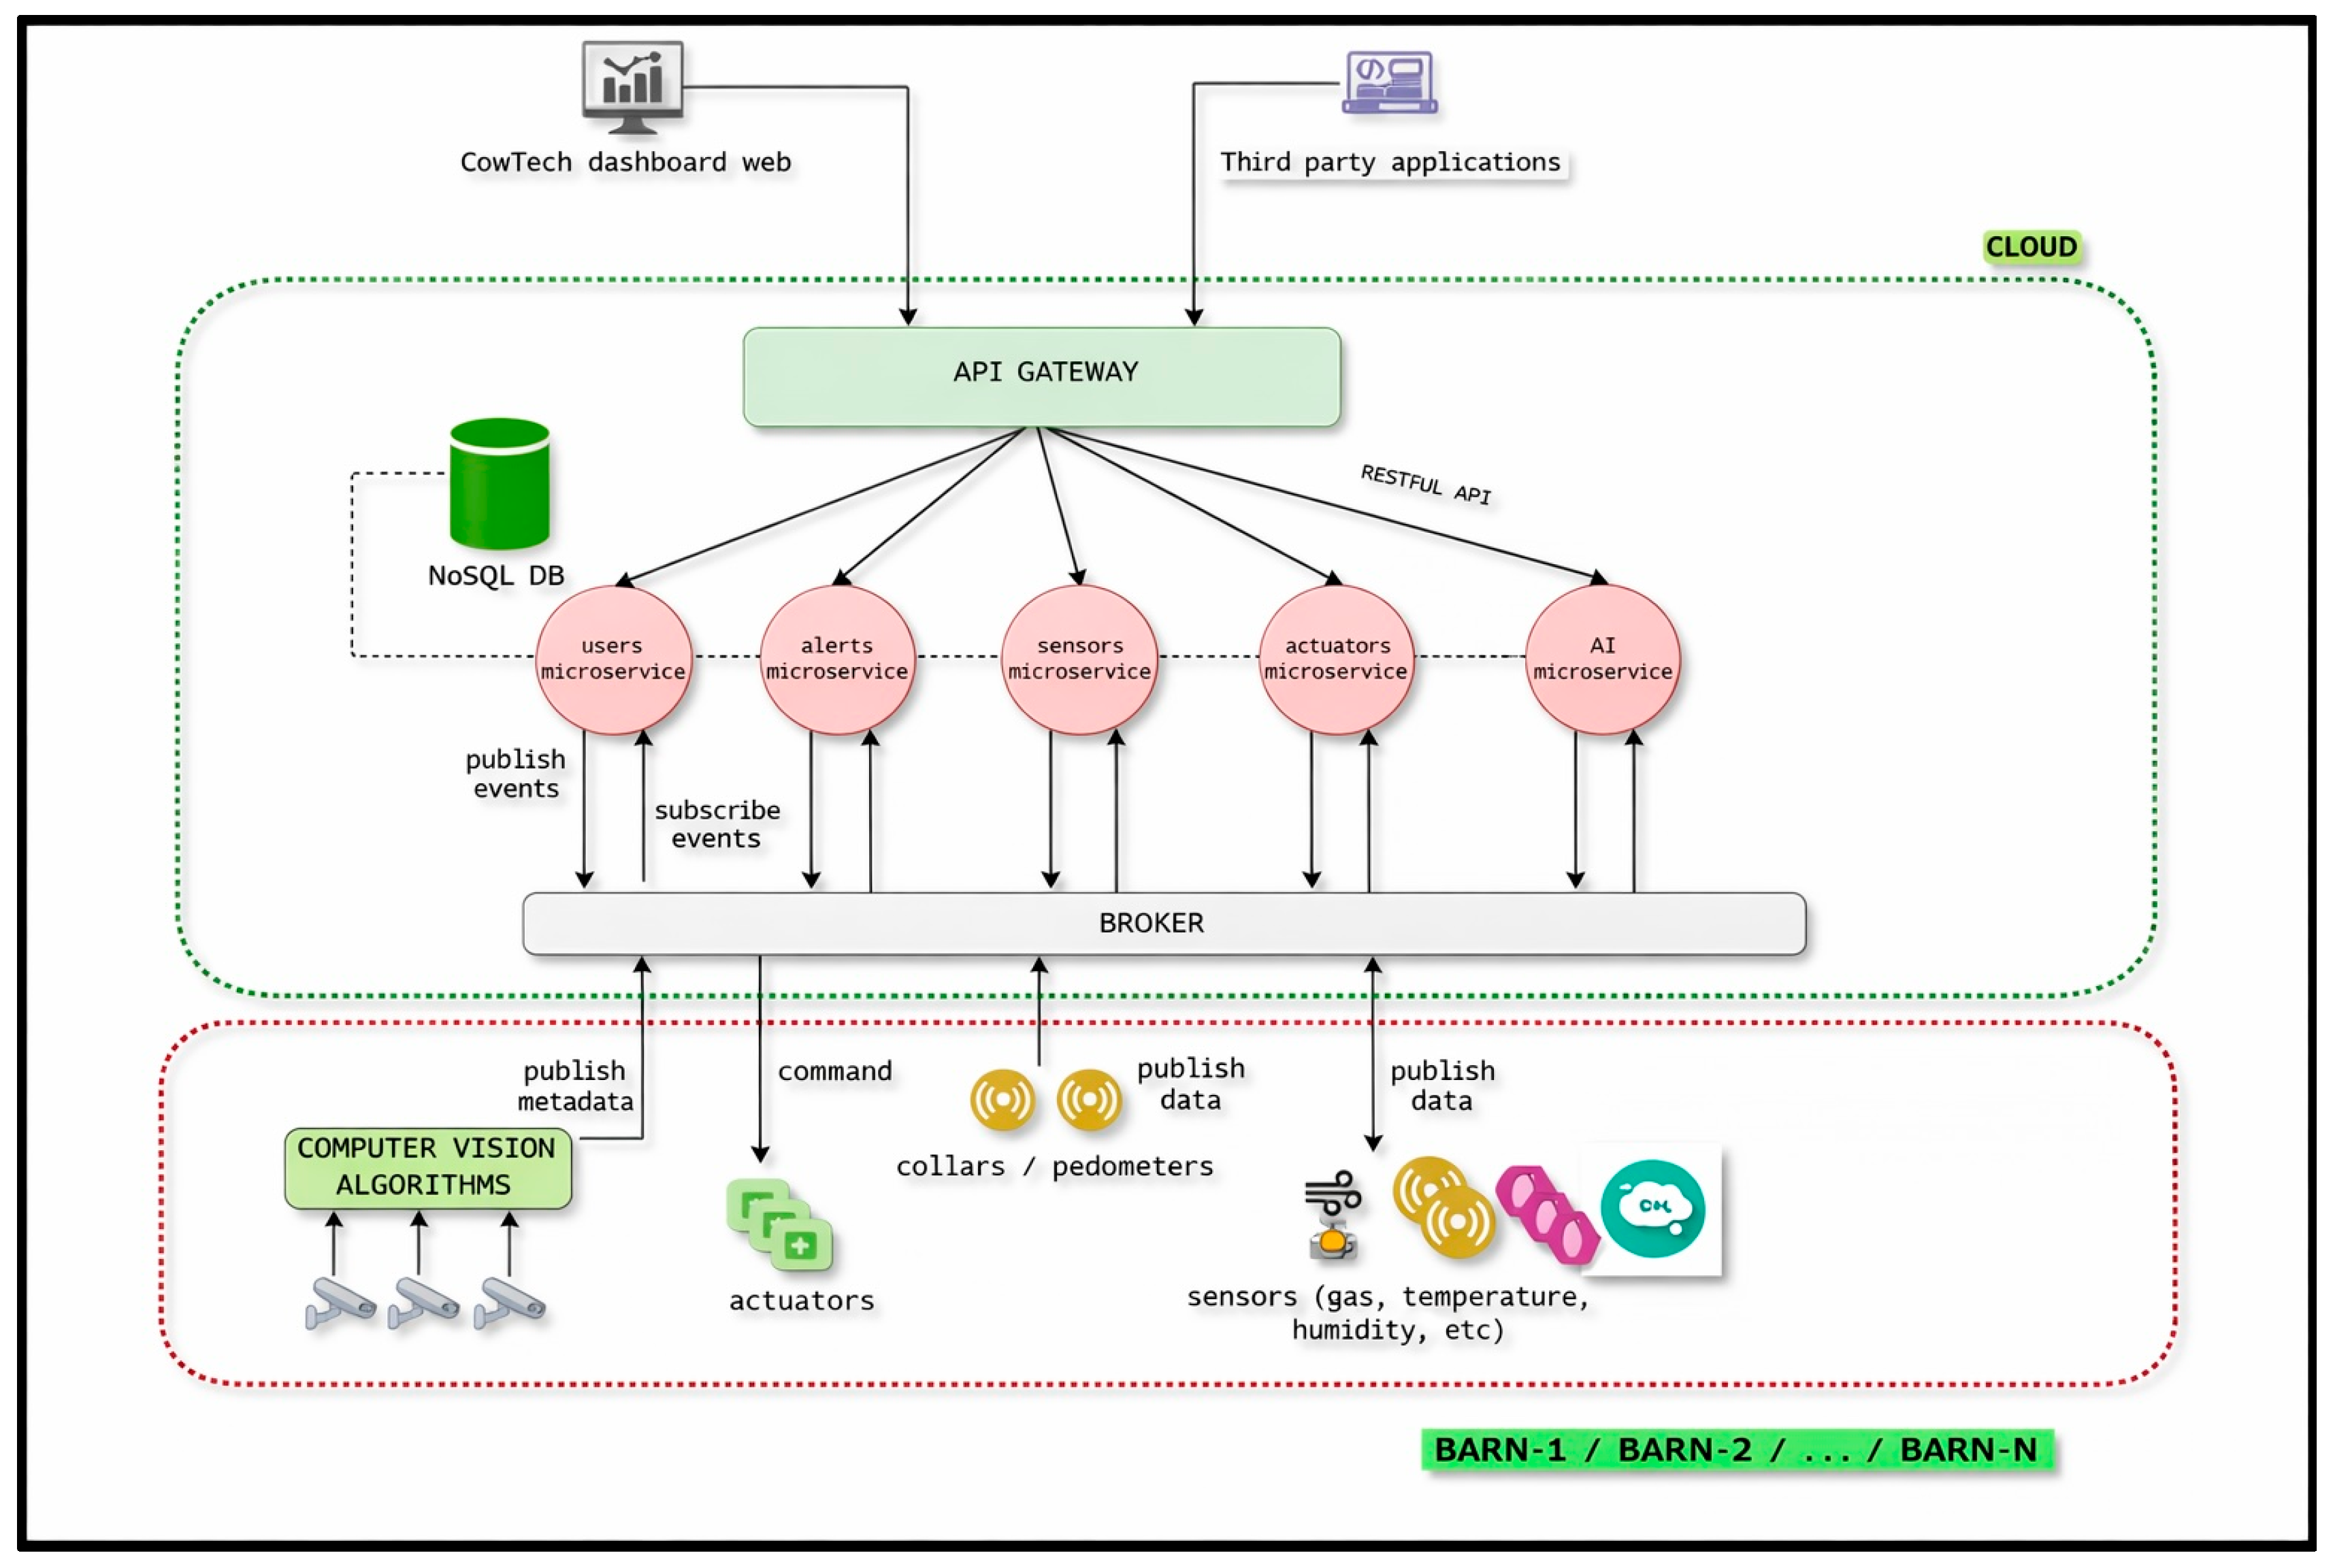
Within the Cowtech Project, a software platform composed of a back-end part and a front-end part was designed and developed (
Figure 5). The back-end is a set of microservices that interface with the pedometer sensors, apply data aggregation algorithms, evaluate any alert conditions, and send notifications. The front-end consists of the web dashboard, whose main tasks are the following:
Platform configuration (cows, pedometer sensors, alerts and notifications);
Sensor data reports from the pedometers and data aggregations on a temporal basis.
The clients access the platform functionalities, implemented by the individual microservices, through the API Gateway module, which is the RESTFul access point to the system.
The microservices cooperate with each other using the publish/subscribe protocol. The same protocol is adopted by the devices used and, therefore, the pedometers publish the acquired data. The metadata generated by the oestrous events of the cows are finally published in the cloud, where specific microservices are set up for their analysis and processing and for the execution of appropriate operations (further analysis, archiving on DB, generation of alerts/notifications, etc.).
The back-end development was based on Nameko [
28], a microservices framework for Python (version 3.11) that simplifies application logic and promotes testability. It comes with built-in support for the following:
RPC over AMQP;
Asynchronous events (pub-sub) over AMQP;
Simple HTTP GET and POST;
Websocket RPC and subscriptions (experimental).
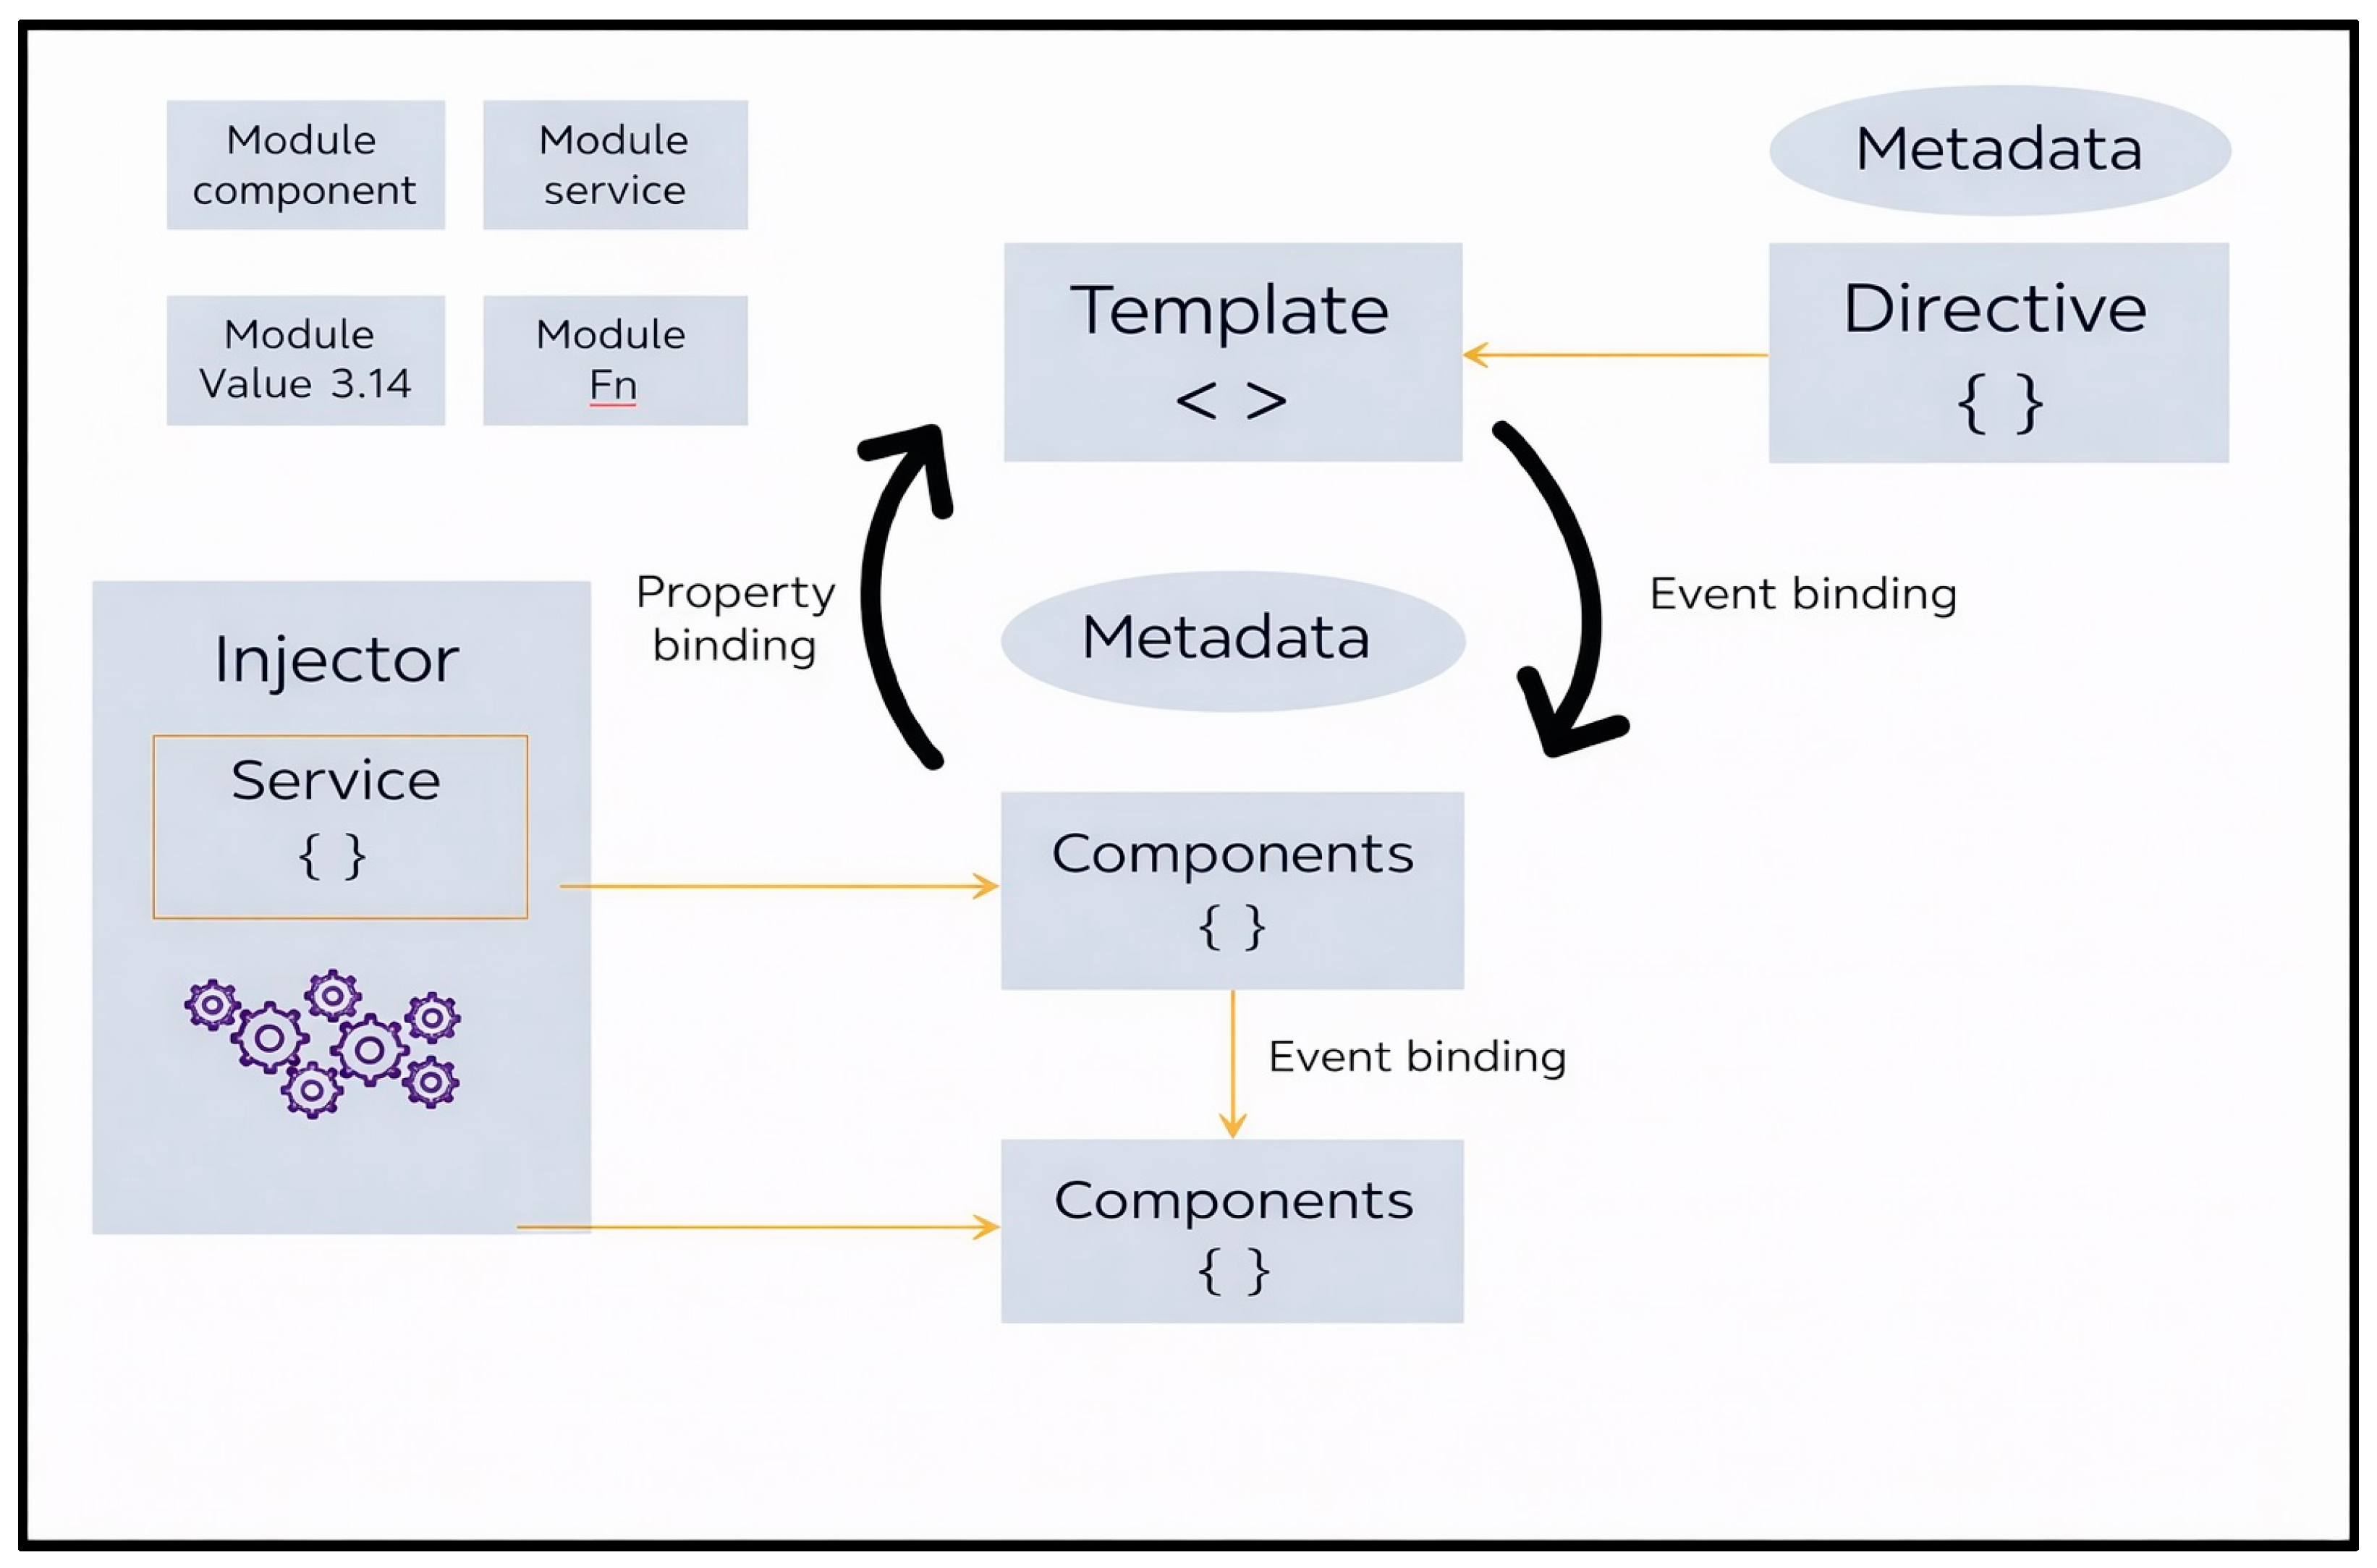
The front-end was developed by using the open-source Angular framework, which is characterized by high processing speed and reaction to user input. In particular, the WebApp created is of a hierarchical type, since it is made of modules, each of which consists of multiple components, in order to achieve a scalable and extensible platform with additional tasks and services. Each module is composed of a GUI (graphical user interface) unit called template and a unit called component that describe the actual functioning. As shown in
Figure 6, bindings interconnect template and component units and, specifically, correlate the component variables to the graphical unit of the template and vice versa (property binding and event binding). The component interacts with other components or with the back-end using services. Services do not have a GUI.
Since it is a messaging ISO Standard protocol designed specifically for applications requiring low power and limited bandwidth, such as sensors and IoT devices, MQTT (Message Queuing Telemetry Transport) was chosen to supervise the data acquisition from the accelerometers installed in the pedometers (ISO/IEC 20922:2016) [
29]. To store the data generated by the sensors, the MongoDB database service was adopted. Microservices were entrusted with the data acquisition, storage, and visualization functions. Among them, the most useful for real-time detection of oestrous events are sensor dispatcher, pedometer sensors data, and pedometer statistics data. The sensor dispatcher microservice acts as the data entry point of the system and sends the data packet to the specific microservice. Pedometer sensors’ data microservice receives data from the pedometers, after being subscribed to and analyzed by the previous microservice. The Pedometer Stats Data microservice performs the calculations and updates the accelerometer curve (expressed in mg) averaged over the last 24 h. The pedometer sensor data and pedometer statistics data microservices also store data in the MongoDB database, providing the interface with access to both the raw and aggregated data.
An alerting module for the notification of oestrous events was designed and developed. So, the dashboard of the WebApp seems to have a user-friendly interface, suitable for displaying the oestrous indicator curves in real time relating to each cow. Moreover, the Web-based software platform was optimized for any type of smart device (smartphone, tablet, desktop computer, etc.).
Ultimately, the WebApp was specifically developed to be a customized tool for the farmer, useful to detect cow’s oestrus event and provide an oestrus alert.
4. Discussion
The number of samples tested appears to be statistically significant, and this allowed us to refine the mean value and the error range for all three indicators. Demonstrating this, the algorithm’s overall reliability in detecting oestrus as certain, across the entire testing period, was found to be 72.7%, higher than the reliability value for each individual testing campaign (66.7% in 2021, 50% in 2022 and 2023, respectively). Conversely, no significant difference was found in the percentage of undetectable oestrus events, confirming the validity of the experimental approach adopted.
The mean value of the oestrus duration found (18.1 ± 2.5 h) is consistent with the scientific literature, which reports behavioral oestrus durations in dairy cows typically within a broader range (e.g., ~8–20 h), with ~18 h frequently cited as a representative average value [
31]. It has to be noted that the error ranges found for W and MS indicators are low when compared to their respective mean values, demonstrating the high repeatability of the oestrus detection system. Furthermore, all three indicators for each validated oestrus event are close to their respective mean values calculated over the entire testing period, supporting the effectiveness of the Cowtech module.
Since all three indicators (W, MS, I%) were implemented in the customized WebApp for each SASP, no installation in the barn (such as a personal computer or wired communication networks and/or power supply) was required. In fact, the SASP devices, by employing LPWAN-typed wireless communication network infrastructure, ensure stable long-range communications with a low bit rate. This feature is an important benefit in rural areas where GSM/GPRS or wired (ADSL) network coverage is often lacking. Furthermore, this feature, combined with the firmware upgradability, allows for constant remote updating of the oestrous indicators’ thresholds based on the values found in future oestrous events. This also makes the deterministic detection system adaptive, well-suited to future implementations oriented towards machine learning approaches.
Finally, it is worth noting that in addition to displaying the acceleration curve, the WebApp allows the breeder to recognize oestrus events early, greatly improving the effectiveness of artificial insemination.
To better understand the potential of the proposed SASP system, it is useful to analyze the strengths and weaknesses of current oestrus detection methods. Among the devices available on the market for detecting oestrus events, pedometers with step counter functions are among the most widespread.
Among the best known are the Alpro pedometer by De Laval and AfiAct pedometer by Afimilk. As Mottram states [
32], the first difficulty consists in correctly defining the alert threshold for oestrus. In fact, there are various methods for detecting oestrus through pedometers: exceeding the mean value by 1 or 2 standard deviations; exceeding a pre-established scale factor; or definition of an appropriate confidence interval [
18]. A further drawback is related to the overestimation of the step count by the pedometer, which increased with the number of steps, up to an increase of 196%, distorting the alert. As demonstrated by Marques et al. [
33], the pedometer counts all movements in which the paw is lifted from the ground, without distinguishing whether the animal body has moved. In any case, the sensitivity recorded for this type of pedometer rarely exceeds 70%, with a maximum recorded value of 76% [
32].
The SASP system overcomes these limitations by not simply basing its operation on the number of steps taken but rather by analyzing variations in the animal’s motor activity that can be traced back to oestrus. Its sensitivity, given by its reliability in detecting one oestrus as probable, currently stands at 86.4% as a result from the limited number of oestrus observed, which will be subject to improvement as the number of oestrus events detected increases.
Collars designed to count the number of head movements using triaxial accelerometers (Mottram [
32]) are also widely used. Voronin et al. [
34] realized that to detect oestrus in animals, it is not enough to simply detect the animal movement over time, but it is necessary to identify whether the detected movement is correlated with the animal feeding periods. Kamphuis et al. [
35] obtained slightly better results than those obtained with pedometers, reaching 76.9% sensitivity, compared to a more modest 62.4% obtained with standard collars based on the detection of motor activity alone. Other patents exist in this sector, each of which attempts to improve the basic concept.
A recent trend is to correlate oestrous events with a decrease in rumination and feeding times, observed in the 24 h preceding and during oestrous. Devices suitable for this purpose have been developed by Afimilk (Aficollar collars), capable of sending an insemination alert 8–20 h after a decrease in rumination and feeding has been recorded (see weblink
https://www.afimilk.com/improve-estrus-detection-monitor-rumination-eating-patterns/, accessed on 1 September 2025). However, even in this case, the telecommunications system adopted is Bluetooth (or similar technologies), and no data pre-processing is available.
Conversely, the statistical method based on accelerometer thresholds, proposed in this work, appears to be more suitable to work with LPWANs due to its low computational cost and the reduced bandwidth required to send the classification results to a cloud server used to deploy front-end applications for farmer use. Indeed, a key objective of this project regarded the development of upgradable firmware, capable of processing raw data and sending results through the LPWAN. The main requirement of such firmware was a low computational cost to increase device battery life. In short, adopting the SASP system, where no installation in the barn (as PC or wired communication or power supply network) is required and the use of cloud services for the management and storage of data collected in the barn is allowed, proves to be a good solution. This solution will lead to a double benefit for the breeder: plug-and-play installation and on-board computing. SASP-based oestrus monitoring services will allow monitoring animals even outside the barn due to the network’s wide coverage. A further element of novelty in the design was the choice of a double-casing geometry in order to reduce the overall number of pedometers required on a dairy farm. This will also limit both the environmental impact of pedometer disposal and their management costs. In fact, while the external casing (less expensive because it has no electronics) will be installed in all the cows being analyzed, the internal casing will only be installed in cows about to come into heat. Once the oestrus event ends, the farmer can transfer the internal casing into a different cow.
Even more recent studies (i.e., Röttgen et al. [
36] and Wang et al. [
37]) propose combining multimodal vocalization-based features with behavioral traits typical of the oestrous phase. These studies demonstrate that multivariate analysis techniques of sound- and behavior-related features can improve the detection ability of cows in oestrus, achieving an accuracy of 90% and a sensitivity of 87% in oestrus detection. Nevertheless, the mechanisms of association between multi-characteristic oestrous traits and oestrous states are still complex, and the algorithms developed so far have some limitations in performance.
As highlighted by Adenuga et al. [
1], while farmers can make informed decisions regarding investments in Automated Oestrus Detection (AOD) technologies, on the other hand, such technologies still involve significant costs within the farm management. Therefore, despite their recognized benefits, AOD technologies remain underutilized in livestock farming. On the contrary, the interest shown by farmers at the end of an economic investigation carried out to elicit the Willingness to Pay (WTP) for SASP system suggests that its innovative and low-cost design could facilitate wider spread, especially among small and medium-sized farms [
17].
Table 4 shows a synthetic comparison between the various oestrus detection systems (commercial systems and multimodal sensor fusion approaches) and the SASP system.
5. Conclusions
This paper discusses a specific module for real-time oestrus detection in dairy cows, which was designed, developed, and implemented within the Cowtech Project. This module was experimentally validated through both direct observations of farmers and veterinary laboratory analyses recognized by the scientific community, such as the milk progesterone test. With percentage of oestrus events detectable as probable and certain of 72.7% and 86.4%, respectively, these devices would appear to have a good ability to identify oestrus events. The firmware of the devices implements a refined and improved version of the moving average-based algorithm for oestrus detection in cows, previously proposed by the authors in contributions to ECPLF 2022 (Vienna) and ECPLF 2024 (Bologna). A hierarchical-typed WebApp was specifically developed to facilitate its use by farmers. The electronic devices housed within the SASPs are connected to the LoRa Wide-Area Network (LoRa WAN). With the exception of silent oestrus events, which cannot be detected using approaches based on cow movement analysis, the Cowtech module was found to be able to detect an oestrus event as certain with over 70% reliability and an oestrus event as probable with almost 90%. These values match with those achieved through more expensive multivariate analysis techniques.
Furthermore, the use of oestrus monitoring services based on the SASPs proposed in this research is expected to have positive impacts on the circular economy: the reduced number of pedometers required in a barn and the use of biocompatible and recyclable materials in the pedometer casings will help limit the environmental impact of disposal.
One important limitation of the SASP system is the non-automatic updating of the algorithm indicators. However, the development of an upgradeable firmware allows for future remote updating of the estrous indicators’ thresholds, making the system scalable and adaptive. Additionally, the firmware could be implemented with deep learning approaches (e.g., neural networks) or machine learning approaches (e.g., decision trees), at the expense of the low computing power and the reduced energy consumption for connectivity. Such implementations would offer greater accuracy and flexibility under variable conditions but would require transmitting large amounts of data to external processing units, making the system complex and computationally expensive, especially for edge computing solutions. Furthermore, this would not be compatible with LPWANs, which offer wide coverage but low bandwidth.