1. Introduction
Minarets are tall and slender structures commonly used in mosque architecture, typically located outside the main walls of mosques. Although the architectural form of minarets has evolved historically, modern minarets—particularly those influenced by the Ottoman tradition—are predominantly constructed as slender reinforced concrete (RC) structures, often using precast cylindrical components [
1].
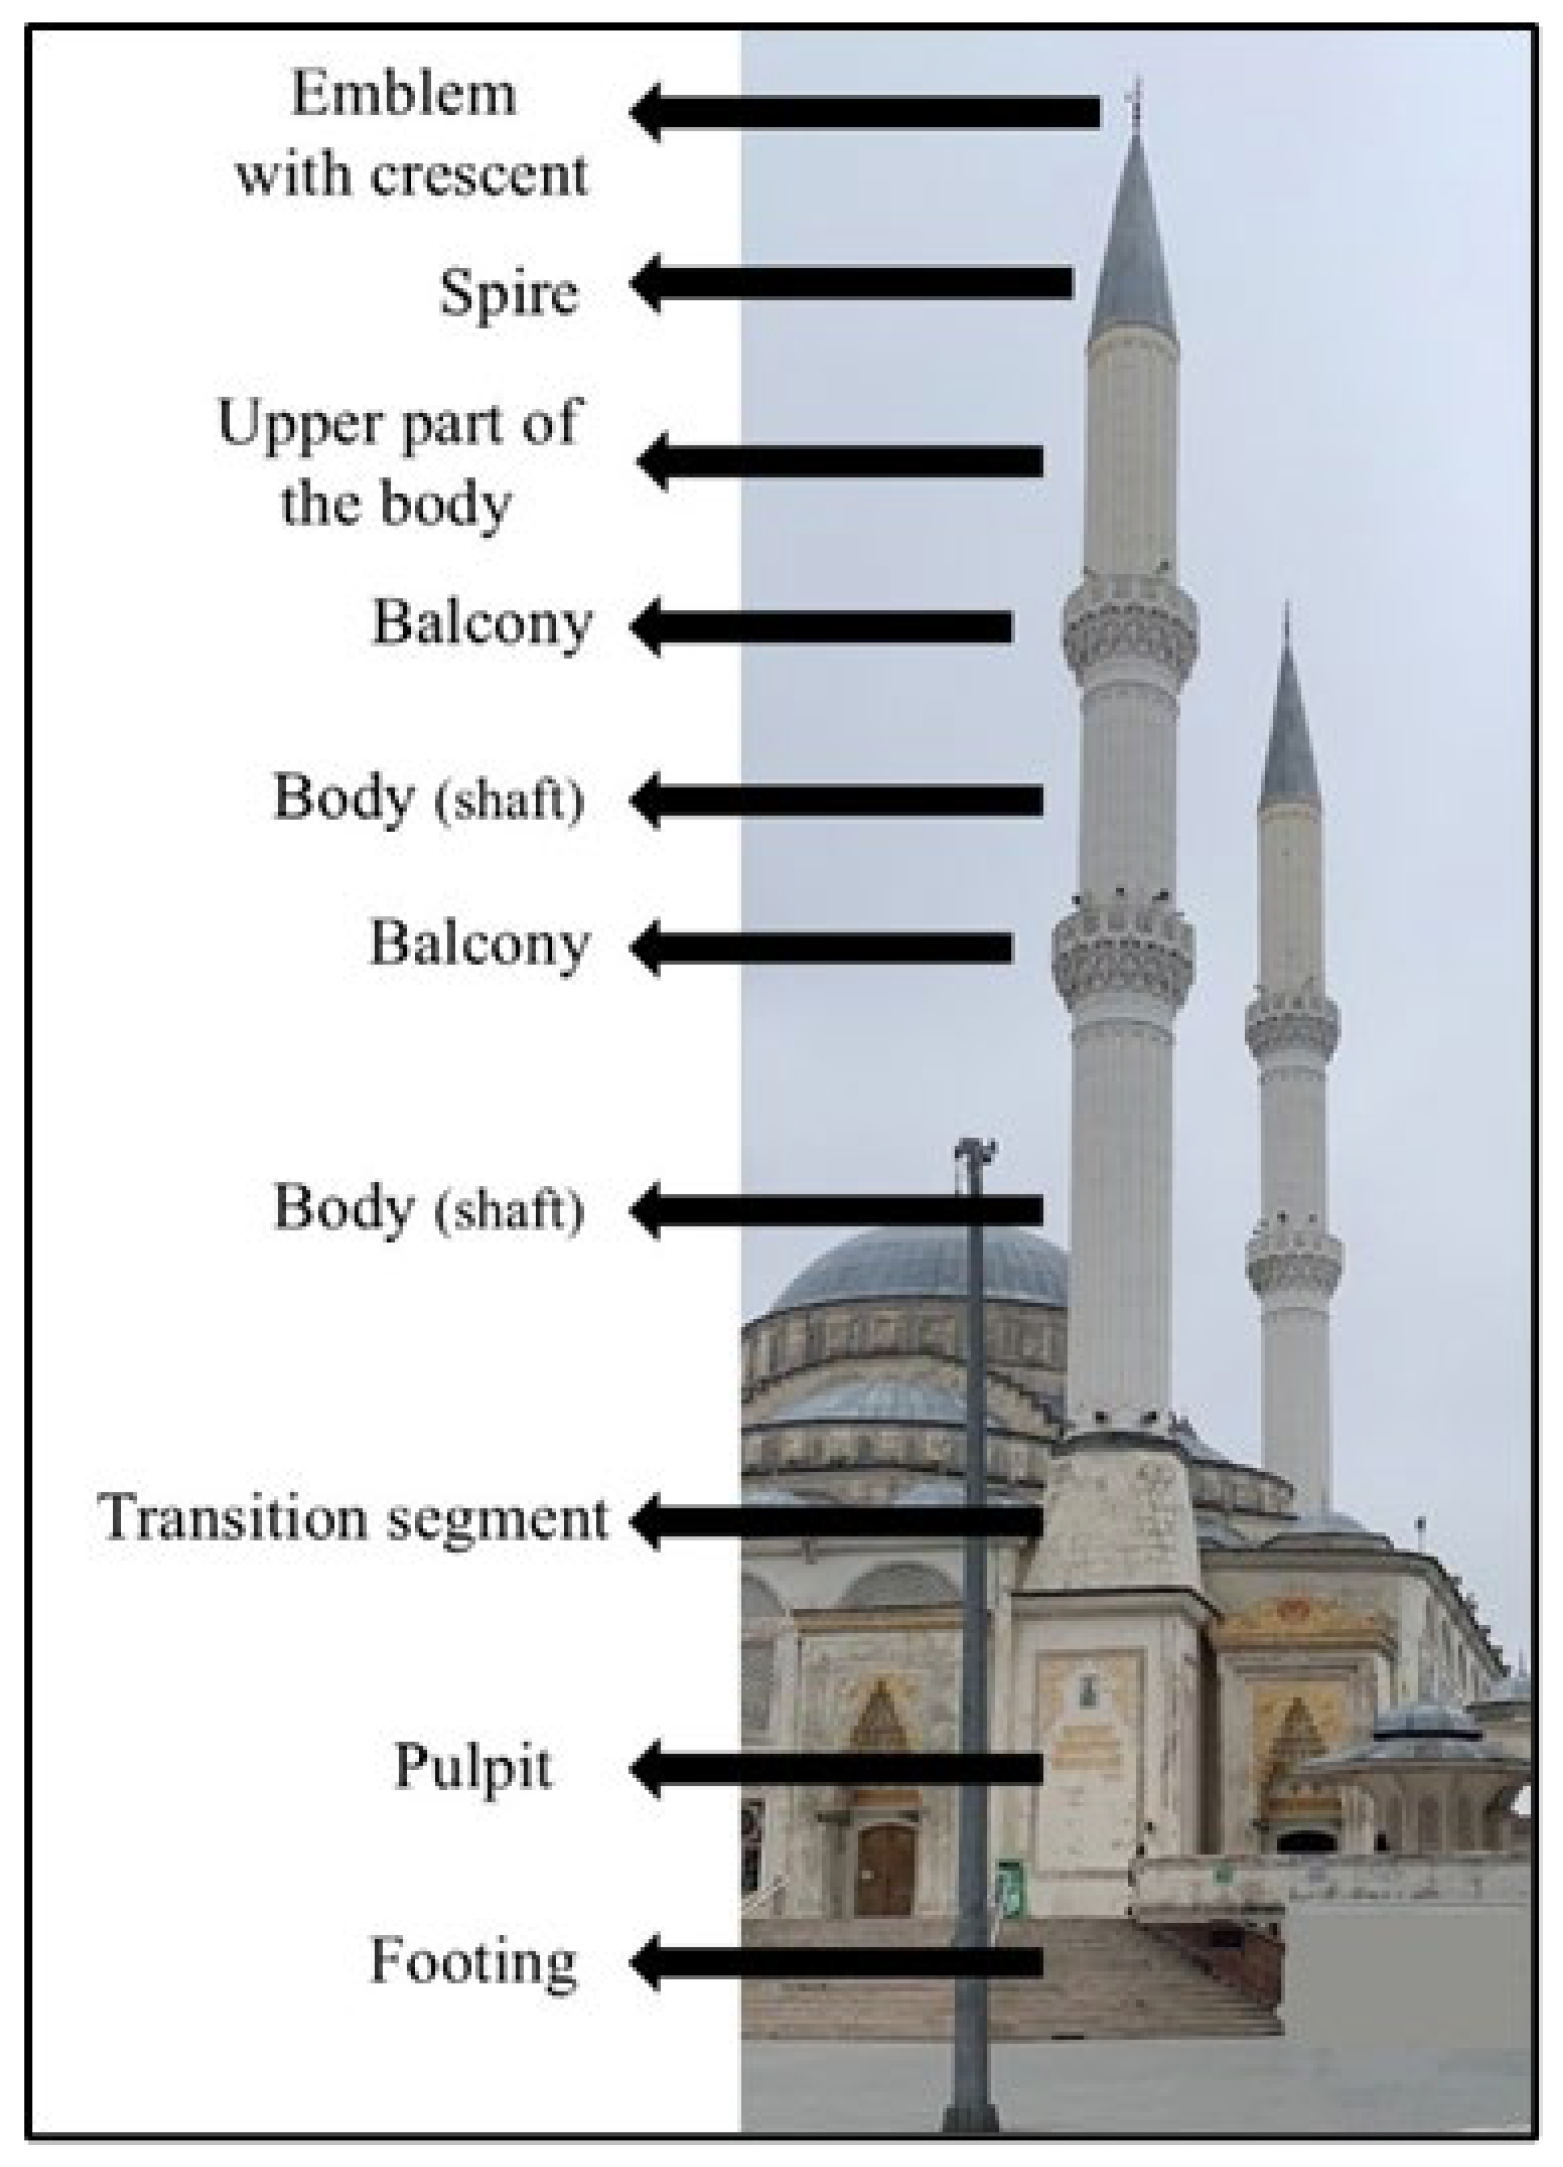
Ottoman minarets generally consist of the following elements: footing, pulpit, transition segment, main body, staircase, balcony, spire, and the “alem”, the emblem with the crescent at the top, as shown in
Figure 1.
Minarets, with their unique shape and delicacy, especially Ottoman minarets, are distinct from other renowned structures. However, their vulnerability has been evident in Türkiye’s recent seismic and wind-related disasters, where many have suffered irreparable damage or collapse, often resulting in loss of life and property. For instance, during the 1999 Kocaeli and Düzce earthquakes (
Mw 7.4 and
Mw 7.2), approximately 70% of the minarets in Düzce were either severely damaged or collapsed [
2]. Similarly, the 23 October 2011 Van earthquake (
Mw 7.1) led to the complete collapse or irreparable damage of 50 minarets, and 26 others sustained repairable damage [
3]. More recently, the 5.8 magnitude earthquake on 26 September 2019 in southwest Istanbul resulted in structural damage to a reinforced concrete minaret [
4]. Additionally, the 2020 Izmir earthquake (
Mw 6.6) caused significant structural failures, including the collapse of a minaret constructed from concrete blocks [
5]. The February 2023 Kahramanmaraş earthquake, one of the most devastating in recent history, caused significant damage to numerous structures, including minarets. In Adıyaman province alone, over 27 minarets were reported to have sustained damage. Additionally, an unquantified number of minarets collapsed or were damaged in other provinces impacted by the earthquake [
6]. Data from the Turkish Presidency of Religious Affairs reveal that the disaster resulted in the collapse of 261 mosques, along with the minarets of 1627 others. Furthermore, of the 8851 mosques equipped with at least one minaret, approximately 36.8% experienced partial or total failure of their minarets [
7]. These observations highlight the considerable seismic risk associated with RC minarets, especially in regions characterized by high seismicity and dense urban development [
1,
2]. Furthermore, in recent years, there has been a significant increase in the number of RC minarets built in Türkiye. According to documentation of the Presidency of Religious Affairs of Türkiye [
8], the number of mosques that usually have at least one minaret increased by 11,068 between 2006 and 2023.
However, RC minarets were typically constructed by local craftsmen without the involvement of professional engineering services. This lack of engineering supervision, coupled with their often overly slender, elongated design and the use of non-standard materials and workmanship with inadequate levels of quality control, has made these structures particularly vulnerable to damage during adverse events such as earthquakes and strong windstorms [
2,
6].
All those reasons necessitate primarily meticulous dynamic and seismic analyses of RC minarets. In this regard, there are several methods for studying the effects of earthquakes on structures. There appears to be three main groups of approaches: analytical methods, experimental methods, and observational methods [
9].
Previous research on RC minarets has predominantly relied on analytical, numerical, and observational approaches. Post-earthquake reconnaissance studies conducted following major seismic events in Türkiye have provided valuable insight into the typical damage patterns and failure mechanisms of RC minarets, highlighting their pronounced vulnerability due to geometric slenderness and inadequate detailing [
2]. In addition, several post-earthquake studies have investigated both RC and historical masonry minarets within a unified assessment framework, offering comparative observations on damage characteristics across different construction typologies [
6,
7]. Moreover, a separate body of literature has focused exclusively on historical masonry minarets, examining their seismic behavior and damage mechanisms in detail [
10,
11].
Building upon these observations, numerical modeling approaches have been extensively employed to investigate the dynamic response of RC minarets under wind and earthquake loading. Such studies have examined the influence of slenderness, boundary conditions, and loading assumptions on global response characteristics, modal properties, and stress demand distributions [
1,
2,
12,
13]. Parallel numerical investigations have also been conducted on historical masonry minarets, primarily focusing on elastic response characteristics and damage interpretation within a heritage conservation context [
14].
Although these numerical investigations have advanced the understanding of elastic and near-elastic behavior, their findings are inherently dependent on modeling assumptions and lack experimental verification.
In contrast to the relatively extensive analytical and numerical literature, experimental investigations on RC minarets remain extremely limited. Existing experimental studies are primarily restricted to ambient vibration testing and operational modal analysis, which are mainly used for model calibration and updating rather than for the direct assessment of seismic response characteristics [
12,
15]. Shaking table experiments, addressing the dynamic behavior of RC minarets, are notably scarce.
In this context, a limited number of shaking table studies on structurally analogous tall and slender systems, such as concrete chimneys and cantilever-type towers, have been reported in the literature. These studies illustrate the potential of scaled physical models to investigate the seismic response of flexural-dominated vertical structures, offering relevant experimental reference cases for RC minarets [
16,
17,
18,
19].
Although shaking table testing represents one of the most advanced experimental techniques for seismic research, its application to RC minarets has been constrained by practical challenges, including extreme geometric slenderness, strict mass-similitude requirements, and the payload and dimensional limitations of commonly available laboratory shaking tables [
20,
21]. These constraints have limited the practical implementation of physical modeling approaches for RC minarets and have left a critical gap between theoretical similitude concepts and experimentally realizable testing strategies.
By systematically examining similitude requirements, realistic laboratory constraints, material properties, and numerical dynamic response characteristics, this study aimed to identify physical modeling strategies for slender RC minarets that can be practically implemented on small- to medium-scale shaking tables. The work is explicitly framed as a preliminary numerical feasibility study intended to support rational decision-making prior to experimental implementation.
The contribution of this study lies in its feasibility-based and comparative evaluation of physical modeling approaches for RC minarets, explicitly integrating classical similitude principles with realistic experimental constraints, rather than proposing new theoretical formulations. It should be noted that the present investigation is limited to numerical analyses and does not include shaking table experiments at this stage. The effects of this limitation and the main modeling assumptions are discussed to help guide the design and implementation of future shaking table tests and to clarify the expected accuracy and limitations of their results with respect to elastic response characteristics, prior to damage-oriented numerical or experimental investigations.
2. Physical Models: Similitude Requirements and Model Types
Physical modeling is widely used in shaking table tests to investigate the seismic response of structures. Due to laboratory constraints related to shaking table dimensions and payload capacity, scaled physical models are employed and designed to satisfy appropriate similitude requirements in order to ensure the reliable interpretation of experimental results [
22].
The relationship between a scaled model and its prototype is established through dimensional analysis, which provides a systematic framework for defining similarity conditions. In general, any physical phenomenon described by a set of variables can be expressed by a dimensionally homogeneous functional relationship:
where,
n denotes the number of variables describing the
Q1-phenomenon, and
Q2,
Q3, …,
Qn denote the physical quantities describing the
Q1-phenomenon.
According to Buckingham’s π theorem, every dimensionless variable π
1 can be expressed as a function of
n-
N independent dimensionless variables,
where,
π2,
π3,
πn-N are the independent dimensionless variables and
N is the size of the dimensional base, or, the number of base dimensions, e.g., length, mass, time; L, M, T [
19,
21].
2.1. Dynamic Similitude Requirements
In structural dynamics applications—where dynamic characteristics, the response to kinematic excitation, and seismic behavior must be realistically reproduced—the governing relationship may be expressed in terms of stress as a function of geometric, material, inertial, and gravitational parameters:
where,
is the spatial position vector,
t is time,
is the mass density,
is the modulus of elasticity,
is acceleration,
is the gravitational acceleration,
is a characteristic length,
is the yield stress, and
denotes the initial position vector [
21].
By applying dimensional analysis, the governing relationships of Equation (3) can be expressed in a fully dimensionless form.
These dimensionless parameters form the basis for defining similarity relationships between the experimental model and the prototype. Using the scale factor definition for a generic physical quantity
i as
SFi =
ip/
im, the required model–prototype scaling relations for all relevant parameters can be systematically derived [
21].
2.2. Types of Earthquake Modeling of Structures
Based on established similitude principles, several physical modeling approaches have been proposed for earthquake engineering applications, including the True Replica Model (TRM), Artificial Mass Model (AMM), Neglected Gravity Model (NGM), and Distorted Model (DM) [
21].
Among these, the TRM represents the most theoretically rigorous modeling approach, as it seeks to simultaneously satisfy Froude and Cauchy similitude by scaling inertial, gravitational, and restoring forces. However, in practice, the inability to scale gravitational acceleration often leads to unrealistic material requirements or excessive mass density, significantly limiting the applicability in laboratory-scale shaking table tests.
As a consequence of these limitations, attention is commonly shifted toward adequate models, which relax one or more strict similitude requirements while maintaining the validity of the governing dimensionless parameters and prediction equations. Within this framework, two principal adequate modeling strategies are widely adopted in earthquake engineering studies: the AMM and the NGM.
In the AMM, the seismically effective mass is decoupled from the density of the structurally effective material and is introduced through additional mass components. This approach can be implemented in two main forms: (i) lumped mass systems, where the added mass is concentrated at discrete locations, such as floor levels, and (ii) distributed mass systems, where the additional mass is spread along the structural height. Although AMM allows the dynamic similitude to be approximately satisfied without requiring unrealistically dense materials, careful attention must be paid to the placement of the added masses, as improper positioning may unintentionally affect the stiffness distribution, stress states, and local dynamic behavior. From a similitude perspective, the AMM commonly adopts a unit acceleration scale factor (
) to directly reproduce prototype-level acceleration demands, which yields a time scale factor of
. Following Moncarz and Krawinkler [
21], Cauchy similitude for artificial mass modeling is formulated in terms of the balance between inertial and elastic restoring forces. By expressing inertial forces using gravitational acceleration as a reference, the similitude condition reduces to
.
As an alternative adequate modeling strategy, the NGM represents a modeling approach in which gravitational similitude is intentionally relaxed under the assumption that the seismic response of slender structures is governed primarily by inertial and elastic restoring forces. By neglecting gravity-induced stresses, the NGM eliminates the need for artificial mass and enables the use of model materials with reduced elastic modulus to satisfy dynamic similarity. This approach offers significant practical advantages in terms of constructability and experimental simplicity, although its applicability may be limited in cases where gravity effects play a non-negligible role in the structural response.
From a similitude perspective, the NGM scaling laws are derived from the governing dimensionless products obtained by neglecting gravity-induced effects, namely
and
[
21].
Alongside adequate modeling strategies, Distorted models (DM) refer to physical models in which one or more similitude requirements are intentionally violated in order to overcome practical limitations related to material properties, geometry, or loading conditions. The primary limitation of distorted models lies in the difficulty of preserving the governing dimensionless parameters that control the dynamic response. Once key similitude conditions are violated, consistent correction factors for prediction equations cannot generally be defined, making it challenging to reliably extrapolate experimental results from the scaled model to the prototype. Accordingly, the selection of an appropriate modeling strategy depends on balancing theoretical consistency with practical feasibility, taking into account the characteristics of the structure under study and the limitations of the available experimental facilities [
21].
As comprehensively discussed by Moncarz and Krawinkler [
21], physical models can be systematically classified into true replica models, adequate models, and distorted models, emphasizing that deviations from strict similitude requirements are often unavoidable in practical model testing. Their study demonstrated that such deviations may influence the accuracy and interpretation of the measured seismic response, particularly with respect to material behavior, stress distribution, and higher-mode contributions. Although true replica models provide the most rigorous theoretical framework, the authors showed that adequately designed alternative modeling approaches can still reproduce essential dynamic response characteristics when the governing dimensionless parameters are appropriately controlled.
To facilitate the subsequent numerical evaluation of the different physical modeling approaches, the principal similitude relationships and corresponding scaling factors adopted in this study are summarized in
Table 1.
3. Case Study
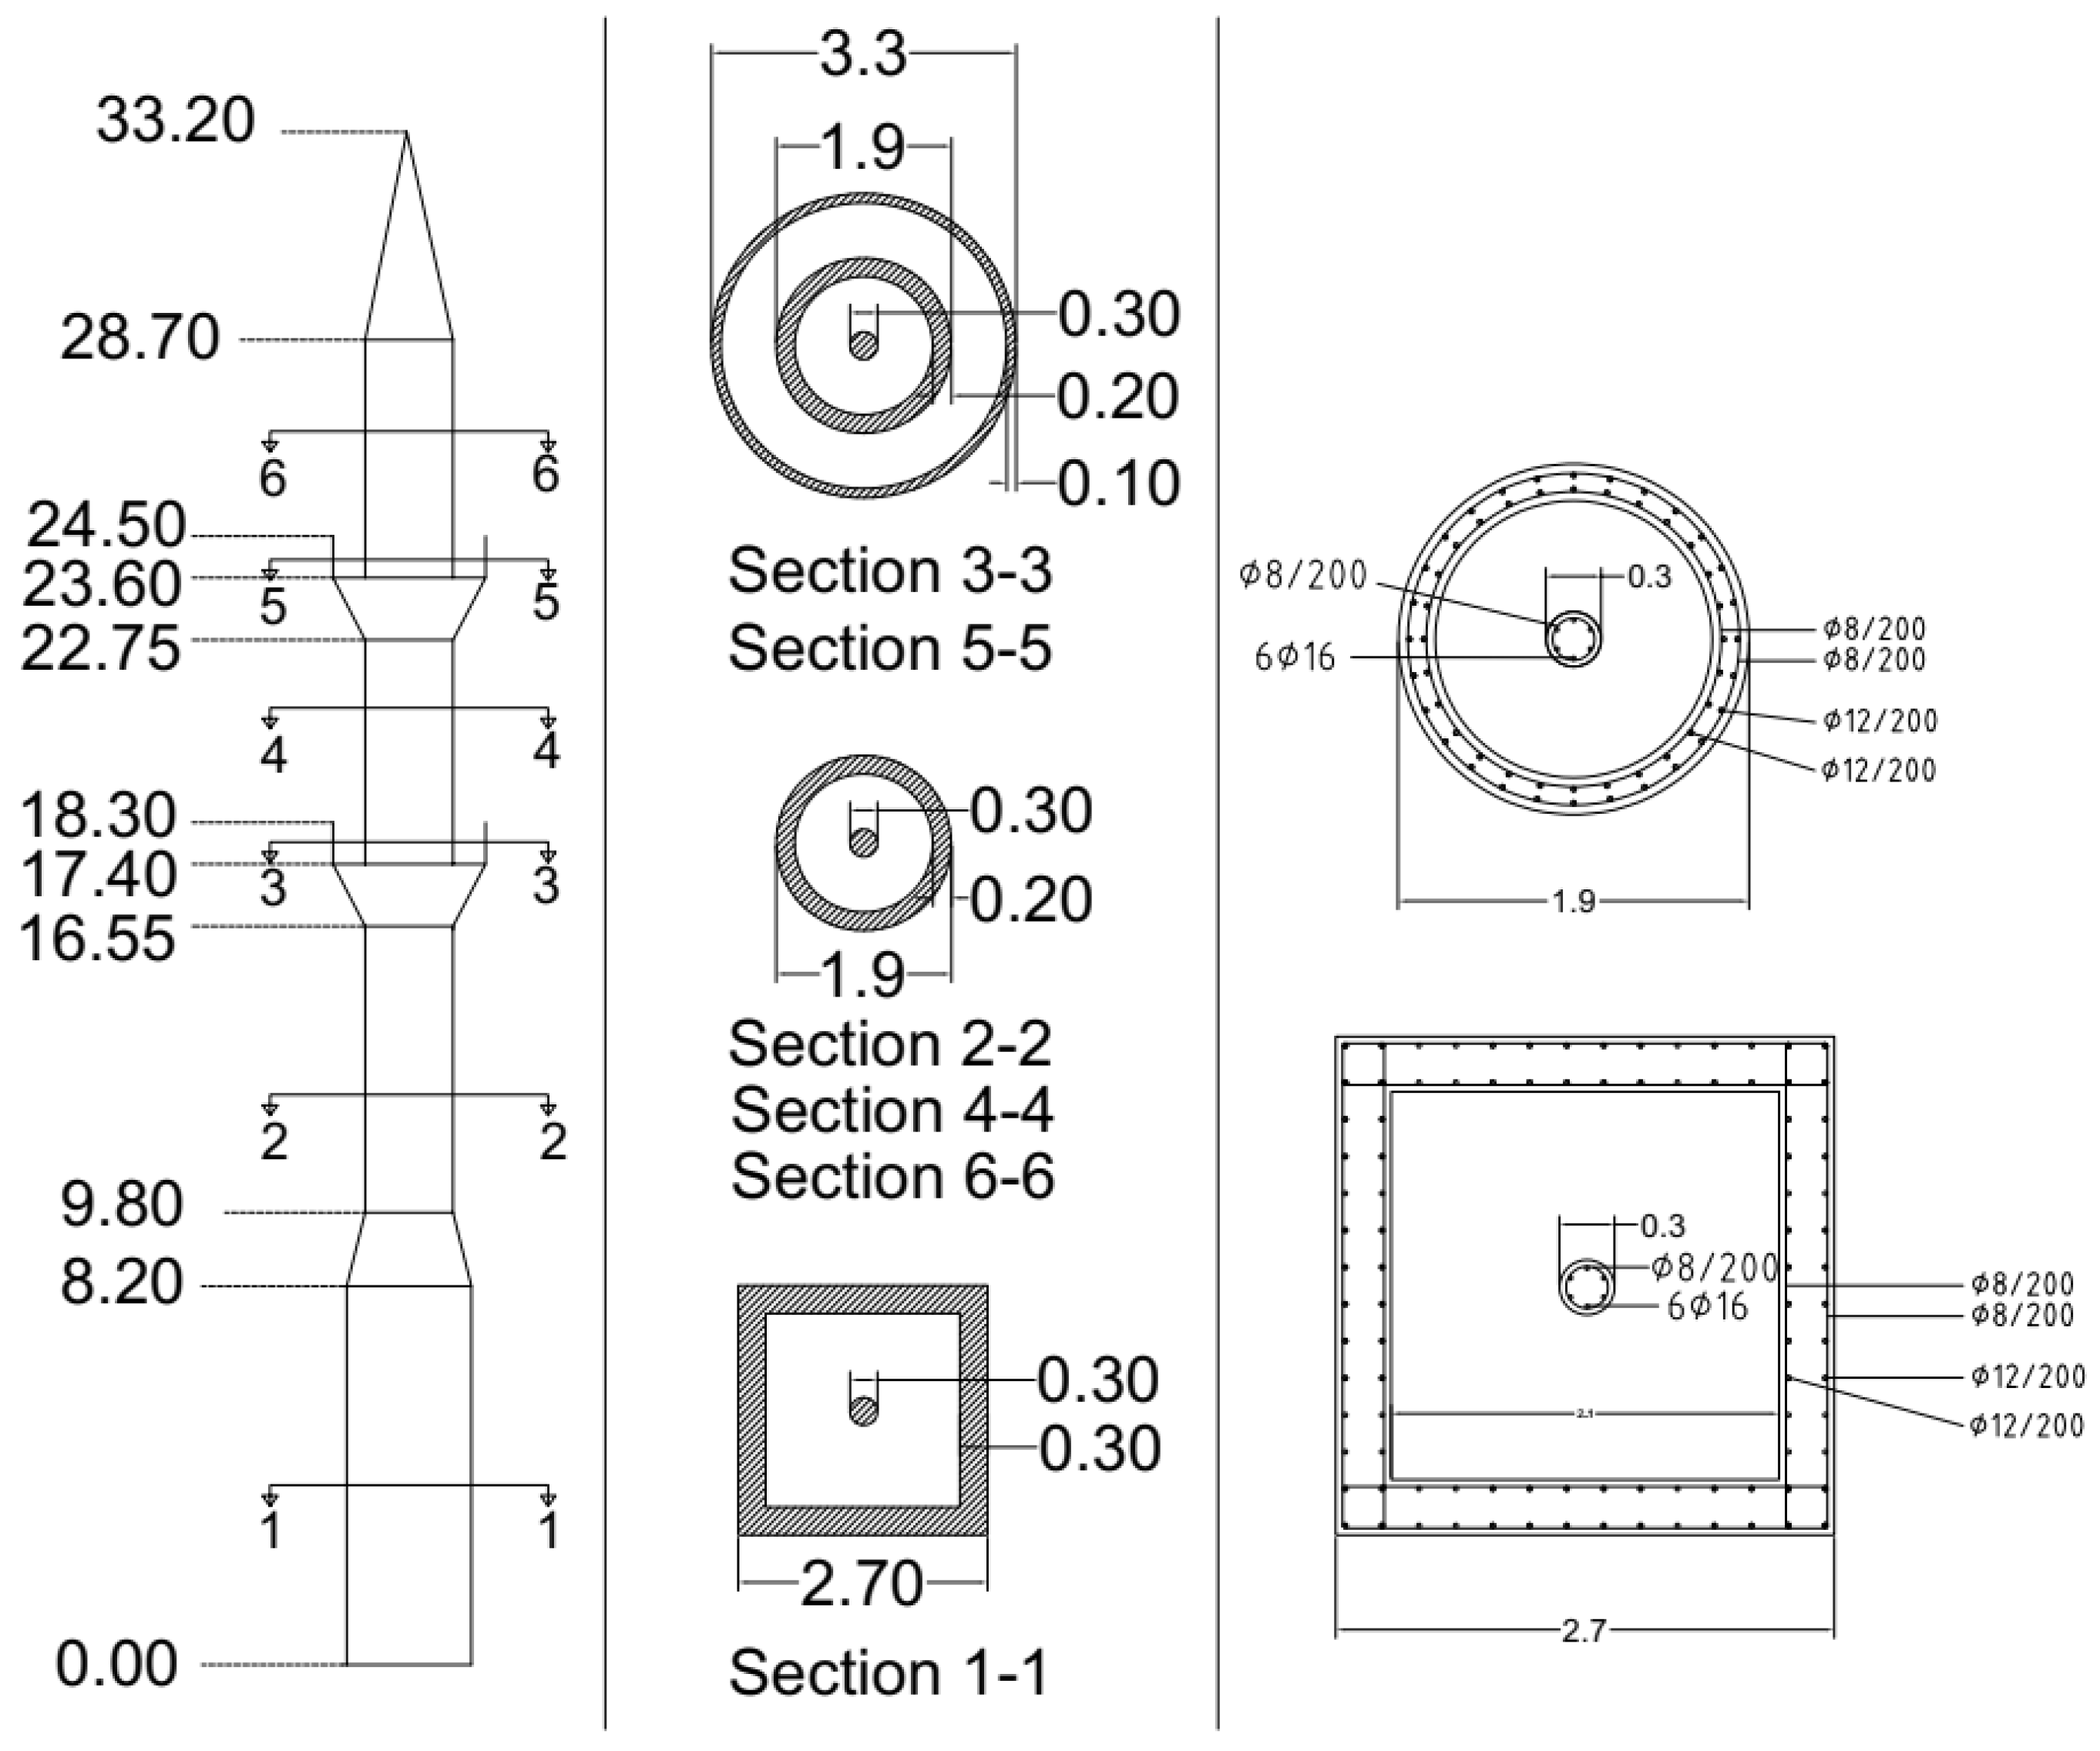
A ready-made project provided by the Cyprus Religious Affairs Administration was selected as the case study for this research. According to the classification adopted by the Cyprus Religious Affairs Administration, the project is designated as a Type B—medium-sized—Mosque. This designation is used to describe a mosque with moderate plan dimensions and a RC minaret height within the range commonly adopted in practice. According to the project drawings, the 33.2 m RC minaret is designed using concrete of class C20/25 and reinforcing steel of grade S420, and follows a standardized design approach based on typical regional geological and ground conditions in Cyprus, without reliance on site-specific geotechnical investigations [
1]. The dimensions and cross-sectional details of the 33.2 m RC minaret of the Type B Mosque are illustrated in
Figure 2.
4. Model Type Possibilities for Shaking Table Tests
Due to the limitations of laboratory model testing conditions, such as the dimensions of the shake table (1.00 m·1.00 m) and its payload capacity of 500 kg
f (4.903 kN) [
23], a length scale factor (
SFL =
Lp/
Lm) of 10 (ten) was chosen. Accordingly, the prototype RC minaret with a total height of 33.2 m was scaled to a model height of 3.32 m. At this scale, the prototype volume of 59.19 m
3 corresponds to a model volume of 5.92 × 10
−2 m
3. Based on the similitude relationships summarized in
Table 1, the feasibility of different physical modeling approaches was evaluated.
4.1. The TRM Approach Trial
Corresponding with the scale factor relations of the TRM (
Table 1, Column 1), the scale factors for length (
SFL), acceleration (
SFa), and time (
SFT) were determined to be 10, 1, and 3.162, respectively. By selecting the same prototype material for constructing the model, the modulus of elasticity scale factor (
SFE) was 1 and the mass density scale factor (
SFρ) was 0.1.
Through dimensional analysis of mass density [
ρ] = M/L
3, the mass scale factor (
SFM) can be expressed as
SFM =
SFρ·(
SFL)
3. This indicates that the mass scale factor (
SFM) should be equal to 100. On the other hand, the total mass of the prototype and the model can be calculated as 142,061.5 kg and 142.0615 kg, respectively, as follows:
where
m is the mass,
ρ is the density, and
V is the volume. Hence, the ratio of the mass of the prototype to that of the model comes out to be 1000, which does not match the mass scale factor (
SFM) of 100. Therefore, in this case, application of the TRM similarity criteria is only practicable if a model material that significantly differs from the prototype material, with its decreased stiffness or increased density, can be employed. Due to the difficulty in obtaining materials that meet these criteria, the use of a TRM is not feasible for this case study of RC minarets.
4.2. The AMM Approach Trials
4.2.1. AMM Approach Trial with the Prototype Material
Corresponding with scale factor relations of the AMM (
Table 1, Column 2), the scale factors for length (
SFL), acceleration (
SFa), and time (
SFT) were determined to be 10, 1, and 3.162, respectively. By selecting the same prototype material for constructing the model, the modulus of elasticity scale factor (
SFE) was 1 and the mass density scale factor (
SFρ) was 0.1.
Through dimensional analysis of mass density, the mass scale factor (SFM) should be equal to 100.
On the other hand, using Equation (5), the total mass of the prototype (mp) and the main body model mass (mm0) can be calculated as 142,061.5 kg and 142.0615 kg, respectively. However, according to the definition of the scale factor, the total mass of the model (the main body mass and the artificial model mass) should be 1420.6 kg. This implies that the artificial model mass of 1278.6 kg needs to be added to the model. Unfortunately, adding this amount of mass to the model is not feasible without employing major assistive equipment and techniques, which are not available in most test laboratories.
4.2.2. AMM Approach Trial with Different Material
Also, corresponding with scale factor relations of the AMM (
Table 1, Column 2), scale factors for length (
SFL), acceleration (
SFa), and time (
SFT) were determined to be 10, 1, and 3.162, respectively.
Hence, for the choice of a different material to build the model, the similarity condition is as follows:
Therefore, through dimensional analysis of mass density, the total mass of the model can be expressed as follows:
On the other hand, the total mass of the prototype (
mp) and the main body model mass (
mm0) can be calculated using Equation (5). Therefore, the artificial model mass can be determined as follows:
To reduce the artificial model mass, it is necessary to increase either one or both of the parameters SFE (the elasticity scale factor) and ρm0 (the main body model mass density). Increasing the elasticity scale factor (SFE) entails utilizing model material with a lower modulus of elasticity, which can be achieved with low-strength micro-concrete.
4.3. NGM Approach Trials
4.3.1. NGM Approach Trial with the Prototype Material
According to the scale factor relations of the NGM (
Table 1, Column 4), the scale factors for length (
SFL) and time (
SFT) were found to be 10, whereas the acceleration scale factor (
SFa) was determined to be 0.1. The scale factors for elasticity and mass density were also established as 1.
Consequently, the model’s time should be one-tenth that of the prototype, whereas the model’s acceleration should be ten times greater than that of the prototype. It should be noted that these adjusted time and acceleration values of the model may not be directly applicable in the laboratory setting.
4.3.2. NGM Approach Trial with Different Material
According to the scale factor relations of the NGM (
Table 1, Column 3), the scale factor of time is inversely proportional to the square root of the specific stiffness scale factor (
SF(E⁄ρ)). Conversely, the scale factor of acceleration is directly proportional to the specific stiffness scale factor. Therefore, to achieve practical values for the model’s time and acceleration, it is imperative to maintain a higher specific stiffness scale factor (
SF(E⁄ρ)). One viable option to achieve this is the utilization of low-strength micro-concrete.
5. Model Material Investigation
After conducting a survey of physical model types for shaking table tests, it has been determined that both the AMM and the NGM are feasible within the limitations of the testing capabilities available. However, it is necessary to employ materials different from those of the real (prototype) structure. The desired model material should have an elastic modulus value lower than that of the prototype material, whereas the mass density in the model should be more than that of the prototype. To meet these objectives, a series of preliminary trial mixes was first designed and experimentally evaluated in the laboratory. Based on the outcomes of these iterative trials, two optimized micro-concrete mixes (Mix-1 and Mix-2) were ultimately selected and developed. The mixes comprise cement, sand, water, and a high-range water-reducing admixture (HRWRA or hyper-fluidifier), with part of the binder replaced by lower-stiffness constituents—namely fly ash and plaster gypsum—to tune the elastic modulus. The replacement ratios were iteratively adjusted to obtain elastic modulus values within a target range of approximately one-quarter to one-half of the prototype elastic modulus, while preserving adequate strength, workability, and constructability for reduced-scale physical modeling.
To satisfy similitude requirements and to minimize the risk of segregation and wall-effect, and to ensure proper material behavior in scaled models, the maximum aggregate size (
Dmax) in micro-concrete should not exceed one-third and preferably not more than one-fifth of the smallest cross-sectional dimension of the model structural elements. Accordingly, all sand used in the micro-concrete mixes was sieved to pass through a 2.00 mm mesh. The hyper-fluidifier was used in both mixes to enhance workability, promote particle dispersion, and improve homogeneity. Furthermore, in Mix-2, a prescribed volume fraction of Bekaert OL steel fibers, 6 mm in length and 0.16 mm in diameter (aspect ratio (
ℓ/d) of 37.5), at a dosage of 0.35% by volume of the micro-concrete, was incorporated to mitigate cracks. The compositions of Mix-1 and Mix-2 are listed in
Table 2.
For Mix-1 and Mix-2, three 100 mm·200 mm cylindrical specimens were tested under uniaxial compression to determine both compressive strength and the modulus of elasticity. The tests were conducted at curing ages of 28 days for Mix-1 and 179 days for Mix-2, which were intentionally selected to reflect the different strength development mechanisms of the two mixes. Although Mix-1 is a cement-gypsum micro-concrete mixture that develops most of its strength and stiffness within the conventional 28-day curing period, Mix-2 incorporates Class F fly ash as a partial binder replacement, which is known to delay the stabilization of compressive strength and the elastic modulus due to its pozzolanic reaction. Consequently, an extended curing age was required for Mix-2 to reach representative long-term mechanical properties suitable for similitude-based scaled physical modeling. All the results are shown in
Table 3. The procedure stated in British Standard (BS EN 12390-13) [
24] was followed to conduct modulus of elasticity tests on the three cylinder specimens. To monitor the mechanical strengths of specimens with varying sizes and shapes, which are not inherently comparable, a conversion based on equivalence for normal concrete, as outlined by Neville (2011) [
25] and Yi,. et al. (2006) [
26], was employed. The compressive strengths of 100 mm·200 mm cylinders were multiplied by a factor of 0.96 to obtain the equivalent values for 150 mm·300 mm cylinders.
Based on the experimentally determined material properties, the model materials Mix-1 and Mix-2 were characterized by elastic moduli of 11.83 GPa and 12.77 GPa, and mass densities of 1964 kg/m
3 and 2017 kg/m
3, respectively. The prototype concrete was assumed as C20/25, with an elastic modulus of 28.5 GPa and a mass density of 2400 kg/m
3. These properties were adopted in the scaling analyses, and the corresponding scale factors and governing similitude relationships were applied in accordance with the scaling equations detailed in
Section 4 for each AMM and NGM case. The resulting scale factors, as well as the artificial masses required in the AMM cases, are summarized in
Table 4.
6. Finite Element Analysis
Finite element models (FEMs) of both the full-scale representative RC minaret and the 1:10 scale physical model were developed using SAP2000 v24.2.0 [
27]. The software was selected due to its widespread application in structural dynamics and earthquake engineering, as well as its robust capabilities for modal and linear time–history analyses.
For the full-scale representative RC minaret, shell elements were utilized in the FEM, with section properties defined and assigned according to the thicknesses elucidated in previous cross-sectional descriptions. The staircase was also modeled as shell elements, with a thickness of 0.17 m, surrounding an RC circular column with a diameter of 0.3 m up to the second balcony. The base of the minaret was assumed to be fixed. The reinforced concrete material was defined using a unit weight of 24.0 kN/m3, an elastic modulus of 28.5 GPa, a Poisson’s ratio of 0.2, and a characteristic compressive strength of 20 MPa.
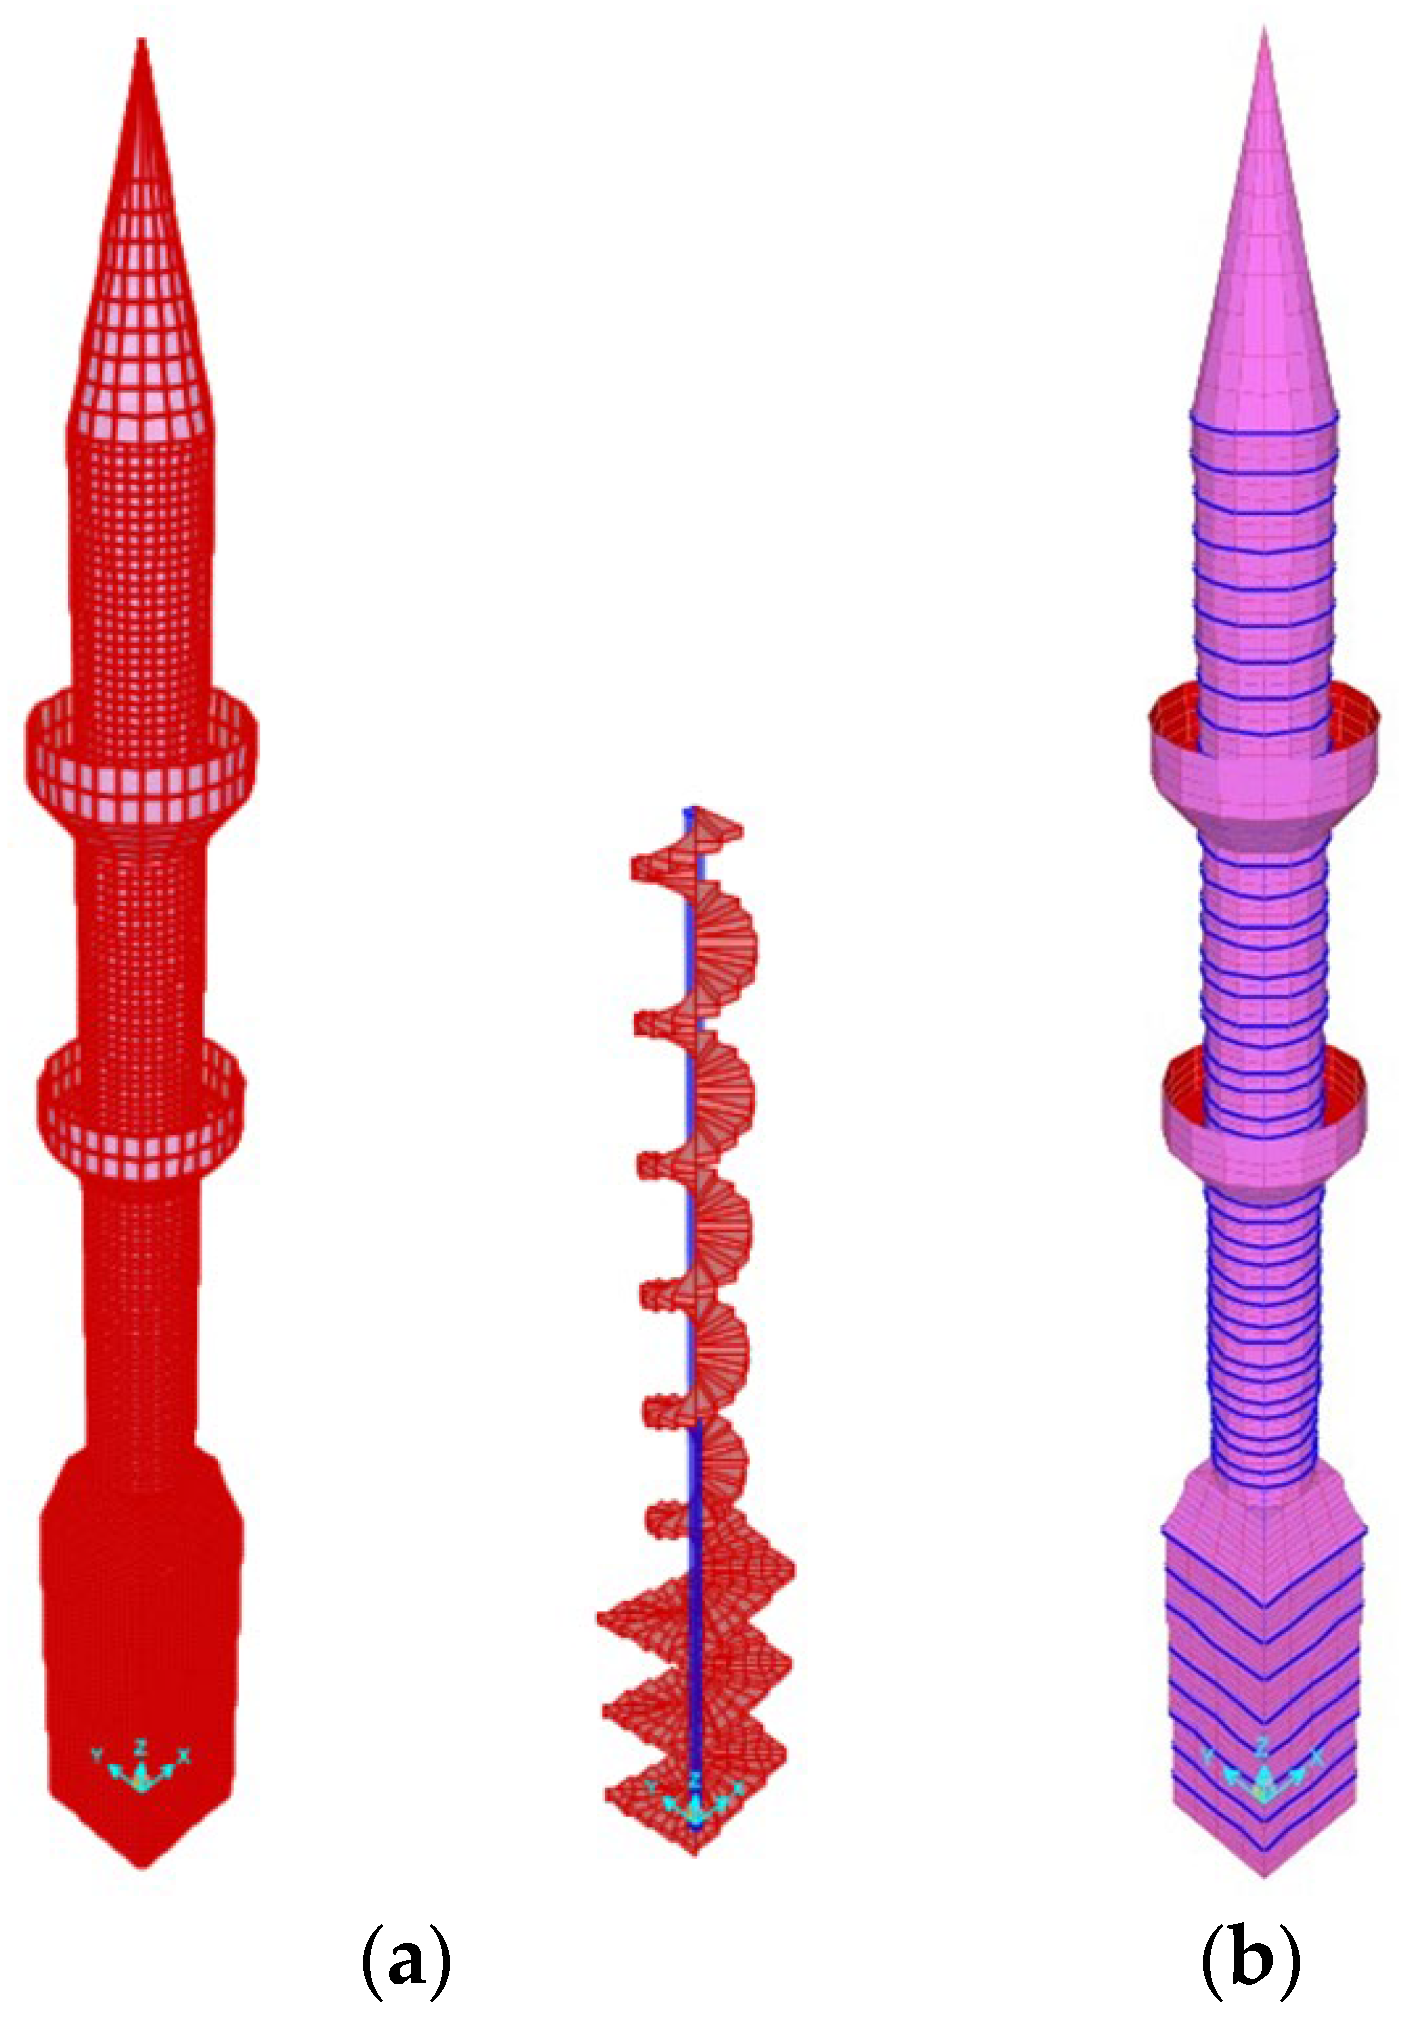
In the FEM, the helical staircase is represented using shell elements. The ends of each stair shell element are rigidly connected (jointed) to the corresponding edge nodes of the outer wall shell elements. This connection ensures compatibility of deformations and continuity of displacements between the stair assembly and the external wall. In other words, the stairs and the wall are constrained to act as a single monolithic structural unit, rather than two independent components. The 3D FEM of the full-scale representative RC minaret is shown in
Figure 3a, whereas the first ten mode shapes, periods, and frequencies of the representative RC minaret are presented in
Table 5.
On the other hand, for the 1:10 scale model, shell elements were employed in the FEM for two distinct cases, corresponding to the experimentally characterized micro-concrete materials (Mix-1 and Mix-2). The material properties obtained from laboratory testing were directly implemented into the FEM material definitions. In the first case, the properties corresponding to Mix-1 were defined as follows: a unit weight of 19.26 kN/m3, an elastic modulus of 11.83 GPa, a Poisson’s ratio of 0.2, and a compressive strength of 9.13 MPa. In the second case, the model was updated using the properties of Mix-2, which included a slightly higher unit weight of 19.79 kN/m3, a higher elastic modulus of 12.77 GPa, the same Poisson’s ratio of 0.2, and a lower compressive strength of 7.96 MPa. In all cases, the material behavior was assumed to be linear elastic and isotropic, consistent with the objective of the study, which focuses on evaluating the dynamic similarity and feasibility of physical modeling strategies rather than nonlinear material responses.
As previously outlined in this study, two applicable physical modeling approaches were adopted: the AMM and the NGM, each implemented in accordance with their respective similitude requirements. For the AMM, when utilizing Mix-1 as the construction material, an artificial mass of 473.4 kg was required to be added to the model to achieve an acceleration scale factor of 1, with a corresponding time scale factor (prototype to model) of 3.16. In contrast, when Mix-2 was employed, the necessary artificial mass increased to 517.1 kg. In the numerical implementation, the artificial mass was represented by steel rod elements with a diameter of 50 mm placed at approximately uniform elevation intervals along the height of the model, following a discrete (lumped) mass representation. In particular, for Mix-1, a total of 37 circular levels and eight square levels were installed, resulting in a cumulative mass of approximately 473 kg. For Mix-2, 42 circular levels and eight square levels were installed, with a total mass of approximately 517 kg. To prevent the artificially introduced steel rods from unintentionally influencing the stiffness distribution of the model, the rod elements were assigned an artificially reduced elastic modulus (
E = 0.1 MPa) while preserving their mass density. This modeling strategy effectively decouples stiffness contributions from inertial effects within the AMM implementation. Verification through internal force inspections confirmed negligible shear forces and bending moments in the rod elements, demonstrating that they function exclusively as inertial mass carriers. The spatial distribution of the artificial mass levels along the height of the scaled minaret model is illustrated in
Figure 3b.
6.1. Modal Behavior
The first ten mode periods of the 1:10 scale model, as determined through FEM analysis in SAP2000, were compared with those calculated using similarity equations and are presented in
Table 6 and
Table 7.
It should be noted that the analyses conducted in this study are based on linear elastic finite element models. For slender structures such as RC minarets, the seismic response is predominantly governed by the low-order vibration modes, which capture the majority of modal mass participation. Consequently, the accuracy of the dynamic response is sensitive to the mass distribution along the height of the structure. In this context, the artificial mass introduced in the AMM approach plays a critical role in reproducing the inertial characteristics of the prototype and directly influences the modal properties and resulting seismic response. The numerical results presented in the following sections should therefore be interpreted within this framework.
6.2. Time History Analysis
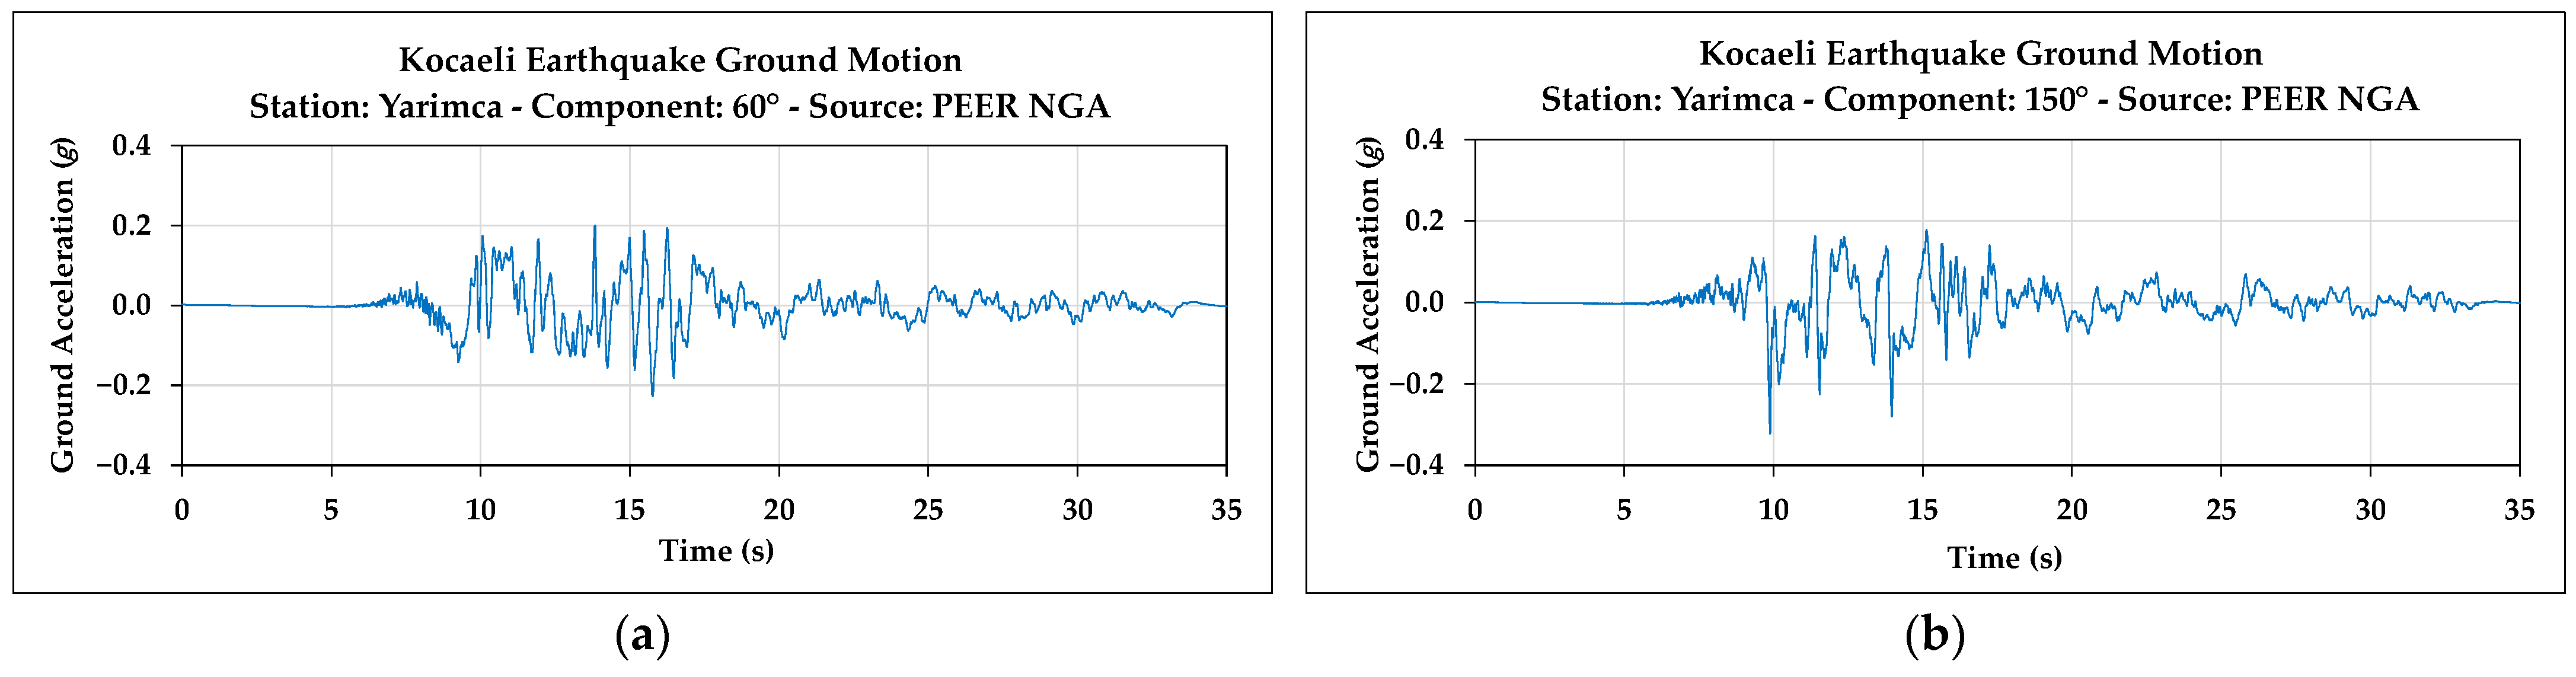
The 1999 Kocaeli earthquake, a significant seismic event in Türkiye’s recent history, was selected as the primary input ground motion for the detailed time history analysis (THA) conducted using SAP2000. This record was chosen as a representative case study due to its relatively strong intermediate-to-long period spectral content, which is particularly relevant for the dynamic response of slender structures such as RC minarets.
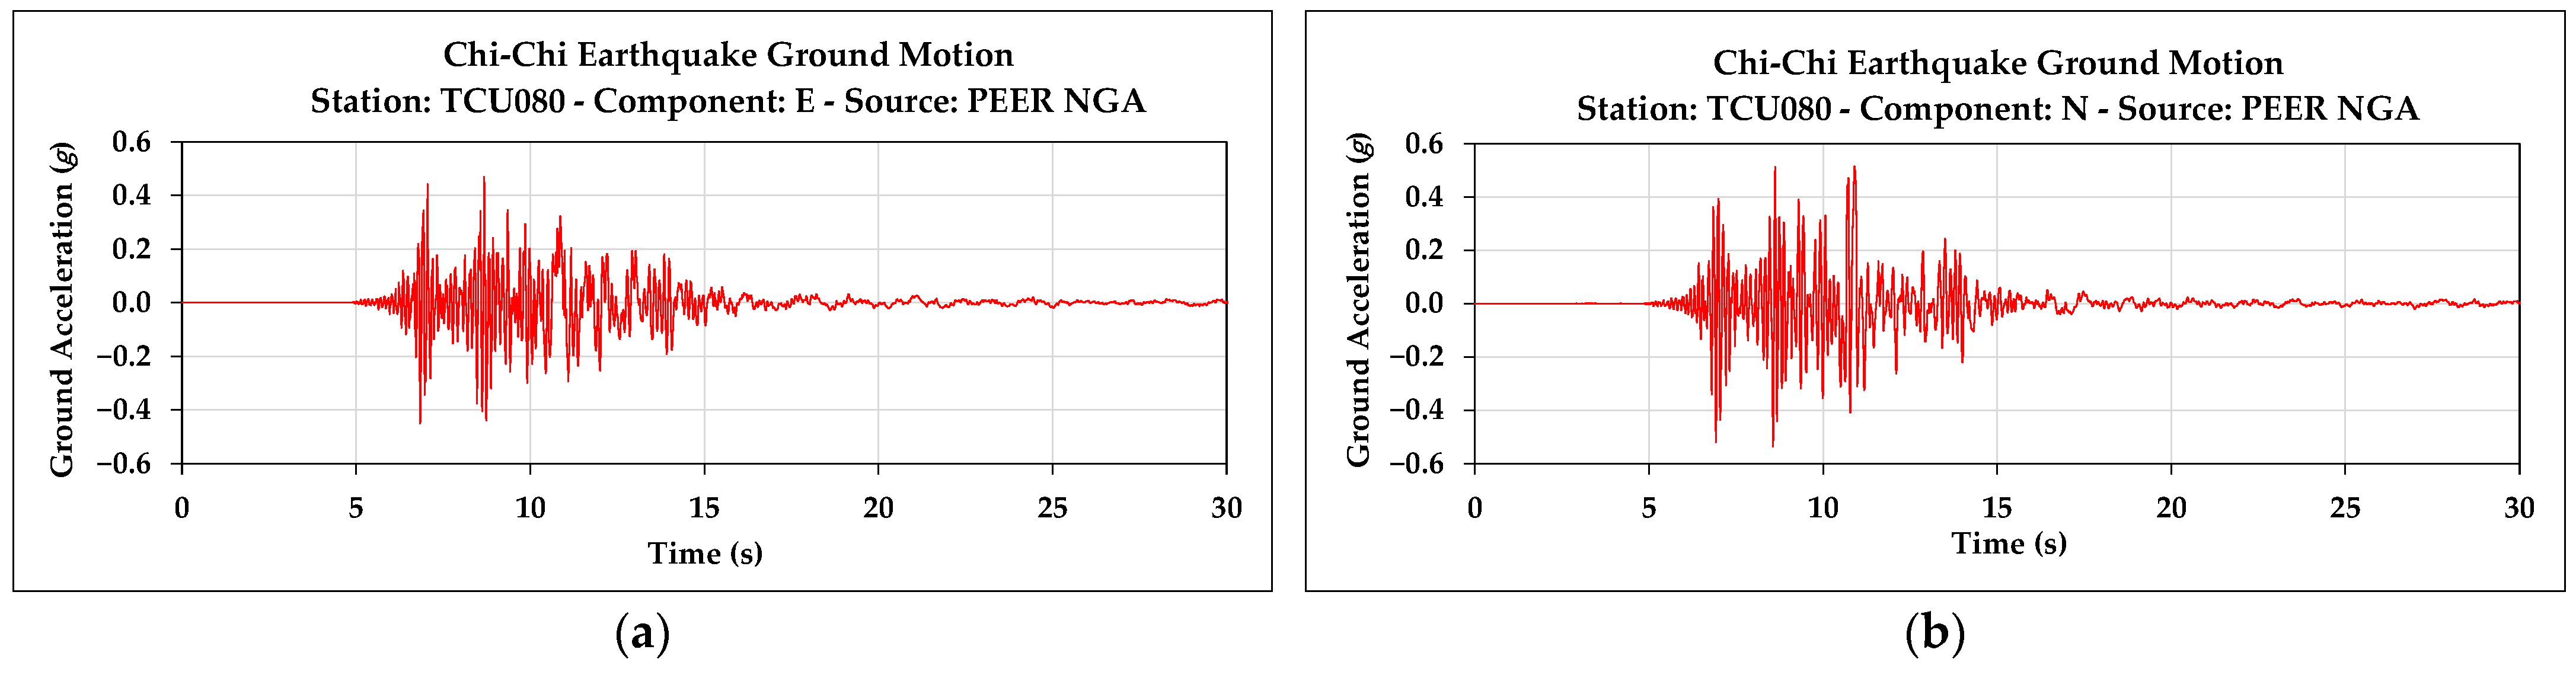
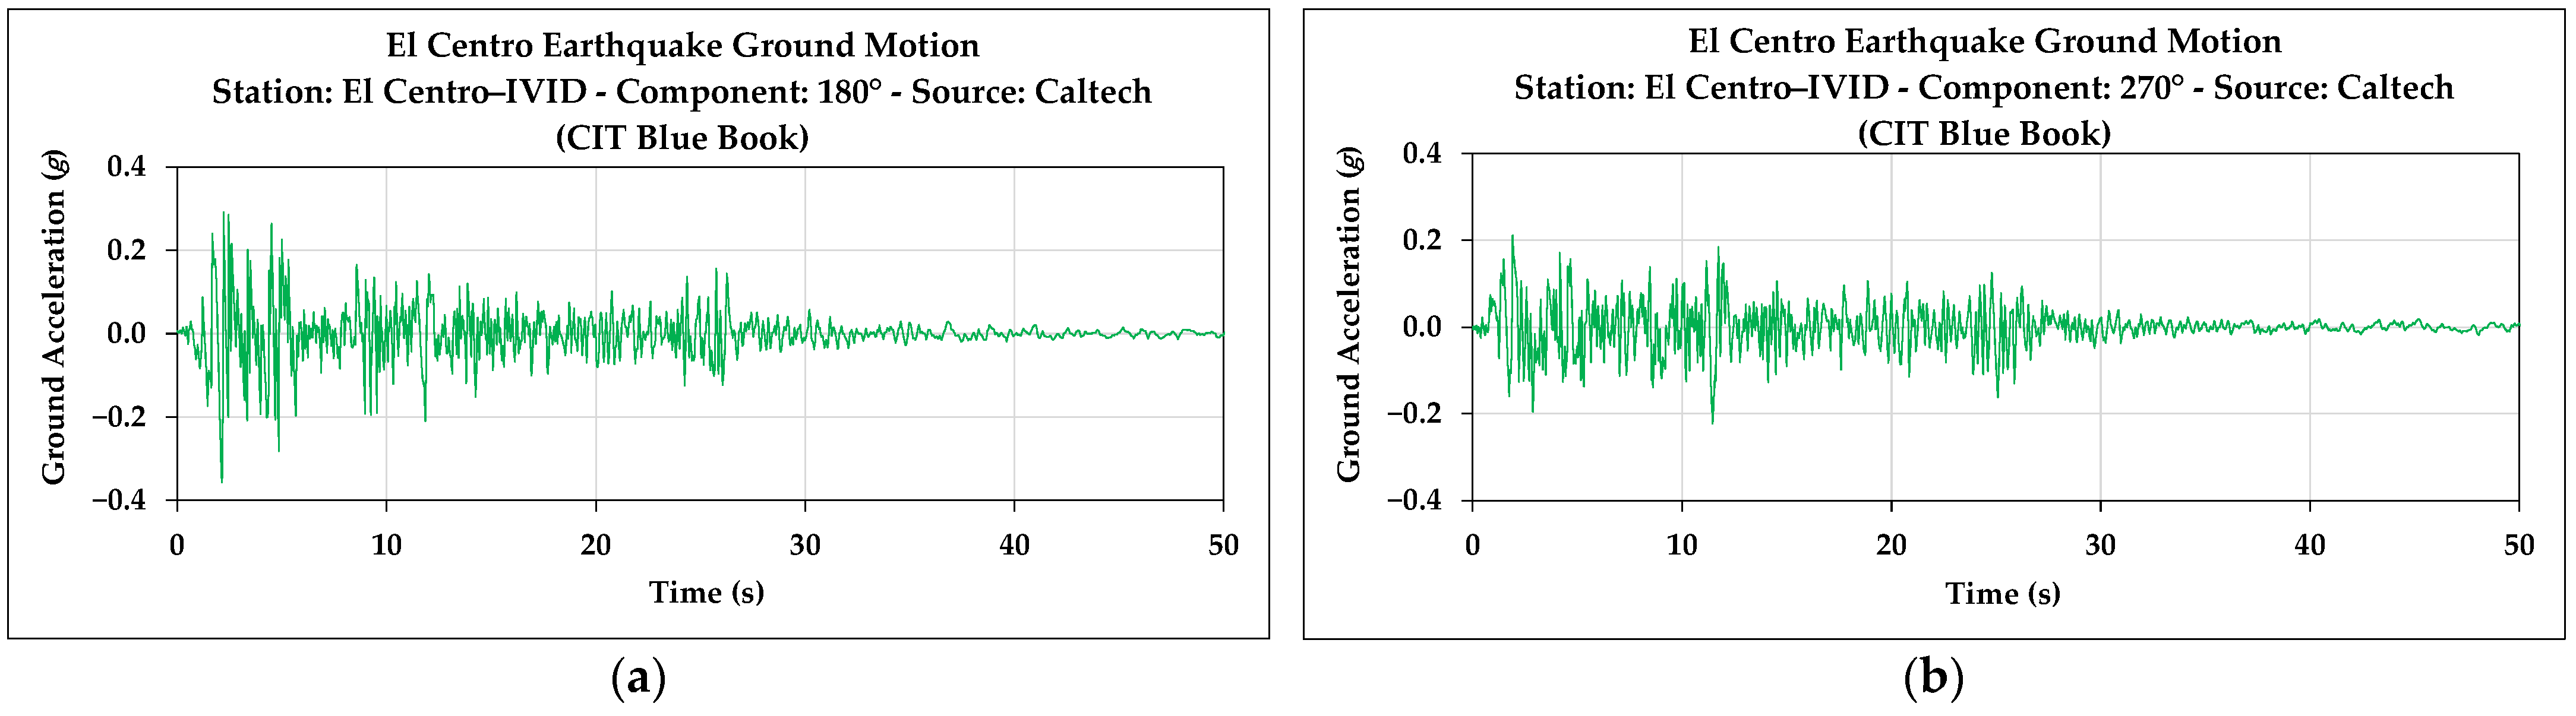
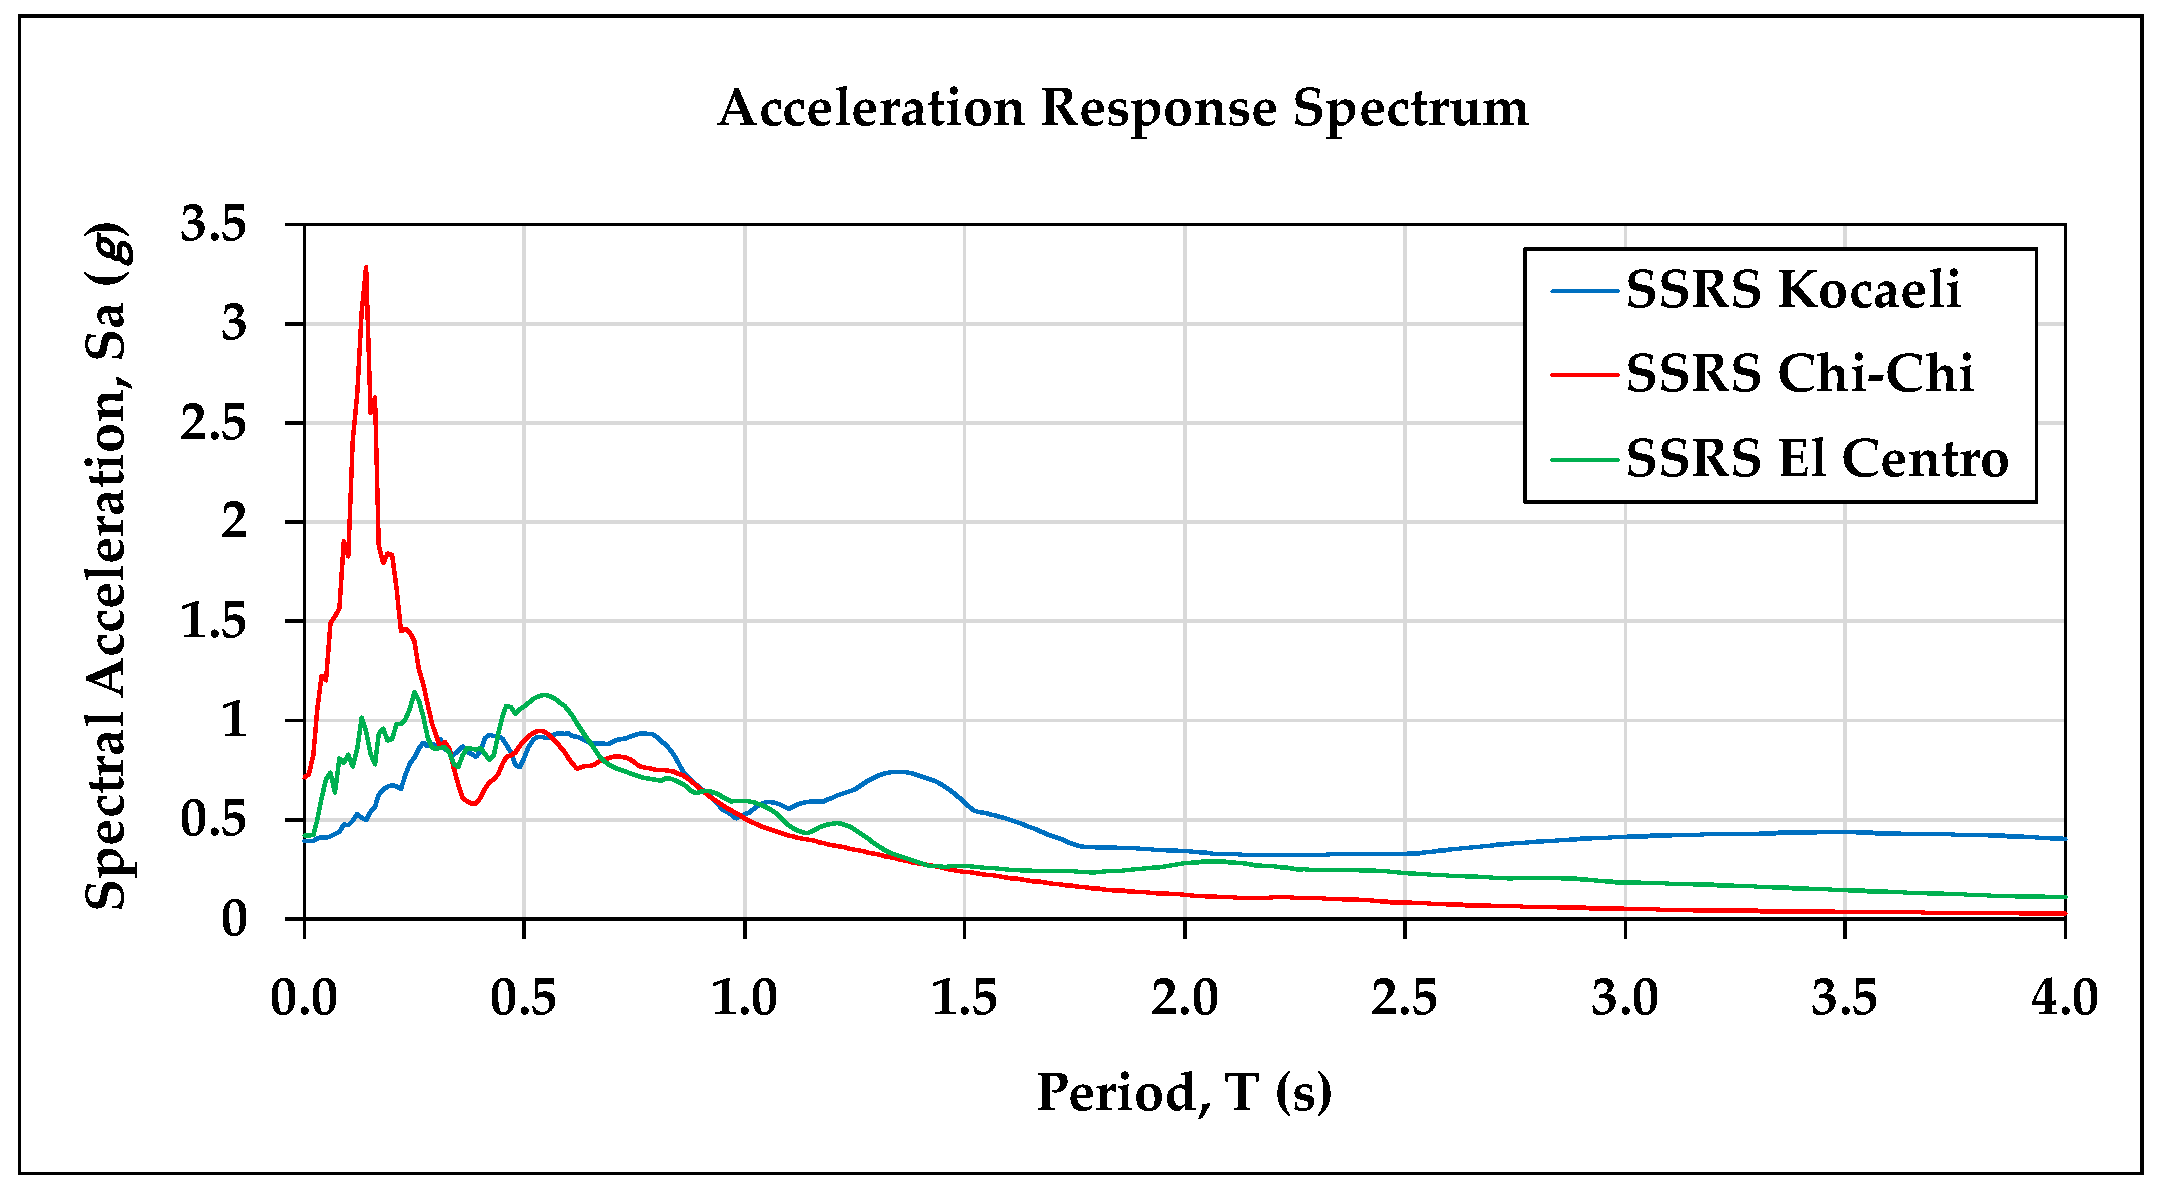
In order to assess the generalizability of the findings and to ensure that the conclusions are not restricted to a single type of seismic input, additional ground motion records with distinct spectral characteristics were considered. Specifically, the 1999 Chi-Chi earthquake, representing a near-fault pulse-like motion, and the 1940 El Centro earthquake, representing a broadband motion with dominant short-to-intermediate period content, were selected. The combined horizontal response spectra (SSRS) of the selected records are presented to illustrate their contrasting frequency characteristics and to justify their suitability for comparative assessment.
Although all three ground motions were employed to evaluate the robustness of the proposed physical modeling approaches, the Kocaeli earthquake was retained as the main case study for detailed response presentation. The Kocaeli and Chi-Chi earthquake records were obtained from the Pacific Earthquake Engineering Research Center (PEER) [
28], whereas the El Centro records were obtained from the Caltech strong motion database (Blue Book series) and accessed via the Strong Motion Virtual Data Center (VDC) [
29]. Each earthquake record consists of two orthogonal horizontal components, which were applied in the
x and
y directions of the structural model to simulate a realistic seismic excitation scenario. The acceleration time histories of the selected ground motions are presented in
Figure 4,
Figure 5 and
Figure 6, whereas the corresponding SSRS acceleration response spectra are shown in
Figure 7.
To enable a meaningful comparison between the dynamic response of the full-scale structure and its corresponding physical models, the recorded acceleration time histories were scaled in both amplitude and time in accordance with the established dynamic similarity factors. Time scaling was performed using the time scale factor (
SFT) derived from the selected physical modeling approach, whereas acceleration scaling was applied using the corresponding acceleration scale factor (
SFa), as summarized in
Table 5. Accordingly, the scaled ground motion was obtained by applying t
m =
SFT·t
p and a
m =
SFa·a
p. This adjustment ensures that the input ground motion corresponds to the dynamic characteristics of the 1:10 scaled models constructed based on the AMM and the NGM approaches, utilizing two distinct mixtures, Mix-1 and Mix-2.
Time history analyses were performed using a linear elastic formulation based on modal superposition in SAP2000. A constant modal damping ratio of 5% was assigned directly within the time history load case. The same damping assumption was applied consistently to the prototype and all scaled model cases.
A comparative assessment was performed to evaluate the effectiveness of the two modeling approaches (NGM and AMM) and the selected construction materials (Mix-1 and Mix-2) in reproducing the full-scale dynamic response of the minaret. The key response parameters considered were the maximum top displacement and peak top acceleration in both the
x and
y directions, as these quantities represent critical indicators of seismic performance for slender structures such as minarets. The results, summarized in
Table 8, show the comparison between the expected scaled values based on theoretical similarity laws (labeled “Similarity”) and the analytical results obtained from SAP2000 simulations. For instance, the top displacement in the negative
x direction for the 1:10 NGM using Mix-1 was 9.65 mm, whereas the theoretically expected value based on the full-scale model was 9.40 mm. This corresponds to a surplus of 2.68%.
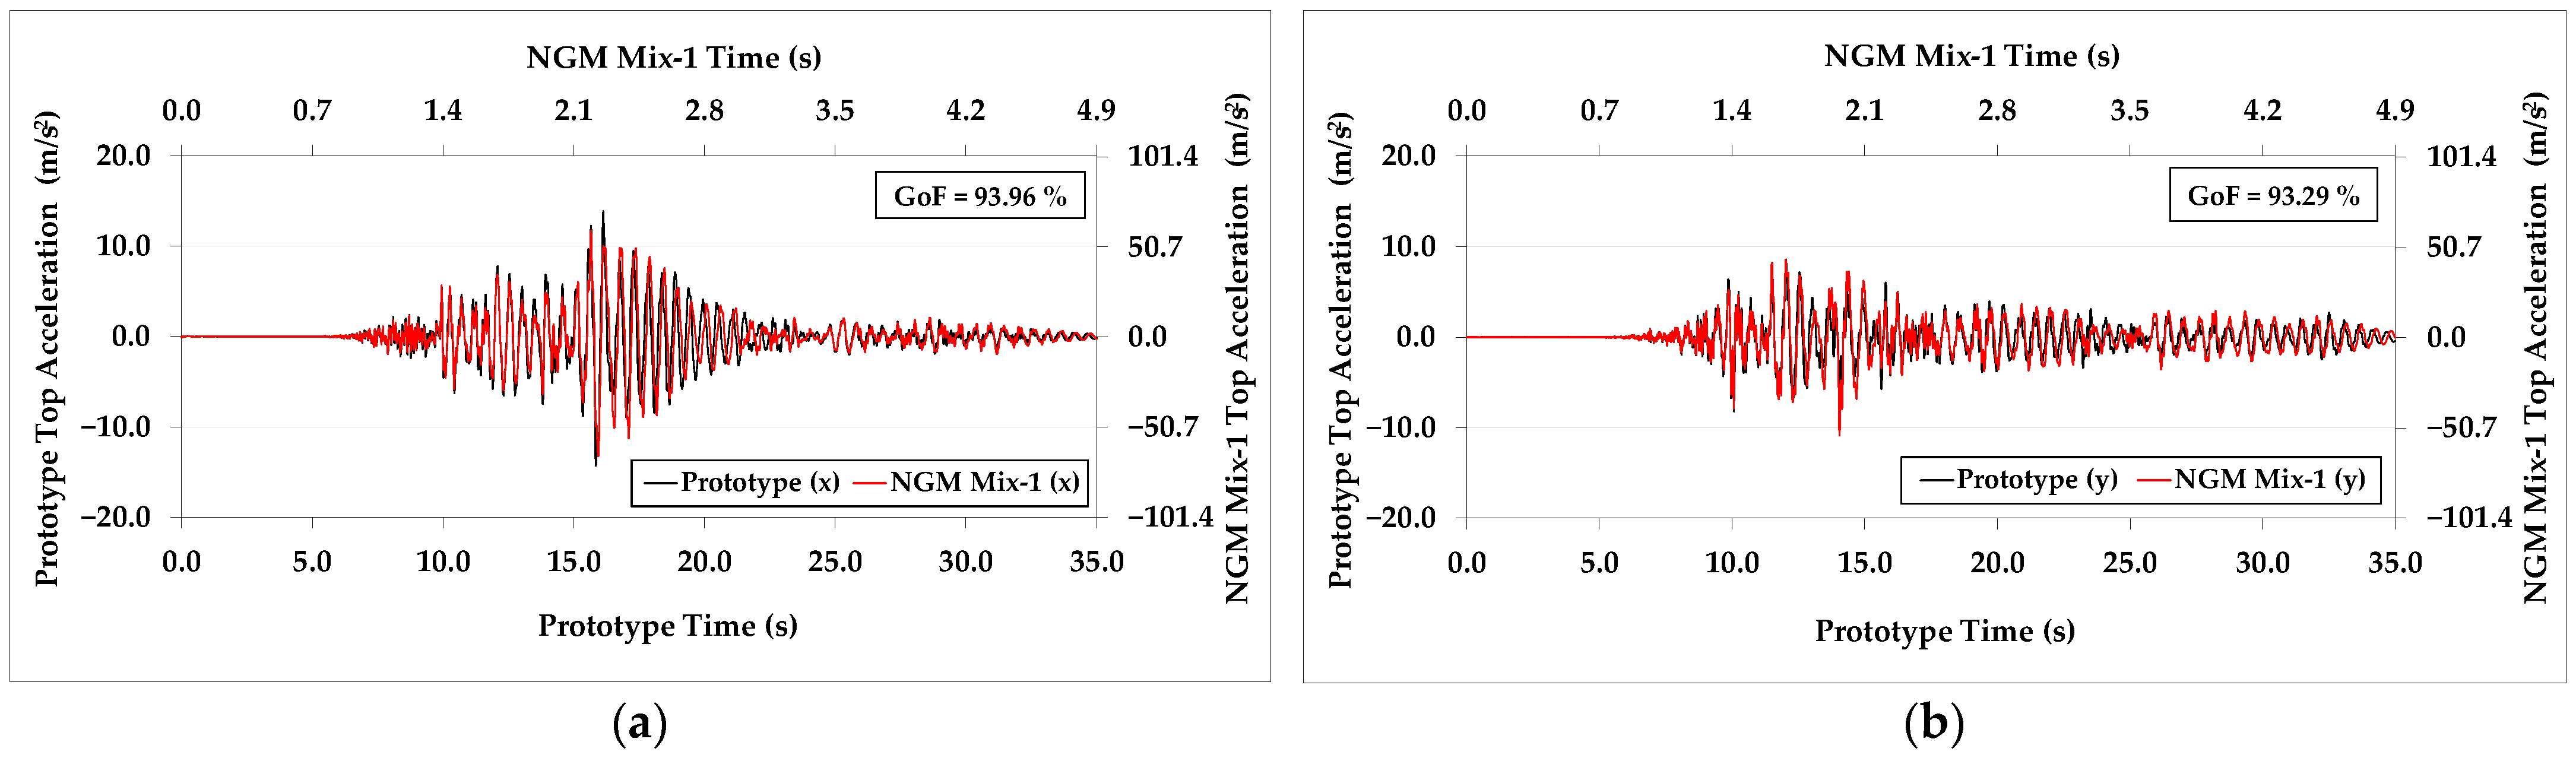
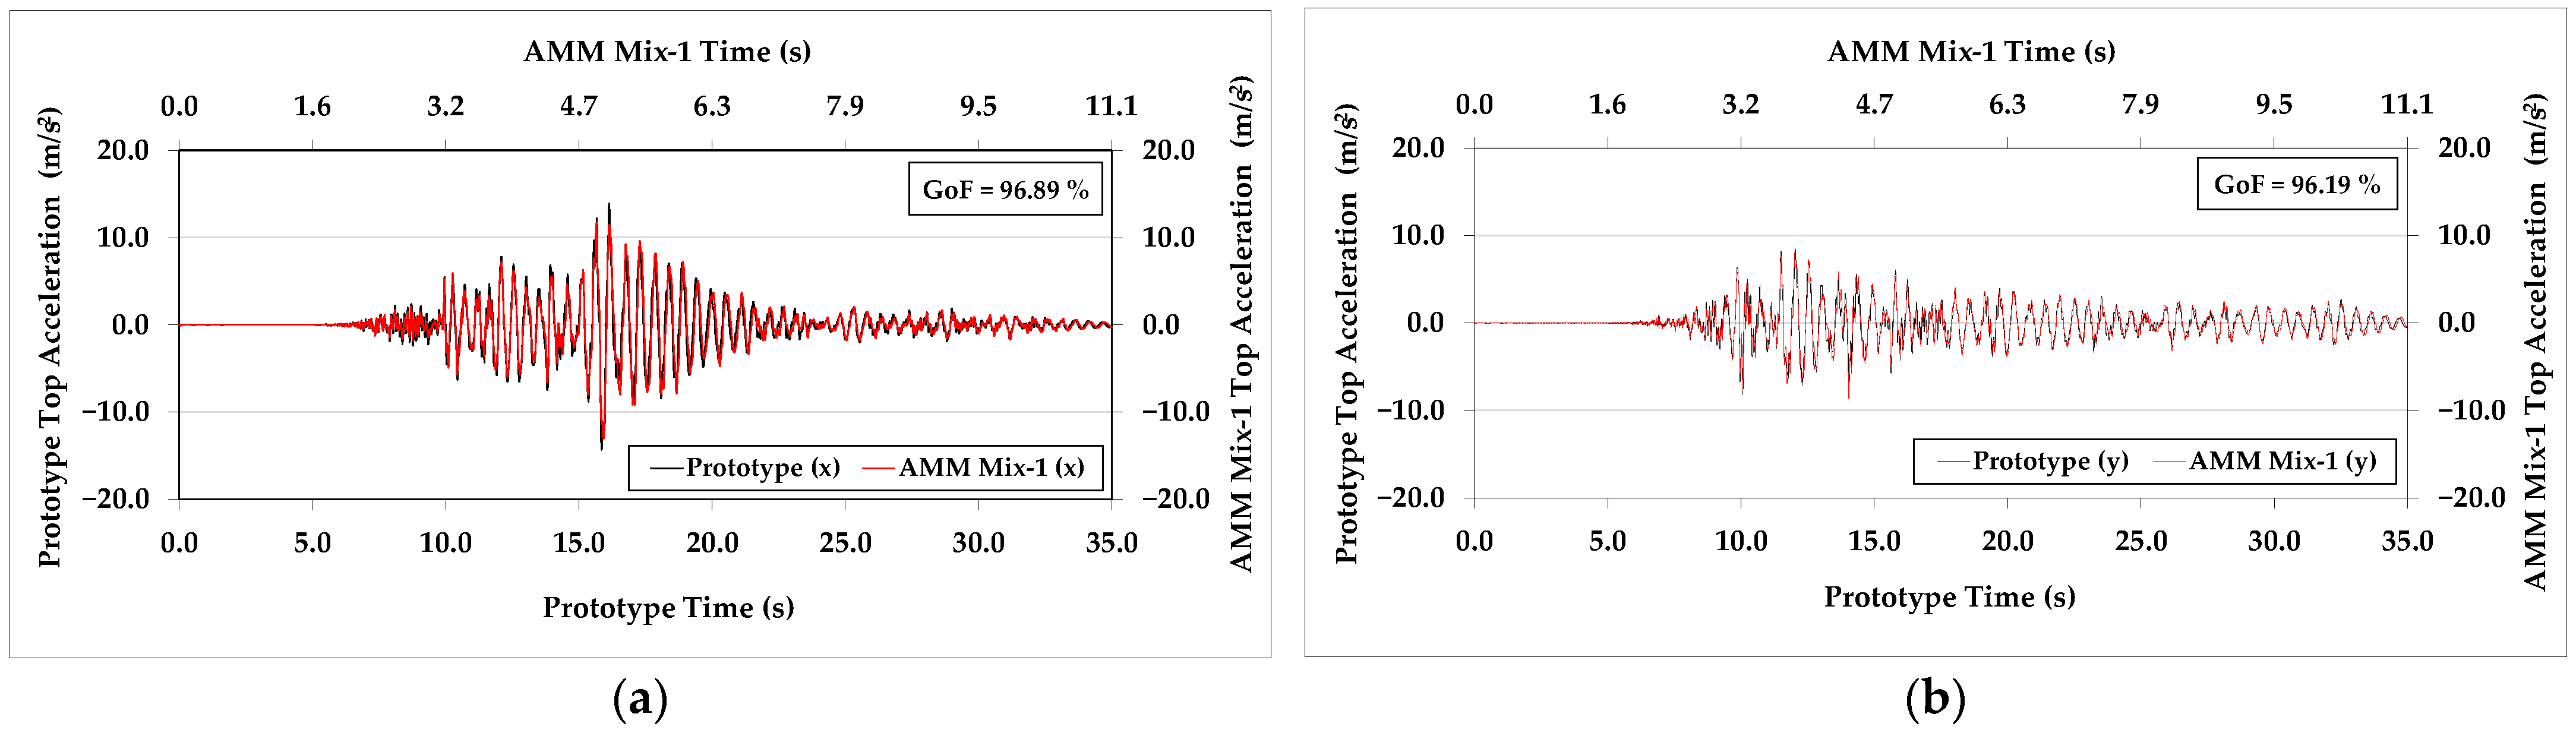
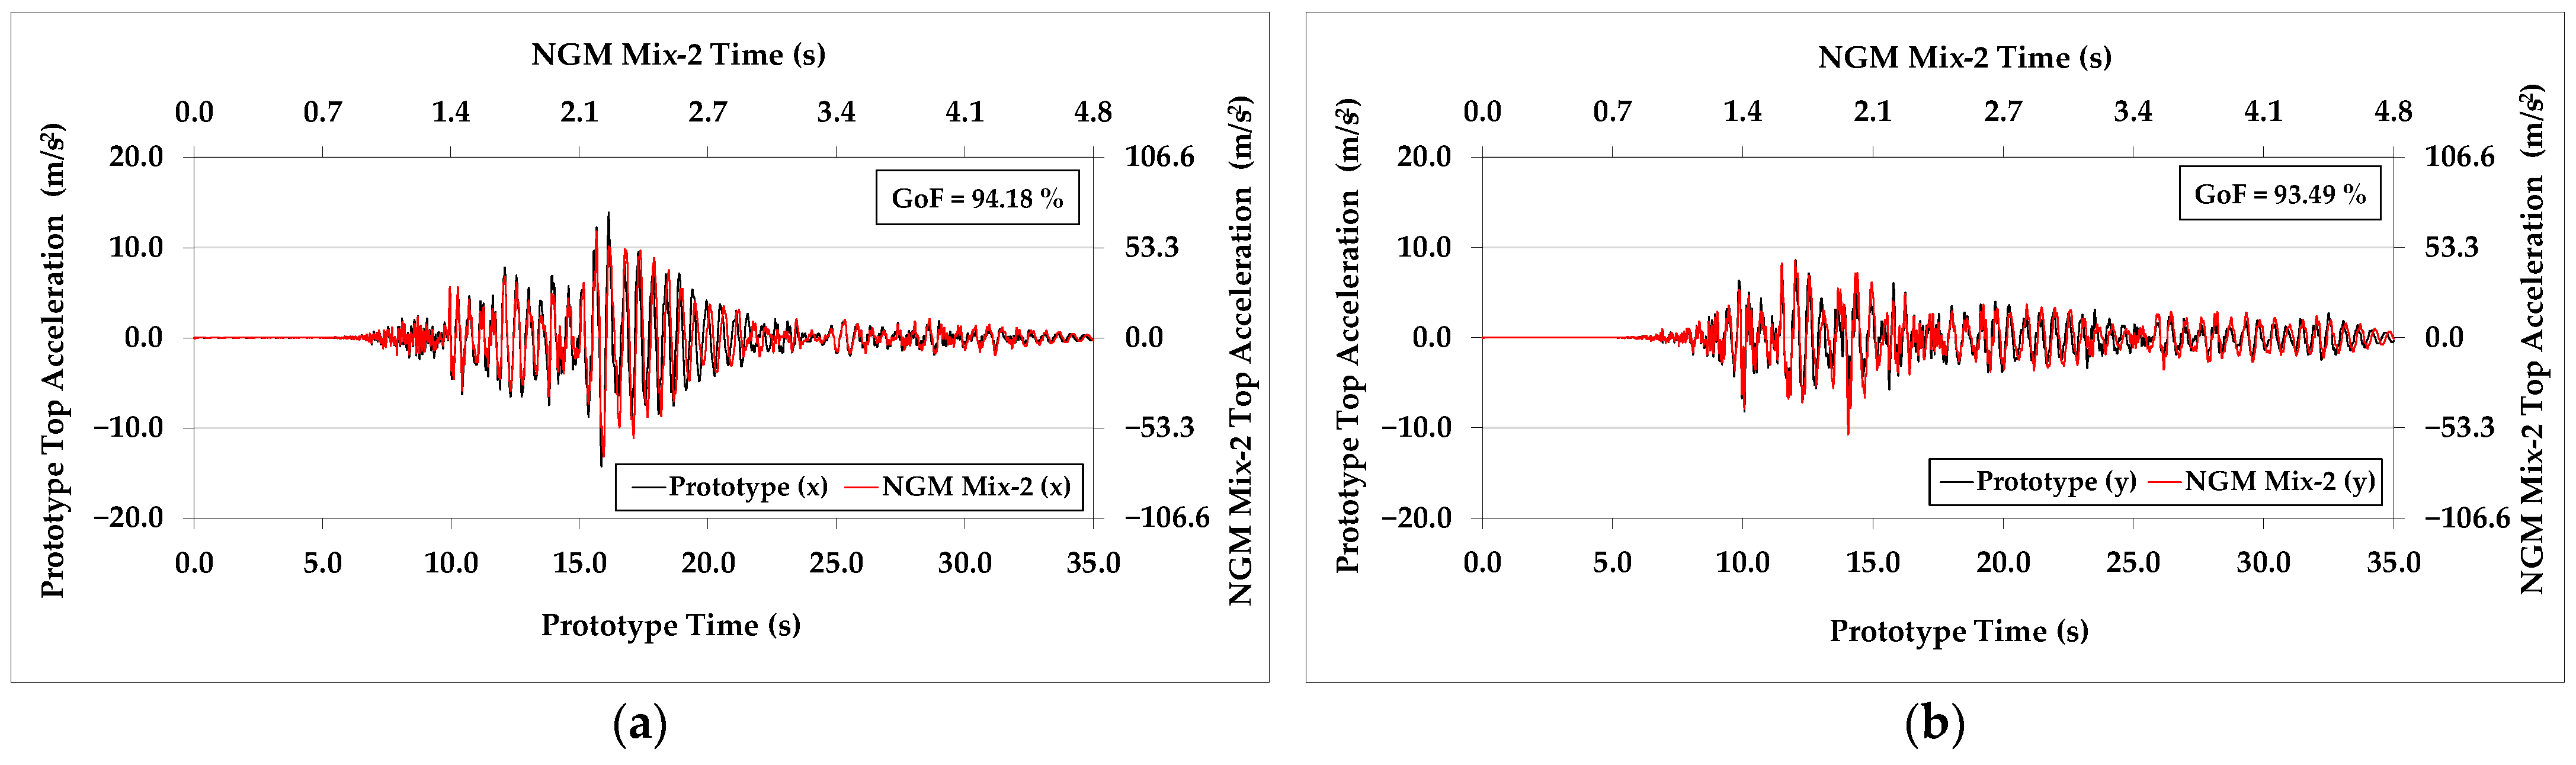
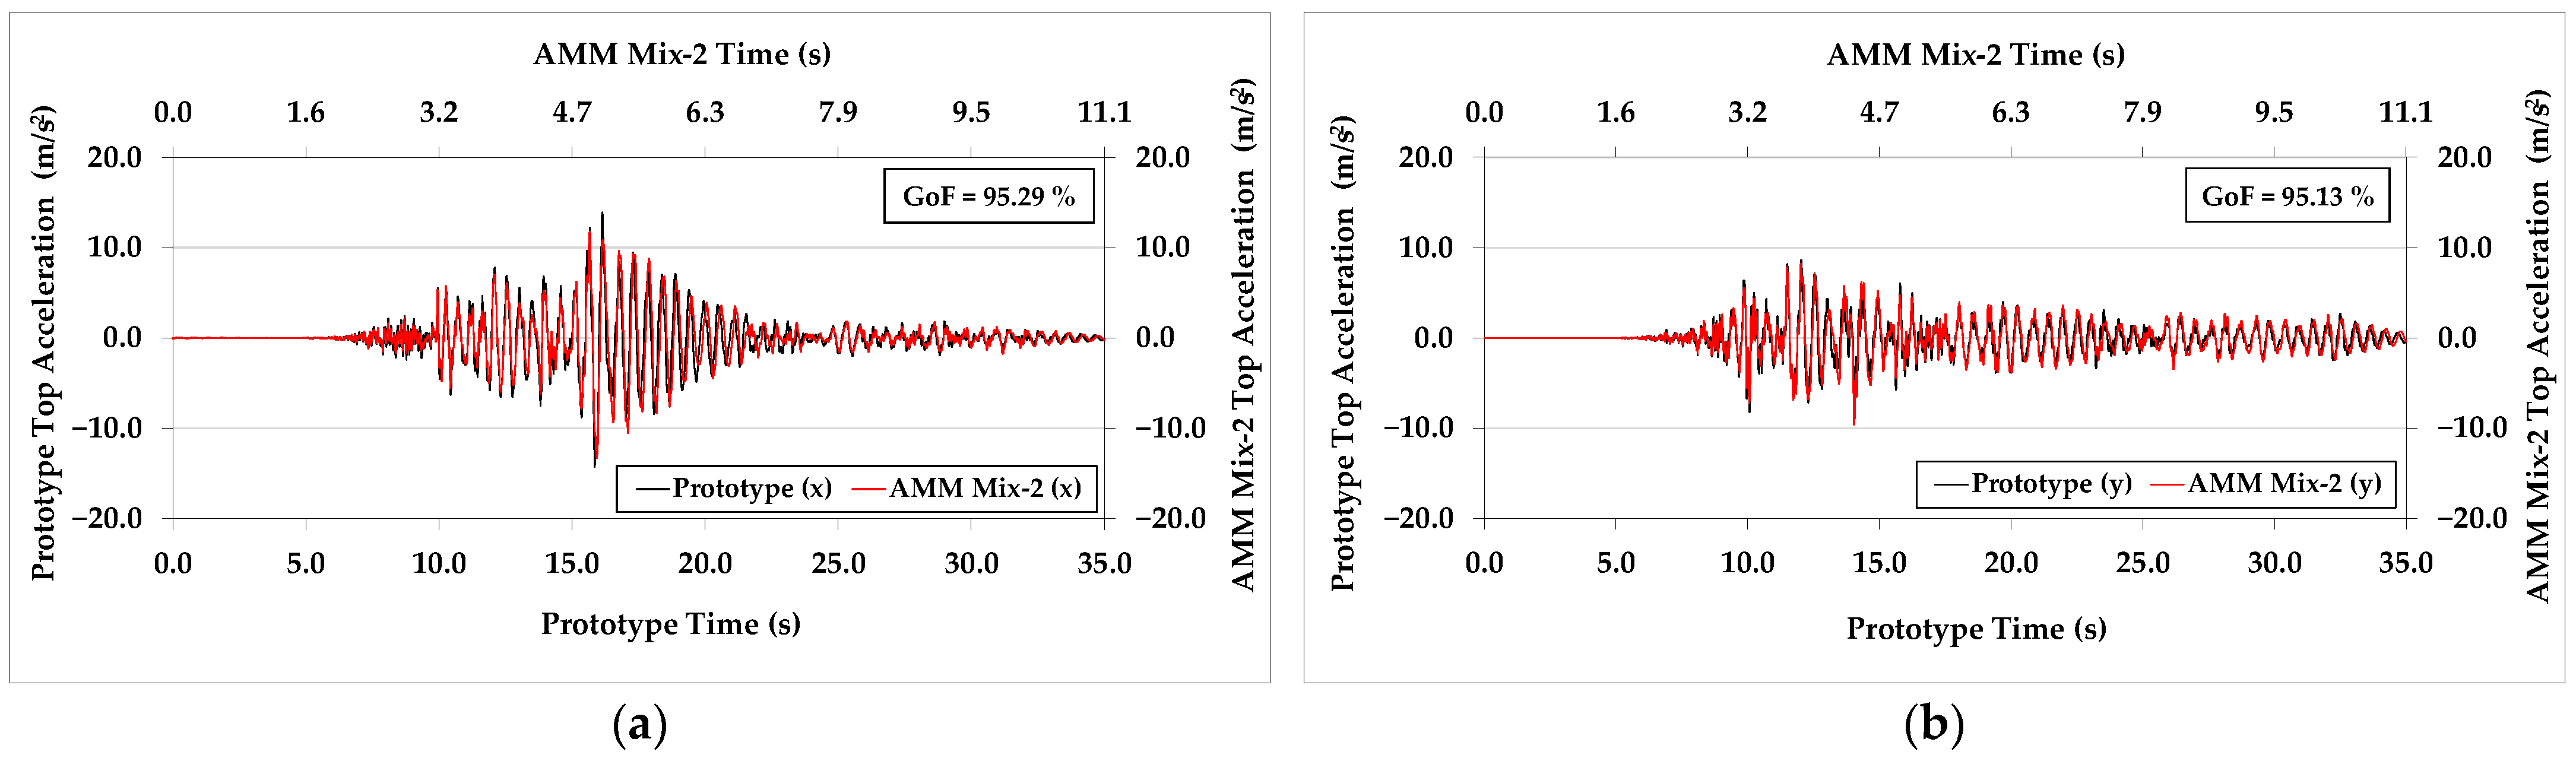
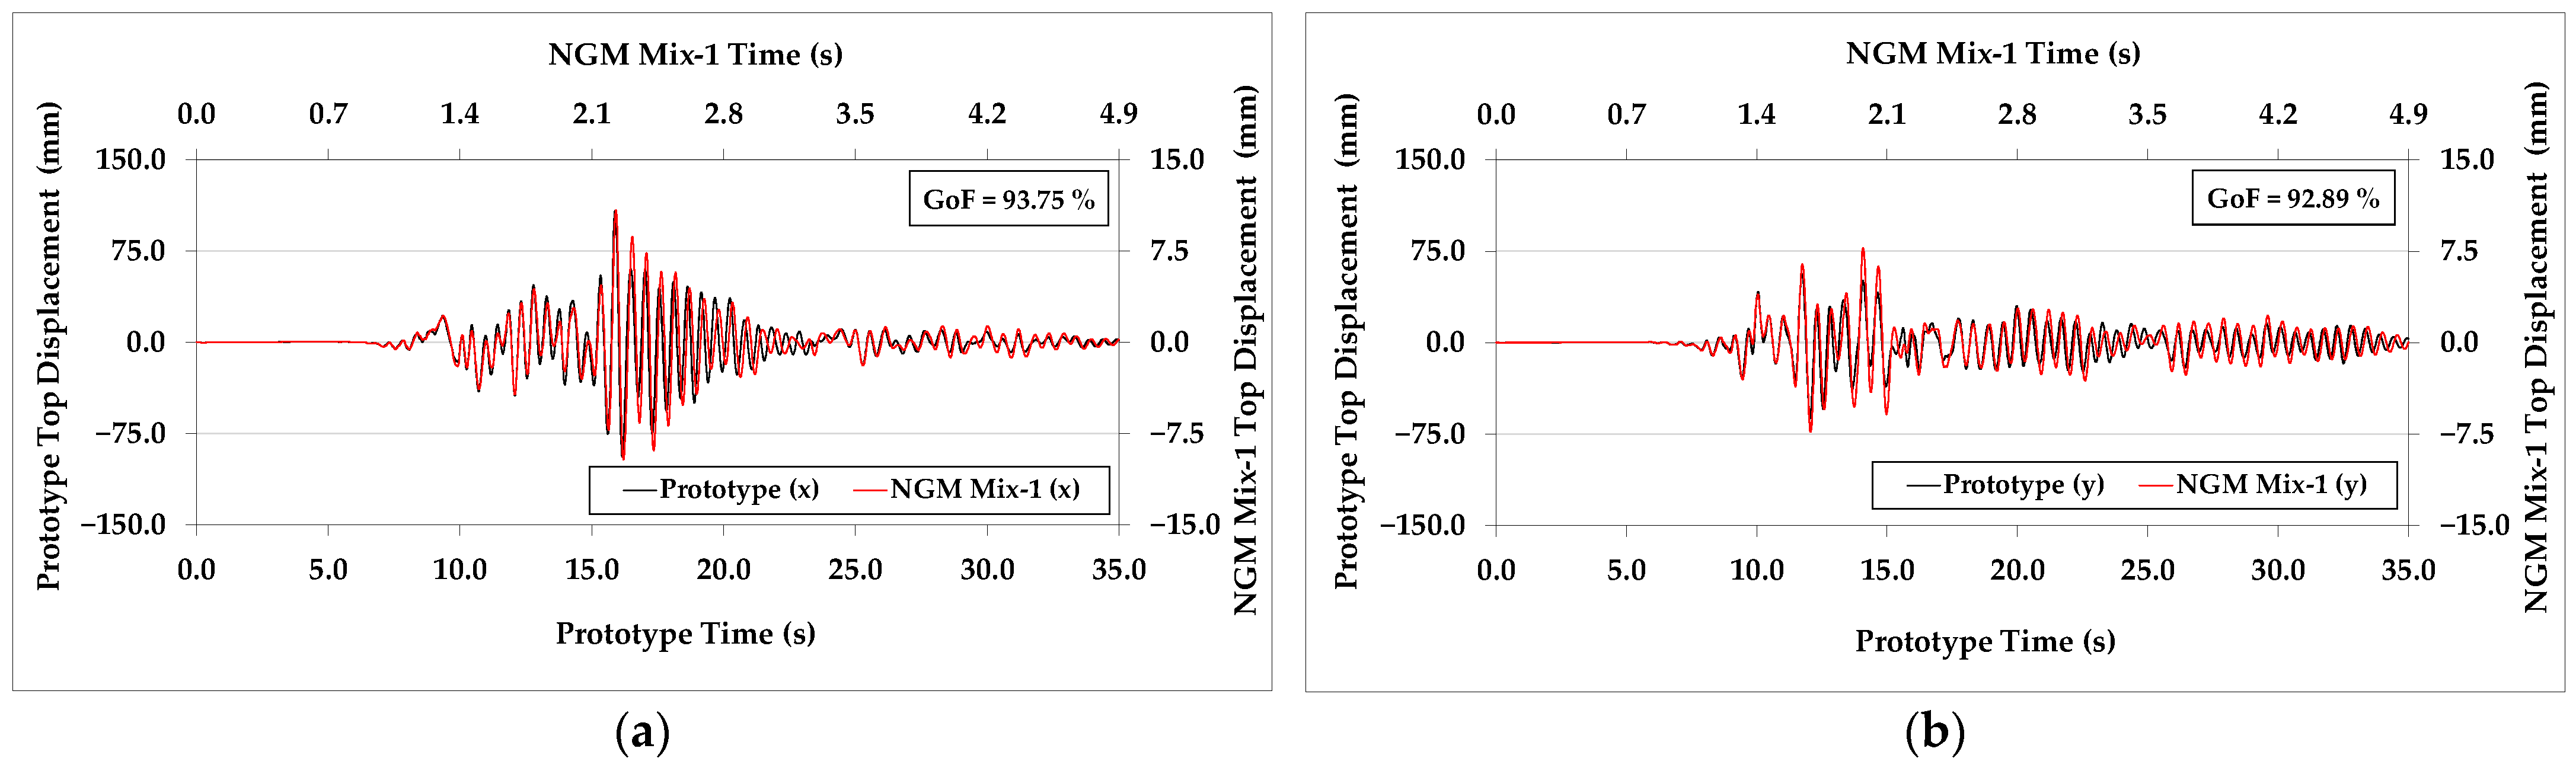
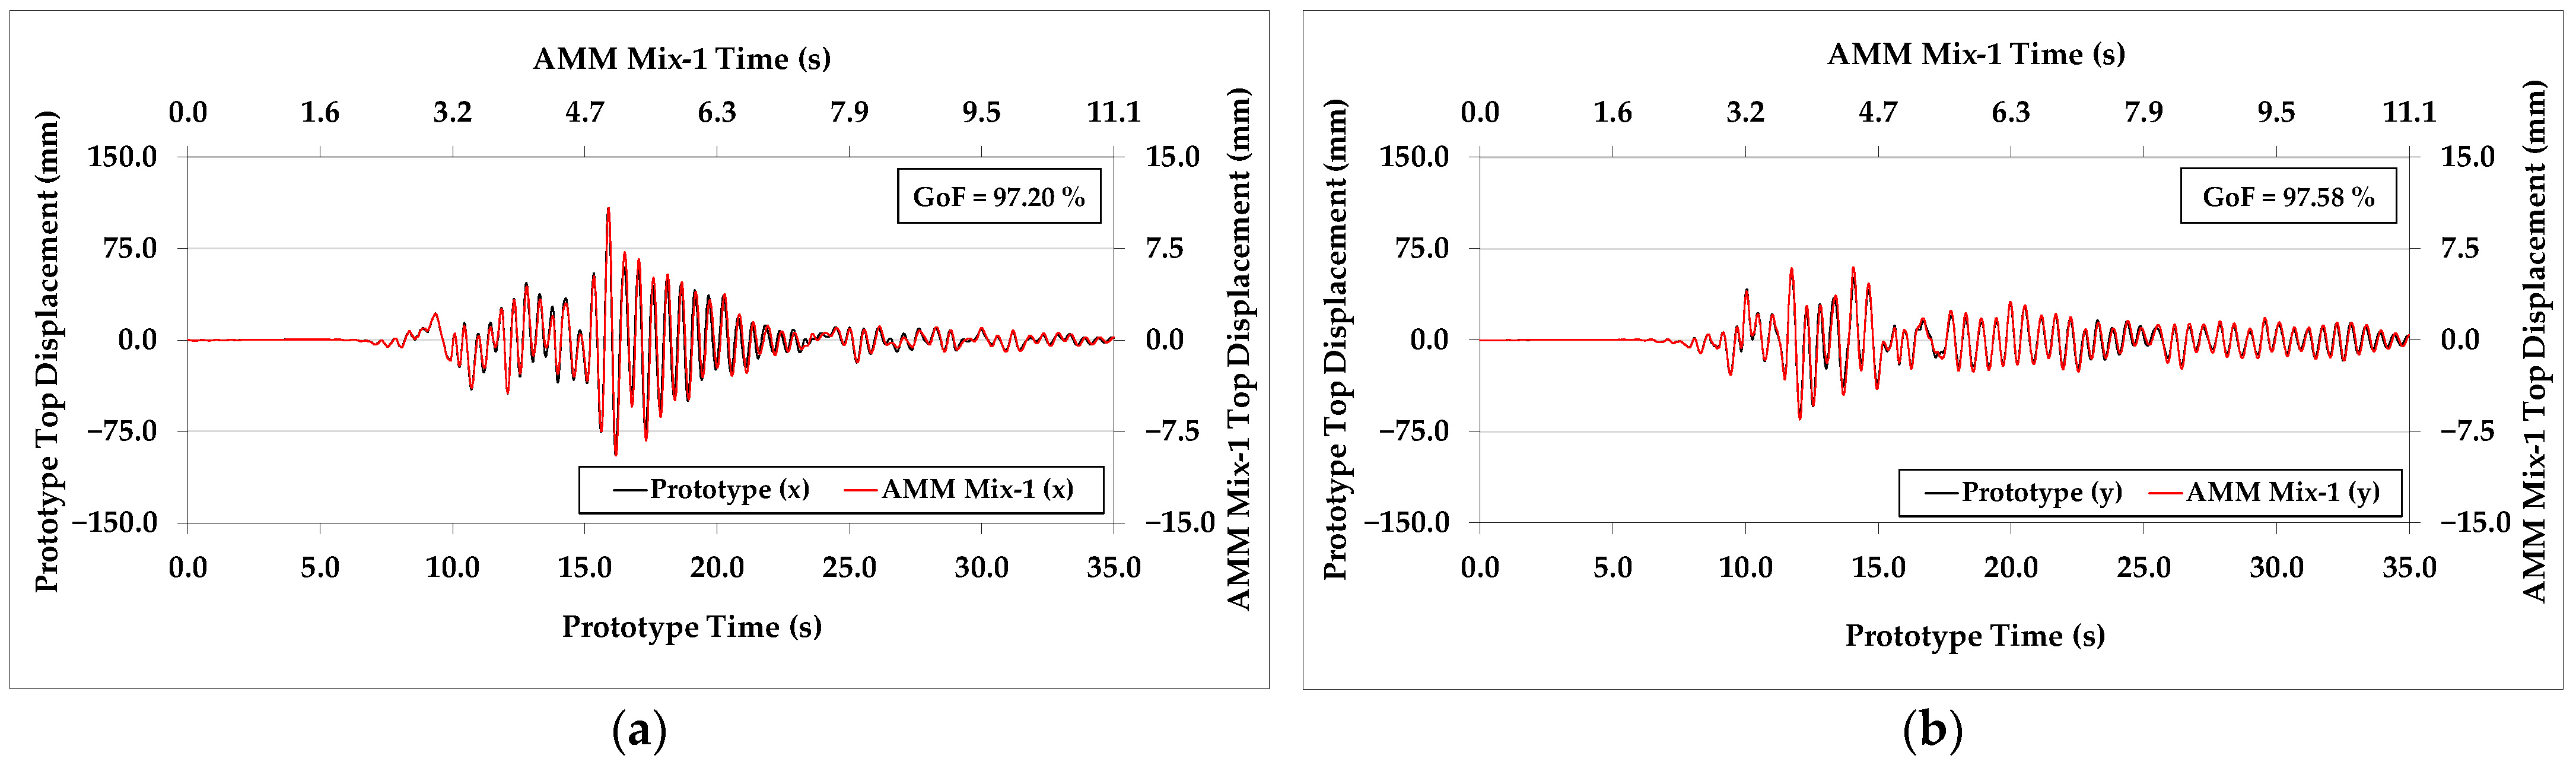
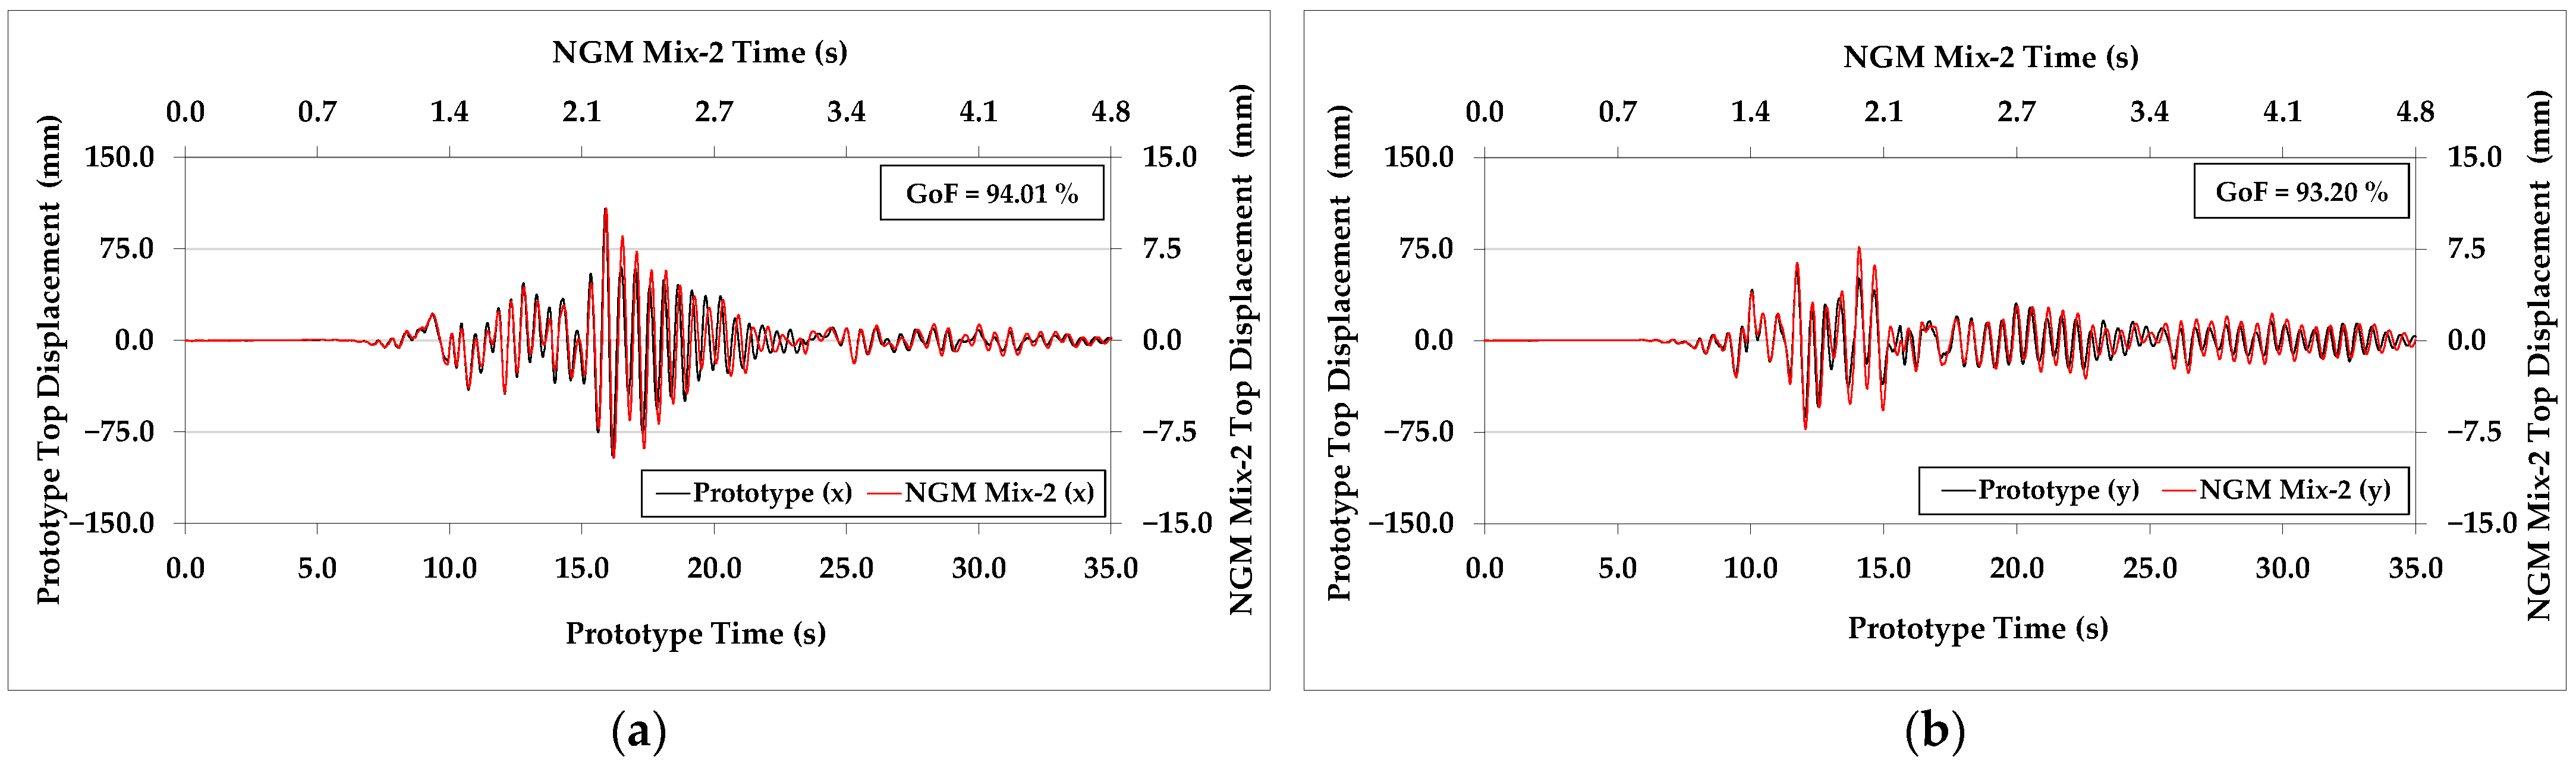
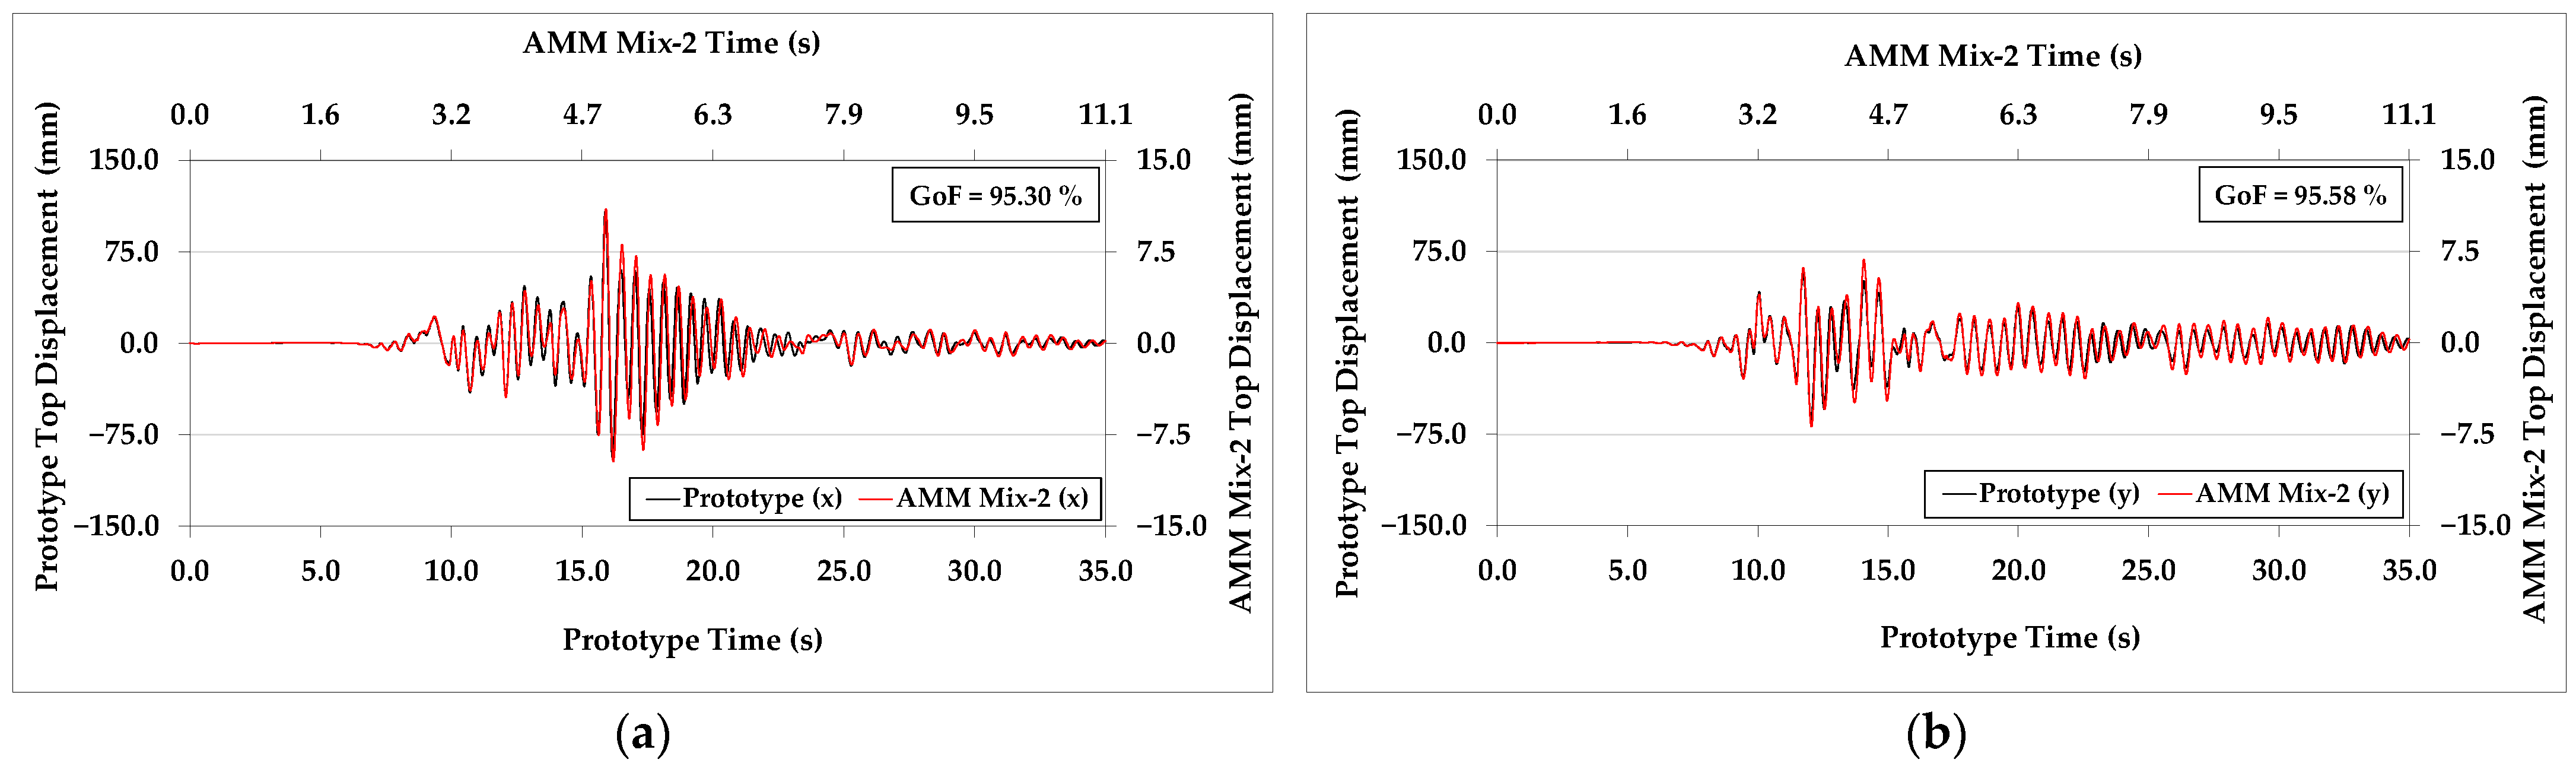
In addition to peak response comparisons, a direct time history comparison was carried out to further evaluate the ability of the scaled models to reproduce the temporal evolution of the full-scale response. For this purpose, the acceleration and displacement time histories at the top point of the minaret were extracted from the linear elastic time-history analyses for both the prototype and the scaled models. The scaled responses were transformed back to the prototype scale using the corresponding similitude factors and were plotted alongside the full-scale responses for both horizontal directions. Representative comparisons of top acceleration and top displacement histories for the AMM and NGM models using Mix-1 and Mix-2 are presented in
Figure 8,
Figure 9,
Figure 10,
Figure 11,
Figure 12,
Figure 13,
Figure 14 and
Figure 15. For these figures, dual vertical and horizontal axes are used. The left
y-axis and bottom
x-axis correspond to the prototype response, whereas the right
y-axis and top
x-axis represent the scaled model response according to the adopted similitude factors (
SFa,
SFT, and
SFL).
To quantitatively assess the level of agreement over the entire duration of the seismic records, a goodness of fit (GoF) index, defined as 100·(1-NRMSE), was adopted as an objective statistical measure, where NRMSE denotes the normalized root mean square error [
30]. In this formulation, higher GoF values indicate better agreement between the compared responses. For clarity and ease of interpretation, the GoF value corresponding to each analyzed case is explicitly reported on the associated acceleration and displacement time history plot.
The GoF values obtained in this study indicate a consistently high level of agreement, confirming that the scaled models are capable of reproducing the dominant response characteristics of the prototype. These comparisons demonstrate that both modeling approaches successfully capture the overall amplitude and phase characteristics of the prototype response with acceptable accuracy. Minor discrepancies observed in peak values and local oscillations are mainly attributed to differences in mass distribution and material properties between the scaled and full-scale models. Nevertheless, the close agreement observed in the dominant response features confirms that the scaled models effectively represent the essential dynamic behavior of the full-scale minaret under seismic excitation.
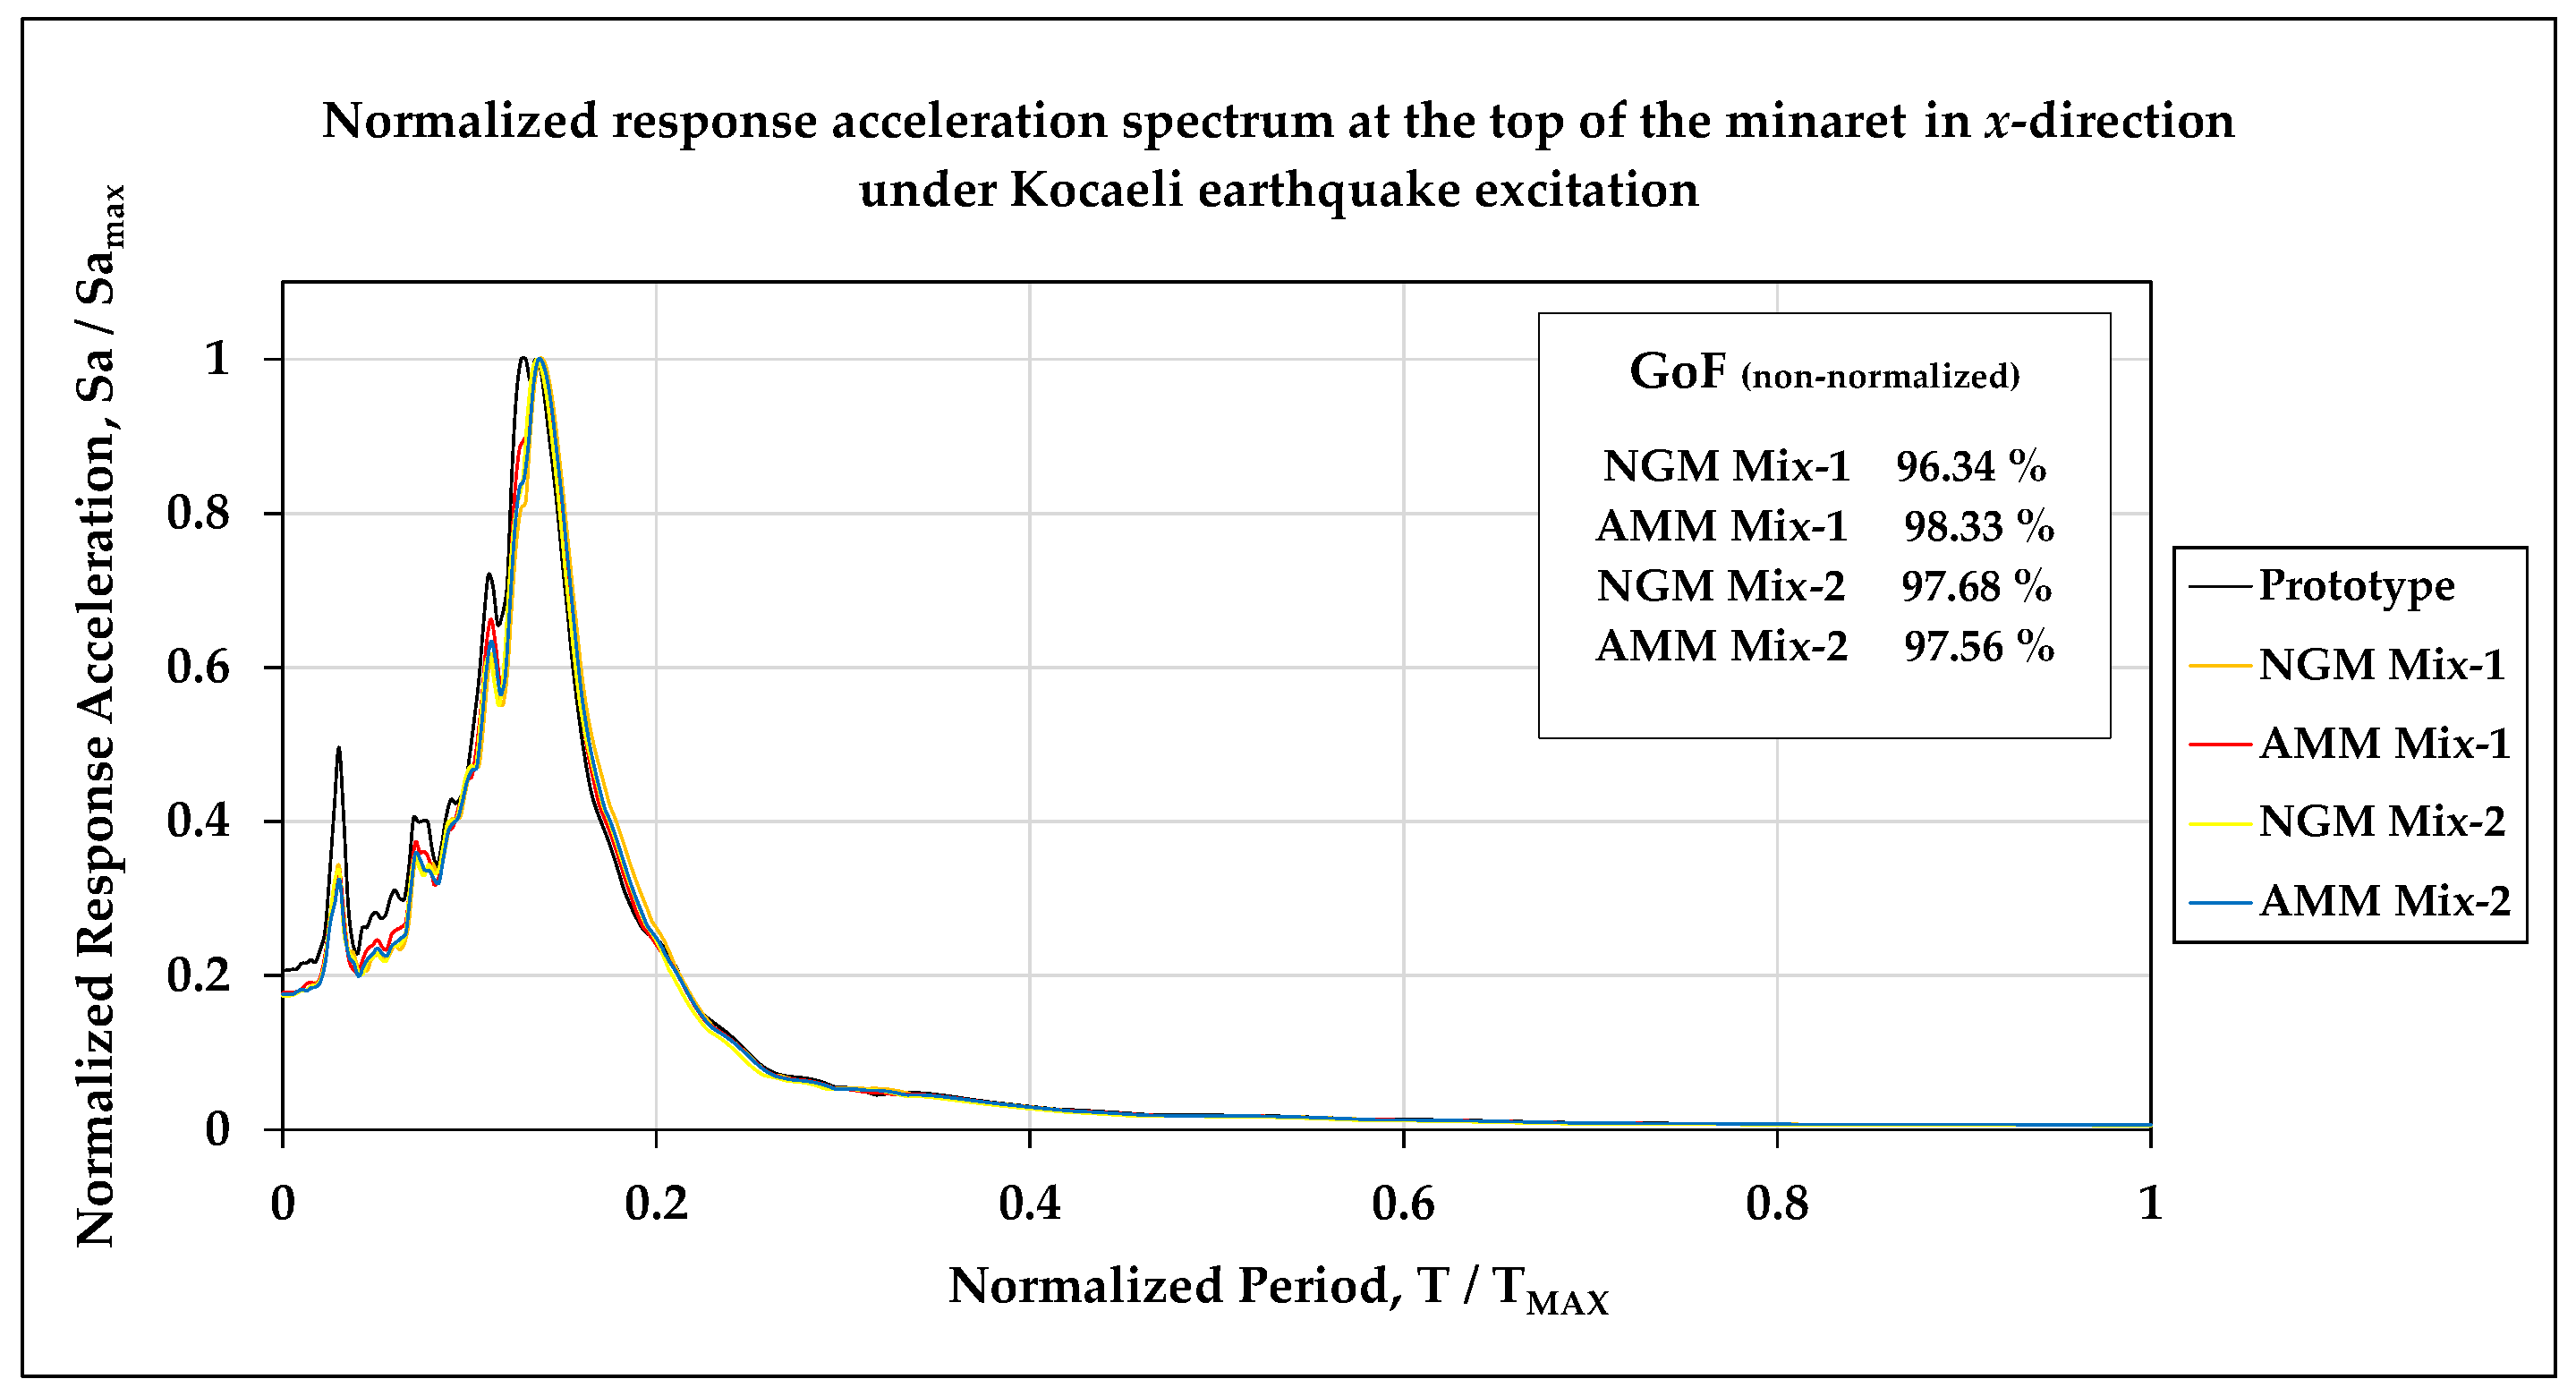
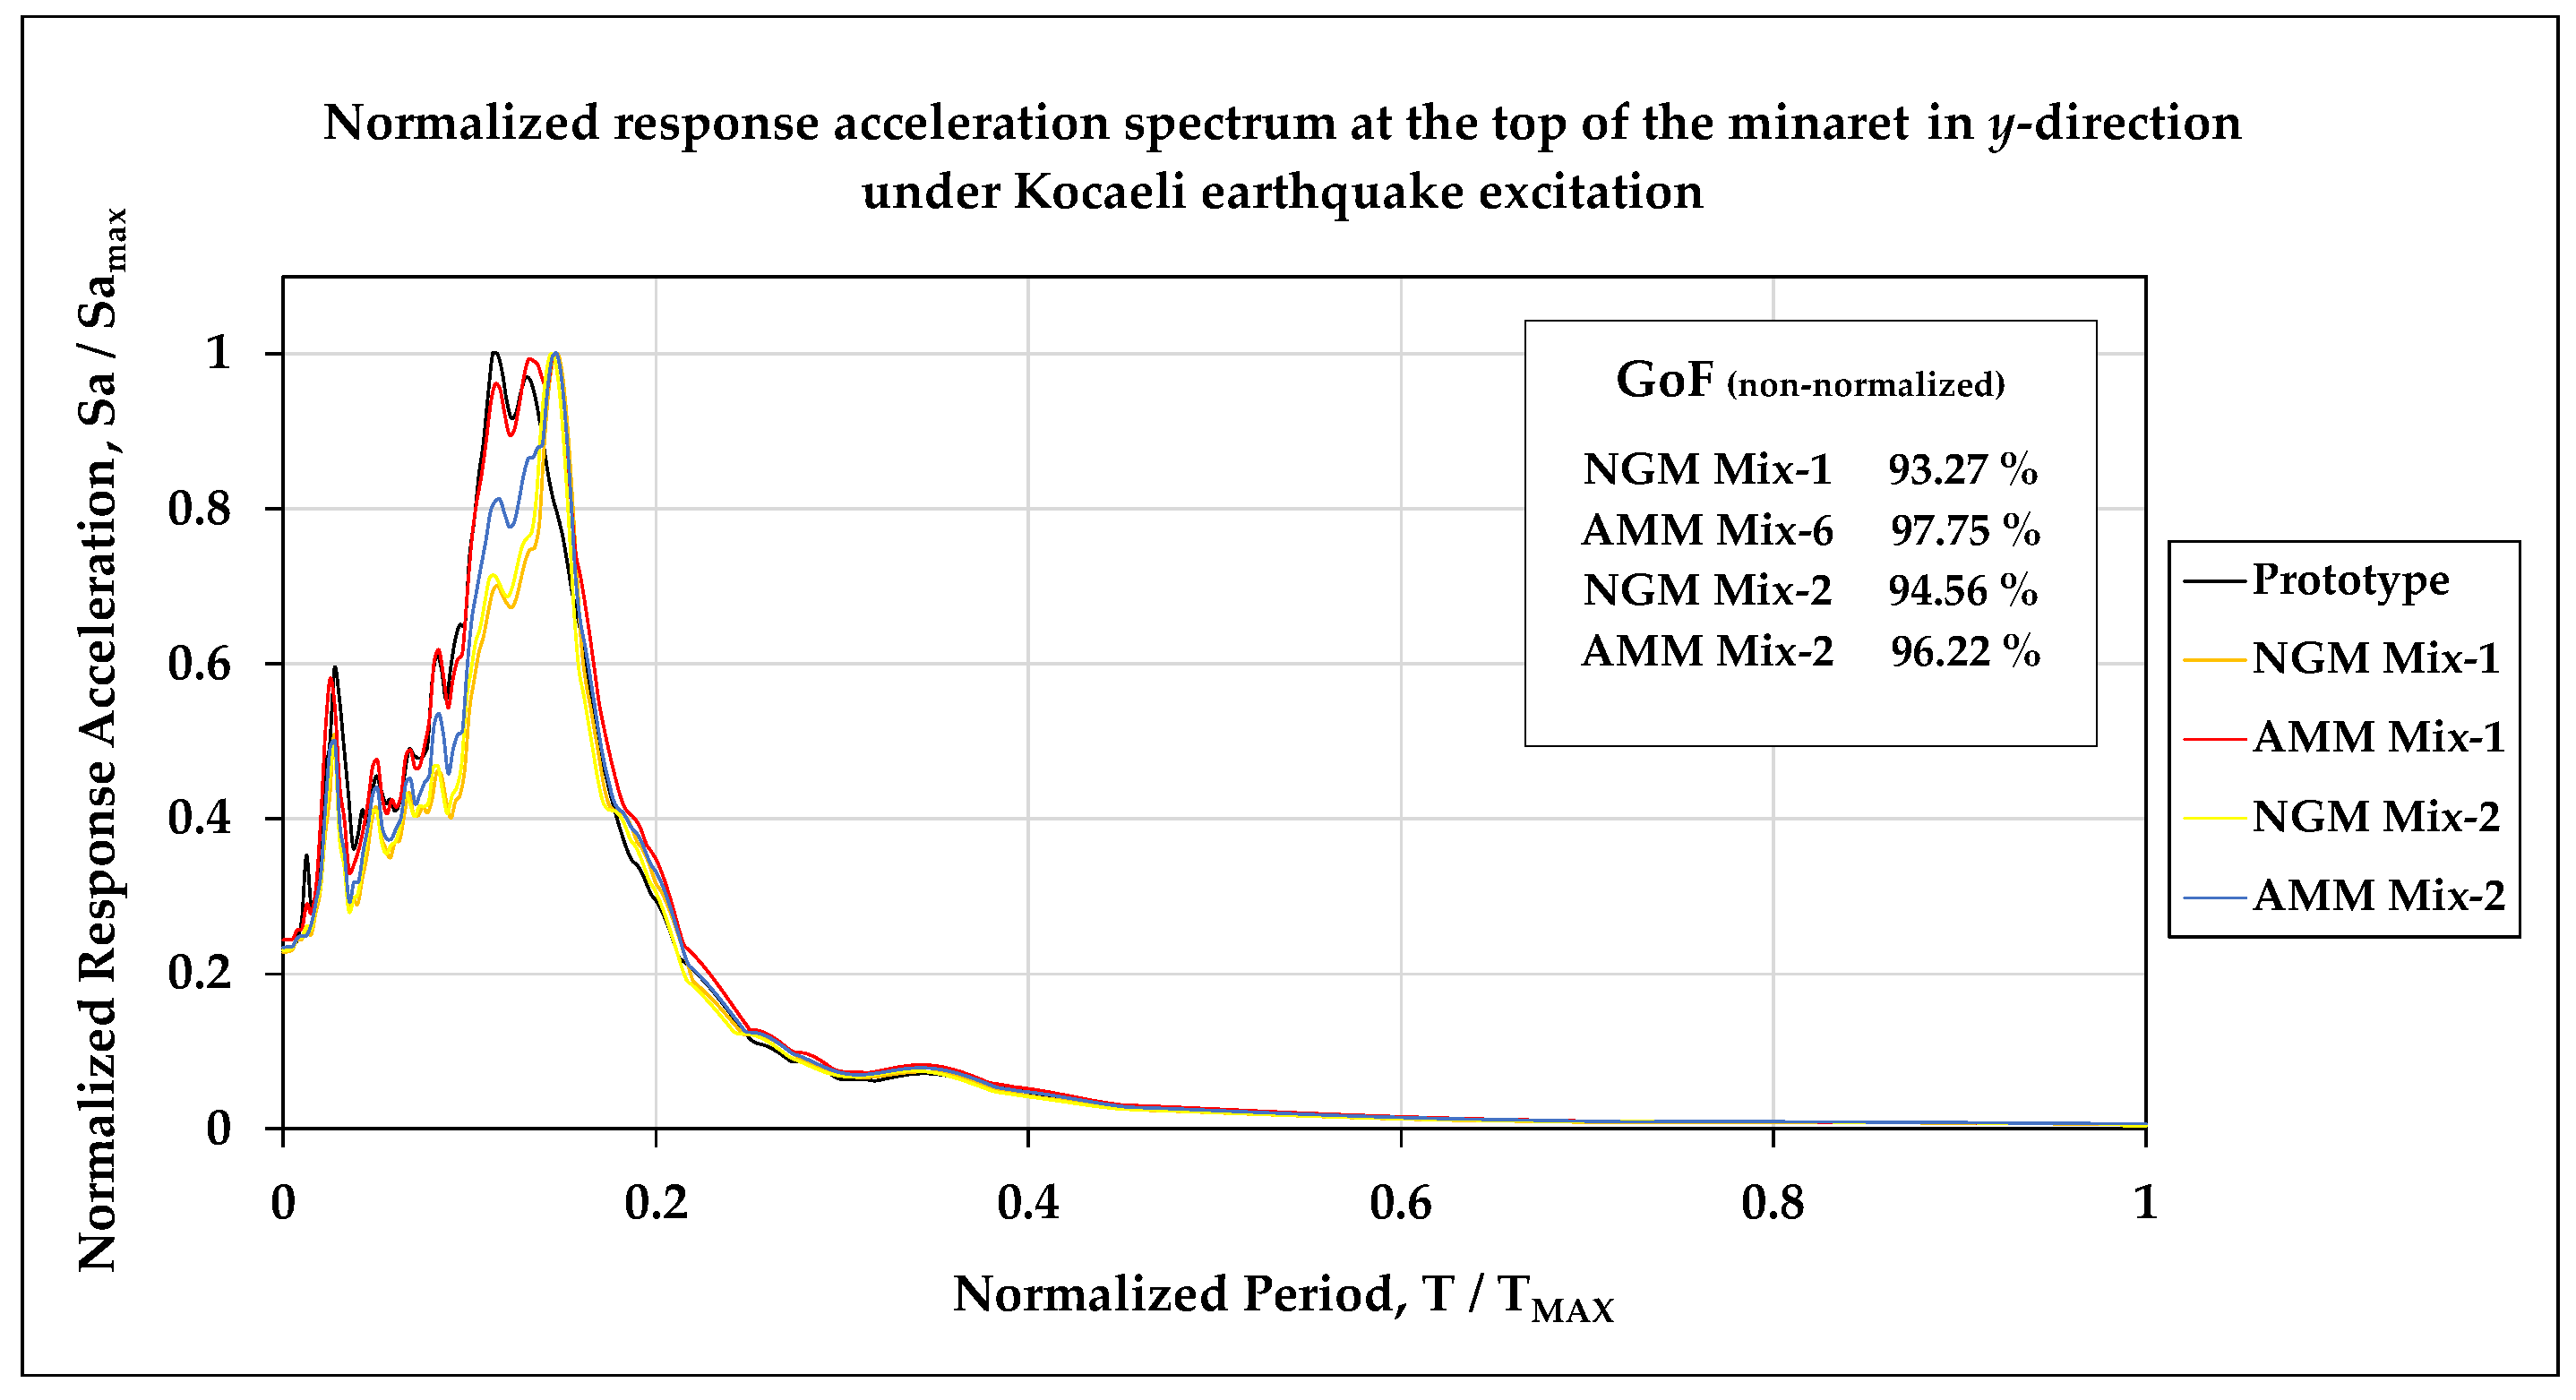
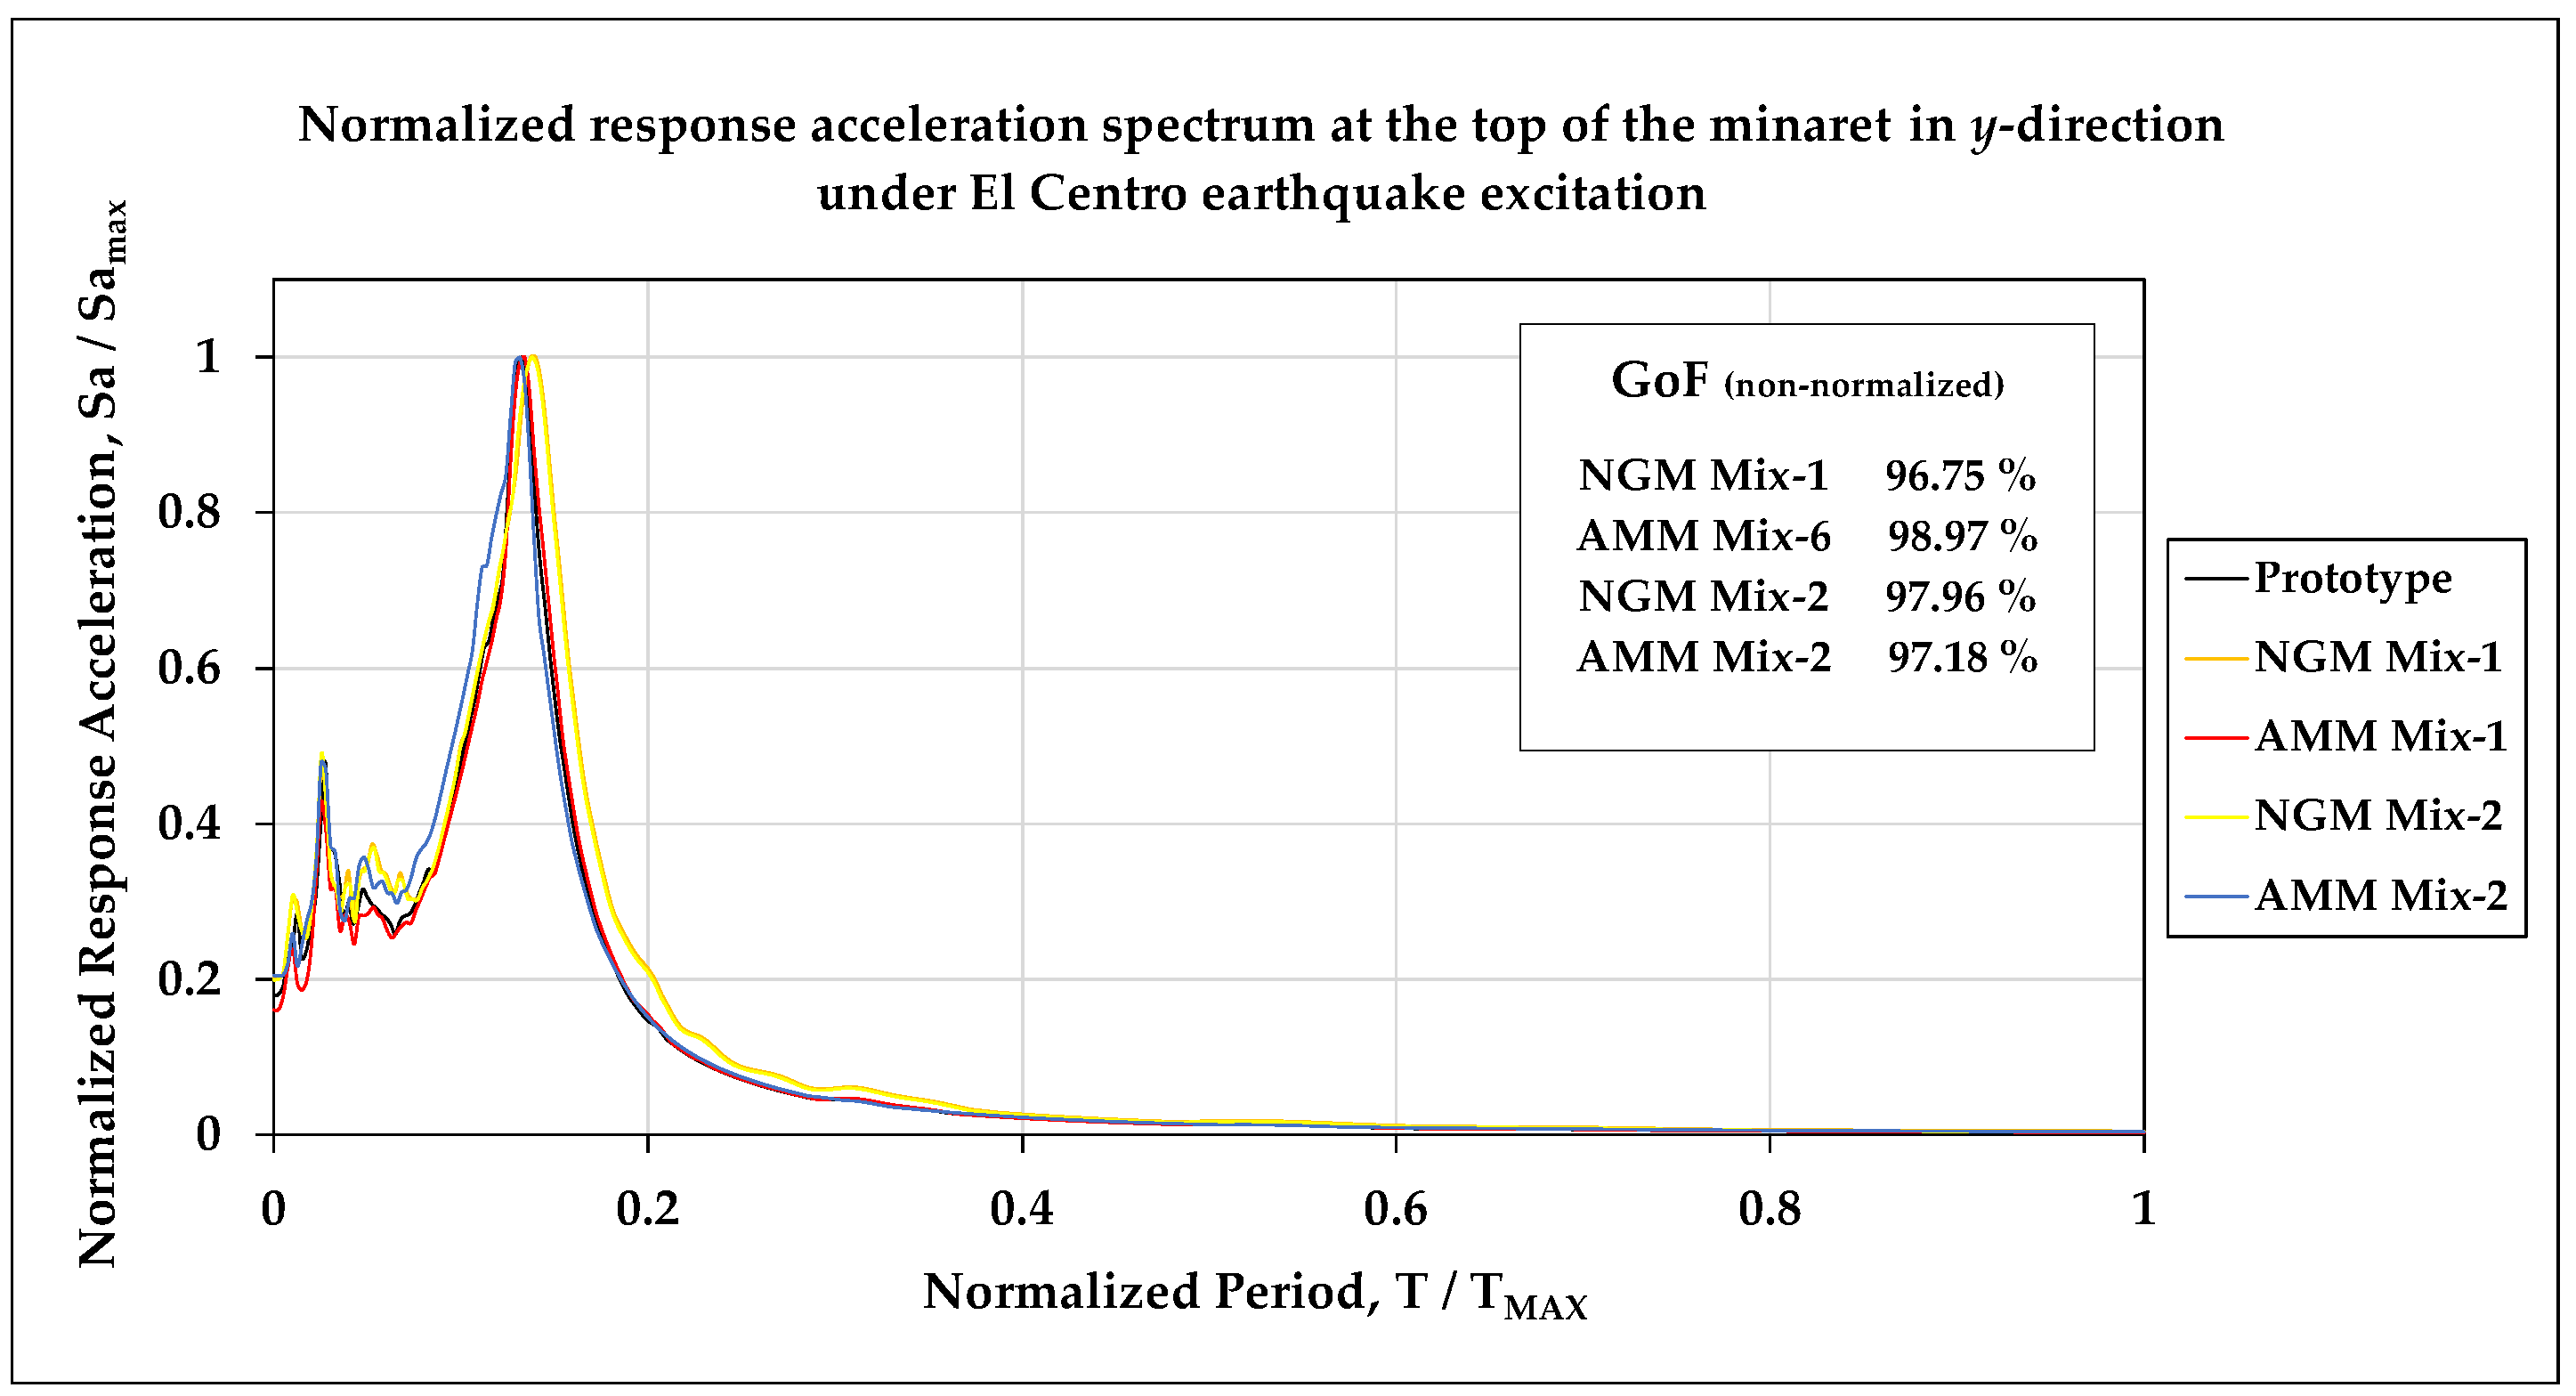
To further examine the dynamic behavior, acceleration response spectra of the minaret models at the top point were extracted using THA and plotted for each case. In order to facilitate a consistent comparison of frequency-dependent behavior, the response spectra were normalized with respect to their corresponding peak spectral acceleration values (Sa/Sa
max), whereas the period axis was normalized by the maximum period (T/T
max). This normalization highlights the relative spectral trends and dominant period characteristics, rather than absolute response amplitudes. The resulting plots illustrate how closely the scaled models replicate the frequency-dependent acceleration demand of the full-scale structure. The normalized response spectrum for the full-scale model serves as the benchmark, whereas the corresponding spectra for the scaled models constructed using Mix-1 and Mix-2, under both AMM and NGM approaches, were comparatively evaluated, as shown in
Figure 16 and
Figure 17.
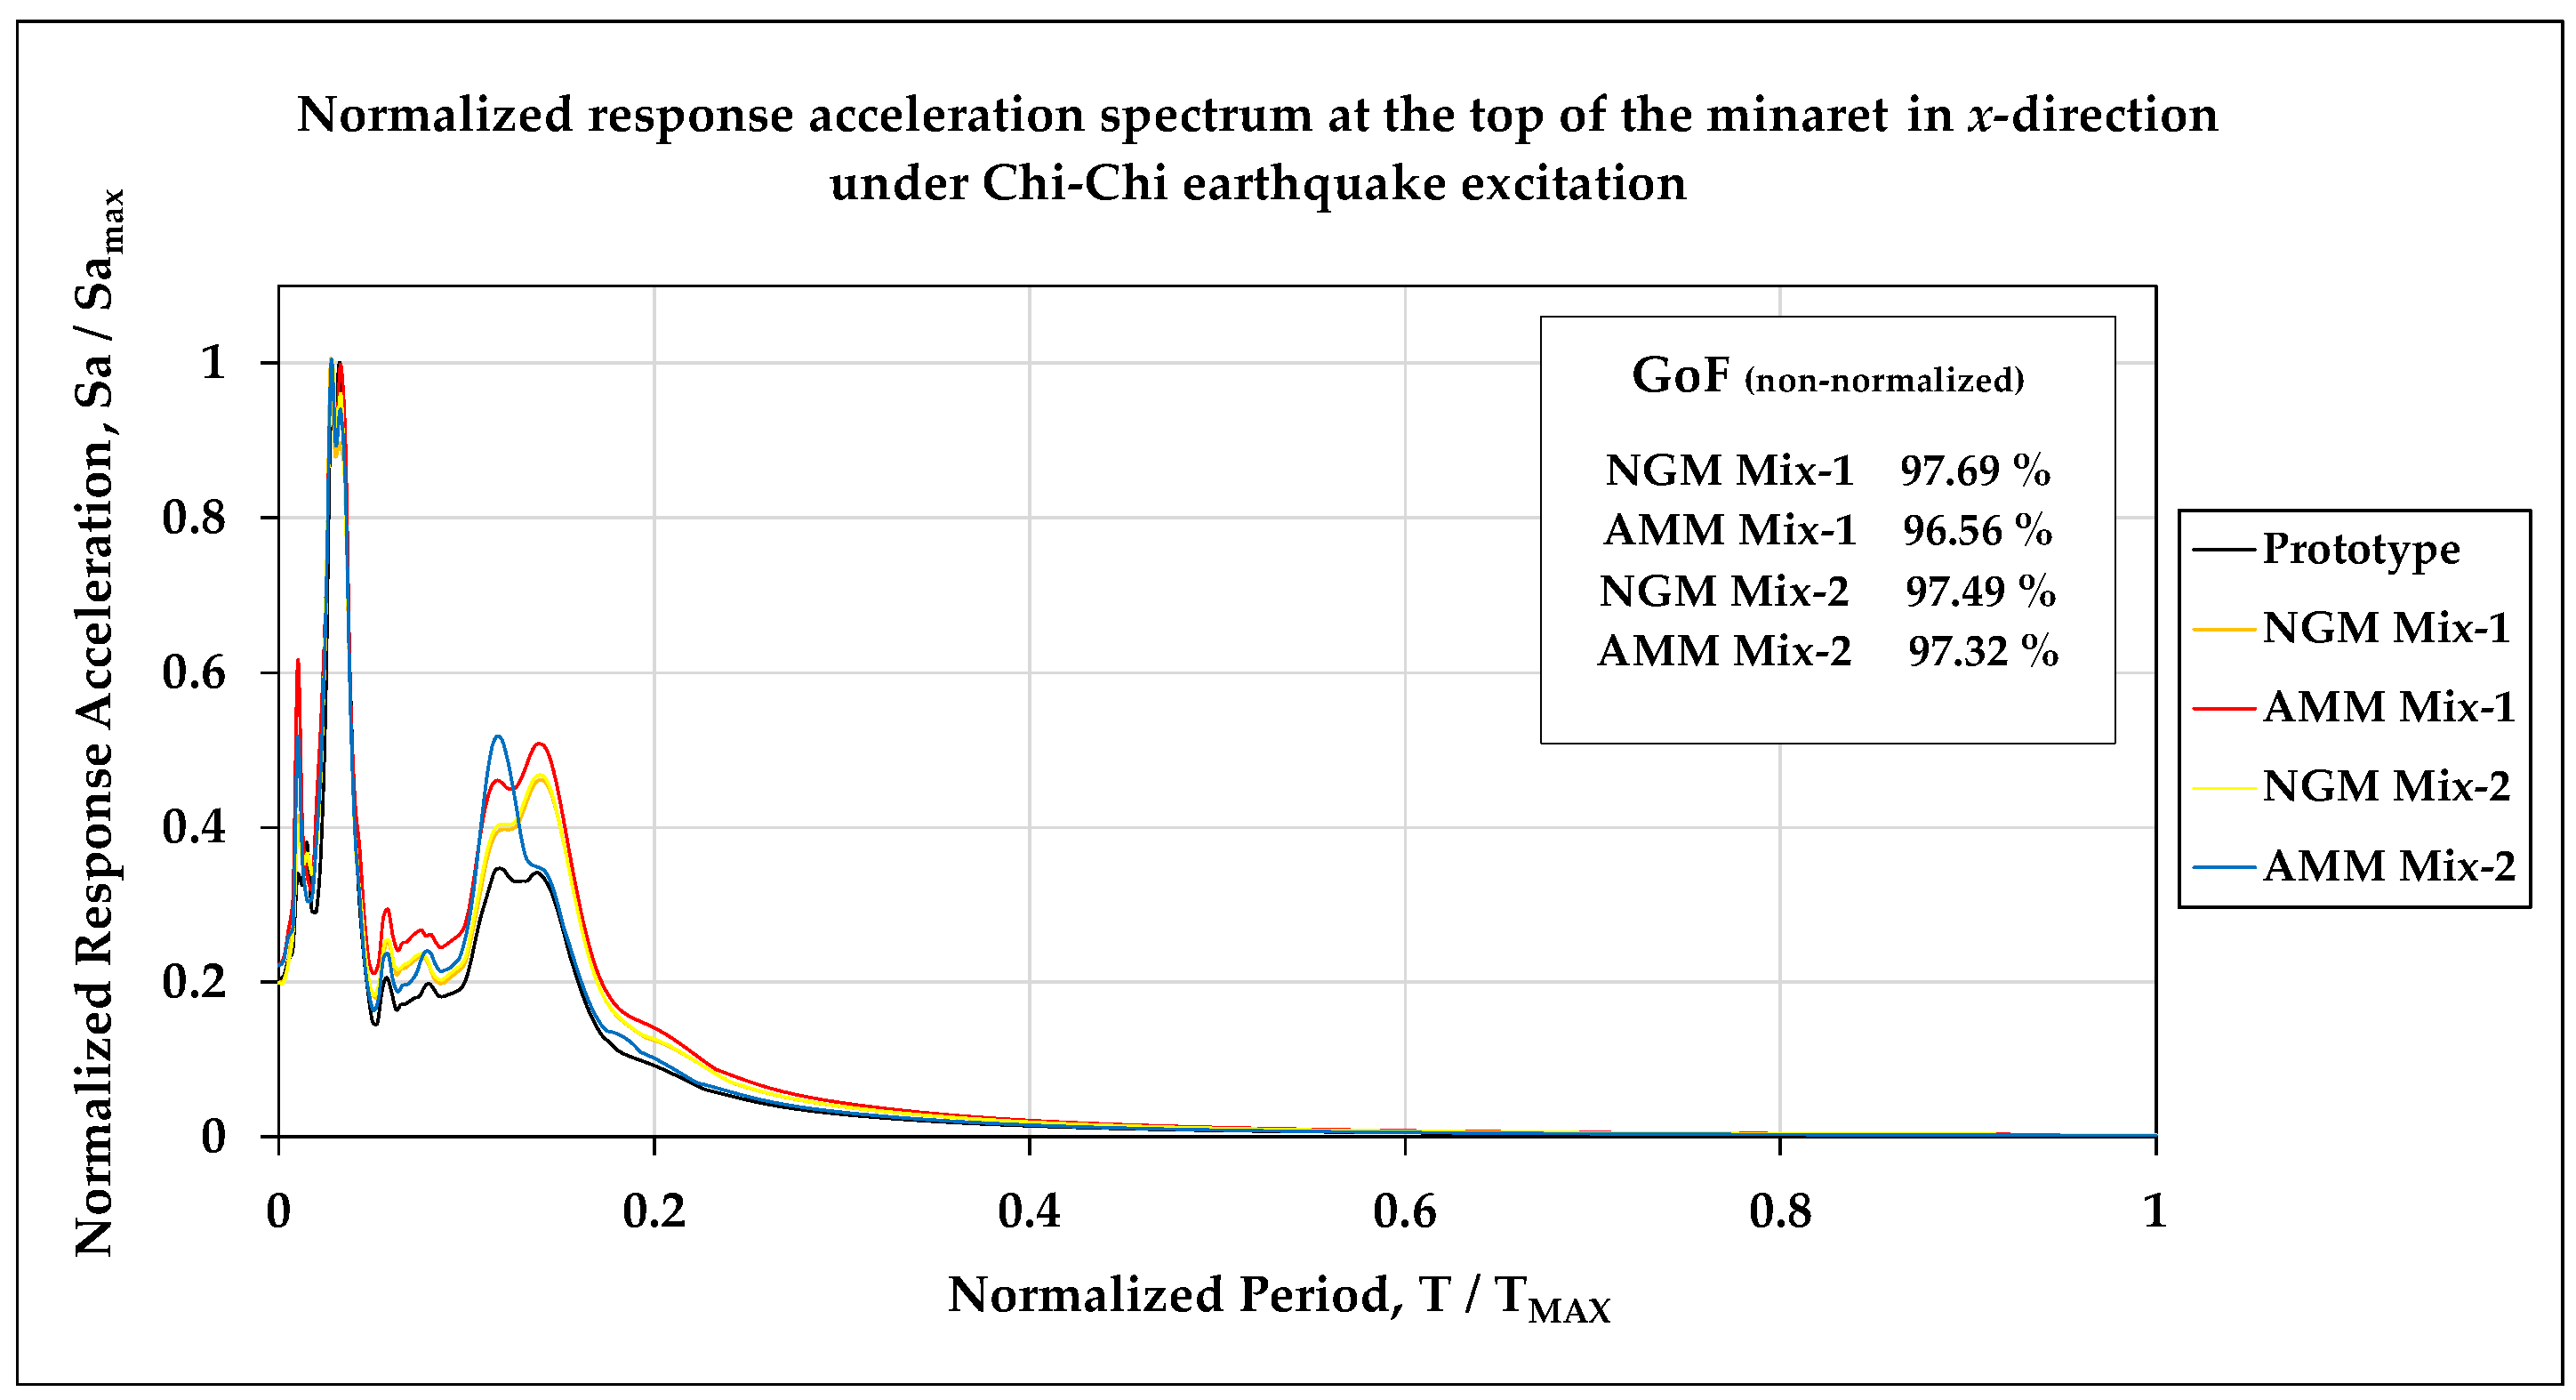
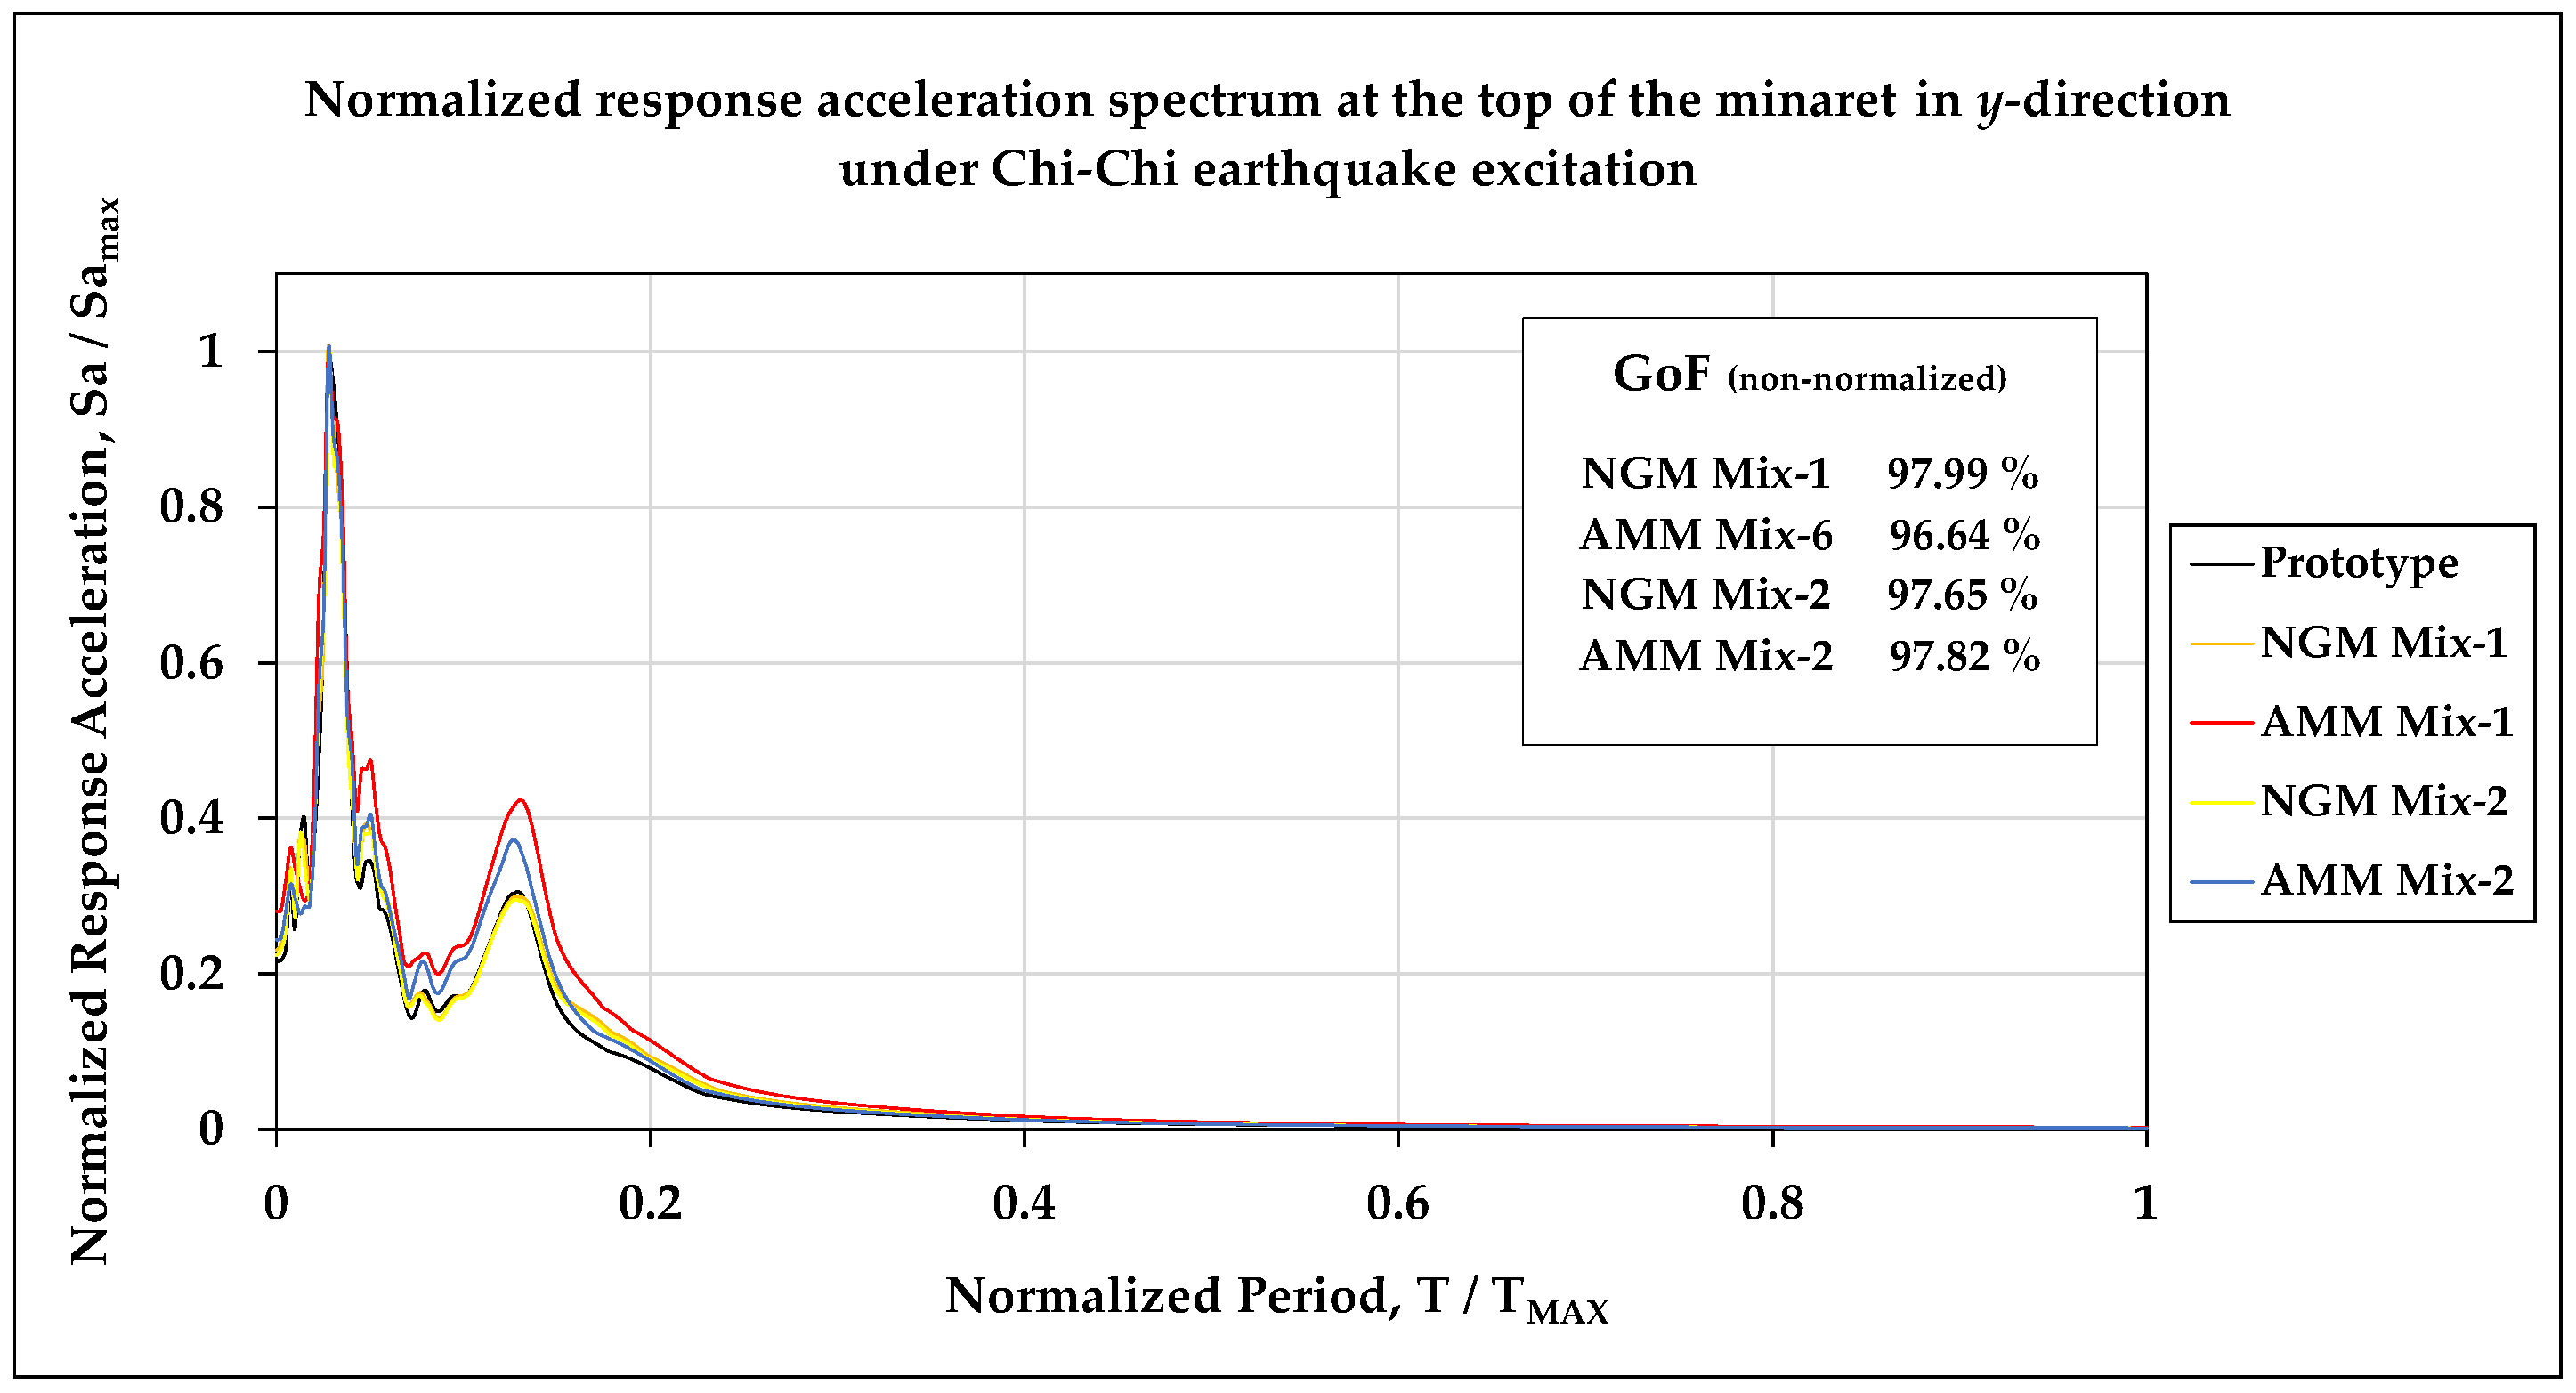
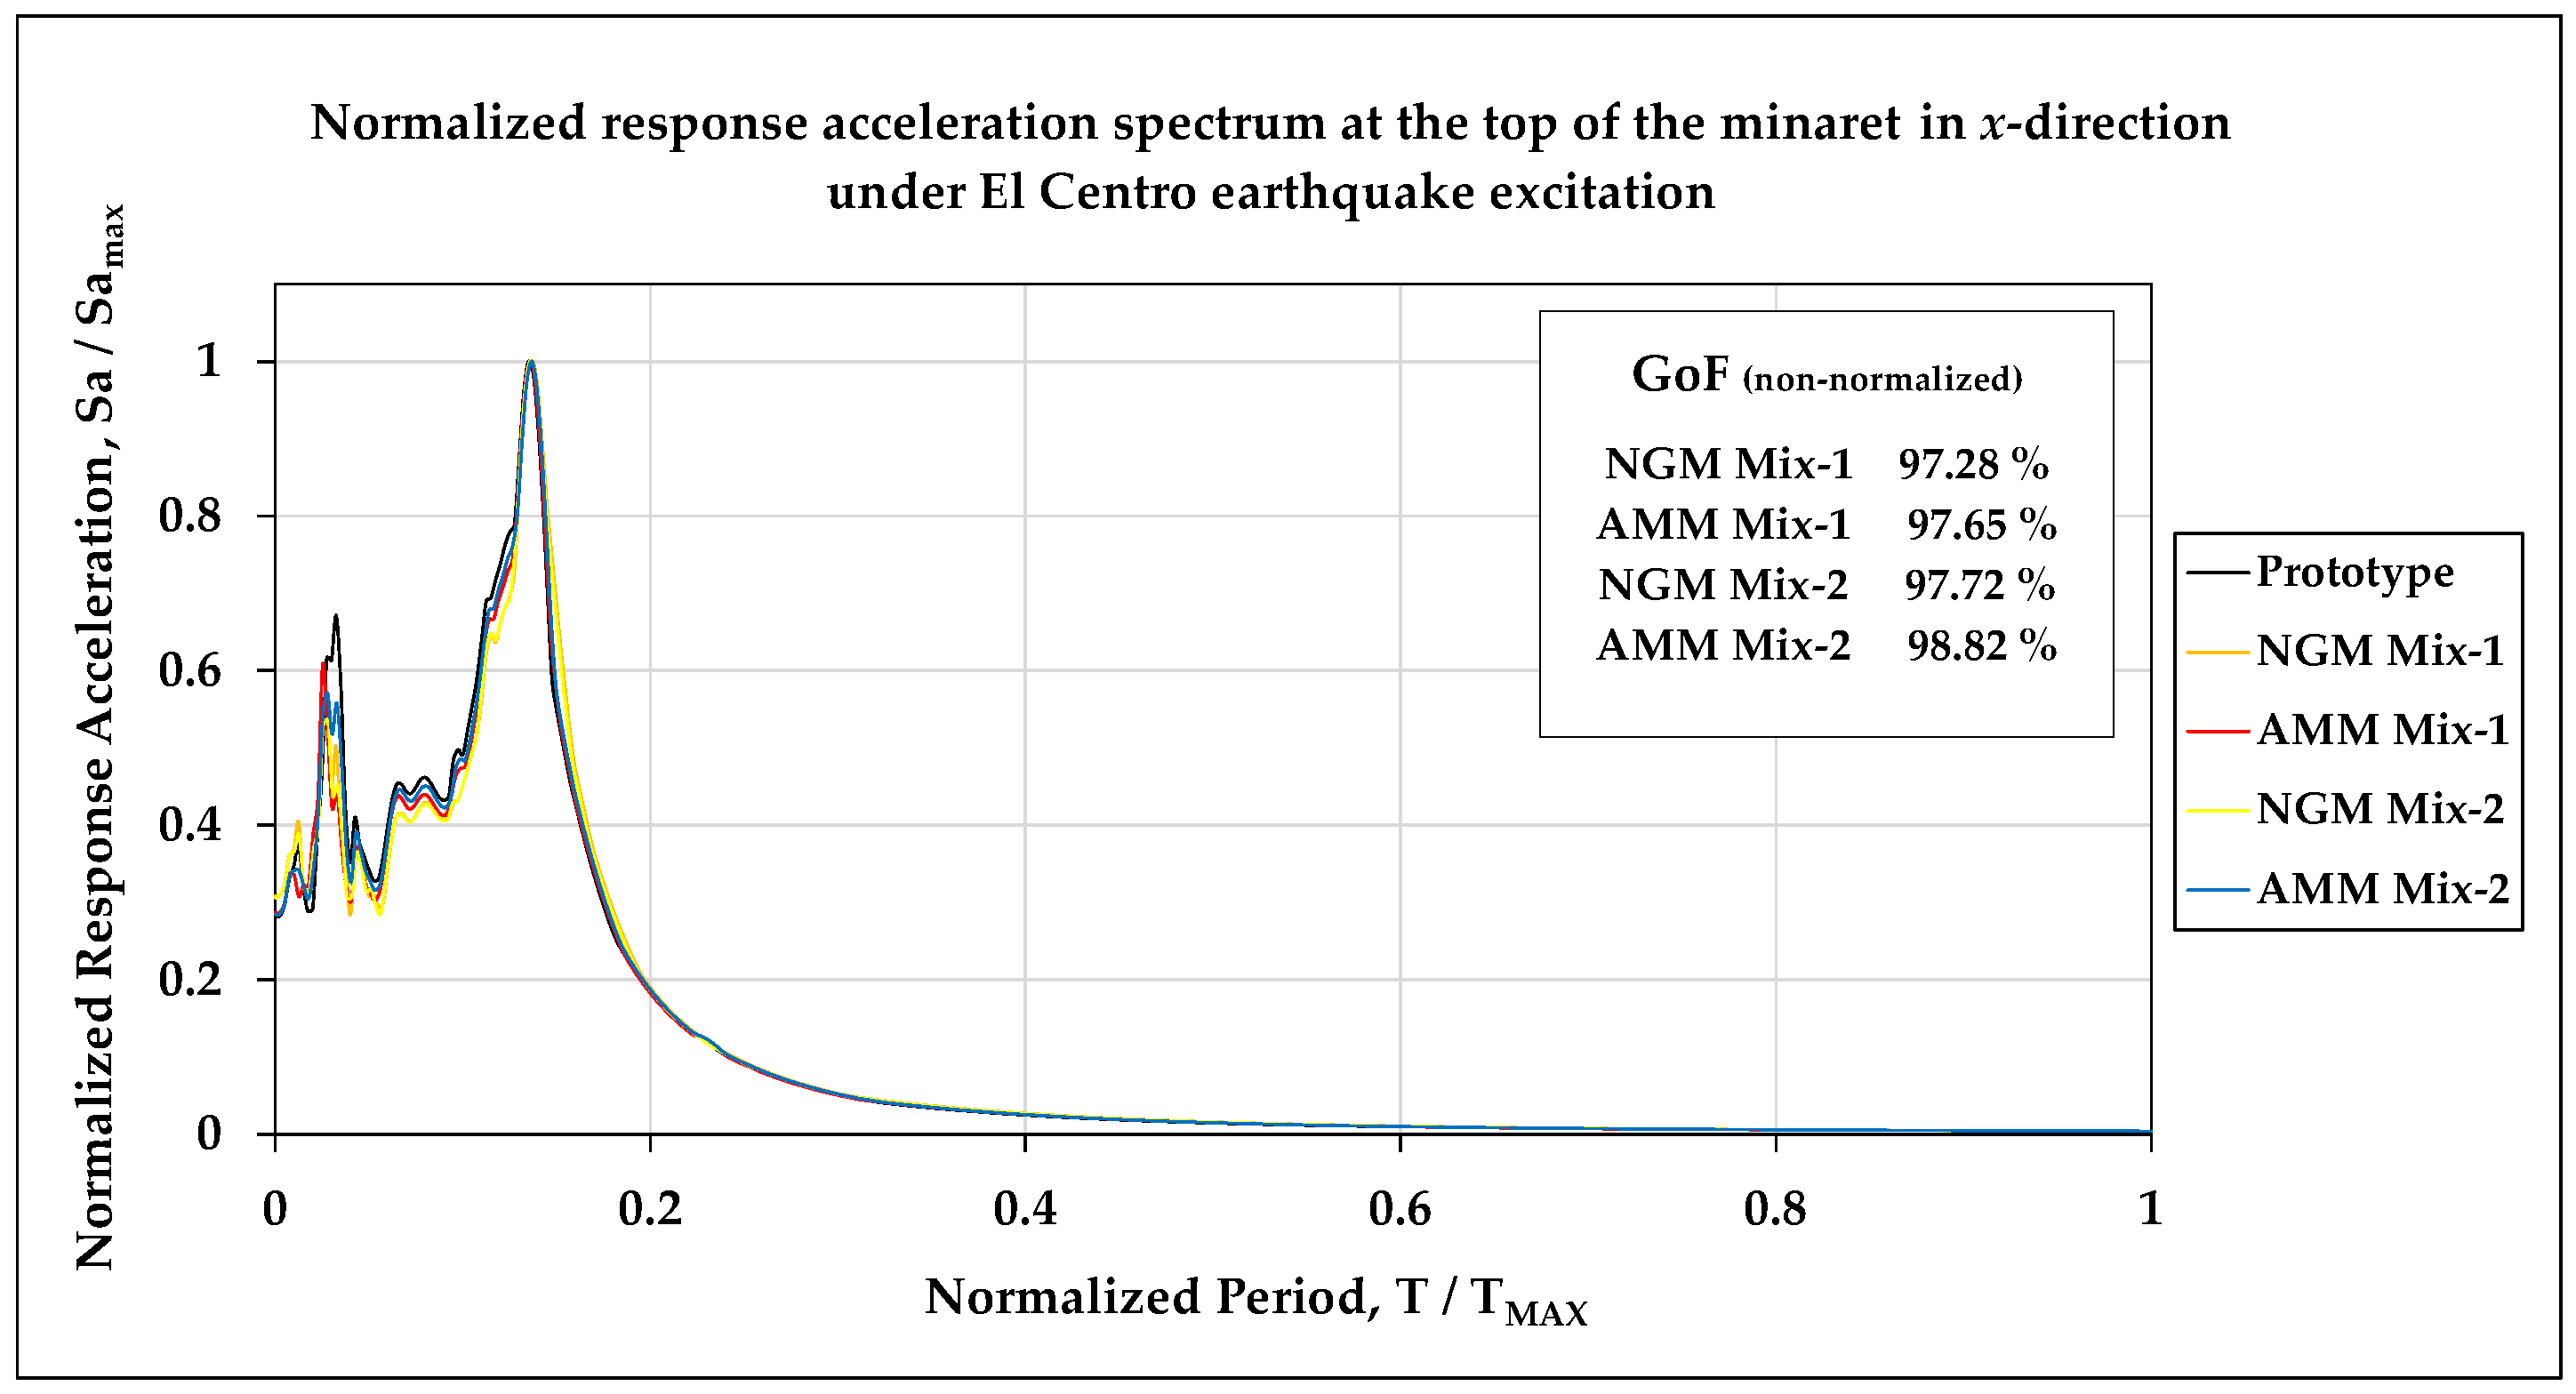
Although the Kocaeli earthquake is presented in detail as the primary case study, the response trends obtained from the Chi-Chi and El Centro ground motion records exhibited behavior consistent with those observed for the Kocaeli record. Due to the similarity in response patterns and the consistently high agreement levels obtained across these records, detailed time history plots were not repeated for brevity. Instead, the frequency-dependent response characteristics were additionally illustrated through the normalized acceleration response spectra at the top of the minaret for the Chi-Chi and El Centro earthquakes (
Figure 18,
Figure 19,
Figure 20 and
Figure 21). The comparative performance of the scaled models under the different seismic inputs was summarized using the GoF index, as presented in
Table 9.
7. Results and Discussions
In this study, the seismic performance of RC minarets was investigated with particular emphasis on physical modeling to achieve realistic representation of their dynamic behavior. All possible physical modeling options were examined in a case study of a representative RC minaret with a total height of 33.2 m, considering the limitations of test conditions. Although the TRM represents the most rigorous theoretical approach, its strict implementation was found to be impractical under the available test conditions as it would require either unrealistically low elastic modulus materials or excessively high mass density, in addition to exceeding the payload and geometric capacity of the available shaking table. Similarly, DM approaches, which intentionally relax similarity requirements, were not considered suitable for the present investigation, as they may lead to non-representative modal characteristics and unreliable interpretation of prototype-level seismic behavior, particularly for slender structures such as RC minarets. Accordingly, two physically realizable modeling strategies were identified as applicable within the laboratory constraints: the AMM and the NGM, both of which rely on the use of model materials with a reduced elastic modulus to satisfy similarity requirements.
To this end, two laboratory micro-concrete mixes were developed, each comprising cement, sand, water, and a hyper-fluidifier. In Mix-1, plaster gypsum was incorporated to further reduce the elastic modulus. In Mix-2, Class F fly ash was used for the same purpose, and steel fibers were additionally included to assess the feasibility of fiber reinforcement to mitigate cracking in the laboratory model.
Based on the compressive strength tests, Mix-1, which appears to approach its near-terminal strength by 28 days, attained a measured cylinder strength of 9.51 MPa and a secant modulus of elasticity of 11.83 GPa for specimens with 100 mm diameter and 200 mm height. For Mix-2, consistent with the slower strength development expected with Class F fly ash, the 100 mm diameter and 200 mm height cylinder reached 8.29 MPa at 179 days, which is lower than the near-terminal strength of Mix-1 by 12.83%. The elastic modulus of Mix-2 at 179 days was 12.77 GPa, which is 7.95% higher than that of Mix-1. These results indicate that Mix-2 developed greater stiffness despite a slightly lower compressive strength, a trend consistent with its higher effective water–binder ratio, probably higher entrapped air content due to steel fiber flocculation, fiber bridging coming into action at stress levels lower than the discontinuity limit, and the microstructural localized densifications and homogenizations promoted by the hyper-fluidifier and fly ash.
Numerical simulations of the representative RC minaret in both full-scale and 1:10 scaled models were performed in SAP2000, focusing on modal behavior and dynamic response under earthquake excitation. The results from both theoretical similitude principles and numerical simulations were compared to assess the effectiveness of the two physical modeling approaches: the AMM and the NGM, each evaluated with two distinct micro-concrete mixes, Mix-1 and Mix-2.
By focusing on modal behavior, the comparison of the first ten mode periods between the similarity-based predictions and SAP2000 analysis results revealed several key observations regarding the validity and limitations of the physical modeling approach. For both the AMM and NGM models, the first few mode periods (T
1 to T
5) show relatively low differences—less than 10% in all cases—between the similarity equation predictions and the FEM results, confirming that the dynamic behavior at lower modes can be reasonably captured using similarity conditions for those models. However, beyond the fifth mode the discrepancies for the AMM generally exceeded 10%, indicating a reduction in similarity accuracy for higher modes. These differences are primarily attributed to the increased sensitivity of higher vibration modes to local and discrete mass distribution inherent to the AMM approach, in which artificial mass is introduced without altering structural stiffness. In contrast, the NGM maintained deviations below 10% even beyond the fifth mode, demonstrating better overall consistency with the theoretical predictions. Nevertheless, it was noted that the global seismic response of slender structures is predominantly governed by the fundamental and lower vibration modes, whereas higher modes typically contribute marginally to the overall response [
21]. Therefore, the observed discrepancies in higher-mode periods do not significantly affect the reliability of the physical modeling approach for seismic response assessment.
Furthermore, the THA performed using the 1999 Kocaeli earthquake record demonstrated that both the AMM and NGM approaches are capable of reproducing the dynamic response of the full-scale structure when the scaling laws are properly applied. The direct comparison between the full-scale prototype and the 1:10 scaled models subjected to the same seismic excitation provides valuable insight into the applicability of dynamic similitude for slender RC structures.
A quantitative evaluation based on the goodness-of-fit (GoF) index revealed a consistently high level of agreement for both modeling strategies. In particular, the AMM cases achieved GoF values exceeding 95%, indicating very close correspondence with the prototype response, whereas the NGM cases exhibited slightly lower GoF values, generally ranging between 90% and 95%, yet still reflecting a strong agreement and reproduction of the dominant dynamic characteristics of the prototype.
In some instances, larger discrepancies were observed in peak response values, locally reaching differences exceeding 30%. Such discrepancies are considered inherent to the scaled model simulations of slender structures and are primarily attributed to localized effects, including differences in mass distribution, the simplified representation of material nonlinearity, and the high sensitivity of peak responses to small variations in stiffness and inertia. Importantly, these differences are confined to short-duration peak instants and do not affect the overall temporal evolution or phase alignment of the response. Consequently, the consistently high GoF values confirm that both AMM and NGM approaches successfully capture the essential dynamic behavior of the full-scale minaret under seismic excitation.
Furthermore, comparable response trends were also observed when the models were subjected to additional earthquake records with different spectral characteristics. Despite variations in frequency content, the relative performance of the AMM and NGM approaches remained consistent, indicating that the observed agreement is not limited to a single seismic excitation.
The present study is subject to several limitations that should be considered when interpreting the results. It should be explicitly noted that the analyses conducted in this work are limited to a linear elastic framework and do not aim to capture cracking, nonlinear behavior, stiffness degradation, or seismic damage mechanisms. These aspects require nonlinear numerical modeling or physical shaking table testing.
Within this context, the numerical agreement observed in modal periods and dynamic response metrics between the AMM and NGM approaches corresponds to an idealized modeling condition. This idealization also includes the assumption of a fully fixed base and monolithic connections, which was adopted to ensure modeling consistency and to reflect the practical constraints associated with feasibility-oriented shaking table studies. The discrepancies observed between the scaled and full-scale responses arise from several modeling-related factors inherent to the numerical implementation of similitude principles. These include the use of finite-element instead of idealized continuous mass and stiffness distributions, the discrete mass representation adopted in the AMM approach, gravity-related modeling assumptions inherent to the NGM approach, and the prescribed numerical damping representation in time-history analyses. Collectively, these factors primarily influence higher-mode behavior and peak response quantities, without significantly affecting the overall response trend.
From an experimental perspective, the numerical findings should therefore be interpreted as indicative trends rather than conclusive validation. The results provide general insight into aspects of the AMM and NGM approaches that may exhibit sensitivity during physical testing, particularly with respect to mass representation and stiffness consistency.
Within this context, although direct experimental and in-situ validation is beyond the scope of the present work, the finite element models are intended to serve as a reference framework for subsequent validation activities. Model validation may be pursued through a staged approach. At the scaled model level, ambient vibration testing can be employed to identify natural frequencies and mode shapes, which may be compared with numerical predictions to assess model consistency and guide refinement of the numerical representation.
This may be followed by response-based comparisons using shaking table testing of the scaled models, where measured acceleration and displacement time histories are evaluated against corresponding numerical results under identical excitation conditions. In addition, ambient vibration measurements on full-scale minarets may provide complementary information for assessing the consistency of numerical predictions at the prototype level.
8. Conclusions
Slender RC minarets are highly vulnerable to seismic actions due to their high-aspect ratios and dynamic sensitivity, as demonstrated by damage observed during recent major earthquakes in Türkiye. Despite this recognized vulnerability, experimental investigations based on physical modeling and shaking table testing remain limited, primarily due to geometric slenderness, strict similitude requirements, and laboratory constraints.
This study evaluated the practical feasibility of employing scaled physical models for the seismic investigation of RC minarets under realistic laboratory conditions. Rather than proposing new similitude formulations, the focus was placed on assessing how established modeling approaches can be implemented with appropriate material selection, mass scaling strategies, and constructability considerations. Within this framework, the AMM and the NGM were examined as viable modeling strategies.
The material investigations demonstrated that micro-concrete mixtures with a reduced elastic modulus can be developed through the partial replacement of cement with lower-stiffness binders, such as plaster gypsum and Class F fly ash. These mixtures provide sufficient mechanical compatibility for both modeling approaches and represent a practical solution for constructing scaled RC minaret models without requiring unrealistic material properties and enabling compatibility with both modeling approaches.
Numerical analyses conducted in SAP2000, including modal and time history analyses based on the selected earthquake records, showed that both AMM and NGM reproduced the dominant dynamic response characteristics of the prototype within acceptable similitude limits. Although the AMM approach exhibited slightly higher accuracy in capturing dynamic responses, it also involved greater implementation complexity due to the required artificial mass distribution. In contrast, the NGM approach offers enhanced practical applicability by eliminating the need for artificial mass while still providing reliable predictions of global dynamic behavior, modal properties, and response trends.
Overall, the findings provide a feasibility-based methodological basis for the physical modeling of slender RC structures such as minarets. The results support the rational design of scaled models and offer guidance for future shaking table experiments aimed at improving the experimental seismic performance assessment of RC minarets. Building on these findings, the outcomes of the present feasibility study may be practically applied and further assessed across a broader range of structural configurations.